Peter Cziraki Peter de Goeij Luc Renneboog - … · Peter de Goeij# Luc Renneboog ... Calcagno,...
49
Insider Trading, Option Exercises and Private Benefits of Control + Peter Cziraki * Peter de Goeij # Luc Renneboog § February 2011 Parts of this paper were written or revised while Peter Cziraki was visiting Stanford Graduate School of Business, whose hospitality he gratefully acknowledges. We are thankful to André Betzer, Jules van Binsbergen, Riccardo Calcagno, François Derrien, Darrell Duffie, Baran Düzce, Jasmin Gider, Dirk Hackbarth, Joachim Inkmann, Alan Jagolinzer, Dirk Jenter, Frank de Jong, Swami Kalpathy, Diana Knyazeva, Péter Kondor, Arthur Korteweg, Katharina Kralj, Meziane Lasfer, Jérémie Lefebvre, Daniel Metzger, Kim Peijnenburg, Paul Sengmüller, Erik Theissen, Jeffrey Zwiebel and participants at the 2009 Corporate Finance Day at the University of Antwerp, the European Financial Management Association annual meetings in Aarhus, the Financial Management Association European conference in Hamburg, the Summer Workshop of the Hungarian Academy of Sciences, the Workshop on Insider Trading of the Netherlands Authority for the Financial Markets (Amsterdam), and seminars at Stanford Graduate School of Business, Tilburg University, Universität Bonn, and Free University Amsterdam for valuable comments and suggestions. Dirk Bevers, Paul de Graaf, Mark van de Paal and Thijs van Wijk provided research assistance. All errors remain our own. The paper was supported by a Hungarian Eötvös Grant. * Corresponding author. Tilburg University. P.O. Box 90153, 5000 LE Tilburg, the Netherlands, email: [email protected] # Tilburg University, email: [email protected] § Tilburg University, email: [email protected]
-
Upload
truongkien -
Category
Documents
-
view
216 -
download
0
Transcript of Peter Cziraki Peter de Goeij Luc Renneboog - … · Peter de Goeij# Luc Renneboog ... Calcagno,...

Insider Trading, Option Exercises and Private Benefits of Control +
Peter Cziraki*
Peter de Goeij#
Luc Renneboog§
February 2011
Parts of this paper were written or revised while Peter Cziraki was visiting Stanford Graduate School of Business, whose hospitality he gratefully acknowledges. We are thankful to André Betzer, Jules van Binsbergen, Riccardo Calcagno, François Derrien, Darrell Duffie, Baran Düzce, Jasmin Gider, Dirk Hackbarth, Joachim Inkmann, Alan Jagolinzer, Dirk Jenter, Frank de Jong, Swami Kalpathy, Diana Knyazeva, Péter Kondor, Arthur Korteweg, Katharina Kralj, Meziane Lasfer, Jérémie Lefebvre, Daniel Metzger, Kim Peijnenburg, Paul Sengmüller, Erik Theissen, Jeffrey Zwiebel and participants at the 2009 Corporate Finance Day at the University of Antwerp, the European Financial Management Association annual meetings in Aarhus, the Financial Management Association European conference in Hamburg, the Summer Workshop of the Hungarian Academy of Sciences, the Workshop on Insider Trading of the Netherlands Authority for the Financial Markets (Amsterdam), and seminars at Stanford Graduate School of Business, Tilburg University, Universität Bonn, and Free University Amsterdam for valuable comments and suggestions. Dirk Bevers, Paul de Graaf, Mark van de Paal and Thijs van Wijk provided research assistance. All errors remain our own. The paper was supported by a Hungarian Eötvös Grant. *Corresponding author. Tilburg University. P.O. Box 90153, 5000 LE Tilburg, the Netherlands, email: [email protected] # Tilburg University, email: [email protected] § Tilburg University, email: [email protected]

Insider Trading, Option Exercises and Private Benefits of Control
Abstract
We investigate patterns of abnormal stock performance around insider trades and option exercises on the Dutch market. Listed firms in the Netherlands have a long tradition of employing many anti-shareholder mechanisms limiting shareholders rights. Our results imply that insider transactions are more profitable at firms where shareholder rights are not restricted by anti-shareholder mechanisms. This finding goes against the monitoring hypothesis which states that more shareholder orientation and stronger blockholders would reduce the gains from insider trading. We show robust support for the substitution hypothesis as insiders of firms which effectively curtail shareholder rights enjoy valuable private benefits of control in lieu of engaging in insider trading to exploit their position. JEL classification: G14, G34, M52
Keywords: insider trading, management stock options, timing by insiders, corporate governance, anti-
shareholder mechanisms, anti-takeover mechanisms.

1
I. Introduction In addition to their attractive compensation packages, executives and other insiders of
public firms appear to reap further benefits through their position, at the expense of dispersed shareholders. Studies of legal insider trading suggest that insiders use private information to increase profits from their transactions (Seyhun (1986), Lakonishok and Lee (2001), Piotroski and Roulstone (2005)). Analyses of insider option exercises have yielded similar results (Huddart and Lang (2003), Bartov and Mohanram (2004)). To the extent that profitable trading is conducted at the expense of outside shareholders, insider trading and option exercises based on private information constitute one way for managers to abuse their position at the firm. The recent option backdating scandal1 highlights yet another example of insiders’ ill-gotten gains (Lie (2005), Heron and Lie (2007)); moreover, besides being arguably unethical, option backdating is also against the law (Narayanan, Schipani and Seyhun (2007)). Analyzing insider transactions is important because they have been documented to have a signaling value to investors, in the short term. Given the private information content of insider trading and option exercising, the magnitude of profits accruing to insiders is an indication of the degree of agency problems at the firm (Bebchuk and Fried (2003)).
Still, proper corporate governance can restrain selfish managerial decisions that are detrimental to the firm: shareholders can prevent abusive actions by monitoring or disciplining managers, or even by firing them if they fail to cooperate. The market for corporate control can sanction inefficiencies if the new controlling shareholders impose rigor upon, or simply replace managers who exploit the firm. However, what happens if legally imposed restrictions on shareholder rights disable effective corporate governance? How can shareholders prevent managers from setting their own pay, using company assets for private purposes, or engaging in insider trading if they do not have the right to replace the board, or, even worse, their voting rights are completely stripped? How credible is a takeover threat in a market where two-thirds of the firms have a poison pill?
In this paper we investigate insider trading, option exercises and corporate governance using insiders’ transactions in the Netherlands, a market where firms have had a long history of oppressing shareholder rights. We contribute to the extant literature on insider trading and corporate governance by alleviating concerns of endogeneity and addressing the causal relationship between governance rules and insider trading profits. In 2004, there were significant modifications in Dutch corporate governance regulations, which we use as a quasi-natural
1 Two late examples include the president and chief operating officer of Monster found guilty of options backdating (Bray (2009)) and Take Two Interactive Software who agreed to pay $3 million to settle a lawsuit in which they were charged with options backdating (Bloomberg News (2009)).

2
experiment. We take a differences-in-differences (DD) approach to examine whether profits to insider trading changed as a new corporate governance code and legislation strengthening shareholder rights came into effect. Our study is the first to examine simultaneously the impact of both blockholder structure and governance rules on insider trading. Our unique, hand-collected dataset contains information on blockholder ownership, as well as anti-shareholder devices employed by firms. Among these anti-shareholder mechanisms, the structured regime is a two-tier board system complemented by the reallocation of decision rights within the company at the expense of shareholders, to the supervisory board. Priority shares are special voting stock whose holder gains the right to decide on influential issues, usually on executive board and supervisory board nominations. Preference shares are tantamount to poison pills and essentially block takeover threats. Depositary receipts are non-voting certificates with full cash-flow rights issued by a trust, in exchange for deposited shares.
First, we delineate and motivate an alternative hypothesis to the monitoring argument which has been the only idea to date underpinning the interrelationship between insider trading and corporate governance. We conjecture that if private benefits owed to managerial entrenchment outweigh the profits from insider trading (and option exercising), insider transactions will be a substitute mechanism that insiders resort to if they are barred from exploiting other private benefits. Second, we explicitly analyze how the profits earned on option exercises by insiders are related to the quality of corporate governance, which, to the best of our knowledge is a question that has not been pursued previously in the literature. Third, we provide strong empirical support for the substitution hypothesis. This result is valid for insider purchases, sales and option exercises, depends on the use of anti-shareholder mechanisms, and is robust to the inclusion of several controls previously shown to affect abnormal returns around insider transactions. Fourth, we use this substitution effect to measure private benefits of control enjoyed by insiders.
Our results indicate that insiders earn an average abnormal return of about 3.5% over the 40-day window following their purchases. However, this is not because they purchase in response to strong stock price performance. Our findings on the relationship between corporate governance and insider trading suggest that the government and nonfinancial blockholders do not monitor insider trading activity. The latter are likely to trade on the same signal, thereby amplifying abnormal returns. Concerning the governance mechanisms of the firm, we find strong evidence for the substitution hypothesis. The returns insiders earn on their transactions are higher at firms that do not limit shareholder power through anti-shareholder mechanisms. This can be explained in a framework where insiders dedicate increased attention to their trades once they are unable to reap private benefits of control. Relying on the 2004 corporate governance changes, our DD estimates suggest that it is indeed corporate governance rules that impact insider trading profits.

3
This is further corroborated by regressions with firm fixed effects. Exploiting the substitution effect uncovered in the data, we conservatively estimate the lower bound of entrenchment benefits provided by one anti-shareholder mechanism at approximately €14,000 per year. When placing these estimates in the context of our sample, we find that insiders of the average firm enjoy private benefits that are worth at least €228,000.
The remainder of the paper is structured as follows. In Section II we offer a synthesis of prior literature on insider trading and insider option exercises, based on which we then develop our research hypotheses. Section III describes the measures used to suppress shareholder rights in the Netherlands. Section IV presents the data and methodology and in Section V we detail our findings on insider trading and option exercises and assess the robustness of our results. In Section VI we estimate the value of private benefits in monetary terms. Section VII summarizes and concludes the paper.
II. Literature review and hypothesis development II.1. Baseline hypotheses on insider trading and option exercises Insider purchases and sales
By buying (selling) shares of their own firm, insiders increase (decrease) their exposure to
the firm’s share price. Exercising options and retaining the resulting share stake similarly increases an insider’s wealth at risk. In addition, early exercising prior to maturity can also reveal to the market the insider’s information about the firm’s prospects. The efficient market paradigm holds that the market is strong-form efficient if no investors possess private information that is not reflected in stock prices. Market efficiency is of the semi-strong form if prices adjust to publicly available information other than historical share prices (Fama (1991)).
Initially, returns to insider trading were examined to investigate if insiders were able to exploit private information to earn profits. Jaffe (1974) showed that insiders earn abnormal returns as they purchase (sell) shares prior to abnormal share price appreciation (depreciation).2 The main results of Seyhun (1986, 1998) show that abnormal returns peak around insider sales and depict a valley pattern around purchases. His findings are in line with the theory that insiders 2 A further question was if outside investors could earn profits using announcements on insider trades. Lorie and Niederhoffer (1968), Jaffe (1974) and Chang and Suk (1998) find that the secondary dissemination of information still allows for such trading gains. Bettis, Vickrey and Vickrey (1997) show that mimickers of insider trades can earn substantial returns, even after subtracting transaction costs. However, the results of Seyhun (1986), Rozeff and Zaman (1988) and Friederich, Gregory, Matatko and Tonks (2002) reach opposite conclusions.

4
trade on private information. However, the documented abnormal stock price patterns could also be explained by contrarian investing: selling after periods of stock price appreciation and buying after periods of stock price decline. Notwithstanding, the ample body of literature concerned with this question shows that insiders earn higher returns on their trades than a naïve contrarian strategy would yield, implying that they indeed possess private information.3 Furthermore, the empirical approach of our paper is different from Rozeff and Zaman (1998), Lakonishok and Lee (2001), Jenter (2005) and Piotroski and Roulstone (2005) in that we focus on individual trades rather than aggregate insider trading, as do Fidrmuc, Goergen and Renneboog (2006) and Ravina and Sapienza (2009).
In line with prior literature, we hypothesize that insiders will trade profitably by exploiting private information. We thus expect cumulative abnormal returns (CARs) to be
negative (positive) in periods before an insider purchase (sale), but also that they are positive
(negative) in the days following the purchase (sale). We furthermore expect that the absolute
magnitude of the market reaction will be larger to purchases than to sales, for sales can be
triggered by reasons other than private information, e.g. liquidity needs or diversification
concerns. This argument is supported by the results of Jeng, Metrick, and Zeckhauser (2003) and Lakonishok and Lee (2001) for US firms, and Friederich et al. (2002) and Fidrmuc et al. (2006) for UK firms.
Insiders’ option exercises
We also assess the abnormal stock return patterns around option exercises. The study of Huddart and Lang (1996) indicates that exercise behavior is related to prior returns but not to subsequent returns. Carpenter and Remmers (2001) find significant positive stock performance in the days (months) before insiders exercise their stock options. However, they only document negative abnormal returns after exercises by top managers at small firms. Although these two studies provide little evidence that insider option exercises are based on private information, the findings of Huddart and Lang (2003) and Bartov and Mohanram (2004) suggest otherwise. Huddart and Lang (2003) unveil that option exercises are significantly more frequent in advance
3 Lakonishok and Lee (2001) attempt to disentangle contrarian investment strategies and inside information and show that even though insiders are in general contrarian investors, their transactions are more informative in predicting future stock performance than are simple contrarian strategies. Jenter (2005) argues that managers have contrarian views concerning the stock of their own company and perceive the book-to-market effect as a mispricing. Piotroski and Roulstone (2005) document that insider trades are based both on contrarian beliefs and on superior (inside) information on future cash flows. Ravina and Sapienza (2009) show insiders have excellent timing abilities and are not merely purchasing after periods of stock price decline and selling after the stock price has gone up. The results of Fidrmuc et al. (2006) also suggest that insider trades are based on private information.

5
of stock price downturns and conversely, fewer options are exercised prior to periods of stock price appreciation. The conclusion of Bartov and Mohanram (2004) is also that option exercises are motivated by private information. In particular, they claim that insiders know whenever observed good performance is a result of earnings management, and will therefore not persist. They further advocate examining large option exercises rather than all transactions, similarly to Eckbo and Smith (1998) who give sizeable transactions more weight, in contrast with the stealth trading hypothesis of Barclay and Warner (1993).4 Bartov and Mohanram (2004) argue that this difference in methodology is the reason that their findings are at odds with those of previous papers. Despite conflicting results of prior studies, we conjecture that insider option exercises are
based on private information and are therefore followed by negative abnormal performance. II. 2. The effect of corporate governance on insider trading profits
An ample body of literature shows that firms benefit from good corporate governance. Strong corporate governance has been documented to positively impact share prices in the long run (Gompers, Ishii and Metrick (2003), Cremers and Nair (2005)), to decrease agency costs (Shleifer and Vishny (1997)) and, recently, to curtail (opportunistic) insider trading (Fidrmuc et al. (2006), Rozanov (2008), Ravina and Sapienza (2009)). Firdmuc et al. (2006) introduced the notion of blockholder monitoring of insider trading. As large shareholders have a greater stake in the company which gives them both stronger incentives to monitor and larger voting power to effectively intervene, these shareholders will monitor the firm more closely. However, major shareholders are not homogenous in terms of their monitoring quality: their ability and incentives to monitor hinges on their type (Holderness and Sheehan (1988)). The empirical results of Franks, Mayer and Renneboog (2001), indicate that large industrial shareholders (and to a lesser extent of family shareholdings) have a positive effect on the intensity of monitoring within a company, whereas institutional investors (e.g. banks, insurance companies, investment and pension funds) usually take a more passive stance.
Regarding blockholder monitoring of insider trades, Fidrmuc et al. (2006) find that the price reaction after purchases is smaller in the presence of blockholders who are likely to monitor management, i.e. unrelated individuals, families or corporations. Hence, insider trades are less informative for well-monitored firms. Similarly, the empirical findings of Betzer and Theissen (2009) indicate that major block ownership by a nonfinancial firm attenuates the absolute magnitude of abnormal returns both after purchases and sales. Fidrmuc et al. (2006) also document for the UK that the positive price reaction to sales is greater in the presence of
4 Eckbo and Smith (1998) study insider trades, rather than option exercises.

6
institutional blockholders who do not monitor management, but trade on their signals instead. In contrast, Rozanov (2008) argues that while transient institutional investors in the US do not monitor insiders, dedicated institutions actually curb profitable insider trading. Finally, the market reaction (positive for purchases and negative for sales) is mitigated if the director already owns a considerable stake in the company, since in this case outside investors also consider the effect of the transaction on director entrenchment (Fidrmuc et al. (2006)). With the above results in mind, we conjecture that blockholder monitoring by individuals, families and nonfinancial
companies impedes profitable insider trading and therefore attenuates abnormal return patterns
around insider purchases, sales and option exercises. Ravina and Sapienza (2009) provide evidence that governance rules also impact the
profitability of insider trades. They show that profits on insider trades are larger at firms with weak governance standards as expressed by the Governance Index of Gompers, Ishii and Metrick (2003). Moreover, their findings indicate that the gap between returns on trades of executives and trades of independent directors is wider at firms with poor corporate governance rules.
In this paper we examine the impact of corporate governance on the profitability of insider trades and option exercises. To the best of our knowledge, our paper is the first to investigate the impact of corporate governance on insiders’ option exercises. The two hypotheses underlying our analysis are what we shall call the monitoring hypothesis and the substitution
hypothesis. Although theoretically these hypotheses are not mutually exclusive, their testable implications are distinct such that the data allow us to verify them separately.
The monitoring hypothesis asserts that strong corporate governance curtails profitable insider trading, as evidenced by the results of Fidrmuc et al. (2006), Rozanov (2008) and Betzer and Theissen (2009). While good corporate governance has been shown, e.g. to decrease agency costs, there is no clear-cut explanation as to how it would mitigate profitable insider trading. We scrutinize two channels through which good corporate governance impacts insider trading: increased shareholder awareness in the absence of anti-shareholder mechanisms and blockholder monitoring. Thus, based on the monitoring hypothesis we would find less profitable insider transactions occurring at firms with stronger corporate governance standards, i.e. fewer anti-shareholder devices. To capture the effect of monitoring by blockholders we control for the identity of the largest blockholder of the firm.
The substitution hypothesis, in contrast, postulates that gains from insider trading are larger at firms with strong corporate governance as insiders will substitute insider trading with more attractive private benefits at firms where shareholder power is limited, hence corporate governance is weak. Under private benefits of control we intend e.g. the use of company resources for private purposes (Yermack (2006)) or increasing their remuneration by setting low performance targets (Bertrand and Mullainathan (2001)). Liu and Yermack (2007) show that

7
excessive CEO real estate purchases are often preceded by large insider sales and option exercises. Meanwhile, the firm underperforms the market, suggesting that the grandiose CEO home purchases are a sign of CEO entrenchment. We posit that these benefits can outweigh potential gains from insider trading and insiders will therefore seek private benefits at firms with weak corporate governance.
The reader might argue that insiders could choose to exploit both private benefits of control and still engage in profitable insider trading. A possible explanation of why insiders at firms with weak governance choose only to reap private benefits of control, but not to earn high profits on their trades is based on loss of reputation. The Netherlands Authority for the Financial Markets (AFM) may investigate the trade (after, and even though, the insider has duly reported it) to discern whether the insider has traded on private information.5 When the AFM starts an investigation and especially when public prosecution then indicts the insider (even if she is later acquitted – as trading on information is hard to prove), suspicions arise in the market about her integrity and ability to serve the interest of shareholders. Hence, she faces a loss of reputation that may result in the termination of her contract, or not being re-elected. The consequences of a tarnished reputation are more severe for insiders of firms with low shareholder rights because, given the high level of private benefits that they can enjoy (for several years), they have more to lose. Hence they are more averse to a potential loss of reputation and will not time their trades to perfection in order not to attract the suspicion of the AFM.
Also, insiders may refrain from trading on private information if they are able to reap private benefits of control, because of risk aversion. Trading on private information does not automatically guarantee a gain. The stock price can decline during an unforeseen industry-wide shock even if the firm’s prospects are otherwise encouraging. Moreover, the exact magnitude of gains is uncertain, unlike with consuming private benefits of control.
There are two papers that provide indirect support for our hypothesis that other benefits (or contractual) are a substitute mechanism for insider trading profits. Firstly, Roulstone (2003) shows that executive compensation is significantly higher at firms that impose restrictions on insider trading. The difference is between 4-13% of total compensation. Results are robust to controlling for the endogeneity of introducing insider trading restrictions. Thus, the paper establishes that insiders substitute private benefits (insider trading profits) with contractual benefits (compensation). If this is the case, it is natural to think that insiders could also substitute one form of private benefits (a higher degree of control over corporate decisions) with another (insider trading profits). Secondly, Banerjee and Eckard (2001) analyze stock price patterns associated with mergers during the Great Merger Wave of 1897-1903. During this period there
5 Section III. 1. describes the Dutch legislation on insider trading and how it is enforced.

8
were no restrictions at all on insider trading. Surprisingly however, the authors find that for mergers with disclosures similar to today’s information dissemination, stock price runups relative to the total value gain are not higher than the values observed in the modern merger literature. This result suggests that, despite the complete absence of insider trading regulations, the extent of trading on private information was not higher circa 1900 than is today. A plausible explanation is that insiders enjoyed many other sources of private benefits, and thus did not trade extensively on private information, even though there was no legal prohibition of insider trading.
Empirically, the monitoring and substitution hypotheses may not be mutually exclusive. This means that in companies with poor corporate governance, insiders can extract private benefits of control and perform insider trading. For the substitution hypothesis to hold, the degree of insider trading in firms where insiders are entrenched should be lower than that in well monitored companies. II. 3. Control variables shown to impact insider trading profits Provided that there are patterns of abnormal returns around insider transactions, several factors may drive the magnitude of these returns. Insiders in small firms have a stronger informational advantage since these firms receive less attention from analysts. This would imply a negative correlation between the information content of directors’ dealings and firm size. Seyhun (1986) provides empirical evidence that insider trading is more profitable in small companies.6 This relation holds also for option exercises: Carpenter and Remmers (2001) report short-term abnormal performance only after exercises by CEOs of small firms. Thus, we expect the absolute value abnormal returns around insider purchases, sales and option exercises to be
inversely related to firm size. As our initial position is that insiders can earn abnormal returns using private information,
we also aim at investigating whether the value of this information differs by insider type. The information hierarchy hypothesis asserts that insiders who possess more information on the operations of the company, i.e. chairmen, chief executives and other officer-directors, are able to realize larger profits on their transactions. On one hand, Seyhun (1986, 1998) and Lin and Howe (1990) have found empirical support for this hypothesis. On the other hand, Jeng et al. (2003), Fidrmuc et al. (2006) and Betzer and Theissen (2009) discern no such effect for insider trades and Huddart and Lang (2003) report that the option exercises by junior employees are just as informative of the future stock price as exercises by top management. In spite of the latter results, we conjecture that share purchases, share sales and option exercises by the chief executive
6 Jeng et al. (2003), however, find no relation between the profitability of insider trading and the size of the firm.

9
director and other executives are followed by CARs that are larger in magnitude than those
observed following the transactions of other insiders.
Option packages customarily have a vesting period of a few years, during which they cannot be exercised. From the vesting date the options can be exercised until they expire. Huddart and Lang (1996) document that most employees do not wait until expiration to exercise their option packages. Brooks, Chance and Cline (2007) reach a similar conclusion as they find that 92.34% of the options are exercised before the expiration date. The results of Bettis, Bizjak and Lemmon (2005) also evidence that early exercise is widespread, with exercise occurring a little over two years subsequent to vesting and more than four years prior to expiration on average. Options exercised at vesting are more likely converted into shares for liquidity reasons. Insiders who hold options that are just about to expire will always exercise them rather than let the option grant lapse. Thus, we expect that the absolute magnitude of abnormal returns to be the largest
around option exercises subsequent to the vesting date but prior to the expiration date. III. Institutional background: insider trading regulation and corporate governance in the Netherlands III. 1. Insider trading legislation and its enforcement
The essential principles underlying insider trading legislation in the Netherlands hold that market participants are barred from trading on private information and price-sensitive information. The former refers to information that is not publicly available, while the latter refers to information that is likely to move the firm’s stock price.7 In addition to this prohibition, corporate insiders are required to report their trades in the company’s stock and derivative instruments whose value is tied to the firm’s share price (e.g. stock options). Insiders, their family up to the second degree, large shareholders and the company itself have an obligation to disclose their transactions. This obligation was introduced in April 1999 and required all of the above parties to report their transactions no later than 10 days after the end of the month in which they took place. Transactions are disclosed to the Netherlands Authority for the Financial Markets (Autoriteit Financiële Markten, AFM) who subsequently publishes this information on its website and in the financial daily Financieel Dagblad.
In October 2002 regulations were tightened: executive board members and supervisory board members were obliged to report their trades without delay. Finally, rules were changed through the 2005 ratification of the European Market Abuse Directive. From October 2005 7 The Dutch legislation is essentially the adoption of two European Union directives, Insider Dealing Directive 89/592/EEC and its successor, the Market Abuse Directive 2003/6/EC.

10
onwards, all insiders are required to disclose transactions at most 5 days after their trade. The only exception is if the total value of the insider’s transactions in that calendar year has not reached 5000 EUR. In these cases, the insider can defer disclosure until the cumulative transaction value surpasses the 5000 EUR threshold.8 Degryse, De Jong and Lefebvre (2009) analyze the information content of insider trades in the different reporting regimes. Our data suggest that prior to the 2005 regulatory change, insiders other than the management board and supervisory board members disclosed their trades typically 4-7 days after the transaction. Thus, the regulations did not go much further than formalizing the status quo. We therefore use day 5 as the reporting day in the empirical analysis of the paper.
The enforcement of insider trading regulation is the task of the AFM. If, based on the analysis of the stock price, the AFM suspects that an insider has traded on private information, it launches an inspection. If there is sufficient evidence to corroborate the initial suspicion, the AFM reports the case to the public prosecution, after which the insider is indicted. In some cases, the AFM imposes a fine on the company for insider trading. During our sample period the AFM started an annual average of 42 inspections leading to 9 reports to public prosecution and 1 administrative fine per year.9 This means that neither the unconditional probability of an inspection taking place, nor the probability of an indictment conditional on being inspected is negligible. Therefore, loss of reputation can indeed play a role in insiders’ trading decisions, as suggested in the previous section. III. 2. Corporate governance regulation and anti-shareholder mechanisms in the Netherlands
Relating the informativeness of insider trades, block trades and insiders’ option exercises to elements of corporate governance is of particular interest on the Dutch stock market. In contrast with the US or the UK and similar to most countries in continental Europe, the Dutch model of corporate governance is stakeholder-oriented. It essentially aims at establishing a consensus among the company’s stakeholders, in particular, employers and employees. Franks and Mayer’s (2001) definition of an insider system fully fits the Dutch model: share ownership is
8 This also implies that there is no disclosure requirement if the overall value of transactions initiated by the insider does not reach €5,000 in a calendar year. However, in our sample we find several transactions that insiders reported even though the value stayed below this threshold. 9 We obtain these figures from the annual reports of the AFM. Both the number of inspections and the number of indictments depict a “U” sharpe during our sample period. Both figures peaked in 1999 (72 inspections and 13 indictments). Inspections dropped during 2002-2004, reaching the minimum (20) in 2004. The pattern is repeated with a lag of one year (showing that gathering evidence is time-consuming) for the number of indictments, which decrease sharply during 2003-2005. We observe the minimum (2) in 2004. Numbers rise again from 2005 (2006 for indictments) to reach 58 (7) during 2007.

11
highly concentrated, there are relatively few listed firms while takeover activity is rather limited (Cools and van Praag (2007), McCahery, Sautner and Starks (2009)).
In the Netherlands, six protective measures are widely used: protective preference shares, priority shares, certificates, structured regime10, binding appointments, and voting caps. It is common for Dutch firms to instate defense mechanisms (anti-shareholder devices) in the form of special securities, thereby explicitly violating the one-share-one-vote principle. The following three types of securities are commonly used to curtail the power of ordinary shareholders:
• Protective preference shares – tantamount to poison pills – are the most widespread antitakeover device. Upon a takeover threat, management issues these securities to a friendly trust office or outside investor. The shares carry full voting rights and are sold at nominal value; however, the purchaser is only to pay 25% of the amount upfront. The size of the issue may reach up to 50%, or depending on the amendments in place, even 100% of the company’s outstanding nominal capital.
• Priority shares, customarily sold to a friendly foundation, grant the bearer special voting privileges over matters such as merger approval, public offerings, the appointment of board members, charter amendments, and liquidation. These instruments are comparable to French or British ‘golden shares’.
• Certificates are tradable depository receipts carrying full cash flow rights but stripped of voting rights. They are issued in exchange for ordinary voting shares – the supervisory board has the authority to request such a transaction –, which are then deposited with the issuer of the certificates, the administration office. Through this process the legal ownership of the shares is transferred to the trust office which thus assumes all voting rights on the shares withdrawn and usually obtains the majority of the votes as a consequence.
The regulations of Euronext Amsterdam permit companies to install at most two of the above security types. This constraint was lifted in 2007, after the end of our sample period.
An important feature of the Dutch governance regime is that further institutionalized restrictions may be imposed on shareholder control by law. In addition to the anti-shareholder devices mentioned so far, numerous Dutch firms have what is called a structured regime. Limited liability companies are legally obliged to adopt this scheme if their subscribed capital is
10 The original Dutch expression structuurregime had several English translations. In legal texts and annual reports we have found the following: “statutory two-tier status”, “structured regime”, “structure regime”, “two-tier structure”, “dual-board structure”, “structural regulations for large companies”, “structural regime applicable to dual-board entities”. The Tabaksblat Code uses “statutory two-tier status” and “statutory two-tier rules”. In our study, we call this anti-shareholder provision structured regime as it is more than a two-tier structure, which is commonly used in Continental Europe, but does not include a substantial reallocation of shareholder powers to the supervisory board.

12
in excess of 11.4 million EUR, they employ at least 100 employees and have a legally installed workers’ council. The structured regime deprives shareholders of the majority of their tasks and powers, and reallocates them to the supervisory board. As a consequence, the powers of the supervisory board are extensive. Although the name suggests that supervisory board members act as outside directors and hence represent the best interest of shareholders and challenge management decisions, this has not been the case historically. Relations between the management board and the supervisory board tend to be quite cordial, also because members of the latter are often elected from main financiers, customers or business partners. A notable example of the absence of checks and balances between the management board and the supervisory board is the Ahold case, a total breakdown of corporate governance. (De Jong, DeJong, Mertens, and Roosenboom (2007)).
In a full structured regime, the following powers are transferred to the supervisory board: establishing the approval of annual accounts, election of management, and even election of the supervisory board itself (through co-optation). Moreover, the supervisory board may also overrule major decisions taken by the executive board. Although shareholders retain the right to vote on payout policy and takeovers, they are practically left with a marginal role in holding management accountable. Accordingly, Cuijpers, Moers and Peek (2005) find that companies that have a structured regime in place smooth earnings more actively, report more conservatively and are less likely to meet or beat analyst forecasts.
The current law also specifies some exemptions from this two-tier scheme, most notably for firms with foreign ownership or international operations. In particular, companies which are majority-owned by foreign entities may adopt only a mitigated form of the regime. This mitigated structured regime enables shareholders to vote on the annual accounts and the appointment of management, but preserves the appointment of supervisory board members by co-optation. Firms are fully exempted if more than 50% of their employees work abroad or if their majority owner is a Dutch multinational that has adopted the structured regime. Nonetheless, most exempt companies choose to retain a weaker version of the regime, because its full abolition requires a statute amendment which the supervisory board can readily block (De Jong, DeJong, Mertens, and Wasley (2005)).11
Prior empirical research has shown that the powerful anti-shareholder provisions in place at most Dutch firms have far-reaching effects on their financial value and policy. These effects are exacerbated even further as most Dutch companies use these devices cumulatively, thereby
11 Binding appointments mean that a specific party, other than shareholders, is granted the right to appoint board members. Bearers of priority shares commonly receive binding appointment rights; therefore we do not pursue this measure further. Voting caps, although still legal in the Netherlands, have been phased out by listed firms (OECD (2004, 2007)), thus are of no interest to our investigation.

13
restricting shareholder control severely. Renneboog and Szilagyi (2007) point out that firms that operate under any form of the structured regime are more likely to install and also to combine preference shares, priority shares and certificates.
Empirical evidence suggests that anti-shareholder devices impact corporate policies and performance. De Jong et al. (2005) find that shareholder control restrictions have considerable valuation effects. Specifically, both the full and the voluntary form of the structured regime are associated with lower firm values – measured by the market-to-book ratio – as are other anti-shareholder devices. Renneboog and Szilagyi (2007) provide empirical evidence that firms with a full structured regime in place pay lower dividends and do not smooth payments over time. This also holds for Dutch multinationals that retain the structured regime in spite of being exempted. Furthermore, preference shares have the same effect on dividend policy, even after controlling for the correlation (mentioned earlier) between the adoption of a structured regime and the use of special securities.
Given that (i) Dutch companies are reluctant to shift their governance practices, despite the proven adverse effect of structured regime and other anti-shareholder mechanisms on company value (De Jong et al. (2005)) and (ii) corporate governance mechanisms have been shown to impact firm value and financial policy, we conjecture that corporate governance devices have an impact also on abnormal return patterns around the events analyzed in this paper – i.e. insider trades and option exercises by insiders. The number of anti-shareholder mechanisms is an
inverse proxy for shareholder power. It follows that, under the monitoring hypothesis, we would
expect to see more profitable insider transactions at firms with a high number of anti-
shareholder mechanisms. The substitution hypothesis yields the opposite prediction: profits on
insider transactions should be higher at firms with few or no anti-shareholder devices. III. 3. Corporate governance changes in 2004
In 2004, there were two important modifications in corporate governance practices in the
Netherlands (Groenewald (2005)). First, on January 1, the new Dutch Corporate Governance Code (Tabaksblat Code) came into effect.12 The Code basically attempted to defuse one of the most commonly used anti-shareholder mechanisms by requiring that depositary receipt holders be granted voting rights at all times. It further encouraged shareholder participation by advising companies to enable proxy voting and facilitate shareholder communication. It also called for a more active role of institutional investors in the general meetings. Furthermore, the Code set caps on the number of supervisory board memberships assumed at other companies by executive 12 The ’Tabaksblat’ committee that drew up the Code was chaired by and named after the former Unilever CEO Morris Tabaksblat.

14
board members and supervisory board members. The Code was enforced using a “comply of explain” approach.
The second change in corporate governance regulation came through the Structured Regime Reform Act, effective September 1, 2004. The Act primarily cut back on the authority of the supervisory board, but also increased shareholder power in other respects. It allowed shareholders and the works council to recommend candidates for supervisory board membership, prior to the nomination made by the supervisory board. Also the firm’s annual accounts and the remuneration of the members of the two boards now had to be approved by the general meeting. Moreover, the Act specified that a general meeting of shareholders representing at least one-third of the issued capital may reject nominations for supervisory board members and dismiss the entire supervisory board with a majority vote. It also required prior shareholder approval for the transfer of the company’s business to a third party, the initiation of a sustainable cooperation (e.g. a joint venture) with other firms and proposed transactions in the shares of companies if the transaction value is greater than or equal to one-third of the firm’s own assets. Furthermore, the law explicitly stated the right of both shareholders and holders of depositary receipts to place resolutions on the agenda of general meetings, provided that they hold a stake of at least 1% or 50 million EUR in the company’s shares. The Act obliged companies to give depositary receipt holders voting rights, except in the event of a hostile takeover bid.13
As both of these corporate governance changes are aimed at strengthening shareholder rights and reducing the impact of anti-shareholder mechanisms, we use the 2004 modifications as a quasi-natural experiment. Since the corporate governance changes increased shareholder power, they arguably diminished the ability of insiders to enjoy private benefits. Hence, if profitable insider trading and reaping private benefits of control are substitutes, we should see the correlation between the two phenomena decline after 2004. We therefore hypothesize that profits
to insider trading are negatively related to the number of anti-shareholder mechanisms employed
by the firm until 2004, but not afterwards.
IV. Data sources, descriptive statistics and methodology IV. 1 Sample description
The primary information source for our sample is the public register of the Netherlands Authority for the Financial Markets (Autoriteit Financiële Markten, AFM). The sample 13 Thus, the Structured Regime Reform Act is not as radical as the Corporate Governance Code. The latter, however, is not legally enforceable.

15
comprises purchases, sales and stock option exercises from April 1999 to April 2007 of all insiders that have a reporting obligation, as defined in subsection III 1. The register contains disclosed trades in stocks, options and warrants. For insider transactions, AFM publishes information on the company names, insiders’ names, transaction dates, number of instruments traded, prices, security type and transaction type. In the case of option exercises, if stocks are immediately sold after the exercise, the database also includes the sale price and the number of stocks sold.
The number of AFM disclosures in our initial database totals 15,527 for 134 companies. All trades in convertible securities, restricted share awards, stock appreciation right awards and warrant-related transactions are erased from the sample. We aggregate multiple insider purchases and sales of one insider, taking place on the same day into a single transaction and, in a similar fashion, aggregate option exercises by the same person on the same day into one observation. If the AFM database indicates that transactions occurred in the weekend (Saturday or Sunday), these transactions are dealt with as if they had occurred on the closest neighboring trading day that corresponds with the price paid by the insider. We drop entries containing typographical errors which could not be validated after searching through the firm’s annual report and/or retrieving information from Datastream. We also delete transactions that took place within 40 days of the first quotation of the firm on Euronext Amsterdam as abnormal returns can then not be calculated.
We search the companies’ annual reports to gather information on the role of the insider at the firm, various accounting data and anti-shareholder mechanisms in place. Information on companies’ ownership structure has been gathered using publicly available information disclosed on the AFM website and companies’ annual reports. We use Bureau van Dijk’s AMADEUS database, to complement any missing data. Information on the characteristics of the exercised options, i.e. the grant date, vesting period and expiration date are obtained from the annual reports.14
The market returns are based on the Amsterdam Exchanges All-Share Index as market index. Since the exercises in the sample not only refer to companies listed at the AEX, but also to midcap and small cap companies, we consider this index as the best proxy for measuring market returns. Risk-free returns are based on the daily rolling interest rates on Dutch three-month zero discount bonds. The betas are monthly rolling betas with a 5-year moving average.
14 Any exercise that occurs within 30 days of the expiration (vesting) date is considered as an exercise performed at expiration (vesting). For part of the sample the exact dates are unavailable and only the year of expiration (vesting) is known. In these cases, an exercise at expiration (vesting) is defined as any exercise that occurs in the year of expiration (vesting).

16
IV. 2. Descriptive statistics
Table 1 reports the summary statistics on all AFM-disclosed insider purchases, sales and option exercises performed by between April 1999 and April 2007.
– Insert Table 1 here –
Panel A shows statistics on the full sample, whereas Panel B partitions transactions by years and by insider type. Insider purchases have the highest mean value, in contrast, they also have the lowest median value, suggesting considerable skewness of the distribution. The majority of the exercises occur between the vesting date and the expiration date (725 exercises or 62%). For this category the percentage of stocks sold after exercise is also the highest (90.74%). The mean (median) value of insider purchases peaked in 2004 (1999), while the largest mean (median) value for sales was calculated in 2000 (2006). For option exercises, we observe the highest mean (median) in 2000 (2007). Most transactions are performed by insiders who are neither members of the executive board nor of the supervisory board. Whereas the proportion of transactions for purchases and sales is approximately equal among the remaining three categories, the second-largest group for option exercises are, by far, members of the executive board (11%).
Table 2 provides an overview of the anti-shareholder mechanisms used by firms in our sample and describes the correlation patterns between these provisions.
– Insert Table 2 here –
IV. 3. Methodology We use event study methodology to identify to the gains on insider purchases, sales and option exercises. To define expected returns, we use the CAPM as a benchmark. The market return is defined as the Amsterdam Exchanges All-Share index. To determine the significance of the AARs and CAARs, we use a simple t-test, as defined in e.g. Barber and Lyon (1997). Since the parametric test may be sensitive to extreme observations, we also compute the nonparametric Wilcoxon rank sum test. Furthermore, given that we group the data in our univariate analysis according to some firm or insider characteristics and the resulting groups often contain quite few observations we also choose to use a bootstrap method to provide further validation for our t-tests. Under certain conditions, bootstrapped estimators attain a faster convergence to the true value than first-order asymptotic approximations and therefore provide refinements to hypothesis

17
testing in small samples (Horowitz (2001)). Because power loss may be severe for tests at low significance levels, we follow the recommendations of Davidson and MacKinnon (1999) and run the bootstrap simulations with 3000 repetitions. To account for the correlation between CARs following trades by different insiders of the same firm we compute heteroskedasticity-robust standard errors clustered at the firm level. Furthermore, we run regressions with firm fixed effects.
To identify the direction of causality between the profitability of insider transactions and the number of anti-shareholder devices employed by the firm, we use the 2004 changes in Dutch corporate governance regulations as a quasi-natural experiment. As described in subsection III. 3., Dutch legislators and the Committee on Corporate Governance pushed to mitigate the impact of anti-shareholder devices. Thus, sample firms with many anti-shareholder devices were forced to cancel some of them (mostly depositary receipts and the structured regime). This lead to a decrease in the differences between firms in the level of shareholder-orientation and hence also in the level of private benefits enjoyed by insiders.
Therefore, our sample became more uniform in terms of the levels of private benefits after the 2004 corporate governance changes. If it is the level of private benefits that influences insider trading profits, the sample should also become more uniform in terms of the profitability of insider transactions. This means that we would expect to see a strong correlation between the number of anti-shareholder mechanisms and the profitability of insider transaction prior to 2004, but none or a weaker one afterwards.
To investigate this, we adopt a differences-in-differences (DD) strategy. We construct a dummy variable for transactions that took place prior to or in 2004 and include it, as well as its interaction with the anti-shareholder index, in the regressions of Table 8.15 Although the change in the corporate governance code became effective on January 1, 2004, many companies amended their corporate governance provisions only in or after 2005. Therefore, we repeat this procedure with a dummy variable for transactions before or in 2005.
We report three types of regressions. Our baseline OLS specification can be written as
[ ] ististststist XBHASICAR εγβββ +′+++= 21040,0 ,
where ASI is the anti-shareholder index, a count variable of the number of anti-shareholder provisions in place, BH contains binary variables indicating the type of the largest blockholder and X contains our control variables. In order to exploit the regulatory change in 2004, we also employ specifications with firm fixed effects, formulated as
15 In these specifications we exclude the economic trend dummies to avoid multicollinearity.
(1)

18
[ ] iststsist ASICAR εββα +++= 1040,0 .
This has two advantages over the OLS setup. First, in these regressions with firm FE, �1 is identified only by transactions at firms that alter their governance structures. Second, although we employ numerous control variables, firm FE capture effects beyond size, profitability, leverage or blockholder structure.
Finally, the differences-in-differences regressions take the form
[ ] istisstststist XPREASIPREBHASICAR εγβββββ +′+++++= 2004*200440,0 43210 .
PRE2004 indicates any level effect, (i.e. common time trends) that influenced the profitability of insider trading at all firms following 2004. It captures, for instance, the regulatory change concerning the disclosure of insider trades, analyzed in detail by Degryse et al. (2009). ASI*PRE2004 is our key dependent variable: it shows the effect of anti-shareholder mechanisms on the profitability of insider trading in the period prior to the 2004 corporate governance changes. If the number of anti-shareholder mechanisms indeed influences insider trading profits, then we should observe this effect until 2004, when firms differed considerably in their anti-shareholder structures, but not after 2004, when their governance structures converged. Thus, �4 should be significantly different from zero, whereas �1 should not.
To justify our empirical setup, we proceed by describing how the anti-shareholder index evolved over time in our two groups: firms that were legally obliged to do away with some anti-shareholder mechanisms (we call this the group of “changers”), and firms that were not and thus did not alter their corporate governance structures (“non-changers”). In Table 3 we present the average number of anti-shareholder mechanisms in the two groups over time in our three subsamples based on transaction type (purchases, sales, and option exercises). Since in the regressions our observations are transactions, we tabulate both equally-weighted averages and averages weighted by the number of transactions, to account for the higher number of some firms’ transactions in the sample. The fluctuation in the averages is due to firms’ attrition and re-appearance: not all firms have transactions in all our sample years. During our sample period, no single firm increased the number of anti-shareholder mechanisms in place. They either retained the existing anti-shareholder devices or abolished some of them from one year to the next. There is a marked difference between the averages of changers and non-changers at the beginning of the
(2)
(3)

19
sample period.16 However, as expected, the wedge between the two groups vanishes completely by 2005. Figure 1 illustrates the dynamics of the anti-shareholder index in the two groups using the equally weighted averages from the purchase subsample.
- Insert Table 3 here –
- Insert Figure 1 here -
A possible source of bias to our empirical strategy is if firms that would have had to alter
their governance structures chose instead to delist from the stock exchange. We obtain data on delistings from Euronext Amsterdam. The average number of delistings during 2003-2005 is lower (not higher) than the average taken over our entire sample period of 1999-2007. Furthermore, during 2003-2005 none of our sample firms initiated a voluntary delisting and more than 89% of delistings occurred due to M&A or bankruptcy. We conclude that our sample firms did not attempt to sidestep the imposed changes in governance rules by delisting from the stock exchange.
V. Results
We first conduct tests on the full sample of insider purchases, sales and option exercises, to analyze whether and to what extent insiders are able to gain from their transactions. The results are exhibited in Table 4.
− Insert Table 4 here −
Purchases are followed by a significant abnormal stock price appreciation of approximately 3.5%, whereas the stock price depreciates only 0.44% abnormally after a stock sale. Calculating the abnormal returns following the supposed announcement date (day 5), we find significant CARs of 2.67% and -1.14% for purchases and sales, respectively. As expected, purchases have higher information content than sales. Similarly to Ravina and Sapienza (2010), we check that these abnormal returns are not an artifact of insiders purchasing during periods of stock price appreciation or selling during stock price declines. Purchases are preceded by a
16 The disparity between the two groups is less pronounced in the option exercise subsample. A possible reason is that some firms do not grant their executives stock options during some parts of our sample period. Due to the absence of mandatory compensation disclosure for the most of our sample period, we are unable to fully verify this.

20
significant share price decline of -4.55% (not annualized) over 40 days, whereas we discern a notable price run-up of 5.53% over the same period before sales. The significance of the reported results is confirmed by bootstrapped t-statistics. The results on abnormal stock performance prior to insider transactions are also consistent with portfolio rebalancing decisions after portfolio proportions get too far away from optimal levels. Thus, in the remainder of the paper we focus solely on abnormal returns following insider transactions.
We scrutinize how anti-shareholder mechanisms (described in Section IV) influence the CARs around insider purchases, sales and option exercises. Table 5 presents CARs around purchases grouped by the presence of the four main anti-shareholder mechanisms. A maximum of three measures may be present because firms are forbidden to employ preference shares, priority shares, and depository receipts simultaneously.
− Insert Table 5 here −
Panel A of Table 5 examines the impact of anti-shareholder mechanisms around purchases. We find no disparity between firms with and without preference shares in terms of the share price decline prior to the purchase. When we split our sample based on the use of priority shares, we find considerably smaller abnormal movements in the share price at companies which use these defensive securities. CARs before a purchase are indistinguishable from zero at companies with priority shares, whilst the price drops 7.7% over the 40 days before the purchase at firms without this anti-shareholder measure. Moreover, following purchases, CARs over a period of two months subsequent to the transaction (day 0) or announcement (day 5) are approximately two times larger at firms with no priority shares, providing further evidence of more accurate timing by insiders. As both the pre- and the post-transaction share price movements are more pronounced at firms with no priority shares, the data support the substitution hypothesis. Purchases are timed more accurately at firms where insiders are unable to curtail shareholder rights as there are no priority shares which would allow them to decide on e.g. the composition of the supervisory board and the executive board by themselves. Conversely, CARs following purchases are lower at firms where insiders can effectively bypass shareholders in numerous decisions and can thus use the company’s assets for goals other than maximizing shareholder value.
Partitioning the observations according to the presence of the structured regime yields similar results: both pre- and post-event abnormal share price movements are substantially larger in absolute value if shareholder power is not diminished by the adoption of the structured regime. The insiders of companies without the structured regime on average purchase shares when the abnormal return had declined by 10.4%, which is a much larger decrease than for companies that

21
impose the structured regime (-2.5%). During the 35 days following the announcement date of the purchase (day 5), the abnormal rise in the stock price is in excess of 5% for firms without the structured regime as opposed to 2% at firms that apply this anti-shareholder mechanism. CARs following the event as well as the announcement are comparable in magnitude for the subsamples of firms with and without depository receipts.17
Finally, we examine the disparities between trades at firms employing three anti-shareholder mechanisms (the regulatory maximum) and at those that have no such measures in place. Abnormal losses in the 40 days leading up to the exercise are much more severe for companies without anti-shareholder mechanisms. In contrast, firms using three or no anti-shareholder mechanisms do not differ significantly in terms of the post-purchase CARs. The results thus far suggest that the absence of anti-shareholder mechanisms magnifies the absolute values of both the CARs preceding and following insider purchases. This pattern of CARs supports our substitution hypothesis, whereas it casts doubt on the validity of the monitoring hypothesis. We now perform identical tests on sales (Table 5, Panel B) and option exercises (Panel C).
The first part of Panel B shows CARs around insider sales at firms with and without preference shares. The share price run-up before the sale is notably sharper in the absence of preference shares (11.75%), as is the subsequent decline, irrespective of whether the CARs are measured from the transaction date [0,40] or the supposed reporting date [5,40]. We observe similar patterns for the structured regime and priority shares. For both categories, we see that CARs following sales are again distinct in the two subgroups: they are negative for companies that employ no priority shares but positive for their peers that do. Partitioning the sample based on the structured regime produces largely similar results. Also, when splitting the sample based on the presence of depositary receipts, we find that CARs after sales are more negative at companies that do not use this instrument to lessen shareholder rights. The difference is significant at the 1% level. Hence, these univariate results for the subsample of stock sales are in favor of the substitution hypothesis.
Finally, we investigate the CARs at firms with an intensive use of anti-shareholder mechanisms and those without. Consistent with results on the individual anti-shareholder mechanisms, the abnormal share price appreciation is significantly larger (10.9%) at firms lacking all anti-shareholder mechanisms. Abnormal stock price patterns after (the announcement of) the sale differ significantly: while CARs are positive following sales at firms with all possible
17 Nonetheless, we note that the reaction appears to be delayed as significantly positive abnormal returns are realized over the 5 days after the purchase at companies without depository receipts, whereas a CAR of similar magnitude is observed only after the announcement of the trade at firms that have this defense mechanism in place.

22
anti-shareholder mechanisms, they are negative at their counterparts that refrain from installing such devices.
Panel C shows the results on the sample of option exercises. In general, we find that the abnormal share price appreciation is significantly greater for option exercises at firms that do not employ a specific anti-shareholder mechanism. Moreover, pre-event CARs are approximately twice as large for firms that do not employ preference shares or priority shares, respectively, compared to their counterparts that do. The difference in the abnormal share price appreciation is four-fold between firms with all possible anti-shareholder mechanisms and without any. However, CARs following option exercises do not exhibit significant differences between subgroups. Therefore, to the extent that pre-transaction CARs are indicative of insiders’ trading strategies, the data on option exercises provide some support for the substitution hypothesis.
Taken together, these results suggest that the lack of anti-shareholder mechanisms is associated with a higher absolute magnitude of CARs following insiders’ transactions. Even though these patterns appear to be robust in a univariate setting, given the correlation between anti-shareholder mechanisms and other firm characteristics such as size, profitability or ownership structure as well as the association amongst the anti-shareholder mechanisms themselves, we further analyze the role of anti-shareholder mechanisms in a multivariate framework. We use the post-transaction CARs a dependent variable. We consider event windows of forty days. In Tables 6, 7 and 8 we regress CAR[0,40] for insider purchases, sales and option exercises, respectively, on an index counting the number of anti-shareholder devices at the firm (ranging from 0 to 3) and numerous controls. The first column shows a simple OLS regression, without controls. In the second column we include firm fixed effects, so that the coefficient on the anti-shareholder index is identified only by firms that change the number of anti-shareholder mechanisms. The third column exhibits differences-in-differences estimates, using the 2004 changes in corporate governance as an exogenous shock to the number of anti-shareholder mechanisms. In the fourth and fifth columns we re-estimate the specifications of the first and third columns, respectively, using an extensive set of controls. Control variables include company size, profitability, leverage (all three measured in the business year prior to the transaction), the firm’s age, the position of the insider at the firm, the identity of the largest blockholder, and dummy variables capturing the macroeconomic trend. For option exercises, we also control for exercise at or prior to expiration and the retention or sale of the obtained shares.
− Insert Table 6 here −
Departing from the full sample average CAR[0,40] of 3.46%, our within-firm
specifications show that when the number of anti-shareholder mechanisms was reduced at a firm,

23
the CAR becomes significantly higher, on average by 2.21% for each anti-shareholder mechanism. DD estimates buttress this finding, with a coefficient of similar magnitude, significant at the 1% level. The DD regression reveals also that, consistent with our conjecture, the number of anti-shareholder mechanisms had no impact on the CARs after the corporate governance changes of 2004. Thus, the number of anti-shareholder mechanisms is not merely correlated with the returns to insider trading, but we also have suggestive evidence to argue the direction of causality. In alternative specifications of the DD equations (columns 3 and 5), we replace the anti-shareholder index, also in the interaction term, with a dummy variable indicating if the firm changed its governance structure in 2004. Results from these regressions (untabulated) support the claim that after 2004, post-purchase CARs increased at changers, when compared to non-changers, which provides further corroboration for the substitution hypothesis.
The inclusion of control variables in both the basic OLS regression and the DD specification yields coefficients that are not only similar to those found without controls but are to each other (-2.25% for OLS and -2.88% for DD). Moreover, coefficients are significant at the 1% level in both extended regressions. Taken together, when including control variables, we find equally strong empirical support for the substitution hypothesis. Furthermore, results from the DD approach indicate that it is the number of anti-shareholder mechanisms that influences the CARs following insider purchases and not conversely. Moreover, coefficients are also significant economically, an issue which we return to in Section VI.
Coefficients on other covariates indicate that insider type affects the extent to which the share price movements favor the insider. Holding other factors constant, CARs are significantly lower following purchases of supervisory board members compared to those of CEOs and other types of insiders. As our base category contains widely-held firms (with no entity owning 5% or more), we also conclude that CARs following purchases are significantly higher if either the government or an industrial or commercial company holds a substantial stake in the firm. The latter finding is difficult to square with the idea of blockholder monitoring, hence it goes against the monitoring hypothesis but is consistent with the substitution hypothesis.
Firm size is positively related to post-purchase CARs, but only in the DD specification, providing mild evidence against the notion that investors have more information about large firms in general. CARs after purchases appear to decrease with leverage. To the extent that high leverage is a symptom of financial distress and the firm underperforms, we would indeed expect there to be fewer stock price movements that managers can exploit. Firm age shows no significant relation with the CARs. We can therefore reject the conjecture that the difference in governance structures is due solely to firm age, or to the renown on the Dutch or the international

24
market. Abnormal share price patterns after insider purchases are not influenced by the overall trend in the economy.18,19
Table 7 shows results from the same five regression specifications on the 40-day CAR following insider sales. The baseline OLS regression suggests that following insider sales, CAR[0,40] is significantly positively related to the number of anti-shareholder mechanisms at the firm. After controlling for firm fixed effects, the point estimate of the coefficient is comparable to that found in the OLS setting and is once again significant at the 1% level, suggesting that whenever a firm reduced the number of anti-shareholder mechanisms, CARs following insider sales become more negative. The relationship is still significant with a coefficient of roughly 2 even after including control variables. In sum, the regression results on the subsample of sales provide further support for the substitution hypothesis.
− Insert Table 7 here −
DD estimates lack statistical significance, most likely because the full sample
CAAR[0,40] for sales is much smaller in absolute value than for purchases, a result that has been long recognized in the literature. The smaller size of post-sales CARs renders it more difficult to accurately identify drivers of cross-sectional or time-series variation, as evidenced by the substantially lower goodness-of-fit values. Further empirical evidence of this pattern is provided by the coefficients on the control variables, of which only two appear to be significant. Firstly, CARs are more negative after stock sales by CEOs, which suggests that chief executives have superior information about the firm’s prospects. Secondly, CARs are less negative for insider sales at large firms.
When scrutinizing CARs following option exercises, in Table 8, consistent correlation patterns are hard to ascertain. This is unsurprising as option exercises may be driven by reasons other than private information. Accordingly, and in contrast to stock transactions, it is actually the macroeconomic trend that emerges as a significant driver of CARs after option exercises. CARs are significantly more positive during the economic upturn through September 2000, and more negative during the subsequent decline, which ended in early 2003. The magnitude of the effect of the macroeconomic cycle appears to be symmetrical during these periods, approximately 4.25%.
18 Results are unaffected by exchanging the economic trend variables with year fixed effects. 19 We infer that the overall situation of the economy is irrelevant to the abnormal returns after insider trades. An alternative explanation could be that since 2003 the effectiveness of timing by insiders declined. Most notably, changes to insider trading regulations and disclosure rules in 2002 and 2006, respectively, may have had an impact on timing. However, when using year fixed effects, as discussed in footnote 25, we find no evidence of this, furthermore, a priori, we would expect these changes to have had an impact also on sales and option exercises.

25
− Insert Table 8 here −
Although the coefficient on the number of anti-shareholder mechanisms is positive in
three out of five specifications and significant in the DD regression without controls (third column), it is unclear whether the substitution hypothesis holds also in the case of option exercises. If these transactions are not driven by private information, then our findings regarding substitution of private benefits and insider trading profits should indeed be limited. Notwithstanding, we again provide evidence that blockholder monitoring by the government is quite ineffective: CARs are substantially more negative at firms where the government has the largest stake. Lastly, there is some support for the conjecture that option exercises occurring at vesting are followed by less negative abnormal returns. Although Tables 6, 7 and 8 report only conventional t-statistics, our results are virtually unaltered when using t-statistics based on bootstrapped standard errors.
Overall, the regression models reinforce the results of our univariate analysis and suggest that at firms with a lower number of anti-shareholder mechanisms insider purchases entail more positive CARs, whereas sales and option exercises at such firms entail more negative CARs. Moreover, we reveal that the presence of blockholders is associated with more accurate timing by insiders, not less. In line with our expectations and previous literature, results are marked for stock purchases, which are most likely to be based on private information, and somewhat less pronounced for sales and option exercises. Hence, the findings of our multivariate analysis also substantiate the substitution hypothesis and go against the monitoring hypothesis.
V. 1. Robustness checks To eliminate possible sources of spurious correlation, we subject our results to five further robustness checks. Transactions in months of frequent trading
We examine whether the detected relationship between insider trading, option exercises
and corporate governance is driven by transactions in months when the majority of insiders was purchasing (selling) the stock or when there were a large number of insiders exercising their option packages. We define a high net purchase month as any month in which purchases outnumbered sales by ten or more. High net sale months are defined similarly. Lastly, we order months by the number of option exercises that took place and label the top decile as high option

26
exercise months. We then re-estimate the regressions shown in Tables 6, 7 and 8 and add the corresponding binary variable for high net purchase months, high net sale months or high option exercise months to the regressions that feature control variables. Compared to the baseline results reported in the fourth and fifth columns of Tables 6, 7 and 8 this procedure yields quantitatively similar coefficient estimates and identical significance levels.20 Therefore, we are reassured that that our main results hold equally in periods of intensive insider purchasing, selling and option exercising.
Differences in trading intensity
Our results indicate that legal insider trading and option exercising is less profitable at firms with a higher number of anti-shareholder mechanisms. However, insiders at firms with weak shareholder orientation may choose a different approach and trade more frequently, thereby making up for the lower of profitability of the individual trades. We explicitly test for this explanation by examining the average number of trades executed per year. We then compare the averages for all three types of transactions across different levels of the anti-shareholder index. For all three transaction types we find that the number of transactions per year do not differ significantly in the groups created based on the anti-shareholder index. An inherent problem with this approach is that firms that changed their governance structures have a different number of anti-shareholder mechanisms, and thus belong to two different groups in different sample years. To address this problem, we repeat the analysis by grouping the firms into switchers and non-switchers. Again, there is no evidence of differences in trading frequencies across groups.
Clustering of option exercises
To ascertain the robustness of our findings on option exercises, we delve into exercises by
insiders at the same company. Thus far, we have argued that insiders are able to time their option exercises to the market, realizing a significant abnormal return on the transaction. If this is the case, then it is also plausible that more insiders at a given firm take advantage of the favorable price movements. Hence, exercises may occur in groups rather than in a random fashion over time. When more insiders of the same company exercise their option packages on the same day, the signal sent to the market is clearer. Furthermore, there are no complications in identifying the event day and no overlapping event windows. Although we initially find that multiple insider exercises are timed more carefully than standalone transactions, this difference vanishes once we
20 Results are available upon request.

27
exclude exercises that occur at vesting or at expiration, which are arguably natural clustering dates.21
Informational opaqueness
One possible mechanism that may explain the difference between the CARs following insider transactions is that firms with strong corporate governance are more transparent. Thus, shareholders have more information based on which they can adjust their valuation of the stock price. It follows that insider transactions do not carry much additional information. By contrast, firms with weak governance are informationally opaque, therefore insider transactions should be more informative. If this were the case, we would expect to see more sizable CARs after insider purchases at firms with weak corporate governance (high number of anti-shareholder mechanisms) than at firms with strong governance (few or no anti-shareholder mechanisms). However, we observe exactly the opposite in our data: the number of anti-shareholder mechanisms is negatively related to CARs following purchases, not positively (and positively, not negatively to the CARs following sales).
Notwithstanding, we choose to examine empirically whether informational opaqueness can, in part, explain our results. To this end, we gather information on earnings announcements and use changes in stock price volatility around these events to capture informational opaqueness. Our proxy is defined as the percentage change in the 10-day realized stock return volatility before and after the earnings announcement. To eliminate idiosyncratic effects, we consider three-year moving averages of this measure by averaging over all earnings announcements in a given year, the previous year and the following year. We then add this proxy to the regressions in the fourth (OLS with controls) and fifth (DD with controls) columns of Tables 6, 7 and 8. We find that the change in volatility around earnings announcements does not enter significantly in any of the regressions. We conclude that informational opaqueness cannot explain the variation in CARs following insider transactions.
Liquidity
One further concern regarding the interpretation of our results is that investors may be reluctant to hold and trade in stocks of firms with a high number of anti-shareholder mechanisms. If this were the case, the anti-shareholder index used in our regressions would not only proxy for the strength of corporate governance at the firm level, but also for the liquidity of the stock. To
21 Tables are available upon request.

28
distinguish between our explanation and one based on liquidity, we consider the turnover of the stock over the one-year period preceding the insider transaction, expressed in percentage terms. We include this variable in the regressions in the fourth (OLS with controls) and fifth (DD with controls) columns of Tables 6, 7 and 8. Our results (untabulated) indicate that although turnover is significantly correlated with post-event CARs in the case of purchases and option exercises, coefficient estimates and significance levels for the anti-shareholder index are unchanged by the inclusion of this control variable.
VI. Estimating the value of private benefits
In Section V, we have shown that CARs are higher after insider purchases and lower
following sales and option exercises at firms that employ fewer anti-shareholder mechanisms or employ none at all. We argue in our substitution hypothesis that the reason underlying this pattern is that insiders of firms protected by anti-shareholder mechanisms enjoy substantial private benefits of control. The empirical support this hypothesis receives in our dataset suggests that these benefits of entrenchment, both monetary and nonmonetary, may outweigh the prospective gains from insider trading. Therefore, CARs following insider transactions will favor the insider to a lesser extent at firms where they are ensured a powerful position owing to anti-shareholder mechanisms. However, at corporations where shareholder rights are not suppressed and the degree of entrenchment is thus small, they may resort to legal insider trading to still exploit their position. In line with previous literature, we have established that CARs have the largest absolute value following insider purchases, as sales and option exercises may take place for liquidity and other reasons.
Hence, the value of an anti-shareholder mechanism can be approximated by the coefficient estimates on the anti-shareholder index in our regressions of CAR[0,40] following insider purchases, as these express the average incremental gains to insider trading at companies that have one anti-shareholder mechanism fewer.22 We base our estimates on the coefficient in the fourth column of Table 6, although point estimates are remarkably similar across specifications. The hypothetical increment in profits due to the change in CARs is calculated as
pqβ , where p is the observed market price of the shares on the day the transaction took place, q is the number of shares purchased and β is the regression coefficient on the anti-shareholder index in the regression of CAR[0,40]. Because abolishing one anti-shareholder mechanism at a
22 By using the number of anti-shareholder mechanisms, we proxy for the value of the private benefits as there is no one-to-one relation between the consumption of private benefits and the reduction of insider trading. As we have argued before, they are not perfect substitutes. If they were, in fact, imperfect substitutes, our estimation procedure would understate the true value of entrenchment.

29
firm would, on average, lead to an increment in insider trading profits, we interpret these profits as the value of the anti-shareholder mechanism. Alternatively, if the firm had one anti-shareholder mechanism more, insiders would be able to consume more private benefits of control and would therefore devote less attention to their trades in the company’s stock. Our regressions predict that this would shrink their profits from insider trading by pqβ . Finally, we take the average of the estimates for the individual transactions. When performing the estimation for the subsample of stock purchases, this procedure yields an annual average value of €14,231. We interpret this as the average value of entrenchment that is due to one anti-shareholder mechanism.
We underline that this is a rather conservative estimate and that it refers to the value of one anti-shareholder mechanism. As seen in Table 2 the majority of our sample firms employs two or more anti-shareholder mechanisms, thereby creating a greater degree of entrenchment which, according to our estimation procedure, would double or treble the value of private benefits. Moreover, our estimate is based on single transactions of individual insiders. Insiders can repeatedly trade in the firm’s stock, which suggests that the longer the anti-shareholder mechanisms remain installed, the more valuable they are. Furthermore, an insider may purchase (and sell company) stock frequently within the span of one (business) year. Lastly, insiders of the same firm collectively enjoy benefits of control stemming from entrenchment, therefore one could also valuate these benefits as the sum of incremental gains from insider trading realized by all insiders of a firm, or, at the very least the CEO and the board of directors. These considerations underscore that the approximation of the value of entrenchment presented in this paper renders a conservative estimate, which is a lower bound for the value of entrenchment.
We therefore repeat the estimation using data on the actual transactions and number of anti-shareholder mechanisms for each firm-year. Thereafter, we sum up the estimated entrenchment values during our sample period for each firm, explicitly taking into account that not every firm had each transaction type each year (i.e. for some years the value is zero), as mentioned on p.18. The average of the firm-level estimates, using the subsample of purchase transactions is €227,546.23
There are two caveats to this interpretation. The first is that these results are predicated on the assumption that the relationship between the number of anti-shareholder mechanisms and the CARs following insider purchases is linear. As our dependent variable is essentially a residual,
23 This figure is calculated as � � �= = =
n
i t
m
jtijtijti aqp
n1
2007
1999 1,,,,,
1 β , where � is the regression coefficient of the anti-
shareholder index in the regression of the CAR[0,40] following insider purchases, from Table 6., column 4., p is the actual price at which the transaction was executed, q is the number of securities involved in the transaction, a is the number of anti-shareholder devices employed by the firm in that year, i indexes the firm, t indexes the year and j indexes the transaction in a given firm-year. The total number of firms in a subsample (in this case, purchases) is denoted by n, and the number of transactions (purchases) at a firm in a year is m.

30
including higher-order terms may be demanding of the data, or lead us to overfit the regressions in-sample. The second caveat is that if substitution between profitable insider trading and private benefits of control ceased after the 2004 corporate governance changes, then we should not use data from 2005 onwards to estimate the magnitude of private benefits. The DD specifications in the third and fifth columns of Table 8 confirm that regression coefficients were higher for the period 1999-2004, therefore, our estimates on the value of an anti-shareholder mechanism to one insider would also be higher. Once again, these results underline the conservative nature of our estimation procedure and that our calculations are a lower bound on the value of anti-shareholder mechanisms. VII. Conclusion
Insiders of publicly listed firms possess more information about the company than outside shareholders. This informational advantage can be converted into profits through insider trading, illegal or legal. This paper studies insider trading and option exercises, and establishes their connection to several aspects of corporate governance: governance rules (as measured by the anti-shareholder mechanisms) and blockholder concentration. We examine a sample of insider trades and option exercises at listed firms in the Netherlands, a financial market where shareholder rights are significantly restrained through several anti-shareholder mechanisms. The most widely used anti-shareholder devices are the structured regime, priority shares, preference shares and depositary receipts.
Our results show that insiders, on average, earn a cumulative abnormal return of 3.46% following purchases, however, the price does not decline significantly following stock sales and option exercises. Our analysis reveals also that abnormal share price appreciation after CEO purchases is roughly 5%, whereas the abnormal loss following a CEO stock sale is in excess of -10%. In line with an information hierarchy among insiders, abnormal stock price movements are less sizeable following transactions of executive board members other than the CEO, supervisory board members and other insiders.
We shed new light on the interrelationship between insider trading and corporate governance by assessing how anti-shareholder mechanisms such as preference shares, priority shares, depository receipts, and the structured regime influence abnormal stock price patterns around insider trading and option exercises. Our baseline hypothesis on this relationship is the monitoring hypothesis, which asserts that the absence of anti-shareholder devices leads to greater shareholder awareness, which curtails insider trading. Based on this argument, insider trading should be more profitable at companies employing many anti-shareholder mechanisms. The

31
alternative, the substitution hypothesis posits that private benefits of control owed to anti-shareholder mechanisms are larger than potential profits to insider trading. Therefore, insiders are likely to seek trading profits if they cannot exploit private benefits, implying larger profits to insider trading at firms with fewer anti-shareholder devices. We provide compelling evidence that the absolute value of abnormal returns following insider transactions is higher at firms that do not limit shareholder rights by employing anti-shareholder mechanisms. The findings are strongest for insider purchases, consistent with the notion supported by previous empirical work that sales may be motivated by liquidity or diversification motives.
The paper contributes to the extant literature on insider trading and corporate governance by alleviating concerns of endogeneity and addressing the causal relationship between governance rules and insider trading profits. To accomplish this, we adopt a differences-in-differences approach which uses the 2004 changes in Dutch corporate governance regulations as quasi-natural experiment which shifts corporate governance rules. Our findings indicate that as firms did away with shareholder-unfriendly governance structures, profits to insider purchases did indeed increase.
These results are unanimously in the favor of our substitution hypothesis and suggest that corporate insiders are more inclined to make profits on trades in the shares of their company if they do not (or to a lesser extent) enjoy private benefits stemming from weak shareholder rights. In contrast, we observe that insiders at companies with several anti-shareholder mechanisms earn significantly lower abnormal returns following their trades. From this, we infer that private benefits of control outweigh the returns to insider trading and option exercising if management is heavily entrenched. However, if anti-shareholder devices do not impede shareholder participation in company decisions, insiders cannot (or to a lesser extent) attain private benefits and will substitute them with profitable insider trading. The most likely reason our results differ from those of previous studies is that the variation in shareholder rights is much larger in the Netherlands than in the US or the UK, simply because the range extends much further at the end of low shareholder rights. Indeed, even in the early ‘90s some US shareholders were shocked to discover that they are completely powerless at their Dutch investee firms, with voting with their feet being their only option.
The substitution effect uncovered in this paper allows for the measurement of the monetary value of entrenchment provided by anti-shareholder mechanisms. Using an extensive set of control variables we find that the relationship between anti-shareholder devices and profits to insider purchases remains significant both statistically and economically. Based on our regression analysis, our conservative estimate for the lower bound of private benefits is approximately €14,000 for share purchases per year, per anti-shareholder mechanism. Based on

32
the number of insider purchases and anti-shareholder mechanisms at our sample firms, the average company’s insiders enjoy private benefits worth approximately €228,000. References Banerjee, A., Eckard, E.W., 2001. Why Regulate Insider Trading? Evidence from the First Great Merger
Wave (1897-1903). American Economic Review 91, 1329-1349. Barber, B., Lyon, J.D., 1997. Detecting long-run abnormal stock returns: The empirical power and
specification of test statistics. Journal of Financial Economics 43, 341-372. Barclay, M. J., Warner, J.B., 1993. Stealth trading and volatility: Which trades move prices? Journal of
Financial Economics 34, 281-305. Bartov, E., Mohanram, P., 2004. Private information, earnings manipulations, and executive stock option
exercises. Accounting Review 79, 889-920. Bebchuk, L.A., Fried, J.M., 2003. Executive Compensation as an Agency Problem. Journal of Economic
Perspectives 17, 71-92. Bertrand, M., Mullainathan, S., 2001. Are CEOs rewarded for luck? The ones without principals are.
Quarterly Journal of Economics 116, 901-932. Bettis, J.C., Bizjak, J.M., Lemmon, M.L., 2005. Exercise behavior, valuation and the incentive effects of
employee stock options. Journal of Financial Economics 76, 445–470. Bettis, J.C., Vickrey, D., Vickrey, D.W., 1997. Mimickers of corporate insiders who make large volume
trades. Financial Analysts Journal 53, 57-66. Bloomberg News, 2009. Video Game Maker to Pay $3 Million to Settle Options Backdating Case. The
New York Times, April 2. Betzer, A., Theissen, E., 2009. Insider Trading and Corporate Governance: The Case of Germany.
European Financial Management 15, 402–429. Bray, C., 2009. Ex-Monster President Found Guilty in Backdating case. Wall Street Journal, May 14. Brooks, R.E., Chance, D.M., Cline, B.N., 2007. Private information and the exercise of executive stock
options. Working paper, Louisiana State University. Carpenter, J.N., Remmers, B., 2001. Executive stock option exercises and inside information. Journal of
Business 74, 513-534. Chang, S., Suk, D., 1998. Stock prices and secondary dissemination of information: The Wall Street
Journal’s “Insider Spotlight” Column. Financial Review 33, 115-128. Cools, K., van Praag, C.M., 2007. The value relevance of top executive departures. Working paper 051/3,
Tinbergen Institute Cremers, K. J. M., Nair, V. B., 2005. Governance Mechanisms and Equity Prices. Journal of Finance 60,
2859–2894. Cuijpers, R., Moers, F., Peek, E., 2005. Firm-level reporting incentives and accounting properties:
Stakeholder- versus shareholder-oriented governance structures. Working paper, Maastricht University.
Davidson, R., MacKinnon, J.G., 2000. Bootstrap tests: How many bootstraps? Econometric Reviews 19, 55-68.
Degryse, H., De Jong F., Lefebvre, J., 2009. An Empirical Analysis of Legal Insider Trading in the Netherlands. Working paper, Tilburg University.
De Jong, A., DeJong D.V., Mertens G., Roosenboom, P., 2007. Investor relations, reputational bonding, and corporate governance: the case of Royal Ahold, Journal of Accounting and Public Policy 26, 328-375.
De Jong, A., DeJong, D.V., Mertens, G., Wasley, C.E., 2005. The role of self-regulation in corporate governance: Evidence and implications from the Netherlands, Journal of Corporate Finance 11, 473-503.

33
Eckbo, E., Smith, D., 1998. The conditional performance of insider trades, Journal of Finance 53, 467–98. Fama, E.F., 1991. Efficient capital markets: II. Journal of Finance 46, 1575-1617. Fidrmuc, J.P., Goergen, M., Renneboog, L., 2006. Insider trading, news releases and ownership
concentration, Journal of Finance 61, 2931-2973. Franks, J., Mayer, C., 2001. Ownership and control of German corporations. Review of Financial Studies
14, 943-977. Franks, J., Mayer, C., Renneboog, L., 2001. Who disciplines management in poorly performing
companies?, Journal of Financial Intermediation 10, 209–248. Friederich, S., Gregory, A., Matatko, J., Tonks, I., 2002. Short-run returns around the trades of corporate
insiders on the London Stock Exchange. European Financial Management 8, 7-30. Gompers, P., Ishii, J., Metrick, A., 2003. Corporate governance and equity prices. Quarterly Journal of
Economics 118, 107–155. Groenewald, E., 2005. Corporate Governance in the Netherlands: From the Verdam Report of 1964 to the
Tabaksblat Code of 2003, European Business Organization Law Review 6, 291-311. Heron, R.A., Lie, E., 2007. Does backdating explain the stock price pattern around executive stock option
grants? Journal of Financial Economics 83, 271–295. Holderness, C.G., Sheehan, D.P., 1988. The role of majority shareholders in publicly held corporations:
An exploratory analysis. Journal of Financial Economics 20, 317 - 346. Horowitz, J.L., 2001. The Bootstrap, in: J.J. Heckman and E.E. Leamer (Eds.), Handbook of
Econometrics, edition 1, volume 5, chapter 52, 3159-3228, Elsevier. Huddart, S., 1994. Employee stock options. Journal of Accounting and Economics 18, 207-231. Huddart, S., Lang, M., 1996. Employee stock option exercises: An empirical analysis. Journal of
Accounting and Economics 21, 5-41. Huddart, S., Lang, M., 2003. Information distribution within firms: evidence from stock option exercises.
Journal of Accounting and Economics 34, 3-31. Jaffe, J.F., 1974. Special information and insider trading, Journal of Business 47, 410-428. Jeng, L., Metrick, A., Zeckhauser, R., 2003. Estimating the returns to insider trading: A performance-
evaluation perspective. Review of Economics and Statistics 85, 453–471 Jenter, D., 2005. Market Timing and Managerial Portfolio Decisions. Journal of Finance 60, 1903-1949 Lakonishok, J., Lee, I., 2001. Are insiders’ trades informative? Review of Financial Studies 14, 79-112. Lie, E., 2005. On the timing of CEO stock option awards. Management Science 51, 802-812. Lin, J.C., Howe, J., 1990. Insider trading at the OTC Market. Journal of Finance 52, 1273-1284. Liu, C.H., Yermack, D., 2007. Where are the Shareholders' Mansions? CEOs' Home Purchases, Stock
Sales, and Subsequent Company Performance. Working paper, New York University Stern School of Business.
Lorie, J.H., Niederhoffer, V. 1968, Predictive and Statistical Properties of Insider Trading, Journal of Law and Economics 11, 35-51.
McCahery, J. A., Sautner, Z.. Starks, L. T., 2009. Behind the Scenes: The Corporate Governance Preferences of Institutional Investors. Working paper 235. European Corporate Governance Institute, Brussels, Belgium.
Narayanan, M.P., Schipani, C.A. Seyhun, H.N., 2007. The Economic Impact of Backdating Executive Stock Options. Michigan Law Review 105, 1597-1642.
OECD: Corporate governance: a survey of OECD countries. Paris, OECD Publications, 2004. OECD Steering Group on Corporate Governance, 2007. Lack of proportionality between ownership and
control: Overview and issues for discussion. OECD, Paris. Piotroski, J.D., Roulstone, D.T., 2005. Do insider trades reflect both contrarian beliefs and superior
knowledge about future cash flow realizations? Journal of Accounting and Economics 39, 55-81. Ravina, E., Sapienza, P., 2010, What Do Independent Directors Know? Evidence from Their Trading,
Review of Financial Studies 23, 962-1000. Renneboog, L., Szilagyi, P., 2007. How Relevant is Dividend Policy under Low Shareholder Protection?,
Working paper 128. European Corporate Governance Institute, Brussels, Belgium.

34
Roulstone, D.T., 2003. The Relation between insider-trading restrictions and executive compensation. Journal of Accounting Research 41, 525-551.
Rozanov, K., 2008, Corporate Governance and Insider Trading. Working paper. London Business School. Rozeff, M.S., Zaman, M.A., 1988. Market efficiency and insider trading: New evidence. Journal of
Business 61, 25-44. Rozeff, M.S., Zaman, M.A. 1998, Overreaction and insider trading: Evidence from growth and value
portfolios, Journal of Finance 53, 701–716. Seyhun, H.N., 1986, Insiders’ profits, cost of trading and market efficiency. Journal of Financial
Economics 16, 189-212. Seyhun, H.N.: Investment Intelligence from Insider Trading. Cambridge, MA: The MIT Press, 1998. Shleifer, A., Vishny, R.W., 1997. A Survey of Corporate Governance. Journal of Finance 52, 737–783 Yermack, D., 2006. Flights of Fancy: Corporate Jets, CEO Perquisites, and Inferior Shareholder Returns.
Journal of Financial Economics 80, 211-242.

35
Figure 1: Average number of anti-shareholder mechanisms employed by changers and non-changers in the purchase subsample This figure shows the number of anti-shareholder mechanisms at firms that were forced in 2004 to abandon some anti-shareholder mechanisms (“changers”) and at firms that were not (“non-changers”). The numbers shown are equally weighted averages. Data run from 1999 to 2007 and are based on our purchase subsample, so that a firm’s anti-shareholder index is considered in the average in a given year if a legal insider purchase took place at that firm in that year. The thick gray line represents the event of the regulatory change.

36
Table 1: Descriptive statistics Panel A reports statistics for the full sample. The sample is partitioned by exercise time (early, at expiration, on or after the vesting date). An early exercise is defined as an exercise with more than 30 days to expiration, when the exact expiration dates are known. When the exact dates are unknown and only the year of expiration (vesting) is available, an exercise at expiration is defined as any exercise that occurs in the year of expiration (vesting). Of the 1,392 exercises, 211 (226) do not report an exact expiration (vesting) date. In Panel A the word "transaction" refers to option exercises, insider sales and insider purchases. Mean value of options exercised is measured as the number of options exercised times the stock's closing price on the exercise date. Transaction values are quoted in Euros. Panel B reports statistics for the sample partitioned by transaction year and type of insider. The 4 categories of insiders are CEOs, executive board members excluding the CEO, supervisory board and other insiders. Other insiders include large shareholders, the management board and supervisory board of companies in which the company has an interest of at least 10%, partners and first degree relatives of CEOs, executive board members and supervisory board members that live in the same household, first degree relatives of CEOs, executive board members and supervisory board members that do not live in the same household, but have an equity stake of at least 5% in the company and members of the works council. Data are from the period 1999-2007.
Panel A: Summary Statistics for the full sample of insider sales, purchases and option exercises
Number of Number of Number of Transaction value Mean (median) % of stocks sold
Mean (median) years prior to expiration exercises firms insiders mean median
Option exercises 1,392 79 733 169,358 47,120 86.45 100 2.17 1.83 Exercised on vesting date 228 35 156 196,276 100,561 87.91 100 3.88 3.75 Exercised before expiration and after vesting date 725 59 448 175,320 47,412 90.74 100 2.22 1.83 Exercised at expiration 220 27 143 110,609 24,547 84.55 100 - - Insider purchases 663 90 339 595,437 20,113 Insider sales 739 86 349 438,618 63,000

37
Table 1 - continued Panel B: Summary Statistics by calendar years and insider type
Number of Number of Number of Value of purchases Value of sales Value of options
exercised Option exercises
purchases sales option exercises mean median mean median mean median % of stocks sold Years prior to
expiration
mean median mean median Full Sample 663 739 1,392 595,437 20,113 438,618 63,000 169,358 47,120 86.45 100 2.17 1.83 1999 69 83 109 386,835 59,000 358,050 57,532 109,925 37,800 79.29 100 2.11 2.33 2000 132 122 248 465,159 25,003 711,075 80,300 325,483 68,666 88.03 100 2.25 2.08 2001 122 96 211 459,078 17,370 436,635 64,500 145,242 28,680 87.96 100 1.53 1.00 2002 89 88 99 278,754 19,891 693,811 90,502 145,860 38,540 80.42 100 0.86 0.75 2003 43 53 62 217,329 11,291 257,411 52,200 211,797 24,031 72.58 100 0.91 0 2004 60 77 106 2,810,560 22,175 91,900 40,250 74,449 24,062 87.86 100 2.18 1.17 2005 41 76 158 666,459 13,500 198,521 44,007 73,034 31,231 86.69 100 2.51 1.75 2006 82 81 312 243,000 17,323 394,492 156,340 151,434 83,240 89.09 100 2.71 2.00 2007 25 63 87 13,824 6,375 583,291 48,430 205,780 120,557 93.00 100 2.58 1.25 CEOs 115 70 44 588,270 54,462 1,017,132 122,723 385,704 64,501 82.03 100 1.32 0.42
Executive Board members
98 88 148 358,442 44,482 517,752 104,175 304,027 64,956 78.54 100 1.70 1.25
Supervisory Board members
113 61 26 519,845 16,732 756,096 269,300 462,570 137,230 84.62 100 2.02 1.46
Other insiders
337 520 1,174 692,148 13,954 310,106 53,768 135,663 44,487 87.64 100 2.25 1.83

38
Table 2: Descriptive statistics and correlations for anti-shareholder mechanisms
Number of purchases Number of sales Number of option
exercises
None 99 92 83 Structured regime only 96 114 36 Preference shares only 79 145 353 Priority shares only 16 7 34 Depositary receipts only 1 0 13 Structured regime and preference shares 122 75 321 Structured regime and priority shares 17 6 1 Structured regime and depositary receipts 4 0 3 Preference shares and priority shares 22 46 68 Preference shares and depositary receipts 30 49 208 Priority shares and depositary receipts 24 1 0 Three anti-shareholder mechanisms 153 204 272
Correlation matrix - purchases
Structured regime Preference shares Priority shares Depositary receipts Structured regime 1 . . .
Priority shares 0.0950 1 . . Preference shares 0.2242 0.1304 1 .
Depositary receipts 0.0116 0.2127 -0.2160 1
Correlation matrix - sales
Structured regime Preference shares Priority shares Depositary receipts Structured regime 1 . . .
Priority shares -0.0386 1 . . Preference shares 0.1913 0.3109 1 .
Depositary receipts 0.1391 0.2866 -0.1364 1
Correlation matrix - option exercises
Structured regime Preference shares Priority shares Depositary receipts Structured regime 1 . . .
Priority shares 0.1644 1 . . Preference shares 0.089 -0.0416 1 .
Depositary receipts -0.0629 0.145 -0.267 1
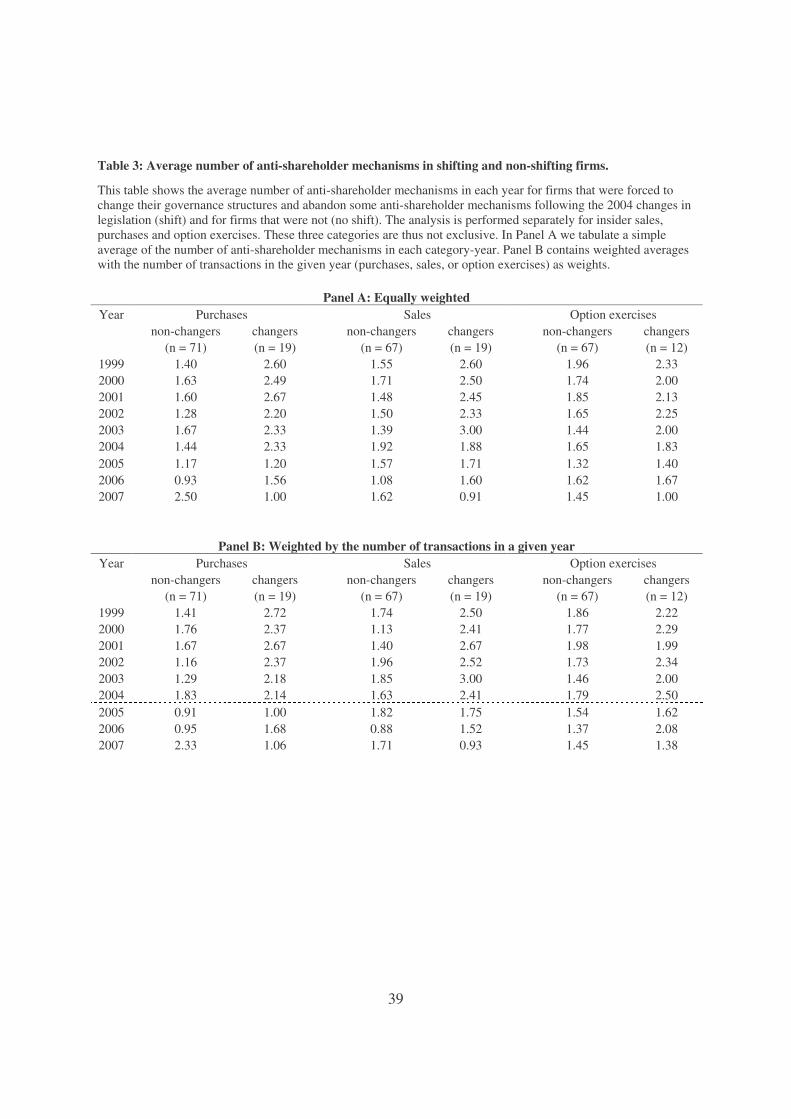
39
Table 3: Average number of anti-shareholder mechanisms in shifting and non-shifting firms.
This table shows the average number of anti-shareholder mechanisms in each year for firms that were forced to change their governance structures and abandon some anti-shareholder mechanisms following the 2004 changes in legislation (shift) and for firms that were not (no shift). The analysis is performed separately for insider sales, purchases and option exercises. These three categories are thus not exclusive. In Panel A we tabulate a simple average of the number of anti-shareholder mechanisms in each category-year. Panel B contains weighted averages with the number of transactions in the given year (purchases, sales, or option exercises) as weights.
Panel A: Equally weighted Year Purchases Sales Option exercises
non-changers changers non-changers changers non-changers changers (n = 71) (n = 19) (n = 67) (n = 19) (n = 67) (n = 12)
1999 1.40 2.60 1.55 2.60 1.96 2.33 2000 1.63 2.49 1.71 2.50 1.74 2.00 2001 1.60 2.67 1.48 2.45 1.85 2.13 2002 1.28 2.20 1.50 2.33 1.65 2.25 2003 1.67 2.33 1.39 3.00 1.44 2.00 2004 1.44 2.33 1.92 1.88 1.65 1.83 2005 1.17 1.20 1.57 1.71 1.32 1.40 2006 0.93 1.56 1.08 1.60 1.62 1.67 2007 2.50 1.00 1.62 0.91 1.45 1.00
Panel B: Weighted by the number of transactions in a given year Year Purchases Sales Option exercises
non-changers changers non-changers changers non-changers changers (n = 71) (n = 19) (n = 67) (n = 19) (n = 67) (n = 12)
1999 1.41 2.72 1.74 2.50 1.86 2.22 2000 1.76 2.37 1.13 2.41 1.77 2.29 2001 1.67 2.67 1.40 2.67 1.98 1.99 2002 1.16 2.37 1.96 2.52 1.73 2.34 2003 1.29 2.18 1.85 3.00 1.46 2.00 2004 1.83 2.14 1.63 2.41 1.79 2.50 2005 0.91 1.00 1.82 1.75 1.54 1.62 2006 0.95 1.68 0.88 1.52 1.37 2.08 2007 2.33 1.06 1.71 0.93 1.45 1.38

40
Table 4: Abnormal returns and cumulative abnormal returns around insider purchases and sales This table reports the average abnormal returns around insider purchases, insider sales and option exercises for the full sample of insider purchases and sales reported to the AFM between April 1999 and April 2007. Abnormal returns are estimated with the CAPM, using the Amsterdam Exchanges All-Share Index as market index. Panel A shows the daily average abnormal returns from day 0 (the day of the trade) to day 10. Panel B reports the cumulative average abnormal returns for 6 windows around the event date. Day 5 is assumed to be the announcement date and CAR [0,1] covers both the transaction date and the subsequent trading day. Bootstrapped t-statistics are calculated based on 3,000 resamplings. ***, **, * represent two-tailed significance at the 1%, 5% and 10% level, respectively. Data are from the period 1999-2007. PURCHASES n=663 SALES n=739 OPTION EXERCISES n=1,392
Panel A: Abnormal returns
Event window Mean % t-statistic
bootstrapped t significance
Event window Mean % t-statistic
bootstrapped t significance
Event window Mean % t-statistic
bootstrapped t significance
0 0.19 1.04 0 0.55 3.04*** 0 0.25 3.73*** 1 0.40 2.92*** 1 0.21 1.86* 1 -0.18 -3.05*** 2 0.41 3.43*** 2 -0.09 -0.91 2 0.04 0.74 3 -0.04 -0.12 3 0.01 0.12 3 0.05 0.85 4 -0.08 -0.62 4 0.12 1.15 4 0.05 0.89 5 0.07 0.60 5 0.10 1.10 5 -0.01 -0.11 6 0.19 1.47 6 -0.12 -1.12 6 0 0.04 7 -0.09 -0.15 7 -0.08 -0.76 7 -0.12 -1.96** 8 -0.15 -1.29 8 0.11 1.06 8 -0.06 -0.98 9 0.14 1.19 9 -0.15 -1.66* 9 0.1 1.64
10 -0.01 -0.08 10 -0.10 -1.33 10 0.02 0.39
Panel B: Cumulative Average Abnormal Returns [-40,-1] -4.55 -5.33*** *** [-40,-1] 5.53 7.08*** *** [-40,-1] 8.34 20.36*** ***
[0,1] 0.52 2.59*** *** [0,1] 0.66 2.74*** *** [0,1] 0.06 0.73 [0,5] 0.87 3.05*** *** [0,5] 0.81 2.82*** *** [0,5] 0.2 1.37 *
[0,40] 3.46 5.47*** *** [0,40] -0.44 -0.63 [0,40] 1.17 3.01*** *** [5,8] 0.16 0.72 [5,8] 0.02 0.13 [5,8] -0.18 -1.4 *
[5,40] 2.67 4.48*** *** [5,40] -1.14 -1.84* ** [5,40] 0.96 2.79*** ***

41
Table 5: Cumulative abnormal returns around insider transactions partitioned by anti-shareholder mechanisms in place This table reports cumulative average abnormal returns around insider transactions partitioned according to anti-shareholder mechanisms in place at the firm. Panel A shows results for share purchases, panel B for share sales and panel C for option exercises. Abnormal returns are estimated with the CAPM, using the Amsterdam Exchanges All-Share Index as market index. Note that firms may not employ preference shares, priority shares and depository receipts at the same time, a maximum two of the three are allowed. Day 5 is assumed to be the announcement date. Bootstrapped t-statistics are calculated based on 3,000 resamplings. ***, **, * represent two-tailed significance at the 1%, 5% and 10% level, respectively. Data are from the period 1999-2007.
Panel A: Share purchases Event CAAR % t-statistic bootstrapped CAAR % t-statistic bootstrapped t-statistic bootstrapped Wilcoxon
window t-statistic t-statistic difference t-statistic Z-statistic difference difference
Preference shares (n=410) No preference shares (n=253) Difference [-40,-1] -4.94 -4.31*** *** -6.00 -3.20*** *** -0.48 0.59
[0,1] 0.68 2.63*** *** 1.43 2.78*** *** 1.30 * -0.30 [0,5] 1.17 3.03*** *** 1.52 2.71*** *** 0.51 0.07
[0,40] 4.93 5.40*** *** 2.67 2.44** *** -1.59 * -1.53 [5,8] 0.37 1.17 -0.33 -0.79 -1.34 * -0.61
[5,40] 3.95 4.54*** *** 1.02 1.09 -2.28** ** -1.69* Priority shares (n=194) No priority shares (n=469) Difference [-40,-1] 0.14 0.09 . -7.70 -6.23*** *** -4.07*** *** -2.45**
[0,1] 1.31 3.58*** *** 0.69 2.31** ** -1.31 * -2.03** [0,5] 1.41 2.56** *** 1.20 3.06*** *** -0.31 0.10
[0,40] 2.75 2.60** *** 5.04 5.32*** *** 1.61 * 1.12 [5,8] -0.16 -0.39 0.34 1.05 0.95 1.36
[5,40] 1.22 1.16 4.04 4.64*** *** 2.05** ** 2.08**
Structured regime (n=396) No structured regime (n=267) Difference [-40,-1] -2.54 -2.81*** *** -10.40 -4.67*** *** -3.27*** *** -2.00**
[0,1] 0.76 3.28*** *** 1.12 2.15** ** 0.64 -0.50 [0,5] 1.04 3.10*** *** 1.71 2.52** *** 0.89 0.61
[0,40] 2.77 3.70*** *** 7.28 4.69*** *** 2.61*** *** 2.03** [5,8] 0.16 0.56 0.23 0.44 0.12 -0.17
[5,40] 2.03 2.78*** *** 5.31 3.74*** *** 2.06** ** 1.50
Depository receipts (n=105) No depository receipts (n=558) Difference [-40,-1] -5.79 -2.98*** *** -4.38 -4.70*** *** 0.58 0.75
[0,1] -0.54 -0.93 0.67 3.07*** *** 2.01** ** 1.00 [0,5] 0.43 0.61 0.93 3.02*** *** 0.47 0.20
[0,40] 2.48 1.68 * 3.59 5.20*** *** 0.63 -0.20 [5,8] 1.40 2.91*** *** -0.01 -0.03 -2.60*** *** -2.77
[5,40] 2.99 1.93* * 2.63 4.08*** *** -0.21 -1.04
Three anti-shareholder
mechanisms (n=157) No anti-shareholder mechanisms (n=95) Difference
[-40,-1] -0.98 -0.62 -5.14 -2.66*** *** -1.66* * -0.69 [0,1] 1.05 2.69*** *** 0.27 0.58 -1.28 -3.69*** [0,5] 1.31 2.21** ** 0.35 0.57 -1.11 -2.05**
[0,40] 3.19 2.76*** *** 1.47 1.27 * -1.05 -1.27 [5,8] -0.18 -0.49 -0.03 -0.09 0.27 0.01
[5,40] 2.09 1.76* ** 1.07 1.02 . -0.64 0.10

42
Table 5 - continued Panel B: Share sales
Event CAAR % t-statistic bootstrapped CAAR % t-statistic bootstrapped t-statistic bootstrapped Wilcoxon window t-statistic t-statistic difference t-statistic Z-statistic
difference difference Preference shares (n=519) No preference shares (n=220) Difference [-40,-1] 3.65 5.01*** *** 11.75 4.45*** *** 2.96*** 1.14
[0,1] 0.45 2.60*** *** 0.43 0.82 -0.04 -0.59 [0,5] 0.87 3.56*** *** -0.10 -0.14 -1.34 *** -2.73***
[0,40] 1.12 1.47 * -4.43 -2.31** ** -2.69*** *** -5.97*** [5,8] 0.06 0.28 0.40 0.87 0.66 -1.20
[5,40] 0.36 0.52 -4.06 -2.30** ** -2.33** *** -5.29*** Priority shares (n=194) No priority shares (n=545) Difference [-40,-1] 1.31 1.27 * 7.52 6.59*** *** 4.02*** *** 4.04***
[0,1] 0.38 1.83* ** 0.47 1.91* * 0.28 -0.02 [0,5] 1.30 4.33*** *** 0.34 1.04 -2.13** ** -2.41**
[0,40] 1.92 2.35** ** -1.19 -1.18 -2.40** ** -2.43** [5,8] 0.52 1.94* * -0.01 -0.03 -1.38 * -1.94*
[5,40] 0.85 1.07 -1.41 -1.53 * -1.86* ** -2.05**
Structured regime (n=399) No structured regime (n=340) Difference [-40,-1] 4.27 4.31*** *** 7.67 4.95*** *** 1.85* 0.68
[0,1] 0.38 1.75* ** 0.54 1.68* ** 0.40 -0.64 [0,5] 0.91 3.16*** *** 0.22 0.50 -1.30 ** -2.31**
[0,40] 0.57 0.76 -1.45 -0.99 -1.22 *** -2.69*** [5,8] 0.70 3.15*** *** -0.64 -1.65* ** -3.00*** *** -3.33***
[5,40] -0.11 -0.15 -1.63 -1.25 -1.02 ** -2.21**
Depository receipts (n=142) No depository receipts (n=597) Difference [-40,-1] 4.16 3.56*** *** 5.80 6.29*** *** 1.24 -1.22
[0,1] 0.76 3.18*** *** 0.63 2.15** *** -0.64 -1.54 [0,5] 1.89 4.83*** *** 0.56 1.66* ** -2.71*** *** -3.51***
[0,40] 3.97 4.30*** *** -0.14 -1.71* ** -4.43*** *** -5.33*** [5,8] 0.73 2.62*** *** -0.13 -0.56 -2.30** ** -2.55**
[5,40] 2.16 2.44** *** -0.19 -2.55** *** -3.50*** *** -4.04***
Three anti-shareholder mechanisms (n=157)
No anti-shareholder mechanisms (n=95) Difference
[-40,-1] 2.83 3.84*** *** 10.91 5.32*** *** 3.70*** *** 1.80* [0,1] 0.70 3.35*** *** 1.86 2.01** ** 1.22 -0.16 [0,5] 1.87 6.21*** *** 1.51 1.48 -0.34 -2.85***
[0,40] 3.97 4.76*** *** -0.30 -0.15 -1.94* * -5.40*** [5,8] 1.05 4.60*** *** -0.28 -0.69 -2.85*** *** -4.15***
[5,40] 2.33 3.01*** *** -1.87 -1.18 -2.38** ** -4.95***

43
Table 5 - continued Panel C: Option exercises
Event CAAR % t-statistic bootstrapped CAAR % t-statistic bootstrapped t-statistic bootstrapped Wilcoxon window t-statistic t-statistic difference t-statistic Z-statistic
difference difference
Preference shares (n=1222) No preference shares (n=170) Difference [-40, -1] 7.22 20.01*** *** 16.46 8.11*** *** -4.48*** *** -3.74***
[0,1] -0.05 -0.52 0.85 2.38** ** -2.43** ** -2.61*** [0,5] 0.00 0.01 1.64 2.83*** *** -2.74*** *** -2.73***
[0,40] 0.70 2.26** ** 4.51 2.01** ** -1.68* -0.99 [5,8] -0.27 -1.89* * 0.41 1.19 -1.82* * -1.69*
[5,40] 0.65 2.35** ** 3.16 1.59 -1.25 0.01
Priority shares (n=229) No priority shares (n=1163) Difference [-40, -1] 4.93 9.36*** *** 9.02 19.07*** *** -5.25*** *** -3.01***
[0,1] 0.25 1.49 0.03 0.27 1.14 0.93 [0,5] 0.59 2.04** ** 0.13 0.76 1.38 0.30
[0,40] 0.86 1.37 1.23 2.75*** *** -0.48 -0.13 [5,8] 0.40 1.79* * -0.30 -1.98** ** 2.60*** ** 1.54
[5,40] 0.37 0.59 1.08 2.73*** *** -0.97 -0.65
Structured regime (n=633) No structured regime (n=759) Difference [-40, -1] 6.70 13.79*** *** 9.72 15.44*** *** -3.80*** *** -3.38***
[0,1] 0.13 1.28 0.01 0.08 0.69 0.76 [0,5] 0.27 1.76* * 0.15 0.62 0.41 0.50
[0,40] 1.61 4.08*** *** 0.81 1.28 1.07 3.41*** [5,8] 0.03 0.23 -0.36 -1.68* 1.56 0.62
[5,40] 1.32 3.59*** *** 0.66 1.19 1.00 3.59***
Depository receipts (n=370) No depository receipts (n=1022) Difference [-40, -1] 7.99 15.01*** *** 8.47 16.17*** *** -0.64 1.02
[0,1] 0.33 2.31** ** -0.03 -0.30 2.03** ** 1.46 [0,5] 0.78 3.67*** *** -0.01 -0.03 2.77*** *** 2.78***
[0,40] 0.40 0.79 1.45 2.92*** *** -1.49 -1.61 [5,8] -0.11 -0.70 -0.21 -1.25 0.44 0.32
[5,40] -0.49 -1.03 1.48 3.41*** *** -3.06*** *** -3.47***
Three anti-shareholder mechanisms (n=272)
No anti-shareholder mechanisms (n=83) Difference
[-40, -1] 6.09 9.63*** *** 26.07 7.04*** *** -5.31*** *** -5.54*** [0,1] 0.34 2.33** ** 1.18 1.74* * -1.21 -1.24 [0,5] 0.41 1.86* * 3.05 2.78*** ** -2.35** ** -2.97***
[0,40] 2.03 3.46*** *** 10.28 2.35** ** -1.87* * -1.90* [5,8] -0.06 -0.31 0.15 0.24 -0.32 0.14
[5,40] 1.48 2.84*** *** 7.77 2.04** ** -1.63 -0.71

44
Table 6: Cross-sectional determinants of abnormal return patterns following insider purchases Type of insider dummies are binary variables that equal one if the insider performs a function of the corresponding type at the time of the transaction. CEOs are excluded from the category Executive Board. The base category is other insiders. Other insiders include large shareholders, the management board and supervisory board of companies in which the company has an interest of at least 10%, partners and first degree relatives of CEOs, executive board members and supervisory board members that live in the same household, first-degree relatives of CEOs, executive board members and supervisory board members that do not live in the same household, but have an equity stake of at least 5% in the company and members of the workers' council. ROE and leverage are the return on equity and debt-to-equity ratio at the end of the year, respectively. Ownership dummies (directors, financial institutions, families or individuals, industrial or commercial companies and government) are set to one if shareholders belonging to the corresponding category have the largest stake as compared to the other categories. The base case is no blockholder of 5% or more. The economic trend dummies of economic growth and economic decline: the base category is the period from March 12 2003 until the end of the sample period in 2007. T-statistics are calculated based on Huber-White standard errors clustered at the firm level. ***, **, * represent two-tailed significance at the 1%, 5% and 10% level, respectively. Data are from the period 1999-2007.
Dependent variable: CAR[0,40]*100 OLS OLS with firm FE DD OLS DD
Coefficient t-statistic Coefficient t-statistic Coefficient t-statistic Coefficient t-statistic Coefficient t-statistic
Constant 4.72*** 3.92 7.14*** 4.20 0.06 0.05 -6.50 -0.85 -15.61** -2.02 Anti-shareholder mechanisms in place
Anti-shareholder index -0.76 -1.30 -2.21** -2.18 0.80 1.37 -2.39*** -3.24 -1.05 -1.08 Corporate governance regime
Until 2004 7.20*** 3.60 8.60*** 4.01 Until 2004 * anti-shareholder index -2.50*** -2.61 -2.47*** -2.09
Type of Insider CEO 1.39 0.77 0.70 0.40 Executive board -0.57 -0.29 -1.42 -0.76 Supervisory board -2.85* -1.77 -3.30** -2.05
Largest stake in the company Directors -2.98 -0.94 -1.36 -0.41 Financial companies 3.28 1.19 5.32* 1.82 Families or individuals -0.68 -0.22 0.50 0.16 Ind./Com. Companies 16.08*** 3.73 17.45*** 4.07 Government 13.91*** 3.75 15.93*** 4.34
Accounting data Firm size (ln market cap) 0.49 1.62 0.64** 2.21 ROE -0.06*** -2.64 -0.06*** -2.78 Leverage 1.55 0.80 1.45 0.73 Firm age (in 1999) 0.01 1.29 0.01 1.32
Economic trend Growth 1-4-99 to 4-9-00 1.24 0.75
Decline 5-9-00 to 12-03-03 1.32 0.75
Number of observations 663 663 663 663 663 Adjusted R2 0.23% 30.36% 1.08% 11.02% 12.85%

45
Table 7: Cross-sectional determinants of abnormal return patterns following insider sales Type of insider dummies are binary variables that equal one if the insider performs a function of the corresponding type at the time of the transaction. CEOs are excluded from the category Executive Board. The base category is other insiders. Other insiders include large shareholders, the management board and supervisory board of companies in which the company has an interest of at least 10%, partners and first degree relatives of CEOs, executive board members and supervisory board members that live in the same household, first degree relatives of CEOs, executive board members and supervisory board members that do not live in the same household, but have an equity stake of at least 5% in the company and members of the workers' council. ROE and leverage are the return on equity and debt-to-equity ratio at the end of the year, respectively. Ownership dummies (directors, financial institutions, families or individuals, industrial or commercial companies and government) are set to one if shareholders belonging to the corresponding category have the largest stake as compared to the other categories. The base case is no blockholder of 5% or more. The economic trend dummies of economic growth and economic decline: the base category is the period from March 12 2003 until the end of the sample period in 2007. T-statistics are calculated based on Huber-White standard errors clustered at the firm level. ***, **, * represent two-tailed significance at the 1%, 5% and 10% level, respectively. Data are from the period 1999-2007.
Dependent variable: CAR[0,40]*100
OLS OLS with firm FE DD OLS DD Coefficient t-statistic Coefficient t-statistic Coefficient t-statistic Coefficient t-statistic Coefficient t-statistic
Constant -4.20** -2.36 -5.22** -2.15 -1.88 -1.53 -19.27* -1.74 -21.96* -1.85 Anti-shareholder mechanisms in place
Anti-shareholder index 2.22*** 2.97 2.81*** 2.10 1.65** 2.33 1.82** 2.33 0.82 1.06 Corporate governance regime
Until 2004 -3.53 -1.26 -0.95 -0.30 Until 2004 * anti-shareholder index 0.87 0.72 0.86 0.69
Type of Insider CEO -8.12** -2.27 -8.10** -2.36 Executive board -0.47 -0.22 -1.12 -0.61 Supervisory board -2.59 -1.04 -3.70 -1.57
Largest stake in the company Directors -4.01 -1.11 -3.03 -0.81 Financial companies 0.42 0.12 1.29 0.35 Families or individuals 1.75 0.25 3.24 0.43 Ind./Com. Companies 1.22 0.18 2.51 0.37 Government -9.61 -1.07 -9.34 -1.02
Accounting data Firm size (ln market cap) 0.92** 2.05 1.05** 2.25 ROE -0.004 -0.18 -0.001 -0.08 Leverage 2.48 1.35 2.73 1.36 Firm age (in 1999) -0.004 -0.40 -0.004 -0.37
Economic trend Growth 1-4-99 to 4-9-00 0.84 0.31
Decline 5-9-00 to 12-03-03 -2.47 -1.35
Number of observations 739 739 739 739 739 Adjusted R2 1.41% 16.81% 1.45% 5.78% 5.41%

46
Table 8: Cross-sectional determinants of abnormal return patterns following insider option exercises Type of insider dummies are binary variables that equal one if the insider performs a function of the corresponding type at the time of exercise. CEOs are excluded from the category Executive Board. The base category is other insiders. Other insiders include large shareholders, the management board and supervisory board of companies in which the company has an interest of at least 10%, partners and first degree relatives of CEOs, executive board members and supervisory board members that live in the same household, first degree relatives of CEOs, executive board members and supervisory board members that do not live in the same household, but have an equity stake of at least 5% in the company and members of the workers' council. ROE and leverage are the return on equity and debt-to-equity ratio at the end of the year, respectively. Ownership dummies (directors, financial institutions, families or individuals, industrial or commercial companies and government) are set to one if shareholders belonging to the corresponding category have the largest stake as compared to the other categories. The base case is no blockholder of 5% or more. The economic trend dummies of economic growth and economic decline: the base category is the period from March 12 2003 until the end of the sample period in 2007. T-statistics are calculated based on Huber-White standard errors clustered at the firm level. ***, **, * represent two-tailed significance at the 1%, 5% and 10% level, respectively. Data are from the period 1999-2007.
Dependent variable: CAR[0,40]*100
OLS OLS with firm FE DD OLS DD Coefficient t-statistic Coefficient t-statistic Coefficient t-statistic Coefficient t-statistic Coefficient t-statistic
Constant 3.27 2.20** -4.19 -0.64 -4.20 -2.47** 14.35 1.61 6.44 0.81 Anti-shareholder mechanisms in place
Anti-shareholder index -1.28 -1.72* 3.27 0.81 3.29 3.66*** -0.20 -0.20 1.55 2.04** Corporate governance regime
Until 2004 10.70 3.57*** 6.11 1.65 Until 2004 * anti-shareholder index -5.99 -4.27*** -3.56 -2.11**
Type of Insider CEO -1.82 -0.53 -2.24 -0.63 Executive board -2.22 -1.05 -2.58 -1.25 Supervisory board -3.88 -1.17 -5.67 -1.85*
Largest stake in the company Directors -6.48 -2.12* -6.17 -1.99** Financial companies -8.89 -3.15*** -7.99 -2.80*** Families or individuals -10.84 -1.84* -10.32 -1.68* Ind./Com. Companies 0.03 0.01 -0.76 -0.12 Government -12.83 -2.78*** -12.48 -2.77***

47
Table 8: Cross-sectional determinants of abnormal return patterns following insider option exercises - continued Coefficient t-statistic Coefficient t-statistic Coefficient t-statistic Coefficient t-statistic Coefficient t-statistic
Accounting data Firm size (ln market cap) 0.03 0.09 0.27 0.86 ROE -0.15 -5.48*** -0.15 -5.33*** Leverage -0.04 -0.73 -0.04 -0.86 Firm age (in 1999) -0.01 -0.84 -0.02 -2.62***
Economic trend Growth 1-4-99 to 4-9-00 4.32 2.32** Decline 5-9-00 to 12-03-03 -3.83 -2.29**
Exercise characteristics Exercise at vesting 1.44 1.49 2.45 2.68*** Exercise at expiration 1.06 0.84 0.66 0.51 Full sale of acquired shares 0.70 0.39 0.66 0.36
Number of observations 1392 1392 1392 1392 1392 Adjusted R2 0.43% 25.59% 2.46% 10.70% 8.71%