Peter Brownsort (SCCS) - Overview of CO2 Shipping Studies Worldwide, Plus Brief Focus on Potential...
29
Scottish Carbon Capture & Storage www.sccs.org.uk Ship transport of CO 2 An Overview Pete Brownsort UKCCSRC Biannual Meeting, Cranfield University, 22nd April 2015
-
Upload
uk-carbon-capture-and-storage-research-centre -
Category
Engineering
-
view
103 -
download
0
Transcript of Peter Brownsort (SCCS) - Overview of CO2 Shipping Studies Worldwide, Plus Brief Focus on Potential...

Scottish Carbon Capture & Storage
www.sccs.org.uk
Ship transport of CO2 An Overview
Pete Brownsort
UKCCSRC Biannual Meeting, Cranfield University, 22nd April 2015

Talk outline
• Introduction – literature survey • Existing CO2 shipping experience • Process technology • Regulation and HSE aspects • Financial factors, cost comparisons
2

CO2 shipping literature survey
• SCCS Joint Industry Project on CO2-EOR commissioned literature survey, 2014 – Extent and scope of
literature on transport of CO2 by ship
– Key findings for EOR
3
http://www.sccs.org.uk/images/expertise/reports/co2-eor-jip/SCCS-CO2-EOR-JIP-WP15-Shipping.pdf

Introduction – literature survey
• Around 60 references found (more since)
• Europe > Asia • Conference > Journal >
Report
4

Literature survey – some key references
• MITSUBISHI HEAVY INDUSTRIES LTD. (2004). Ship Transport of CO2. Cheltenham, IEA-GHG. Report number: PH4/30.
• ASPELUND, A., MØLNVIK, M. J. & DE KOEIJER G. (2006). Ship Transport of CO2. Chemical Engineering Research and Design. 84(9): 847-855.
• ASPELUND, A. (2010). Gas purification, compression and liquefaction processes and technology for carbon dioxide (CO2) transport. In: Maroto-Valer, M. M. (Ed) Developments and innovation in CCS technology, Cambridge, Woodhead Publishing Ltd. pp. 383-407.
• VERMEULEN, T. N. (2011). Overall Supply Chain Optimization. CO2 Liquid Logistics Shipping Concept. Tebodin Netherlands BV, Vopak, Anthony Veder and GCCSI. Report number: 3112001.
• ZEP (2011). The Costs of CO2 Transport. Brussels, European Technology Platform for Zero Emission Fossil Fuel Power Plants.
5

Literature survey – key findings
• Ship transport of CO2 feasible using known technologies, related to LPG
• Established on small scale • Can be cost competitive • Some advantages over pipeline transport • Focus of studies for CCS, not EOR • Some knowledge gaps
6

Existing experience of CO2 shipping • EU market for bulk CO2 c.3 Mt/yr,
transported by truck, train, ship.
• Yara International trades CO2 from Nor and NL through 7 import and distribution terminals around western European coasts
7 Images: Larvik; Yara; Anthony Vader; IM Skaugen
• Larvik shipping – Yara I, II, III – 900-1200 t
• Yara Embla, Yara Froya – 1800 t • Anthony Vader – 1250 m3 dual
purpose LPG/CO2 • IM Skaugen – six 10,000 m3 dual
purpose LPG/CO2

Experience of CO2 shipping vs. LPG, LNG
CO2 LPG LNG Number of ships ≤ 12 ≥600 (?) ≥ 350 Capacity Most ≤ 1800t,
up to 10,000 m3 Up to 80,000 m3 Up to 266,000 m3
Type Semi-pressurised/refrigerated
Pressurised, Semi-pressurised/refrigerated, or Refrigerated
Refrigerated, atmospheric pressure
Typical conditions -30°C, 20 bara (existing fleet)
Varied: to -55°C, 20 bara
-161°C, 1 bara
Loading/unloading In port In port, offshore In port, offshore
8

Process technology
• Shipping of CO2 as liquid near triple point generally proposed – 6.5 bara, -52°C – Other liquid conditions sometimes proposed – Transport as compressed gas also considered
• Technology can be adapted from LPG • Process blocks:
9
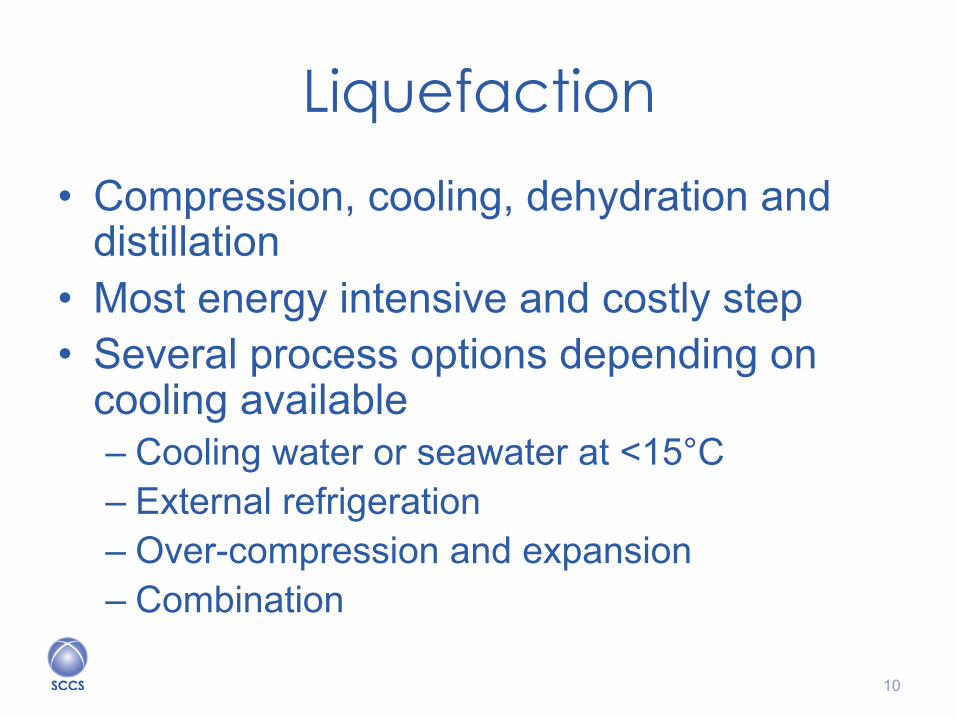
Liquefaction
• Compression, cooling, dehydration and distillation
• Most energy intensive and costly step • Several process options depending on
cooling available – Cooling water or seawater at <15°C – External refrigeration – Over-compression and expansion – Combination
10

Liquefaction
11
Compression, inter-stage cooling and condensation
Dehydration
Seawater cooling
Volatile Distillation
Expansion for final conditioning
Source: Aspelund, 2010
Option using seawater cooling favored in NW Europe
T P

Shore storage
• Liquefaction is continuous, shipping is batch ! buffer storage needed before loading – Cylinders or spheres – Onshore or on barge in port
• Shore storage volume, 1.0 to 1.5 x ship volume
12
Images: Yara; Liaoning Refine Technology Group

Ship loading • Quayside loading
– Flexible cryogenic hoses
– Cryogenic marine loading arms
13 Images: mann-tek; KLAW, Center for LNG

Ship designs
• Covered by International Code for the Construction and Equipment of Ships Carrying Liquefied Gases in Bulk (“IGC Code”)
• Proposed designs based on LPG carrier experience
• Typically several horizontal cylindrical cargo tanks giving 20,000 – 40,000 m3
• Alternatives – bi-lobe tanks, spherical tanks, vertical cylindrical tanks
14

Ship designs
15 Images: Vermeulen (2010), Yoo et al (2013), allaboutshipping.co.uk

Ship equipment
• Dynamic positioning system (DPS) – To maintain position during offshore offloading
• Process equipment – To recondition CO2 to T and P required for
offloading, and/or for well injection • Pumping to 50 to 400 bar • Warming to -15 to +20°; seawater, waste heat or fuelled
system – Conditions needed specific to each case and
depend on several factors • Offloading system design • Platform capabilities and well design • Reservoir conditions
16

Ship-board process equipment Example (Vermuelen, 2011) • Cargo lift pumps • LP pumps (45 barg)
avoids vaporisation on warming
• Seawater-warmed shell and tube heat exchanger
• HP pumps to injection pressure (154-400 barg)
17
Alternatives and additional equipment • Mid-pressure pump to make transfer to platform, HP pump on platform • Waste heat or fuelled ancillary heater • CO2 vaporiser for tank pressure equalisation • Dry air plant

Offshore offloading
• Perhaps least well defined aspect • Lots of options based on hydrocarbon
transfers but will need adapting for CO2 • Choice of single point offloading system
depends on – CO2 conditions – liquid or SC fluid, T and P – Flexible hose suitability – for environment and
CO2 conditions/properties – Location – sea conditions, water depth – Ship design – processing equipment, DPS
18

Offshore offloading
Examples of general arrangements • Submerged
offloading system (Omata, 2011)
• Single point mooring and platform (Vermeulen, 2011)
• Many alternative options for single point moorings
19
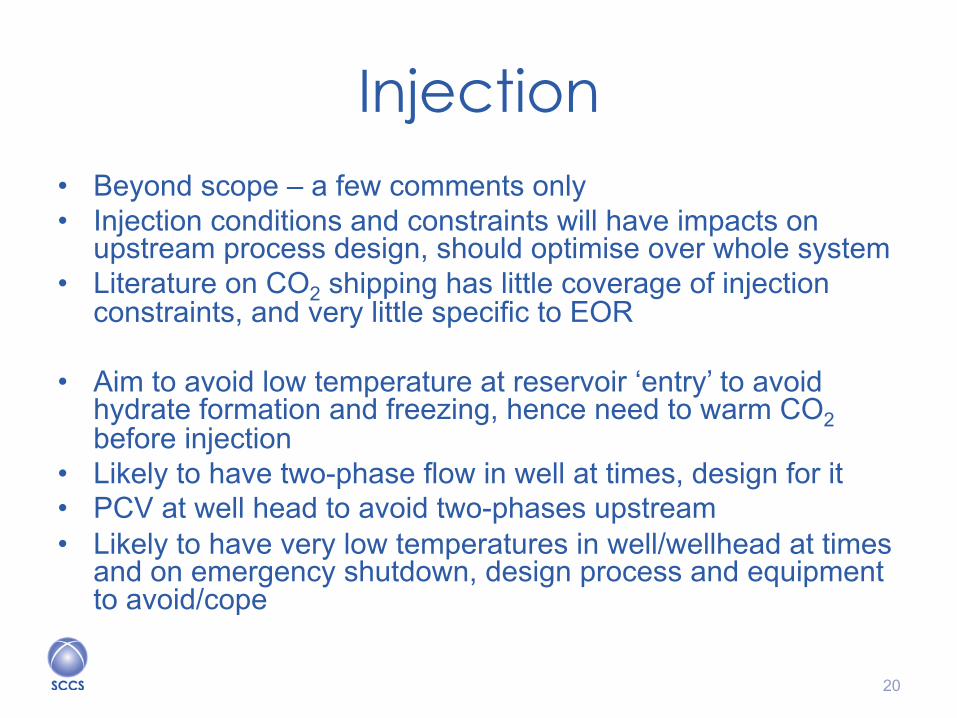
Injection • Beyond scope – a few comments only • Injection conditions and constraints will have impacts on
upstream process design, should optimise over whole system • Literature on CO2 shipping has little coverage of injection
constraints, and very little specific to EOR • Aim to avoid low temperature at reservoir ‘entry’ to avoid
hydrate formation and freezing, hence need to warm CO2 before injection
• Likely to have two-phase flow in well at times, design for it • PCV at well head to avoid two-phases upstream • Likely to have very low temperatures in well/wellhead at times
and on emergency shutdown, design process and equipment to avoid/cope
20

Regulation and HSE
• No specific regulations for CO2 shipping – Covered by UNCLOS and London Protocol – Transport of Dangerous Goods – CO2 non-toxic,
non-flammable – Ship design under IGC Codes
• Carbon Footprint – Estimates vary widely with system boundaries
and assumptions – Range 1.4% to 18% relative to CO2 transported
21

Regulation and HSE
• Health – CO2 asphixiant and toxic, UK-WEL 5,000 ppm (8h); 15,000 ppm (15min)
• Risk assessment – DNV report for Vopak/Veder study concluded risk levels below national (NL) risk criteria (Koers and de Looji, 2011)
• Operational issues – several potential hazard areas, all within existing scope of engineering knowledge
22

Costs of CO2 transport by ship
• Lifetime total cost estimates for North Sea distances range 10-30 €/t-CO2, including compression and liquefaction – Estimates vary quite widely depending on
assumptions and boundaries • Intuitive sensitivities to scale, distance, ship
capacity, utility costs – But relatively insensitive to distance – Also sensitive to cooling water temperature, CO2
supply pressure, CO2 purity
23

Cost breakdown
• In all estimates costs for liquefaction are highest portion – From both high capital costs and high
operational costs due to energy consumption
24
Data from Aspelund, Mølnvik, de Koeijer (2006)
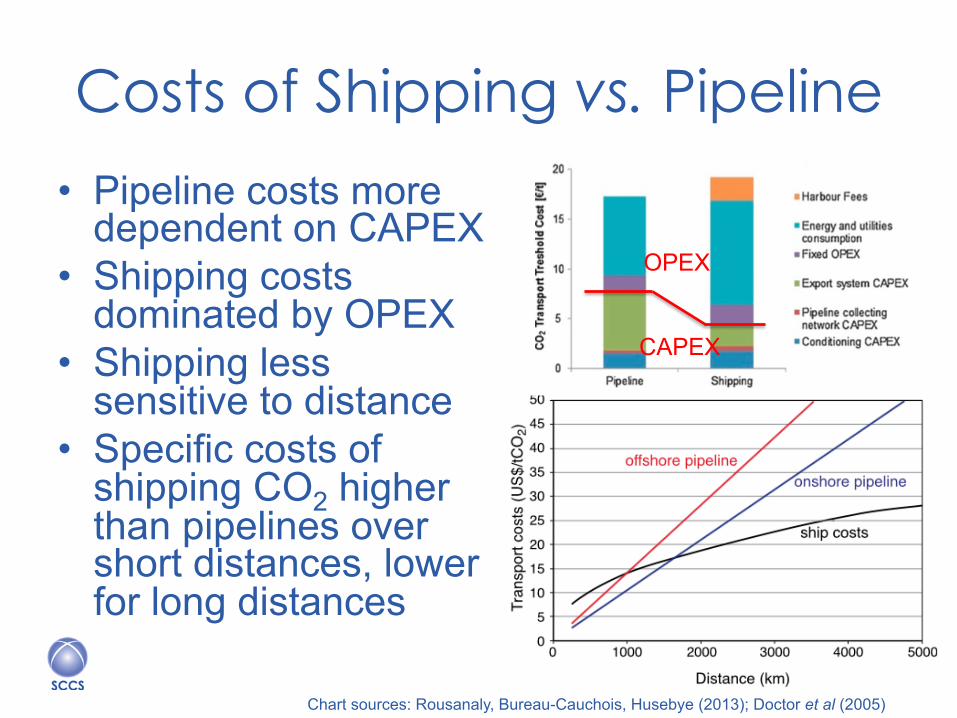
Costs of Shipping vs. Pipeline
• Pipeline costs more dependent on CAPEX
• Shipping costs dominated by OPEX
• Shipping less sensitive to distance
• Specific costs of shipping CO2 higher than pipelines over short distances, lower for long distances
25 Chart sources: Rousanaly, Bureau-Cauchois, Husebye (2013); Doctor et al (2005)
OPEX
CAPEX

Costs of Shipping vs. Pipeline
• ‘Breakeven distance’ beyond which shipping more cost-effective
• Breakeven distance varies with scale, and other assumptions
• Smaller volumes and longer distances favour shipping
26
Shipping more cost-effective
Pipeline more cost-effective
Chart sources: Doctor et al (2005), author (2015)

Asset flexibility, financial risk
• Shipping allows flexibility – In collection points, from scattered emitters – In delivery points, serving different EOR fields – In time, EOR injection profiles and project
phasing, changes to industry sources – In capacity, sequential addition of ship capacity – In asset use, dual purpose, reuse for LPG
• Low entry CAPEX for shipping and flexibility combine to give lower financial risk than pipelines – More attractive to investors
27

Ship transport of CO2 - Conclusions
• Ship transport of CO2 feasible using known technologies
• Existing experience at small scale, but understanding of scale-up requirements generally good
• Published knowledge sparse for offshore offloading, EOR injection profiles and consequences, whole-chain optimisation
• No unusual regulatory or HSE issues • Shipping cost-competitive for lower scales and greater
distances • Flexibility and low entry capital reduce financial risks
28


![Multi-year Expert Meeting on Transport, Trade Logistics ...unctad.org/meetings/en/Presentation/Simon BENNETT.pdf · may choose to adopt at COP21. [Slide - Shipping and CO2] The shipping](https://static.fdocuments.in/doc/165x107/5c67b18c09d3f2c85f8c4b0f/multi-year-expert-meeting-on-transport-trade-logistics-bennettpdf-may.jpg)