PETE 310 Review Lecture # 7 Three & Multicomponent Mixtures… Plus Lecture # 8 – Chapter 5.
38
PETE 310 PETE 310 Review Lecture # 7 Review Lecture # 7 Three & Multicomponent Three & Multicomponent Mixtures… Mixtures… Plus Plus Lecture # 8 – Chapter 5 Lecture # 8 – Chapter 5
-
Upload
opal-gibbs -
Category
Documents
-
view
228 -
download
4
Transcript of PETE 310 Review Lecture # 7 Three & Multicomponent Mixtures… Plus Lecture # 8 – Chapter 5.

PETE 310PETE 310
Review Lecture # 7 Review Lecture # 7
Three & Multicomponent Three & Multicomponent Mixtures…Mixtures…
PlusPlus
Lecture # 8 – Chapter 5Lecture # 8 – Chapter 5

Ternary Diagrams: ReviewTernary Diagrams: Review
.9
.8
.7
.6
.5
.4
.3
.2
.1
.1
.2
.3
.4
.5
.6
.7
.8
.9
1.1 .2 .3 .4 .5 .6 .7 .8 .90
01
L
H I
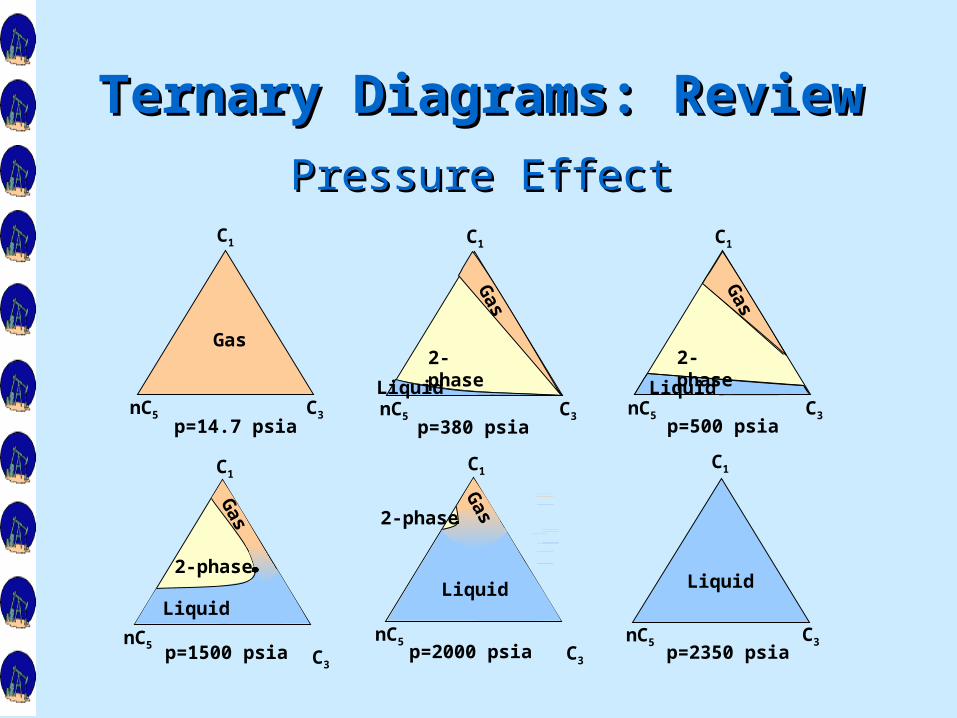
Ternary Diagrams: ReviewTernary Diagrams: Review
Pressure EffectPressure Effect
C3C3
nC5 C3
C1
Gas
p=14.7 psia
C1
nC5
Gas
2-phase
Liquid
p=380 psiaC3 nC5
C1
C3
Gas
2-phase
Liquid
p=500 psia
C1
Gas
2-phase
Liquid
nC5 p=1500 psia
2-phase
Liquid
C1
nC5
Gas
p=2000 psia
C1
nC5 C3
Liquid
p=2350 psia

Dilution LinesDilution LinesTernary Diagrams: ReviewTernary Diagrams: Review
.9
.8
.7
.6
.5
.4
.3
.2
.1
.1
.2
.3
.4
.5
.6
.7
.8
.9
1.1 .2 .3 .4 .5 .6 .7 .8 .90
01
C1
C10 n-C4
x

Ternary Diagrams: ReviewTernary Diagrams: Review
Quantitative Representation of Quantitative Representation of Phase Equilibria - Tie (or Phase Equilibria - Tie (or equilibrium) linesequilibrium) lines
Tie lines join equilibrium conditions of Tie lines join equilibrium conditions of the gas and liquid at a given pressure the gas and liquid at a given pressure and temperature.and temperature.
Dew point curve gives the gas Dew point curve gives the gas composition.composition.
Bubble point curve gives the liquid Bubble point curve gives the liquid composition.composition.

Ternary Diagrams: ReviewTernary Diagrams: Review
Quantitative Representation of Quantitative Representation of Phase Equilibria - Tie (or Phase Equilibria - Tie (or equilibrium) linesequilibrium) lines
All mixtures whose overall composition All mixtures whose overall composition (z(zii) is along a tie line have the SAME ) is along a tie line have the SAME equilibrium gas (yequilibrium gas (yii) and liquid ) and liquid composition (xcomposition (xii), but the relative ), but the relative amounts on a molar basis of gas and amounts on a molar basis of gas and liquid (fliquid (fvv and f and fll) change linearly (0 – vapor ) change linearly (0 – vapor at B.P., 1 – liquid at B.P.).at B.P., 1 – liquid at B.P.).
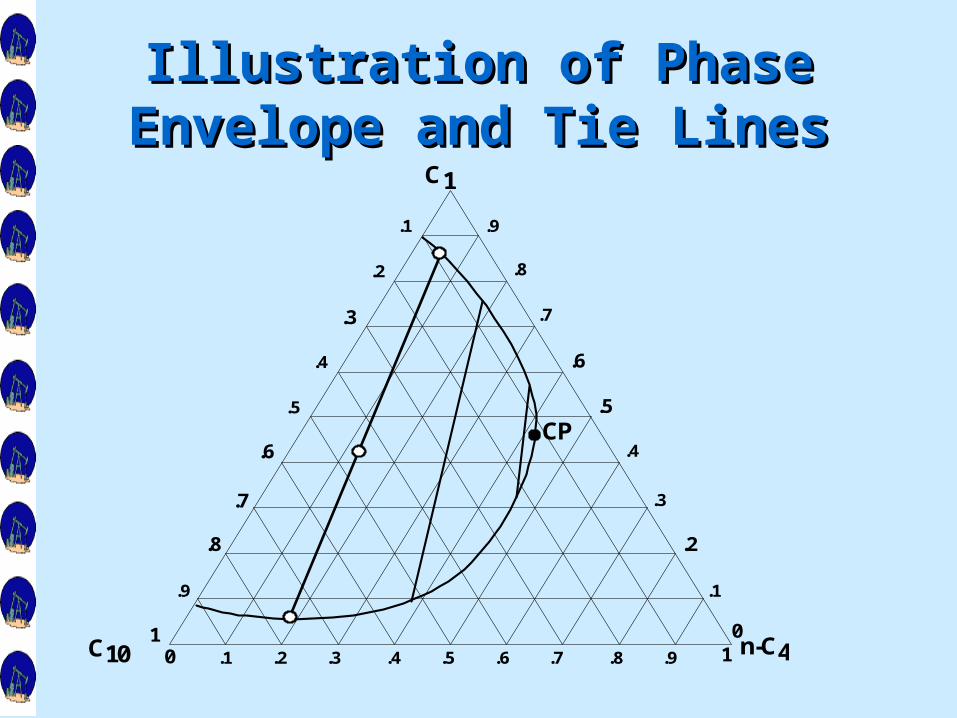
Illustration of Phase Illustration of Phase Envelope and Tie LinesEnvelope and Tie Lines
.9
.8
.7
.6
.5
.4
.3
.2
.1
.1
.2
.3
.4
.5
.6
.7
.8
.9
1.1 .2 .3 .4 .5 .6 .7 .8 .90
01
C1
C10 n-C4
CP

Uses of Ternary DiagramsUses of Ternary Diagrams
Representation of Multi-Component Representation of Multi-Component Phase Behavior with a Phase Behavior with a Pseudoternary DiagramPseudoternary Diagram
Ternary diagrams may approximate Ternary diagrams may approximate phase behavior of multi-component phase behavior of multi-component mixtures by grouping them into 3 mixtures by grouping them into 3 pseudocomponentspseudocomponents
heavy (Cheavy (C77++))
intermediate (Cintermediate (C22-C-C66))light (Clight (C11, CO, CO2 , 2 , NN22- C- C1, 1, COCO22-C-C22, ...), ...)

Uses of Ternary DiagramsUses of Ternary Diagrams
Miscible Recovery ProcessesMiscible Recovery Processes
.9
.8
.7
.6
.5
.4
.3
.2
.1
.1
.2
.3
.4
.5
.6
.7
.8
.9
1.1 .2 .3 .4 .5 .6 .7 .8 .90
01
C1
C2-C6C7+
A
O
Solvent1Solvent1
oiloil
Solvent2Solvent2
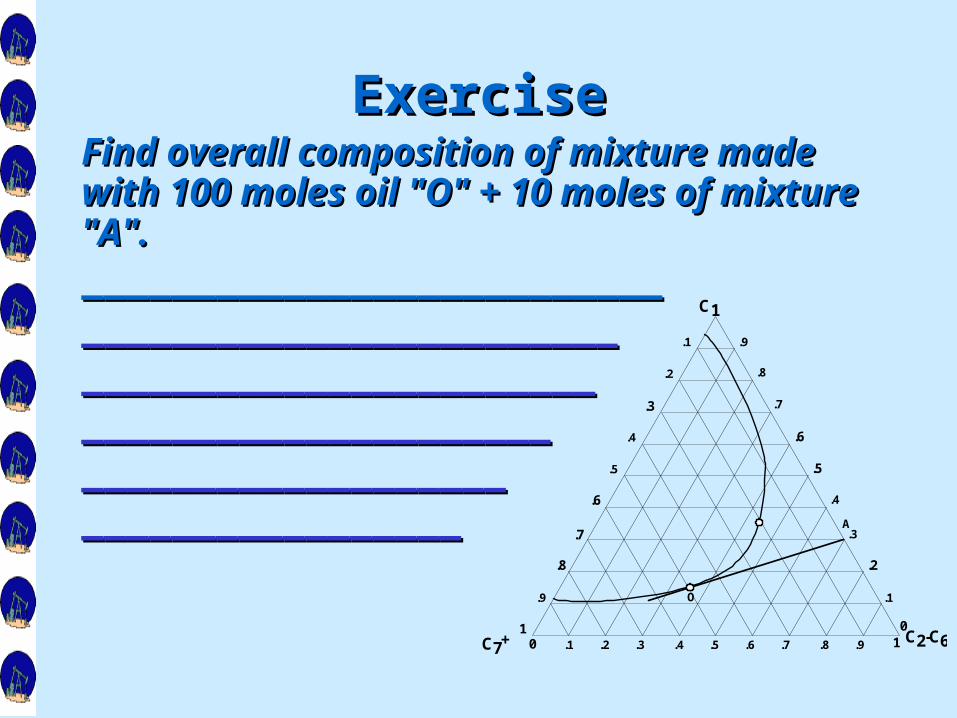
ExerciseExerciseFind overall composition of mixture Find overall composition of mixture made with 100 moles oil "O" + 10 made with 100 moles oil "O" + 10 moles of mixture "A".moles of mixture "A".____________________________________________________________________________________________________________________________________________________________________________________________________________________________________________________________________
.9
.8
.7
.6
.5
.4
.3
.2
.1
.1
.2
.3
.4
.5
.6
.7
.8
.9
1.1 .2 .3 .4 .5 .6 .7 .8 .90
01
C1
C2-C6C7+
A
O

Practice Ternary Practice Ternary DiagramsDiagrams
Pressure EffectPressure Effect
T=180FP=14.7 psia
Pressure Effect
O
T=180FP=200 psia
C1-C3-C10
Pressure Effect
O
T=180FP=400 psia
Pressure Effect
O
T=180FP=600 psia
Pressure Effect
O

Practice Ternary DiagramsPractice Ternary DiagramsPressure EffectPressure Effect
T=180FP=1000 psia
Pressure Effect
O
T=180FP=1500 psia
Pressure Effect
O
T=180FP=2000 psia
O
T=180FP=3000 psia
O
T=180FP=4000 psia
O

Practice Ternary DiagramsPractice Ternary Diagrams
Temperature EffectTemperature Effect
T=100FP=2000 psia
Temperature Effect
O
T=150FP=2000 psia
Temperature Effect
O
T=200FP=2000 psia
Temperature Effect
O
T=300FP=2000 psia
Temperature Effect
O

Practice Ternary DiagramsPractice Ternary Diagrams
Temperature EffectTemperature Effect
T=350FP=2000 psia
Temperature Effect
O
T=400FP=2000 psia
Temperature Effect
O
T=450FP=2000 psia
Temperature Effect
O

Pressure-Temperature Pressure-Temperature Diagram for Diagram for
Multicomponent SystemsMulticomponent SystemsR
eser
voir
Pre
ssu
re
Reservoir Temperature
Bubble-Curve
Dew-Curve
60%
20%0%
2-Phase
1-Phase 1-PhaseCP

Changes During Changes During Production and InjectionProduction and Injection
Temperature
t1
Pre
ssu
re
t3
t2
Gas
Injection
Productiont
t3
2
Gas
Injection
Production

PETE 310PETE 310
Lecture # 8: Five Lecture # 8: Five Reservoir Fluids (Chapter Reservoir Fluids (Chapter
5)5)

PETE 310 - Phase PETE 310 - Phase BehaviorBehavior
Used to visualize the fluids Used to visualize the fluids production path from the production path from the reservoir to the surfacereservoir to the surface
To classify reservoir fluidsTo classify reservoir fluidsVisualize miscible processesVisualize miscible processes
Pressure vs. Temperature DiagramsPressure vs. Temperature Diagrams

Pressure-Temperature Pressure-Temperature Diagram for Diagram for
Multicomponent SystemsMulticomponent SystemsR
eser
voir
Pre
ssu
re
Reservoir Temperature
Bubble-Curve
Dew-Curve
60%
20%0%
2-Phase
1-Phase 1-PhaseCP

Why do we need to Why do we need to classify Reservoir Fluids?classify Reservoir Fluids?
Determine fluid samplingDetermine fluid samplingDetermine types and sizes of surface Determine types and sizes of surface
equipmentequipmentDictate depletion strategyDictate depletion strategyDetermine selection of EOR methodDetermine selection of EOR methodDetermine techniques to predict oil Determine techniques to predict oil
& gas reserves& gas reservesDetermine Material Balance Determine Material Balance
calculationscalculations

Phase EnvelopesPhase Envelopes
CriticalPoint
Cricondenbar
Cricondentherm
Bubblepoint Curve
Dew Point Curve
QualityLines
Temperature
Pre
ssu
re 75%
50%
25%
Fixed Composition

Classification of Classification of Reservoirs based on Reservoirs based on
Phase DiagramPhase DiagramGas Reservoirs (Single Phase)Gas Reservoirs (Single Phase)
Gas Condensate Reservoirs Gas Condensate Reservoirs (Dew-Point Reservoirs): (Dew-Point Reservoirs):
Undersaturated Solution-Gas Undersaturated Solution-Gas Reservoirs (Bubble-Point Reservoirs (Bubble-Point Reservoirs):Reservoirs):

Phase Diagram of a Phase Diagram of a Dry Gas ReservoirDry Gas Reservoir
Temperature
Pre
ss
ure
Path of Production
Initial Reservoir Conditions
Separator Conditions
CP

Phase Diagram of a Phase Diagram of a Wet Gas ReservoirWet Gas Reservoir

Phase Diagram of a Phase Diagram of a Retrograde Gas ReservoirRetrograde Gas Reservoir
Temperature
Pre
ss
ure
Initial Reservoir Conditions
CP
Path of Production
Separator Conditions
Temperature
Pre
ss
ure
Initial Reservoir Conditions
CP
Path of Production
Separator Conditions
Temperature
Pre
ss
ure
Initial Reservoir Conditions
CP
Path of Production
Separator Conditions

Phase Diagram of a Phase Diagram of a Volatile Oil ReservoirVolatile Oil Reservoir
Temperature
Pre
ss
ure
Initial Reservoir Conditions
CP
Path of Production
Separator Conditions
75%
50%25%

Phase Diagram of a Phase Diagram of a Black Oil ReservoirBlack Oil Reservoir
Temperature
Pre
ss
ure
Initial Reservoir Conditions
CPPath of Production
Separator Conditions
25%50%75%
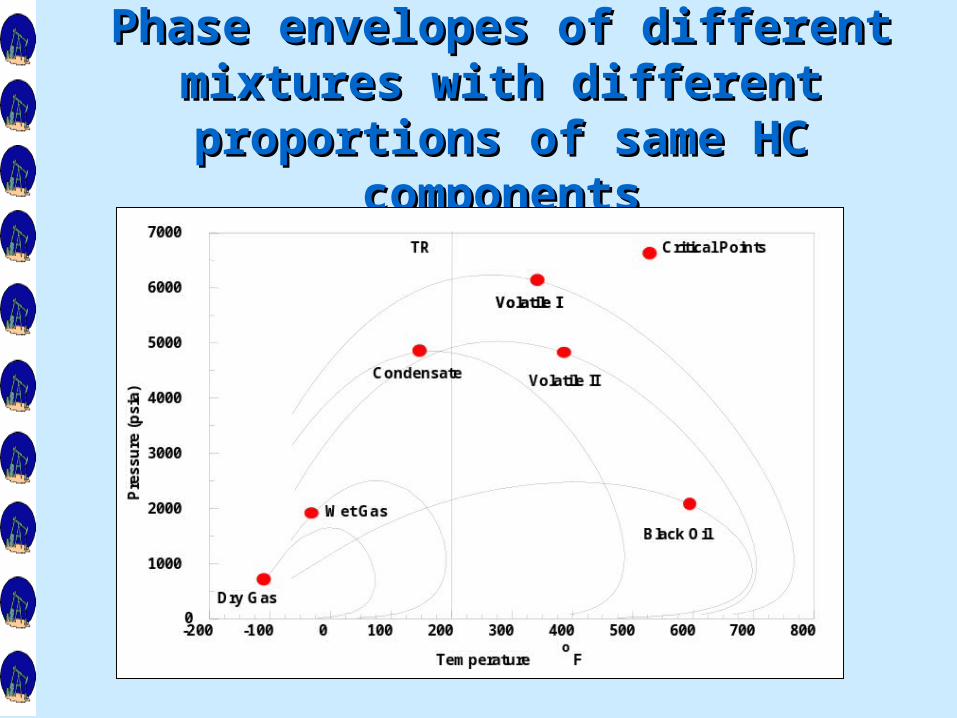
Phase envelopes of different Phase envelopes of different mixtures with different mixtures with different proportions of same HC proportions of same HC
componentscomponents

Typical Reservoir Fluid Typical Reservoir Fluid CompositionsCompositions
Component Black Oil Volatile Oil Gas Condensate Wet Gas Dry Gas
C1 48.83 64.36 87.07 95.85 86.67
C2 2.75 7.52 4.39 2.67 7.77
C3 1.93 4.74 2.29 0.34 2.95
C4 1.60 4.12 1.74 0.52 1.73
C5 1.15 3.97 0.83 0.08 0.88
C6 1.59 3.38 0.60 0.12
C7+
42.15 11.91 3.80 0.42
MwC7+
225 181 112 157
GOR 625 2000 18,200 105,000 -
Tank oAPI 34.3 50.1 60.8 54.7 -
LiquidColor
GreenishBlack
MediumOrange
LightStraw
WaterWhite
-

Compositional Distribution ofReservoir Fluids

Classification of Reservoirs Classification of Reservoirs based on Production and based on Production and
PVT dataPVT data
GAS CONDENSATE RESERVOIRS:GAS CONDENSATE RESERVOIRS:GOR between 70,000-100,000 GOR between 70,000-100,000
SCF/STBSCF/STBDensity greater than 60 ºAPIDensity greater than 60 ºAPILight in colorLight in colorCC77
++ composition composition << 12.5% 12.5%

Classification of Reservoirs Classification of Reservoirs based on Production and based on Production and
PVT dataPVT data
VOLATILE OIL RESERVOIRS:VOLATILE OIL RESERVOIRS:GOR between1,000-8,000 GOR between1,000-8,000
SCF/STBSCF/STBDensity between 45-60 ºAPIDensity between 45-60 ºAPIOil FVF greater than 2.00 (high Oil FVF greater than 2.00 (high
shrinkage oils)shrinkage oils)Light brown to green in colorLight brown to green in colorCC77
++ composition composition >> 12.5% 12.5%

BLACK OIL RESERVOIRS:BLACK OIL RESERVOIRS:GOR less than 1,000 SCF/STBGOR less than 1,000 SCF/STBDensity less than 45 ºAPIDensity less than 45 ºAPIReservoir temperatures less than Reservoir temperatures less than
250 ºF250 ºFOil FVF less than 2.00 (low Oil FVF less than 2.00 (low
shrinkage oils)shrinkage oils)Dark green to black in colorDark green to black in colorCC77
++ composition > 30% composition > 30%
Classification of Classification of Reservoirs based on Reservoirs based on
Production and PVT dataProduction and PVT data

AssignmentAssignment
Read and make a summary of Read and make a summary of revised & newer criteria for revised & newer criteria for classification of Reservoir classification of Reservoir Fluids from given paper by Fluids from given paper by William D. McCain in JPT William D. McCain in JPT September 1994September 1994

JPT paper Study GuideJPT paper Study Guide
What are the distinctive What are the distinctive features of features of black oilsblack oils in terms in terms ofofInitial GOR & GOR vs timeInitial GOR & GOR vs time
Initial API & API vs timeInitial API & API vs time
CompositionsCompositions
ColorColor

JPT paper Study GuideJPT paper Study Guide
What are the distinctive What are the distinctive features of features of volatile oilsvolatile oils in in terms ofterms ofInitial GOR & GOR vs timeInitial GOR & GOR vs time
Initial API & API vs timeInitial API & API vs time
CompositionsCompositions
ColorColor

JPT paper Study GuideJPT paper Study Guide
What are the distinctive What are the distinctive features of features of Condensate gasesCondensate gases in terms ofin terms ofInitial GOR & GOR vs timeInitial GOR & GOR vs time
Initial API & API vs timeInitial API & API vs time
CompositionsCompositions
ColorColor

JPT paper Study GuideJPT paper Study Guide
What are the distinctive What are the distinctive features of features of Dry gasesDry gases in terms in terms ofofInitial GOR & GOR vs timeInitial GOR & GOR vs time
CompositionsCompositions