Pet Food in the U.S., 10th Edition
22
ReportLinker Find Industry reports, Company profiles and Market Statistics >> Get this Report Now by email! Pet Food in the U.S., 10th Edition Published on July 2013 Report Summary With volume sales relatively flat, competition for every pet food dollar has never been more intense, such that pet food marketers' attentions are firmly directed toward presenting products that stand out while establishing or maintaining position in the all-important premium/natural segment. As mass-market pet food sales stagnate, with growth of under half a percentage point for the 52 weeks ending January 27, 2013, the action is in premium and superpremium foods where growth has reached double digits in some segments. With Hill's reformulating Science Diet as a natural product, Walmart launching Pure Balance as its first natural pet food store brand, Nestlé Purina coming on strong with Purina One Beyond, Merrick taking acquiring Castor & Pollux and obtaining organic certification, and Del Monte acquiring Natural Balance, everyone is stepping up their game to take advantage of the natural boom. Yet another market driver is the fact that, more than ever, pet specialty and mass-market brands are growing significantly more alike in terms of offerings. In order to differentiate, marketers are turning to trends such as grain-free, 'meat first' and human grade products. As pet superstores draw shoppers away from supermarkets and mass merchandisers with increased customer service and a greater range of products, discount and online retailers are putting the pressure on pet retailers across the board, offering quality products at substantially lower prices. Although pet-owning households have slowly increased their income level, with 29.4% of dog or cat-owning households making $60,000 a year or more in 2012 compared with 27.8% in 2007, the percentage of pet owners shopping at discount stores remains high, at nearly 25%, based on Simmons Fall 2012 consumer survey data. Additionally, although online shopping for pet products is significanly lower than in other retail channels, at just over 6% in 2012, dog and cat owners are more likely than the population at large'at 15% and 23%, respectively'to shop online in general, leading to the potential for more online shopping growth in the pet market. Bringing to bear more than 20 years of experience in analyzing this market and drawing on Packaged Facts' broad cross-category expertise, this study pinpoints strategic directions for current and prospective marketers, with a forward-looking focus on high-growth product segments and market drivers. Covering products for all types of companion animals, the report devotes separate chapters to Dog Food, Cat Food, and Other Pet Food (birds, small animal, fish, and reptiles), while also providing a comprehensive Market Overview covering cross-market trends and opportunities through 2017. The report provides market size estimates for the overall retail universe, while quantifying mass-market sales to the marketer/brand share level using data from IRI. It also charts market size and marketer share figures for the natural and specialty/gourmet supermarket channels, using SPINSscan sales tracking data. In sum, Pet Food in the U.S., 10th Edition thoroughly documents competitive, new product and retail trends, as well as trends in pet food purchaser demographics, brand preferences, cross-channel shopping, and cross-product purchasing. Consumer profiling is based on exclusive data from Packaged Facts' own quarterly pet owners surveys and customized cross tabulations of Simmons consumer survey data from Experian Marketing Services. Dozens of images of pet food and treat products and consumer and trade ads are included. Table of Content Chapter 1: Executive Summary Scope and Methodology Scope of Report: Dog, Cat, Other Pet Food in the U.S., 10th Edition (From Issuu) Page 1/22
description
Â
Transcript of Pet Food in the U.S., 10th Edition
ReportLinker Find Industry reports, Company profilesand Market Statistics
>> Get this Report Now by email!
Pet Food in the U.S., 10th Edition
Published on July 2013
Report Summary
With volume sales relatively flat, competition for every pet food dollar has never been more intense, such that pet food marketers'
attentions are firmly directed toward presenting products that stand out while establishing or maintaining position in the all-important
premium/natural segment. As mass-market pet food sales stagnate, with growth of under half a percentage point for the 52 weeks
ending January 27, 2013, the action is in premium and superpremium foods where growth has reached double digits in some
segments. With Hill's reformulating Science Diet as a natural product, Walmart launching Pure Balance as its first natural pet food
store brand, Nestlé Purina coming on strong with Purina One Beyond, Merrick taking acquiring Castor & Pollux and obtaining organic
certification, and Del Monte acquiring Natural Balance, everyone is stepping up their game to take advantage of the natural boom. Yet
another market driver is the fact that, more than ever, pet specialty and mass-market brands are growing significantly more alike in
terms of offerings. In order to differentiate, marketers are turning to trends such as grain-free, 'meat first' and human grade products.
As pet superstores draw shoppers away from supermarkets and mass merchandisers with increased customer service and a greater
range of products, discount and online retailers are putting the pressure on pet retailers across the board, offering quality products at
substantially lower prices. Although pet-owning households have slowly increased their income level, with 29.4% of dog or cat-owning
households making $60,000 a year or more in 2012 compared with 27.8% in 2007, the percentage of pet owners shopping at
discount stores remains high, at nearly 25%, based on Simmons Fall 2012 consumer survey data. Additionally, although online
shopping for pet products is significanly lower than in other retail channels, at just over 6% in 2012, dog and cat owners are more
likely than the population at large'at 15% and 23%, respectively'to shop online in general, leading to the potential for more online
shopping growth in the pet market.
Bringing to bear more than 20 years of experience in analyzing this market and drawing on Packaged Facts' broad cross-category
expertise, this study pinpoints strategic directions for current and prospective marketers, with a forward-looking focus on high-growth
product segments and market drivers. Covering products for all types of companion animals, the report devotes separate chapters to
Dog Food, Cat Food, and Other Pet Food (birds, small animal, fish, and reptiles), while also providing a comprehensive Market
Overview covering cross-market trends and opportunities through 2017.
The report provides market size estimates for the overall retail universe, while quantifying mass-market sales to the marketer/brand
share level using data from IRI. It also charts market size and marketer share figures for the natural and specialty/gourmet
supermarket channels, using SPINSscan sales tracking data. In sum, Pet Food in the U.S., 10th Edition thoroughly documents
competitive, new product and retail trends, as well as trends in pet food purchaser demographics, brand preferences, cross-channel
shopping, and cross-product purchasing. Consumer profiling is based on exclusive data from Packaged Facts' own quarterly pet
owners surveys and customized cross tabulations of Simmons consumer survey data from Experian Marketing Services. Dozens of
images of pet food and treat products and consumer and trade ads are included.
Table of Content
Chapter 1: Executive Summary
Scope and Methodology
Scope of Report: Dog, Cat, Other
Pet Food in the U.S., 10th Edition (From Issuu) Page 1/22

ReportLinker Find Industry reports, Company profilesand Market Statistics
>> Get this Report Now by email!
Terminology Exclusions
Market Size and Growth
U.S. Pet Food Retail Sales, 2008-2012
Table 1-1: U.S. Retail Sales of Pet Food: 2008-2012 (in millions of dollars)
Mass-Market Dollar Sales Flat, Volume Sales Down
Premium vs. Regular vs. Value Foods
Share of Sales by Distribution Channel
Table 1-2: Share of U.S. Pet Food Sales by Retail Outlet Type: 2012 (percent)
Sales Growth Through 2017
Table 1-3: Projected U.S. Retail Sales of Pet Food: 2012-2017 (in millions of dollars)
Competitive Trends
Top Five Players Control Four-Fifths of Market
Table 1-4: Top Five U.S. Marketers of Pet Food: 2010 vs. 2012 (percent)
Mergers and Acquisitions
Del Monte Foods and Natural Balance Pet Foods Merge
Merrick Acquires Castor & Pollux
Expansions Galore
Three Companies Dominate Mass-Market Sales
Pet Specialty Channel Leaders
Natural/Organic Specialists
Veterinary Diet Marketers
Retail Channel Trends
Overview
Figure 1-1: Household Purchasing of Pet Products by Retail Channel or Pet Superstore Chain, 2012 (percent of U.S. households with
pets)
The Big Two: PetSmart and Petco Continue to Advance
Independent Pet Stores Under Pressure
Focus on Private Label
Pet Food in the U.S., 10th Edition (From Issuu) Page 2/22

ReportLinker Find Industry reports, Company profilesand Market Statistics
>> Get this Report Now by email!
Pet Consumer Trends
64 Million Households Own Pets
Table 1-5: Pet Ownership in the United States, 2012 (percent and number of U.S. households)
34% of Pet Households Keep Multiple Types
Figure 1-2: Ownership of Multiple Types of Pets, 2012 (percent of pet-owning U.S. households)
55% of Pet Households Keep More Than One Pet
Pet Specialty Leads in Channel Usage Rates
Table 1-6: Household Purchasing of Pet Products by Retail Channel: Total Purchasers and Sole Purchasers, 2008 vs. 2012 (percent
of U.S. households with pets)
Chapter 2 Highlights
Chapter 2: Market Overview
Introduction
Three Animal Categories: Dog, Cat, Other
Terminology
Exclusions
Other Marketing Classifications
Market Size and Growth
U.S. Pet Food Retail Sales, 2008-2012
Table 2-1: U.S. Retail Sales of Pet Food: 2008-2012 (in millions of dollars)
Mass-Market Dollar Sales Flat, Volume Sales Down
Table 2-2: IRI-Tracked Dollar and Volume Sales of Pet Food: Overall and by Category and Segment, January 2012 vs. January 2013
(in millions of dollars)
Dog Food Inches Up to $3.8 Billion
Cat Food Stalls at $2.4 Billion
Non-Dog/Cat Food at $236 Million
Dog Food the Strongest Contributor to Mass-Market Growth
Back-story: Mass-market Sales Chart Steady Growth
Pet Food Sales Trends in Natural Supermarkets
Table 2-3a: Retail Dollar Sales of Pet Food in the Natural Supermarket Channel by Type (Dog Food, Cat Food, Other Pet Food,
Pet Food in the U.S., 10th Edition (From Issuu) Page 3/22

ReportLinker Find Industry reports, Company profilesand Market Statistics
>> Get this Report Now by email!
Treats), 2012 vs. 2013 (in millions of dollars)
Table 2-3b: Share of Retail Dollar Sales of Pet Food in the Natural Supermarket Channel by Type (Dog Food, Cat Food, Other Pet
Food, Treats), 2012 vs. 2013 (percent)
Table 2-3c: Retail Dollar Sales of Pet Food in the Specialty/Gourmet Supermarket Channel by Category and Segment, 2012 vs. 2013
(in millions of dollars)
Table 2-3d: Share of Retail Dollar Sales of Pet Food in the Specialty/Gourmet Supermarket Channel by Category and Segment, 2012
vs. 2013 (percent)
Market Composition
Premium vs. Regular vs. Value Foods
Table 2-4: Share of U.S. Retail Sales of Pet Food by Price
Category: Premium (Mass Premium and Superpremium), Regular, Value, Treats: Dog Food, Cat Food, Total, 2010 vs. 2012 (percent)
Dog Food vs. Cat Food
Table 2-5: Share of IRI-Tracked Retail Dollar Sales of Pet Food by Category: January 2012 vs. January 2013 (percent)
Dog and Cat Treats on the Ups
Table 2-6: Share of IRI-Tracked Sales of Dog and Cat Food by Form: January 2012 vs. January 2013 (percent)
Pet Food Sales by Form: Dry Tops List
Table 2-7: Share of IRI-Tracked Sales of Pet Food by Form: January 2012 vs. January 2013 (percent)
Natural and Organic Pet Food Sales
Table 2-8: U.S. Retail Sales of Natural Pet Food: 2008, 2012 and 2017 (in millions of dollars)
Independent Pet Store Sales by Animal Type
Table 2-9: Share of Independent Pet Store Supply Retail Dollar Sales by Animal Type: 2010-2011 (percent)
Food and Treats Share of Sales in Independent Pet Stores by Animal Type
Table 2-10: Share of Retail Dollar Sales of Pet Edibles vs. Pet Non-Edible Supplies, by Animal Type in Independent Pet Stores: 2010
vs. 2011 (percent)
Dog Food the Largest Category in Pet Specialty Stores
Table 2-11: Share of Pet Specialty Retailer Dollar Sales by Category: 2009-2011 (percent)
Share of Sales by Distribution Channel
Table 2-12: Share of U.S. Pet Food Sales by Retail Outlet Type: 2012 (percent)
Pet Food in the U.S., 10th Edition (From Issuu) Page 4/22

ReportLinker Find Industry reports, Company profilesand Market Statistics
>> Get this Report Now by email!
Market Outlook
Pet Market Still Feeling Recession Fallout
Figure 2-1: Level of Agreement with Statement 'I Am Spending Less on Pet Products These Days Because of the Economy,' 2010 vs.
2013 (percent of U.S. pet owners)
Table 2-13: Economic Outlook of U.S. Pet Owners: Now vs. Last 12 Months (percent)
Table 2-14: IRI-Tracked Sales of Pet Products by Food and Non- Food Category, 2011 vs. 2012 (in millions)
Table 2-15: Economic Outlook of U.S. Pet Owners: Now vs. Next 12 Months (percent)
Pet Market Growth Hinges on Innovation
Human/Animal Bond and 'Functional Pampering'
Figure 2-2: 'I Consider My Pet(s) Part of the Family,' 2013 (percent of pet owners)
Superpremium Products an Essential Market Driver
Premium Food Trend Includes Natural Products
Figure 2-3: Level of Agreement with Statement: 'Natural/organic brand pet products are often better than standard national brand
products,' 2012 vs. 2013 (percent of pet owners)
Figure 2-4: Level of Agreement with Statement: 'If natural/organic products were more available where I shop, I would buy them more
often,' 2013 (percent)
Figure 2-5: Level of Agreement with Statement: 'If natural/organic products were more affordable where I shop, I would buy them
more often,' 2013 (percent of pet owners)
Pet Specialty Channel Focuses on Natural Products
Figure 2-6: Level of Agreement with Statement: 'Natural products sold in pet specialty stores (such as Petco, PetSmart, or
independent pet stores) are superior to natural products sold in regular stores (such as Walmart, supermarkets, drugstores),' 2013
(percent)
Illustration 2-1: Pet Food Brands Carried by Unleashed by Petco (Website Screenshot)
Figure 2-7: 'In which product categories is a natural marketing proposition important'' (percent)
Growing Focus on Therapeutic Pet Foods
Table 2-16: Level of Agreement with Statement: 'I believe that pet supplements are more effective than 'functional' pet food designed
to treat specific health conditions,' 2012 (percent)
Table 2-17: Level of Agreement with Statement: 'I believe 'functional' pet food designed to treat specific health conditions is more
effective than supplements in pill, tablet, liquid, or powder form,' 2012 (percent)
Table 2-18: Level of Agreement with Statement: 'I do not use pet supplements because I believe my pet gets all the nutrients it needs
from the pet food I buy,' 2012 (percent)
Illustration 2-2: Hill's Everypeteverytime.com Vet-Targeted Website
Nutraceutical Treats Expanding Market Boundaries
Table 2-19: Use of Special-Purpose Nutritional Formula Pet Food and Treats vs. Pet Supplements: Dog and Cat Owners, 2013
(percent)
The Aging Pet Population
Table 2-20: Age of Dogs and Cats, 2013 (percent of pet owners)
Pet Food in the U.S., 10th Edition (From Issuu) Page 5/22
ReportLinker Find Industry reports, Company profilesand Market Statistics
>> Get this Report Now by email!
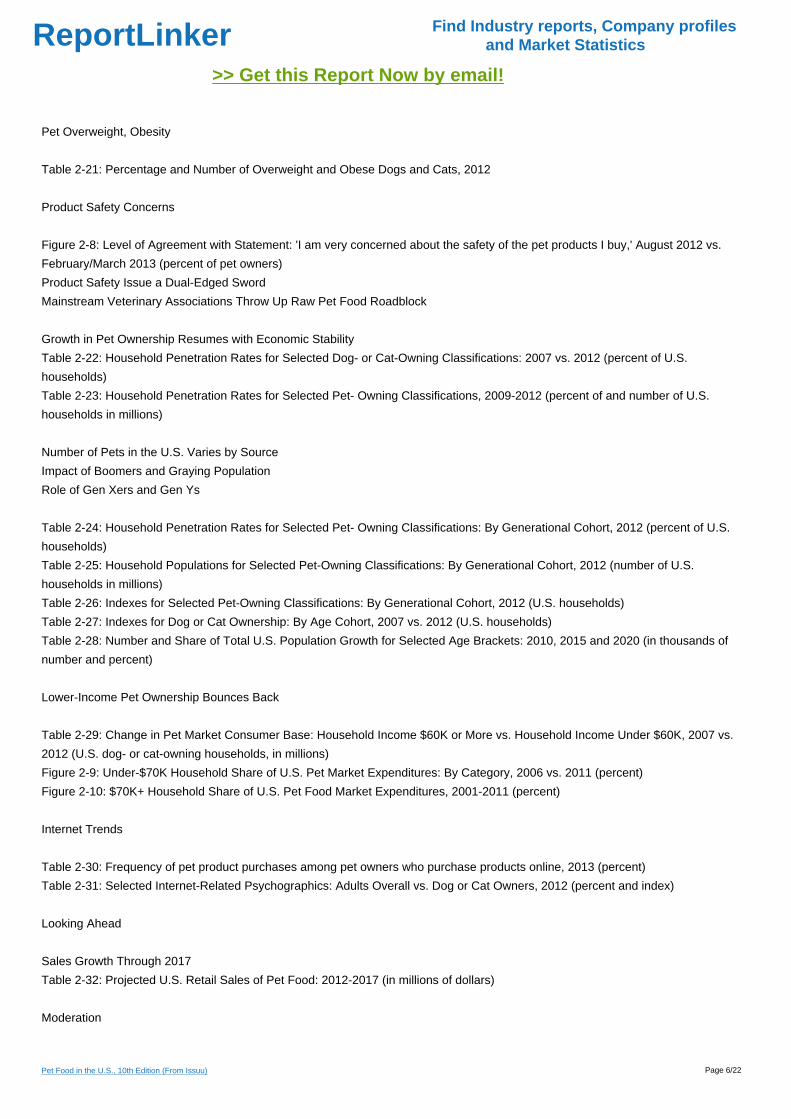
Pet Overweight, Obesity
Table 2-21: Percentage and Number of Overweight and Obese Dogs and Cats, 2012
Product Safety Concerns
Figure 2-8: Level of Agreement with Statement: 'I am very concerned about the safety of the pet products I buy,' August 2012 vs.
February/March 2013 (percent of pet owners)
Product Safety Issue a Dual-Edged Sword
Mainstream Veterinary Associations Throw Up Raw Pet Food Roadblock
Growth in Pet Ownership Resumes with Economic Stability
Table 2-22: Household Penetration Rates for Selected Dog- or Cat-Owning Classifications: 2007 vs. 2012 (percent of U.S.
households)
Table 2-23: Household Penetration Rates for Selected Pet- Owning Classifications, 2009-2012 (percent of and number of U.S.
households in millions)
Number of Pets in the U.S. Varies by Source
Impact of Boomers and Graying Population
Role of Gen Xers and Gen Ys
Table 2-24: Household Penetration Rates for Selected Pet- Owning Classifications: By Generational Cohort, 2012 (percent of U.S.
households)
Table 2-25: Household Populations for Selected Pet-Owning Classifications: By Generational Cohort, 2012 (number of U.S.
households in millions)
Table 2-26: Indexes for Selected Pet-Owning Classifications: By Generational Cohort, 2012 (U.S. households)
Table 2-27: Indexes for Dog or Cat Ownership: By Age Cohort, 2007 vs. 2012 (U.S. households)
Table 2-28: Number and Share of Total U.S. Population Growth for Selected Age Brackets: 2010, 2015 and 2020 (in thousands of
number and percent)
Lower-Income Pet Ownership Bounces Back
Table 2-29: Change in Pet Market Consumer Base: Household Income $60K or More vs. Household Income Under $60K, 2007 vs.
2012 (U.S. dog- or cat-owning households, in millions)
Figure 2-9: Under-$70K Household Share of U.S. Pet Market Expenditures: By Category, 2006 vs. 2011 (percent)
Figure 2-10: $70K+ Household Share of U.S. Pet Food Market Expenditures, 2001-2011 (percent)
Internet Trends
Table 2-30: Frequency of pet product purchases among pet owners who purchase products online, 2013 (percent)
Table 2-31: Selected Internet-Related Psychographics: Adults Overall vs. Dog or Cat Owners, 2012 (percent and index)
Looking Ahead
Sales Growth Through 2017
Table 2-32: Projected U.S. Retail Sales of Pet Food: 2012-2017 (in millions of dollars)
Moderation
Pet Food in the U.S., 10th Edition (From Issuu) Page 6/22
ReportLinker Find Industry reports, Company profilesand Market Statistics
>> Get this Report Now by email!
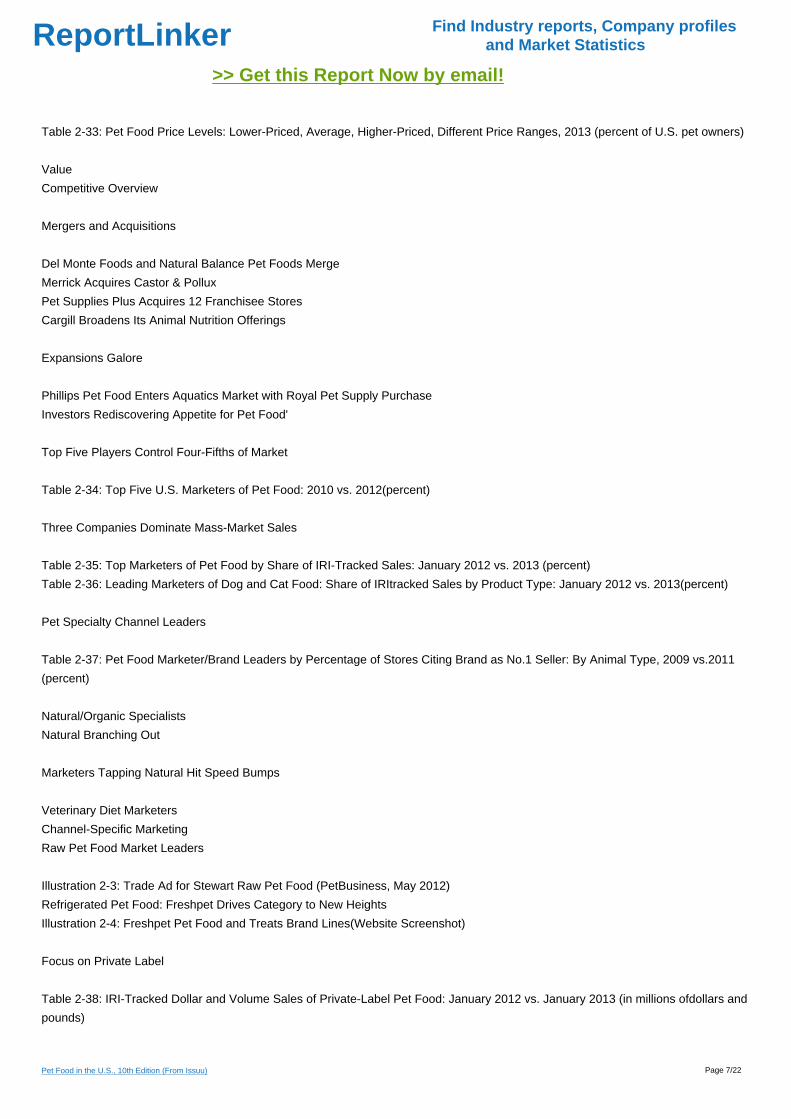
Table 2-33: Pet Food Price Levels: Lower-Priced, Average, Higher-Priced, Different Price Ranges, 2013 (percent of U.S. pet owners)
Value
Competitive Overview
Mergers and Acquisitions
Del Monte Foods and Natural Balance Pet Foods Merge
Merrick Acquires Castor & Pollux
Pet Supplies Plus Acquires 12 Franchisee Stores
Cargill Broadens Its Animal Nutrition Offerings
Expansions Galore
Phillips Pet Food Enters Aquatics Market with Royal Pet Supply Purchase
Investors Rediscovering Appetite for Pet Food'
Top Five Players Control Four-Fifths of Market
Table 2-34: Top Five U.S. Marketers of Pet Food: 2010 vs. 2012(percent)
Three Companies Dominate Mass-Market Sales
Table 2-35: Top Marketers of Pet Food by Share of IRI-Tracked Sales: January 2012 vs. 2013 (percent)
Table 2-36: Leading Marketers of Dog and Cat Food: Share of IRItracked Sales by Product Type: January 2012 vs. 2013(percent)
Pet Specialty Channel Leaders
Table 2-37: Pet Food Marketer/Brand Leaders by Percentage of Stores Citing Brand as No.1 Seller: By Animal Type, 2009 vs.2011
(percent)
Natural/Organic Specialists
Natural Branching Out
Marketers Tapping Natural Hit Speed Bumps
Veterinary Diet Marketers
Channel-Specific Marketing
Raw Pet Food Market Leaders
Illustration 2-3: Trade Ad for Stewart Raw Pet Food (PetBusiness, May 2012)
Refrigerated Pet Food: Freshpet Drives Category to New Heights
Illustration 2-4: Freshpet Pet Food and Treats Brand Lines(Website Screenshot)
Focus on Private Label
Table 2-38: IRI-Tracked Dollar and Volume Sales of Private-Label Pet Food: January 2012 vs. January 2013 (in millions ofdollars and
pounds)
Pet Food in the U.S., 10th Edition (From Issuu) Page 7/22

ReportLinker Find Industry reports, Company profilesand Market Statistics
>> Get this Report Now by email!
Table 2-39: Private-Label Share of IRI-Tracked Sales of Pet Food:By Product Category and Segment, January 2012 vs. January2013
(percent)
Independents Also Playing the Store-Brand Game
Table 2-40: Purchasing Patterns for Selected Types of Store- Brand Dog and Cat Food: By Retail Channel Shopped, 2008vs. 2012
(percent)
Table 2-41: The U.S. Pet Food Market: Selected Leading Marketers and Brands, 2013
Retail Channel Trends
Channel Trends
Figure 2-11: Household Purchasing of Pet Products by Retail Channel or Pet Superstore Chain, 2012 (percent of U.S.households
with pets)
Table 2-42: Household Purchasing of Pet Products by Retail Channel or Pet Superstore Chain: Total Purchasers and Sole
Purchasers, 2010-2012 (percent of U.S. households with pets)
The Big Two: PetSmart and Petco Continue to Advance
Table 2-43: PetSmart and Petco Sales and Number of Stores: 2001-2012 (cumulative, in units and millions of dollars)
Pet Specialty Chains
Independent Pet Stores Under Pressure
Increasing Competition from Mass, Pet Superstores Survival of the Industry
Walmart's Growing Presence
Supermarkets Fight Back
Online Selling
Pet Consumer Trends
Methodology
64 Million Households Own Pets
Table 2-44: Pet Ownership in the United States, 2012 (percent and number of U.S. households)
Ownership of Dogs or Cats Trends Upward
Table 2-45: Dog and Cat Ownership in the United States: 2008, 2010 and 2012 (percent and number of U.S. households)
34% of Pet Households Keep Multiple Types
Figure 2-12: Ownership of Multiple Types of Pets, 2012 (percent of pet-owning U.S. households)
Ownership of Multiple Types of Pets
Pet Food in the U.S., 10th Edition (From Issuu) Page 8/22
ReportLinker Find Industry reports, Company profilesand Market Statistics
>> Get this Report Now by email!
Table 2-46: Multiple Pet Ownership in the United States, 2008 vs. 2012 (percent of pet-owning households)
55% of Pet Households Keep More Than One Pet
Bucking Trend, Ownership of Multiple Cats Is on the Rise
Table 2-47: Ownership of Multiple Pets of a Single Type, 2012(percent and number of U.S. households who keep pets of a given
type)
Table 2-48: Ownership of Multiple Pets of a Single Type, 2008 vs. 2012 (percent of U.S. households who keep pets of a given type)
Pet Specialty Leads in Channel Usage Rates
Table 2-49: Household Purchasing of Pet Products by Retail Channel: Total Purchasers and Sole Purchasers, 2008 vs. 2012 (percent
of U.S. households with pets)
Organic Pet Food and Channel Choices
Table 2-50: Purchasing Rates for Organic Pet Food by Channel Shopped for Pet Products, 2012 (percent of U.S. households with
pets)
The Pet Food Coupon Clipper
Table 2-51: Coupon Usage Rates by Type Among Pet Owners, 2012 (percent and index among U.S. pet-owning households)
Chapter 3 Highlights
Chapter 3: Dog Food
Introduction
Five Product Segments
Market Size and Growth
Total Dog Food Retail Sales, 2008-2017
Table 3-1: U.S. Retail Sales of Dog Food: 2008-2017 (in millionsof dollars)
IRI-Tracked Dollar and Volume Sales of Dog Food
Table 3-2: IRI-Tracked Dollar and Volume Sales of Dog Food by Category: January 2013 vs. January 2012 (in millions of dollars and
pounds)
Table 3-3: Share of IRI-Tracked Sales of Dog Food by Segment: January 2013 (percent)
Table 3-4: IRI-Tracked Sales of Dog Food: 2008-2012 Compound Annual Growth Rates by Segment (percent)
Marketer and Brand Shares
Methodology
Nestlé Purina Dominates Dog Food Category
Pet Food in the U.S., 10th Edition (From Issuu) Page 9/22
ReportLinker Find Industry reports, Company profilesand Market Statistics
>> Get this Report Now by email!
Table 3-5: Top Dog Food Marketers by Share of IRI-Tracked Sales of Dog Food and Total Pet Food, January 2012-January 2013
(percent)
Three of Five Top Dog Food Marketers Rely Most on Dry Form
Table 3-6: Share of Top Dog Food Marketers' IRI-Tracked Sales by Product Form, 2012'2013 (percent)
Nestlé Purina Leads Dry Dog Food Segment
Milk-Bone Takes Top Spot in Treats
Mars Maintains Pinnacle Position in Wet Dog Food
Freshpet Dominates in Frozen/Refrigerated Dog Food
Semi-Moist Segment Dominated by Nestlé
Dog Food Product Winners and Losers
Pet Specialty Channel Marketer/Brand Dog Food Leaders
Table 3-7: Marketers and Brands of Dry Dog Food by IRI-Tracked Sales and Market Share: January 2012 vs. January 2013 (in
millions of dollars and percent)
Table 3-8: Marketer and Brands of Dog Biscuits/Treats by IRITracked Sales and Market Share: January 2012 vs. January 2013 (in
millions of dollars and percent)
Table 3-9: Marketer and Brands of Wet Dog Food by IRI-Tracked Sales and Market Share: January 2012 vs. January 2013 (in
millions of dollars and percent)
Table 3-10: Marketer and Brands of Frozen/Refrigerated Dog Food by IRI-Tracked Sales and Market Share: January 2012 vs.
January 2013 (in millions of dollars and percent)
Table 3-11: Marketer and Brands of Semi-Moist Dog Food by IRITracked Sales and Market Share: January 2012 vs. January 2013 (in
millions of dollars and percent)
Table 3-12: Top Dog Food Products by Dollar Gains/Losses in IRI-Tracked Sales
Table 3-13: Dog Food Marketer/Brand Leaders by Percentage of Stores Citing Brand as No.1 Seller: 2007'2011 (percent)
Marketing and New Product Trends
Meaningful Marketing in the Dog Food Sphere
Social Media Do-Gooding
Corporate Responsibility
Illustration 3-1: FreeHand Products
Made in the USA, Locally Grown, Family Farms
Spotlight on Ingredients
Fruits & Veggies
Illustration 3-2: Fruitables Skinny Minis
Illustration 3-3: Stewart Pet Pro-Treat
Limited Ingredients
Illustration 3-4: Herbsmith Smiling Dog Pet Treats
Human Grade
Illustration 3-5: Wet Noses Hemp Seed and Banana Treats
Grain-Free Foods and Treats
Pet Food in the U.S., 10th Edition (From Issuu) Page 10/22
ReportLinker Find Industry reports, Company profilesand Market Statistics
>> Get this Report Now by email!
Illustration 3-6: Innova Prime Grain-Free
Illustration 3-7: Petcurean Go! Fit+Free
Natural Branches Out
Walmart Launches Pure Balance Store Brand
Illustration 3-8: Pure Balance Dog Food
Hill's Science Diet Going Natural
Illustration 3-9: Ideal Balance Web Image
Illustration 3-10: Hill's Ideal Balance Life Stages
Illustration 3-11: Hill's New Color Coded System
Organic
Holistic
Functional and Special Diet Foods and Treats
Illustration 3-12: Total Pet Health Calming Treats
Omegas and Antioxidants
Illustration 3-13: Darford Omega Booster
Illustration 3-14: Pet Botanics Healthy Omega
Healthy Weight
Illustration 3-15: Annamaet Lean
Probiotics, Prebiotics and Healthy Digestion
Illustration 3-16: The Bear & The Rat Bacon Peanut Barker
Frozen Treat
Size- and Breed-Specific Products
Illustration 3-17: Royal Canin X-Small Aging +12 Dry Food
Focus on Raw Pet Food
Market Leaders and Upstarts
Illustration 3-18: Zoe's Premium Frozen Raw Food
Product Mainstreaming
Complete and Balanced
Freeze-Dried and Dehydrated
Illustration 3-19: Nutrisca Freeze Dried Dinner Bites
Illustration 3-20: Halo, Purely for Pets Liv-a-Littles
Convenience Forms and Packaging
Illustration 3-21: Nature's Variety Raw Daily Boost
Other Trends in Raw Foods
Frozen Treats
Illustration 3-22: Nature's Variety Sweet Spots
Refrigerated Pet Food: Freshpet Drives Category to New Heights
Expanding Distribution, Product Lines
Illustration 3-23: Freshpet Website
Pet Food in the U.S., 10th Edition (From Issuu) Page 11/22

ReportLinker Find Industry reports, Company profilesand Market Statistics
>> Get this Report Now by email!
'People Food'
Dog Candy
Illustration 3-24: Canine Cuisine Dogcandy
Illustration 3-25: Exclusively Dog Lick-O-Rish Chews
Baked Goodies
Illustration 3-26: Beneful Baked Delights Heartfuls
Party Mix
Illustration 3-27: Darford Party Mix
Canned/Wet Foods Tempt with Gourmet Flavors
Illustration 3-28: Natural Balance Delectable Delights Stew
Make-It-Yourself Kits
Illustration 3-29: Kong Easy Freeze
Treats on the Go
Lickable Treats Travel Anywhere
Illustration 3-30: PetSafe Lickety Stik
Energy Bars: Meals to Go
Illustration 3-31: All American Pet Nutra Bar
Trail Mix
Illustration 3-32: Milk-Bone Trail Mix
Hartz Heads for Field & Stream
Illustration 3-33: Field & Stream Energy Bar
Nutraceutical Treats
Illustration 3-34: Isle of Dogs Soft Chew Dog Treats
Oral Care Treats
Illustration 3-35: Zuke's Z-Bones
Emphasis: Active Lifestyles/Functional
Illustration 3-36: Cloud Star Dynamo Dog Ad
Emphasis: Dental Health
Illustration 3-37: Pedigree Dentastix Video Still
Emphasis: Value/Nutrient Comparison/Innovation
Illustration 3-38: Iams Web Banners
Emphasis: Size-Specific/Pampering
Illustration 3-39: Fromm Family Foods Ad
Emphasis: Digestive Health/Shop Local
Illustration 3-40: Holistic Select Ad
Emphasis: Freshness/Convenience
Illustration 3-41: Sojos Raw Food Ads
Emphasis: Cause Marketing/Social Media Incentive
Illustration 3-42: Natural Balance Facebook Page
Pet Food in the U.S., 10th Edition (From Issuu) Page 12/22
ReportLinker Find Industry reports, Company profilesand Market Statistics
>> Get this Report Now by email!
Dog Ownership Trends and Demographics
Methodology
45 Million Households Keep Pet Dogs
Dog Ownership on the Rise
Figure 3-1: Dog Ownership in the United States, 2012 (percent of U.S. households)
Table 3-14: Dog Ownership in the United States: 2008, 2010 and 2012 (percent and number of U.S. Households)
Dog Household Demographics
Table 3-15: Demographics for Keeping Pet Dogs, 2012 (percent, number and index among U.S. households)
Dogs and the City
Figure 3-2: Top 25 Metro Area Share of Total U.S. Households vs.
Total Dog-Owning Households, Fall 2009 through Fall 2012 (percent)
Older Boomers, Seniors Are Keeping Pet Dogs at Higher Rates
Table 3-16: Dog Ownership Rates by Age 40+ Brackets: 2007 vs. 2012 (percent of U.S. households)
Keepers of the Pack: Multiple-Dog Demographics
Table 3-17: Demographic Overview for Selected Dog-Owning Classifications, 2012 (percent and index of U.S. households)
Retail Purchasing Patterns
Pet Stores Maintain Hold on Half of Household Pet Purchases
Table 3-18: Dog Owner Shopping for Pet Products by Retail Channel or Pet Superstore Chain: Total Purchasers and Sole
Purchasers, 2010-2012 (percent of U.S. dog-owning households)
Demographic Patterns by Retail Channel
Table 3-19: Pet Product Shopping Rates Among Dog Owners by Retail Channel, 2012 (percent of U.S. dog-owning households)
Table 3-20: Pet Product Shopping Indexes Among Dog Owners by Retail Channel, 2012 (indexes for U.S. dog-owning households)
Dog Food Purchasing Patterns
80% Buy Dog Biscuits/Treats
Figure 3-3: Dog Food Purchasing Rates by Type, 2007 vs. 2012 (percent of U.S. dog-owning households)
Table 3-21: Dog Food Cross-Purchasing Rates by Type, 2012 (percent of U.S. dog-owning households)
Minority, Lower Income Skews for Canned/Wet Dog Foods
Pet Food in the U.S., 10th Edition (From Issuu) Page 13/22
ReportLinker Find Industry reports, Company profilesand Market Statistics
>> Get this Report Now by email!
Table 3-22: Demographic Overview of Dog Food Purchasing by Type: Dry, Canned/Wet, and Treats/Snacks, 2012 (percent of U.S.
dog-owning households)
Regular Dry/Canned Food Formulations Grow in Usage
Table 3-23: Dog Food Purchasing Patterns by Type, 2007 vs. 2012 (percent of U.S. dog-owning households)
Single- vs. Multiple-Pet Patterns by Dog Food Type
Table 3-24: Dog Food Purchasing Patterns by Type: Single vs. Multiple Dog Owners, 2012 (percent and index)
Milk-Bone Is Most Widely Used Brand Line
Figure 3-4: Top Ten Dog Food/Treat Brand Lines by Overall Usage Rates, 2012 (percent of U.S. dog-owning households)
Store Brands Skew to Multiple-Dog Owners
Table 3-25: Purchasing Patterns for Leading Dog Food/Treat Brand Lines: Single vs. Multiple Dog Owners, 2012 (index)
Independent Pet Stores Are Partial Exception to Cross-Channel
Shopping Patterns
Table 3-26: Purchasing Patterns for Leading Dog Food/Treat Brand Lines: By Retail Channel Shopped, 2012 (percent)
Chapter 4 Highlights
Chapter 4: Cat Food
Introduction
Market Size and Composition
Total Cat Food Retail Sales, 2008-2017
Table 4-1: U.S. Retail Sales of Cat Food: 2008-2017 (in millions of dollars)
IRI-Tracked Dollar and Volume Sales
Table 4-2: IRI-Tracked Dollar and Volume Sales of Cat Food: January 2013 vs. January 2012 (in millions of dollars and pounds)
Table 4-3: Share of IRI-Tracked Sales of Cat Food by Segment: January 2013 (percent)
Table 4-4: IRI-Tracked Sales of Cat Food: 2008-2012 Compound Annual Growth Rates by Segment (percent)
Marketer and Brand Shares
Methodology
Nestlé Purina No. 1 in Cat Food Category
Table 4-5: Top Cat Food Marketers by Share of IRI-Tracked Sales of Cat Food and Total Pet Food, January 2012'January 2013
(percent)
Pet Food in the U.S., 10th Edition (From Issuu) Page 14/22

ReportLinker Find Industry reports, Company profilesand Market Statistics
>> Get this Report Now by email!
Iams, Ainsworth Heavily Leveraged in Dry Cat Food
Table 4-6: Share of Top Cat Food Marketers' IRI-Tracked Sales by Product Form, January 2012'January 2013 (percent)
Nestlé Purina Remains on Top in Wet Cat Food
Nestlé Purina Accounts for Over Half of Dry Cat Food Sales
Mars on Top in Cat Treats
Freshpet Dominates Refrigerated Cat Food Segment
Semi-moist Cat Food = Private Label
Top Cat Food Products
Pet Specialty Channel Marketer/Brand Cat Food Leaders
Table 4-7: Marketers and Brands of Wet Cat Food by IRI-Tracked Sales and Market Share: January 2012 vs. January 2013 (i millions
of dollars and percent)
Table 4-8: Marketers and Brands of Dry Cat Food by IRI-Tracked Sales and Market Share: January 2012 vs. January 2013 (in
millions of dollars and percent)
Table 4-9: Marketers and Brands of Cat Snacks/Beverages by IRITracked Sales and Market Share: January 2012 vs. January 2013
(in millions of dollars and percent)
Table 4-10: Top Cat Food Products by Dollar Gains/Losses in IRITracked Sales: January 2012 vs. January 2013 (in millions of
dollars)
Table 4-11: Cat Food Marketer/Brand Leaders in the Pet Specialty Channel by Percentage of Stores Citing Brand as No.1 Seller:
2007'2011
Marketing and New Product Trends
Cat Food Promotions: Beyond Commercials
Connecting Via Social Media
Illustration 4-1: Meow Mixer
Natural an Overarching Theme in New Product Intros
Corporate Responsibility a Plus
Ingredient Sourcing
Human-Grade
Illustration 4-2: The Honest Kitchen Grace Dehydrated Cat Food
Eco-Packaging
Grain-Free
Illustration 4-3: Natural Balance Alpha Cat
Meat-First
Illustration 4-4: Pronature Holistic Duck a L'Orange
Limited Ingredients
Illustration 4-5: Nature's Variety Instinct Grain-Free
100% Fish
Illustration 4-6: Petite Cuisine
Pet Food in the U.S., 10th Edition (From Issuu) Page 15/22

ReportLinker Find Industry reports, Company profilesand Market Statistics
>> Get this Report Now by email!
Raw Foods Make Headway in Cat Category
Raw/Frozen
Raw/Dehydrated
Illustration 4-7: Feline Natural Raw Freeze Dried Food
Illustration 4-8: Sojos Raw Freeze Dried Food
Illustration 4-9: Addiction Foods Wild Brushtail & Berries Entree
Functional and Special Diet Products
Illustration 4-10: Holistic Natural Treats
Hairball Relief, Urinary Health and Dental Care
Illustration 4-11: Zuke's G-Zees Treats
Illustration 4-12: Feline Greenies SmartBites
Senior and Kitten Formulas
Illustration 4-13: Iams ProActive Health Senior Plus
Indoor Cats
Canned/Wet Foods Focus on Gourmet Trends
Illustration 4-14: Evanger's Signature Series
Illustration 4-15: Natural Balance Platefulls
Illustration 4-16: Wellness Signature Selects
Breakfast Specials
Illustration 4-17: Fancy Feast Mornings and Friskies Rise & Shine
Innovative Cat Treats
Illustration 4-18: Pet Greens Freeze Dried Treats
Illustration 4-19: Lickety Stik Treats
Examples of Cat Food Advertising
Emphasis: Feeding Adventure
Illustration 4-20: Still from Purina One Cash Ad
Illustration 4-21: True Nature of Cats Facebook Page
Emphasis: Human-Animal Bond/Lifestyle
Illustration 4-22: Ziggy and Jake in Iams' Keep Love Strong Commercial
Emphasis: Meat First/Finicky Eaters
Illustration 4-23: Nutrisca Dry Cat Food Ad
Emphasis: Great Taste/Male Cat Owners
Illustration 4-24: Mars' Temptations "Cat Boots"
Emphasis: Cat Celebrities
Illustration 4-25: Grumpy Cat Friskies Commercial Still
Cat Ownership Trends and Demographics
Methodology
30 Million Households Keep Pet Cats
Pet Food in the U.S., 10th Edition (From Issuu) Page 16/22

ReportLinker Find Industry reports, Company profilesand Market Statistics
>> Get this Report Now by email!
Multiple Cat Household Numbers Bounce Back
Figure 4-1: Cat Ownership in the United States, 2012 (percent and number of U.S. households)
Table 4-12: Cat Ownership in the United States: 2008, 2010 and 2012 (percent and number of U.S. Households)
Younger Demographic Likely to Own Cats
Patterns by Number of Cats Owned
Table 4-13: Demographics for Keeping Pet Cats, 2012 (percent, number and index among U.S. households)
Table 4-14: Demographic Overview by Number of Cats Owned, 2012 (percent and index of U.S. households)
Retail Purchasing Patterns
Half of Cat Owners Shop Supermarkets for Pet Products
Table 4-15: Cat Owner Shopping for Pet Products by Retail Channel or Pet Superstore Chain: Total Purchasers and Sole Purchasers,
2010-2012 (percent of U.S. cat-owning households)
Demographic Patterns by Retail Channel
Table 4-16: Pet Product Shopping Rates Among Cat Owners by Retail Channel, 2012 (percent of U.S. cat-owning households)
Table 4-17: Pet Product Shopping Indexes Among Cat Owners by Retail Channel, 2012 (indexes for U.S. cat-owning households)
Cat Food Purchasing Patterns
Canned Food Is Stronger in Cat Arena
Figure 4-2: Cat Food Purchasing Rates by Type, 2007 vs. 2012 (percent of U.S. cat-owing households)
Table 4-18: Cat Food Cross-Purchasing Rates by Type, 2012 (percent of U.S. cat-owning households)
Demographics by Type of Cat Food
Table 4-19: Demographic Overview of Cat Food Purchasing by Type: Dry, Canned/Wet, and Treats/Snacks, 2012 (percent and index
of U.S. cat-owning households)
Uptick in Regular/Adult Cat Food Positioning
Table 4-20: Cat Food Purchasing Patterns by Type: 2007 vs. 2012 (percent of U.S. cat-owing households)
Multiple Cat Households, Supermarkets Skew to Canned/Wet Food
Table 4-21: Cat Food Purchasing Patterns by Type: Single vs.
Multiple Cat Owners, 2012 (percent and index)
Table 4-22: Cat Food Purchasing Rates by Type: By Retail Channels Shopped, 2012 (percent of U.S. cat-owning households)
Pet Food in the U.S., 10th Edition (From Issuu) Page 17/22

ReportLinker Find Industry reports, Company profilesand Market Statistics
>> Get this Report Now by email!
Friskies Is Most Widely Used Brand Line
Figure 4-3: Top Cat Food/Treat Brand Lines by Overall Usage Rates, 2012 (percent of U.S. cat-owing households)
Highest Skews Are for Multiple-Cat Owners
Table 4-23: Purchasing Patterns for Leading Cat Food/Treat Brand Lines: Single vs. Multiple Cat Owners, 2012 (percent and index)
Table 4-24: Purchasing Patterns for Leading Cat Food/Treat
Brand Lines: By Retail Channel Shopped, 2012 (percent)
Chapter 5 Highlights
Chapter 5: Other (Non-Dog/Cat) Pet Food
Introduction
Category Scope
Market Size and Growth
Other Pet Food Sales, 2008-2017
Table 5-1: U.S. Retail Sales of Other Pet Food: 2008-2017 (in millions of dollars)
Figure 5-1: Share of Sales of Other Pet Food by Animal Type: 2010 vs. 2012 (percent)
Illustration 5-1: Pets in the Classroom Website Home Page
IRI-Tracked Dollar and Unit Sales
Table 5-2: IRI-Tracked Dollar and Unit Sales of Other Pet Food: January 2012 vs. January 2013 (in millions of dollars and units)
Independent Pet Stores: Share of Sales by Animal Type
Table 5-3: Share of Independent Pet Store Sales by Animal Type: 2009-2011 (percent)
Fish Products: Share of Sales by Category
Bird Products: Share of Sales by Category
Table 5-4: Share of Independent Pet Store Sales of Fish Products by Category: 2009-2011 (percent)
Table 5-5: Share of Independent Pet Store Sales of Bird Products by Category: 2009-2011 (percent)
Herptile Products: Share of Sales by Category
Table 5-6: Share of Independent Pet Store Sales of Herptile Products by Category: 2009-2011 (percent)
Small Mammal Products: Share of Sales by Category
Table 5-7: Share of Independent Pet Store Sales of Small Mammal Products by Category: 2009-2011 (percent)
Share of Other Pet Food Sales by Retail Channel
Pet Food in the U.S., 10th Edition (From Issuu) Page 18/22
ReportLinker Find Industry reports, Company profilesand Market Statistics
>> Get this Report Now by email!
Figure 5-2: Share of U.S. Other Pet Food Sales by Retail Outlet Type: 2012 (percent)
Competitive Trends
Marketer Overview
Nestlé Purina Adding to Other Pet Offerings
Central Garden & Pet on Top in IRI-Tracked Outlets
Table 5-8: Marketers and Brands of Other Pet Food by IRITracked Sales and Market Share: January 2012 vs. January 2013 (in
millions of dollars and percent)
Central Garden & Pet Posts Biggest Dollar Gains
Table 5-9: Top Other Pet Food Products by Dollar Gains in IRITracked Sales: January 2012 vs. January 2013 (in millions of dollars)
Table 5-10: Other Pet Food Products by Dollar Losses in IRITracked Sales: January 2012 vs. January 2013 (in millions of dollars)
Tetra and Wardley Control Fish/Herptile Segment
Leading Pet Specialty Channel Brands
Table 5-11: Marketers and Brands of Fish/Herptile Food by IRITracked Sales and Market Share: January 2012 vs. January 2013 (in
millions of dollars and percent)
Table 5-12: Other Pet Food Brand Leaders in Pet Specialty Stores: 2009, 2010 and 2011 (percent)
Marketing and New Product Trends
Overriding Trends
New Product Thrusts
Trends in Bird Food
Functional/Fortified
Bird Treats
Illustration 5-2: Lefeber Avi-Cakes Fruit Delight
Blended and Extruded Foods
'Soak & Serve' Foods
Illustration 5-3: Roudybush Soak & Serve
Trends in Small Animal Food
Functional/Fortified
Illustration 5-4: Supreme Pet Foods FibaFirst
Ingredient Sourcing
Trends in Fish Food
Functional Foods
Fresh and Live Foods
Pet Food in the U.S., 10th Edition (From Issuu) Page 19/22

ReportLinker Find Industry reports, Company profilesand Market Statistics
>> Get this Report Now by email!
Environmental Responsibility
Illustration 5-5: Ocean Nutrition Betta Food
Trends in Herptile Food
Table 5-13: Bird, Small Animal, Fish and Herptile Food: Selected New Product Introductions, May 2011 ' May 2013
Examples of Other Pet Food Advertising
Emphasis: New Packaging/Product Format
Illustration 5-6: Kaytee New Packaging Design
Illustration 5-7: Reef Munchies New Format
Emphasis: Fish Health/Water Clarity
Illustration 5-8: TetraMin Clean Water Ad
Emphasis: Ingredient Sourcing
Illustration 5-9: OmegaSea Website Banner
Illustration 5-10: Vitakraft Website
Illustration 5-11: Purina Website Banner
Emphasis: Dietary Systems
Illustration 5-12: Piscene Enterprises Pet Age Ad
Illustration 5-13: Oxbow Website Banner
Emphasis: Scientific Research
Illustration 5-14: Timberline Vita-Bugs Pet Age Ad
Empha
Pet Food in the U.S., 10th Edition (From Issuu) Page 20/22
ReportLinker Find Industry reports, Company profilesand Market Statistics
>> Get this Report Now by email!Fax Order Form To place an order via fax simply print this form, fill in the information below and fax the completed form to:
Europe, Middle East and Africa : + 33 4 37 37 15 56 Asia, Oceania and America : + 1 (805) 617 17 93
If you have any questions please visit http://www.reportlinker.com/notify/contact Order Information Please verify that the product information is correct and select the format(s) you require.
Product Formats Please select the product formats and the quantity you require.
Contact Information Please enter all the information below in BLOCK CAPITALS Title: Mr Mrs Dr Miss Ms Prof First Name: _____________________________ Last Name: __________________________________ Email Address: __________________________________________________________________________ Job Title: __________________________________________________________________________ Organization: __________________________________________________________________________ Address: __________________________________________________________________________ City: __________________________________________________________________________ Postal / Zip Code: __________________________________________________________________________ Country: __________________________________________________________________________ Phone Number: __________________________________________________________________________ Fax Number: __________________________________________________________________________
Pet Food in the U.S., 10th Edition
1 User License--USD 4 500.00 Quantity: _____
Department License--USD 6 750.00 Quantity: _____
Corporate License--USD 9 000.00 Quantity: _____
Pet Food in the U.S., 10th Edition (From Issuu) Page 21/22
ReportLinker Find Industry reports, Company profilesand Market Statistics
>> Get this Report Now by email!Payment Information Please indicate the payment method, you would like to use by selecting the appropriate box.
Payment by credit card
Card Number: ______________________________________________ Expiry Date __________ / _________ CVV Number _____________________ Card Type (ex: Visa, Amex…) _________________________________
Payment by wire transfer
Crédit Mutuel
RIB : 10278 07314 00020257701 89
BIC : CMCIFR2A
IBAN : FR76 1027 8073 1400 0202 5770 189
Payment by check
UBIQUICK SAS 16 rue Grenette – 69002 LYON, FRANCE
Please note that by ordering from Reportlinker you are agreeing to our Terms and Conditions at
http://www.reportlinker.com/index/terms
Please fax this form to:
Europe, Middle East and Africa : + 33 4 37 37 15 56
Asia, Oceania and America : + 1 (805) 617 17 93
Customer signature:
Pet Food in the U.S., 10th Edition (From Issuu) Page 22/22