Peruvian Privatization: Impacts on Firm Performance · over time. While the impact of privatization...
75
Inter-American Development Bank Banco Interamericano de Desarrollo Latin American Research Network Red de Centros de Investigación Research Network Working Paper #R-481 Peruvian Privatization: Impacts on Firm Performance BY Máximo Torero December 2003
Transcript of Peruvian Privatization: Impacts on Firm Performance · over time. While the impact of privatization...

Inter-American Development Bank Banco Interamericano de Desarrollo Latin American Research Network Red de Centros de Investigación
Research Network Working Paper #R-481
Peruvian Privatization: Impacts on Firm
Performance
BY
Máximo Torero
December 2003

Cataloging-in-Publication data provided by the Inter-American Development Bank Felipe Herrera Library Torero Cullen, Máximo.
Peruvian privatization : impacts on firm performance / by Máximo Torero.
p. cm. (Research Network Working papers ; R-481) Includes bibliographical references. 1. Privatization--Peru--Evaluation. 2. Employment (Economic theory)—Effect of
Privatization on. I. Inter-American Development Bank. Research Dept. II. Latin American Research Network. III. Title. IV. Series.
338.61 T72--dc21 ©2003 Inter-American Development Bank 1300 New York Avenue, N.W. Washington, DC 20577 The views and interpretations in this document are those of the authors and should not be attributed to the Inter-American Development Bank, or to any individual acting on its behalf.
This paper is part of the Latin American Research Network project “Costs and Benefits of Privatization in Latin America.” The terms of reference for the project can be found on the internet at: http://www.iadb.org/res/laresnetwork/studies/st70tor.pdf
The Research Department (RES) produces a quarterly newsletter, IDEA (Ideas for Development in the Americas), as well as working papers and books on diverse economic issues. To obtain a complete list of RES publications, and read or download them please visit our web site at: http://www.iadb.org/res
2

Abstract∗
In the nearly ten years since Peru privatized major State Owned Enterprises (SOEs), the overall impact of the process is not yet clear. This paper analyzes the impact of privatization through a detailed statistical and econometric analysis of first difference (the difference between pre- and post-privatization performance), and second difference (change in performance of privatized firms relative to the change in performance of SOEs) of several indicators on profitability, operating efficiency, employment, leverage and convergence. The results, which showed that privately owned firms are more efficient and more profitable than otherwise comparable state owned firms, were consistent with previous literature. In the case of the most competitive sector, the financial system, the newly privatized banks converged towards the leading private banks over time. While the impact of privatization on employment is negative in the short-run, there are more positive impacts in the long term, especially since SOEs traditionally hire employees for political rather than technical reasons. This paper demonstrates that, as the result of privatization, there is a significant increase in indirect employment through services and significant growth of total employment—both direct and indirect.
JEL: L970, L960, L950, L500, L430, D600
Key Words: Privatization, firm performance, and regulation.
∗ Máximo Torero is a Senior Researcher at Grupo de Análisis para el Desarrollo. This paper has been prepared for the project “Costs and Benefits of Privatization in Latin America” of the Inter-American Development Bank’s Latin American Research Network. Dean Hyslop gave valuable advice on the econometric analysis of these results and Florencio López-de-Silanes, Alberto Chong, Alberto Pascó-Font and all the participants in the IDB Research Network on Costs and Benefits of Privatization offered numerous and helpful comments. The author is also indebted to the enormous effort and support of Virgilio Galdo throughout this project, as well as to his remarkably talented team of research assistants: Daniel Oda, Jorge de la Roca, Gissele Gajate and Linette Lecussan. Finally, the author thanks the Comisión de Promoción de la Inversión Privada (COPRI) for granting access to the White Books of all the privatized firms. Send correspondence to [email protected].
3

1. Introduction In the last two decades, countries around the world have embarked on major privatization
programs, yet many remain reluctant to privatize while still more have had to halt ongoing
processes of privatization. This is particularly true in developing countries, where State-
Owned Enterprises (SOE) still account for more than 10 percent of gross domestic product,
20 percent of investment and about five percent of formal employment (Kikeri, Nellis, and
Shirley, 1994). The aversion to privatization appears to be associated with public distrust of
the privatization process. Unions and other traditional opponents of privatization have argued
that it results in layoffs and poorer services. Political leaders, meanwhile, fear that the higher
profitability of private companies comes at the expense of the rest of society, especially
during the difficult transition period from state ownership to private ownership.
The transfer from the public to the private sector (Vickers and Yarrow, 1988)
necessarily implies a change in the relationships between those responsible for the firm’s
decisions and the beneficiaries of the profit flows (the social view and the agency view). In
general, the transfer of property rights leads to a different structure of management
incentives, causing changes in managerial behavior, company performance, and quality of
service in terms of access and use, but in the words of Jean-Jacques Laffont and Jean Tirole
(1993), “theory alone is thus unlikely to be conclusive in this respect.” Empirical work, then,
is crucial.
Nevertheless, there is still little empirical knowledge about how well privatization has
worked. There are difficult methodological problems as well as special problems with data
availability and consistency. Furthermore, the possibility of sample selection bias can arise
from several sources, including a government’s desire to sugarcoat the process by privatizing
the healthiest firms first. Megginson and Netter (2001) carried out a very detailed review of
22 studies on non-transitional economies and concluded that Galal, Jones, Tandon, and
Vogelsang (1994), La Porta and López-de-Silanes (1999), and the studies summarized in
D’Souza and Megginson (1999) are the most solid and persuasive supporting the proposition
that privatization improves the operating and financial performance of firms. The author
considers La Porta and López-de-Silanes (1999) the finest study of an individual country,
since it examines nearly the entire universe of Mexican privatizations.
These studies, especially La Porta and López-de-Silanes (1999), investigate whether
companies increase profits after privatization, whether privatization inflicts significant social
losses, and, if so, through which channels. They conclude that the improved performance of
4
privatized firms is the result of significant restructuring efforts, not of market power
exploitation, or massive layoffs and lower wages. In other words, firms undergo a harsh
restructuring process following privatization and do not simply mark up prices and lower
wages, as many economists have predicted. Deregulation, particularly the removal of
price/quantity controls and trade barriers, is associated with faster convergence to industry
benchmarks. The author suggests that the additional revenues and increased tax revenues the
government receives from privatizations are probably enough to offset the cost of job losses
to society.
Newly-privatized firms cut employment, usually reducing the roll of white and blue-
collar workers by nearly half. These numbers may actually underestimate the effects of
privatization, since in the years before, most companies have already trimmed payrolls in
order to prepare for divestiture. These findings suggest that transfers from workers to
shareholders play a role in the success of privatization. However, productivity gains resulted
in large real wage increases of 114 percent in the post-privatization period.
La Porta and López-de-Silanes showed, for example, that privatized firms increased
sales 54.3 percent, despite workforce reductions and only modest increases in capital.
Surprisingly, prices rose only 2.9 percent relative to the Producer Price Index. La Porta and
López-de-Silanes also decomposed reported increases in profitability. Approximately 10
percent of the gain in profits was attributable to higher prices and 33 percent to worker
layoffs, while productivity gains accounted for the remaining 57 percent. Some of the social
effects of higher prices and layoffs were offset by corporate taxes, which absorbed slightly
more than half of the gains in operating income.
In this study, the author follows a similar approach to La Porta and Lopez-de-Silanes
(1999) by collecting information on nearly the entire population of privatized firms in order
to evaluate the impact of Peruvian privatization. The author then compares the performance
of those firms with the remaining SOEs and, when possible, with industry-matched private
firms. Through this method, the impact of privatization on profitability ratios, operating
efficiency ratios, labor indicators, and capital deepening indicators is analyzed. Even though
the ultimate effect of changes in management incentives depends on the competitive and
regulatory environment in which a given firm operates, it is argued that the degree of market
competition and the effectiveness of regulatory policy has more important effects on
performance than does change of ownership (Vickers and Yarrow, 1988). This is extremely
important in the case of the Peruvian privatization process because it was accompanied by
large-scale sectoral reforms in which competitive structures and independent regulatory
5

agencies were established to monitor and promote competition in each sector. Therefore,
variables needed to identify the roles played by the regulatory agencies and the competitive
forces that determine firm performance (existence of a regulatory framework, autonomy of
the regulatory agency, etc), are taken into account in the analysis.
Peru’s privatization experience was rated one of the early success stories in Latin
America. The privatization process, begun by then-President Alberto Fujimori, was launched
as part of a rigorous process of stabilization and structural reform initiated in response to the
crisis in the Peruvian economy. At the time, inflation had reached an annualized rate of
36,000 percent, and per capita income had dropped to its lowest level in 30 years. Though
privatization was not part of the initial set of reforms, it soon became a central plank of the
overall reform program.
By 2001, the privatization process involved 252 transactions, including 42 SOEs,
brought US$9.2 billion in revenue (including capitalization) to the Treasury, and mobilized
an additional US$11.4 billion in new investments. Nevertheless, Peru’s considerable success
in attracting private participation and capital focused on a few sectors such as telecoms,
electricity, banking, hydrocarbons and mining. Unlike some countries, such as Argentina and
Bolivia, there has been virtually no private participation in the transportation, water, or
sanitation sectors. Furthermore, as is the case in other countries, public support for
privatization has been declining steadily—from 65 percent in May 1992 to less than 25
percent by 2000. This decline has practically brought the privatization process to a halt.
Written during a period of anti-privatization sentiment, this report is of special importance
because it aims to analyze empirically the impact on performance of privatized SOEs.
The study is organized as follows. After the introduction, the second section reviews
the privatization process and its principal results. The third section summarizes the empirical
methodology followed by the author, and the fourth section details the database they
developed. The fifth section presents calculations of the differences in pre- and post-
privatization performance, difference in difference comparisons for which control groups
were developed, and a panel data regression analysis of the static and dynamic performance
of privatized firms relative to SOEs. The final section offers the authors’ conclusions.
2. The Privatization Process At the beginning of 1990, Peru faced its worst macroeconomic situation ever (see Table 1).
The country had never experienced such large and prolonged periods of inflation and
recession. The economic model implemented in response to the crisis assigned the state a
6
central role in economic policy-making. The policies adopted by the government were not up
to the challenge at hand: public expenditure and public internal credit rose impressively, price
controls and subsidies were established, tariffs on public services were fixed, and exchange
rate controls were set. These policies translated into a persistent fiscal imbalance and a
considerable drop in tax revenues. In addition, the country faced a high underemployment
rate and a striking decline in financial intermediation.1
The macroeconomic crisis affected Peru’s poorest citizens, around 43 percent of the
1990 population, most of all. The situation worsened as public services, such as education
and health, deteriorated. Additionally, the end of the decade saw an increase in informal
economic activity, delinquency, drug trafficking and terrorism. Furthermore, in 1990, Peru
reached record underemployment (86.4 percent), while unemployment was around 8.3
percent and formal employment barely reached 5.3 percent.2
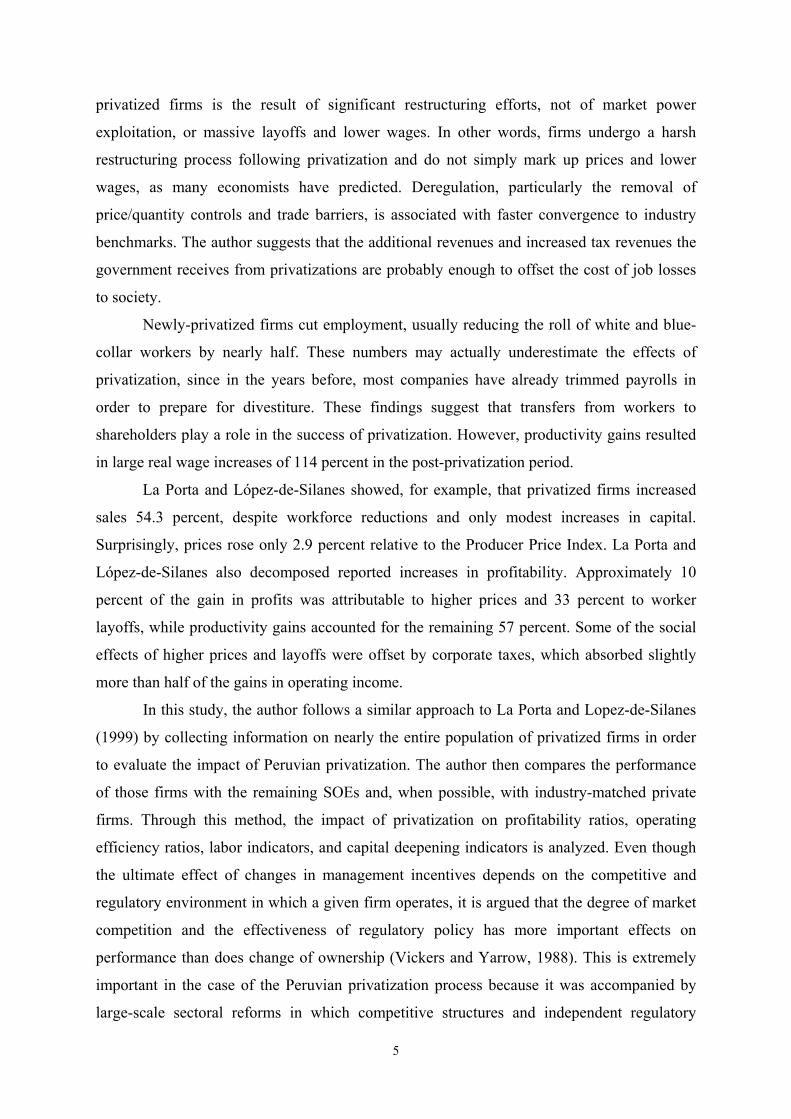
Table 1. Main Macroeconomic Indicators
% Change in GDP(at Constant Prices)
Annual Inflation(% )
Annual Inflation(% )
Depreciation of theReal Effective
Exchange Rate1987-1992 1987-1992 1990 (% )
-4.9 733.1 7,649.60 -2.04
Source: Crisis and Reform in Latin America; Sebastian Edwards (W orld Bank).
In this context, public enterprises were characterized by inefficient provision of goods and
services, ambiguous objectives, extensive intervention by politicians, decapitalization of
investment resources, and a lack of fresh investment resources. Not surprisingly, then, public
firms registered accumulated losses of more than US$4 billion in 1989-1990.3 In an effort to
reverse this situation, the Peruvian government decided to design an attractive normative and
institutional framework for the purpose of promoting private investment as the main vehicle
of economic growth. One of the key aspects of this new framework was a program to
privatize public sector companies in 1991.
In February 1991, the privatization process was launched with the enactment of
Supreme Decree (SD) 041, which regulated and restructured the managerial activity of the
State, even though the State was limited to managing no more than 23 companies. In
1 According to Apoyo (2002), during the second semester of 1985 the amount of banking deposits reached 23 percent of GNP, while the same ratio fell to 5 percent in May 1990. Also, a similar drop occurred in the net internal credit of the banking system to the private sector (interest rates rose between 200 and 400 percent annually in real terms). 2 These figures are for the Lima metropolitan area. Source: Perú en Números 1991, Cuánto S.A. 3 Apoyo (2002).
7

November 1991, the government extended more active and decisive support for the
privatization process by enacting Legislative Decree (LD) 674, also known as the Promotion
of Private Investment in State Companies. LD674 introduced the Commission for the
Promotion of Private Investment (COPRI) and the Special Privatization Committees
(CEPRIs), as well as private investment promotion schemes, which included sales of stocks
and assets, service provision, concessions, and other items. In order to give more dynamic
and political support to the process, President Fujimori appointed five state ministers to lead
COPRI. These ministers were in charge of the general management of the privatization
process; they had to establish the policies and objectives of the process, appoint CEPRIs to
particular processes, and approve the most important decisions. CEPRIs were put in charge of
the planning and execution of individual privatization processes.
One of the most important laws enacted was LD662, or the “Law of Foreign
Investment Promotion,” which mandated equal treatment of national and foreign capital. This
law permitted foreign investment in all economic sectors and its execution through any legal
administrative means.
Diverse laws were then instituted in 1992 to facilitate the privatization process. The
State was authorized to grant the safeties and guarantees necessary to protect foreign
acquisitions and investments. Foreign investors were also granted facilities for the payment
of taxes and debts owed by SOEs in the privatization process. In some cases, these
commitments were suspended until the end of the process.
In 1993, all of these reforms were written into law with the approval of the new
Political Constitution. The new Constitution included the promotion of free private initiative,
the establishment of equality between national and foreign investors, the encouragement of
competition and equal treatment for all economic activities, and the guarantee of the
possibility of the signing of Stability Agreements between private investors and the State. In
addition, the State subscribed to many International Agreements for the protection of foreign
investment and conflict solution through international arbiters.
Together with the launching of the privatization program, the government undertook
another set of structural reforms. Through these reforms, the government promoted market-
based competition and free international trade, installed policies to create a more flexible
labor market, liberalized the financial system, eliminated price controls, and implemented
sector reforms for the deregulation of markets. All the reforms carried out were
complementary and necessary to the privatization program. In so doing, the government
recognized that adequate regulatory and institutional frameworks and a competitive market
8

for the product, and not just ownership, were determining factors in the success of the
privatization process.
Peru’s privatization scheme began in earnest between the months of November 1991
and February 1992. Its main objective was simple: privatize as many public companies as
quickly as possible. The initial tasks carried out were defining privatization methods,
prioritizing the public enterprises to be privatized (which depended on their importance and
the ease with which they could be privatized), and creating the CEPRIs.4 The most common
practice adopted for privatization was the public auction, due to its transparent and
competitive scheme.
In the following years, the design of an appropriate juridical-legal framework for the
development of private investment continued. One particularly important law provided for
the regulation of immigration applications and facilitated the nationalization of foreign
citizens who wanted to provide capital and invest in Peru.
The results of the privatization process were outstanding. Beyond the simple transfer
of assets, companies were purchased and significant amounts of investment were committed
(see Table 2 for details). In 1991, two public companies were privatized (Sogewiese Leasing
and Buenaventura Mine). In 1992, under an operational COPRI and various CEPRIS, ten
SOEs were privatized, drawing in revenues of US$208 millions and US$706 million in
projected investment. In 1993, the process gathered momentum and 13 companies were
privatized for a total of US$317 million and projected investment of US$589 million. The
next year the government sold its natural monopolies in the telecommunications and
electricity sectors, which resulted in US$2,579 million in revenues collected and a total
amount of US$2,050 million of projected investments.
4 In February 1992, the first 26 CEPRIs initiated their operations.
9

Table 2 Privatization Amounts ($ Millions)
TRANSACTIONS
YEAR Sale of Shares/ Assets
Concessions Options Rights/ Small Assets /
Other Capitalizations Total
Projected Investment
1991 2.6 2.6 1992 207.5 1.4 208.9 706.0 1993 316.7 20.7 6.5 343.9 589.3 1994 2579.2 4.7 610.8 3194.7 2050.0 1995 1089.0 6.6 9.1 120.1 1224.8 70.1 1996 2281.8 344.2 2.7 40.0 2668.7 2695.0 1997 447.1 99 8.8 126.4 681.3 706.2 1998 251.8 35.1 5.2 292.1 220.6 1999 286.3 10.9 3.1 300.3 166.6 Total 7462.0 516.5 41.5 897.3 8917.3 7203.8
Source: Commission for the Promotion of Private Investment (COPRI). During 1995 and 1996, the privatization process accelerated and deepened. Sixty-four
companies were privatized, producing revenue of US$3,370 million and investment
commitments of US$2,765 million. This continued in 1997 when 25 more companies were
transferred for US$447 million and projected investments of US$706 million. In 1998, the
privatization process made way for the concessionary process of transportation
infrastructure.5 CEPRIs were created for the concession of airports, ports, road networks, and
mobile telephone bands, among other facilities.
Between 1991 and 2001, Peru’s privatization and concessionary processes generated
revenues totaling US$9.5 billion (including capitalizations) and investment commitments of
approximately US$11.45 billion. Graph 1 shows the evolution of the privatization process
and the timeline for the transfer of nearly all public enterprises over the last 10 years. Graph 2
shows the revenues of the privatization process outlined by sector and company.6 In regard to
privatization practices, a total of 203 operations were carried out, representing US$7.85
billion of revenues and US$6.4 billion of investment commitments. Concessions raised
US$726 million and US$4.60 billion, respectively.
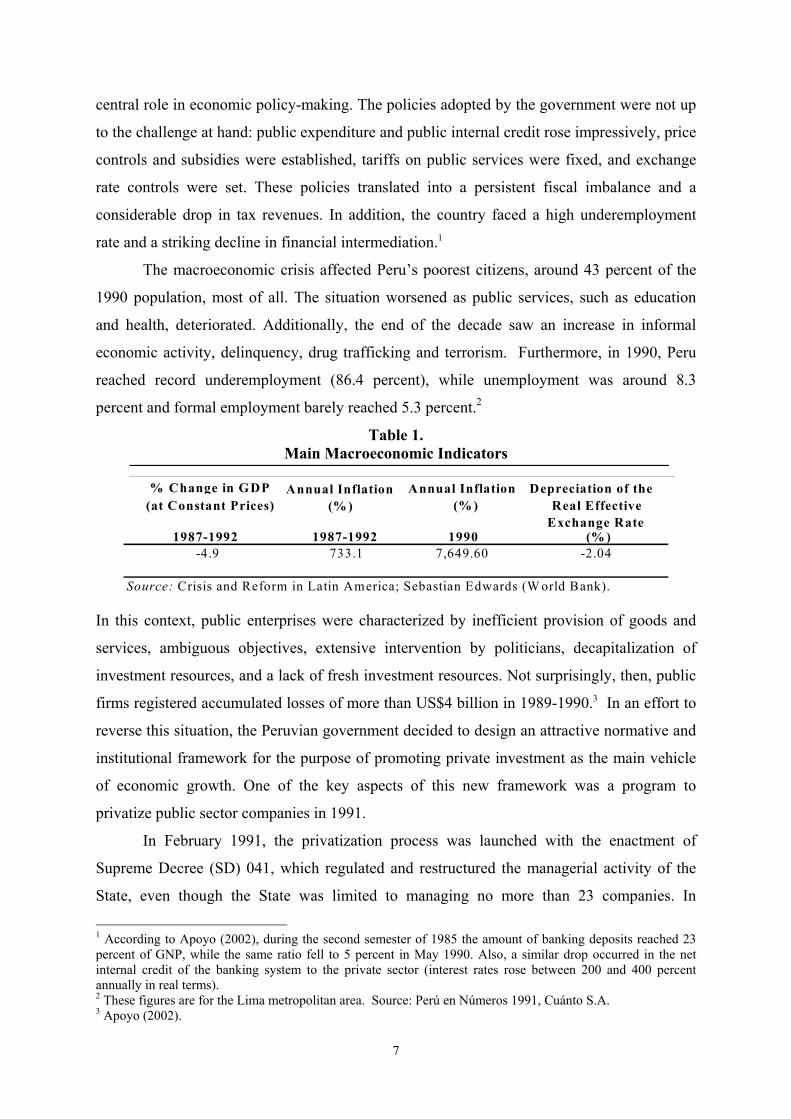
Most of the privatization process occurred in the telecommunications, electricity,
finance, mining and hydrocarbons sectors. Graph 3 shows how much privatization occurred
5 This meant the creation of PROMCEPRI (Comission for the Promotion of Private Concessions) in 1997, which was later absorbed by COPRI. 6 The slowdown between 1997 and 2000 is attributable to domestic and foreign factors: namely, the Russian crisis, “El Niño,” the Peruvian political crisis, and others.
10

in each of the various sectors. Telecommunications and finance are already entirely
privatized. In fact, telecommunications, electricity, finance and mining represent more than
75 percent of revenues collected by the Peruvian government. Nevertheless, to the present
there has been virtually no private participation in the transportation, water, or sanitation
sectors, and there are still sectors, such as agriculture, where much remains unprivatized.
11

Graph 1 Evolution of the Privatization Process
0%
5%
10%
15%
20%
25%
30%
35%
40%
1991 1992 1993 1994 1995 1996 1997 1998 1999 2000*
Number of Projects (%)Sales of Shares /Assets (%)Projected Investment (%)
* Through June 30th. Source: COPRI.
Graph 2 Privatization Revenues By Sector ($ Millions)
0 500 1.000 1.500 2.000 2.500 3.000 3.500 4.000 4.500 5.000
Other
Agriculture
Tourism
Transport
Fishery
Financing
Industry
Hydrocarbon
Mining
Electricity
Telecommunications
Projected Investment Transactions
Source: COPRI.
12
Graph 3
Privatization Process Progress (1991-2000)
0% 10% 20% 30% 40% 50% 60% 70% 80% 90% 100%
Other
Agriculture
Financing
Industry
Hydrocarbon
Mining
Electricity
Telecommunications
Source: COPRI.
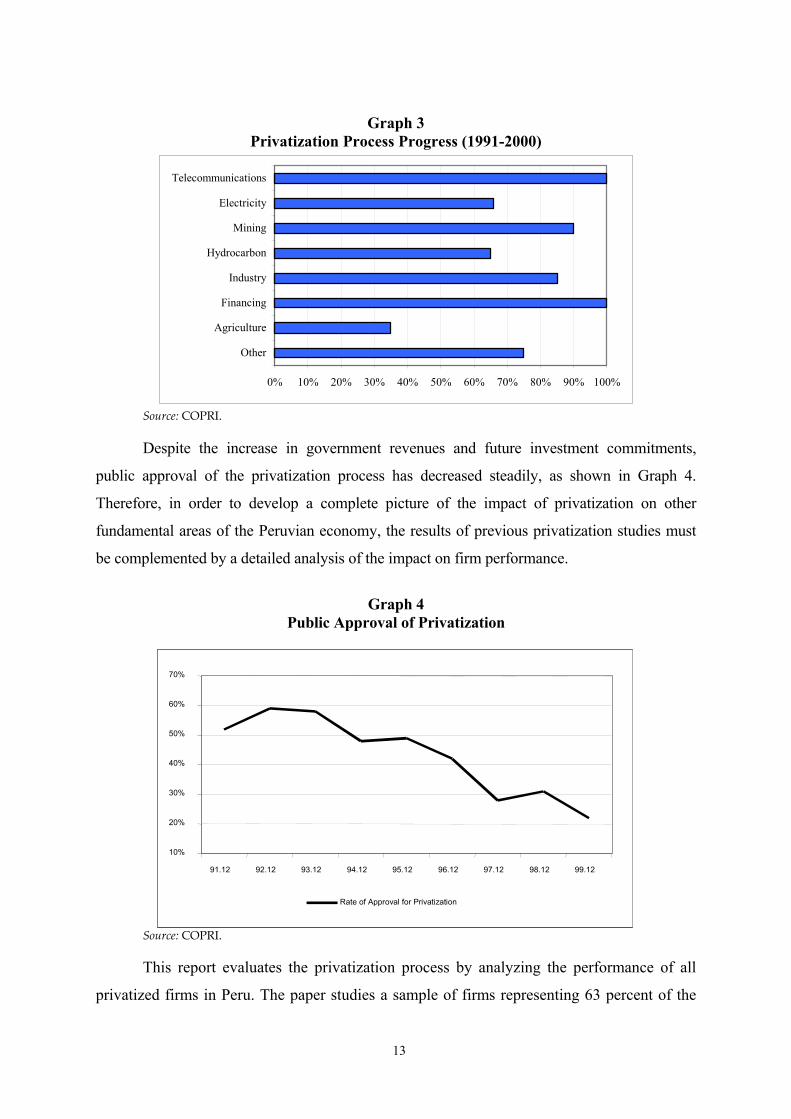
Despite the increase in government revenues and future investment commitments,
public approval of the privatization process has decreased steadily, as shown in Graph 4.
Therefore, in order to develop a complete picture of the impact of privatization on other
fundamental areas of the Peruvian economy, the results of previous privatization studies must
be complemented by a detailed analysis of the impact on firm performance.
Graph 4
Public Approval of Privatization
10%
20%
30%
40%
50%
60%
70%
91.12 92.12 93.12 94.12 95.12 96.12 97.12 98.12 99.12
Rate of Approval of P i ti ti
10%
20%
30%
40%
50%
60%
70%
91.12 92.12 93.12 94.12 95.12 96.12 97.12 98.12 99.12
Rate of Approval for Privatization
Source: COPRI.
This report evaluates the privatization process by analyzing the performance of all
privatized firms in Peru. The paper studies a sample of firms representing 63 percent of the
13

privatized SOEs and 91 percent of the transactions involved in the privatization process. In
addition, this study analyzes in detail the three sectors where most of the privatization took
place: telecommunications, electricity, and financial services. Those three sectors accounted
for 80 percent of the total revenue collected during the privatization process.
In the telecom sector, the Peruvian government sold both Compañía Peruana de
Teléfonos (CPT) and Empresa Nacional de Telecomunicaciones (ENTEL). CPT provided
basic telecommunication services in the Lima area, and ENTEL provided national and
international long distance services, as well as local service for the rest of Peru. Divestiture
took place in 1994 after an auction to the highest bidder. Using a first-price sealed bid
mechanism, approximately 35 percent of CPT and ENTEL common shares (the minimum
required to give the buyer control of the merger) were sold to Spain’s Telefónica de España.7
The results of the auction were impressive: Telefónica paid $2.004 million, far larger than the
second highest bid of $800 million—a bid that was closer to the base price set by the
government. Soon after buying both companies, Telefónica de España S.A. merged them and
created Telefónica del Perú S.A. (TdP). Initially, TdP was granted a five-year national
monopoly for the provision of lines, local calls, national long distance (NLD) and
international long distance (ILD) throughout the country.8 Simultaneously, the government
created the Supervisory Agency for Private Investment in Telecommunications (OSIPTEL).
The privatization of CPT and ENTEL (now TdP) continued over the following years.
In 1996, 65 percent of the company’s shares were divided between minor shareholders (36.3
percent) and the Peruvian government (28.7 percent). The latter decided to sell 26.6 percent
of its shares to small individual investors through a process known as Sistema de
Participación Ciudadana (Citizen Participation System). In total, privatization in the telecom
sector raised US$3.6 billion in revenues and US$1.56 billion in investment commitments for
the government.
For the electricity sector, the government approved in 1992 the Law of Electric
Concessions (DL 25844), which split power generation from electricity distribution and
transmission. Power generation is a market open to competition, whereas transmission and
distribution are usually considered natural monopolies. Between 1994 and 1997, the
government privatized ten SOEs (five in distribution and five in generation) for a total of
US$1.43 billion. There was also a significant investment commitment to increase the total 7 Telefonica was no stranger to the acquisition of Latin American telecom providers, having already bought the former Teléfonos de Chile, currently known as CTC, and Argentina’s ENTEL.
14

capacity of the privatized generation companies by 560 MW. At present, the privatized
companies represent 64 percent of the total power generation capacity of the National
Electric System and 79 percent of the distribution service.
The government also created two regulatory bodies for the electricity sector: the
Supervisory Agency for Private Investment in Energy (OSINERG), and the Commission of
Energy Tariffs (CTE), which was absorbed later by OSINERG. The privatization process in
this sector is not yet concluded because one of the south’s major generating enterprises,
Central Hidroelectrica del Mantaro, and all of the region’s distribution enterprises are not yet
privatized. However, although the privatization is incomplete, the electric sector has become
the second largest generator of revenues and investment commitments for the State: US$2.33
billion in revenue has been collected and US$716 million in investment commitments have
been promised.
Water and sanitation is the only public utility where no privatization has occurred.
Perhaps the only exception was the concession to the Italian Company Impregilo to operate
wells and a water treatment plant in the river Chillón basin to sell water to the Lima water
company. However, the government sought to improve the organization and management of
the system by decentralizing it. This new reform gave municipalities control over water
services. The only exception was the most important municipal water service, Empresa de
Servicio de Agua Potable y Alcantarillado de Lima (SEDAPAL), which remains a state
company. SEDAPAL was the only water-service provider included in the privatization
program, but it has yet to be privatized. Despite this, the government has tried to improve
SEDAPAL’s services and coverage. Additionally, in 1992 the government created the
Superintendencia Nacional de Servicios de Saneamiento (SUNASS), the National Office for
Services of Sanitation, as the regulatory body for this sector. SUNASS is responsible for
controlling the quality of the service provided, the tariff system and regulation, as well as
intersector coordination, establishment of norms for the execution of investment plans and
supervision of those plans.
With respect to the financial sector, on July 20, 1994, 99.86 percent of the
government’s shares in Interbanc were auctioned. The winner was a Consortium formed by
International Financial Holding (Gran Caiman) and IFH Peru S.A., with the advice of Banco
Osorno and La Union (Chile), for US$51 million (workers paid US$4.83 million for a total of
9.46 percent of the bank’s shares). Interbanc branches Financiera Peruana (Interfip), 8 Although the monopoly was initially scheduled to expire in June 1999, the TdP moved the expiration forward to August, 1st, 1998.
15

Internacional de Inmuebles and Empresas de Servicios Internacionales (Interserv) were also
included.
Finally, on April 18, 1995, 60 percent of the shares of Banco Continental were
awarded to the Consortium formed by Banco Bilbao Vizcaya (Spain) and the companies
Inversiones Breca, Inversiones San Borja, Urbanizadora Jardin and Minsur (all belonging to
the Brescia Group). In August 1995, in agreement with the Share Purchase Sale Contract of
Banco Continental, 15,325,388 shares belonging to the State were transferred to Holding
Continental S.A for US$32 million.9 By July 21, 1998, the Peruvian government had
managed to sell 19 percent of its remaining shares on the international and local markets.
3. Methodology The analysis conducted in this paper determines, from a firm’s perspective, whether the
privatization of SOEs in Peru and other developing countries is desirable in terms of the
performance of newly privatized firms. Following Boubakri and Cosset (1998), the paper tries
to determine whether firms improve their performance after privatization. Firm performance
was measured by profitability, operating efficiency, capital expenditures, output, employment
and leverage. The following list, taken from Megginson, Nash and van Randerborgh (1994),
shows details on the proxies for these performance measures as well as the predicted
relationships.
Proxies Predicted RelationshipP(1) Profitability Return on Sales (ROS)=Net Income / Sales ROS A >ROS B
Return on Assets (ROA) = Net Income/ Total ROA A >ROA B Return on Equity (ROE) = Net Income/ Equity ROE A >ROE B
P(2) Operating Sales Efficiency (SALEFF)= Sales/Number of Employees SALEFF A >SALEFFBNet Income Efficiency (NIEFF)=Net Income/Number of Employees NIEFF A >NIEFF B
P(3) Capital Investment Capital Expenditure to Sales (CESA)= Capital Expenditures/Sales CESA A >CESA B Capital Expenditure to Assets (CETA)=Capital Expenditures/Total Assets CETA A >CETA B
P(4) Output Real Sales (SAL)=Nominal Sales/Consumer Price SAL A ? SAL B P(5) Employment Total Employment (EMPL)= Total Number of Employees EMPL A <EMPL B P(6) Leverage Debt to Assets (LEV)=Total Debt/Total Assets LEV A <LEV B
Long Term Debt to Equity (LEV2)=Long Term Debt/Equity LEV2 A <LEV2 B
Performance Measure
9 This transaction corresponds to the shares not purchased by the workers of Banco Continental and Subsidiaries as part of their preferential right conferred by LD 674. In agreement with the contract, these shares had to be purchased by Holding Continental S.A. at the auction price. The reception of the duly subscribed share purchase sale contracts concluded on July 10. A total of 1,178 employees practiced their preferential right, acquiring a total 2,115,700 shares as follows: 379,667 shares were paid in cash for S/.1.8 million, and 1,736,033 shares were acquired through sales with installment credits for S/.8.2 million at an effective annual interest rate of 10.03 percent.
16

Based on these performance measures for most of the firms privatized or awarded in
concession, the empirical approach consisted of two stages. In the first stage, a simple statistical
analysis was executed to study the post-privatization changes in firms’ performance. In the
second approach, a regression analysis was performed controlling most of the differences
between firms and variables, other than privatization, that could explain the performance of the
firm.
The statistical analysis consisted of computing the performance variables for each
company for a fifteen-year period (1986-2000). Secondly, the means for each performance
variable (Y) for the pre-privatization and post-privatization periods were computed.
Furthermore, to avoid any bias resulting from a pre-privatization restructuring of the firm, all
years prior to the divestiture in which restructuring took place were excluded.10 After the means
were calculated, using differences from the sample counterpart of the privatization effect and
the performance variables, the following was obtained:
][ zationpreprivatiizationpostrpivat YYY −=∆ (1)
The two-tailed Wilcoxon signed-rank test and the Hotelling test are then used to test
for significant changes in performance variables after privatization. Nevertheless, both tests
are based on the assumption that the distributions are normal. If the sample size is small and
the true distribution of differences is far from normal, the stated probability levels may be
significantly in error. Specifically, when looking at each individual firm, the central limit
theorem can not be applied since the sample of years for each is small. For that reason, it is
necessary to verify the normality of the series. Therefore, the Shapiro-Francia test for
normality is used.
When the Shapiro-Francia test rejects the null hypothesis of normality, a non-
parametric test, the Kolmogorov-Smirnov (K-S) statistic, is used to formally test the equality
of the empirical hazards functions of the different pre- and post-privatization performance
indicators.11
10 The privatization year is the date on which the government sold, for the first time, a certain amount of shares. 11 The test evaluates the closeness of the distributions and by computing the least upper bound of all pointwise differences
privpre−λ privpost−λ( ) ( ) |ˆˆ xx privpreprivpost −− − λλ| . The KS statistic can be written as:
( ) ( ) |]ˆˆ[|sup xxD privpreprivpostx
−− −= λλ The null hypothesis ( ) is accepted if is sufficiently close to , in other words
if the value of
privpreprivpost −− = λλ:H 0privpost −λ privpre−λ
D is sufficiently small or smaller than the critical value at a certain significance level.
17

The above methodology is equivalent to considering the simplest possible model for
capturing the effect over performance with no regressors; it can easily be derived so that
performance depends only on the date of the privatization dummy,
0)Pr/(E Pr ,,,,, =++= tititititi ivatuunivatizatioY γα (2) Nevertheless, the above result is likely to be biased for two reasons. First, the two groups
may have different characteristics and, thus, different performance behavior. Second, the two
groups of years may be subject to different shocks. Part of the differences in pre- and post-
privatization performance patterns may simply be a result of these differences.
An alternative way to solve this problem is to develop a benchmark to control for
these different characteristics and shocks. In this sense, a difference in difference measure
was calculated for each economic sector in which privatization was important:
firmsnotprivprivpreprivpostfirmsprivprivpreprivpost yearyearyearyear
YYYYY . .2 ][][ −−−− −−−=∆ (3) The main caveat of the difference in difference measure is the lack of an appropriate control
group with which to compare the difference in performance of the privatized firms. It is not
possible to use an optimal matching methodology such as propensity scores, as detailed in
Rubin (1974, 1983), Heckman and Smith (1995), Heckman, Ichimura, Smith, and Todd
(1996), Heckman, Ichimura, and Todd (1997), and Heckman, Lalonde, and Smith (1999),
because in all sectors under analysis, except banking, there are not enough cases to find the
appropriate control group. In this sense, the author will try to reduce this problem by
complementing the above equations with a regression analysis.
The regression analysis added to equations 2 and 3 incorporates regressors, which
control for observable characteristics at the firm level, into the model. It also includes sectoral
and macroeconomic variables. The latter variables tried to capture different shocks, thereby
isolating the impact of privatization.
The regression analysis primarily consisted of an attempt to model each of the
performance measures (P) as a function of the following variables:
Yi,t = f(Xi,t, Ti,, Pi,t, PI,r, Sj, Rj, Z,t) (4)
where Yi,t are the different performance measures previously detailed for firm i in period of
time t; Xit are firm characteristics; Ti are the characteristics of the privatization process of the
specific firm; Pi,t is the date in which the firm was privatized or given in concession; Pi,r is a
18

dummy indicating whether the firm is privatized or not; Sj are variables at the sector level of
the firm; Rj are characteristics of the regulatory agency (for details see Guash and Spiller
(1999), and finally Zt are other controls such as macroeconomic variables.
Additionally, the author explored interaction effects of the privatization dummy, and
carried out panel estimations using differences to drop out all firm observed and unobserved
time invariant fix effects. Therefore, the three econometric specifications regressed are:
titjijtititi ZRTSXtPP ,6543,21,00, µβββββββα ++++++++= (5)
titjijtirititi ZRTSXtPPP ,6543,21,0,00, µββββββγβα +++++++++= (6)
titjijti
ritirititi
ZRTSXtPtPtPPP
,6543,2
,2,11,0,00,
µβββββ
γγβγβα
++++++
+++++= (7)
Equation (5) is the same as equation (2) but includes firm, sector and macroeconomic
variables and, when available, some variables for the characteristics of the regulatory agency.
Equation (6) includes a privatization dummy and a control group in the sample to be able to
carry out a difference in difference estimation as in equation (3), but again with the controls
previously specified. Finally, equation (7) includes additional interactions of the year-
privatized dummy (Pi,t) and the dummy of whether the firm is privatized or not (Pi,r) includes
a time trend to capture trend and convergence over time of newly-privatized firms with firms
in the control group (public firms or already private firms).
Equations 5, 6, and 7 were estimated using a simple OLS panel data of firms as
detailed in the data section. In addition, it was necessary to account for unmeasured industry
and industry/year effects. Making establishment fixed effects allowed the author to drop out
all firm observed and unobserved time invariant fixed effects. However, since these
performance models could suffer too from endogeneity problems,12 simultaneous
determination and reverse causality of the explanatory variables, following what is now
standard procedure in the literature of instrumental variables, were used. The latter problems
arise mainly because the privatization process directly affects most of the explanatory
variables for many of the performance indicators and therefore, reverse causality or
simultaneous determination is a latent problem. Additionally, the GMM-IV estimation
allowed for heteroskedasticity of unknown form. In order to have appropriate instruments, the
lags of the instrumentalized variables as well as the privatization variables were used. Also,
to check if the equation is overidentified by an abundance of instruments, a test of
19
12 Heterogeneity may also be present but can be controlled by pooling the data.

overidentifying restrictions—Hansen's “J” statistic (1982)—is provided to evaluate the
validity of the model. If this statistic13 rejects the null hypothesis, the validity of the model is
called into question.14
Although this estimator is restricted to models linear in the parameters, it is relatively
more efficient than an OLS with instrumental variables, even with correction for
heteroskedasticity with the White procedure. The efficiency gain is derived from GMM-IV’s
use of an optimal weighting matrix15 (rather than the identity weighting matrix implicit in any
least squares estimator) to define the appropriate combination of moment conditions. In this
context, the moment conditions are the orthogonality conditions of each instrument with the
error process. A discussion of the development of the estimator is given in Greene (2000).
4. The Data The construction of the database required several sources of statistical information. For the
pre-privatization period, the primary sources of information were the “White Books”16 and
the published histories of the respective firms. This information was complemented by
sources like the fiscal statistical summary of the Central Reserve Bank of Peru, the National
Institute of Statistics and Computing Statistics, annual economic surveys, and others (for
further details on data sources, see Appendix 1).
For the post-privatization period, the author collected information from various
sources. Again, company histories were an excellent source of information. Data on the
characteristics of the firms was complemented by statistics from the Supervising Committee
of Companies and Securities (CONASEV), annual economic surveys, and monthly financial
reports of the Bank and Insurance Superintendent (SBS). Also, the author collected data for
sectoral indicators from statistics published by the regulatory agencies (see Appendix 1). It is
important to mention that the data collected includes information for the period 1986—2000
in order to provide enough pre-privatization sectoral data. The pre-privatization data allowed
13 This statistic is distributed Chi-squared in the number of overidentifying restrictions. 14 The null hypothesis is that the additional moment conditions are approximately satisfied. 15 Hansen (1982) showed that the optimal weighting matrix for this class of estimators is W = AsyVar[1/N Z'e], where Z is the N x L matrix of instruments and e is the N x 1 matrix of the GMM residuals. For the procedure followed for N observations the optimal W is given by: N W = (1/N2) Σzi zi' ei
2 i=1 where zi is the ith row of Z and ei is the ith element of e. and ivgmm saves W in e(W) . 16 The White Books are a collection of all information available for firms to be privatized.
20

the author to control for the period of restructuring that many enterprises experienced before
they could be privatized.
One major problem was the merger, absorption, or division of many companies or
business units during the privatization process. This activity made it difficult to follow
companies as a single unit through the privatization process. Two alternative methods were
adopted to resolve the issue. In the first method, the author aggregated pre-privatization
accounting information provided in the White Books; the second alternative relied on the fact
that in most of the privatization agreements, as in the merger of CPT and ENTEL into TdP,
the privatized entities were required to keep separate accounting books. Thus, the author
could either aggregate a company’s important data or follow the respective merged unit over
time.
A second problem of data collection was that some privatization strategies required
that SOEs be divided and each individual unit offered separately. The registers kept before
the privatization processes were based on aggregated data, since all the different business
units operated as a single enterprise. However, from the day of the decision to privatize, the
registers were kept separately for each unit and then consolidated into one record for the
company.
Although the companies were considered single units after the privatization process,
in some cases there existed a combination of private businesses and SOEs that were only
partially privatized. Mixed ownership in a firm’s record complicated the measurement of the
impact of privatization. In order to partially control for this problem, the authors generated a
variable based on the percentage of the firm still owned by the government to measure the
intensity of the privatization process and added a discrete dummy of the period in which the
privatization started.
The final problem was that parts of the SOE portfolios had been liquidated. Those
companies usually represented inefficient units of SOEs that had not been absorbed by the
private system. In these cases, when possible, the unit of the company liquidated was
excluded, or it was assumed that the new private owner decided to shut down that unit for
efficiency reasons.
Between the years 1992 and 2000, 185 transactions took place. This process included
42 SOEs. However, the sample of companies in this paper is less than the total of privatized
SOEs. Several important reasons exist for not including all of the privatized SOEs in this
study:
21
• Some state companies were divided horizontally or vertically in small units and privatized separately. In most cases, it was possible to join all the parts in which the company was divided and assume that it remains a single operating unit. In the case of Telefónica del Perú, information from CPT and ENTEL Perú has been added. This was not possible in other cases due to lack of information about some of the units into which the company was divided.
• Most of the concessions and projects have not been included due to the lack
of financial information from the pre-privatization period. • Several firms have been liquidated or had their operations stopped. • Some firms have been absorbed, or another firm has acquired some of their
business units.17 • In some cases, information was unavailable.
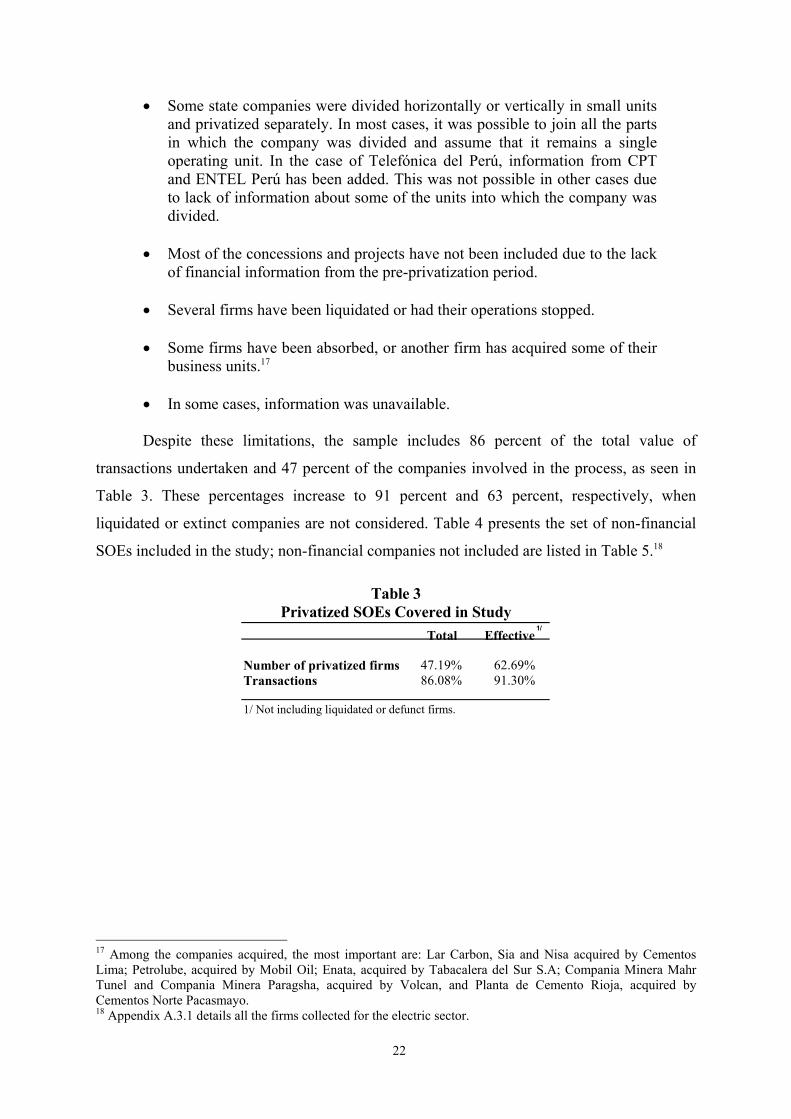
Despite these limitations, the sample includes 86 percent of the total value of
transactions undertaken and 47 percent of the companies involved in the process, as seen in
Table 3. These percentages increase to 91 percent and 63 percent, respectively, when
liquidated or extinct companies are not considered. Table 4 presents the set of non-financial
SOEs included in the study; non-financial companies not included are listed in Table 5.18
Table 3 Privatized SOEs Covered in Study
Total Effective1/
Number of privatized firms 47.19% 62.69%Transactions 86.08% 91.30%
1/ Not including liquidated or defunct firms.
17 Among the companies acquired, the most important are: Lar Carbon, Sia and Nisa acquired by Cementos Lima; Petrolube, acquired by Mobil Oil; Enata, acquired by Tabacalera del Sur S.A; Compania Minera Mahr Tunel and Compania Minera Paragsha, acquired by Volcan, and Planta de Cemento Rioja, acquired by Cementos Norte Pacasmayo. 18 Appendix A.3.1 details all the firms collected for the electric sector.
22

Table 4 Non-Financial Companies Included in Study
Data Available Data AvailablePublic Private
EdelnorLuz del SurEdegelEde - CañeteEde - ChancayElectroperúEgenorEgesurCahua
Empresa Eléctrica de Piura Empresa Eléctrica de Piura 1997-1999Electro Andes 1997-1999
Electro Centro Electro Centro 1986-1998 1999Electro Noroeste Electro Noroeste 1986-1998 1999Electro Norte Electro Norte 1986-1998 1999Electro Norte Medio Electro Norte Medio 1986-1998 1999Electro Oriente 1986-1999Electro Sur 1986-1999Electro Sur Este 1986-1999Electro Sur Medio Electro Sur Medio 1986-1996 1997-1999Etevensa Etevensa 1994-1995 1996-1999Seal 1986-1999Cemento Sur Cemento Sur 1986-89, 1994 1996-1998Cementos Lima Cementos Lima 1987-1993 1994-2000Cementos Norte Pacasmayo Cementos Norte Pacasmayo 1992-1993 1994-2000Cemento Yura Yura 1986-1990 1994-1995Centromín 1986-1990Sociedad Minera Cerro Verde Sociedad Minera Cerro Verde 1993 1994-96, 1999-00Compañia Minera Condestable Compañia Minera Condestable 1987-1990 1992-2000Hierro Perú Shougan Hierro Perú 1986-1990 1998-1999Minero Perú 1986-1990Empresa Minera Especial Tintaya 1986-1989Empresa de la Sal Empresa de la Sal 1991-1994 1995-2000
Petróleos del Perú Petróleos del Perú 1986-1991 1992-1998Petroperú - Refineria la Pampilla Refineria la Pampilla 1996-1998Química del Pacífico Química del Pacífico 1988-1992 1993-2000Certificaciones del Perú Certificaciones del Perú 1991-1993Reactivos Nacionales Reactivos Nacionales 1987-89, 1991-92 1993-2000Industrias Navales Industrias Navales 1991-1992 1993-1996Sudamericana de Fibras Sudamericana de Fibras 1991-1992 1993-1996Empresa Siderúrgica del Perú Empresa Siderúrgica del Perú 1986-90, 93-95 1996-1997Solgas 1986-1990
Compañía Peruana de Teléfonos
Empresa de Telecomunicaciones del PerúSedapal 1986-1999
Electroperú
Telefónica
1986-1994 1995-1999
1986-1993 1994-2000
Private CompaniesSOE
Electrolima 1986-1993 1994-1999
23

Table 5 Non-Financial Companies Not Included in Study
Liquidated or Defunct Divided Land Sales Absorbed by Other Firm Information UnavailableMinpeco USA Sociedad Paramonga Proyecto Especial Chavimochic Lar Carbón Petrolera TransoceánicaAero Perú Epsep Tierras del Proyecto Especial Pastogrande Sia Refineria CajamarquillaPetromar Tierras del Proyecto Especial Chinecas Nisa Pesca PerúEcasa Tierras del Proyecto Especial Majes-Siguas Planta de Cemento Rioja EnaferFlopesca Tierras del Proyecto Especial Jequetepeque-Zaña Petrolube Empresa Minera YauliyacuPesquera Grau Tierras Eriazas Enata Empresa Radio PanamericanaFertisa Tierras del Proyecto Especial Chira-Piura Empresa Minera Mahr Túnel Empresa Difusora Radio TeleEpersur Empresa Minera Paragsha PletasaPlesulsa Planta Lechera de IquitosMetaloroyaAmfaTalleres de Moyopampa Empresa Minera Cobriza Cedega TEnatruperúErtur Arequipa EretruErtsa PunoEntur PerúEmturinKuelapComplejo Pesquero de Samanco ErgusaIncasaErtur
24
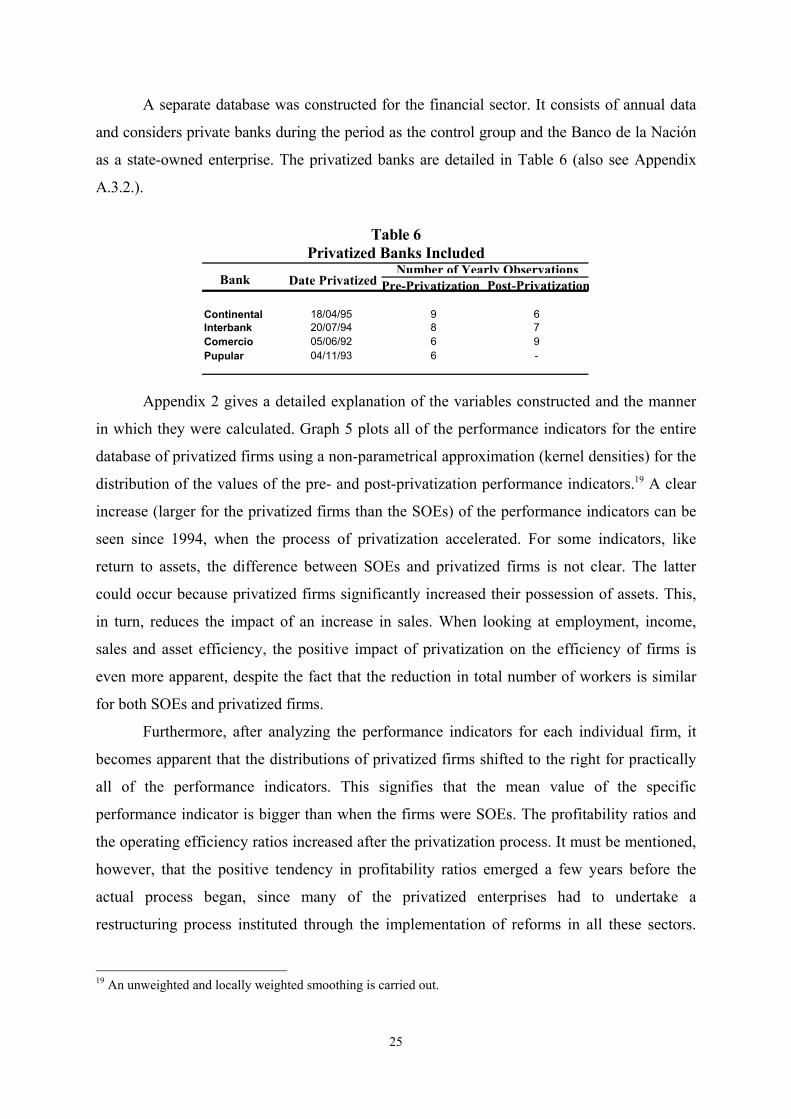
A separate database was constructed for the financial sector. It consists of annual data
and considers private banks during the period as the control group and the Banco de la Nación
as a state-owned enterprise. The privatized banks are detailed in Table 6 (also see Appendix
A.3.2.).
Table 6
Privatized Banks Included
Pre-Privatization Post-Privatization
Continental 18/04/95 9 6Interbank 20/07/94 8 7Comercio 05/06/92 6 9Pupular 04/11/93 6 -
Number of Yearly ObservationsBank Date Privatized
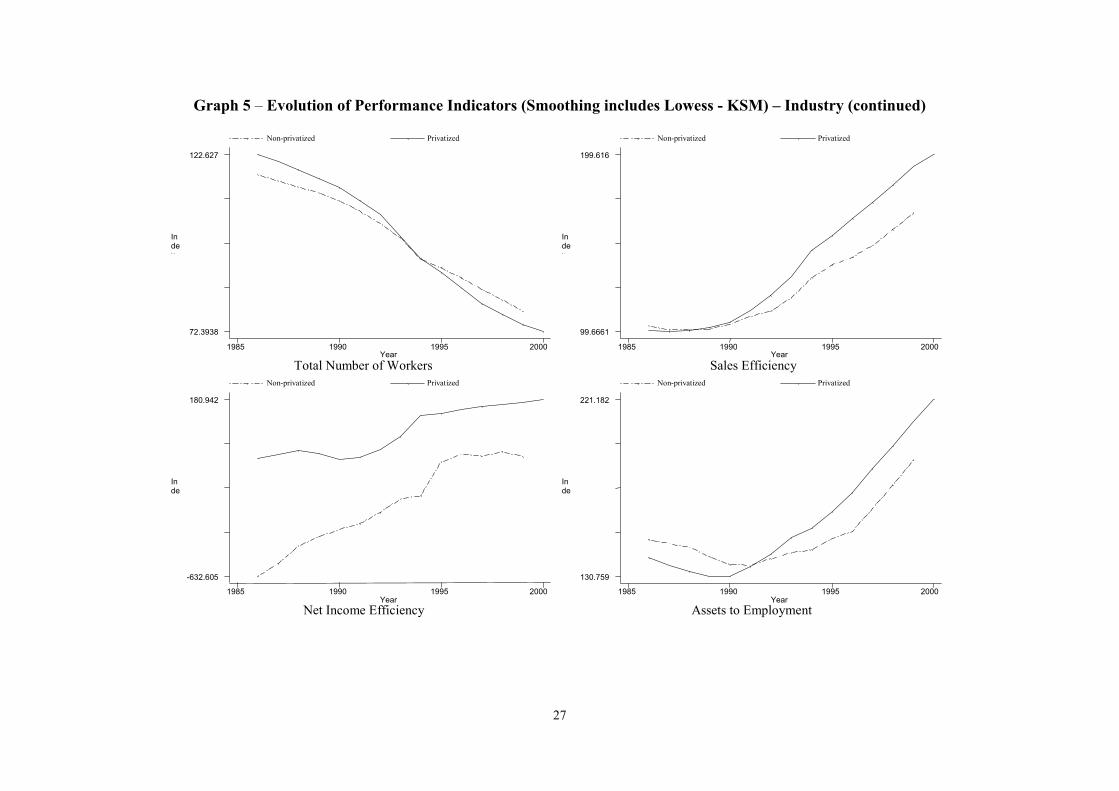
Appendix 2 gives a detailed explanation of the variables constructed and the manner
in which they were calculated. Graph 5 plots all of the performance indicators for the entire
database of privatized firms using a non-parametrical approximation (kernel densities) for the
distribution of the values of the pre- and post-privatization performance indicators.19 A clear
increase (larger for the privatized firms than the SOEs) of the performance indicators can be
seen since 1994, when the process of privatization accelerated. For some indicators, like
return to assets, the difference between SOEs and privatized firms is not clear. The latter
could occur because privatized firms significantly increased their possession of assets. This,
in turn, reduces the impact of an increase in sales. When looking at employment, income,
sales and asset efficiency, the positive impact of privatization on the efficiency of firms is
even more apparent, despite the fact that the reduction in total number of workers is similar
for both SOEs and privatized firms.
Furthermore, after analyzing the performance indicators for each individual firm, it
becomes apparent that the distributions of privatized firms shifted to the right for practically
all of the performance indicators. This signifies that the mean value of the specific
performance indicator is bigger than when the firms were SOEs. The profitability ratios and
the operating efficiency ratios increased after the privatization process. It must be mentioned,
however, that the positive tendency in profitability ratios emerged a few years before the
actual process began, since many of the privatized enterprises had to undertake a
restructuring process instituted through the implementation of reforms in all these sectors.
19 An unweighted and locally weighted smoothing is carried out.
25

Graph 5 – Evolution of Performance Indicators (Smoothing includes Lowess - KSM) – Industry
Index
Return of Sales Year
Non-privatized Privatized
1985 1990 1995 2000
-1300.09
.224043
Index
Return of Assets Year
Non-privatized Privatized
1985 1990 1995 2000
-332.535
60.6412
Index
Return of EquityYear
Non-privatized Privatized
1985 1990 1995 2000
-934.179
63.1283
26
Graph 5 – Evolution of Performance Indicators (Smoothing includes Lowess - KSM) – Industry (continued)
Index
Total Number of WorkersYear
Non-privatized Privatized
1985 1990 1995 2000
72.3938
122.627
Index
Sales EfficiencyYear
Non-privatized Privatized
1985 1990 1995 2000
99.6661
199.616
Index
Net Income EfficiencyYear
Non-privatized Privatized
1985 1990 1995 2000
-632.605
180.942
Index
Assets to Employment Year
Non-privatized Privatized
1985 1990 1995 2000
130.759
221.182
27

Graph 5 – Evolution of Performance Indicators (Smoothing includes Lowess - KSM) – Industry (continued)
Index
Debt to AssetsYear
Non-privatized Privatized
1985 1990 1995 2000
55.5072
176.941
Index
Debt to EquityYear
Non-privatized Privatized
1985 1990 1995 2000
41.6735
5305.84
28

Additionally, it should be noted that the profitability indicators for the banks under
examination showed an important decline a few years after the privatization process. This result
can be explained by the severe global financial crisis at the end of the 1990s.
On the other hand, improvement in the operating efficiency ratios demonstrated not
only a recovery in sales and income of companies across sectors, but also the strong decline in
post-privatization total employment across sectors. It is worth mentioning that these indicators
had a positive, but weak, evolution in the years before the privatization process, but only after
privatization occurred did their pace accelerate.
The capital-deepening indicator (the ratio of assets to employment) showed a very
important increase after the privatization process. In all sectors, this indicator was more or less
stagnant before the process occurred, but afterwards, it started rising very rapidly. Furthermore,
leverage indicators that had a very negative and unstable tendency before privatization began to
improve, although not immediately. In all sectors, the negative tendency was reversed in years
after the privatization process began, but many faced a relapse due to the global financial crisis.
The means and variances for these ratios during the period of analysis, as well as for the values
of the most important indicators for all sectors, can be found in Appendix 4.
It is important to mention that even though businesses in the Sanitation Sector
(specifically Sedapal) have not been privatized, they are included in this project as a control
group for the privatized firms in the services sector. Sedapal is used as a control group because
it is a service, like telephones or electricity, and because it had a similar evolution in
performance indicators for the pre-privatization period. The latter occurred because the
government initially prepared Sedapal for privatization also. This similarity presents an
opportunity to include an “untreated group” (a firm that has not been privatized, such as
Sedapal) with a similar process of pre-privatization reform comparable to the “treated group”
(TdP). In the case of electricity, as detailed in Appendix A.3.1, unprivatized firms still exist.
Thus, there are enough controls to evaluate the impact of privatization under the difference in
difference methodology.
5. Empirical Results In this section, the methodologies outlined in section 3 are utilized to analyze the impact of
the privatization process on firm performance. First, a detailed analysis of performance
indicators is carried out for all privatized firms, then the three major privatized sectors are
analyzed: telecommunications, electricity and the financial sector.
29

Each of the tables consists of two tests comparing pre- and post-privatization. The
first test is a first difference analysis using firm and year fixed effects to analyze the
difference between pre- and post-privatization information for all firms under study. The
second test is a difference in difference test, as detailed in the methodological section. The
difference in difference statistic will both test for the change in firm performance compared
to the privatization period and take into account relative firm performance when compared to
a control group that did not undergo the privatization process. In the all-firm panel, the
control groups are all the SOEs present for every year for which information was collected.
The GNP per capita for each sector is also included to control for the size of the sector to
which the specific firms belong.
When analyzing the two principal sectors where privatization took place, the control
firms were those identified as most similar to the ones under analysis. In the case of
telecommunications, the control group is Sedapal, the main firm in the Water and Sanitation
sector. This firm was not privatized but underwent a pre-privatization reform process similar
to that of the telecommunications firm.20 In the case of electricity, the control group is a
group of non-privatized electric companies (Electro Oriente, Electro Sur, Electro Sur Este
and Electro Sur Medio). Finally, for the case of the two privatized banks, Banco Continental
and Interbank, two different control groups were used. The first group consisted of all private
banks in operation between 1986-2000; the comparison was carried out between privatized
banks and private banks. The second type of control was state-owned bank Banco de la
Nación.
Since there were enough private banks to develop the control group, a propensity
score based on Rubin (1974), Heckman et al. (1995), Heckman et al. (1996), Heckman et al.
(1997), and Heckman et al. (1999), in which the probability of belonging to the treated group,
given observable characteristics (inter-bank funds, assets, total liabilities and equity),21 was
used as a summary of those characteristics in order to measure the average treatment effect
on the treated variables in comparison to the performance variables.
Finally, a regression analysis and the estimation of equation 7 were carried out in
order to find a possible convergence of performance indicators. The regression analysis also
allowed controlling for different variables mentioned in the literature that could explain the 20 Barber and Lyon (1996) suggest that sample firms must be matched to control firms with similar pre-event performance, which is especially difficult in studies of privatized firms, but Sedapal went through the same reform as the privatized firms.
30

impact of the privatization of the SOE's. In addition to characteristics of the firm such as size,
sector GDP and assets over employment, controls that helped measure the size of market
failure were included.
As noted above, and as mentioned by Megginson and Netter (2001), welfare theory
argues that privatization tends to have the greatest positive impact in cases where the role of
the government in minimizing market failure is the weakest, i.e., for SOEs in competitive
markets or markets that can readily become competitive. On the other hand, Shleifer (1998)
and others have argued that both in natural monopolies, where competitive considerations are
weaker, and markets for public goods, government-owned firms are rarely the appropriate
solution. Consistent with this literature, the regression analysis includes a set of variables that
will control for the degree of competition approximated by concentration indices as well as
variables that will measure the type of regulatory processes that accompanied the
privatization process.
5.1. Results for All Privatized Firms Table 7 presents the results for all of the privatized firms. In the table, first and second
differences in performance changes are presented using both the mean and the median. The
second differences are presented using as a control group all the firms not privatized in the
respective periods of analysis. In all performance indicators and as mentioned in the
methodological section, a simple regression was carried out (Equation 2) in which fix effects
were included at the level of the firm (Graph 5 plots each of the indicators). Additionally, a
test for normality was carried out as well as the Kolgomorov Smironov non-parametric test to
determine if the difference in the distribution of the performance indicators was significant.
In all the performance indicators, with the exception of leverage and assets to employee, the
test showed significant differences.
Even accounting for the wide range of firms included in the study, the performance
indicators show a significant improvement after privatization. Specifically, when analyzing
three basic indicators, sales, cost per unit and labor, the results obtained are as expected:
privatized firms significantly increase their sales compared to non-privatized firms. At the
same time, there is a statistically significant reduction in cost per unit. With respect to
21 For this purpose a probit model was used to estimate the propensity score. For further reference see Rosenbaum and Rubin (1983); Heckman et al. (1996); Heckman, Ichimura, Smith, and Todd (1998); Heckman et al. (1997); Heckman, Ichimura and Todd (1998); and Heckman and Smith (1995).
31

employment, the expected result occurs: direct employment falls significantly, in line with
the restructuring process that the privatized firms went through.
Moreover, the profitability indicators and all the operating efficiency indicators show
significant improvement for both the privatized firms and in comparison with the non-
privatized firms. In the case of the rate of net income to assets (Net income/PPE)22, there is no
significant difference between the pre- and post-privatization periods. This result was
expected because both the denominator and numerator increase with the privatization given
the high levels of investments made by new companies in order to increase efficiency.
22 PPE refers to property, plant and equipment.
32

Table 7 Performance Changes in Firms After Privatization
Difference in Difference
Mean Before Mean After t-stat 2/ t-stat 2/
Median Before Median After t-stat 3/ t-stat 3/
i. Profitability Operating Income / Sales 0,053 0,187 2,70 2,700
0,083 0,207 5,57 4,850 Net Income / Sales -0,293 0,028 2,41 2,410
-0,128 0,074 0,30 0,300 Net Income / PPE -0,062 0,010 1,41 1,410
-0,027 0,042 1,56 1,090 ii. Operating EfficiencyCost per unit 0,947 0,813 -2,70 -2,700
0,917 0,793 -2,81 -2,980 Sales/Employee 1/ 110,317 242,909 11,91 11,910
105,089 249,802 2,12 1,970 Log (Sales/Employees) 5,336 5,770 10,85 10,850
5,377 5,789 3,35 2,550 Sales/PPE 1,215 1,007 -1,43 -1,430
1,167 0,936 0,25 -0,260 Log (Sales/PPE) -0,443 -0,321 1,98 1,980
-0,377 -0,323 0,14 0,240 iii. Output Log(Sales) 6,590 11,636 8,47 8,470
7,596 11,674 1,25 0,350 iv. Labor Employee 1/ 114,621 68,621 -13,93 -13,930
116,612 67,377 -4,88 -2,740 Log (Employee) 6,145 5,635 -14,65 -14,650
6,183 5,622 -0,28 -5,740 v. Assets Log (PPE) 11,641 11,722 0,73 0,730
11,594 11,768 1,22 0,490
1/ Index (year 1993 = 100) 2/ Correspond to the test of significance of an OLS regression with fix-effects.3/ Correspond to the test of significance of a LMS regression with fix-effects.
First Difference
5.1.1 Results for Services Sector A detailed analysis of the two major privatized sectors (public services and finance) is carried
out for the firms included in the panel, and the different time periods over which they were
privatized. As previously mentioned, these two sectors represent more than 75 percent of the
total revenue collected by the privatization process.
The results of estimating equation 7 are shown in Tables 8 and 9.23 In the case of
public services (electricity, telephones and water as a control), the results of the privatization
23 As mentioned before, the GMM instrumental variables were carried out to control for heteroskedasticity of unknown form. As expected, the results were consistent with the literature; privatized firms are more profitable
33

date dummy are only significant for the debt indicators. On the other hand, the time trend is
positive and significant, which means that over time all the performance measures improved.
The latter, together with the insignificant dummy that captures the date of privatization,
suggests that the performance indicators started to improve prior to the privatization process
and that only the debt indicators improved significantly faster after the privatization process.
When examining the dummy that captures a firm’s privatization status, through a
treatment on the treated type of analysis (similar to the second difference) in the ROS, debt
indicators, sales efficiency, and ratio assets to employment, there is a significant
improvement with respect to Sedapal, which is used as a control group. This result shows that
the privatized firms are improving relative to Sedapal. However, the variable of time trend
times the privatized firm dummy is significant and negative, meaning that over time, the
privatized firms are converging to the lower performance of Sedapal. The latter result is very
important, because it sheds light on how in recent years the financial performance of both the
telephone company and the electric utilities declined, which could be a consequence of
increased market competition.
On the other hand, the coefficient on the percent of government participation has a
negative and significant sign for two of the three profitability indicators (ROS and ROA),
although it shows a positive and significant sign in sales efficiency and ratio of assets to
employment. These results sharply contradict expectations. In addition, the dummy variable
for price cap regulation is significant and positive in the ROE and debt to assets ratio,
implying that the type of regulation carried out by the regulatory agency also has an
important impact on firm performance. Finally, the concentration index is not significant,
possibly because there is competition in the electricity sector, especially in distribution, and a
monopoly in the telephone sector.
When examining each of the privatized firms (see Appendix 5 and Tables A.5.1. to
A.5.5), the results of the first and second difference statistics for the privatized SOEs are
completely consistent with what the author found in Table 8. In the cases of Telefónica del
Perú S.A. and Electrolima, both the first and second differences are significant and in the
expected direction. In the case of the telephone company, only the difference in means in the
leverage indicators in both the first and second difference were not significant.
Similarly for Electrolima, all the performance indicators, including leverage,
improved significantly. This also holds when a control group is included and the second and productive than public firms (Boardman and Vining, 1989, Vining and Boardman 1992, and La Porta and López-de-Silanes 1999).
34

difference is calculated. The profitability ratios moved from being negative in average to
positive in magnitudes from 8 percent to 20 percent. Furthermore, sales efficiency increased
by 500 percent and net income efficiency by more than 800 percent. The main explanation
for such a significant increase in operating efficiency was the reduction of employment by
more than half (55.6 percent) after privatization. Another significant reduction occurred in
debt ratios, which fell more than 50 percent.
35

Table 8. ce of Perf
Dummy for Date of Privatization (fpriv) -0.5355 0.0788 -0.0263 -0.5594 -1.9622 -3.9619 -0.346 4,453.08(0.8867) (0.1070) (0.1706) (0.2133)** (0.6373)** (324.0414) (186.8696) (4209.4528)
Dummy if Firm is Privatized (epriv) 1.3155 0.0114 -0.008 0.4892 1.4444 233.929 40.0353 5,574.28(0.4665)** (0.0242) (0.0425) (0.0549)** (0.2800)** (47.0005)** (32.4350) (1,771.8165)**
Time Trend (t) 0.1517 0.0113 0.0176 0.0097 0.0162 34.3105 11.3793 35.6078(0.0292)** (0.0038)** (0.0063)** (0.0046)* (0.0130) (4.6841)** (2.7264)** (84.3298)
t *fpriv 0.1455 -0.0026 0.0077 0.0502 0.1705 53.5472 13.581 192.7965(0.0885) (0.0074) (0.0123) (0.0174)** (0.0525)** (28.5794) (15.1040) (372.0849)
t* epriv -0.1305 -0.0067 -0.0093 -0.0345 -0.1115 -26.3847 -6.3136 -443.6183(0.0425)** (0.0032)* (0.0061) (0.0071)** (0.0306)** (5.0188)** (3.3763) (148.8121)**
Concentration Index -0.004 0.0002 0.0003 0.0000 -0.0017 1.1352 0.1334 -15.8996(0.0025) (0.0003) (0.0006) (0.0006) (0.0025) (1.0208) (0.4399) (14.9523)
% Change of GDP per Capita 0.0484 0.0012 0.0015 0.0013 0.0033 -0.0098 4.6774 -72.6033(0.0141)** (0.0018) (0.0030) (0.0022) (0.0101) (2.0111) (1.9953)* (66.4124)
% Government Participation 1.1136 -0.0448 -0.0635 0.1108 0.1387 513.6258 104.3681 6,369.42(0.7313) (0.0184)* (0.0310)* (0.0603) (0.1850) (122.7353)** (78.5154) (1,345.1637)**
Dummy Regulation by Price Cap -0.4064 0.0602 0.1393 0.1374 0.3629 -66.4621 -58.5637 -626.2109(0.2648) (0.0352) (0.0569)* (0.0622)* (0.1887) (77.8893) (36.9691) (1017.4182)
Dummy Regulation Based on Costs 0.0522 -0.0177 -0.0137 -0.0415 0.0214 222.233 22.2343 -1,485.57(0.3372) (0.0303) (0.0530) (0.0469) (0.2030) (56.4033)** (39.7200) (1524.1113)
log(Employment) 0.2742 0.0247 0.0463 0.0138 0.0598 104.4154 40.8697 -572.6417(0.1328)* (0.0094)** (0.0176)** (0.0182) (0.0818) (19.5389)** (13.6881)** (714.1734)
Ratio Assets/Employment -0.0002 0.0000 0.0000(0.0001) (0.0000)** (0.0000)**
Constant -4.4631 -0.2313 -0.4215 -0.0884 -0.4686 -1,450.22 -505.2756 -1,151.88(1.5426)** (0.0860)** (0.1583)** (0.1853) (0.6785) (256.1044)** (175.4672)** (6526.9513)
Observations 93 93 93 96 96 98 98 93Pseudo- R-squared 0.349 0.335 0.335 0.569 0.502 0.741 0.371 0.426Note: Standard errors in parenthesis and * significant at 5 percent; ** significant at 1 percent.Variables log (employment) and loans per worker where instrumented using one period lags and fpriv, epriv) using GMM-IV.Pseudo R-squared is the R-square using IV regression with robust standard errors.
Ratio Assets/Employment
Hansen J-statistic (1982) was used to test for overidentifying restrictions and in any case of the null hypothesis that the additional moment conditions areapproximately satisfied was rejected validating the use of our instruments.
Results of Difference in Difference in Differen ormance Indicators of Privatized Services(Generalized Method of Moments Instrumental Variables Estimator (GMM-IV))
Variables ROS ROA ROE Deb To Assets Deb ToEquity
SalesEfficiency
Net IncomeEfficiency
36
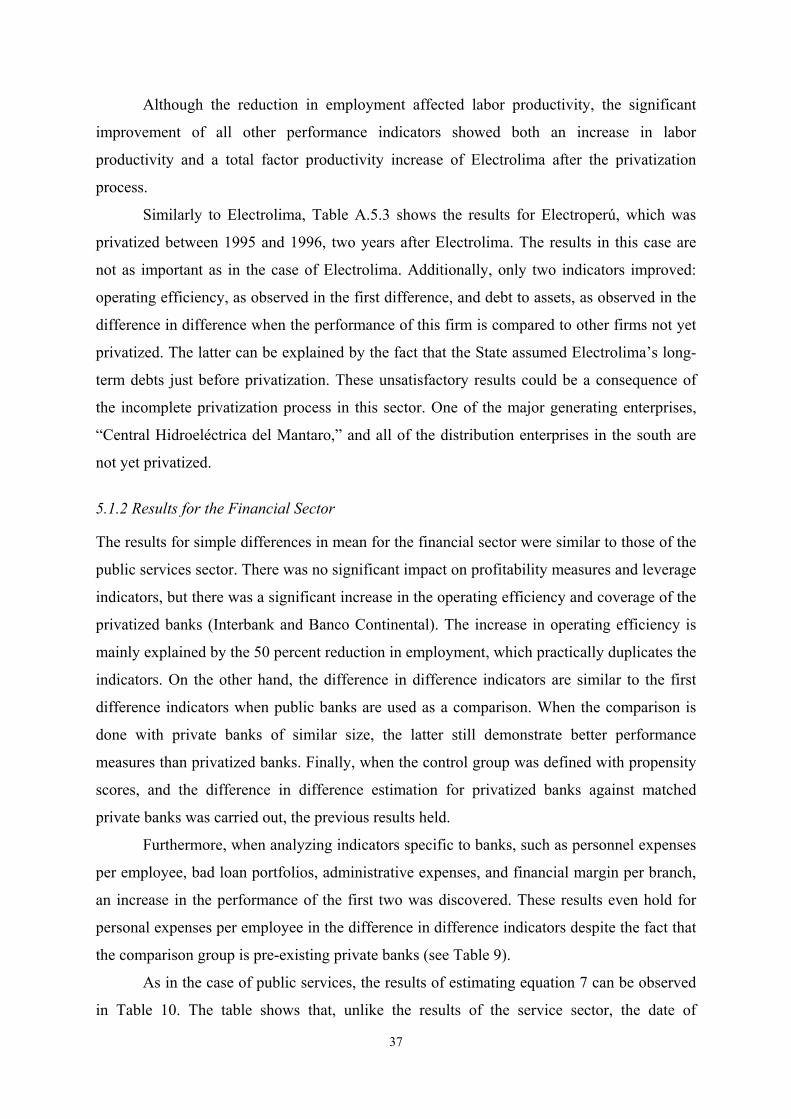
Although the reduction in employment affected labor productivity, the significant
improvement of all other performance indicators showed both an increase in labor
productivity and a total factor productivity increase of Electrolima after the privatization
process.
Similarly to Electrolima, Table A.5.3 shows the results for Electroperú, which was
privatized between 1995 and 1996, two years after Electrolima. The results in this case are
not as important as in the case of Electrolima. Additionally, only two indicators improved:
operating efficiency, as observed in the first difference, and debt to assets, as observed in the
difference in difference when the performance of this firm is compared to other firms not yet
privatized. The latter can be explained by the fact that the State assumed Electrolima’s long-
term debts just before privatization. These unsatisfactory results could be a consequence of
the incomplete privatization process in this sector. One of the major generating enterprises,
“Central Hidroeléctrica del Mantaro,” and all of the distribution enterprises in the south are
not yet privatized.
5.1.2 Results for the Financial Sector The results for simple differences in mean for the financial sector were similar to those of the
public services sector. There was no significant impact on profitability measures and leverage
indicators, but there was a significant increase in the operating efficiency and coverage of the
privatized banks (Interbank and Banco Continental). The increase in operating efficiency is
mainly explained by the 50 percent reduction in employment, which practically duplicates the
indicators. On the other hand, the difference in difference indicators are similar to the first
difference indicators when public banks are used as a comparison. When the comparison is
done with private banks of similar size, the latter still demonstrate better performance
measures than privatized banks. Finally, when the control group was defined with propensity
scores, and the difference in difference estimation for privatized banks against matched
private banks was carried out, the previous results held.
Furthermore, when analyzing indicators specific to banks, such as personnel expenses
per employee, bad loan portfolios, administrative expenses, and financial margin per branch,
an increase in the performance of the first two was discovered. These results even hold for
personal expenses per employee in the difference in difference indicators despite the fact that
the comparison group is pre-existing private banks (see Table 9).
As in the case of public services, the results of estimating equation 7 can be observed
in Table 10. The table shows that, unlike the results of the service sector, the date of
37

privatization (fpriv) is significant for all the performance indicators. This reveals that there
was an important change after the privatization process. On the other hand, there is no direct
difference between the privatized (epriv=1) and the already private banks (the control group).
These results are consistent with the fact that privatized firms are being compared to banks
that were always private; therefore, their performance will be better or similar to the private
banks.
When analyzing the interaction between the time trend and the dummy for privatized
banks (epriv), there is a significant and positive effect for the return over sales. The latter
signifies that over time there is an improvement of newly privatized banks compared to
already private banks. This result reflects a possible convergence of performance. As
expected, there is also a negative time trend that could be justified with the international
financial crisis that affected all the banks in the region. Additionally, the interaction between
the time trend and the year of privatization dummy (fpriv) is significant and negative,
implying that the growth rate of performance since privatization is declining. However, the
size of the coefficient is less than a tenth of the coefficient of the date of privatization dummy
implying that the overall effect of privatization over performance was positive. The latter
decline can also be explained by the international effects of the Japanese and Russian
financial crises.
38

Table 9.
Sector S-Francia 5Prob>z
Performance Measure (P i)1. Profitability:
Return on Sales (ROS) 0,0545 0,0784 -1,320 * 1,743 2,971 0,116 0,476(0,010) (0,016)
Return on Assets (ROA) 0,0112 0,0099 0,383 0,147 0,167 0,314 0,994(0,002) (0,002)
Return on Equity (ROE) 0,1467 0,1193 0,629 0,395 0,429 0,291 0,994(0,029) (0,027)
2. Operating Efficiency: Sales Efficiency (SALEFF) - 1994 S/. Thousands 188,85 404,10 -7,122 *** 50,725 *** 35,071 *** 0,125 0,007 ***
(17,921) (24,582) Net Income Efficiency (NIEFF)- 1994 S/. Thousands 10,70 22,60 -2,641 ** 6,973 ** 12,031 ** 0,178 0,082 **
(2,403) (4,249)3. Employment: Total Employment (EMPL) 3132,5 1831,2 7,101 *** 50,419 *** 44,613 *** 0,146 0,001 ***
(95,085) (177,859)4. Leverage: Debt to Assets (LEV) 0,9125 0,9175 -0,555 0,308 0,758 0,077 0,329
(0,007) (0,002) Debt to Equity (LEV2) 12,134 11,189 0,485 0,235 0,733 0,029 0,476
(1,432) (0,304)
5. Coverage: Loans per worker (LOAW) 354,17 1440,36 -13,329 *** 177,654 *** 120,006 *** 0,015 0,001 ***
(40,902) (81,520) Deposit per worker (DEPW) 513,23 1742,60 -9,216 *** 84,940 *** 93,298 *** 0,051 0,001 ***
(52,243) (154,157)
6. Indicators specific to banks Personnel Expenses per Employee -31,45 -53,48 6,74 *** 45,41 *** 22,79 *** 0,665 0,007 ***
(1,98) (2,54) Bad Loan Portfolio 0,08 0,08 -0,26 0,07 0,60 0,671 0,721
(0,07) (0,01) Administrative Expenses 0,49 0,42 1,19 1,43 3,91 * 0,010 0,216
(0,04) (0,01) Financial Margin per Branch 1913,80 2374,20 -1,27 1,62 1,30 0,724 0,476
(253,46) (145,10)
Level of Significance: * 10%, ** 5%, *** 1% Std. Err. in Parenthesis 1/ The year of privatization is 19952/ t-test for Ho about difference between means. Unequal N's
3/ Test of equality:
Where x be a 1xk matrix of the means and S be the estimated covariance matrix. 4/Control group based on propensity score matching.5/ Shapiro-Francia test for normality. Ho: variable is normally distributed.
T-test 2 Means 1 Diff. in Dif. 4
Hotelling 3 Kolmorogrov-Smirnov 6
Performance Changes After Privatization - Financial Sector (Difference between Means and Difference in Difference Tests)
First DifferencesPre-
PrivatizationPost-
PrivatizationHotelling 3
2121
222
211
2121
11*)2(
)1()1(
)()(
2 1 nnn n
sn s n X X
S X X
t X X
+−+
−+−
− =
−=
−
2121
222
211
2121
11*)2(
)1()1(
)()(
2 1 nnn n
sn s n X X
S X X
t X X
+−+
−+−
− =
−=
−
2121
222
211
2121
11*)2(
)1()1(
)()(
2 1 nnn n
sn s n X X
S X X
t X X
+−+
−+−
− =
−=
−
( ) ( )'211
212 xx S x x T −−= −
39

Table 10. Differen
Date of Privatization Dummy (fpriv) 0.3092 0.0538 0.4506 -0.0922 -11.4328 -1.4313 111.1536 -(0.1237)* (0.0182)** (0.2096)* (0.0323)** (4.1852)** (112.1632 (36.1325)** (627.2483
Dummy if Firm is Privatized (epriv) -0.1219 -0.0114 0.0778 0.0334 7.1600 -96.5512 -40.8681 -27.2020(0.0508)* (0.0080) (0.0696) (0.0227) (4.0179) (82.2342) (20.4276)* (461.7338
Time Trend (t) -0.0208 -0.0023 -0.0132 -0.0002 -0.0470 6.4866 -2.9459 121.4275(0.0085)* (0.0009)** (0.0070) (0.0010) (0.0648) (2.8684)* (1.1379)** (19.2942)**
t *fpriv -0.0247 -0.0041 -0.0260 0.0108 1.4272 12.5945 -8.1146 175.8407(0.0102)* (0.0017)* (0.0185) (0.0036)** (0.5373)** (13.5645) (3.7083)* (77.6577)*
t* epriv 0.0116 0.0014 -0.0096 -0.0054 -1.0251 4.9709 4.2447 -51.8588(0.0059)* (0.0011) (0.0080) (0.0029) (0.5275) (11.7789) (2.9500) (68.2979)
Participation in Total Credit Allocations -0.1551 0.0567 1.1762 0.0521 12.3772 1748.686 274.5105 14982.404(share) (0.6042) (0.0601) (0.7128) (0.0696) (6.2735)* (202.0476)** (61.9442)** (1,549.2723)**% Change of GDP per Capita 0.0006 -0.0005 -0.0035 0.0019 0.0754 -12.4515 -1.8681 -56.0758
(0.0017) (0.0003) (0.0021) (0.0006)** (0.0423) (1.8376)** (0.8185)* (9.3183)**Dummy for Closed State Owned Banks -0.0548 -0.0067 -0.0125 0.0127 1.4007 -76.3966 -24.4158 -67.1054
(0.0301) (0.0048) (0.0818) (0.0106) (1.0590) (27.8619)** (10.8307)* (157.1675log(Employment) 0.0283 -0.0026 -0.0549 0.0126 0.3098 - -19.1690 -
(0.0451) (0.0045) (0.0479) (0.0055)* (0.3564) (14.6869)** (6.4199)** (97.4552)**Loans per Worker 0.0001 0.0000 0.0001
(0.0001)* (0.0000) (0.0000)Constant -0.0258 0.0347 0.4267 0.8055 7.0200 878.7896 154.4391 5849.700
(0.2340) (0.0252) (0.2199) (0.0325)** (1.8918)** (95.6279)** (46.8079)** (594.3191)**
Observation 285 285 285 285 285 285 285 285Pseudo- R-squared 0.111 0.115 0.06 0.162 0.144 0.411 0.146 0.4755Note: Standard errors in parenthesis and * significant at 5 percent; ** significant at 1%.Variables log (employment) and loans per worker where instrumented using one period lags and fpriv, epriv) using GMM-IV.Pseudo R-squared is the R-square using IV regression with robust standard errors.
ROEROANet IncomeEfficiency
SalesEfficiency
Debt ToEquity
Debt ToAssets
Ratio Assets/Employment
Results of Difference in Difference in ce of Performance Indicators of Privatized Banks(Generalized Method of Moments Instrumental Variables Estimator (GMM-IV))
Hansen J-statistic (1982) was used to test for overidentifying restrictions and in any case of the nullhypothesis that the additional moment conditions are approximately satisfied was rejected, validating theuse of our instruments.
Variables ROS
40

5.2. Employment The impact of privatization on the welfare of displaced public workers has received little
attention in the literature. One of the main problems faced by researchers is the lack of
available data, since information for displaced workers is provided for only one period of
time (the moment of displacement from the SOE). In fact, it would require large amounts of
time, effort and resources to trace displaced public workers for the purpose of analyzing the
long-term impact of privatization on their welfare and earnings. This is possibly the reason
why most of the studies analyze the effects of privatization on employment, welfare and
wage levels using gross national figures or industry and firm information.
From the previous results, it is clear that there was a significant reduction in direct
employment. Moreover, as can be seen in Table 11, average employment fell 35 percent
compared to the pre-privatization period. However, when the figures are adjusted, the
average decrease in employment is 0.7 percent higher than the privatized firms’ industry
average.24 Decomposing the results into white collar and blue collar employees yields the
result that unemployment in privatized firms decreased 4.1 percent less than the industry
average, but the reduction of employment was 17.6 percent higher than the industry average
for blue collar workers. This result demonstrates that the most important reduction of direct
employment took place among blue collar workers.
24 It is important to mention here that Peru had possibly the most restrictive and protective labor legislation in Latin America. After the successive waves of reform in 1991 and 1995, no other country had so liberalized its labor market (Lora and Márquez, 1998, Márquez and Pagés, 1998, and Saavedra and Torero, 1999.) Such drastic reform must be considered when looking at the impact of privatization on employment.
41

Table 11. Means of Changes in Employment After Privatization
Before Privatization After Privatization Change(1993) (1997) (%)
All mean 2461,17 1605,75 -34,8%median 2237,50 1393,50 -37,7%
(1508,536) (1300,427)
White-collar mean 2049,17 1387,00 -32,3%median 1746,50 1102,00 -36,9%
(1457,232) (1153,019)
Blue-collar mean 412,00 218,75 -46,9%median 210,00 149,50 -28,8%
(495,463) (247,820)
1/ Standard Deviation in Parenthesis Consequently, one of the major criticisms of the privatization process is that a
significant reduction in the number of employees could be the major reason for the
improvement in performance, rather than a real increase in total factor productivity. To
address this issue, the author follows La Porta and López-de-Silanes (1999) to calculate the
impact on privatized companies if all the layoffs are included at their original salaries.25 For
this purpose, the cost of layoffs was calculated as: (Lpre-L1994)*Wagepre, where Wpre is the
average wage in the year preceding privatization, Lpre is the average number of employees in
the years preceding privatization, and L1994 is the level of employment in 1994 after
privatization.
The results are shown in Table 12. There is no significant difference between the post-
privatization performance indicators and the post-privatization performance indicators under
the assumption that there were no layoffs. For utilities, the percentage change in the profit
indicators goes from –2 percent to –5 percent, while in the case of the banks the impact is
bigger, averaging –12 percent and –26 percent for Banco Continental and Interbanc,
respectively. When looking at the percentage change in the net income efficiency, a variable
that is directly affected by the number of employees, TdP was impacted –12 percent,
Interbanc –34 percent, and Continental –14 percent.
25 It is important to mention that since privatization, privatized firms’ wages have had significant increases in both absolute and relative terms with respect to the industry. On average, salaries increased 180 percent at privatized companies and were 91 percent higher than the specific industry average.
42

In the case of TdP, contracting service companies created a significant amount of
indirect employment. These service companies frequently consisted of personnel laid off as a
result of the privatization. This required an additional exercise that involved subtracting the
costs from all service payments carried out by the company in order to find the net
employment layoff. This resulted in a positive percentage change for some of the profitability
indicators since the wage costs prior to privatization were smaller than what the company
pays the service companies. Furthermore, the number of employees in the
telecommunications sector rose from 13,000 employees in 1993 to 34,000 employees in
1998, according to OSIPTEL.
In general, for all the companies studied, the results of the modified version of La
Porta and López-de-Silanes’ (1999) exercise can be explained through the following reasons:
total wages of laid-off employees represented only 1.4 percent of total sales, since the
average wages paid prior to privatization were extremely low; there was a significant increase
in post-privatization sales, which spread labor costs over a wider base; and there was also a
significant increase in the productivity of other factors, especially capital, because of the
increase in coverage and the new investments undertaken by privatized firms.26
In the case of utility companies, there was a clear and insignificant increase in sales.
In telecommunications, the teledensity27 of fixed phones grew from 2.9 in 1993 to 7.8 in
1998. Similarly, cellular phones grew from 50,000 to 735,000 in the same two years. In the
electricity sector, the coefficient of electrification grew an average of 27 percent and the
generation of electricity grew an average of 25 percent as a result of the heavy volume of
investments (approximately US$682 million). Even more than in telephones and electricity,
there was an important rebalancing of tariffs see Torero and Pascó-Font (2000), which prior
to the privatization period were usually 75 percent or less of the costs of producing the
service.
In summary, the results show: a clear improvement in firm performance since
privatization, according to the Megginson et al. (1994) hypothesis; a relative improvement
compared to control groups; and an improvement in both labor productivity, as a
consequence of the layoffs, and total factor productivity.
26 It is important to mention that as in La Porta and López de Silanes, the methodology overstates the contribution of layoffs given the assumption that laid-off workers had zero productivity. 27 The number of phones per 100 inhabitants.
43

Table 12. ormanc
ROS ROA ROE Net Income Efficiency ROS ROA ROE Net Income Efficiency
TdP 0.385 0.162 0.287 81.385 0.366 0.155 0.272 71.883(0.09) (0.05) (0.08) (42.84) (0.09) (0.05) (0.07) (40.57)
Electrolima 0.170 0.056 0.072 136.742 0.165 0.054 0.069 132.152(0.08) (0.03) (0.03) (72.01) (0.08) (0.03) (0.03) (69.05)
Electroperu 0.257 0.030 0.050 258.850 0.252 0.029 0.049 252.863(0.22) (0.02) (0.04) (206.78) (0.22) (0.02) (0.04) (206.65)
Sedapal 0.160 0.027 0.034 33.496 0.154 0.026 0.032 25.160(0.04) (0.01) (0.01) (7.70) (0.04) (0.01) (0.01) (11.61)
Continental 0.091 0.011 0.130 23.434 0.080 0.010 0.115 20.051(0.05) (0.01) (0.09) (13.67) (0.06) (0.01) (0.09) (13.70)
Interbank 0.066 0.010 0.116 17.323 0.048 0.007 0.087 11.457(0.06) (0.01) (0.10) (14.27) (0.06) (0.01) (0.11) (16.37)
Note: Layoffs are included with the average wage of 1994 and their marginal productivity is assumed to be zero.All numbers are averages for the post’privatization period (1994-2000).
Impact of Layoffs on Perf e Indicators for Major Privatized Firms
Post-Privatization Post-Privatization without Layoffs
44

6. Conclusions Privatization began in Peru in 1991 in order to generate vital fiscal revenues for the
government and improve the quality and coverage of infrastructure and other services.
Privatization took place in the telecommunications, electricity, mining, financial services and
hydrocarbons sectors. The process was accompanied by sector reforms aimed at establishing
competitive markets and autonomous regulatory agencies. The result was one of Latin
America’s greatest privatization success stories. Nevertheless, it is important to note that a
strong record of economic policy and performance underpinned the success of the
privatization process. Macroeconomic stability, an open policy-making environment and
competitive sector markets gave the firms a stable and certain environment through 1998.
Without such conditions, success would not have been achieved.
Unfortunately, the depth of the reforms, especially the extent of privatization, was
uneven across sectors. Despite this reform mixture, the results in terms of improvement on
the supply side are positive and very significant. The analysis clearly shows a significant
improvement in firm performance since privatization.
It is clear from the analysis that privatization had an impact on public utility firms in
comparison to non-privatized firms that went through a similar pre-privatization
restructuring. Although over time there was a decrease in performance, implying less profits,
this could have been the result of an increase in competition in the sector and a slowdown in
services such as electricity due to the privatization process.
Comparable results can be found when examining the two major privatized sectors. In
both the financial and utilities sectors, a positive first difference effect was found. In the
financial sector, the main difference was the comparison with previously-privatized
companies. The performance indicators for financial enterprises were better than those of the
pre-privatization period, but they were not as good as those of the control group (private
banks). The results also show that privatized banks have a convergence tendency toward the
best performers in the private sector. The latter is primarily driven by the significant recent
improvement of Banco Continental.
It is clear that in the short-run, the impact of privatization on employment is negative
since SOEs usually hired people based on political rather than technical criteria. The
privatized firms had to adjust to the new market conditions and reduce the level of
employment; consequently, only 36 percent (approximately 43,000) of employees kept their
jobs after the privatization process. Two effects have been demonstrated: a significant
45

increase in indirect employment through services and average growth of 28 percent in total
employment—both direct and indirect—since privatization. Nevertheless, in order to measure
the real impact on employment in the medium-run, it is inadequate to study only employment
in a specific sector. One also has to study the effects on other sectors stemming from the
higher demand for services by the privatized firms.
Despite the success in terms of firm performance, service quality and consumer
benefits must be taken into account to make a balanced judgment of the privatization process.
As mentioned in Torero and Pascó-Font (2001), there exist important problems in the
privatization process that could explain why positive welfare impacts on consumers were not
very significant, or were even negative in electricity. Although the electricity sector has
shown important improvements, the positive effects of privatization have not yet reached
important regions of urban Peru. This could explain why, on average, consumers are not
experiencing an increase in welfare. In contrast, telephony is the sector that has experienced
the most significant improvements since privatization. Both in terms of supply and demand,
the results show a positive balance, including an increase in progressiveness, for the
telecommunications sector. However, a significant reduction in household consumer surplus
has occurred since 1997.
In summary, improved firm performance clearly suggests the necessity of continuing
the privatization process, especially in electricity, water, and other SOEs where major
reforms need to be concluded, or in some cases begun. This is only a supply-side analysis,
but when combined with results from the demand-side analysis (see Torero, Schroth, and
Pascó-Font (2000)), it is apparent that firms and regulatory agencies must develop adequate
policies to facilitate the transfer of performance benefits from privatized firms to consumers.
In so doing, even further increases in the gains in welfare derived from the process will be
possible. Policymakers must fortify the regulatory agencies and increase their independence.
They also must work with privatized firms to identify vulnerable groups and to develop
tailored measures, such as appropriate consumption plans, that will help increase consumer
welfare.
46

References Abdala, M. 1992. “Distributional Impact Evaluation of Divestiture in a High-Inflation
Economy: The Case of Entel Argentina.” Boston, United States: Boston
University. Doctoral dissertation.
Adam, C., W. Cavendish, and P. Mistry, 1992. Adjusting Privatization: Case Studies
From Developing Countries. London, United Kingdom and Portsmouth, United
States: J. Curry and Heinemann.
Aharoni, Y. 1990. “On the Measurement of Successful Privatization.” In: R. Ramamurti
and R. Vernon, editors. Privatization and Control of State-Owned Enterprises.
Washington, DC, United States: World Bank.
Arellano, M., and Bond, S. 1991. "Some Tests of Specification for Panel Data: Monte
Carlo Evidence and an Application to Employment Equations." Review of
Economic Studies: 58, 277-297.
Arellano, M., and Bond, S. 1998. “Dynamic Panel Data Estimation Using DPD98 For
GAUSS.” Mimeographed document.
Barber, B. and Lyon, J. 1996. “Detecting Abnormal Operating Performance: The
Empirical Power and Specification of Test Statistics.” Journal of Financial
Economics 41: 539-99.
Birch, M. and Haar, J., editors. 2000. The Impact of Privatization in the Americas.
Miami, United States: North South Center Press.
Boardman, A. and Vining, A. 1989. “Ownership and Performance in Competitive
Environments: A Comparison of the Performance of Private, Mixed, and State-
Owned Enterprises.” Journal of Law and Economics 32: 1-33.
Borcherding, T., Pommerehene, W. and Schneider, F. 1982. “Comparing the Efficiency
of Private and Public Production: The Evidence from Five Countries”. Zeitschrift
für Nationalokonomie 2: 127-56.
Bortolotti, B., Fantini, M. and Siniscalco, D. 2000. “Privatizations and Institutions: A
Cross-Country Analysis.” Forthcoming in Journal of Finance.
Bourbakri, N. and Cosset, J. 1998. “The Financial and Operating Performance of Newly
Privatized Firms: Evidence from Developing Countries.” Journal of Finance 53:
1081-1110.
47

Boycko, M., A. Shleifer, and R. Vishny, 1993. A Theory of Privatization. Cambridge,
United States: MIT Press.
Caillaud, B., R. Guesnerie, P. Rey, and J. Tirole. 1988. “Government Intervention in
Production and Incentives Theory: A Review of Recent Contributions.” RAND
Journal of Economics 19: 1-26.
Caves, R. 1990. “Lessons from Privatization in Britain: State Enterprise Behavior, Public
Choice, and Corporate Governance.” Journal of Economic Behavior and
Organization 13(2): 145-169.
Chong, A. and Calderon, C. 2000. “Causality and Feedback Between Institutional
Measures and Economic Growth.” Economics and Politics 12(1): 69-82.
Crandall, R. 1989. Efficiency Gains from Divestiture. Washington, DC, United States:
Brookings Institution.
Crépon, B., E. Duguet, and J. Mairesse. 1998. “Research, Innovation, and Productivity:
An Econometric Analysis at the Firm Level.” NBER Working Paper No. 6696.
Cambridge, United States: National Bureau of Economic Research.
Donahue, J. 1989. The Privatization Decision. New York, United States: Basic Books.
D’Souza, J. and Megginson, W. 1999. “The Financial and Operating Performance of
Privatized Firms During the 1990s.” Athens, United States: University of
Georgia.
Eckel, C., Eckel, D. and Singhal, V. 1997. “Privatization and Efficiency: Industry Effects
of the Sale of British Airways.” Journal of Financial Economics 43: 275-298.
Galal, A., Jones, L., Tandon, P. and Vogelsang, I. 1994. Welfare Consequences of Selling
Public Enterprises. Washington, DC, United States: Oxford University Press/World
Bank.
Greene, W., Econometric Analysis. 4th Ed. 2000. New York: Prentice-Hall.
Guasch, J.L. and Spiller, P. 1999. Managing the Regulatory Process: Design, Concepts,
Issues, and the Latin America and Caribbean Story. Washington, DC, United
States: World Bank.
Hachette, D. and Luders, R. 1992. La Privatización en Chile. Oakland, United States:
Institute for Contemporary Studies Press/Centro Internacional para el Desarrollo
Económico.
48

Hansen, L. 1982. “Large Sample Properties of Generalized Methods of Moments
Estimators.” Econometrica 50: 1029-1054.
Heckman, J., R. LaLonde, and J. Smith. 1999. “The Economics and Econometrics of
Active Labor Market Programs.” In O. Ashenfelter and D. Card, editors. Handbook of
Labor Economics, Vol. III. Elsevier, Amsterdam: North-Holland Press.
Heckman, J., and Hotz, J. 1989. "Choosing Among Alternative Nonexperimental
Methods for Estimating the Impact of Social Programs: The Case of Manpower
Training". Journal of the American Statistical Association 84: 862-880.
Heckman, J., and Smith, J. 1995. "Assessing the Case of Social Experiments". Journal of
Economic Perspectives 9: 85-110.
Heckman, J., H. Ichimura, and P. Todd. 1997. “Matching as an Econometric Evaluation
Estimator: Evidence from Evaluating a Job Training Program.” Review of
Economic Studies 64: 605-654.
Heckman, J., Ichimira, H., Smith, J. and Todd, P. 1996. “Characterizing Selection Bias
Using Experimental Data.” Econometrica 66: 1017-1098.
Kikeri, S., Nellis, J. and Shirley, M. 1994. “Privatization: The Lessons From Market
Economies.” World Bank Research Observer 9: 241-272.
La Porta, R. and López-de-Silanes, F. 1999. "Benefits of Privatization: Evidence from
Mexico". Quarterly Journal of Economics 114(4): 1193-1242.
Laffont, J.J. and Tirole, J. 1993. A Theory of Incentives in Procurement and Regulation.
Cambridge, United States: MIT Press.
López-de-Silanes, F. 1997. “Determinants of Privatization Prices.” Quarterly Journal of
Economics 112: 966-1028.
López-de-Silanes, F. and Zamarripa, G. 1995. “Deregulation and Privatization of
Commercial Banking: Pre- versus Post-Performance.” Review of Economic
Analysis/Revista de Análisis Económico. 10 (2): 113-164.
Lora, E., and Márquez, G. 1998. “El problema del empleo en América Latina:
Percepciones y hechos estilizados.” Document prepared for the meeting of IDB
Governors, Cartagena, Colombia.
Luders, R. 1991. “Chile’s Massive SOEs Divestiture Program, 1975-1990: Failures and
Successes.” Contemporary Policy Issues 9 (4): 1-19.
49

Mackenzie, G. 1998. “The Macroeconomic Impact of Privatization.” IMF Staff Papers 45
(2): 363-373.
Márquez, G. and Pagés, C. 1998. Ties That Bind: Employment Protection and Labor
Market Outcomes in Latin America. Document prepared for the meeting of IDB
Governors, Cartagena, Colombia.
Megginson, W. and Netter, J. 2001. "From State to Market: A Survey of Empirical
Studies on Privatization." Journal of Economic Literature 39: 321-389.
Megginson, W., Nash, R. and van Randerborgh, M. 1994. “The Financial and Operating
Performance of Newly Privatized Firms: An International Empirical Analysis.”
Journal of Finance 49(2): 403-452.
Ramamurti, R., editor. 1996. Privatizing Monopolies: Lessons From the
Telecommunications and Transport Sectors in Latin America. Baltimore, Untied
States: The Johns Hopkins University Press.
Ramamurti, R. and Vernon, R. 1991. Privatization and Control of State Owned
Enterprises. Washington, DC, United States: World Bank.
Rubin, D. 1974. “Estimating Causal Effects to Treatments in Randomized and
Nonrandomised Studies.” Journal of Educational Psychology 66: 688-701.
Rubin, D. 1977. “Assignment to Treatment Group on the Basis of a Covariate.” Journal
of Educational Studies 2:1-26.
Rubin, D. 1979. “Using Multivariate Matched Sampling and Regression Adjustment to
Control Bias in Observational Studies.” Journal of the American Statistical
Association 74: 318-328.
Sáenz, R. 1992. “An Overview of Privatization in Chile: The Episodes,
the Results, and the Lessons.” Santiago, Chile: CIEPLAN.
Mimeographed document. Saavedra, J. and Maruyama, E. 2000. “Rigidez o flexibilidad del mercado laboral
peruano: Un análisis económico de la legislación laboral.” Working paper No. 28.
Lima, Peru: GRADE. Saavedra, J., and Torero, M. 1999. “Labor Market Reforms and Their Impact on Formal Labor Demand
and Job Market Turnover: The Case of Peru.” Working Paper R-394. Washington, DC, United
States: Inter-American Development Bank, Research Department.
50

Shapiro, C. and Willig, R. 1990. “Economic Rationales for the Scope of Privatization.”
In: E. Suleiman and J. Waterbury, editors. The Political Economy of Public Sector
Reform and Privatization. London, United Kingdom: Westview Press.
Shleifer, Andrei; 1998. “State versus Private Ownership.” NBER Working Paper No.
6665. Cambridge, United States: National Bureau of Economic Research.
Shleifer, A. and Vishny, R. 1994. “Politicians and Firms.” Quarterly Journal of
Economics. 46: 995-1025. Shukla, J. and Guasch, J.L. 1999. “Peru: Private Participation in Infrastructure. Overview of Achievements,
Priorities and Opportunities.” Washington, DC, United States. Mimeographed document. Sinn, H.W., 1992. “Privatization in East Germany.” NBER Working Paper No. 3998.
Cambridge, United States: National Bureau of Economic Research.
Torero, M., E. Schroth, and A. Pascó-Font. 2000. “The Impact of the Privatization of
Telecommunications in Peru on the Welfare of Urban Consumers.” Lima, Peru:
Mimeographed document.
Torero, M. and Pascó-Font, A. 2001. The Social Impact of Privatization and Regulation
of Utilities in Urban Peru. Helsinki, Finland: Wider.
Vickers, J. and Yarrow, G. 1988. Privatization: An Economic Analysis. Cambridge,
United States: MIT Press.
Vining, A. and Boardman, A. 1992. “Ownership versus Competition: Efficiency in Public
Enterprises.” Public Choice 73: 205-39.
World Bank. 1995. Bureaucrats in Business: The Economics and Politics of Government
Ownership. Washington, DC, United States: Oxford University Press/World
Bank.
Yan, B., Chen, X. and Roberts, M. 1997. “Firm Level Evidence on
Productivity Differentials, Turnover, and Exports in Taiwanese
Manufacturing.” NBER Working Paper No. 6235. Cambridge,
United States: National Bureau of Economic Research.
Yan, B. Chung, S. and Roberts, M. 1998. “Productivity and The
Decision to Export: Micro Evidence from Taiwan and South
51

Korea.” NBER Working Paper No. 6558. Cambridge, United
States: National Bureau of Economic Research. o Data Sources Banco Central de Reserva del Perú (BCRP). 1986-2000. Annual Report. ----. Web Page: http://bcrp.gob.pe. Cementos Lima S.A. 1988 – 1998. Annual Report. Lima, Perú: Cementos Lima, S.A. Comisión de Promoción de la Inversión Privada (COPRI). 1996. White Book. Cementos
Lima S.A. Perú. ----. White Book; CEPREL – Electrolima S.A. Perú ----. White Book; Electroperú, S.A. Perú ----. White Book; Electro Sur Medio, S.A. Perú ----. White Book; Empresas Regionales de Electricidad: Electro Norte, S.A., Electro
Norte Medio, S.A., Electro Noroeste, S.A. and Electro Centro, S.A. Perú ----. Web page: http://www.copri.org. Comisión de Tarifas Eléctricas (CTE). 1984, 1985, 1986 – 1989, 1990 – 1991, 1996,
1999. Annual Report. Lima, Perú. ----. 1992-1993, 1994, 1995, 1996, 1997, 1998, 1999. Statistical Yearbooks. Lima, Perú. Comisión Nacional Supervisora de Empresas y Valores (CONASEV); Web Page:
http://www.conasevnet.gob.pe. Compañía Peruana de Teléfonos S.A.. 1985 – 1987, 1990 – 1993. Annual Report. Lima,
Perú. Electrolima, S.A. 1985 – 1988, 1990 – 1994, 1997. Annual Report. Lima, Perú:
Electrolima, S.A. Electroperú, S.A. 1985 – 1999. Annual Report. Lima, Perú: Electroperú, S.A. Entel Perú, S.A. 1990, 1991, 1993. Annual Report. Lima, Perú: Entel Perú, S.A. ----. 1985 – 1992. Statistical Yearbooks. Lima, Perú: Entel Perú, S.A.
52

Sedapal, S.A. 1997. “Historia del abastecimiento del agua potable de Lima 1535 - 1996”.
Lima, Perú: Sedapal, S.A. Sedapal, S.A. 1984 –1999. Annual Report. Lima, Perú: Sedapal, S.A. Superintendencia de Banca y Seguros (SBS). 1986 – 2000. Weekly Notes. Lima, Perú. Superintendencia Nacional de Servicios de Saneamiento (SUNASS). 1998. “Indicadores
de Gestión 1996–1998”. Lima, Perú: SUNASS. ----. 1996 – 1999. Annual Report. Lima, Perú: SUNASS. ----. Centro de Documentación, Web Page:
http://www.sunass.gob.pe/cendoc.html. Telefónica del Perú, S.A. 1994 – 2000. Annual Report. Lima, Perú: Telefónica del Perú, S.A. Other Data Sources: From the Commission of Energy Tariffs: The Statistical Yearbook (1994–1998). A yearly publication that details regulation of electricity rates and economic results for the Peruvian electricity market. CTE Informs (June 1999–November 2000). Monthly publication with news about regulation, markets, agents and other current topics of interest in the electricity and hydrocarbon sectors in Peru and all around the world. El Informativo (June 1996–November 2000). Periodical publication containing technical articles, market information, evolution of rates, company news, statistics and sector news. Commercial Information (First Quarter, 2000). Publication containing results from the processing and analysis of commercial information provided by the electric sector companies. Yearly Report (1994–1999). Electric Sector Operations (January 2000–November 2000). Monthly publication containing information on production and demand of electricity, prices and other information related to the operation of the sector.
53

From OSIPTEL: The Transformation of Telecommunications in Peru: 1995 Report. Regulation and the Telecommunications Market: 1996 Report. The Opening of the Telecommunications Market: 1997 Report. Consumers and Telecommunications: 1998 Report. Five years in the telecommunications market: 1999 Report. Institutional Report, 2000. Technical Studies (various titles). Studies in Telecommunications (various titles). Bulletins (various titles).
54

Appendix 1
A.1.1. COPRI: White Books The White Books represent essential information sources for the pre-privatization period.
The White Books contain a series of valuation studies of privatized companies, financial
information, engineering, employment, installed capacity, market share and projection
data, etc. They are the primary source of statistical information for the companies. At the
same time, it should be mentioned that there are as many White Books as privatization
processes. At the end of each process, the Special Privatization Committee (CEPRI) is
charged with publishing the White Book for that particular process.
In the case of companies that were divided to be privatized, the White Books
allowed the authors to obtain disaggregated statistical information. Alternatively, in the
case of the privatization of joint ventures (ie., Entel and CPT), these books permitted the
the compilation of consolidated financial information. A.1.2. MITINCI: Yearly Economic Surveys The Yearly Economic Surveys (EEAs) are carried out each year for every manufacturing
company in Peru by the Industry, Tourism, Integration and International Commercial
Negotiation Ministry (MITINCI). The companies are required by law to answer this
survey, which consists of three established forms. Despite this legal requirement, a large
percentage of companies do not abide by this obligation even after the MITINCI tries to
follow up with them.
The first form is sent to companies with a maximum of 4 workers, the second to
companies with 5 to 19 workers, and the last one to companies with 20 or more workers.
The surveys differ in size. The survey for small companies has nine chapters, while the
survey for large companies has 17 chapters.
This information helps to create a database that identifies all the relevant variables
of the survey for the years between 1992-1996, as well as the CIIIU 4 digits at company
level.
Specifically, in the case of companies with 20 or more workers, the chapters in the
Yearly Economic Surveys include the following information:
55

• Identification and location of the business or industrial plant. • Sales price list of products manufactured by the business. • Working staff during the year. • Remunerations and other staff expenditures during the year. • Expenditure on electricity. • Expenditures on services carried out by a third party, taxes and diverse
administration charges paid by the business, and cost of merchandise sold. • Inventory. • Yearly general sales tax, selective consumption tax, special tax and others. • Annual input expenditures. • Annual expenditures on raw materials and auxiliary materials. • Annual expenditures on fuels and lubricants. • Annual production for sale, transfer to or manufacture by a third party. • Annual Intermediate production. • Summary of fixed assets movement. • Summary of accumulated depreciation movement. • Annual real and potential production by main production lines. • Annual net sales and other revenues during the year.
A.1.3. SBS: Monthly Financial Information The main objective of the Bank and Insurance Superintendence (SBS) is to preserve the
interest of the depositors, the insured and the members of the Private Pension System.
The agency’s supervisory duty consists of constantly monitoring the solvency and
integrity of each of the companies that act in the market. One of its primary missions is to
generate confidence in the public in relation to the solvency of the financial system.
Secondarily, it provides adequate and appropriate information for the promotion of
prudent behavior by economic agents. A.1.4. MTPS : Pay Roll Summary Sheet The pay roll summary sheet is a complex directory containing labor information for
businesses with ten or more workers. This is due to the fact that the Labor Ministry
requires all such businesses to report their payrolls to the Ministry annually. The authors
used this data source to access companies’ labor information. A.1.5. SBS : Monthly Financial Information
56

The Bank and Insurance Superintendency (SBS) is the agency in charge of the regulation
and supervision of the Financial System. This information, generated and spread through
many publications, will be very useful for acquiring information at the bank level, which
in turn allows for the acquisition of data on financial incomes, capital expenditures,
assets, personal expenditures, other expenditures, deposits, offerings, financial
expenditures, interbank deposits, overdue portfolios, number of agencies, number of
workers and net profit. Additionally, the detailed information provided by the SBS
simplifies the tracking of the different mergers and takeovers that occurred in the last ten
years. This is possible due to the fact that The Bank and Insurance Superintendence is in
charge of consolidating the statistical information of the banks.
A.1.6. CONASEV: Financial Statements of Quoted Companies; Company Ranking, 1997-99 The National Supervising Committee of Companies and Securities (CONASEV)
promotes efficiency in the security and product markets through regulation, supervision,
and diffusion of information. At the same time, this will strengthen the confidence and
transparency between participants. Every quoted company in the Stock Exchange in Lima
is forced to give financial and accounting information. On the other hand, CONASEV is
in charge of spreading this information through periodical publications, through its
documentation center (CENDOC) or in real time through the Internet. This information is
useful in this study only for those private companies listed on the stock exchange.
CONASEV also offers the public a general ranking of the top companies in the
country for the period 1997-1999 in order to contribute to better knowledge of corporate
management in the country. The ranking contains information according to income level,
total assets, net fix assets, patrimony and year outcome, as well as classification by
economic activity. A.1.7. OSIPTEL: Reports The Supervisory Agency for Private Investment in Telecommunications (OSIPTEL) is
easily the most important source of data for the telecommunications sector. Since its
creation in July 1993, OSIPTEL’s main functions have been the promotion of the
development of public telecommunication services, protecting consumer rights, and
57

promotion and guarantee of a free and fair competitive environment. Throughout its six
years of institutional life, OSIPTEL has managed to compile and diffuse, through various
publications, statistical information relevant to the sector.28
These publications grant access to relevant sectoral information since 1993. This
information includes coverage statistics, quality of service, rates, earnings structure,
efficiency and economic results. A.1.8. OSINERG: Reports The Supervisory Agency for Investment in Energy (OSINERG) is in charge of
supervising the activities carried out by companies in the sub sectors of electricity and
hydrocarbons. It is, therefore, a valuable source of information for the energy sector.
Created December 30, 1996, OSINERG was conceived as an assessment and supervision
tool to guarantee compliance of rules and contracts with concessionary companies.
Among other functions, OSINERG supervises compliance with legal and technical
norms, as well as commitments to the Government made through the electric concessions
contracts. Furthermore, OSINERG must ensure the protection of consumers’ rights in the
sub sector of electricity, which includes overseeing the security, quality and continuity of
the service, and protecting the environment from the possible damages that these
activities might bring about. A.1.9. CTE: Reports
The Commission of Energy Tariffs is a technical and decentralized division of the Energy
Sector. It is responsible for setting rates for electricity, liquid hydrocarbon transportation,
natural gas transportation and natural gas distribution. In competitive markets, the
companies lack influence—at least to a relevant degree—on market prices; on the
contrary, monopolies have enough market power to fix them. As a consequence, and to
prevent the user from being adversely affected by the setting of monopoly rates, the CTE
is in charge of regulating these prices, with rates that reflect the production costs plus a
reasonable profit margin. In this way, the benefits are spread out not only between the
suppliers of the service, but also between the users.
28 A list of some of its more important publications can be found in the Annexes.
58

Since its establishment in 1999, the CTE has been charged with compiling and
spreading statistical information relevant to the electric sector through diverse publications.
It also constituted an important source of information for this research project. A.1.10. SUNASS: Reports The National Sanitation Services Superintendence (SUNASS) was created in December
1992 by the Law Decree Nº 25965. As a regulatory and supervisory agency of sanitation
services in Peru, SUNASS guarantees the quality of sanitation services, establishes the
general conditions for the supply of the service, issues complementary norms for the
organization of the Sanitary Services Enterprises (EPS) and regulation of rates, and
supervises the fulfillment of service and rate-setting norms.
Among the publications through which SUNASS releases statistical information,
its reports are the most important. They provide data on coverage statistics, quality of
services, rates, structure of earnings, efficiency, economic results, and other topics.
A.1.11. INEI : The National Institute of Statistics and Computing The National Institute of Statistics and Computing (INEI) is the agency in charge of
controlling, planning, directing and supervising Peru’s official statistical activities.
Consequently, it is the primary source of information for sectoral statistics and prices.
A.1.12. BCR: Non Financial Public Sector Statistical Summary The aim of the autonomous Central Bank is to preserve monetary stability. Its principal
functions are the regulation of currency and the financial credit system, the administration
of the international reserves under its control, and others as described in its Charter. The
Bank is obliged to inform the country, accurately and periodically, about the state of the
national finances. Under this obligation, the Bank published until 1989 a Non-Financial
Public Sector Statistical Summary. This summary contained aggregated and disaggregated
statistical information on administration of public enterprises. Consequently, it was a
crucial source of information for the pre-privatization period, along with the White Books.
Finally, it should be noted that all data presented in this report has been deflated
using the General Price Index for the year 1994 (GPI). The GPI was used instead of the
59

Consumer Price Index because it is able to control for periods of hyperinflation, which
characterized the Peruvian economy during the 1980s and early 1990s.
60
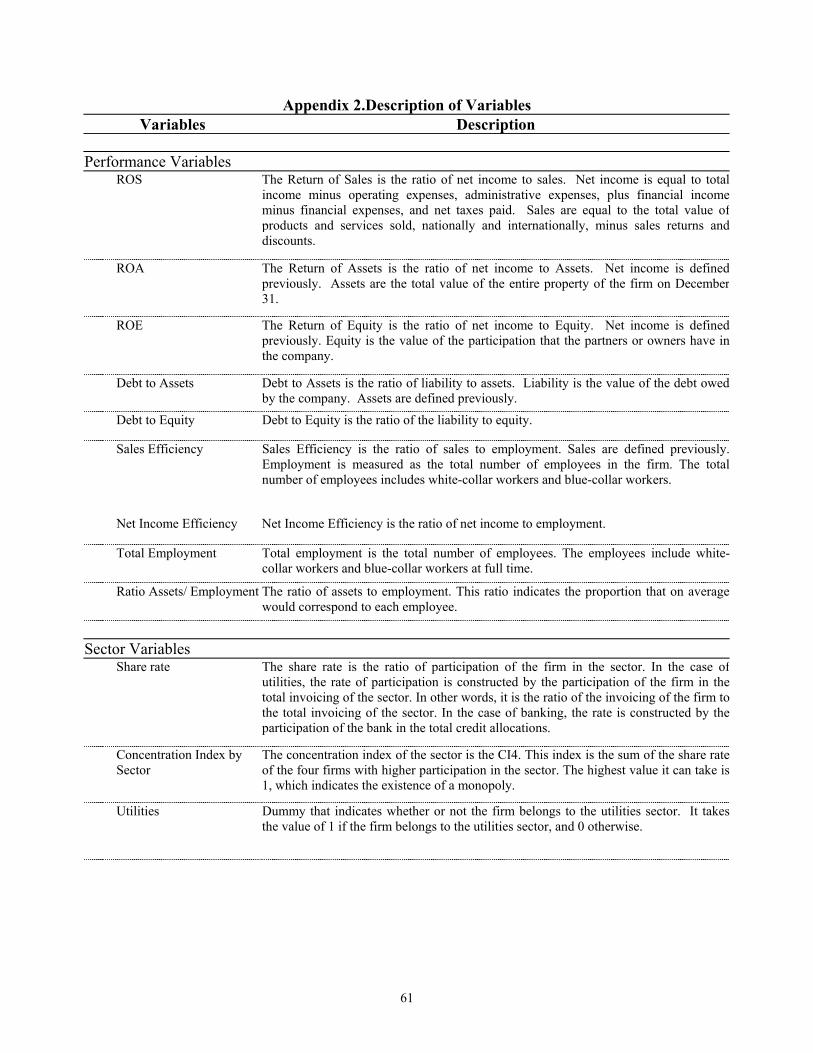
Appendix 2.Description of Variables Variables Description
Performance Variables ROS The Return of Sales is the ratio of net income to sales. Net income is equal to total
income minus operating expenses, administrative expenses, plus financial incomeminus financial expenses, and net taxes paid. Sales are equal to the total value ofproducts and services sold, nationally and internationally, minus sales returns anddiscounts.
ROA The Return of Assets is the ratio of net income to Assets. Net income is defined previously. Assets are the total value of the entire property of the firm on December31.
ROE The Return of Equity is the ratio of net income to Equity. Net income is definedpreviously. Equity is the value of the participation that the partners or owners have in the company.
Debt to Assets Debt to Assets is the ratio of liability to assets. Liability is the value of the debt owedby the company. Assets are defined previously.
Debt to Equity Debt to Equity is the ratio of the liability to equity.
Sales Efficiency Sales Efficiency is the ratio of sales to employment. Sales are defined previously.Employment is measured as the total number of employees in the firm. The totalnumber of employees includes white-collar workers and blue-collar workers.
Net Income Efficiency Net Income Efficiency is the ratio of net income to employment.
Total Employment Total employment is the total number of employees. The employees include white-collar workers and blue-collar workers at full time.
Ratio Assets/ Employment The ratio of assets to employment. This ratio indicates the proportion that on averagewould correspond to each employee.
Sector Variables Share rate The share rate is the ratio of participation of the firm in the sector. In the case of
utilities, the rate of participation is constructed by the participation of the firm in thetotal invoicing of the sector. In other words, it is the ratio of the invoicing of the firm tothe total invoicing of the sector. In the case of banking, the rate is constructed by the participation of the bank in the total credit allocations.
Concentration Index by Sector
The concentration index of the sector is the CI4. This index is the sum of the share rateof the four firms with higher participation in the sector. The highest value it can take is 1, which indicates the existence of a monopoly.
Utilities Dummy that indicates whether or not the firm belongs to the utilities sector. It takesthe value of 1 if the firm belongs to the utilities sector, and 0 otherwise.
61

Privatization Variables Privatization Dummy that indicates whether or not the firm is privatized. It takes the value of 1 if
the firm is privatized from the year of the transaction, and 0 otherwise.
Concession Dummy that indicates if the firm is given in concession. It takes the value of 1 if thefirm is given in concession from the year of the transaction, and 0 otherwise.
Value of Transactions The value of the transactions is the amount in $US millions paid by the investor for the available share package.
Projected Investment The projected investment is the amount in $US million that the investor commits toinvest.
Operator's Characteristics Foreign Participation Dummy that indicates whether or not foreign investors own a majority stake in the
firm. It takes the value of 1 if foreign investors have the highest percentage of thestocks, and 0 otherwise.
Buyer's Experience Dummy that indicates whether or not the buyer has experience in the sector. It takesthe value of 1 if the buyer has previous experience in the sector, and 0 otherwise.
Regulatory Agency Variables Regulated Industry Dummy that indicates whether or not the firm belongs to a regulated industry. It takes
the value of 1 if the firm belongs to a regulated industry, and 0 otherwise.
Regulatory Agency Dummy that indicates the existence of a regulatory agency in the sector. It takes thevalue of 1 if a regulatory agency operated in the firm's sector in that year, and 0otherwise.
Price Cap Regulation Dummy that indicates if there is a price cap regulation in the sector. It takes the valueof 1 if there was a price cap regulation that year, and 0 otherwise.
Rate of Return Regulation Dummy that indicates if the rate of return in the sector is regulated. It takes the value of 1 if the rate of return is regulated, and 0 otherwise.
Discretionary Prices Dummy that indicates if regulation is managed through discretionary prices. It takesthe value of 1 if the regulatory agency adopts a discretionary prices regulation in that year, and 0 otherwise.
62

Macro Variables Peruvian per Capita Real
GNP Per Capita Real GNP is the Gross Net Product by inhabitant at 1994 prices.
Average Precipitation Average precipitation is the average annual rain precipitation. The rain precipitation is measured in cubic millimeters.
Average Exchange Rate The average exchange rate is the annual average exchange rate. Exchange rate is thevalue of US$1 in Nuevos Soles.
IPG A weighted average of individual prices in a particular year, relative to prices in the base year (1994). A measure of how much the average price has changed since the baseyear.
GNP The Gross Net Product is the value of goods and services produced by a country’sresidents over a year at 1994 prices. GNP is the sum of consumption, investment, government expenses, and export, minus import.
Population Population is the total number of inhabitants in Peru.
Agriculture GNP The Agriculture Gross Net Product is the value of the goods and services produced in the agricultural sector over a year at 1994 prices.
Fishing GNP The Fishing Gross Net Product is the value of the goods and services produced in thefishing sector over a year at 1994 prices.
Mining & Hydrocarbons GNP
The Mining and Hydrocarbons Gross Net Product is the value of the goods and servicesproduced in the mining & hydrocarbons sector over a year at 1994 prices.
Manufacturing GNP The Manufacturing Gross Net Product is the value of the goods and services producedin the manufacturing sector over a year at 1994 prices.
Construction GNP The Gross Net Product is the value of the goods and services produced in theconstruction sector over a year at 1994 prices.
Total Domestic Savings (% GNP)
The change in the value of assets of the economy as a whole. It is calculated as apercentage of the GNP.
Public Savings (% GNP) The change in the value of assets of Peru’s public sector. It is calculated as apercentage of the GNP.
Private Savings (% GNP)
The change in the value of assets of Peru’s private sector. It is calculated as apercentage of the GNP.
Total Investment (% GNP)
The value of the total purchases of capital goods as a percentage of GNP.
Public Investment (% GNP)
The value of the public purchases of capital goods as a percentage of GNP.
Private Investment (% GNP)
The value of the private purchases of capital goods as a percentage of GNP.
Current Account Balance (% GNP)
The value of goods produced by domestic residents (including the net factor income from abroad) plus net transfers from abroad, less the expenditure by domestic residentson goods as a percentage of the GNP. If the Current Account Balance is positive(negative), then there is a surplus (deficit) in the current account.
Trade Balance (% PBI) Is equal to the value of exports of goods minus the value of imports of goods. It isexpressed as a percentage of the GNP.
Services Balance (% PBI) Is equal to the value of exports of services minus the value of imports of services. It is
63

expressed as a percentage of the GNP. Net Factor Income (%
GNP) Net income from factor, labor or capital, which includes claims on assets abroad. It iscalculated as a percentage of the GNP.
Current Transfers (% GNP)
Is equal to the value of received foreign assets minus assets transferred outside thecountry.
Total Export The value of total exports in $US millions.
Total Import The value of total imports in $US millions.
Private and Public Total External Debt
The value of debt contracted with foreign agents by public and private organizations in$US millions.
Public Total External Debt The value of the debt contracted with foreign agents by the government in $USmillions.
RIN The Net International Reserves are the value in $US millions of liquid assets, including international currency, that the Central Bank uses for international transactions.
Inflation (%) Inflation is the percentage change in the general level of prices. The general level ofprices is measured by the IPG.
Export (% GNP) The value of exports as a percentage of the GNP. Exports are goods that are producedby the residents of a country but are sold to foreigners.
Import (% GNP) The value of imports as a percentage of the GNP.
Export + Import (% PBI) The value of exports plus imports as a percentage of the GNP.
Terms of Trade Index The terms of trade index is the price of Peru’s tradable goods expressed relative to theprice of a market basket of the world’s tradable goods. It is approximated by the ratio of Peru’s export prices to import prices.
Potable Water The national production of potable water in a year measured in cubical meters.
Electricity The national production of electricity in a year measured in kilowatts per hour.
Telephony The number of telephone calls in a year.
Vital Minimum Wage Legal Minimum Wage that a firm can pay. Index of Total
Employment (Jan95=100) The number of persons working at jobs in the market sector divided by the number ofworkers in January 1995 and multiplied by 100.
Strikes The reported number of strikes in a year.
Affected Workers The total number of workers affected by strikes.
Man-hours Lost This variable is the sum of all lost work hours per worker due to strikes.
Subversive Activity Subversive activity is measured as the number of subversive attacks in a year.
Financial Variables Personal Expenses per
Employee Personal expenses per employee is the ratio of total personal expenses to the totalnumber of employees.
64

Bad Loan Portfolio Bad Loan Portfolio is the ratio of bad loans to the net loan portfolio. Bad loans aredefined as expired loans plus legal costs. Net loan portfolio is equal to current accountsless discounts, plus long-term and short-term loans, refinanced loans, mortgage and other loans.
Administrative Expenses Administrative expenses is the ratio of total administrative expenses to financialincome. Administrative expenses are equal to personal expenses plus general expensesand depreciation and amortization. Financial income is equal to income by commissions and interests on loans.
Financial Margin per Branch
Financial Margin per Branch is the ratio of financial margin to branch. Financialmargin is equal to financial income less financial expenses. Branch is defined as the total number of offices.
65

Appendix 3 A.3.1. Electric Sector
1986 - 1993 1994 1995 1996 1997 1998 1999
Electroperú Electroperú Electroperú Electroperú ElectroperúElectroperú Electroperú Egenor Egenor Egenor Egenor Egenor
Egesur Egesur Egesur Egesur EgesurCahua Cahua Cahua Cahua Cahua
Luz del Sur Luz del Sur Luz del Sur Luz del Sur Luz del Sur Luz del SurElectrolima Edegel Edegel Edegel Edegel Edegel Edegel
Edelnor Edelnor Edelnor Edelnor Edelnor EdelnorElectrolima EDE-Chancay
EDE-Cañete EDE-Cañete EDE-Cañete EDE-Cañete EDE-Cañete
Electro Centro Electro Centro Electro Centro Electro Centro Electro Centro Electro CentroElectro Nor Oeste Electro Nor Oeste Electro Nor Oeste Electro Nor Oeste Electro Nor Oeste Electro Nor OesteElectro Norte Electro Norte Electro Norte Electro Norte Electro Norte Electro NorteElectro Norte Medio Electro Norte Medio Electro Norte Medio Electro Norte Medio Electro Norte Medio Electro Norte MedioElectro Oriente Electro Oriente Electro Oriente Electro Oriente Electro Oriente Electro OrienteElectro Sur Electro Sur Electro Sur Electro Sur Electro Sur Electro SurElectro Sur Este Electro Sur Este Electro Sur Este Electro Sur Este Electro Sur Este Electro Sur EsteElectro Sur Medio Electro Sur Medio Electro Sur Medio Electro Sur Medio Electro Sur Medio Electro Sur Medio
Seal Seal Seal Seal Seal Seal Seal
Emsemsa Emsemsa Emsemsa Emsemsa EmsemsaEtevensa Etevensa Etevensa Etevensa EtevensaEgasa Egasa Egasa Egasa EgasaGera Gera Gera Gera GeraEgemsa Egemsa Egemsa Egemsa EgemsaEtecen Etecen Etecen Etecen EtecenEtesur Etesur Etesur Etesur EtesurElectro Ucayali Electro Ucayali Electro Ucayali Electro Ucayali Electro Ucayali
Coelvisa Coelvisa Coelvisa CoelvisaSers Sers Sers SersC.H. Virú
Electro Andes Electro Andes Electro AndesEepsa Eepsa EepsaChavimochic Chavimochic Chavimochic
Shougesa ShougesaPariac PariacElectro Pangoa Electro Pangoa
EmseusaElectro TocacheElectro PunoSan Gabán
Electric Companies
66

A.3.2. Financial Sector
1986 1987 1988 1989 1990
Amazónico 1962 Si Liquidación Amazónico Amazónico Amazónico Amazónico AmazónicoAmerica 1966 America America AmericaBandesco 1980 Bandesco Bandesco Bandesco Bandesco BandescoCentral de Madrid 1984 Central de Madrid Central de MadridCCC 1988 CCC CCC Citibank 1920 Citibank Citibank Citibank Citibank CitibankComercio 1967 Comercio Comercio Comercio Comercio ComercioContinental 1951 Si Privatización Continental Continental Continental Continental ContinentalContinorte 1961 Si Liquidación Continorte Continorte Continorte Continorte ContinorteCrédito 1889 Crédito Crédito Crédito Crédito CréditoDe los andes 1962 Si Liquidación De los andes De los andes De los andes De los andes De los andesDel Norte 1960 Del Norte Del Norte Del Norte Del Norte Del NorteExtebandes 1982 Extebandes Extebandes Extebandes Extebandes ExtebandesFinanciero 1986 Financiero Financiero Financiero FinancieroInteramericano 1991 Interandino 1990 Interandino InterandinoInterbank 1897 Si Privatización Interbank Interbank Interbank Interbank InterbankLatino 1982 Latino Latino Latino Latino LatinoLima 1952 Lima Lima Lima Lima Lima Londres 1936 Londres LondresManhattan 1984 ManhattanMercantil 1984 Mercantil Mercantil Mercantil Mercantil MercantilPopular 1889 Si Liquidación Popular Popular Popular Popular PopularProbank 1990 ProbankSur Perú 1962 Sur Perú Sur Perú Sur Perú Sur Perú Sur PerúSurmebanc 1962 Si Liquidación Surmebanc Surmebanc Surmebanc Surmebanc SurmebancTokyo 1965 Tokyo TokyoWiese 1943 Wiese Wiese Wiese Wiese WieseSudamericano 1993 Banex 1993 Nuevo Mundo 1993 Del Libertador 1994 Del Trabajo 1994 Solventa 1994 Serbanco 1996 Boston 1996 Republica 1980 Orion 1995 Del pais 1997 Mibanco 1998 BNP-andes 1999
Source: Superintendencia de Banca y Seguros, Memorias 1986-1991. Superintendencia de Banca y Seguros, Información Financiera Mensual 1992-2000.
Evolution of Financial Sector
Birth Year Name State Participation
Financial Reform: 1992-98
67

1991 1992 1993 1994 1995 1996 1997 1998 1999 2000
Amazónico AmazónicoAmericaBandesco Bandesco Bandesco Bandesco BandescoCentral de MadridCCC CCCCitibank Citibank Citibank Citibank Citibank Citibank Citibank Citibank Citibank Citibank CitibankComercio Comercio Comercio Comercio Comercio Comercio Comercio Comercio Comercio Comercio ComercioContinental Continental Continental Continental Continental Continental Continental Continental Continental Continental ContinentalContinorte ContinorteCrédito Crédito Crédito Crédito Crédito Crédito Crédito Crédito Crédito Crédito CréditoDe los Andes De los AndesDel Norte Del Norte Del Norte Del Norte Del Norte Del Norte Del Norte Del Norte Del Norte Del Norte NBK-BostonExtebandes Extebandes Extebandes Extebandes Extebandes Extebandes Extebandes Extebandes Standard Standard StandardFinanciero Financiero Financiero Financiero Financiero Financiero Financiero Financiero Financiero Financiero FinancieroInteramericano Interamericano Interamericano Interamericano Interamericano Interamericano Interamericano Interamericano Interamericano Interamericano InteramericanoInterandino Interandino Interandino Interandino Interandino Santander Santander Santander Santander Santander SantanderInterbank Interbank Interbank Interbank Interbank Interbank Interbank Interbank Interbank Interbank InterbankLatino Latino Latino Latino Latino Latino Latino Latino Latino Latino LatinoLima Lima Lima Lima Lima Lima Lima Lima Lima Fusión con WieseLondresManhattanMercantil Mercantil Mercantil Mercantil Mercantil Mercantil Fusión con SantanderPopular PopularProbank Probank Probank Probank Probank Probank Probank Probank Probank Fusión con Del NorteSur Perú Sur Perú Sur Perú Sur Perú Sur Perú Sur Perú Sur Perú Sur Perú Sur Perú Sur PerúSurmebanc SurmebancTokyoWiese Wiese Wiese Wiese Wiese Wiese Wiese Wiese Wiese Wiese WieseSudamericano Sudamericano Sudamericano Sudamericano Sudamericano Sudamericano Sudamericano Sudamericano SudamericanoBanex Banex Banex Banex Banex Banex BanexNuevo Mundo Nuevo Mundo Nuevo Mundo Nuevo Mundo Nuevo Mundo Nuevo Mundo Nuevo Mundo Nuevo Mundo Nuevo MundoDel Libertador Del Libertador Del Libertador Fusión con Sur PeruDel Trabajo Del Trabajo Del Trabajo Del Trabajo Del Trabajo Del Trabajo Del TrabajoSolventa Solventa Solventa Solventa Solventa Fusión con Del NorteSerbanco Serbanco Serbanco Serbanco SerbancoBoston Boston Boston Boston Boston BostonRepublica Republica Republica RepublicaOrion Orion Orion OrionDel pais Del pais Del pais Fusión con Nuevo MundoMibanco Mibanco Mibanco MibancoBNP-Andes BNP-Andes BNP-Andes
Source: Superintendencia de Banca y Seguros, Memorias1986-1991. Superintendencia de Banca y Seguros, Información Financiera Mensual
Name
Evolution of Financial Sector (continued)
68

Appendix 4. Basic Statistics (Means and Standard Deviations)
Obs. ROS ROA ROE Debt toAssets
Debt toEquity
SalesEfficiency
Net IncomeEfficiency
Number ofWorkers
Assets toEmployment
NetIncome Assets
Non-Financial Firms 336 -0.2493194 -0.0389506 0.5950617 0.46898 33.37169 369.8179 -43.1846 1336.634 1443.96 -70480 1540130(0.716) (0.231) (12.183) (0.555) (519.600) (554.375) (262.358) (2,533.352) (3,508.70) 802842 3612434
332 298 297 301 300 317 317 336 296 331 311
TelecommunicationTelefonica 15 0.1743028 0.0770865 0.1358832 0.4623202 1.047343 270.1213 37.45725 10523.47 663.5529 343455 5398240
(0.219) (0.094) (0.167) (0.153) (0.774) (177.889) (51.469) (4,284.891) (490.97) 427695 2266784
EnergyElectro Centro 14 -0.442782 -0.0336314 -0.053096 0.2634567 0.4065865 146.7447 -43.9994 617.5714 722.4821 -31089 388853
(0.763) (0.053) (0.079) (0.144) (0.286) (72.391) (60.796) (150.036) (338.59) 42847 9989614 10 10 10 10 14 14 14 11 14 11
Electro Nor Oeste 13 -0.6004902 -0.1410099 -0.2587486 0.4593327 1.139803 203.2694 -94.7579 372.4615 695.3607 -35737 240917(0.952) (0.250) (0.425) (0.181) (1.067) (89.244) (114.649) (87.024) (283.27) 47839 103963
13 10 10 10 10 13 13 13 11 13 11Electro Norte 14 -0.4727198 -0.1047444 -0.5336266 0.4547396 2.030046 156.8029 -54.04638 326.5 405.5334 -18137 125990
(0.597) (0.081) (1.196) (0.219) (3.999) (85.136) (44.423) (45.996) (135.30) 15795 3300713 10 10 10 10 13 13 14 11 13 11
Electro Norte Medio 14 -0.3671124 -0.0248074 -0.0663969 0.3872155 1.01031 260.3288 -69.08984 550.3571 1024.264 -41454 468014(0.664) (0.039) (0.096) (0.242) (1.137) (183.681) (116.459) (140.053) (777.21) 71836 298246
14 10 10 10 10 14 14 14 11 14 11Electro Oriente 14 -0.4367591 -0.0458596 -0.0736331 0.3292673 0.5553846 237.3511 -84.5527 199.1429 1285.012 -17795 240264
(0.613) (0.040) (0.069) (0.139) (0.390) (86.825) (95.371) (32.330) (475.32) 20692 8230714 10 10 10 10 14 14 14 11 14 11
Electro Sur 14 -0.4076176 -0.1243156 -0.0095799 0.4194928 0.3329606 187.5237 -50.60007 152 519.9311 -8429 74913(0.611) (0.229) (0.730) (0.409) (1.715) (67.666) (71.514) (23.416) (327.13) 11603 50539
14 10 10 10 10 14 14 14 11 14 11Electro Sur Este 14 -0.2829914 -0.0273679 -0.0541556 0.3126861 0.5784778 203.6812 -51.56755 313.2143 778.7391 -16760 233936
(0.464) (0.035) (0.076) (0.213) (0.616) (60.108) (70.129) (35.529) (333.17) 23075 8792114 10 10 10 10 14 14 14 11 14 11
Electro Sur Medio 14 -0.2475585 -0.0435348 -0.0997691 0.2952759 0.5159004 140.55 -15.69763 367.5 337.8643 -7816 110249(0.455) (0.081) (0.175) (0.180) (0.473) (74.776) (26.942) (124.886) (135.52) 13078 36632
14 10 10 10 10 14 14 14 13 14 13Electrolima 14 -0.0306695 0.0121335 0.0115666 0.345301 0.5766408 415.2717 47.69156 3251.786 1370.89 51941 3533158
(0.300) (0.054) (0.082) (0.122) (0.288) (323.148) (94.740) (1,275.973) (967.23) 221382 1480396
Electroperu 14 -0.4751673 0.0098345 0.0165352 0.4529143 0.9051605 540.2886 69.95837 1503.071 8463.11 -26213 12500000(1.520) (0.026) (0.046) (0.101) (0.474) (497.822) (240.495) (806.171) (3,448.23) 320191 9487072
SanitationSedapal 14 -0.2786477 -0.0020533 -0.0014089 0.1915537 0.2411109 133.7304 -0.535571 2514.143 1059.295 -47248 2500485
(0.701) (0.035) (0.042) (0.047) (0.077) (78.191) (40.119) (954.741) (408.21) 183016 1143402
69

Appendix 4 (continued)
Obs. ROS ROA ROE Debt toAssets
Debt toEquity
SalesEfficiency
Net IncomeEfficiency
Number ofWorkers
Assets toEmployment
NetIncome Assets
MiningCentromin 5 -0.1332537 -0.0688604 -0.540891 0.8772924 8.169167 1909.095 -206.3774 714 3935.958 -147339 2810561
(0.167) (0.096) (0.703) (0.043) (3.713) (578.950) (257.100) (0.000) (2,321.44) 183552 1657888
Cerro Verde 6 -0.1909331 -0.0951101 -0.1574462 0.4448881 1.025483 257.1431 -25.51694 556.3333 545.4611 -15259 293492(0.732) (0.360) (0.675) (0.221) (0.749) (127.128) (148.923) (114.880) (347.76) 80744 165074
5 5 5 6 6 5 5 6 6 5 6Condestable 14 -0.0967807 -0.0202723 20.03124 0.7968503 676.51 775.5975 97.32727 28 902.5966 150 24341
(0.447) (0.206) (52.621) (0.233) (2,395.99) (326.462) (160.295) (0.000) (694.27) 5534 1355314 14 14 14 14 7 7 7 7 13 14
Hierro Peru 8 -0.2928411 -0.0821107 -0.4565211 0.6275598 2.743274 98.71169 -0.3294156 2003.333 177.5791 -26824 493081(0.601) (0.139) (0.850) (0.199) (2.724) (8.294) (6.732) (145.418) (28.59) 67554 287769
8 8 8 8 8 3 3 3 3 8 8Minero Peru 5 -1.212696 -0.214607 -0.9757489 0.8098281 4.473682 716.9303 -634.9446 984 3152.684 -624833 3102620
(1.814) (0.263) (1.098) (0.042) (1.240) (479.053) (717.658) (0.000) (2,747.58) 706262 2704137
Tintaya 4 -0.1899639 -0.0501089 -0.8048472 -0.231965 13.90178 3292.367 -541.1156 88 21114.6 -47634 1858315(0.365) (0.080) (1.614) (1.893) (26.505) (786.447) (1,263.796) (0.000) (17,047.68) 111257 1500480
IndustryCemento Sur 13 0.1352336 0.0591323 0.0760161 0.3650225 0.4066641 198.6824 24.37964 141 270.9168 2873 35505
(0.197) (0.156) (0.264) (0.278) (0.214) (86.868) (36.089) (15.039) (138.58) 4010 145628 8 7 8 7 8 8 13 8 8 8
Cemento Yura 10 -1.152027 -0.0872967 -2.198517 0.6081172 6.184069 299.7802 -274.5071 198.8 1436.217 -56090 284337(1.650) (0.225) (5.637) (0.222) (12.300) (166.060) (595.652) (10.119) (1,081.74) 119813 220114
7 7 7 7 7 7 7 10 7 7 7Cementos Lima 14 0.1443421 0.0796947 0.1152668 0.2405524 0.353121 785.8346 138.6899 340 1886.881 43628 657215
(0.141) (0.069) (0.098) (0.125) (0.239) (268.283) (111.021) (56.829) (1,052.64) 35490 45110414 14 14 14 14 14 14 14 14 14
CNP S.A. 15 -0.2344534 -0.0997569 -0.8230885 0.7468356 0.4205876 49.33342 -6.827435 399.2 57.96657 -2157 21189(0.505) (0.208) (2.467) (0.258) (6.924) (17.349) (12.935) (48.768) (20.28) 4419 5758
9 9 9 9 9 9 9 15 9 9 9Cerper 3 0.064921 0.1046582 0.1760848 0.4124866 0.7074616 0 0 0 0 1213 11460
(0.095) (0.128) (0.223) (0.041) (0.115) (0.000) (0.000) (0.000) (0.00) 1469 217
Sider Peru S.A. 12 -0.1491934 -0.0506708 -0.1046823 0.5050244 1.414001 138.7289 -14.74069 3271.167 262.6793 -73433 848168(0.555) (0.213) (0.758) (0.192) (1.167) (64.262) (47.501) (1,052.985) (166.00) 153536 724436
10 10 10 10 10 10 10 12 10 10 10Empresa de la Sal 10 -0.0509581 -0.0228022 -0.0411322 0.3581276 0.5754323 113.0404 -1.782991 186.6 162.0986 -458 19505
(0.160) (0.094) (0.153) (0.071) (0.176) (60.389) (11.856) (147.113) (90.17) 1858 195210 10 10 10 10 10 10 10 10 10
Industrias Navales 6 0.0179527 0.0689295 0.0624727 0.3331735 0.674707 90.09027 6.621975 34.16667 140.9403 279 4483(0.373) (0.123) (0.284) (0.199) (0.730) (40.562) (22.174) (13.288) (48.94) 657 1076
70

Appendix 4 (continued)
Obs. ROS ROA ROE Debt toAssets
Debt toEquity
SalesEfficiency
Net IncomeEfficiency
Number ofWorkers
Assets toEmployment
NetIncome Assets
La Pampilla 1 0.0238506 0.0245851 0.0385072 0.361546 0.5662834 1486.441 35.45257 341 1442.036 12089 491734. . . . . . . . . . .
Petroperu S.A. 13 -0.5401705 -0.4032016 -1.394297 1.421697 2.454934 1055.132 -274.6417 4772.308 793.4588 -1592135 3835390(1.099) (0.805) (2.279) (2.040) (11.699) (1,216.418) (657.354) (1,733.099) (759.62) 3759827 4588286
13 13 13 13 13 13 13 13 13 13Quimica del Pacifico 6 0.1293092 0.0813118 0.1184589 0.3138721 0.4973785 154.6838 18.94553 323 210.6251 6379 66508
(0.108) (0.046) (0.063) (0.108) (0.305) (77.205) (19.408) (95.180) (117.05) 8553 49123
Renasa 13 0.0497724 0.0241934 0.0415194 0.3568842 0.5757962 170.5299 7.393634 82.15385 221.9594 1235 17262(0.209) (0.136) (0.207) (0.078) (0.189) (64.515) (33.134) (31.241) (93.80) 4067 10391
SEAL 14 -0.2235636 -0.0047941 -0.0166959 0.3767928 0.7812843 263.4491 -27.68549 432.6429 636.3682 -16490 245730(0.383) (0.063) (0.112) (0.169) (0.770) (167.862) (54.206) (146.531) (351.27) 27328 185602
14 10 10 11 11 14 14 14 11 14 11Solgas 5 -0.0025543 0.042019 0.0596 0.322689 1.7432 309.3359 -0.8520609 230 184.3473 -196 42403
(0.075) (0.126) (0.143) (0.351) (3.321) (154.645) (29.099) (0.000) (124.02) 6694 28530
Sufisa 6 -0.0471735 -0.0751745 -8.294297 0.7574187 24.46572 339.4731 -6.460945 401.1667 451.7127 -7384 159632(0.184) (0.199) (20.302) (0.317) (46.826) (81.743) (51.927) (124.370) (236.92) 26100 47332
Financial Firms 340 0.7246747 0.0795942 1.599587 0.8831061 9.461535 277.6275 269.9395 1178.735 1636.413 1904351 1738226(12.848) (1.320) (27.996) (0.069) (4.433) (182.053) (4,621.284) (1,573.675) (1,182.42) 34800000 2983462
Continental 15 0.0797 0.0119 0.16654 0.9198 13.073 273.887 18.7155 2912.733 1656.867 52323 4491742(0.050) (0.008) (0.112) (0.024) (6.101) (109.476) (12.731) (491.963) (923.11) 34154 1929788
Interbank 15 0.05645 0.01095 0.12074 0.90827 10.3129 254.6527 12.84644 2360.867 1310.12 28045 2408220(0.048) (0.010) (0.103) (0.019) (2.219) (141.650) (12.246) (911.153) (974.21) 27476 886993
* Standard Deviation in parenthesesWhen there was a difference in the number of the observations for each variable they are indicated in italics under the standard deviation of the variable.
71

Appendix 5.
Table A5.1
Sector S-Francia5
Prob>zPerformance Measure (P )1. Profitability:
Return on Sales (ROS) -0,0099 0,4083 -10,2639*** 105,3480*** 49,6114 *** 0,1974 0,001 ***(0,029) (0,028)
Return on Assets (ROA) 0,0024 0,1714 -6,9935 *** 48,9086 *** 24,4539 *** 0,3279 0,001 ***(0,014) (0,021)
Return on Equity (ROE) 0,0036 0,3128 -7,8995 *** 62,4022 *** 33,4508 *** 0,2083 0,007 ***(0,032) (0,014)
2. Operating Efficiency: Sales Efficiency (SALEFF)-1994S/.Thousands 143,918 455,3162 -6,3317 *** 40,0909 *** 42,5110 *** 0,0382 0,007 ***
(23,373) (47,931) Net Income Efficiency (NIEFF) -1994S/.Thousands -0,9794 93,7577 *** ***-8,3231 69,2732 47,2743 *** 0,0299 0,008 ***
(3,662) (12,355)3. Employment:
Total Employment (EMPL) *** *** ***14125,6 5992,17 9,9687 99,3749 38,4810 0,1090 0,001 ***
(575,074) (543,713)
0,9228
0,5444 0,2964 1,9149 0,8725 0,921
0,7603 0,5781 1,6069 0,0026 0,921
4. Leverage: Debt to Assets (LEV)
Debt to Equity (LEV2)(0,055)0,4999
1,2433(0,339)
0,4584(0,049)
(0,170)5. Coverage:
Lines per worker (LINES) 39,6038 261,0051 -8,0536*** 64,8610 *** 0,0047 0,001 ***
(9,763) (78,008)
Level of Significance: * 10%, ** 5%, *** 1%.1/ Standard Error in Parenthesis2/ t-test for Ho about difference between means. Unequal N’s.4/ The year or privatization is 1994.5/ Shapiro-Francia test for normality. Ho: variable is normally distributed.
3/ Test of equality
Where x is a 1xk matrix of the means and S is the estimated covariance matrix.
Hotelling
Means Diff. in Diff.First DifferencesKolmorogrov
Smirnov 6
Performance Changes of Telefonica After Privatization - Telecommunication Sector(Difference between Means and Difference in Difference Tests)
Pre-Privatization Post-Privatization Hotelling3
SedapalT-test
( ) ( )'211
212 xxSxxT −−= −
1
72

Table A.5.2
Sector S-Francia 6
Prob>z
-0,1811 0,2018 -2,6239 ** 6,8848 ** 3,6440 * 0,0032 0,017 ***(0,320) (0,024)-0,0205 0,0661 -4,2075 *** 17,7033 *** 7,5367 ** 0,2327 0,017 ***(0,016) (0,004)-0,0335 0,0850 -3,2998 *** 10,8884 *** 2,4812 0,0583 0,017 ***(0,028) (0,005)
162,9284 803,5256 -12,5352 *** 157,1316 *** 119,0269 *** 0,0155 0,002 ***(16,391) (60,559)-19,0959 163,0455 -9,4166 *** 88,6730 *** 33,3117 *** 0,0424 0,017 ***(11,569) (16,074)
4210,3 1855,60 7,2221 *** 52,1582 *** 50,8770 *** 0,1292 0,002 ***(239,607) (138,342)
0,4302 0,2208 5,1558 *** 26,5819 *** 15,2595 *** 0,6949 0,001 ***(0,023) (0,037)0,7739 0,2952 4,7567 *** 22,6259 *** 48,3539 *** 0,8744 0,002 ***(0,069) (0,062)
229,3598 794,4770 -8,8517 *** 78,3535 *** 0,0183 0,002 ***(57,742) (169,273)
Level of Significance: * 10%, ** 5%, *** 1% 4/ The year of privatization is 1994.
2/ t-test for Ho about difference between means. Unequal N’s5/ The control group is Electro Oriente, Electro Sur, and Electro SurEste, and Electro Sur Medio for Saleff, Nieff and Empl.
3/ Test of equality: 6/ ShapiroFrancia test for normality. Ho: variable is normally distributed.
Where x is a 1xk matrix of the means and S is the estimated covariance matrix.
T-test 2Means Diff. in Diff.First Differences
KolmorogrovSmirnov 7
Performance Changes of Electrolima After Privatization – Electric Sector
(Difference between Means and Difference in Difference Tests)
Pre-Privatization Post-PrivatizationHotelling
Public 5Hotelling 3
( ) ( )'211
212 xxSxxT −−= −
Performance Measure (P )1. Profitability:
Return on Sales (ROS)
Return on Assets (ROA)
Return on Equity (ROE)
2. Operating Efficiency:
Sales Efficiency (SALEFF)-1994S/.Thousands
Net Income Efficiency (NIEFF) -1994S/.Thousands
3. Employment:
Total Employment (EMPL)
4. Leverage: Debt to Assets (LEV)
Debt to Equity (LEV2)
5. Coverage:
Lines per worker (LINES)
1/ Standard Error in Parenthesis
3
73

Table A.5.3
Sector S-Francia6
Prob>z
1. Profitability:Return on Sales (ROS) -0,8485 0,2229 -1,1486 1,3194 1,6025 0,0001 0,274
(0,605) (0,096) Return on Assets (ROA) 0,0008 0,0300 -1,9676 * 3,8716 * 1,6639 0,4842 0,234
(0,008) (0,012) Return on Equity (ROE) 0,0021 0,0483 -1,7341 3,0070 0,2457 0,5607 0,234
(0,015) (0,021)
2. Operating Efficiency: Sales Efficiency (SALEFF) - 1994 S/. Thousands 205,7400 1222,7810 -10,7568 *** 115,7089 *** 45,2077 *** 0,0177 0,003 ***
(57,770) (51,656) Net Income Efficiency (NIEFF)- 1994 S/. Thousands -26,6490 285,7193 -2,4842 ** 6,1711 ** 3,3408 * 0,6345 0,197
(65,580) (119,717)3. Employment: Total Employment (EMPL) 1976,7 593,00 4,6217 *** 21,3599 *** 9,9168 *** 0,3306 0,003 ***
(194,342) (30,257)4. Leverage: Debt to Assets (LEV) 0,4757 0,4010 1,1977 1,4345 3,5220 * 0,0858 0,749
(0,035) (0,049) Debt to Equity (LEV2) 1,0039 0,7000 1,0279 1,0565 2,4812 0,0005 0,749
(0,185) (0,125)
5. Coverage: Lines per worker (LINES) 0,0034 0,0216 -6,8787 *** 47,3159 *** 0,0031 0,003 ***
(0,002) (0,008)
Level of Significance: * 10%, ** 5%, *** 1%1/ Standard Error in Parenthesis2/ t-test for Ho about difference between means. Unequal N's 4/ The year of privatization is 19953/ Test of equality: 5/ The control group is Electro Oriente, Electro Sur, and Electro Sur Este;
and Electro Sur Medio for Saleff, Nieff and Empl.6/ Shapiro-Francia test for normality. Ho: variable is normally
di ib dWhere x be a 1xk matrix of the means and S be the estimated covariance
Hotelling3Means First Differences Diff. in Diff.
Kolmorogrov-Smirnov7
Performance Changes of Electroperu After Privatization - Electric Sector(Difference between Means and Difference in Difference Tests)
Hotelling3
Public 5Pre-Privatization Post-Privatization
T-test 2
( ) ( )'211
212 xxSxxT −−= −
Performance Measure (P )
74

75