Peru: National Survey of Rural Household Energy Use · Energy Sector Management Assistance Program...
190
Energy Sector Management Assistance Program Peru: National Survey of Rural Household Energy Use Peter Meier Voravate Tuntivate Douglas F. Barnes Susan V. Bogach Daniel Farchy Peru: National Survey of Rural Household Energy Use Special Report 007/10 August 2010 ENERGY AND POVERTY Special Report August 2010
Transcript of Peru: National Survey of Rural Household Energy Use · Energy Sector Management Assistance Program...
Energy Sector Management Assistance Program
Peru: National Survey of Rural Household Energy Use
Peter MeierVoravate TuntivateDouglas F. BarnesSusan V. BogachDaniel Farchy
Peru: National Survey of Rural H
ousehold Energy Use
Special Report 007/10 A
ugust 2010
ENERGYAND POVERTYSpecial Report August 2010
7134-EnglishCover.pdf 1 8/25/10 10:13 AM

Copyright © 2010The International Bank for Reconstructionand Development/THE WORLD BANK GROUP1818 H Street, N.W.Washington, D.C. 20433, U.S.A.
All rights reservedManufactured in the United States of AmericaFirst printing August 2010
ESMAP Reports are published to communicate the results of ESMAP’s work to the development community. Some sources cited in this paper may be informal documents that are not readily available.
The fi ndings, interpretations, and conclusions expressed in this paper are entirely those of the author(s) and should not be attributed in any manner to the World Bank, or its affi liated organizations, or to members of its Board of Executive Directors or the countries they represent. The World Bank does not guarantee the accuracy of the data included in this publication and accepts no responsibility whatsoever for any consequence of their use. The Boundaries, colors, denominations, other information shown on any map in this volume do not imply on the part of the World Bank Group any judgment on the legal status of any territory or the endorsement or acceptance of such boundaries.
The material in this publication is copyrighted. Requests for permission to reproduce portions of it should be sent to the ESMAP Manager at the address shown in the copyright notice above. ESMAP encourages dissemination of its work and will normally give permission promptly and, when the reproduction is for noncommercial purposes, without asking a fee. All images remain the sole property of their source and may not be used for any purpose without written permission from the source. Cover photos belong to The Directorate of Competitive Funds (DFC) and The General Directorate of Rural Electrifi cation (DGER).
7134-EnglishCover.pdf 2 9/1/10 10:18 AM
Peru: National Survey of Rural Household Energy Use
Peter MeierVoravate TuntivateDouglas F. BarnesSusan V. BogachDaniel Farchy
ENERGYAND POVERTYSpecial Report 007/10August 2010
7134-CHFM.pdf i 8/25/10 10:14 AM

7134-CHFM.pdf ii 8/25/10 10:14 AM
iii
Contents
Exchange Rate ix
Abbreviations and Acronyms xi
Foreword xiii
Acknowledgments xv
Executive Summary xvii
1 Introduction 1 Geographical and Socioeconomic Diversity in Peru 2 Electricity Sector Structure 4 Rural Electrifi cation to Date 6 Key Rural Electrifi cation Issues 7
2 Household Energy Use and Expenditure 9 Household Energy Use 9 Energy Expenditure 13 Comparison of Households with and without Access to Grid Electricity 14 Socioeconomic Characteristics 14 Energy Use 16 Energy Expenditures 17 Conclusions 18
3 Electricity from the Grid 21 Access to Grid Electricity 21 Service Reliability 22 Overall Electricity Use and Expenditure 23 Electricity Tariff by Usage Level 23 Electricity Usage for Lighting 24 Household Appliances 26 Conclusions 28
4 Off-Grid Electricity 31 Car Batteries 31 Dry Cell Batteries 33 Small Generators 35 Solar Home Systems 36 Conclusions 37
7134-CHFM.pdf iii 8/25/10 10:14 AM

Special Report Peru: National Survey of Rural Household Energy Use
iv
5 Benefi ts of Rural Electrifi cation 39 Background on Rural Electrifi cation Benefi t Estimation 39 Measuring the Benefi ts of Better Lighting 41 Benefi ts of Communications 49 Television 49 Radio 50 Refrigeration 51 Benefi ts of Education and Health 53 Education 53 Health and Environmental Benefi ts 54 Benefi ts to Home Business 54 Willingness to Pay for Electricity in Enterprises 55 Conclusions 58
6 Policy Implications of Survey Results 59 Connection Rates in Electrifi ed Villages 59 Distribution of Electricity Consumption by Village 60 Growth of Electricity Consumption 61 Pricing Policy 62 FOSE 63 Tariff Structure 64 Targeting Performance of FOSE 68 Effi cient Lighting 70 Issues for Further Research 72 Conclusions 72
Annexes1 Survey Design and Methodology 752 Survey Results 833 Estimating the Benefi ts of Rural Electrifi cation 1154 Survey Questionnaire: Consumption of Energy Households in Rural Areas 119 100. Characteristics of House & Household 120 200. Characteristics of Household Members 122 300. Sources of Energy (Only for the Head of Home or the Spouse) 126 400. Productive Equipment 148 500. Time Use 150 600. Household Income 151 700. Attitude 155 800. Business Module 156 900. Opinion and Attitude on Energy and Business 159
Bibliography 161
Boxes5.1 Comparison of Survey Results with an NRECA Study 526.1 Rate of Return for Replacement of Incandescent Lighting with CFLs 71
Figures2.1 Application of Kerosene Users (Users Only) 112.2 Expenditure Differences Across Regions: Fraction of Households in Each
Expenditure Quintile by Region 112.3 Households Using Modern Energy by Expenditure Quintile 122.4 Households Using Traditional Fuel by Expenditure Quintile 132.5 Household Monthly Spending on Energy by Region and Type (Soles/Month) 14
7134-CHFM.pdf iv 8/25/10 10:14 AM
Contents
v
2.6 Percentage of Households Maintaining Kerosene and Candles to Supplement Electric Lighting 17
2.7 Household Energy Expenditure as a Percentage of Total Expenditure by Region 182.8 Household Expenditures on Electricity and Other Lighting Fuels/Energy by
Expenditure Quintiles (Soles per Month) 193.1 Percentage of Households with Access to Grid Electricity by Region 223.2 Percentage of Households with Access to Electricity by Expenditure Quintile 223.3 Months of Service per Year 233.4 Hours of Service per Day 233.5 Lighting versus Total kWh by Quintile 253.6 Appliance Use in Electrifi ed Homes 263.7 Appliance Ownership in Electrifi ed Homes by Expenditure Quintile 273.8 Television Ownership in Electrifi ed Households by Region 273.9 Fan Ownership by Region 284.1 Percentage of Households Reporting Use of Dry Cells 344.2 Dry Cell Watt-Hour Consumption by Expenditure Quintile 355.1 Demand Curve for Lighting (Theoretical) 415.2 Demand Curve for Lighting (Actual) 445.3 The Impact of Assumptions 455.4 Demand Curve Based on Price and Quantity of Energy Use by Income Class 475.5 Energy Source Differences Between Electrifi ed versus Unelectrifi ed Enterprises 565.6 Change in Monthly Expenditure with Electrifi cation 576.1 Breakdown of Villages with Average Consumption above and
below 22 kWh/Month by Region 616.2 Distribution of Years of Electricity Service 626.3 Monthly kWh of Consumption versus Age of Connection 636.4 Components of the Tariff 646.5 Typical Tariff Curves 656.6 Average Cost/kWh, Electrosur 686.7 Proportion of Households Reporting Given Levels of Consumption 696.8 Effective Rate of FOSE Discount 69
A.1.1 Monthly Household Electricity Expenditure by Region (Users Only) 79A.1.2 Monthly Kerosene Expenditure by Region (Users Only) 80A.1.3 Kernel Density Estimation of Total Monthly Household Cash Expenditure
without Energy Expenditures (Logarithm) 82A.3.1 Demand for Lighting 115A.3.2 Comparison of Estimates Used for Kerosene Lighting 116
Tables1.1 Population by Region and Area 21.2 Poverty Incidence in Rural Areas (% of Households) 41.3 Residential Subsidized Tariffs (Soles/kWh) 51.4 Latin American and Caribbean Region Electricity Coverage, by Percentage of Coverage 62.1 Percentage of Households that Use Each Type of Energy by Region 102.2 Total Household Monthly Cash Spending on Energy by Expenditure Quintiles
(Users Only) 152.3 Total Household Expenditure and Education by Electrifi cation Status 152.4 Percentage of Households that Use Each Type of Energy by Electrifi cation Status 162.5 Household Monthly Cash Expenditure on Electricity and Lighting Fuels/Energy
by Electrifi cation Status (Users Only) 173.1 Household Electricity Consumption, Expenditure, and Average Effective Price
per KWh by Region 243.2 Household Electricity Consumption, Expenditure, and Average Effective Price
per kWh by Expenditure Quintiles 24
7134-CHFM.pdf v 8/25/10 10:14 AM
Special Report Peru: National Survey of Rural Household Energy Use
vi
3.3 Number and Type of Electric Lights Owned by Level of Usage 254.1 Use of Car Batteries (% of Households) 324.2 Car-Battery Statistics by Expenditure Quintile 334.3 Uses of Dry Cell Batteries (% of Users Only) 334.4 Dry Cell Battery Costs 344.5 Small Generator Users, Cost Data 364.6 Percentage of Households that Use Solar PV Systems by Electrifi cation Status
and Expenditure Quintile 365.1 Lumen Output for Lighting Devices 425.2 Lighting Ownership and Hours of Utilization by Households (Unweighted) 435.3 Percentage of Households Reporting Use of Lamps 445.4 WTP Estimates 465.5 Number of Households Using Lighting Energy by Income Class, 2005 475.6 Estimates of Lighting Service and Price 485.7 Increases of Consumer Surplus by Income Class (Soles/month) 485.8 WTP per kWh (Alternate Method) 495.9 Cost and Viewing Hours for Television 505.10 Cost per Radio Listening Hour Based on Energy Source 505.11 Price and Quantity of Radio Listening 515.12 Use of Refrigerators in Unelectrifi ed Households 515.13 Average Number of Hours per Night Household Members Read/Study (Weighted) 535.14 Percentage of Children in the Household Attending School (Weighted) 535.15 Home Business Incidence by Major Lighting Type 545.16 Distribution of Households with Home Business by Major Lighting Type 545.17 Energy Sources in Rural Enterprises 555.18 Average Energy Expenditures in Rural Enterprises 565.19 Enterprise Willingness to Pay for Electricity 575.20 Net Benefi ts of Grid Electrifi cation (per HH/month) 586.1 Connection Rates by Region 606.2 Major Reasons Cited for Households Lack of Grid Access: Electrifi ed Villages
versus Unelectrifi ed Villages (% of Respondents) 606.3 Average Consumption in Electrifi ed Villages 616.4 FOSE Subsidy Rates 636.5 Number of Connections Benefi ting from FOSE, 2004 646.6 Fixed Charges 656.7 Sample Electricity Bills from Electrosur, April 2005 676.8 Targeting Performance for FOSE Transfer 706.9 Average Monthly Electricity Bill, Soles/Month 72
A.1.1 Distribution of the Sample Size 75A.1.2 Weighted versus Unweighted Estimates of kWh/HH/Month 76A.1.3 Comparison of Monthly Energy Expenditure and Total Cash Expenditure between
the ENAHO and the Survey 78A.1.4 Monthly Household Electricity Expenditure by Region (Users Only) 80A.1.5 Monthly Household Kerosene Expenditure by Region (Users Only) 81A.1.6 Monthly Household Kerosene Expenditure by Region 82A.2.1 Percentage of Households that Use Each Type of Energy, by Region 83A.2.2 Percentage of Households that Use Each Type of Energy, by Expenditure Quintiles 84A.2.3 Total Household Monthly Cash Spending on Energy by Region, in Soles (Users Only) 85A.2.4 Total Household Monthly Cash Spending on Energy by Expenditure Quintiles,
in Soles (Users Only) 86A.2.5 Total Household Monthly Cash Spending on Energy by Region, in Soles (All Households) 87A.2.6 Total Household Monthly Cash Spending on Energy by Expenditure Quintiles,
in Soles (All Households) 87
7134-CHFM.pdf vi 8/25/10 10:14 AM
Contents
vii
A.2.7 Percentage of Households that Use Each Type of Energy by Electrifi cation Status and Region 88
A.2.8 Percentage of Households that Use Each Type of Energy by Electrifi cation Status and Expenditure Quintile 89
A.2.9 Comparison of Total Household Monthly Cash Spending on Energy between Households with and without Access to Grid Electricity by Region, in Soles (Users Only) 90
A.2.10 Comparison of Total Household Monthly Cash Spending on Energy between Households with and without Access to Grid Electricity by Expenditure Quintiles (Users Only) 91
A.2.11 Number and Percentage of Households Using Kerosene for Lighting and Cooking by Electrifi cation Status and by Region (All Households) 92
A.2.12 Number and Percentage of Households Using Kerosene for Lighting and Cooking by Region (All Households) 93
A.2.13 Number and Percentage of Households Using Kerosene for Lighting and Cooking by Electrifi cation Status and Expenditure Quintiles (All Households) 94
A.2.14 Number and Percentage of Households Using Kerosene and Candles for Lighting by Electrifi cation Status and Region (All Households) 95
A.2.15 Number and Percentage of Household Using Kerosene and Candles for Lighting by Electrifi cation Status and Expenditure Quintiles (All Households) 96
A.2.16 Household Monthly Expenditure on Kerosene for Lighting and Cooking by Electrifi cation Status and Region (Users Only) 97
A.2.17 Household Monthly Expenditure on Kerosene for Lighting and Cooking by Region (Weighted—Users Only) 98
A.2.18 Household Monthly Expenditures on Candles for Lighting by Electrifi cation Status and Region (Users Only) 98
A.2.19 Household Monthly Expenditures on Kerosene for Lighting and Cooking by Electrifi cation Status and Expenditure Quintiles (Users Only) 99
A.2.20 Household Monthly Expenditures on Kerosene for Lighting and Cooking by Expenditure Quintiles, in Soles (Users Only) 100
A.2.21 Household Monthly Expenditures on Candles for Lighting by Electrifi cation Status and Expenditure Quintiles, in Soles (Users Only) 100
A.2.22 Household Monthly Expenditures on Kerosene and Candles for Lighting by Electrifi cation Status and Region, in Soles (Users Only) 101
A.2.23 Household Monthly Expenditures on Kerosene and Candles for Lighting by Region (Users Only) 101
A.2.24 Household Monthly Expenditures on Kerosene and Candles for Lighting by Electrifi cation Status and Expenditure Quintiles (Users Only) 102
A.2.25 Household Monthly Expenditures on Kerosene and Candles for Lighting by Expenditure Quintiles 102
A.2.26 Household Monthly Expenditures on Lighting and Electricity by Electrifi cation Status and Region (Weighted—Users Only) 103
A.2.27 Household Monthly Expenditures on Lighting and Electricity by Region, in Soles (Users Only) 104
A.2.28 Household Monthly Expenditures on Lighting and Electricity by Electrifi cation Status and Expenditure Quintiles, in Soles 105
A.2.29 Household Monthly Expenditures on Lighting and Electricity by Expenditure Quintiles 106A.2.30 Percentage of Households with and without Access to Grid Electricity by Region 106A.2.31 Percentage of Households with and without Access to Grid Electricity
by Expenditure Quintiles 107A.2.32 Household Electricity Consumption, Expenditure in Soles, Effective Price
per kWh, and Electricity Used for Lighting by Region 107A.2.33 Household Electricity Consumption, Expenditure Effective Price per kWh
and Electricity Used for Lighting by Expenditure Quintiles 108
7134-CHFM.pdf vii 8/25/10 10:14 AM

Special Report Peru: National Survey of Rural Household Energy Use
viii
A.2.34 Type and Number of Electric Lights Owned by Household by Expenditure Quintiles (All Households with Grid Connection) 108
A.2.35 Type and Number of Electric Lights Owned by Region (Users Only) 109A.2.36 Type and Number of Electric Lights Owned by Expenditure Quintiles (Users Only) 109A.2.37 Electricity Usage for Lighting by Lifeline Rate 109A.2.38 Type and Number of Electric Lights Owned by Lifeline Rate 110A.2.39 Television Ownership by Region 110A.2.40 Television Ownership by Expenditure Quintiles 110A.2.41 Plug-in Radio and Television Ownership by Region 111A.2.42 Plug-in Radio and Television Ownership by Expenditure Quintiles 111A.2.43 Electric Appliance Ownership by Region 112A.2.44 Electric Appliance Ownership by Expenditure Quintiles 112A.2.45 Households with Photovoltaic (PV) Systems 113A.2.46 Small Generator Users, Cost Data 114A.3.1 Statistical Comparison of User Estimates of Kerosene Consumption versus Average
Lamp Consumption 117A.3.2 Assumptions and Results, Willingness to Pay for Lighting per Month, by Quintile 117A.3.3 Cross-Country Comparisons of WTP Calculations 118
7134-CHFM.pdf viii 8/25/10 10:14 AM

ix
Exchange Rate
(Effective 2007)Currency unit = Nuevos Soles (s/.)1 U.S. dollar = 3.23 Nuevos Soles
7134-CHFM.pdf ix 8/25/10 10:14 AM

7134-CHFM.pdf x 8/25/10 10:14 AM

xi
Abbreviations and Acronyms
AER Areas de Empadronamiento Rural
ADINELSA Electric Infrastructure Administration Enterprise (Empresa de Administración de Infraestructura Eléctrica, S.A)
B&W black and white (TV)
CFL compact fl uorescent lamp (also known as compact fl uorescent light bulb)
CIER Comision de Integracion Eléctrica Regional
CV coeffi cient of variation
DEP Executive Project Directorate
ECLAC Economic Commission for Latin America and the Caribbean
EDELNOR Empresa de Distribucion Electrica de Lima S.A.
ELP ELECTROPERU-Public Electric Enterprise of Peru
ENAHO National Household Survey (Encuesta Nacional de Hogares)
FONAFE National Financing Fund for State Enterprise Activity (Fondo Nacional de Financiamiento de la Actividad Empresarial del Estado)
FONCODES National Fund for Compensation and Social Development of Peru
FOSE Social Tariff for Electricity Consumption (Fondo de Compensación Social Eléctrica)
GoP Government of Peru
HH household
ICT information and communication technologies
IDA International Development Agency
INEI National Institute of Statistics and Information Technology (Instituto Nacional de Estadística e Informática)
kWh kilowatt-hour
LCE Law of Electricity Concessions (Ley de Concessiones Eléctricas)
LPG liquifi ed petroleum gas
MEM Ministry of Energy and Mines (Ministerio de Energía y Minas)
MHS micro hydroelectric systems
7134-CHFM.pdf xi 8/25/10 10:14 AM
Special Report Peru: National Survey of Rural Household Energy Use
xii
NRECA National Rural Electric Cooperative Association
OSINERG Supervisory Commission for Energy Investments (Organismo Supervisor de la Inversión en Energía)
PPIAF Public Private Infrastructure Advisory Facility (World Bank)
PV photovoltaic
WTP willingness to pay
All monetary amounts are US dollars unless otherwise indicated.
7134-CHFM.pdf xii 8/25/10 10:14 AM
xiii
Foreword
In order to gain a better understanding of the existing and potential users of electricity in rural areas of Peru, the National Survey of Rural Household Energy Use was carried out in seven regions of the country, the Coastal North, Central, and South regions, the Andean North, Central, and South regions, and the Amazon region. The Survey provided data on rural household energy use and expenditures, use by rural households of electricity from the grid, and use by rural households of off-grid electricity. The Survey also provided information for an analysis of the economic benefi ts from electricity use in rural areas in Peru. Finally, the data were analyzed to provide implications for further development of rural electrifi cation policies in Peru. It is important to note that the report represents the situation with respect to rural electrifi cation in Peru in 2005–2006.
The Survey was initiated during the preparation of the World Bank-GEF–assisted Peru Rural Electrifi cation Project. It provided socioeconomic and energy data to inform the design of the Project and also assist in improving policies for rural electrifi cation in Peru. The preliminary data from the Survey were used to prepare the economic and fi nancial analysis for the Peru Rural Electrifi cation Project.
The main conclusion of the survey is that rural households in Peru have a signifi cant desire, willingness, and ability to pay for electricity. Households without electricity from the grid frequently pay more for energy of lesser quality from kerosene lamps or batteries than they would pay for electricity service. However, the need to pay the connection cost is a signifi cant barrier, and 25 percent of households living in areas with electricity service are not connected. Use of car batteries by 18 percent of rural households without electricity is a strong indication of unsatisfi ed demand for electricity in areas near to the grid.
The Survey report provides data for the planning of rural electrifi cation in the context of Peru, including estimates of the benefi ts, which are particularly important for the economic analysis of Projects. However, we believe that the survey report will also be useful to other countries as an example of a comprehensive effort to collect and analyze original data on rural household energy use.
7134-CHFM.pdf xiii 8/25/10 10:14 AM

7134-CHFM.pdf xiv 8/25/10 10:14 AM

xv
The Survey was carried out with fi nancing from the Ministry of Energy and Mines for the survey fi eldwork and from the World Bank’s Energy Sector Management Assistance Program (ESMAP) for the survey design and the preparation of the fi nal report. The work was completed in 2007, it then went through a series of internal and external reviews. It is the intention of the authors that you fi nd this material interesting and insightful. This report has also been published in Spanish by the originating unit within the World Bank. The report can be found as: Peru : Encuesta Nacional de Consumo de Energía a Hogares en el Ambito Rural, 54286-PE.
The authors would like to thank the former and current authorities of the Ministry of Energy and Mines for their help and support, as well as former Vice Minister of Energy Mr. Juan Miguel Cayo Mata.
The Technical Directorate of Demographics and Social Indicators of the National Institute of Statistics and Information Technology (INEI) deserves special mention for designing the sample and the survey, as well as for organizing and supervising the fi eld survey work under diffi cult conditions, and entering and verifying the data. INEI’s team was led by Arturo Arias, and the sample design was done by Juan Valverde Quesada. Patricia Ormeno supervised and coordinated the survey fi eldwork on behalf of the Ministry of Energy and Mines. Laura Berman assisted in coordination among the Ministry of Energy and Mines, INEI and the World Bank, and drafting the Introduction to the Report and Annex 1.
Voravate Tuntivate was responsible on the World Bank side for the sample design, development of the questionnaire, providing guidance and supervision of the initiation of the fi eldwork, cleaning and analyzing the data, preparing the tables in Annex 2, and drafting a preliminary report.
Peter Meier prepared the complete draft of the fi rst report, as well as the benefi ts estimates in Chapter 5 of the report, and assisted in review and fi nalizing the data. Daniel Farchy prepared the second draft of the report and the fi rst draft of the executive summary. Paula Tarnapol Whitacre edited the fi nal draft of the report. Thomas Haven assisted in reviewing and editing the fi nal draft of the main report.
The authors are grateful to the following reviewers for their valuable comments: Dana Rysankova, Kyran O’Sullivan, and Eduardo Zolezzi. Douglas Barnes provided guidance to the task team throughout the preparation of the Survey and the report. The task team leader was Susan V. Bogach. Special thanks to Shepherd, Inc. for copyediting the fi nal report and to Marjorie K. Araya (ESMAP) for coordinating the publication process.
The fi ndings, interpretations and conclusions expressed in this report are entirely those of the authors as individuals.
The report was completed under the guidance of the Energy Unit of the Sustainable Development Department of the Latin America and Caribbean Region of the World Bank.
Acknowledgments
7134-CHFM.pdf xv 8/25/10 10:14 AM

7134-CHFM.pdf xvi 8/25/10 10:14 AM
xvii
Peru is a country of extreme diversity, both in its geography and the socioeconomic conditions of its citizens. This makes it a challenge for the Government of Peru (GoP) to extend access to basic infrastructure services, including electricity, to the dispersed population living in rural areas. Plans and targets have been in place for rural electrifi cation since the early 1970s, but by 2005, only 39 percent of rural households had electricity service. Peru has one of the lowest rural electrifi cation rates in Latin America. An estimated 6 million people in the predominantly poor rural areas of Peru did not have access to electricity in 2005.
The MEM initiated a World Bank and GEF-assisted Rural Electrifi cation Project in August 2006 to assist local distribution companies in reaching rural populations (World Bank 2006). The project aims to supply electricity services to about 160,000 currently unserved rural households, businesses, and public facilities, such as schools and health clinics (serving about 800,000 people), using both conventional grid extension and renewable energy sources.
Detailed data were required in order to prepare the design of the Peru Rural Electrifi cation Project, as well as to improve the rural electrification program and to analyze the economic and fi nancial aspects of rural electrifi cation. Consequently, it was decided to implement the National Survey of Rural Household Energy Use (referred to as the Survey in this publication),1 with the assistance of the World Bank’s Energy Sector Management Assistance
Executive Summary
1 In Spanish, Encuesta de Consumo de Energía a Hogares en el Ámbito Rural. 2 The expected standard deviation in each region ranged from 0.021 to 0.050 (see Annex 1).
Program (ESMAP), to obtain information on the demand and use of electricity in rural areas of Peru.
The Survey covered 6,690 households with and without electricity in rural areas of Peru. To represent the target population for rural electrifi cation, rural areas were defined as those populations living in aggregations of 1,000 households or less. (This defi nition is different from that used by the Institute of Statistics and Information Technology [Instituto Nacional de Estadística e Informática, INEI] in the Census, which defines rural population centers as those with less than 100 dwellings grouped contiguously.) The sample was large enough to provide reliable estimations about the survey population at seven regional levels: Coastal North, Central, and South regions, the Andean North, Central, and South regions, and the Amazon region.2
The survey was conducted through the National Institute of Statistics and Information Technology (Instituto Nacional de Estadística e Informática, INEI), together with experts on household energy surveys provided by the World Bank. The information collected includes general socioeconomic information on households, as well as detailed information on their current energy use, energy expenditures, and ability/willingness to pay for electricity services. Until now such data have not been available.
This report presents the main results of the Survey, and shows how Survey information can contribute to the analysis of important policy issues in developing an improved rural electrifi cation framework in Peru.
7134-CHFM.pdf xvii 8/25/10 10:14 AM

Special Report Peru: National Survey of Rural Household Energy Use
xviii
Household Energy Use and ExpenditureThe Survey compares energy usage among households in different regions, expenditure quintile classifi cations, and categories of households with and without access to grid electricity.
Variations in Energy Use
Rural households in Peru, like rural households elsewhere in the world, rely on various sources of energy for lighting, cooking, and appliances. More than 84 percent of rural households rely on fuelwood for cooking, while 24 percent use dung and 11 percent use agriculture residue. Liquified petroleum gas (LPG) is used mainly for cooking by 14 percent of all households. An estimated 74 percent of all households use dry cells for small appliances such as radios and flashlights, and about 60 percent of all households use candles and kerosene for lighting. Electricity is used by 39 percent of all households. A surprisingly high 11 percent of households use car batteries to run electric appliances, indicating a high, unmet demand for electricity services. A tiny fraction, 0.6 percent, have generators, and 0.5 percent have solar home systems.
There is a high degree of regional variation in these fi gures, particularly between the richer Coastal Regions and the Andean and Amazon Regions that contain significant indigenous populations. The percentage of households in the Andean regions with access to grid electricity ranges from 22 percent in the north to 52 percent in the central region. In the Coastal regions, coverage of grid electricity ranges from 35 percent in the north to about 71 percent in the south. Electricity access is lowest in the Amazon, at 18 percent.
Variations in Energy Expenditures
The total monthly cash expenditure for all types of energy used in the household is estimated to be 25 soles per month, on average. This amounts to about 9.7 percent of total household cash expenditures each month. However, household energy expenditure varies significantly among regions and between
financially better-off and poorer households. Energy expenditure represents a heavier burden for households in the three Andean regions than for households in other regions of the country.
Although poor households spend less on energy than nonpoor households, their energy spending accounts for a larger portion of their income. Households in the lowest quintile spend about 17 percent of their total monthly expenditures on energy, while households in all other quintiles spend less than 10 percent. Part of the reason for this discrepancy is that the poor often lack access to relatively cheap grid electricity.
Households with grid electricity are financially better off than households without access (average 430 soles/month versus 317 soles/month). Yet, the Survey also found that households with electricity spend only marginally more on grid electricity and electricity substitutes (16.3 soles per month) than households without electricity spend on substitutes alone (15.4 soles per month). Households without elect r ic it y are paying comparable amounts for much-lower-quality services. This indicates that they would be able to pay for electricity if it were available.
Electricity from the GridAs already noted, the Survey showed that only 39 percent of rural households currently had access to grid electricity. In addition to regional variations, access is strongly correlated with expenditure quintile: 28 percent of households in the poorest quintile have access, compared with 49 percent in the top quintile. Electricity usage among rural households in Peru is relatively low, at an average of 27 kWh per month. This may be due to several factors, including a high tariff, unavailability of inexpensive appliances, and high prevalence of poverty.
As a result of fi xed charges, the average effective rate for households that use small amounts of electricity is relatively high. Currently, about 70 percent of households with a grid connection use less than 30 kWh per month. These households’
7134-CHFM.pdf xviii 8/25/10 10:14 AM
Executive Summary
xix
average effective electricity price is 0.76 soles per kWh. However, the average effective price per kWh for households that use more than 30 kWh per month is only 0.46 soles per kWh.
The proportion of total electricity used for lighting is strongly dependent upon expenditure quintile. The bottom quintile uses 39 percent of total electricity consumption for lighting, while the top quintile uses only 21 percent. As income (expenditure) increases, the ability to purchase expensive electric appliances increases, and thus a greater fraction of electricity is used for color TV, sound equipment, and refrigerators.
Radios are by far the most common type of household electric appliance, with 66 percent of electrifi ed households owning one or more, followed by black-and-white televisions (37 percent of households), color televisions (33 percent), and electric irons (25 percent). Appliance ownership variations by region are in line with regional income disparities.
Off-Grid ElectricityPeople often assume that households without access to the electricity service from the grid do not use electricity. This is not the case. The electricity may cost them more and they may use less of it, but almost all households have some form of off-grid electricity use. This is evidence of a pent-up consumer demand for electricity and an indication that people are willing to pay high prices for small amounts of it.
Car and Dry Cell Batteries
Close to one-fi fth of households in rural Peru without electricity use car batteries for televisions and lights. This is an important indication of the very high value of electricity for people in rural areas, as the work and expense involved in charging car batteries is not trivial. Battery costs vary across the expenditure quintiles, with the poor paying higher prices per kilowatt-hour than the more wealthy households. The poorest quintile seems to purchase batteries of signifi cantly lower capacity, while paying similar prices as the richer quintiles do for better batteries.
The use of dry cell batteries for specifi c uses is very common among both grid and off-grid households in rural areas. Often, such batteries fulfi ll an energy niche that cannot be entirely met though the use of grid electricity. However, it is also evident that households with grid electricity are less reliant on batteries for their electricity needs than households without access to it. As a consequence, they save having to pay for what is a very expensive form of energy.
Small Generators and Solar Home Systems
Small generators and solar home systems in rural Peru are uncommon. Overall, 0.6 percent of rural households, or an estimated 13,100 households, use small gasoline or diesel generators. The estimated cost of using a generator is much lower than the cost of using a car battery, and it would give far better service levels. It is likely that a signifi cant barrier to the adoption of generators is their high upfront costs.
Solar photovoltaic (PV) systems represent an option for providing electricity to households in remote rural areas, where the costs of grid extension are particularly high. The use of solar systems is quite rare in rural Peru because of a lack of promotion of the use of such systems. Most of the households that would use a solar PV system now use car batteries. Solar systems are estimated to be present in 0.8 percent of all households, or about 16,700 rural households.
Benefi ts of Rural Electrifi cationThe benefits of electricity consumption can be broken into two categories: direct and indirect. Direct benefits include improvements to lighting and television viewing. Indirect benefits include improved educational outcomes for children in homes with electricity and improved income-generation opportunities. Most of the quantitative work described in the literature relates to estimating the direct benefi ts. However, there is evidence that some direct benefi ts, such as improved lighting, give rise to indirect benefi ts.
7134-CHFM.pdf xix 8/25/10 10:14 AM
Special Report Peru: National Survey of Rural Household Energy Use
xx
There are two principal methods for estimating direct benefi ts, or the willingness of consumers to pay for services: avoided cost and demand curve estimates. The former tends to underestimate value. This study uses demand curves to estimate the benefits of lighting, television viewing, income-generation, and other services.
Benefi ts of Electricity Use to Lighting
Although various forms of energy are used by all income groups, it is primarily the poor who depend on high-cost and less-effi cient alternatives to grid electricity, such as candles and kerosene, to provide lighting.
Using consumer surplus calculations, the report shows the benefi ts in switching to different forms of lighting. Benefi ts from improved lighting range from 17 to 90 soles/month/household, depending on expenditure level and assumptions. The estimates have high variance, but even at the low end of the range, the economic benefi ts are substantial. Not only do households with electricity enjoy much greater levels of service, but also they obtain a real income gain since their total expenditure on lighting service decreases.
Benefi ts of Electricity Use to Communications
For radio, most basic calculations suggest that households without electricity would save 4.6 soles per month if they were to use grid electricity. For television viewing, demand curve calculations fi nd a total benefi t or willingness to pay of 24.2 soles per month.
Benefi ts of Electricity Use to Education and Health
The Survey shows that children aged 6 to 18 in households with electricity read or study 65 minutes per night, compared to 51 minutes for those without electricity. Although school enrollments for children aged 6 to 12 with and without grid access are comparable, school enrollment of children aged 13 to 18 in households with electricity is 82 percent, versus 62 percent in households without access.
Although not quantifi ed, the health benefi ts from reduced burns and respiratory effects from kerosene are major benefi ts of rural electrifi cation.
Benefi ts of Electricity Use to Business
About 13 percent of sampled houses reported a home business, with a higher proportion in grid-electrifi ed households (18.3 percent) than households without electricity (7.7 percent). Although the small number of households using electricity from car batteries have a similar proportion of home businesses as those connected to the grid (16.1 percent), it is clear that home businesses are concentrated in households connected to the grid.
Willingness to pay (WTP) for electricity in non-household applications may be estimated from the results of the business survey, which sampled 192 rural enterprises. Sixty-nine (69) percent had access to the grid. Even a simple consideration of energy sources suggests that WTP for electricity for business is much higher than for domestic applications; 26 percent of unelectrifi ed businesses use car batteries and 24 percent use small generators.
Total energy expenditures remain largely unchanged: 154 soles per month for electrified enterprises versus 155 soles per month for unelectrifi ed enterprises. These energy expenditure data do not take into account the dramatic difference in enterprise incomes. The average monthly turnover (gross sales) in electrified enterprises is 3,520 soles/month, as opposed to 1,140 soles/month in unelectrified enterprises.
Policy ImplicationsChapter 6 uses data from the Survey to consider policy issues relevant to the creation and sustainability of rural electrifi cation programs:
• Connection rates in electrifi ed villages. Almost one-quarter of households without electricity are in villages that are electrifi ed. The most common reason given for nonconnection in these villages is the upfront costs of connection, wiring, and equipment. The fi nancial sustainability of projects is strongly infl uenced by connecting as many households as possible, from which follows that connection costs, perhaps including house wiring, should be part of the overall cost eligible for subsidy.
7134-CHFM.pdf xx 8/25/10 10:14 AM

Executive Summary
xxi
• Variations in electricity consumption levels. An indicative consumption threshold of 22 kWh/household/month is used in this report for whether most rural electrification schemes would be financially viable. Although the average consumption in 374 electrifi ed villages is 35 kWh/household/month, these averages show significant variation across regions. In the Andean South region, the average is only 15 kWh/household/month, and only 23 percent of villages had consumption levels above 22 kWh/household/month. This suggests that there is likely to be a signifi cant problem with fi nancial viability of rural electrifi cation in the Andean South.
• Growth of electricity consumption. One of the important assumptions in making financial projections of the viability of rural electrifi cation projects is the rate of growth in consumption. At least based on the experience of those communities prioritized by the current scheme (often the poorest and most lacking in infrastructure access), there is no evidence that annual consumption growth per connected household would be much higher than the commonly assumed 0.5 to 1.0 percent per year. Therefore, the Survey results suggest that these rates continue to be used in projections.
• Pricing policy. Those who consume small amounts of electricity pay relatively high prices per
kWh, notwithstanding the FOSE mechanism. Households in the lowest quintile capture only 7.7 percent of the total FOSE subsidy received by all rural households, yet this quintile constitutes 20 percent of all households. The highest quintile captures 32.6 percent of the benefit. In short, the targeting performance of the FOSE could be improved. Improvements in the targeting performance could be achieved by further lowering the FOSE cap. If the 50 percent discount were limited to 15 kWh/month and phased out at 25 kWh/month, the share of benefi ts going to the lowest quintile would be 19 percent, while the richest would receive less than 10 percent.
• Effi cient lighting. The economic case for linking future rural electrification projects with an efficient lighting program using compact fl uorescent lamps (CFLs) is compelling. Rural electrifi cation costs per household are between US$445 and $600, so an additional US$8-$9 for three CFLs per household would have little impact on rural electrifi cation project budgets.
Supplementary InformationThe Annexes provide additional information about the Survey design and methodology (Annex 1), more detailed fi ndings (Annex 2), additional details about estimating benefi ts (Annex 3), and the Survey itself (Annex 4).
7134-CHFM.pdf xxi 8/25/10 10:14 AM

7134-CHFM.pdf xxii 8/25/10 10:14 AM
1
1 Introduction
Peru is a country of extreme diversity, both in its geography and the socioeconomic conditions of its citizens. This makes it a challenge for the government of Peru (GoP) to meet its targets to extend access to basic infrastructure services, including electricity, to the dispersed population living in rural areas. Plans and targets have been in place for rural electrifi cation since the early 1970s, but by 2005, only 39 percent of rural households had electricity service. Peru has one of the lowest rural electrifi cation rates in Latin America.
A n est i mated 6 m i l l ion people i n t he predominantly poor rural areas of Peru do not have access to electricity. Together with the scarcity of other infrastructure services, lack of electricity results in high costs for basic energy services, a lower quality of life, poor medical care and education, and limited opportunities for economic development. The extremely high incidence of poverty in rural areas of Peru highlights the importance of investing in provision of basic infrastructure, such as electricity, as part of the national rural development agenda.
The MEM initiated a World Bank- and GEF-assisted Rural Electrifi cation Project in August 2006 to assist local distribution companies in reaching rural populations with well-targeted subsidies, aiming at fi nancing projects that would be fi nancially sustainable after receiving a subsidy of a substantial part of the capital costs (World Bank 2006). The project aims to provide fi nancing for investments in subprojects to supply electricity services to about 160,000 currently unserved rural households, businesses, and public facilities, such as schools and health clinics (serving about 800,000 people), using
both conventional grid extension and renewable energy sources.
Detailed data were required in order to prepare the design of the Peru Rural Electrifi cation Project. Data were also needed to improve the rural electrifi cation program and to analyze the economic and fi nancial aspects of rural electrification. The information needed includes general socioeconomic information on households, as well as detailed information on their current energy use, energy expenditures, and ability/willingness to pay for electricity services. Until now, such data have not been available. Consequently, it was decided to implement the National Survey of Rural Household Energy Use (referred to as the Survey in this publication),3 with the assistance of the Energy Sector Management Assistance Program (ESMAP), to obtain information on the demand and use of electricity in rural areas of Peru.
The Survey was conducted through the National Institute of Statistics and Information Technology (Instituto Nacional de Estadística e Informática, INEI) and experts on household energy surveys provided by the World Bank. INEI’s Technical Department of Demographics and Social Indicators executed the fi eldwork and data processing from April through July 2005 in the 24 departments (departamentos) of Peru.
It is essential to point out that the defi nition of rural population center that is used in the National Survey of Rural Household Energy Use is different from that used by INEI in the census. The defi nition used by INEI for the purpose of the census is that rural population centers are those with less than 100 dwellings grouped contiguously. The defi nition used in the National Survey of Rural Household Energy Use
3 In Spanish, Encuesta de Consumo de Energía a Hogares en el Ámbito Rural.
7134-CH01.pdf 1 7/27/10 6:54 AM
Special Report Peru: National Survey of Rural Household Energy Use
2
for rural population centers are those with less than 1000 dwellings grouped contiguously, a defi nition that better represents the target population for rural electrifi cation programs. This difference in defi nition of rural population centers means that the data from this survey cannot be directly compared with data from the census of other surveys conducted by INEI.
The Survey covered 6,690 households with and without electricity in rural areas of Peru. Rural areas were defi ned as those populations living in aggregations of 1,000 households or less. The sample was large enough to provide reliable estimations about the survey population at seven regional levels: Coastal North, Central, and South Regions, the Andean North, Central, and South Regions, and the Amazon Region. The expected standard deviation in each region ranged from 0.021 to 0.050 (see Annex 1).
This report presents the main results of the Survey, and shows how Survey information can contribute to the analysis of important policy issues in developing an improved rural electrification framework in Peru.
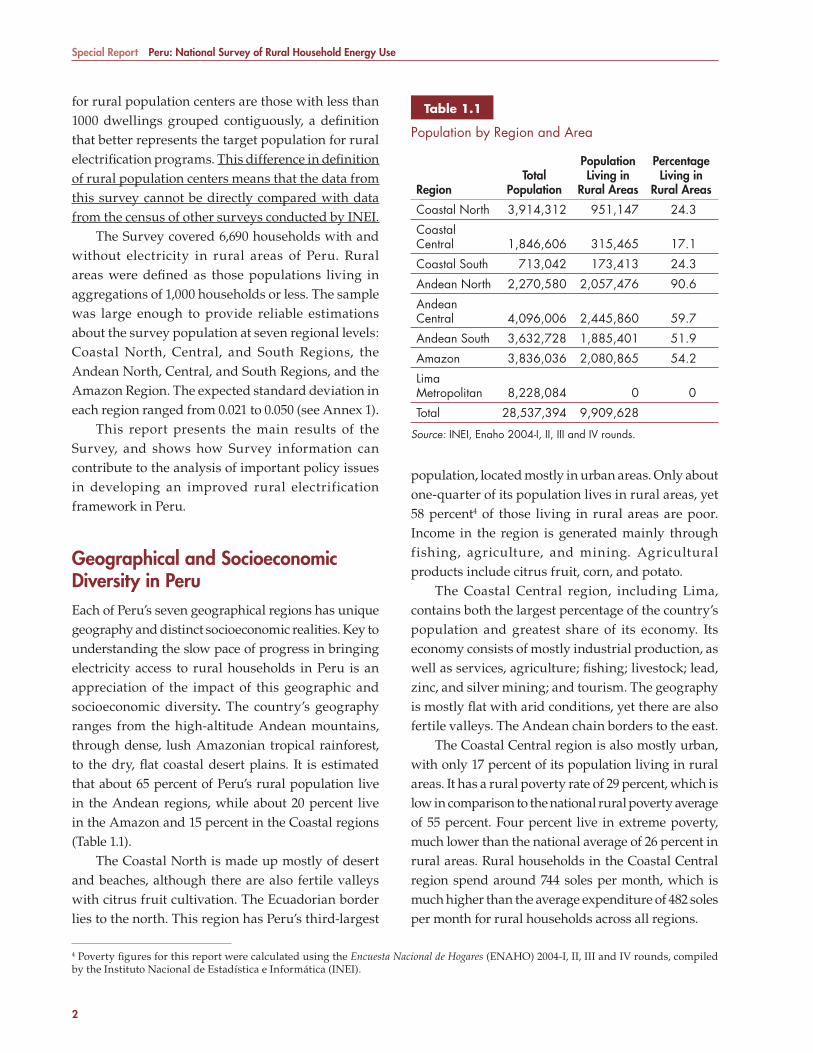
Geographical and Socioeconomic Diversity in PeruEach of Peru’s seven geographical regions has unique geography and distinct socioeconomic realities. Key to understanding the slow pace of progress in bringing electricity access to rural households in Peru is an appreciation of the impact of this geographic and socioeconomic diversity. The country’s geography ranges from the high-altitude Andean mountains, through dense, lush Amazonian tropical rainforest, to the dry, fl at coastal desert plains. It is estimated that about 65 percent of Peru’s rural population live in the Andean regions, while about 20 percent live in the Amazon and 15 percent in the Coastal regions (Table 1.1).
The Coastal North is made up mostly of desert and beaches, although there are also fertile valleys with citrus fruit cultivation. The Ecuadorian border lies to the north. This region has Peru’s third-largest
population, located mostly in urban areas. Only about one-quarter of its population lives in rural areas, yet 58 percent4 of those living in rural areas are poor. Income in the region is generated mainly through fishing, agriculture, and mining. Agricultural products include citrus fruit, corn, and potato.
The Coastal Central region, including Lima, contains both the largest percentage of the country’s population and greatest share of its economy. Its economy consists of mostly industrial production, as well as services, agriculture; fi shing; livestock; lead, zinc, and silver mining; and tourism. The geography is mostly fl at with arid conditions, yet there are also fertile valleys. The Andean chain borders to the east.
The Coastal Central region is also mostly urban, with only 17 percent of its population living in rural areas. It has a rural poverty rate of 29 percent, which is low in comparison to the national rural poverty average of 55 percent. Four percent live in extreme poverty, much lower than the national average of 26 percent in rural areas. Rural households in the Coastal Central region spend around 744 soles per month, which is much higher than the average expenditure of 482 soles per month for rural households across all regions.
4 Poverty fi gures for this report were calculated using the Encuesta Nacional de Hogares (ENAHO) 2004-I, II, III and IV rounds, compiled by the Instituto Nacional de Estadística e Informática (INEI).
Table 1.1Table 1.1
Population by Region and Area
RegionTotal
Population
Population Living in
Rural Areas
Percentage Living in
Rural Areas
Coastal North 3,914,312 951,147 24.3
Coastal Central 1,846,606 315,465 17.1
Coastal South 713,042 173,413 24.3
Andean North 2,270,580 2,057,476 90.6
Andean Central 4,096,006 2,445,860 59.7
Andean South 3,632,728 1,885,401 51.9
Amazon 3,836,036 2,080,865 54.2
Lima Metropolitan 8,228,084 0 0
Total 28,537,394 9,909,628
Source: INEI, Enaho 2004-I, II, III and IV rounds.
7134-CH01.pdf 2 7/27/10 6:54 AM

1 Introduction
3
The Coastal South region is also fl at and desert-like, with some fertile irrigated valleys, the Andes to the east, and the Chilean border to the south. It has both the lowest population of Peru’s seven regions and the smallest number of people living in rural areas. Approximately one-quarter of its population lives in rural areas, and it has the lowest rural poverty index of the regions, at 21 percent. The Coastal South also has the country’s highest rural household expenditure, about 775 soles per month. The economy depends on fi shing; copper mining; agriculture such as corn, potato, and asparagus; production of wine and Pisco; and production of poultry and other livestock.
The landscape of the Andean North is a mixture of high peaks, plateaus, and deep gorges and valleys, which makes the provision of basic infrastructure to these areas very diffi cult and expensive. This region also has one of the most expansive land areas of the regions. (The entire Andean region covers 30 percent of Peru’s total land area.) The Andean North is the world’s sixth largest producer of gold, as well as a major producer of livestock, such as cattle and sheep, and associated products, such as milk and cheese. It also produces agricultural goods such as corn, potato, and rice, and has some tourism. However, much of its rural population continues to depend on subsistence farming. It has the highest percent of population living in rural areas, at 90 percent, and the highest index of poverty in rural areas.
The Andean Central region has some of the highest peaks in the world, particularly in the White Andean chain, as well as valleys, gorges, and rivers. As in the Andean North, this diffi cult geography hinders the provision of public infrastructure such as roads and electricity. Income in this region is generated from lead, zinc, and silver mining and smelting. Potato and other root crops are other major sources of income. Much of the rural population is dedicated to subsistence farming. This Andean region has the largest population of the country (excluding metropolitan Lima), with 60 percent of its inhabitants living in rural areas. Sixty-eight percent of these rural households are poor, and 44 percent live in extreme poverty.
The Andean South is characterized by high altitudes, harsh winters, and strong winds in the areas
where much of the population lives, making it diffi cult to raise any crops other than potatoes. Although there is a thriving tourism industry (mainly from the Cuzco-Machu Picchu area) and a large percentage of its income derives from natural gas production (Camisea), the region also contains Peru’s two poorest departamentos, Huancavelica and Huanuco. The majority of the rural population generates income through agricultural production, mainly potato, and subsistence farming. A little more than one-half of the total population lives in rural areas. The Andean South has the second highest poverty incidence in the country. Nearly 70 percent of rural households are poor, and about 38 percent are extremely poor.
The Amazon makes up 60 percent of Peru’s total land area. It is covered with thick tropical forests in the west and dense tropical vegetation in the center and east. As a result, the region remains largely unexplored and undeveloped. This makes the infrastructure, such as grid-connected electricity, expensive. The Amazon is one of the most populated regions, with 54 percent of its population in rural areas. Although not as poor as the Andean regions, 58 percent of rural households in the Amazon are poor and 26 percent live in extreme poverty. The Amazon region mainly produces citrus fruit and coffee, and also generates income through tourism. It also produces rice and yucca, and there is some petroleum mining.
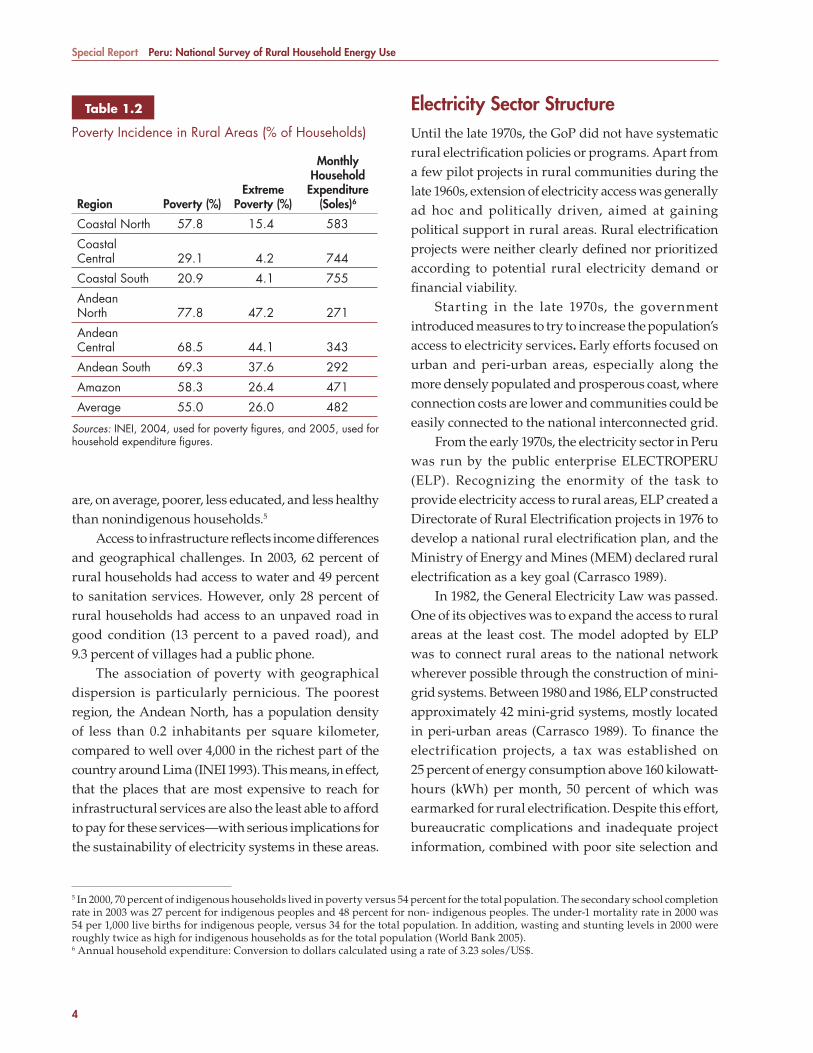
Household income and expenditures are positively correlated with urbanization and density of population. The coastal regions are the most commercialized, urban, and prosperous. Almost one-third of the country’s population lives in Lima, but only 3 percent of its population lives in extreme poverty. Extreme poverty rates among urban populations range from 4 percent in the Central and South areas to 15 percent in the Coastal North. This contrasts sharply with conditions in the North and Central Andes, where a predominantly indigenous population engages in traditional lifestyles. In the Andean regions, between 38 and 47 percent of all households live in extreme poverty, and rural households on average have less than one-quarter of the average annual income per household in Lima (INEI 2005; World Bank 2005) (see Table 1.2). According to data from the World Bank’s Peru Poverty Assessment (2005), indigenous households
7134-CH01.pdf 3 7/27/10 6:54 AM
Special Report Peru: National Survey of Rural Household Energy Use
4
are, on average, poorer, less educated, and less healthy than nonindigenous households.5
Access to infrastructure refl ects income differences and geographical challenges. In 2003, 62 percent of rural households had access to water and 49 percent to sanitation services. However, only 28 percent of rural households had access to an unpaved road in good condition (13 percent to a paved road), and 9.3 percent of villages had a public phone.
The association of poverty with geographical dispersion is particularly pernicious. The poorest region, the Andean North, has a population density of less than 0.2 inhabitants per square kilometer, compared to well over 4,000 in the richest part of the country around Lima (INEI 1993). This means, in effect, that the places that are most expensive to reach for infrastructural services are also the least able to afford to pay for these services—with serious implications for the sustainability of electricity systems in these areas.
Electricity Sector StructureUntil the late 1970s, the GoP did not have systematic rural electrifi cation policies or programs. Apart from a few pilot projects in rural communities during the late 1960s, extension of electricity access was generally ad hoc and politically driven, aimed at gaining political support in rural areas. Rural electrifi cation projects were neither clearly defi ned nor prioritized according to potential rural electricity demand or fi nancial viability.
Starting in the late 1970s, the government introduced measures to try to increase the population’s access to electricity services. Early efforts focused on urban and peri-urban areas, especially along the more densely populated and prosperous coast, where connection costs are lower and communities could be easily connected to the national interconnected grid.
From the early 1970s, the electricity sector in Peru was run by the public enterprise ELECTROPERU (ELP). Recognizing the enormity of the task to provide electricity access to rural areas, ELP created a Directorate of Rural Electrifi cation projects in 1976 to develop a national rural electrifi cation plan, and the Ministry of Energy and Mines (MEM) declared rural electrifi cation as a key goal (Carrasco 1989).
In 1982, the General Electricity Law was passed. One of its objectives was to expand the access to rural areas at the least cost. The model adopted by ELP was to connect rural areas to the national network wherever possible through the construction of mini-grid systems. Between 1980 and 1986, ELP constructed approximately 42 mini-grid systems, mostly located in peri-urban areas (Carrasco 1989). To fi nance the electrification projects, a tax was established on 25 percent of energy consumption above 160 kilowatt-hours (kWh) per month, 50 percent of which was earmarked for rural electrifi cation. Despite this effort, bureaucratic complications and inadequate project information, combined with poor site selection and
Table 1.2Table 1.2
Poverty Incidence in Rural Areas (% of Households)
Region Poverty (%)Extreme
Poverty (%)
Monthly Household Expenditure
(Soles)6
Coastal North 57.8 15.4 583
Coastal Central 29.1 4.2 744
Coastal South 20.9 4.1 755
Andean North 77.8 47.2 271
Andean Central 68.5 44.1 343
Andean South 69.3 37.6 292
Amazon 58.3 26.4 471
Average 55.0 26.0 482
Sources: INEI, 2004, used for poverty fi gures, and 2005, used for household expenditure fi gures.
5 In 2000, 70 percent of indigenous households lived in poverty versus 54 percent for the total population. The secondary school completion rate in 2003 was 27 percent for indigenous peoples and 48 percent for non- indigenous peoples. The under-1 mortality rate in 2000 was 54 per 1,000 live births for indigenous people, versus 34 for the total population. In addition, wasting and stunting levels in 2000 were roughly twice as high for indigenous households as for the total population (World Bank 2005).6 Annual household expenditure: Conversion to dollars calculated using a rate of 3.23 soles/US$.
7134-CH01.pdf 4 7/27/10 6:54 AM
1 Introduction
5
prioritization, made it diffi cult for ELP to reach its project goals. A failure to properly train local staff also resulted in poor administration, operation, and management of the mini-grid systems.
In 1992, a new legal and regulatory framework for the electricity sector was put in place through the Law of Electric Concessions (Ley de Concessiones Eléctricas, LCE). In line with then-President Alberto Fujimori’s focus on economic reform, the LCE envisaged the private sector as the principal actor, with the public sector playing mainly a regulatory and supervisory role. As with many other Latin American countries during this period, the vertically integrated model was replaced with a new structure in which generation, transmission, and distribution were unbundled, with competitive markets operating in the generation andcommercialization markets, while transmission and distribution was regulated, based on free-entry and open access. A privatization program was established to break up the vertically integrated ELP and transfer the assets into private hands.
Prices for small retail users (known as regulated users) were regulated, while a free market was created for large industrial and commercial customers with demand above 1,000 kW (free users). Price setting was done on the principle of a reasonable return to compensate the costs of an “economically efficient” service provider. The main regulatory body, responsible for tariff setting, supervising, and monitoring the legal and technical regulations for the electricity sector, was the Supervisory Commission for Energy Investments (Organismo Supervisor de la Inversión en Energía, OSINERG).
Despite attempts to extend privatization throughout Peru, factors such as high capital costs, low demand, and diffi cult geography have discouraged private investment outside Lima. There are two principal private distribution companies, EDELNOR and Luz del Sur, created when ELP was privatized in 1994. They serve approximately half of the total electric market in Peru, primarily in the areas around Lima.
Twelve other regional electric distribution companies provide service in Peru, as well as the few smaller-scale municipality electric companies—all of which are publicly owned. These companies hold
concession areas concentrated in small areas around urban centers and have an obligation to meet service requests only within 100 meters of the existing network. There is thus no incentive for either public or private companies to extend service to households outside these concession areas. Areas with electric concessions in Peru are dwarfed by areas with no service from a distribution company. Connected areas are heavily concentrated in urban coastal areas, such as Lima, while the majority of the rural population remains unserved.
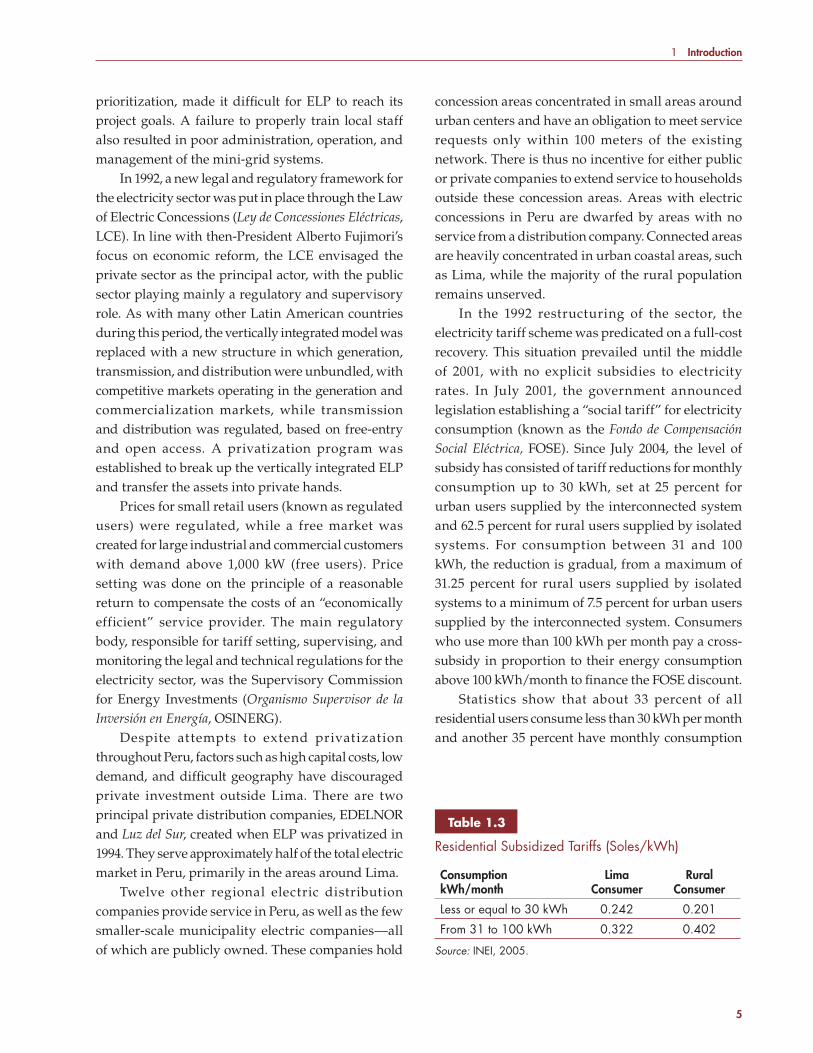
In the 1992 restructuring of the sector, the electricity tariff scheme was predicated on a full-cost recovery. This situation prevailed until the middle of 2001, with no explicit subsidies to electricity rates. In July 2001, the government announced legislation establishing a “social tariff” for electricity consumption (known as the Fondo de Compensación Social Eléctrica, FOSE). Since July 2004, the level of subsidy has consisted of tariff reductions for monthly consumption up to 30 kWh, set at 25 percent for urban users supplied by the interconnected system and 62.5 percent for rural users supplied by isolated systems. For consumption between 31 and 100 kWh, the reduction is gradual, from a maximum of 31.25 percent for rural users supplied by isolated systems to a minimum of 7.5 percent for urban users supplied by the interconnected system. Consumers who use more than 100 kWh per month pay a cross-subsidy in proportion to their energy consumption above 100 kWh/month to fi nance the FOSE discount.
Statistics show that about 33 percent of all residential users consume less than 30 kWh per month and another 35 percent have monthly consumption
Table 1.3Table 1.3
Residential Subsidized Tariffs (Soles/kWh)
Consumption kWh/month
Lima Consumer
Rural Consumer
Less or equal to 30 kWh 0.242 0.201
From 31 to 100 kWh 0.322 0.402
Source: INEI, 2005.
7134-CH01.pdf 5 7/27/10 6:54 AM

Special Report Peru: National Survey of Rural Household Energy Use
6
between 31 and 100 kWh. This means that 68 percent of all residential consumers receive some electricity price subsidy. This cost of the subsidy represents a surcharge of 3 percent cost of electricity to the users providing the subsidy (those with monthly consumption over 100 kWh.). Table 1.3 shows electricity tariffs, including the FOSE subsidy, for a residential user with monthly consumption up to 100 kWh.
It should also be noted that rural tariffs vary by location, based on the tariff calculated by OSINERG for the areas of each distribution company. The price paid per kWh from the Survey (including fi xed and variable, as well as other charges such as lighting), varied from a low of 0.47 soles/kWh in the Coastal South Coast region to a high of 0.83 soles/kWh in the Andean South region. The fi xed charge for connection, until recently paid by the customer, averaged about 320 soles per connection. Under the 2006 Rural Electrifi cation law, the distribution company will pay the connection charge. The connection facilities (wire drop and meter) will be owned by the distribution company and will be recovered through the distribution value-added charge as part of the tariff.
The National Financing Fund supervises state-owned distribution companies for State Enterprise Activity (Fondo Nacional de Financiamiento de la Actividad Empresarial del Estado, FONAFE). FONAFE is a state organization that holds assets, sets policies, and directs investments of regional distribution enterprises.
Rural Electrifi cation to DateOverall, electricity coverage rates are lower than in most countries in Latin America, at 78 percent. In comparison, the coverage rate is 89 percent in Ecuador, which has roughly the same per capita income (see Table 1.4). As noted earlier, an estimated 6 million people in the predominantly poor rural areas of Peru do not have access to electricity.
The low level of rural electrifi cation in Peru refl ects the fact that the framework under the Electricity Law failed to address rural electrifi cation. To fi ll this gap, a 1993 Supreme Decree created the Executive Project
Directorate (DEP) within the Ministry of Energy and Mines (MEM) as a project implementation branch whose principal objective is to extend electricity access, mainly in rural areas. The primary function of the DEP is to define and implement the rural electrification plan, financing or cofinancing the majority of these projects and directly implementing them by contracting with construction fi rms.
The DEP prepares a national rural electrifi cation plan that sets out a list of projects to be developed, annual investment budgets, and sources of funding. The plan has a 10-year horizon and is updated annually, refl ecting program progress, new policies, and prioritization and allocation of economic resources. The Plan Nacional de Electrifi cación Rural 2006–2015 aims to increase the national coverage rate
Table 1.4Table 1.4
Latin American and Caribbean Region Electricity Coverage, by Percentage of Coverage
Population, 2005
(millions)
Electricity Coverage
(%)
Population w/o
Electricity (millions)
Nicaragua 5.5 54 2.5
Bolivia 9.2 69 2.8
Honduras 7.2 69 2.2
Peru 28 78 6.3
El Salvador 6.9 82 1.2
Guatemala 12.6 83 2.1
Panama 3.2 86 0.5
Paraguay 6.2 87 0.8
Ecuador 13.2 89 1.5
Brazil 186.4 92 15.8
Venezuela 26.6 92 2.2
Mexico 103.2 93 6.8
Colombia 41.5 94 2.7
Argentina 38.7 95 2.1
Uruguay 3.5 95 0.2
Chile 16.3 98 0.3
Costa Rica 4.3 99 0.1
Total 512.4 90 50.1
Sources: CIER, ECLAC, Offi cial statistics in the case of Colombia, Mexico, and Chile.
7134-CH01.pdf 6 7/27/10 6:54 AM

1 Introduction
7
from 78 percent in 2006 to 93 percent in 2015, at a total cost of US$929 million (MEM 2007).
The DEP performs all of the administrative, technical, and/or financial activities required to develop projects (directly or through service contracting), including prefeasibility and feasibility studies, procurement, contracting, execution of the works, supervision, and inspection until the service begins. Financing for these projects comes from the central government’s budget. The constructed systems are later transferred to distribution companies or to the Electric Infrastructure Administration Enterprise (ADINELSA), a government holding company, as described later in this chapter.
The first step in the DEP process is for the community, local or regional government to submit a letter of request to the DEP. The DEP evaluates the project based on technical criteria (actual project state, electric infrastructure, provincial electricity coefficient), economic criteria (actual social net value, investment/capita), and socioeconomic criteria (poverty index, geographic location). An engineer then visits and evaluates the site and draws up the technical plan for project implementation, followed by the preparation of prefeasibility and feasibility studies. The DEP then, through a bidding process, contracts the construction of selected projects. After the project is constructed, administration is transferred to the primary electricity distributor in the region or, if it is an isolated system, to ADINELSA.
In addition to the DEP, the National Fund for Compensation and Social Development of Peru (FONCODES) also played a part in rural access extension in the 1990s. Created in 1991 as a temporary autonomous, decentralized agency that reports directly to the executive branch of the GoP, it was designed to improve the living conditions of the poor, create jobs, help to meet the basic needs of the poor, and encourage the poor to take part in their own development. Between 1991 and 1996, FONCODES invested more than US$57 million in 1,733 energy infrastructure projects. FONCODES was originally given funds to cofi nance rural development projects, but since decentralization, the funds are given directly to regional governments.
The activities of the electricity distribution companies within their concessions, and of the DEP and social funds such as FONCODES in rural areas, have increased national coverage levels from 57 percent in 1993 to 78 percent in 2006. Although coverage is at approximately 94 percent in urban areas, it is still only about 39 percent in rural areas (INEI, 2005). The total investment by the DEP to 2004 was just over US$600 million, with an annual average of about US$50 million. The DEP completed 608 projects during this time period. About 4.8 million people benefited from these projects (1 million households). The average amount of kilowatt-hours (kWh) consumed per month by each household that benefi ted from the DEP projects is around 20 kWh.
O nce DEP or FONCODES projec t s a re commissioned, ownership of the fixed assets is transferred to distribution companies. Where these assets cannot be transferred to electricity distribution companies—usually in areas located outside the geographical limits of the regional electricity companies—they are transferred to the Electric Infrastructure Administration Enterprise (Empresa de Administración de Infraestructura Eléctrica S.A., ADINELSA), a state company formed to administer the fi xed assets of the DEP program and supervise the operation of the isolated rural electricity systems. ADINELSA is in charge of administering the electricity installations and delegates the operation and maintenance of the facilities to concessionary enterprises or municipalities.
Key Rural Electrifi cation IssuesThe first and most important issue for the rural electrifi cation program is adequate fi nancing. There is a need for sustained and predictable fi nancing of the subsidies required. Funding for the rural electrifi cation projects constructed by the DEP or FONCODES has come almost entirely from the Treasury, with some contributions from other state entities and regional and local governments. The levels of investments have dropped signifi cantly from a peak of US$135 million in 1996 to about $40 million
7134-CH01.pdf 7 7/27/10 6:54 AM
Special Report Peru: National Survey of Rural Household Energy Use
8
per year in 2004–2005. Although it may be unrealistic to expect to reach the GoP’s target, which would require almost a doubling of current budget levels, mobilizing cofi nancing from distribution companies, as well as from local and regional governments, could help.
A second key concern for rural electrifi cation projects has been fi nancial and technical sustainability during the operation of the projects. Projects that are transferred to distribution companies, and especially ADINELSA, often have costs for operation and maintenance that are higher than the revenues from the tariff. ADINELSA, for example, must continuously subsidize the operators of its projects, and is, as a consequence, facing increasingly heavy losses, with operating losses at US$2.8 million in 2003 and US$4.7 million in 2004.
Part of the problem occurs because the weighting factors for project selection have resulted in priority being given to areas with low provincial electricity coverage and a high incidence of poverty as opposed to criteria such as economic effi ciency, minimum subsidy, or maximum economic benefit. This undermines the long-run project sustainability and imposes an excessive burden on the distribution companies or ADINELSA, which must then subsidize projects whose operation and maintenance costs are higher than tariff revenues.
A third key issue is that the DEP and FONCODES have followed centralized processes with very limited participation of distribution companies in the process of identification, selection, and development of projects. The distribution companies, for their part, have generally lost interest in participation in the extension of rural electricity service, as there have been no incentives available to them to cover the capital costs for grid extension.
Despite MEM’s significant achievements in improving electrifi cation in Peru, limitations on fi scal budget allocations and problems with the existing approach suggest the need for an overhaul of the model. An improved strategy is required to promote the involvement of public and private distribution
companies and to broaden the involvement of additional actors in project development. Aside from a few exceptions, the municipalities have also not participated in electric service provision. Instead, they have taken on the role of lobbying on behalf of local demands for obtaining electricity service and contributing to fi nancing the electricity projects (Aragón 2004).
In the Rural Electrifi cation Plan of 2007, the GoP aims to increase national coverage from 78 percent in 2006 to 88.5 percent in 2011 and 93 percent in 2015. To meet this commitment, investments benefi ting 4.8 million people and totaling US$929 million between 2006 and 2015 are planned (MEM 2007). Most of these investments are planned in rural areas.
To accomplish this ambitious task, the GoP will need to improve the rural electrifi cation framework to increase economic effi ciency and attract broader participation and financing from communities, regional governments, and electricity service providers. Congress passed the General Law of Rural Electrifi cation on July 1, 2006. The General Law creates a Rural Electrifi cation Fund and provides a base from which specifi c regulations can be developed for an improved strategy.
The MEM initiated a World Bank- and GEF-assisted Rural Electrifi cation Project in August 2006 to assist local distribution companies in reaching rural populations with well-targeted subsidies, aiming at fi nancing projects that would be fi nancially sustainable after receiving a subsidy of a substantial part of the capital costs (World Bank 2006). The project aims to provide fi nancing for investments in subprojects to supply electricity services to about 160,000 currently unserved rural households, businesses, and public facilities, such as schools and health clinics (serving about 800,000 people), using both conventional grid extension and renewable energy sources. The Project also includes a component aimed at increasing productive uses of electricity. It is hoped that lessons learned during the implementation of this Project would assist the Ministry to develop a more sustainable and cost-effective strategy for rural electrifi cation.
7134-CH01.pdf 8 7/27/10 6:54 AM
9
2 Household Energy Use and Expenditure
Knowledge about existing energy use and expenditure patterns of rural households is essential for formulating energy policies and programs to enhance living standards and alleviate poverty in rural Peru. It enables energy planners to determine the potential willingness and ability of rural households to pay for modern energy, such as electricity, kerosene, liquefi ed petroleum gas (LPG), and off-grid electricity sources such as car batteries. It also facilitates assessment of the potential demand for such modern and clean energy sources.
This chapter presents the information from the Survey on current energy use and expenditures in rural households in Peru. It compares energy usage among households in different regions, different household expenditure quintile classifi cations, and different categories of households, with and without access to grid electricity. It should be noted that the report uses total household monthly expenditure as a proxy for household monthly income.
Household Energy Use The Survey shows that rural households in Peru, like rural households elsewhere in the world, rely on various sources of energy for lighting, cooking, and appliances, including agriculture residue, fuelwood, animal dung, candles, kerosene, electricity, liquid petroleum gas (LPG), dry cell batteries, car batteries, generators, and even solar home systems (Table 2.1). More than 84 percent of households rely on fuelwood for cooking, while 24 percent use dung and 11 percent use agriculture residue. An estimated 74 percent of all households use dry cells for small appliances such as radios and fl ashlights. About 60 percent of all households use candles and
kerosene for lighting. Electricity is used by 39 percent of all households. A surprisingly high 11 percent of all households use car batteries to run electric appliances, indicating a high, unmet demand and willingness to pay for electricity services. LPG is used mainly for cooking by an estimated 14 percent of all households. A tiny fraction of households, 0.6 percent, have their own generators; and 0.5 percent have solar home systems.
There is a high degree of regional variation in these fi gures, particularly between the richer Coastal regions and the Andean and Amazon Regions that contain significant indigenous populations. Electricity use is highest in the Coastal Central at 60 percent and Coastal South at 71 percent, and lowest in the Amazon at 18 percent. Similarly, LPG use is also highest in the Coastal Central and South areas at 63 and 53 percent, and lowest in the Andean North and Amazon Regions at 5 and 7 percent. Car battery use is concentrated in the Coastal North and Central Regions. The use of dung is concentrated in the Andean South, and to a lesser extent in the Andean Central region.
More households in the three Andean Regions use candles and kerosene than households living in the three coastal regions. This is expected because fewer households living in the mountains have access to grid electricity than households on the coast. The percentage of households in the Andean Regions with access to grid electricity ranges from 22 percent in the North to 52 percent in the Central region. In the Coastal regions, coverage of grid electricity ranges from 35 percent in the North to about 71 percent in the South.
Kerosene is used by 57 percent of households for lighting and cooking, although the overwhelming majority of kerosene consumers use it only or mainly
7134-CH02.pdf 9 8/25/10 10:14 AM
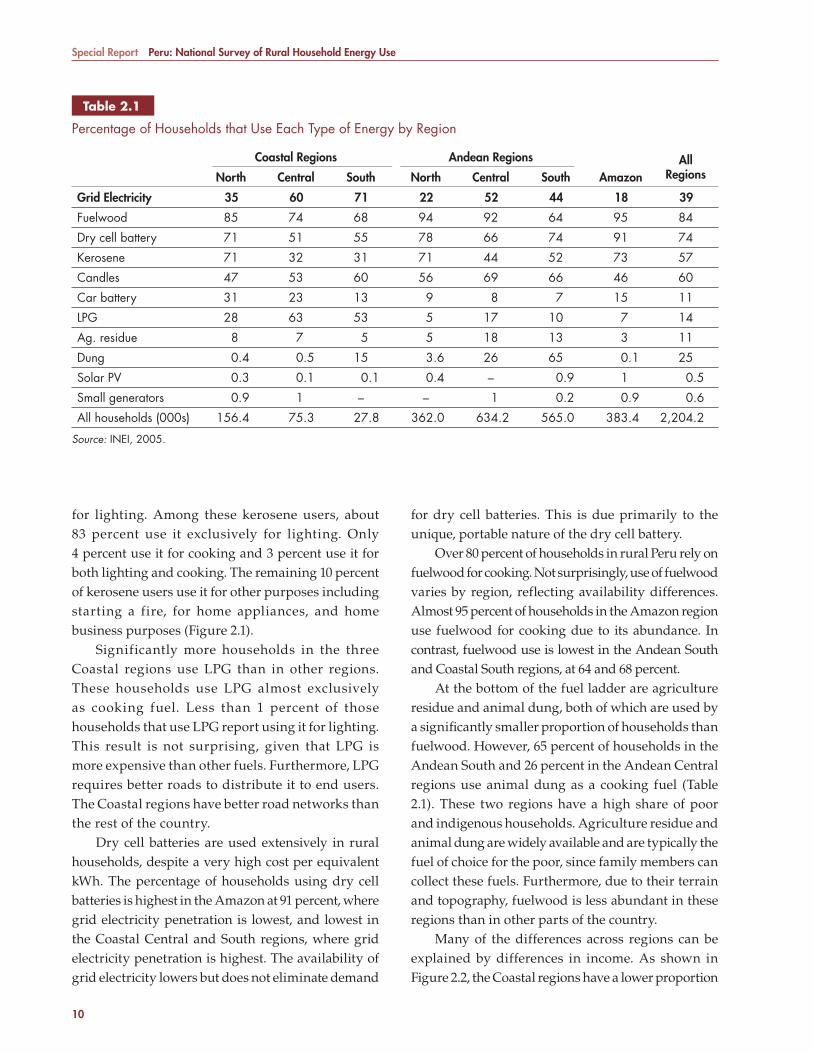
Special Report Peru: National Survey of Rural Household Energy Use
10
for lighting. Among these kerosene users, about 83 percent use it exclusively for lighting. Only 4 percent use it for cooking and 3 percent use it for both lighting and cooking. The remaining 10 percent of kerosene users use it for other purposes including starting a fire, for home appliances, and home business purposes (Figure 2.1).
Significantly more households in the three Coastal regions use LPG than in other regions. These households use LPG almost exclusively as cooking fuel. Less than 1 percent of those households that use LPG report using it for lighting. This result is not surprising, given that LPG is more expensive than other fuels. Furthermore, LPG requires better roads to distribute it to end users. The Coastal regions have better road networks than the rest of the country.
Dry cell batteries are used extensively in rural households, despite a very high cost per equivalent kWh. The percentage of households using dry cell batteries is highest in the Amazon at 91 percent, where grid electricity penetration is lowest, and lowest in the Coastal Central and South regions, where grid electricity penetration is highest. The availability of grid electricity lowers but does not eliminate demand
for dry cell batteries. This is due primarily to the unique, portable nature of the dry cell battery.
Over 80 percent of households in rural Peru rely on fuelwood for cooking. Not surprisingly, use of fuelwood varies by region, reflecting availability differences. Almost 95 percent of households in the Amazon region use fuelwood for cooking due to its abundance. In contrast, fuelwood use is lowest in the Andean South and Coastal South regions, at 64 and 68 percent.
At the bottom of the fuel ladder are agriculture residue and animal dung, both of which are used by a signifi cantly smaller proportion of households than fuelwood. However, 65 percent of households in the Andean South and 26 percent in the Andean Central regions use animal dung as a cooking fuel (Table 2.1). These two regions have a high share of poor and indigenous households. Agriculture residue and animal dung are widely available and are typically the fuel of choice for the poor, since family members can collect these fuels. Furthermore, due to their terrain and topography, fuelwood is less abundant in these regions than in other parts of the country.
Many of the differences across regions can be explained by differences in income. As shown in Figure 2.2, the Coastal regions have a lower proportion
Table 2.1Table 2.1
Percentage of Households that Use Each Type of Energy by Region
Coastal Regions Andean Regions
Amazon All
RegionsNorth Central South North Central South
Grid Electricity 35 60 71 22 52 44 18 39
Fuelwood 85 74 68 94 92 64 95 84
Dry cell battery 71 51 55 78 66 74 91 74
Kerosene 71 32 31 71 44 52 73 57
Candles 47 53 60 56 69 66 46 60
Car battery 31 23 13 9 8 7 15 11
LPG 28 63 53 5 17 10 7 14
Ag. residue 8 7 5 5 18 13 3 11
Dung 0.4 0.5 15 3.6 26 65 0.1 25
Solar PV 0.3 0.1 0.1 0.4 – 0.9 1 0.5
Small generators 0.9 1 – – 1 0.2 0.9 0.6
All households (000s) 156.4 75.3 27.8 362.0 634.2 565.0 383.4 2,204.2
Source: INEI, 2005.
7134-CH02.pdf 10 8/25/10 10:14 AM
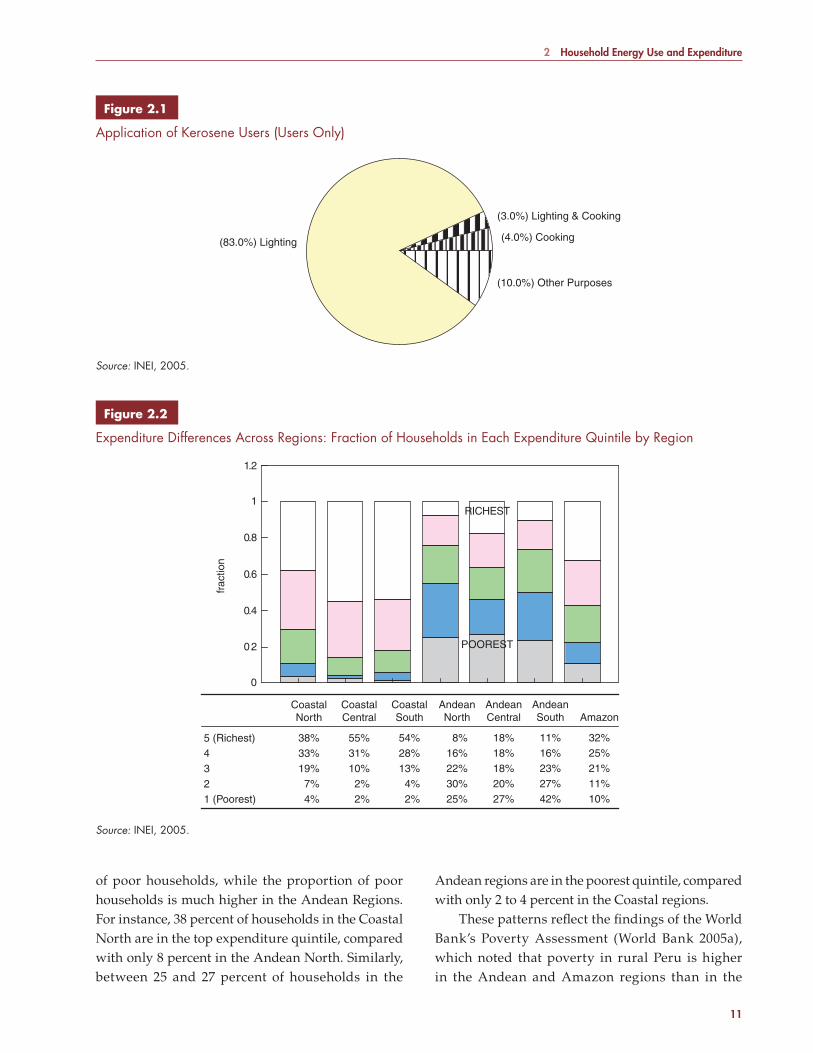
2 Household Energy Use and Expenditure
11
of poor households, while the proportion of poor households is much higher in the Andean Regions. For instance, 38 percent of households in the Coastal North are in the top expenditure quintile, compared with only 8 percent in the Andean North. Similarly, between 25 and 27 percent of households in the
Andean regions are in the poorest quintile, compared with only 2 to 4 percent in the Coastal regions.
These patterns refl ect the fi ndings of the World Bank’s Poverty Assessment (World Bank 2005a), which noted that poverty in rural Peru is higher in the Andean and Amazon regions than in the
Source: INEI, 2005.
(83.0%) Lighting
(10.0%) Other Purposes
(3.0%) Lighting & Cooking
(4.0%) Cooking
Figure 2.1Figure 2.1
Application of Kerosene Users (Users Only)
Source: INEI, 2005.
.
0
02
0.4
0.6
0.
frac
tion
8
1
1.2
POOREST
RICHEST
5 (Richest)4321 (Poorest)
CoastalNorth
38%33%19%7%4%
55%31%10%2%2%
CoastalCentral
54%28%13%4%2%
CoastalSouth
8%16%22%30%25%
AndeanNorth
18%18%18%20%27%
AndeanCentral
11%16%23%27%42%
AndeanSouth
32%25%21%11%10%
Amazon
Figure 2.2 Figure 2.2
Expenditure Differences Across Regions: Fraction of Households in Each Expenditure Quintile by Region
7134-CH02.pdf 11 8/25/10 10:14 AM
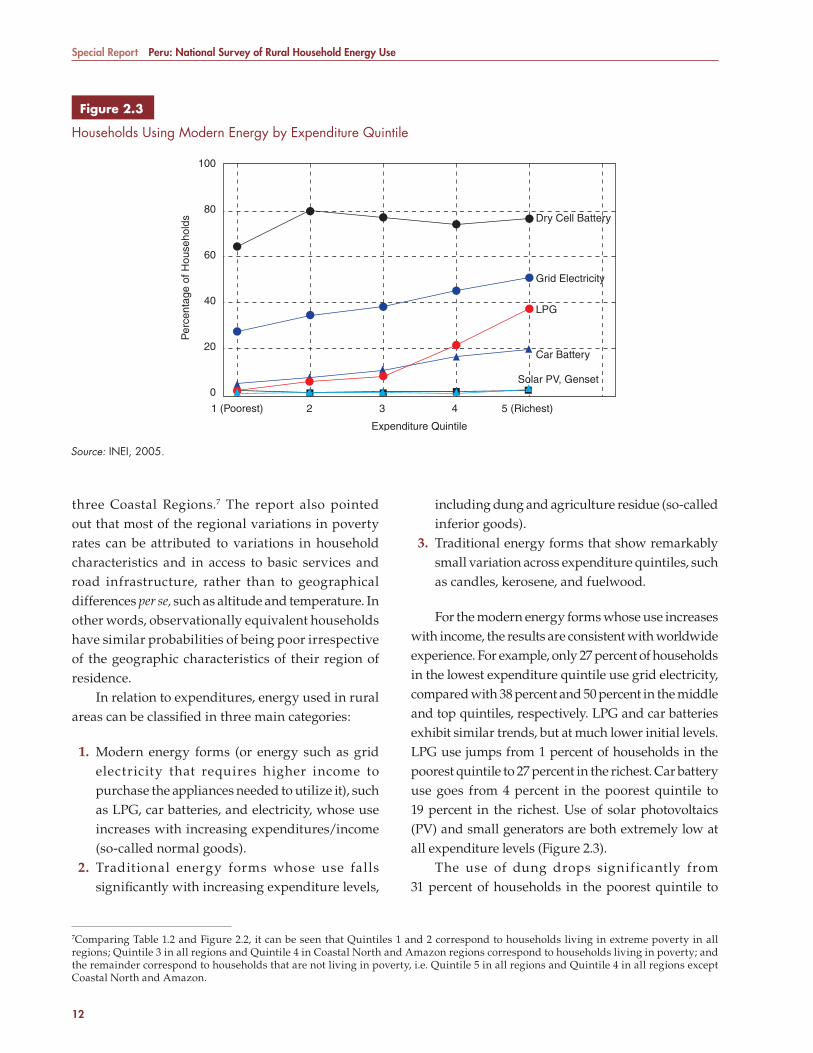
Special Report Peru: National Survey of Rural Household Energy Use
12
three Coastal Regions.7 The report also pointed out that most of the regional variations in poverty rates can be attributed to variations in household characteristics and in access to basic services and road infrastructure, rather than to geographical differences per se, such as altitude and temperature. In other words, observationally equivalent households have similar probabilities of being poor irrespective of the geographic characteristics of their region of residence.
In relation to expenditures, energy used in rural areas can be classifi ed in three main categories:
1. Modern energy forms (or energy such as grid electricity that requires higher income to purchase the appliances needed to utilize it), such as LPG, car batteries, and electricity, whose use increases with increasing expenditures/income (so-called normal goods).
2. Traditional energy forms whose use falls signifi cantly with increasing expenditure levels,
including dung and agriculture residue (so-called inferior goods).
3. Traditional energy forms that show remarkably small variation across expenditure quintiles, such as candles, kerosene, and fuelwood.
For the modern energy forms whose use increases with income, the results are consistent with worldwide experience. For example, only 27 percent of households in the lowest expenditure quintile use grid electricity, compared with 38 percent and 50 percent in the middle and top quintiles, respectively. LPG and car batteries exhibit similar trends, but at much lower initial levels. LPG use jumps from 1 percent of households in the poorest quintile to 27 percent in the richest. Car battery use goes from 4 percent in the poorest quintile to 19 percent in the richest. Use of solar photovoltaics (PV) and small generators are both extremely low at all expenditure levels (Figure 2.3).
The use of dung drops significantly from 31 percent of households in the poorest quintile to
Source: INEI, 2005.
100
80
60
40
20
0
1 (Poorest)
Per
cent
age
of H
ouse
hold
s
2 3
Expenditure Quintile
Dry Cell Battery
Grid Electricity
LPG
Car Battery
Solar PV, Genset
4 5 (Richest)
Figure 2.3 Figure 2.3
Households Using Modern Energy by Expenditure Quintile
7Comparing Table 1.2 and Figure 2.2, it can be seen that Quintiles 1 and 2 correspond to households living in extreme poverty in all regions; Quintile 3 in all regions and Quintile 4 in Coastal North and Amazon regions correspond to households living in poverty; and the remainder correspond to households that are not living in poverty, i.e. Quintile 5 in all regions and Quintile 4 in all regions except Coastal North and Amazon.
7134-CH02.pdf 12 8/25/10 10:14 AM
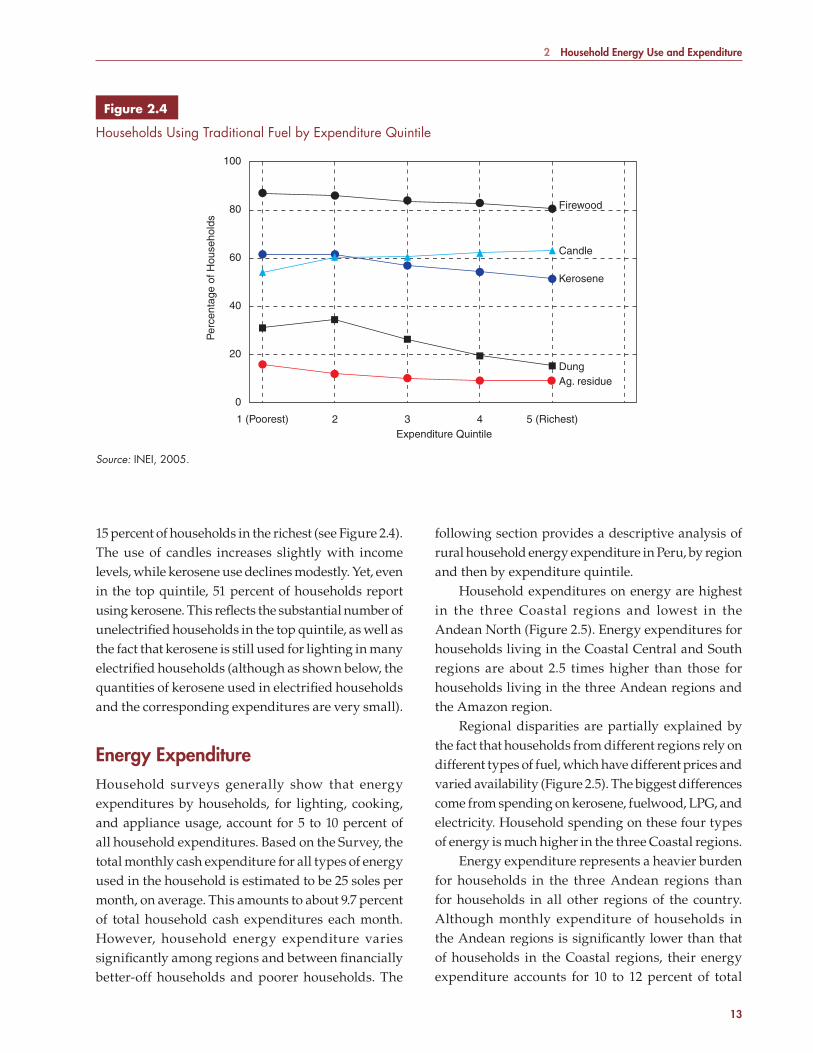
2 Household Energy Use and Expenditure
13
15 percent of households in the richest (see Figure 2.4). The use of candles increases slightly with income levels, while kerosene use declines modestly. Yet, even in the top quintile, 51 percent of households report using kerosene. This refl ects the substantial number of unelectrifi ed households in the top quintile, as well as the fact that kerosene is still used for lighting in many electrifi ed households (although as shown below, the quantities of kerosene used in electrifi ed households and the corresponding expenditures are very small).
Energy Expenditure Household surveys generally show that energy expenditures by households, for lighting, cooking, and appliance usage, account for 5 to 10 percent of all household expenditures. Based on the Survey, the total monthly cash expenditure for all types of energy used in the household is estimated to be 25 soles per month, on average. This amounts to about 9.7 percent of total household cash expenditures each month. However, household energy expenditure varies signifi cantly among regions and between fi nancially better-off households and poorer households. The
following section provides a descriptive analysis of rural household energy expenditure in Peru, by region and then by expenditure quintile.
Household expenditures on energy are highest in the three Coastal regions and lowest in the Andean North (Figure 2.5). Energy expenditures for households living in the Coastal Central and South regions are about 2.5 times higher than those for households living in the three Andean regions and the Amazon region.
Regional disparities are partially explained by the fact that households from different regions rely on different types of fuel, which have different prices and varied availability (Figure 2.5). The biggest differences come from spending on kerosene, fuelwood, LPG, and electricity. Household spending on these four types of energy is much higher in the three Coastal regions.
Energy expenditure represents a heavier burden for households in the three Andean regions than for households in all other regions of the country. Although monthly expenditure of households in the Andean regions is signifi cantly lower than that of households in the Coastal regions, their energy expenditure accounts for 10 to 12 percent of total
Source: INEI, 2005.
100
80
60
40
20
0
1 (Poorest)
Per
cent
age
of H
ouse
hold
s
2 3Expenditure Quintile
Firewood
Candle
Kerosene
DungAg. residue
4 5 (Richest)
Figure 2.4 Figure 2.4
Households Using Traditional Fuel by Expenditure Quintile
7134-CH02.pdf 13 8/25/10 10:14 AM
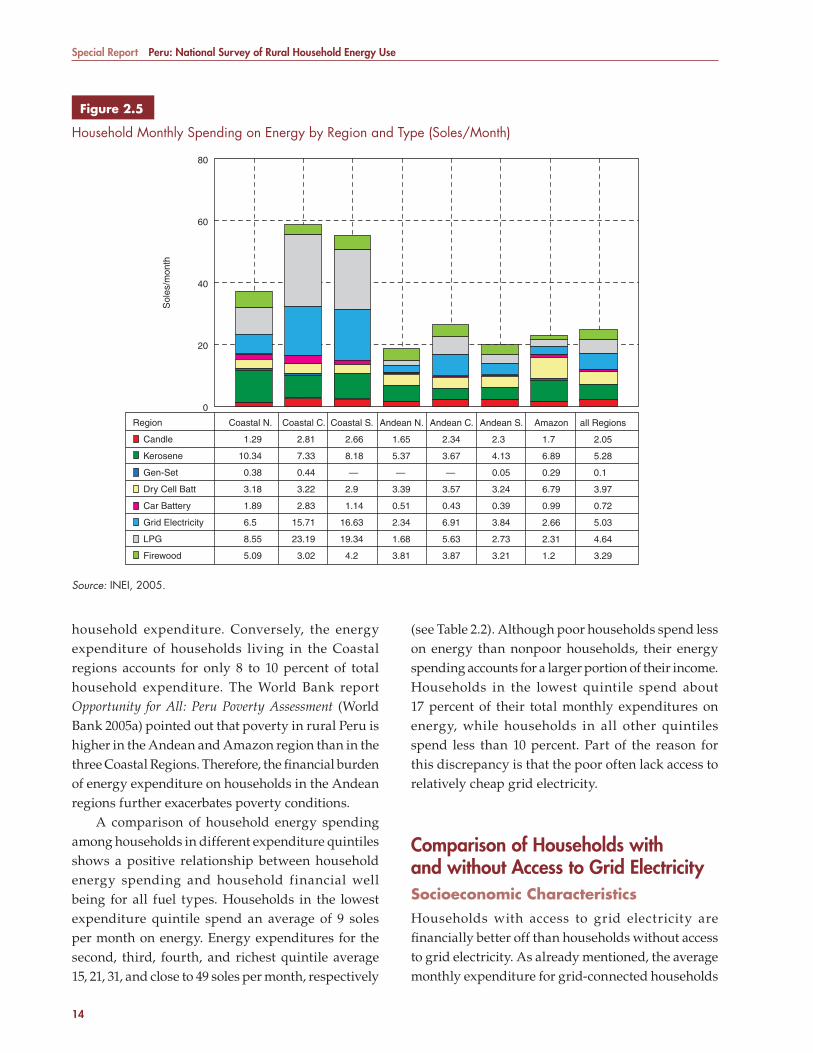
Special Report Peru: National Survey of Rural Household Energy Use
14
household expenditure. Conversely, the energy expenditure of households living in the Coastal regions accounts for only 8 to 10 percent of total household expenditure. The World Bank report Opportunity for All: Peru Poverty Assessment (World Bank 2005a) pointed out that poverty in rural Peru is higher in the Andean and Amazon region than in the three Coastal Regions. Therefore, the fi nancial burden of energy expenditure on households in the Andean regions further exacerbates poverty conditions.
A comparison of household energy spending among households in different expenditure quintiles shows a positive relationship between household energy spending and household financial well being for all fuel types. Households in the lowest expenditure quintile spend an average of 9 soles per month on energy. Energy expenditures for the second, third, fourth, and richest quintile average 15, 21, 31, and close to 49 soles per month, respectively
(see Table 2.2). Although poor households spend less on energy than nonpoor households, their energy spending accounts for a larger portion of their income. Households in the lowest quintile spend about 17 percent of their total monthly expenditures on energy, while households in all other quintiles spend less than 10 percent. Part of the reason for this discrepancy is that the poor often lack access to relatively cheap grid electricity.
Compariso n of Households with and without Access to Grid ElectricitySocioeconomic CharacteristicsHouseholds with access to grid electricity are fi nancially better off than households without access to grid electricity. As already mentioned, the average monthly expenditure for grid-connected households
Source: INEI, 2005.
80
60
Region
Sol
es/m
onth
Candle
Kerosene
Gen-Set
Dry Cell Batt
Car Battery
Grid Electricity
LPG
Firewood
1.29
10.34
0.38
3.18
1.89
6.5
8.55
5.09
Coastal N.
2.81
7.33
0.44
3.22
2.83
15.71
23.19
3.02
Coastal C.
2.66
8.18
—
2.9
1.14
16.63
19.34
4.2
Coastal S.
1.65
5.37
—
3.39
0.51
2.34
1.68
3.81
Andean N.
2.34
3.67
—
3.57
0.43
6.91
5.63
3.87
Andean C.
2.3
4.13
0.05
3.24
0.39
3.84
2.73
3.21
Andean S.
1.7
6.89
0.29
6.79
0.99
2.66
2.31
1.2
Amazon
2.05
5.28
0.1
3.97
0.72
5.03
4.64
3.29
all Regions
40
20
0
Figure 2.5 Figure 2.5
Household Monthly Spending on Energy by Region and Type (Soles/Month)
7134-CH02.pdf 14 8/25/10 10:14 AM

2 Household Energy Use and Expenditure
15
is 430 soles versus 317 soles for households without a grid connection. Another disparity between households with and without access to grid electricity is the educational level of the head of household. Thirty-nine percent of grid-connected households are headed by someone with at least a secondary education, compared with only 21 percent of unelectrifi ed households (Table 2.3).
There are no differences in household size, number of children at home, education of children,
or ethnic minority between households with and without access to grid electricity. Almost all children between ages 6 and 18 are attending school, regardless of their household’s electrifi cation status. However, studies have shown that electricity enhances children’s education. For example, electricity allows children to study and/or do homework at night, allows schools to use modern educational equipment, and enables children to gain access to computers and the Internet. These benefi ts are further discussed in
Table 2.2Table 2.2
Total Household Monthly Cash Spending on Energy by Expenditure Quintiles (Users Only)
1 (Poorest) 2 3 4 5 (Richest) All
< 113 Soles 113–201 Soles 201–321 Soles 321–533 Soles > 533 Soles
Grid Electricity 7.4 8.5 10.4 14.2 22.5 13.6
Candle 2.7 23.0 3.6 3.6 4.1 3.4
Kerosene 4.9 6.6 8.8 11.7 16.2 9.3
Small generators – – 13.0 29.0 38.1 33.2
Dry cell battery 3.4 4.5 5.3 6.0 7.3 5.4
Car battery 5.2 5.1 5.8 6.7 7.4 6.5
LPG 20.4 20.6 26.2 30.1 37.1 32.6
Fuelwood 13.6 17.9 22.9 27.7 36.0 26.6
All energy spending 9.4 15.3 20.6 31.1 49.1 25.1
% of total spending 17.1% 9.9% 8.2% 7.4% 5.8% 9.7%
Source: INEI, 2005.
Table 2.3Table 2.3
Total Household Expenditure and Education by Electrifi cation StatusGrid Electricity
All AreasWith Access Without Access
No schooling 10% 16% 14%
Primary education 51% 63% 58%
Secondary education 30% 18% 23%
Above secondary education 9% 3% 5%
Population 839,581 1,326,075 2,165,656
Total Household Exp. (Soles/Month) 430 317 361
Population 851,510 1,352,705 2,204,215
Total Users (Electricity & Electricity Substitutes) 845,522 1,340,491 2,186,013
Source: INEI, 2005.
7134-CH02.pdf 15 8/25/10 10:14 AM
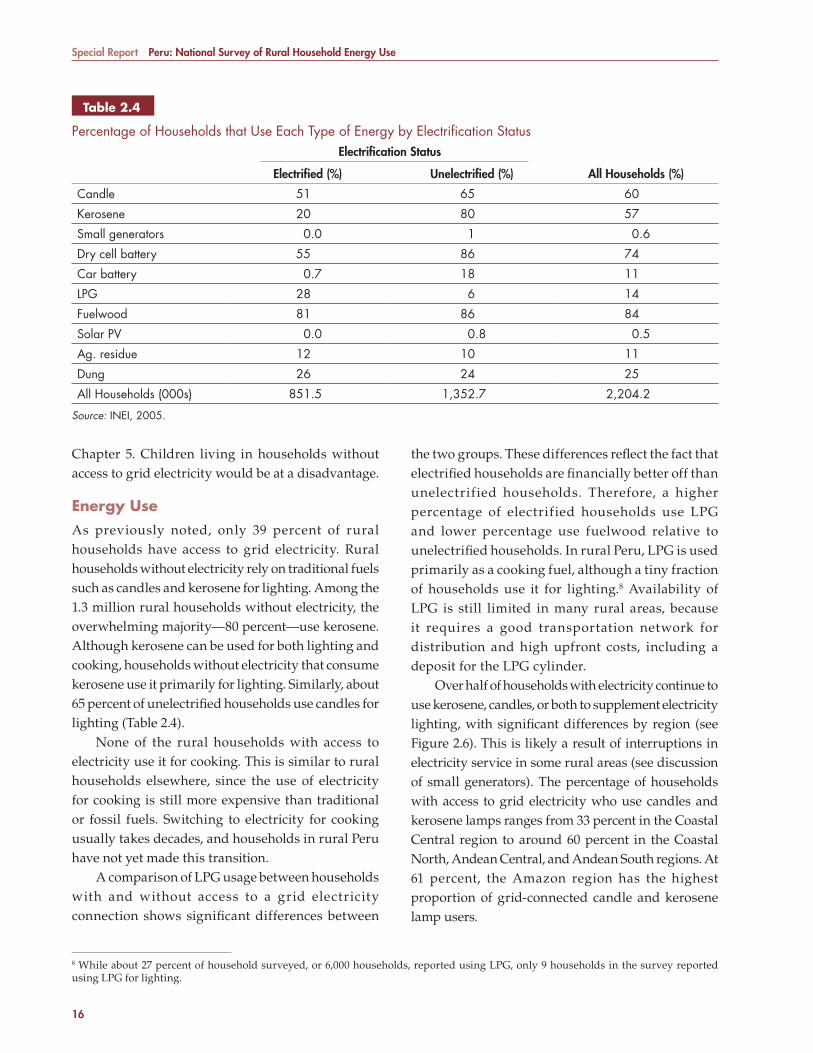
Special Report Peru: National Survey of Rural Household Energy Use
16
Chapter 5. Children living in households without access to grid electricity would be at a disadvantage.
Energy UseAs previously noted, only 39 percent of rural households have access to grid electricity. Rural households without electricity rely on traditional fuels such as candles and kerosene for lighting. Among the 1.3 million rural households without electricity, the overwhelming majority—80 percent—use kerosene. Although kerosene can be used for both lighting and cooking, households without electricity that consume kerosene use it primarily for lighting. Similarly, about 65 percent of unelectrifi ed households use candles for lighting (Table 2.4).
None of the rural households with access to electricity use it for cooking. This is similar to rural households elsewhere, since the use of electricity for cooking is still more expensive than traditional or fossil fuels. Switching to electricity for cooking usually takes decades, and households in rural Peru have not yet made this transition.
A comparison of LPG usage between households with and without access to a grid electricity connection shows signifi cant differences between
the two groups. These differences refl ect the fact that electrifi ed households are fi nancially better off than unelectrified households. Therefore, a higher percentage of electrified households use LPG and lower percentage use fuelwood relative to unelectrifi ed households. In rural Peru, LPG is used primarily as a cooking fuel, although a tiny fraction of households use it for lighting.8 Availability of LPG is still limited in many rural areas, because it requires a good transportation network for distribution and high upfront costs, including a deposit for the LPG cylinder.
Over half of households with electricity continue to use kerosene, candles, or both to supplement electricity lighting, with signifi cant differences by region (see Figure 2.6). This is likely a result of interruptions in electricity service in some rural areas (see discussion of small generators). The percentage of households with access to grid electricity who use candles and kerosene lamps ranges from 33 percent in the Coastal Central region to around 60 percent in the Coastal North, Andean Central, and Andean South regions. At 61 percent, the Amazon region has the highest proportion of grid-connected candle and kerosene lamp users.
8 While about 27 percent of household surveyed, or 6,000 households, reported using LPG, only 9 households in the survey reported using LPG for lighting.
Table 2.4Table 2.4
P ercentage of Households that Use Each Type of Energy by Electrifi cation StatusElectrifi cation Status
All Households (%)Electrifi ed (%) Unelectrifi ed (%)
Candle 51 65 60
Kerosene 20 80 57
Small generators 0.0 1 0.6
Dry cell battery 55 86 74
Car battery 0.7 18 11
LPG 28 6 14
Fuelwood 81 86 84
Solar PV 0.0 0.8 0.5
Ag. residue 12 10 11
Dung 26 24 25
All Households (000s) 851.5 1,352.7 2,204.2
Source: INEI, 2005.
7134-CH02.pdf 16 8/25/10 10:14 AM
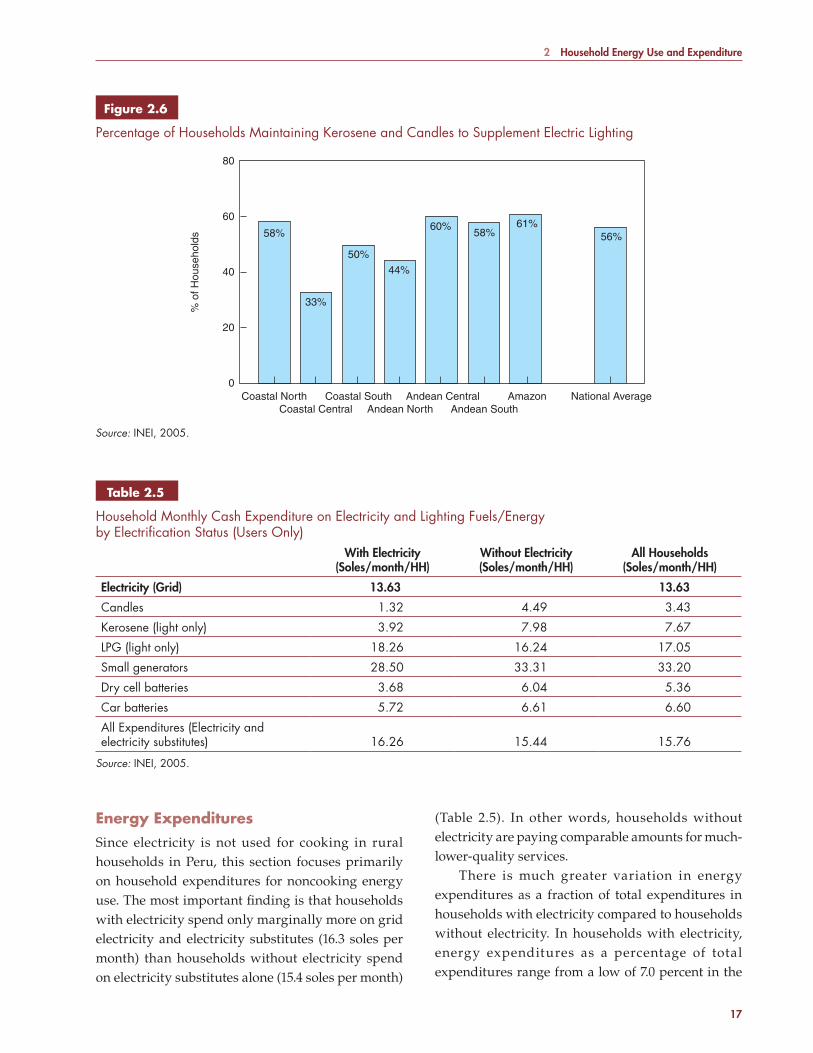
2 Household Energy Use and Expenditure
17
Energy ExpendituresSince electricity is not used for cooking in rural households in Peru, this section focuses primarily on household expenditures for noncooking energy use. The most important fi nding is that households with electricity spend only marginally more on grid electricity and electricity substitutes (16.3 soles per month) than households without electricity spend on electricity substitutes alone (15.4 soles per month)
(Table 2.5). In other words, households without electricity are paying comparable amounts for much-lower-quality services.
There is much greater variation in energy expenditures as a fraction of total expenditures in households with electricity compared to households without electricity. In households with electricity, energy expenditures as a percentage of total expenditures range from a low of 7.0 percent in the
Source: INEI, 2005.
80
60
40
20
0Coastal North
% o
f Hou
seho
lds 58%
33%
50%
44%
60% 61%58% 56%
Coastal Central Andean North Andean SouthCoastal South Andean Central Amazon National Average
Figure 2.6 Figure 2.6
P ercentage of Households Maintaining Kerosene and Candles to Supplement Electric Lighting
Table 2.5Table 2.5
Hou sehold Monthly Cash Expenditure on Electricity and Lighting Fuels/Energy by Electrifi cation Status (Users Only)
With Electricity(Soles/month/HH)
Without Electricity(Soles/month/HH)
All Households(Soles/month/HH)
Electricity (Grid) 13.63 13.63
Candles 1.32 4.49 3.43
Kerosene (light only) 3.92 7.98 7.67
LPG (light only) 18.26 16.24 17.05
Small generators 28.50 33.31 33.20
Dry cell batteries 3.68 6.04 5.36
Car batteries 5.72 6.61 6.60
All Expenditures (Electricity and electricity substitutes) 16.26 15.44 15.76
Source: INEI, 2005.
7134-CH02.pdf 17 8/25/10 10:14 AM
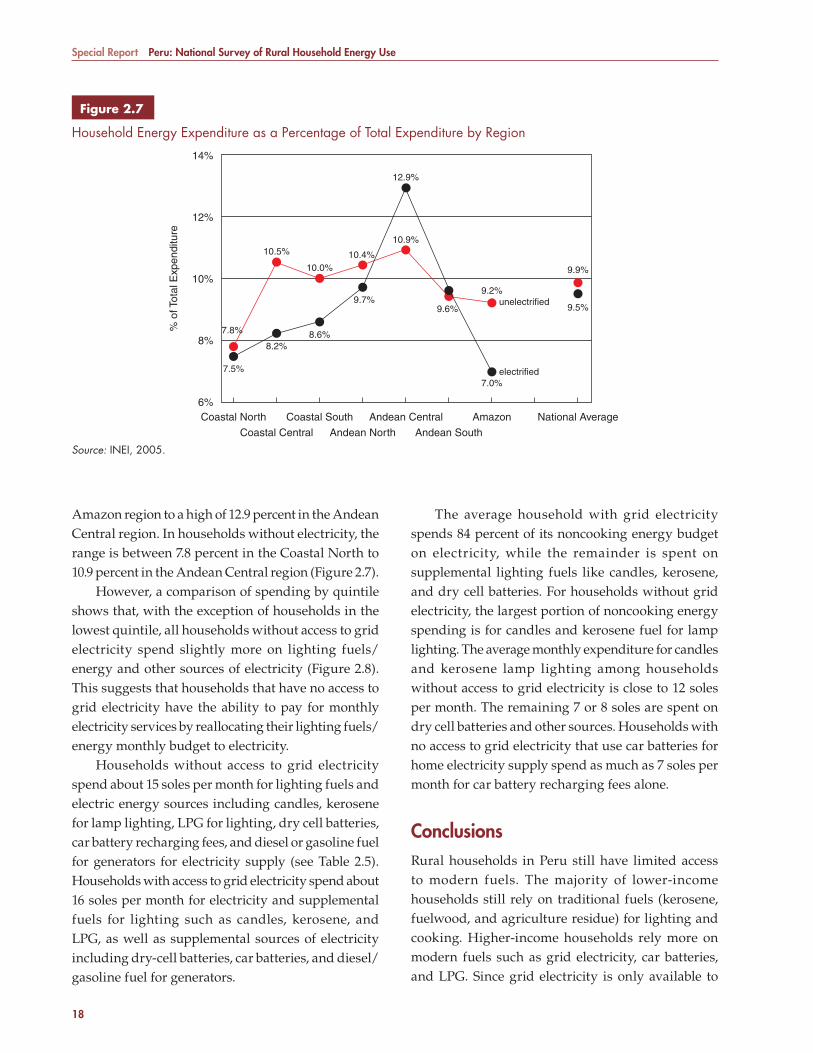
Special Report Peru: National Survey of Rural Household Energy Use
18
Amazon region to a high of 12.9 percent in the Andean Central region. In households without electricity, the range is between 7.8 percent in the Coastal North to 10.9 percent in the Andean Central region (Figure 2.7).
However, a comparison of spending by quintile shows that, with the exception of households in the lowest quintile, all households without access to grid electricity spend slightly more on lighting fuels/energy and other sources of electricity (Figure 2.8). This suggests that households that have no access to grid electricity have the ability to pay for monthly electricity services by reallocating their lighting fuels/energy monthly budget to electricity.
Households without access to grid electricity spend about 15 soles per month for lighting fuels and electric energy sources including candles, kerosene for lamp lighting, LPG for lighting, dry cell batteries, car battery recharging fees, and diesel or gasoline fuel for generators for electricity supply (see Table 2.5). Households with access to grid electricity spend about 16 soles per month for electricity and supplemental fuels for lighting such as candles, kerosene, and LPG, as well as supplemental sources of electricity including dry-cell batteries, car batteries, and diesel/gasoline fuel for generators.
The average household with grid electricity spends 84 percent of its noncooking energy budget on electricity, while the remainder is spent on supplemental lighting fuels like candles, kerosene, and dry cell batteries. For households without grid electricity, the largest portion of noncooking energy spending is for candles and kerosene fuel for lamp lighting. The average monthly expenditure for candles and kerosene lamp lighting among households without access to grid electricity is close to 12 soles per month. The remaining 7 or 8 soles are spent on dry cell batteries and other sources. Households with no access to grid electricity that use car batteries for home electricity supply spend as much as 7 soles per month for car battery recharging fees alone.
ConclusionsRural households in Peru still have limited access to modern fuels. The majority of lower-income households still rely on traditional fuels (kerosene, fuelwood, and agriculture residue) for lighting and cooking. Higher-income households rely more on modern fuels such as grid electricity, car batteries, and LPG. Since grid electricity is only available to
Source: INEI, 2005.
14%
12%
10%
10.5%
8%
6%Coastal North
Coastal Central Andean North Andean South
Coastal South
% o
f Tot
al E
xpen
ditu
re
Andean Central Amazon National Average
7.8%
7.5%
8.2%8.6%
10.0%
9.7%9.6%
9.2%
7.0%
9.5%
9.9%
unelectrified
electrified
10.9%
12.9%
10.4%
Figure 2.7 Figure 2.7
Ho usehold Energy Expenditure as a Percentage of Total Expenditure by Region
7134-CH02.pdf 18 8/25/10 10:14 AM
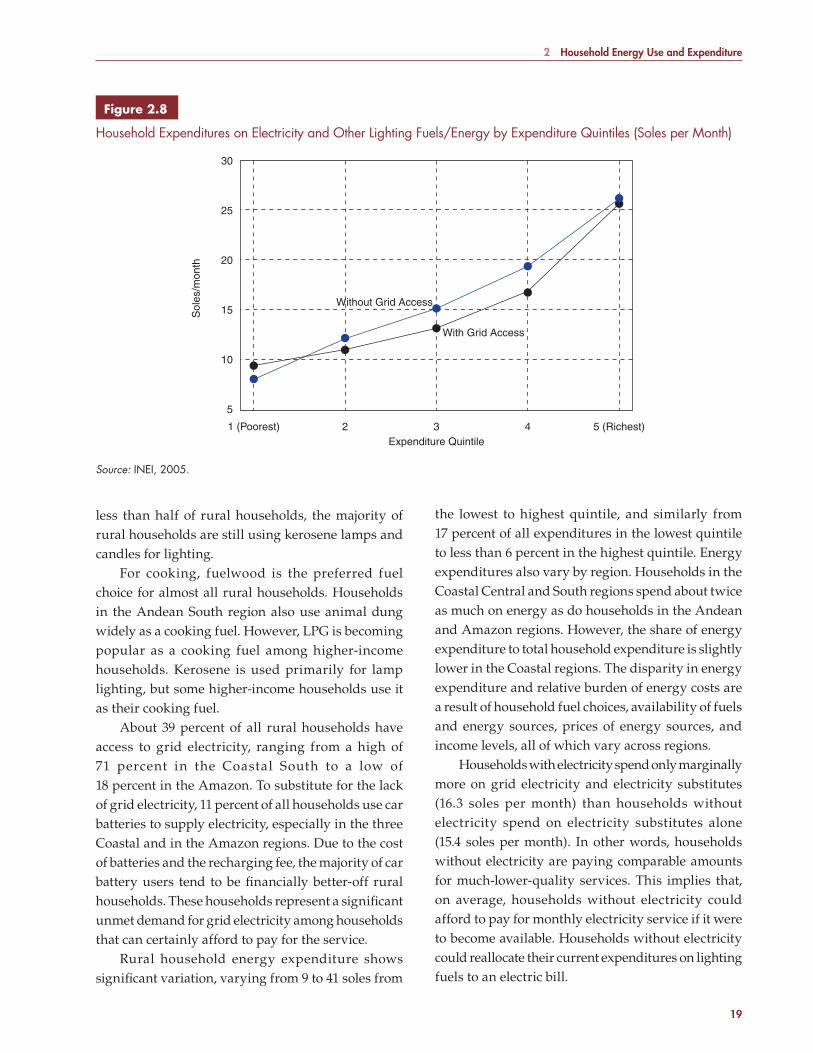
2 Household Energy Use and Expenditure
19
Source: INEI, 2005.
30
20
25
15
10
5
1 (Poorest)
Without Grid Access
With Grid Access
Sol
es/m
onth
2 3Expenditure Quintile
4 5 (Richest)
Figure 2.8 Figure 2.8
Household Expenditures on Electricity and Other Lighting Fuels/Energy by Expenditure Quintiles (Soles per Month)
less than half of rural households, the majority of rural households are still using kerosene lamps and candles for lighting.
For cooking, fuelwood is the preferred fuel choice for almost all rural households. Households in the Andean South region also use animal dung widely as a cooking fuel. However, LPG is becoming popular as a cooking fuel among higher-income households. Kerosene is used primarily for lamp lighting, but some higher-income households use it as their cooking fuel.
About 39 percent of all rural households have access to grid electricity, ranging from a high of 71 percent in the Coastal South to a low of 18 percent in the Amazon. To substitute for the lack of grid electricity, 11 percent of all households use car batteries to supply electricity, especially in the three Coastal and in the Amazon regions. Due to the cost of batteries and the recharging fee, the majority of car battery users tend to be fi nancially better-off rural households. These households represent a signifi cant unmet demand for grid electricity among households that can certainly afford to pay for the service.
Rural household energy expenditure shows signifi cant variation, varying from 9 to 41 soles from
the lowest to highest quintile, and similarly from 17 percent of all expenditures in the lowest quintile to less than 6 percent in the highest quintile. Energy expenditures also vary by region. Households in the Coastal Central and South regions spend about twice as much on energy as do households in the Andean and Amazon regions. However, the share of energy expenditure to total household expenditure is slightly lower in the Coastal regions. The disparity in energy expenditure and relative burden of energy costs are a result of household fuel choices, availability of fuels and energy sources, prices of energy sources, and income levels, all of which vary across regions.
Households with electricity spend only marginally more on grid electricity and electricity substitutes (16.3 soles per month) than households without electricity spend on electricity substitutes alone (15.4 soles per month). In other words, households without electricity are paying comparable amounts for much-lower-quality services. This implies that, on average, households without electricity could afford to pay for monthly electricity service if it were to become available. Households without electricity could reallocate their current expenditures on lighting fuels to an electric bill.
7134-CH02.pdf 19 8/25/10 10:14 AM

7134-CH02.pdf 20 8/25/10 10:14 AM
21
3 Electricity from the Grid
As noted in the Introduction, access to electricity services brings important benefits to rural areas. Lighting with electricity improves the quality of life, extends the time available for productive or leisure activity, and increases the time available for study and learning by students (Barnes 2002). Electricity improves health in homes by reducing indoor pollution associated with lighting from kerosene and lowering the number of burn injuries, especially among children, from fi res caused by kerosene lamps and candles. It also improves health in rural communities through the improved effi cacy of refrigerated vaccines and the lighting of rural health clinics. Home and community security is enhanced by illumination and the provision of public lighting. Finally, electricity also empowers the rural poor by increasing access to information and communication technologies (ICT). Electricity infrastructure is vital for development, alleviation of poverty, and improvement in the living conditions of rural populations.
Typically, electricity service from the grid is fi rst extended to fi nancially better-off households living in more densely populated rural areas that can afford to connect to the grid and pay for electricity. However, as rural electrifi cation expansion progresses and grid electricity is extended further and further, poorer households eventually gain access to grid electricity. In Peru, grid electricity service has been provided to only 39 percent of rural households, partly because of the diffi cult geography and topography of the country.
This chapter provides detailed characteristics of electrifi ed rural households. It also provides an assessment on how rural households utilize and benefi t from electricity.
Access to Grid ElectricityElectrifi cation varies signifi cantly across regions. As shown in Figure 3.1, the Andean North and Amazon regions have the lowest rural electrifi cation rates (22 and 18 percent, respectively). The next lowest rate is the Coastal North at 35 percent. In contrast, the more densely populated and more easily accessible Coastal Central and South regions have achieved the highest rural electrifi cation rates, at 60 and 71 percent, respectively.
There is a direct positive relationship between a household’s fi nancial well being and access to grid electricity. The vast majority of the poor—measured in terms of total household expenditure—do not have access to grid electricity, while the vast majority of fi nancially better-off households do have access. Access to electricity is strongly correlated with expenditure quintile: only 28 percent of households in the poorest quintile have access to electricity, compared with 49 percent in the top quintile (Figure 3.2). Poverty—measured in terms of low expenditure, low income, and low access to basic services—is a way of life for the majority of rural Peruvians. The lack of access to basic infrastructure services, including electricity, not only exacerbates poverty conditions, but also hampers efforts to alleviate poverty.
7134-CH03.pdf 21 7/27/10 6:55 AM

Special Report Peru: National Survey of Rural Household Energy Use
22
Service ReliabilityTwo ways of looking at reliability of electricity service are the number of months of service per year and the number of hours of service per day. The fi rst relates to seasonal availability. As shown in Figure 3.3, more
than 91.6 percent of households report year-round availability, and a further 3.7 percent report 11 months of service. Around 12,000 households (1.6 percent) experience only one or two months of service per year. Although the question of generation type was not specifi cally asked in the Survey, it is reasonable to
Source: INEI, 2005.
80%
60%
40%
20%
% o
f Hou
seho
lds
Coastal North
35%
60%
71%
22%
52%
44%
18%
39%
Coastal Central Andean North Andean South
Coastal South Andean Central Amazon National Average
0%
Figure 3.1Figure 3.1
Percentage of Households with Access to Grid Electricity by Region
Source: INEI, 2005.
55%
40%
45%
50%
35%
30%
25%
1 (Poorest)
Per
cent
age
of H
ouse
hold
s
2 3Expenditure Quintile
4 5 (Richest)
Figure 3.2Figure 3.2
Percentage of Households with Access to Electricity by Expenditure Quintile
7134-CH03.pdf 22 7/27/10 6:55 AM

3 Electricity from the Grid
23
assume that households with service just a few months per year are served by small hydro systems. In terms of hourly service reliability, 93.3 of households reported 24-hour service, and another 2.7 percent reported 12-hour service (Figure 3.4). However, only 80 percent of households reported 24-hour service throughout the year (i.e., 24-hour service in every month)
Overall Electricity Use and ExpenditureIn Peru, the interaction of regional factors, income, and price play an important role in determining household
electricity usage.9 Electricity usage among rural households in Peru is relatively low, at an average of 27 kWh per month, compared to other rural households in countries such as Thailand, the Philippines, and Lao PDR. This may be due to several factors, including a high electricity tariff, unavailability of inexpensive electric appliances, and high prevalence of poverty in rural areas.
Electricity usage among rural households varies significantly among regions. As expected, rural households living in the Coastal Regions use signifi cantly more electricity than households living in the Andean and Amazon Regions. Within the three major regions there are further disparities. For instance, electricity usage in the Coastal Central and South Regions is between 54 and 61 percent greater than in the Coastal North region (Table 3.1).
Households with a grid electricity connection spend on average 14 soles per month on electricity. As with the amount of electricity usage, the amount of money spent on electricity varies signifi cantly across regions and expenditure quintiles, refl ecting different usage levels as well as prices (Table 3.1 and Table 3.2).
Electricity Tariff by Usage LevelAside from income and regional disparities that have a direct impact on variation of electricity consumption, electricity tariff structure, and ownership of electric appliances also play important roles in determining the level of consumption. As expected, the average effective electricity price per kWh each household has to pay depends on the level of usage. Larger electricity users that live in the Coastal Central and South regions pay an average of only 0.49 and 0.47 soles per kWh, respectively. By contrast, smaller users, who tend to be poorer customers who live in the Andean regions, pay about 0.60 to 0.80 soles per kWh. The variation of average effective electricity price per kWh is due directly to the tariff structure, which includes a fi xed charge, maintenance charge, and public lighting
9 Of the 3,098 households sampled that reported access to grid electricity, only 977 reported their quantity of electricity used. About half of electrifi ed households in the sample reported only average monthly expenditure, making it possible to calculate usage when average tariff data are known. For the remainder of electrifi ed households in the sample (637 households), neither quantity nor expenditure data are known. Of those 637 households, 274 are served by municipal utilities not regulated by OSINERG, meaning that tariff schedule information is not available.
Source: INEI, 2005.
Figure 3.3Figure 3.3
Months of Service per Year
0
200
400
600
800
1000
0.8% 0.8% 0.7% 0.8% 0.6% 3.7%
91.6%
Months of Service0 1 2 3 4 5 6 7 8 9 10 11 12
Numb
er of
Hou
seho
lds (1
000s
)
Figure 3.4Figure 3.4
Hours of Service per Day
0
200
400
600
800
1000
2.7% 1.0%
93.2%
Hours of Service per Day0 2 4 6 8 10 12 14 16 18 20 22 24
Numb
er of
Hou
seho
lds (1
000s
)
Source: INEI, 2005.
7134-CH03.pdf 23 7/27/10 6:55 AM

Special Report Peru: National Survey of Rural Household Energy Use
24
fee that apply to all customers. Although a large number of distribution companies charge a public lighting fee for smaller users (those who consume less than 30 kWh per month), that is lower than for larger users, the overall fi xed charges still play a signifi cant role in the retail price of electricity. As a result of fi xed charges, the average effective electricity for households that use small amounts of electricity each month is relatively high, even though the overall fi xed charges for consumers using less than 30 kWh per month is lower than those using more than 30 kWh per month.
Currently, about 70 percent of households with grid electricity connection use less than 30 kWh per month. These households’ average effective electricity price is 0.76 soles per kWh. However, the average effective price per kWh for households that use more than 30 kWh per month is only 0.46 soles per kWh.
The impact of fi xed charges among households that consume small amounts of electricity per month
is very large. However, the effect of fi xed charges on average effective electricity price becomes smaller and smaller as monthly electricity usage becomes larger. Given the level of monthly electricity usage among rural households in Peru, the impact of fi xed charges on average effective electricity price is quite high. For example, the average effective price for a household that uses less than 10 kWh per month is about one sol (1.03 soles) per kWh. However, the impact of fi xed charges on average effective price is minimized as consumption reaches 50 kWh per month.
Electricity Usage for LightingThe proportion of total electricity used for lighting is strongly dependent on expenditure quintile (Figure 3.5). The bottom quintile uses 39 percent of total electricity consumption for lighting, while the top quintile uses only 21 percent. The explanation is simple: As income (expenditure) increases, the ability
Table 3.2Table 3.2
Household Electricity Consumption, Expenditure, and Average Effective Price per kWh by Expenditure Quintiles
1 (Poorest) 2 3 4 5 (Richest) All
KWh used per month 11.7 14.64 19.96 28.66 48.51 27.19
Spending per month (soles) 7.36 8.54 10.38 14.2 22.52 13.63
Effective price per KWh (soles) 0.83 0.76 0.69 0.62 0.55 0.67
Source: INEI, 2005.
Table 3.1Table 3.1
Household Electricity Consumption, Expenditure, and Average Effective Price per KWh by Region
Coastal Regions Andean Regions
Amazon All RegionsNorth Central South North Central South
kWh used/month 38.3 61.7 59.1 21.7 26.9 16.7 31.6 27.2
Soles/month on electricity 19.8 27.0 24.7 10.9 13.4 9.4 16.0 13.6
Avg. price/kWh (soles) 0.57 0.49 0.47 0.60 0.62 0.83 0.71 0.67
% kWh used for lighting 28.0 24.0 24.2 43.7 41.1 54.6 38.5 42.9
kWh for lighting per month 7.0 10.4 9.3 6.4 7.7 5.8 6.9 7.1
Source: INEI, 2005.
7134-CH03.pdf 24 7/27/10 6:55 AM
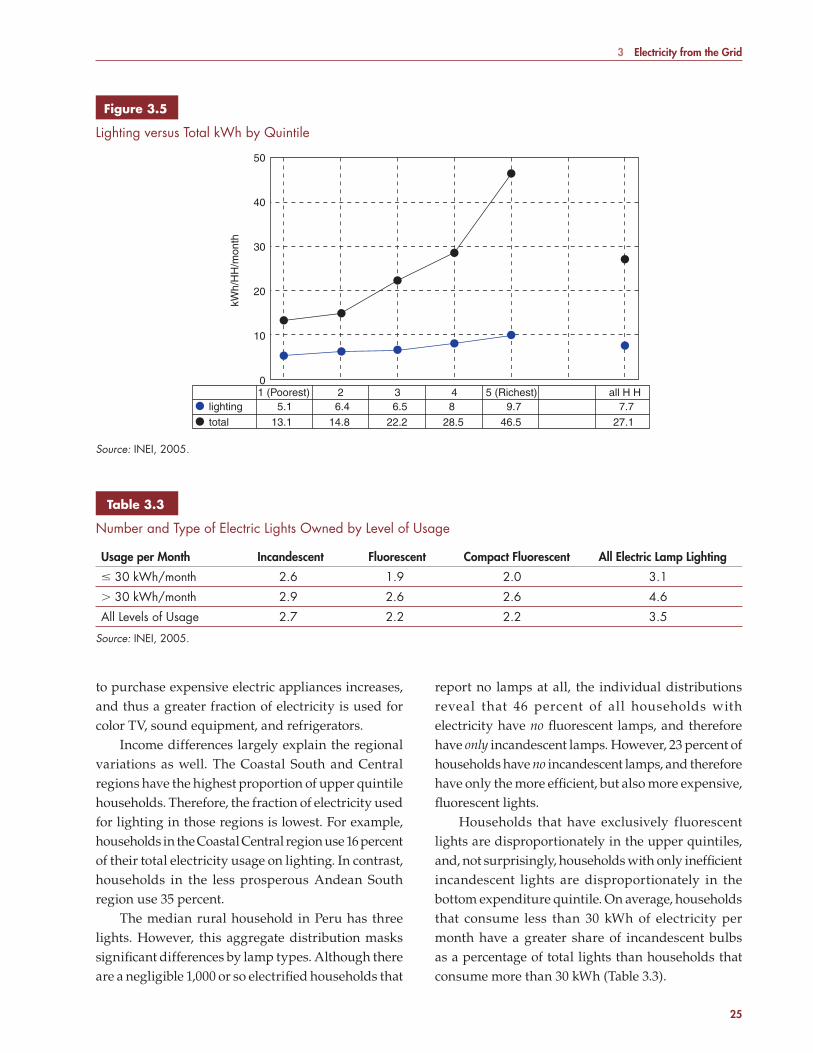
3 Electricity from the Grid
25
to purchase expensive electric appliances increases, and thus a greater fraction of electricity is used for color TV, sound equipment, and refrigerators.
Income differences largely explain the regional variations as well. The Coastal South and Central regions have the highest proportion of upper quintile households. Therefore, the fraction of electricity used for lighting in those regions is lowest. For example, households in the Coastal Central region use 16 percent of their total electricity usage on lighting. In contrast, households in the less prosperous Andean South region use 35 percent.
The median rural household in Peru has three lights. However, this aggregate distribution masks signifi cant differences by lamp types. Although there are a negligible 1,000 or so electrifi ed households that
report no lamps at all, the individual distributions reveal that 46 percent of all households with electricity have no fl uorescent lamps, and therefore have only incandescent lamps. H owever, 23 percent of households have no incandescent lamps, and therefore have only the more effi cient, but also more expensive, fl uorescent lights.
Households that have exclusively fluorescent lights are disproportionately in the upper quintiles, and, not surprisingly, households with only ineffi cient incandescent lights are disproportionately in the bottom expenditure quintile. On average, households that consume less than 30 kWh of electricity per month have a greater share of incandescent bulbs as a percentage of total lights than households that consume more than 30 kWh (Table 3.3).
Table 3.3Table 3.3
Number and Type of Electric Lights Owned by Level of Usage
Usage per Month Incandescent Fluorescent Compact Fluorescent All Electric Lamp Lighting
� 30 kWh/month 2.6 1.9 2.0 3.1
� 30 kWh/month 2.9 2.6 2.6 4.6
All Levels of Usage 2.7 2.2 2.2 3.5
Source: INEI, 2005.
Source: INEI, 2005.
50
30
40
20
10
01 (Poorest)
kWh/
HH
/mon
th
2 3 4lighting
total
5.1
13.1
6.4
14.8
6.5
22.2
8
28.5
9.7
46.5
7.7
27.1
5 (Richest) all H H
Figure 3.5Figure 3.5
Lighting versus Total kWh by Quintile
7134-CH03.pdf 25 7/27/10 6:55 AM

Special Report Peru: National Survey of Rural Household Energy Use
26
Household AppliancesTypical electric appliances used in rural households can be classifi ed in three major categories: (1) radio, television, and other entertainment appliances; (2) refrigerators, fans, and other appliances that can be used for cooking or domestic work; and (3) electric appliances directly used for income-generating activities. The number and type of electric appliances in grid-connected rural households provide a good indication of living standards improvements made possible by electricity.
Figure 3.6 summarizes major appliance use in electrified homes. Radios are by far the most common type of appliance, with 66 percent of electrifi ed households owning one or more. Radios are followed by black-and-white televisions (37 percent of households), color televisions (33 percent), and electric irons (25 percent).
Ownership of almost all types of electrical appliances goes up as household income increases (Figure 3.7). The only exceptions are black and white televisions and radios to some degree, which show drops in ownership between the fourth and fi fth
quintiles. Black-and-white TVs are clearly replaced by color TVs. Appliance ownership variations by region are in line with regional income disparities (see Table A.2.44 in Annex 2 for the complete data).
Radio and television are two of the most important home appliances for both urban and rural households. For a large portion of rural households in Peru and the rest of the world, radio and television are the only means to gain access to news and information beyond their community. Radio and television are also a key source of entertainment in rural communities.
The Survey reveals that about 15 percent of rural households with electricity have neither plug-in radios nor plug-in television sets at home. Although plug-in radio and television are inexpensive to use, especially in comparison to radio and television powered by dry cell or automobile batteries, these households are unable to take full advantage of grid electricity. Of the households with neither plug-in radios nor TV, more than 60 percent are in the bottom two expenditure quintiles. The Survey also reveals that the vast majority—80 percent—of households without plug-in radio and/or television lives in the Andean and Amazon regions.
Source: INEI, 2005.Note: See Table A.2.43 in Annex 2 for data by region.
Percentage of Households
40%20%0%
Radio
B & W TV
Color TV
Electric Iron
Sound Equipment
Refrigerator
Video/DVD
Electric Fan
Microwave Oven
Electric Motor
Electric Sewing Machine
Washing Machine
Electric Drill
Domestic Water Pump
Electric Pump Irrigation
Electric Saw
Electric Stove
60%
66%
37%33%
25%
21%
11%
11%3%
1%
1%
1%
1%
0%
0%
0%
0%
0%
80%
Figure 3.6Figure 3.6
Appliance Use in Electrifi ed Homes
7134-CH03.pdf 26 7/27/10 6:55 AM
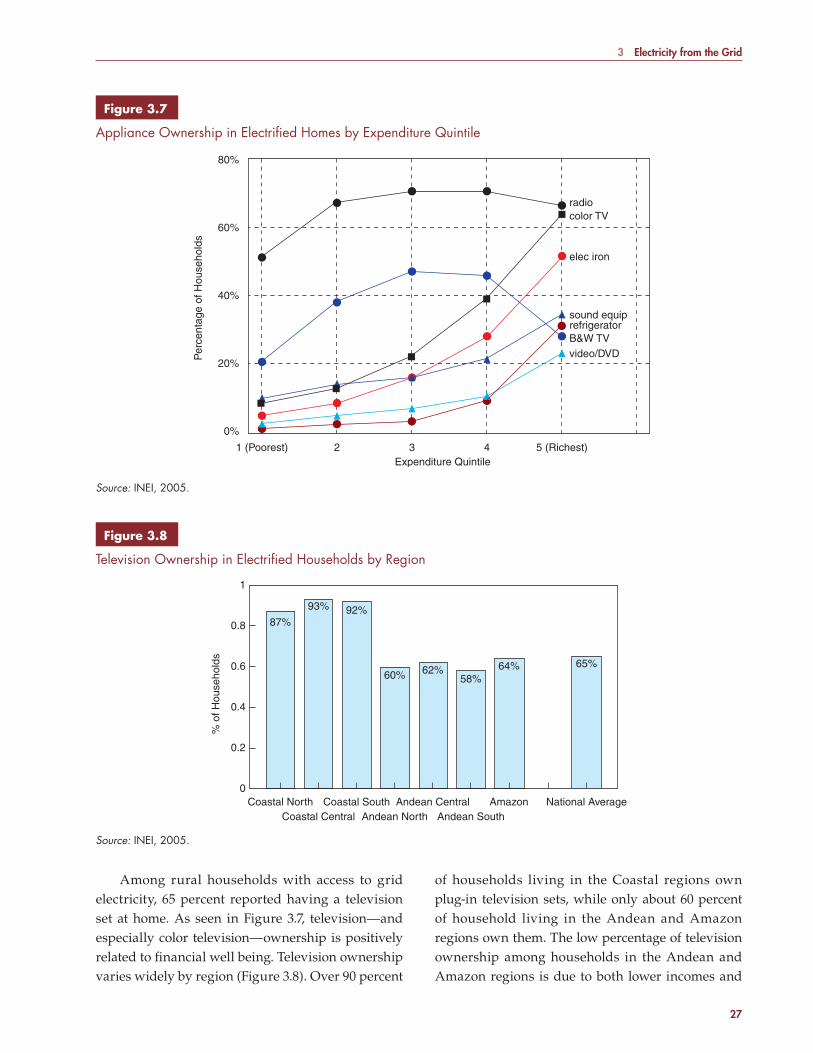
3 Electricity from the Grid
27
Among rural households with access to grid electricity, 65 percent reported having a television set at home. As seen in Figure 3.7, television—and especially color television—ownership is positively related to fi nancial well being. Television ownership varies widely by region (Figure 3.8). Over 90 percent
of households living in the Coastal regions own plug-in television sets, while only about 60 percent of household living in the Andean and Amazon regions own them. The low percentage of television ownership among households in the Andean and Amazon regions is due to both lower incomes and
Source: INEI, 2005.
80%
60%
40%
20%
0%
1 (Poorest) 2 3Expenditure Quintile
Per
cent
age
of H
ouse
hold
sradiocolor TV
elec iron
sound equiprefrigeratorB&W TVvideo/DVD
4 5 (Richest)
Figure 3.7Figure 3.7
Appliance Ownership in Electrifi ed Homes by Expenditure Quintile
Source: INEI, 2005.
1
0.8
0.6
0.4
0.2
0
87%
93% 92%
60% 62%58%
64% 65%
Coastal Central
% o
f Hou
seho
lds
Coastal SouthCoastal NorthAndean North
Andean CentralAndean South
Amazon National Average
Figure 3.8Figure 3.8
Television Ownership in Electrifi ed Households by Region
7134-CH03.pdf 27 7/27/10 6:55 AM
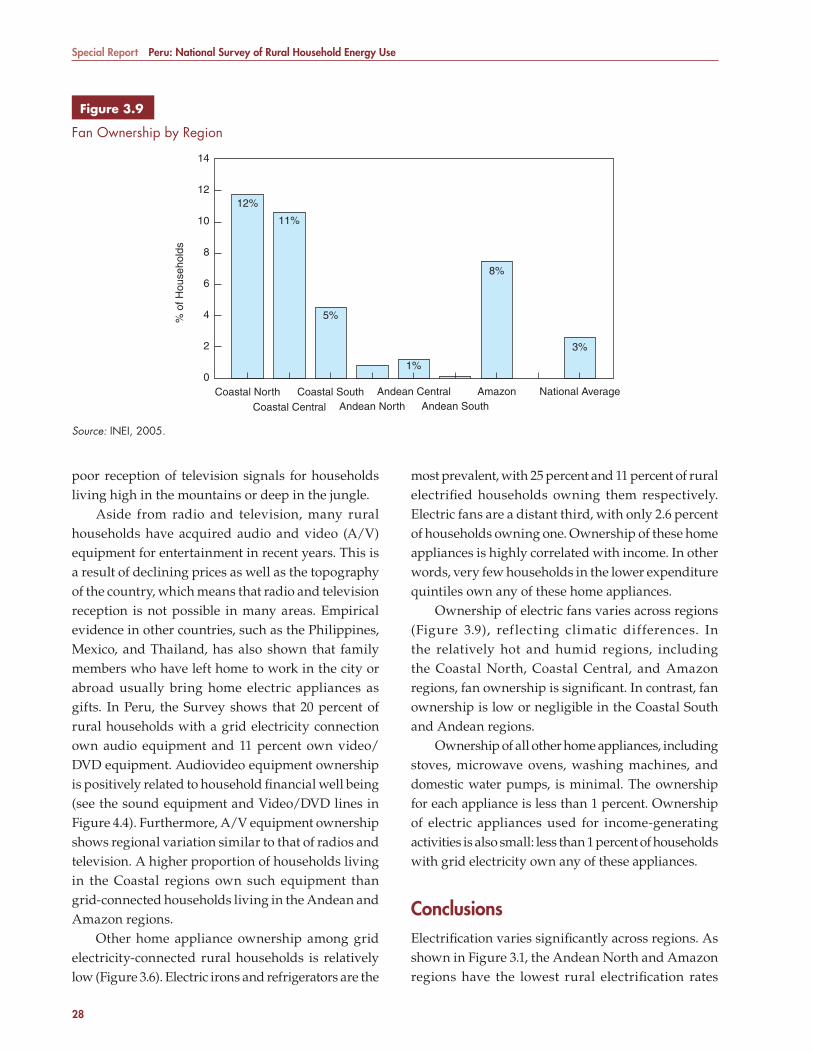
Special Report Peru: National Survey of Rural Household Energy Use
28
poor reception of television signals for households living high in the mountains or deep in the jungle.
Aside from radio and television, many rural households have acquired audio and video (A/V) equipment for entertainment in recent years. This is a result of declining prices as well as the topography of the country, which means that radio and television reception is not possible in many areas. Empirical evidence in other countries, such as the Philippines, Mexico, and Thailand, has also shown that family members who have left home to work in the city or abroad usually bring home electric appliances as gifts. In Peru, the Survey shows that 20 percent of rural households with a grid electricity connection own audio equipment and 11 percent own video/DVD equipment. Audiovideo equipment ownership is positively related to household fi nancial well being (see the sound equipment and Video/DVD lines in Figure 4.4). Furthermore, A/V equipment ownership shows regional variation similar to that of radios and television. A higher proportion of households living in the Coastal regions own such equipment than grid-connected households living in the Andean and Amazon regions.
Other home appliance ownership among grid electricity-connected rural households is relatively low (Figure 3.6). Electric irons and refrigerators are the
Source: INEI, 2005.
14
12
10
8
6
4
2
0
12%
11%
5%
1%
8%
3%
Coastal Central
% o
f Hou
seho
lds
Coastal SouthCoastal NorthAndean North
Andean CentralAndean South
Amazon National Average
Figure 3.9Figure 3.9
Fan Ownership by Region
most prevalent, with 25 percent and 11 percent of rural electrifi ed households owning them respectively. Electric fans are a distant third, with only 2.6 percent of households owning one. Ownership of these home appliances is highly correlated with income. In other words, very few households in the lower expenditure quintiles own any of these home appliances.
Ownership of electric fans varies across regions (Figure 3.9), reflecting climatic differences. In the relatively hot and humid regions, including the Coastal North, Coastal Central, and Amazon regions, fan ownership is signifi cant. In contrast, fan ownership is low or negligible in the Coastal South and Andean regions.
Ownership of all other home appliances, including stoves, microwave ovens, washing machines, and domestic water pumps, is minimal. The ownership for each appliance is less than 1 percent. Ownership of electric appliances used for income-generating activities is also small: less than 1 percent of households with grid electricity own any of these appliances.
ConclusionsElectrifi cation varies signifi cantly across regions. As shown in Figure 3.1, the Andean North and Amazon regions have the lowest rural electrifi cation rates
7134-CH03.pdf 28 7/27/10 6:55 AM

3 Electricity from the Grid
29
(22 and 18 percent respectively). The next lowest rate is the Coastal North at 35 percent. In contrast, the more densely populated and more easily accessible Coastal Central and South regions have achieved the highest rural electrifi cation rates, at 60 and 71 percent, respectively.
Access to electricity is strongly correlated with expenditure quintile: only 28 percent of households in the poorest quintile have access to electricity, compared with 49 percent in the top quintile. Poverty—measured in terms of low expenditure, low income, and low access to basic services—is a way of life for the majority of rural Peruvians. The lack of access to basic infrastructure services, including electricity, not only exacerbates poverty conditions, but also hampers efforts to alleviate poverty.
Over 91 percent of households report year-round availability, and a further 4 percent report 11 months service. Around 12,000 households (1.6 percent) experience only 1 or 2 months service per year (presumably from isolated hydro systems). In terms of hourly service reliability, 93 of households reported 24-hour service, and another 3 percent reported 12-hour service. However, only 80 percent of households reported 24-hour service throughout the year (i.e., 24 hour service in every month).
An estimated 46 percent of all households with electricity have no fl uorescent lamps, and therefore have only incandescent lamps. By contrast, 23 percent of households have no incandescent lamps, and therefore have only the more effi cient, but also more expensive, fl uorescent lights. Households that have exclusively fl uorescent lights are disproportionately in the upper quintiles; and, not surprisingly, households with only ineffi cient incandescent lights are disproportionately in the bottom expenditure quintile.
Radios are the most common appliance used, with 66 percent of all households using radios. About 65 percent of households with grid electricity service reported having a television set at home. Over
90 percent of households living in the Coastal regions own plug-in television sets, while only about 60 percent of households living in the Andean and Amazon regions own plug-in television sets. The low percentage of television ownership among households in the Andean and Amazon regions is due to both lower incomes and poor reception of television signals for households living high in the mountains or deep in the jungle. Radios and TVs are followed by electric irons (25 percent), sound equipment (20 percent), refrigerators (11 percent), and video/DVDs (11 percent). Use of other equipment is negligible.
The Survey showed that electricity consumption of rural households in Peru is relatively low at 27 kWh/month (ranging from 17 kWh is the Andean South to 61.7 kWh in the Coastal Central region). However, the price of rural electricity is high, averaging 13.6 soles per kWh (ranging from 16 soles per kWh in the Andean South to 25 soles per kWh in the Coastal Central region). There is a strong association between level of usage and household fi nancial well being as measured by total household cash expenditure. The application of electricity varies strongly with income: for example, 39 percent of kilowatt-hours consumed in the poorest expenditure quintile are for lighting, as opposed to only 21 percent in the richest quintile. Eight percent of the poorest electrifi ed households have color TVs, as opposed to 64 percent in the richest quintile.
Because of the role of fi xed charges in the pricing structure, the effective price paid by lower-level electricity users is quite high: Consumers using 15 kWh per month typically pay about 0.7 soles per kWh, as opposed to 0.5 soles per kWh when consumption is 50 kWh/month. While this does (to some extent) refl ect the actual cost of providing service to small consumers, it raises the more general question of the targeting performance of the FOSE, the main mechanism for providing cross-subsidies to poor rural consumers. This is examined in more detail in Chapter 6.
7134-CH03.pdf 29 8/25/10 10:15 AM

7134-CH03.pdf 30 7/27/10 6:55 AM

31
4 Off-Grid Electricity
People often assume that households without access to the electricity service from the grid do not use electricity. This is not the case. The electricity may cost them more and they may use less of it, but almost all households have some form of off-grid electricity use. The use of car batteries for powering televisions and lights is one common way to obtain off-grid electricity. There is also the ever-present use of small batteries for fl ashlights and radios. This is evidence of a pent-up consumer demand for electricity and an indication that people are willing to pay high prices for small amounts of it. Most common calculations for the price per kilowatt hour (kWh) of a D-cell battery show that the price is about US$50–60 per kWh, and it is even higher in remote areas of Peru. Thus, the use of electricity even in small quantities is an indication of the value that household place on having some form of electricity.
The main types of off-grid electricity used in rural Peru are car and dry cell batteries. In addition, a small number of people use generators and solar home systems. Car batteries in particular are a signifi cant energy source for areas without grid service that are near enough to the grid to enable users to charge the batteries within a short distance. An estimated 18 percent of all households that do not have grid electricity (approximately 240,000 households) use batteries as their main source of electricity. Both households with and without electricity use dry cell batteries, but the use is more prevalent in households without grid electricity. This chapter examines the alternatives for households in rural Peru that do not have access to electricity from the national or local grids.
Car Batteries Close to one-fi fth of the households in rural Peru without electricity use car batteries for televisions and lights. This is an important indication of the very high value of electricity for people in rural areas. The work and expense involved in charging car batteries is not trivial. The batteries have to be transported either to an area with grid electricity for charging or to the place of business of someone with a generator. Such batteries are heavy and have corrosive chemicals in them. This section profi les the use of car batteries followed by the cost. Car battery use by rural households is an indication of demand for electricity in areas without grid electricity, and this is a fi rst step for estimating the benefi ts of grid electrifi cation explored in a subsequent chapter.
Car batteries are quite common in rural Peru, especially in the Coastal regions where as many as one-half of households without electricity use them (Table 4.1). Incomes are comparatively high in the rural areas surrounding Lima, and car battery recharging is relatively easy due to the presence of good roads. The two other Coastal regions also have very high levels of car battery use in households without electricity—47 percent in the North and 37 percent in the South. In the Amazon, about 18 percent of households use car batteries, while in the Andean regions, usage levels among households without electricity range from 11 to 16 percent. Even some households with electricity from the grid have car batteries. We presume they are used primarily in case of grid supply brownouts or blackouts. Again, this refl ects consumers’ willingness to pay high costs to maintain a high level of service. Such redundant systems are fairly expensive.
7134-CH04.pdf 31 7/27/10 6:55 AM
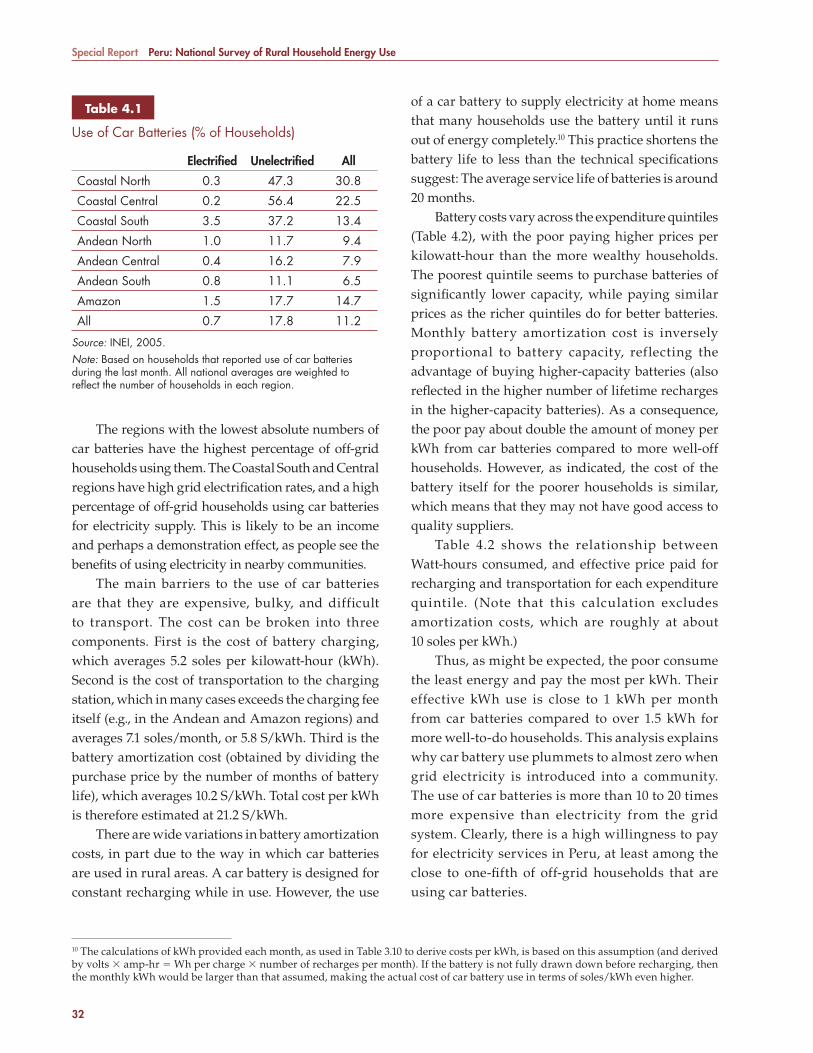
Special Report Peru: National Survey of Rural Household Energy Use
32
The regions with the lowest absolute numbers of car batteries have the highest percentage of off-grid households using them. The Coastal South and Central regions have high grid electrifi cation rates, and a high percentage of off-grid households using car batteries for electricity supply. This is likely to be an income and perhaps a demonstration effect, as people see the benefi ts of using electricity in nearby communities.
The main barriers to the use of car batteries are that they are expensive, bulky, and difficult to transport. The cost can be broken into three components. First is the cost of battery charging, which averages 5.2 soles per kilowatt-hour (kWh). Second is the cost of transportation to the charging station, which in many cases exceeds the charging fee itself (e.g., in the Andean and Amazon regions) and averages 7.1 soles/month, or 5.8 S/kWh. Third is the battery amortization cost (obtained by dividing the purchase price by the number of months of battery life), which averages 10.2 S/kWh. Total cost per kWh is therefore estimated at 21.2 S/kWh.
There are wide variations in battery amortization costs, in part due to the way in which car batteries are used in rural areas. A car battery is designed for constant recharging while in use. However, the use
of a car battery to supply electricity at home means that many households use the battery until it runs out of energy completely.10 This practice shortens the battery life to less than the technical specifi cations suggest: The average service life of batteries is around 20 months.
Battery costs vary across the expenditure quintiles (Table 4.2), with the poor paying higher prices per kilowatt-hour than the more wealthy households. The poorest quintile seems to purchase batteries of signifi cantly lower capacity, while paying similar prices as the richer quintiles do for better batteries. Monthly battery amortization cost is inversely proportional to battery capacity, reflecting the advantage of buying higher-capacity batteries (also refl ected in the higher number of lifetime recharges in the higher-capacity batteries). As a consequence, the poor pay about double the amount of money per kWh from car batteries compared to more well-off households. However, as indicated, the cost of the battery itself for the poorer households is similar, which means that they may not have good access to quality suppliers.
Table 4.2 shows the relationship between Watt-hours consumed, and effective price paid for recharging and transportation for each expenditure quintile. (Note that this calculation excludes amortization costs, which are roughly at about 10 soles per kWh.)
Thus, as might be expected, the poor consume the least energy and pay the most per kWh. Their effective kWh use is close to 1 kWh per month from car batteries compared to over 1.5 kWh for more well-to-do households. This analysis explains why car battery use plummets to almost zero when grid electricity is introduced into a community. The use of car batteries is more than 10 to 20 times more expensive than electricity from the grid system. Clearly, there is a high willingness to pay for electricity services in Peru, at least among the close to one-fi fth of off-grid households that are using car batteries.
Table 4.1Table 4.1
Use of Car Batteries (% of Households)
Electrifi ed Unelectrifi ed All
Coastal North 0.3 47.3 30.8
Coastal Central 0.2 56.4 22.5
Coastal South 3.5 37.2 13.4
Andean North 1.0 11.7 9.4
Andean Central 0.4 16.2 7.9
Andean South 0.8 11.1 6.5
Amazon 1.5 17.7 14.7
All 0.7 17.8 11.2
Source: INEI, 2005.Note: Based on households that reported use of car batteries during the last month. All national averages are weighted to refl ect the number of households in each region.
10 The calculations of kWh provided each month, as used in Table 3.10 to derive costs per kWh, is based on this assumption (and derived by volts � amp-hr � Wh per charge � number of recharges per month). If the battery is not fully drawn down before recharging, then the monthly kWh would be larger than that assumed, making the actual cost of car battery use in terms of soles/kWh even higher.
7134-CH04.pdf 32 7/27/10 6:55 AM

4 Off-Grid Electricity
33
Dry Cell BatteriesDry cell batteries are commonly used for specifi c purposes in both grid and off-grid households in rural areas. Often, such batteries fulfi ll an energy niche that cannot be entirely met though the use of grid electricity. Flashlights and radios can be carried both inside and outside of the house, something that is impractical for grid electricity. However, it is also evident that households with grid electricity are less reliant on batteries for their electricity needs as households without access to it. As a consequence, they save having to pay for what is a very expensive form of energy.
The main uses of batteries are for fl ashlights and radios. As can be seen in Table 4.3., over one-half of rural households have fl ashlights and radios. The use of these appliances is quite important to rural households, even though their operation is fairly expensive. Dry cell batteries, although the most expensive way of providing electricity from nongrid sources, are used by 74 percent of all households for highly valued appliances such as radios and fl ashlights.11 Table 4.4 provides a breakdown of dry cell battery costs. Not surprisingly, the costs per kWh decrease inversely with battery size, going from US$890 per kWh for AAA batteries to US$80 per kWh for D batteries.
Despite very high costs compared to other electricity sources, dry cells continue to be used by households with electricity. Fifty-fi ve percent of households with electricity report use of dry cell batteries, as opposed to 86 percent of households without electricity (Figure 4.1). This difference is consistent across expenditure quintiles. It is clear from the figure that the percentage of households using dry cells in the poorest quintile is substantially less than in the other quintiles, but still remains quite high.
The general pattern is for households with higher incomes to use a larger number of batteries, and therefore more watt-hours of electricity. In Figure 4.2, the watt-hours (Wh) consumption per month for households with and without electricity increases with the income of the household. However, those households without electricity
Table 4.2Table 4.2
Car-Battery Statistics by Expenditure Quintile
Qu intileBattery Cost
(Soles)
Battery Capacity
(amp-hours)
Effective Monthly Energy (kWh/Month)
Lifetime Recharges
Monthly Battery Cost (S/Month)
Average Operating
Cost per kWh (Soles/kWh)
1 (Poorest) 121 48.7 0.9 33.7 11.4 12.72 123 58.9 1.1 33.0 9.3 8.53 123 60.8 1.4 41.5 9.0 6.44 122 62.2 1.6 44.2 9.9 6.25 (Richest) 124 59.8 1.7 46.3 8.5 5.0All Households 123 59.4 1.4 42.0 9.4 6.7
Source: INEI, 2005.
11 The Survey does not record the devices used with AA and AAA batteries, but radio is likely the predominant use.
Table 4.3Table 4.3
Uses of Dry Cell Batteries (% of Users Only)
Income Quintile 1 2 3 4 5
Clock 2% 4% 4% 6% 10%
Flashlight 46% 61% 61% 53% 66%
Radio 46% 61% 60% 54% 53%
Source: INEI, 2005.
7134-CH04.pdf 33 7/27/10 6:55 AM

Special Report Peru: National Survey of Rural Household Energy Use
34
actually consume an increasing amount of batteries. In the highest-expenditure quintile, monthly Watt-hours in dry cells decreases by half, from 38 Wh/month to 19Wh/month, once a household has received electricity service from the grid. In the poorest quintile, it decreases by much less, from 17Wh/month to 13 Wh/month.
The use of dry cell batteries in Peru is pervasive. Households without electricity pay about 6 soles per
month on dry cell batteries, compared to 3 soles per month for households with electricity. Thus, grid electricity does, to a degree, reduce expenditures on batteries. In a later section, we will use the consumer surplus method to estimate the lighting and radio use benefi ts of electrifi cation, based on both the extent of use and the price of the service. The evidence is strong that dry cell batteries are a signifi cant expenditure for rural households.
Table 4.4Table 4.4
Dry Cell Battery Costs
Unit AAA AA C D
MilliAmpere Hour(1) mAh 1,250 2,850 8,350 20,500
Watt-Hours at Nominal 1.5 Volts(1) Watt-hour 1.9 4.3 12.5 30.8
Watt-Hour at Actual(2) Watt-hour 1.4 3.2 9.4 23.1
Typical U.S. Cost $US/battery 1.25 1.00 1.60 1.80
Typical U.S. Cost per kWh $/kWh 890 310 170 80
Source: INEI, 2005.(1) From Energizer battery Web site, www.energizer.com (high-quality alkaline batteries).(2) Actual Watt-hours likely in practice, given fall in voltage over time.
Source: INEI, 2005.
100%
90%
80%
70%
60%
50%
40%
1 (Poorest)Electrified
All HHUnelectrified
48%
65%71%
57%
78%89%
57%
77%90%
59%
77%94%
52%
73%90%
2 3
Per
cent
age
of H
ouse
hold
s U
sing
Dry
Cel
ls
Unelectrified
All Households
Electrified
4 5 (Richest)
Figure 4.1Figure 4.1
Percentage of Households Reporting Use of Dry Cells
7134-CH04.pdf 34 7/27/10 6:55 AM
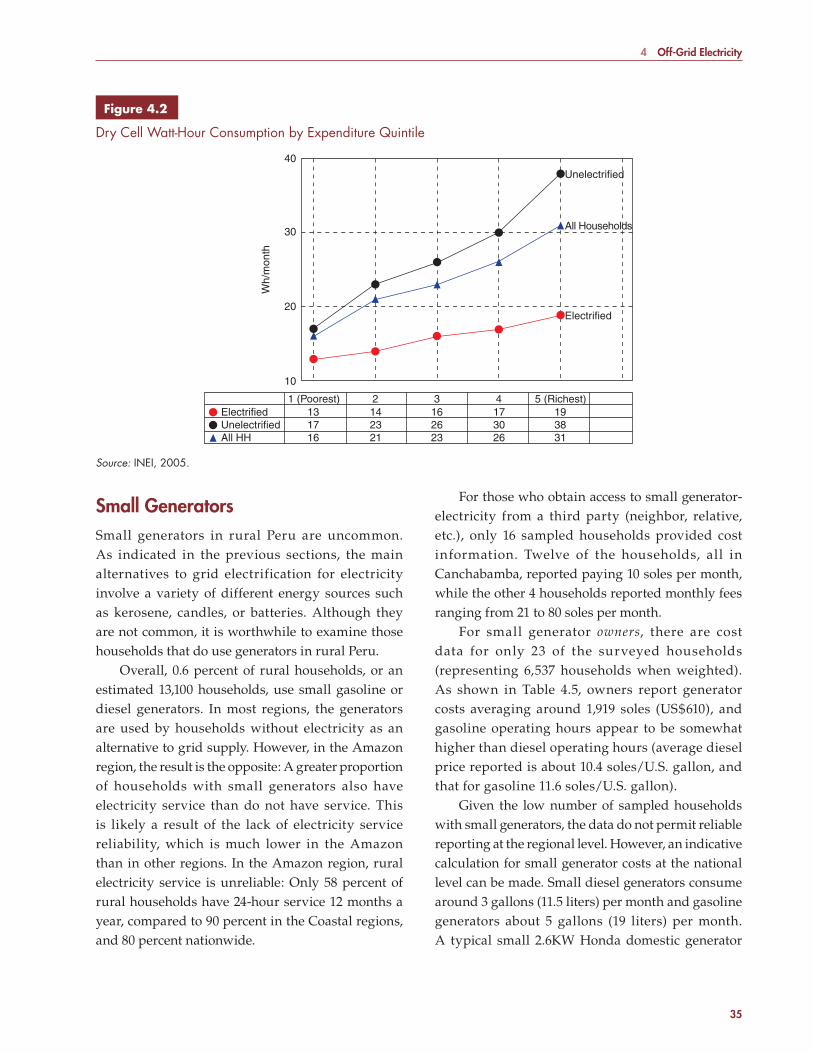
4 Off-Grid Electricity
35
Small GeneratorsSmall generators in rural Peru are uncommon. As indicated in the previous sections, the main alternatives to grid electrification for electricity involve a variety of different energy sources such as kerosene, candles, or batteries. Although they are not common, it is worthwhile to examine those households that do use generators in rural Peru.
Overall, 0.6 percent of rural households, or an estimated 13,100 households, use small gasoline or diesel generators. In most regions, the generators are used by households without electricity as an alternative to grid supply. However, in the Amazon region, the result is the opposite: A greater proportion of households with small generators also have electricity service than do not have service. This is likely a result of the lack of electricity service reliability, which is much lower in the Amazon than in other regions. In the Amazon region, rural electricity service is unreliable: Only 58 percent of rural households have 24-hour service 12 months a year, compared to 90 percent in the Coastal regions, and 80 percent nationwide.
For those who obtain access to small generator-electricity from a third party (neighbor, relative, etc.), only 16 sampled households provided cost information. Twelve of the households, all in Canchabamba, reported paying 10 soles per month, while the other 4 households reported monthly fees ranging from 21 to 80 soles per month.
For small generator owners, there are cost data for only 23 of the surveyed households (representing 6,537 households when weighted). As shown in Table 4.5, owners report generator costs averaging around 1,919 soles (US$610), and gasoline operating hours appear to be somewhat higher than diesel operating hours (average diesel price reported is about 10.4 soles/U.S. gallon, and that for gasoline 11.6 soles/U.S. gallon).
Given the low number of sampled households with small generators, the data do not permit reliable reporting at the regional level. However, an indicative calculation for small generator costs at the national level can be made. Small diesel generators consume around 3 gallons (11.5 liters) per month and gasoline generators about 5 gallons (19 liters) per month. A typical small 2.6KW Honda domestic generator
Source: INEI, 2005.
40
30
20
10
1 (Poorest)Electrified
All HHUnelectrified
13
1617
14
2123
16
2326
19
3138
17
2630
2 3
Wh/
mon
th
Unelectrified
All Households
Electrified
4 5 (Richest)
Figure 4.2Figure 4.2
Dry Cell Watt-Hour Consumption by Expenditure Quintile
7134-CH04.pdf 35 7/27/10 6:55 AM
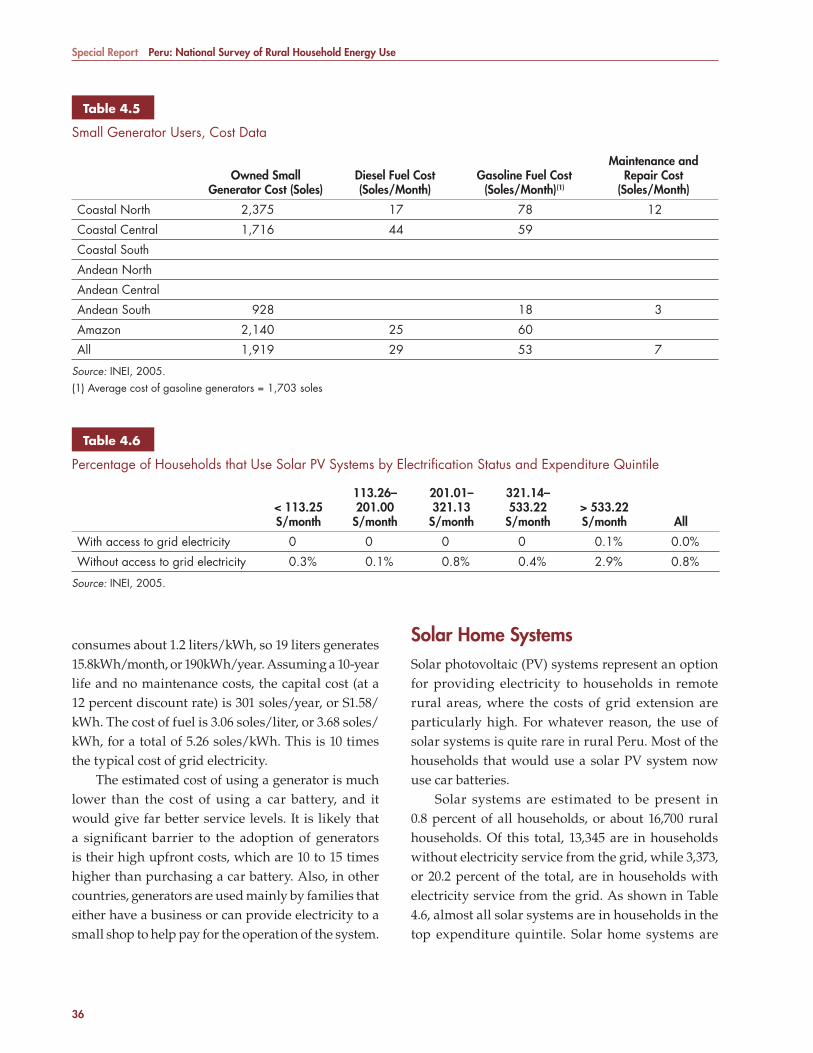
Special Report Peru: National Survey of Rural Household Energy Use
36
consumes about 1.2 liters/kWh, so 19 liters generates 15.8kWh/month, or 190kWh/year. Assuming a 10-year life and no maintenance costs, the capital cost (at a 12 percent discount rate) is 301 soles/year, or S1.58/kWh. The cost of fuel is 3.06 soles/liter, or 3.68 soles/kWh, for a total of 5.26 soles/kWh. This is 10 times the typical cost of grid electricity.
The estimated cost of using a generator is much lower than the cost of using a car battery, and it would give far better service levels. It is likely that a signifi cant barrier to the adoption of generators is their high upfront costs, which are 10 to 15 times higher than purchasing a car battery. Also, in other countries, generators are used mainly by families that either have a business or can provide electricity to a small shop to help pay for the operation of the system.
Solar Home SystemsSolar photovoltaic (PV) systems represent an option for providing electricity to households in remote rural areas, where the costs of grid extension are particularly high. For whatever reason, the use of solar systems is quite rare in rural Peru. Most of the households that would use a solar PV system now use car batteries.
Solar systems are estimated to be present in 0.8 percent of all households, or about 16,700 rural households. Of this total, 13,345 are in households without electricity service from the grid, while 3,373, or 20.2 percent of the total, are in households with electricity service from the grid. As shown in Table 4.6, almost all solar systems are in households in the top expenditure quintile. Solar home systems are
Table 4.5Table 4.5
Small Generator Users, Cost Data
Owned Small Generator Cost (Soles)
Diesel Fuel Cost (Soles/Month)
Gasoline Fuel Cost (Soles/Month)(1)
Maintenance and Repair Cost
(Soles/Month)
Coastal North 2,375 17 78 12
Coastal Central 1,716 44 59
Coastal South
Andean North
Andean Central
Andean South 928 18 3
Amazon 2,140 25 60
All 1,919 29 53 7
Source: INEI, 2005.(1) Average cost of gasoline generators = 1,703 soles
Table 4.6Table 4.6
Percentage of Households that Use Solar PV Systems by Electrifi cation Status and Expenditure Quintile
< 113.25 S/month
113.26–201.00
S/month
201.01–321.13
S/month
321.14–533.22
S/month> 533.22 S/month All
With access to grid electricity 0 0 0 0 0.1% 0.0%
Without access to grid electricity 0.3% 0.1% 0.8% 0.4% 2.9% 0.8%
Source: INEI, 2005.
7134-CH04.pdf 36 7/27/10 6:55 AM

4 Off-Grid Electricity
37
concentrated in the Andean Central, Andean South, and Amazon regions.
Of the 42 households sampled reporting PV systems, only 22 households reported use in the previous month. Of the 20 systems not used, 14 of the households have grid access. Since only four of the systems were reported to be installed before the year 2000, this indicates that the programs installing the systems did not target well to ensure that the solar home systems were destined for areas that would not be connected to the grid. Five systems appear to be out of service since the households have no grid access and report no use in the previous month. Three of the systems in use were more than 12 years old, and the oldest was installed in 1982. The four systems reported to be installed before 2000 were still in use, including the one installed in 1982. In terms of appliance use, most of the systems are used for lighting and communications, especially radio and black and white TV, while no uses for color TVs or VCRs were reported. Only one of the systems operated during the last month also had grid access.
ConclusionsThe main types of off-grid electricity used in rural Peru are car and dry cell batteries. In addition, a small number of people use generators and solar home systems. An estimated 18 percent of all households that do not have grid electricity are using batteries as their main source of electricity, and this amounts to approximately 240,000 households. More than half of households without electricity in the Coastal Central region use car batteries. Incomes are comparatively
high in the rural areas surrounding Lima, and car battery recharging would be relatively easy due to the presence of good roads. The two other Coastal regions also have very high levels of car battery use in households without electricity—47 percent in the North and 37 percent in the South. In the Amazon, about 18 percent of households use car batteries, while in the Andean regions, usage levels among households without electricity range from 11 to 16 percent. Costs are high, estimated at 5 to 13 soles per kWh for operation, plus 10 soles per kWh for amortization of the battery.
Both households with and without electricity use dry cell batteries, but their use is more prevalent in households without grid electricity. Less than 1 percent of all households have either a generator or a solar home system, and these are mainly concentrated in households with higher incomes.
The off-grid use of electricity in rural Peru is both pervasive and expensive. A signifi cant proportion of households that are not receiving electricity from the grid consume electricity that is available from other energy sources, such as car batteries, small generators, solar home systems, and dry cell batteries. Such electricity is generally of lesser quantity and poorer quality than that available from the grid, and has much higher cost per energy unit. The common use of this rather expensive electricity by households with no connection to the grid is an indication that they place a high value on the services provided by electricity. This is a testament to the strong desire for electricity in rural Peru due to the benefi ts it can bring to rural households. In the next section, the benefi ts of grid electricity are quantifi ed.
7134-CH04.pdf 37 7/27/10 6:55 AM

7134-CH04.pdf 38 7/27/10 6:55 AM
39
5 Benefi ts of Rural Electrifi cation
The benefi ts of rural electrifi cation are well recognized. However, there are few empirical studies that provide a firm economic quantification of these benefits, particularly in rural areas. In part, this is because of the diffi culties of quantifying benefi ts that may take decades to be realized—as in the case of improved educational outcomes from better study habits or improved income generation opportunities. Long-term outcomes are further blurred by migration from rural to urban areas. Diffi culties in quantifying benefi ts are also due to the intrinsic diffi culty of quantifying health and safety benefi ts, such as measuring the benefi ts of avoided burn injuries to children. Gathering reliable information in remote areas through household surveys also presents challenges. If establishing reliable estimates of household and energy expenditures is diffi cult where there is at least the common basis of money, establishing quantitative estimates of the diversity of services provided by electricity, such as lighting, television viewing, and refrigeration, is more diffi cult still.
In this chapter, we examine the benefits of providing electricity to people in rural areas. This is not a trivial task, and it involves both understanding demand behavior and making some assumptions about how households without grid electricity will change their behavior once they have access to it. Implicit in this work is that electricity is valued not in and of itself, but rather, for the services that are provided. In some cases, these services already are provided though the use of other fuels. Candles and kerosene are used for lighting before households gain access to electricity. In other cases, there are new uses that are just not possible without electricity. Fortunately, we have evidence from households that already have electricity concerning how they use it
and how much they are paying for these services, so comparisons become possible.
Background on Rural Electrifi cation Benefi t Estimation The goal of determining the benefi ts of projects is hampered by the fact that “benefi t” has no natural measure. Psychologists, sociologists, and economists may imagine a measure, such as the “value” or “utility.” Yet, no physical meter or device can measure the increased value or utility enjoyed by individuals and households that results from the significant change in lifestyle that occurs once grid electricity is delivered into a home.
The benefits of electricity consumption can be broken into two categories: direct and indirect. Direct benefits include improvements to lighting and television viewing. Indirect benefits include improved educational outcomes for children in homes with electricity and improved income-generation opportunities. Most of the quantitative work described in the literature relates to estimating the direct benefi ts, and most of this section is devoted to assessing these direct benefi ts using techniques that have been increasingly used in similar studies in other countries. However, there is evidence that some of the direct benefi ts, such as improved lighting give rise to indirect benefi ts, such as improved education or school attendance. Thus, even though measuring and quantifying indirect benefi ts may be problematic, some of them may be embedded in some of the direct benefi ts measured. As an example, lighting may allow children to read in the evening and parents may then see a long-term benefi t of sending their children to school because they will perform better.
7134-CH05.pdf 39 7/27/10 6:55 AM

Special Report Peru: National Survey of Rural Household Energy Use
40
There are two basic approaches for estimating the direct economic benefi ts of rural electrifi cation. The fi rst—which is well-established in the applied economics literature—is to set benefits equal to the avoided costs of the various devices that are replaced by electrification, including kerosene, diesel generation for auto battery charging, candles, and dry cells batteries. This avoided cost method is easily applied because it needs only expenditure information. It also has the advantage that the estimates of benefi ts are empirical and demonstrable. For example, if electricity displaces a certain amount of kerosene and candles, then it is reasonable to assume that the monetary benefi ts of electrifi cation will be at least equal to those avoided costs.
The avoided cost method generally underestimates the actual benefi ts, for two reasons. The fi rst is that the quality of service from electrifi cation is far superior to that from most alternative devices: The illumination derived from a compact fluorescent lamp is far superior to that provided by candles or kerosene lamps. Moreover, electric lighting eliminates many harmful side effects, such as smoke, odor, and the risk of fi re and injury. Individuals are prepared to pay more for high-quality service, which is to say that they value a given number of lumens from an electric bulb much more than the equivalent number of lumens from candles and kerosene. For this reason, the benefi ts are greater than those that may be inferred from replacement costs alone.
The second reason why benefits can be underestimated is that it is well established that individuals are prepared to pay very high prices for the fi rst few kWh of electricity (or lumens). The evidence is that people commonly use kerosene and dry cell batteries with a very high cost per kilolumen hour. They are also prepared to pay high prices for enough electricity to power a small television. But the amount they are prepared to pay, for example, for the tenth and eleventh compact fl uorescent lamp (CFL) will be much less than that which they are willing to pay for the fi rst and second CFL. This demand curve—the representation of quantity demanded as a function of price—is therefore downward sloping, and the total benefi ts from some level of consumption is given by the area under the demand curve (to that level of consumption).
To circumvent the underestimation problem of the “avoided cost” method, another direct benefit calculation method can be used that involves estimating a demand curve. However, this is generally diffi cult because few actual data points may be available to accurately determine the shape of the curve. In many cases, there are only two points: one of which corresponds to the quantity consumed and price paid by households with electricity, and the other for the quantity/price combination of households without electricity. Despite the additional uncertainty, this method of estimating the demand curve and the formalization of willingness to pay is generally accepted as a more realistic measure of the benefi ts of electrifi cation than the avoided costs method and has been widely adopted.
Economic theory holds that the total benefi t of consuming a given quantity of a good at a given price is equal to the area under the demand curve. Such a demand curve is illustrated in Figure 5.1 for the case of lighting: For the purpose of this illustrative example, it is assumed that lighting in households without electricity is provided by kerosene lamps only, and is represented by the point x on the demand curve. The quantity of service consumed is therefore QKERO, at the price PKERO. Thus, the total household expenditure on lighting is QKERO � PKERO, equal to the area B � D.
The total willingness to pay (WTP) for the service at level QKERO is the total area under the demand curve to that level of consumption (i.e., areas A � B � D). This is the total benefi t to the consumer. However, the cost is area B � D, and therefore the net benefi t of consuming QKERO, also called the consumer surplus, is the difference between the two, namely, the area A.
After electrifi cation, the level of service (in the case of lighting, the number of lumen-hours) typically increases substantially and is represented by the point y. Consumption therefore increases from QKERO to QE, but the price paid for the electricity service also falls (typically) from PKERO to PE. Now the household’s expenditure for electricity is PE � QE, equal to the area D � E. At this level of consumption, the total area under the demand curve to QE (i.e., the total benefi t), is now the area A � B � C � D � E. Therefore, the net benefi t, or consumer surplus, after subtracting the cost D � E, is A � B � C. Thus, it follows that the
7134-CH05.pdf 40 7/27/10 6:55 AM

5 Benefi ts of Rural Electrifi cation
41
net economic benefi t of electrifi cation is the increase in consumer surplus, which is the area B � C.
Areas B, D, and E are readily calculated from knowledge of consumption before and after electrification, from the household budget for kerosene (and battery charging), and from electricity tariffs. In other words, given knowledge of the two points on the demand curve, x and y, the areas B, D, and E are immediately calculable. Area C is more diffi cult to estimate, since it requires knowledge of the shape of the demand curve between points x and y. The most convenient assumption is that the demand curve is linear. However, as shown next in the case of the demand for lighting, for which several points on the curve are available (each representing different steps in the lighting ladder), the shape is concave.
This approach of estimating changes in welfare by consumer surplus has a number of issues and limitations that are rarely acknowledged, and needs to be applied with some caution. Consumer surplus is an approximation of real benefi t increase that lies somewhere between the area under the demand as measured by old prices and benefit increases
associated with new prices. One must recognize that the demand curve shifts outward with increases in income. For most so-called normal goods at a given price, higher income would mean an increase in demand. However, in the case of an inferior good, consumption decreases with increase of income.12 It will be seen later in this chapter that radio listening decreases when households with electricity start using television. But for lighting, it is possible to estimate the benefi ts by calculating the increase in consumer surplus from the relevant demand curve.
Thus, the methodology requires estimates of the cost and quantity of a service before and after electrifi cation, described in the following sections for a number of the important services provided by electricity—lighting, television-viewing, radio, and refrigeration.
Measuring the Benefi ts of Better LightingIdeally, to measure the benefits of electrification, one would collect data on lighting utilization
Source: INEI, 2005.
QKERO
A
B
C
D E
QE
P KE RO
P E
service level
price
x
y
Figure 5.1Figure 5.1
Demand Curve for Lighting (Theoretical)
12 These limitations are discussed further in Annex 3.
7134-CH05.pdf 41 7/27/10 6:55 AM
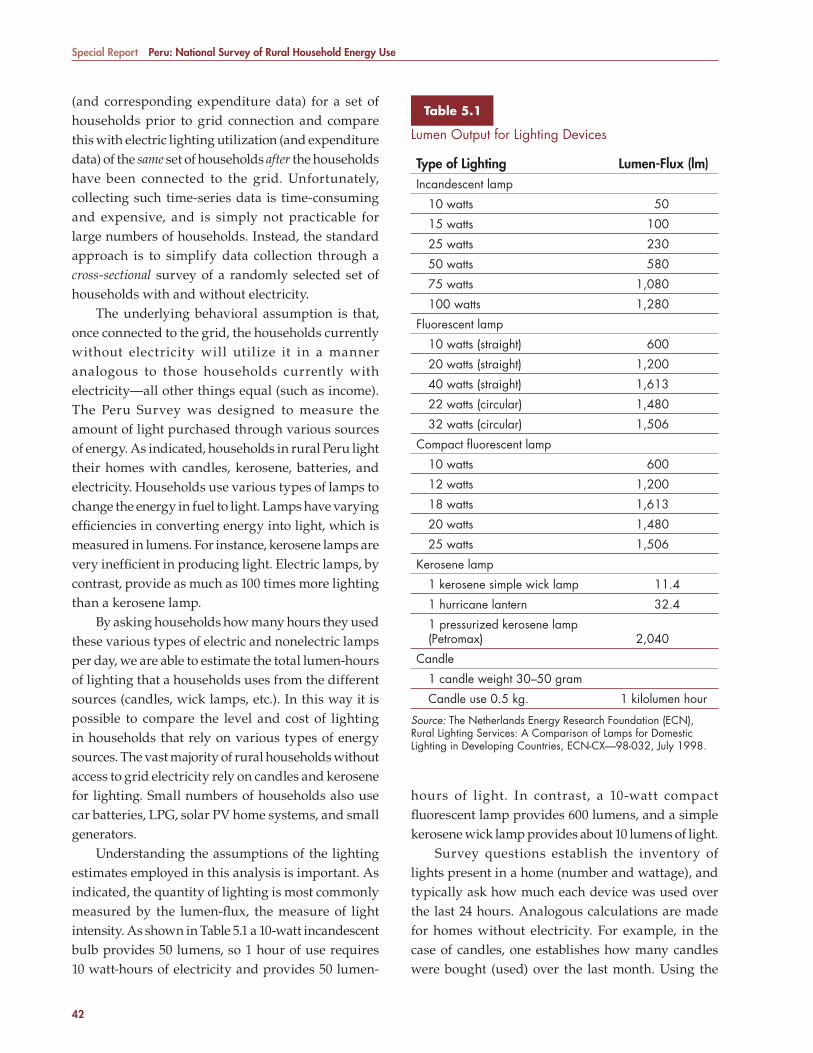
Special Report Peru: National Survey of Rural Household Energy Use
42
(and corresponding expenditure data) for a set of households prior to grid connection and compare this with electric lighting utilization (and expenditure data) of the same set of households after the households have been connected to the grid. Unfortunately, collecting such time-series data is time-consuming and expensive, and is simply not practicable for large numbers of households. Instead, the standard approach is to simplify data collection through a cross-sectional survey of a randomly selected set of households with and without electricity.
The underlying behavioral assumption is that, once connected to the grid, the households currently without electricity will utilize it in a manner analogous to those households currently with electricity—all other things equal (such as income). The Peru Survey was designed to measure the amount of light purchased through various sources of energy. As indicated, households in rural Peru light their homes with candles, kerosene, batteries, and electricity. Households use various types of lamps to change the energy in fuel to light. Lamps have varying effi ciencies in converting energy into light, which is measured in lumens. For instance, kerosene lamps are very ineffi cient in producing light. Electric lamps, by contrast, provide as much as 100 times more lighting than a kerosene lamp.
By asking households how many hours they used these various types of electric and nonelectric lamps per day, we are able to estimate the total lumen-hours of lighting that a households uses from the different sources (candles, wick lamps, etc.). In this way it is possible to compare the level and cost of lighting in households that rely on various types of energy sources. The vast majority of rural households without access to grid electricity rely on candles and kerosene for lighting. Small numbers of households also use car batteries, LPG, solar PV home systems, and small generators.
Understanding the assumptions of the lighting estimates employed in this analysis is important. As indicated, the quantity of lighting is most commonly measured by the lumen-fl ux, the measure of light intensity. As shown in Table 5.1 a 10-watt incandescent bulb provides 50 lumens, so 1 hour of use requires 10 watt-hours of electricity and provides 50 lumen-
hours of light. In contrast, a 10-watt compact fl uorescent lamp provides 600 lumens, and a simple kerosene wick lamp provides about 10 lumens of light.
Survey questions establish the inventory of lights present in a home (number and wattage), and typically ask how much each device was used over the last 24 hours. Analogous calculations are made for homes without electricity. For example, in the case of candles, one establishes how many candles were bought (used) over the last month. Using the
Table 5.1Table 5.1
Lumen Output for Lighting Devices
Type of Lighting Lumen-Flux (lm)Incandescent lamp
10 watts 50
15 watts 100
25 watts 230
50 watts 580
75 watts 1,080
100 watts 1,280
Fluorescent lamp
10 watts (straight) 600
20 watts (straight) 1,200
40 watts (straight) 1,613
22 watts (circular) 1,480
32 watts (circular) 1,506
Compact fl uorescent lamp
10 watts 600
12 watts 1,200
18 watts 1,613
20 watts 1,480
25 watts 1,506
Kerosene lamp
1 kerosene simple wick lamp 11.4
1 hurricane lantern 32.4
1 pressurized kerosene lamp (Petromax) 2,040
Candle
1 candle weight 30–50 gram
Candle use 0.5 kg. 1 kilolumen hour
Source: The Netherlands Energy Research Foundation (ECN), Rural Lighting Services: A Comparison of Lamps for Domestic Lighting in Developing Countries, ECN-CX—98-032, July 1998.
7134-CH05.pdf 42 7/27/10 6:55 AM
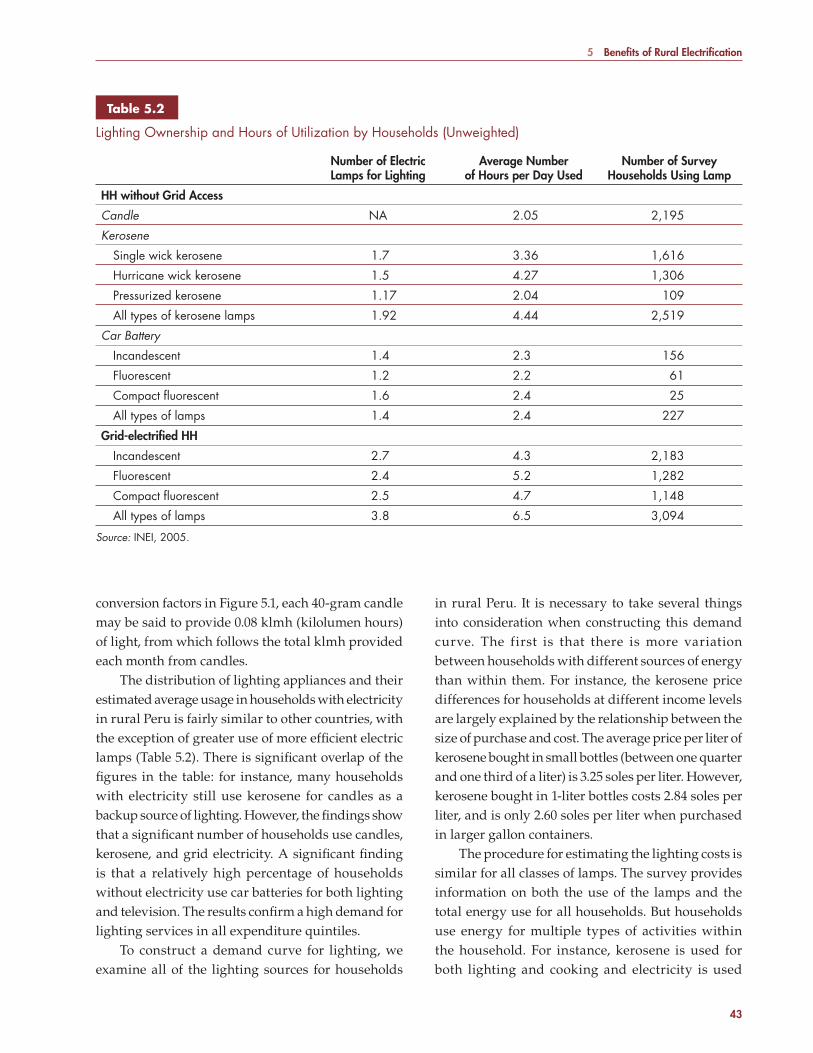
5 Benefi ts of Rural Electrifi cation
43
conversion factors in Figure 5.1, each 40-gram candle may be said to provide 0.08 klmh (kilolumen hours) of light, from which follows the total klmh provided each month from candles.
The distribution of lighting appliances and their estimated average usage in households with electricity in rural Peru is fairly similar to other countries, with the exception of greater use of more effi cient electric lamps (Table 5.2). There is signifi cant overlap of the fi gures in the table: for instance, many households with electricity still use kerosene for candles as a backup source of lighting. However, the fi ndings show that a signifi cant number of households use candles, kerosene, and grid electricity. A signifi cant fi nding is that a relatively high percentage of households without electricity use car batteries for both lighting and television. The results confi rm a high demand for lighting services in all expenditure quintiles.
To construct a demand curve for lighting, we examine all of the lighting sources for households
in rural Peru. It is necessary to take several things into consideration when constructing this demand curve. The first is that there is more variation between households with different sources of energy than within them. For instance, the kerosene price differences for households at different income levels are largely explained by the relationship between the size of purchase and cost. The average price per liter of kerosene bought in small bottles (between one quarter and one third of a liter) is 3.25 soles per liter. However, kerosene bought in 1-liter bottles costs 2.84 soles per liter, and is only 2.60 soles per liter when purchased in larger gallon containers.
The procedure for estimating the lighting costs is similar for all classes of lamps. The survey provides information on both the use of the lamps and the total energy use for all households. But households use energy for multiple types of activities within the household. For instance, kerosene is used for both lighting and cooking and electricity is used
Table 5.2Table 5.2
Lighting Ownership and Hours of Utilization by Households (Unweighted)
Number of Electric Lamps for Lighting
Average Number of Hours per Day Used
Number of Survey Households Using Lamp
HH without Grid Access
Candle NA 2.05 2,195
Kerosene
Single wick kerosene 1.7 3.36 1,616
Hurricane wick kerosene 1.5 4.27 1,306
Pressurized kerosene 1.17 2.04 109
All types of kerosene lamps 1.92 4.44 2,519
Car Battery
Incandescent 1.4 2.3 156
Fluorescent 1.2 2.2 61
Compact fl uorescent 1.6 2.4 25
All types of lamps 1.4 2.4 227
Grid-electrifi ed HH
Incandescent 2.7 4.3 2,183
Fluorescent 2.4 5.2 1,282
Compact fl uorescent 2.5 4.7 1,148
All types of lamps 3.8 6.5 3,094
Source: INEI, 2005.
7134-CH05.pdf 43 7/27/10 6:55 AM
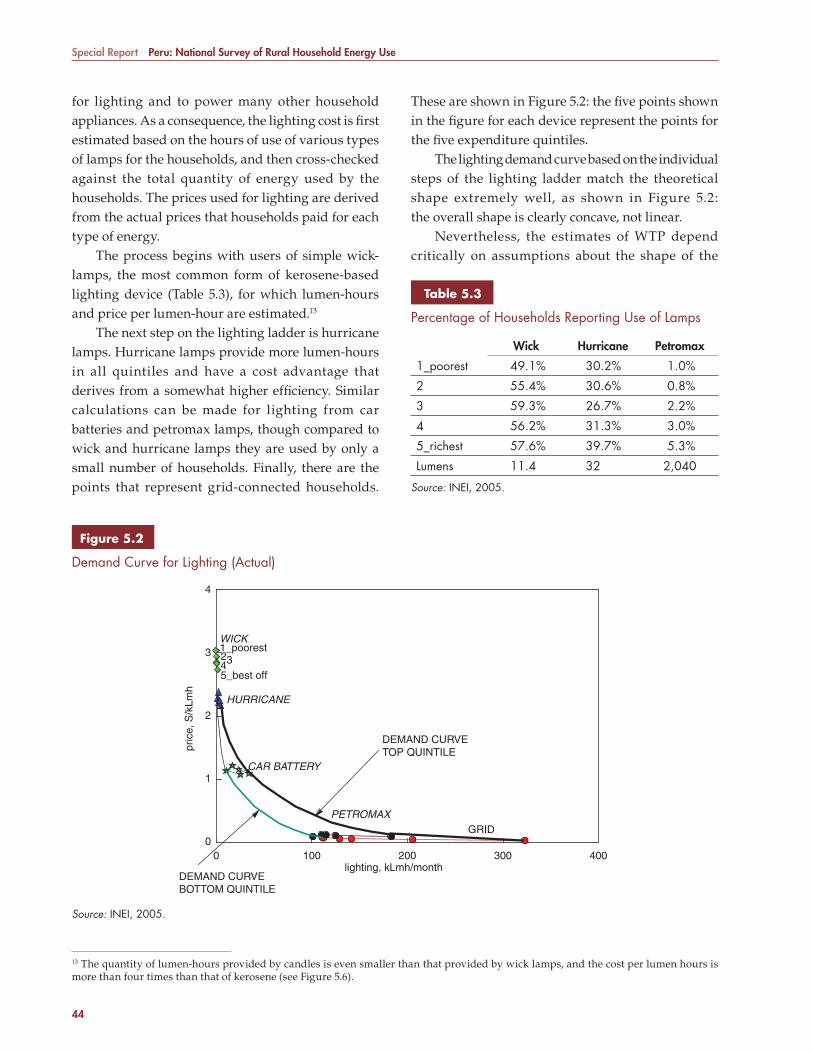
Special Report Peru: National Survey of Rural Household Energy Use
44
for lighting and to power many other household appliances. As a consequence, the lighting cost is fi rst estimated based on the hours of use of various types of lamps for the households, and then cross-checked against the total quantity of energy used by the households. The prices used for lighting are derived from the actual prices that households paid for each type of energy.
The process begins with users of simple wick-lamps, the most common form of kerosene-based lighting device (Table 5.3), for which lumen-hours and price per lumen-hour are estimated.13
The next step on the lighting ladder is hurricane lamps. Hurricane lamps provide more lumen-hours in all quintiles and have a cost advantage that derives from a somewhat higher effi ciency. Similar calculations can be made for lighting from car batteries and petromax lamps, though compared to wick and hurricane lamps they are used by only a small number of households. Finally, there are the points that represent grid-connected households.
These are shown in Figure 5.2: the fi ve points shown in the fi gure for each device represent the points for the fi ve expenditure quintiles.
The lighting demand curve based on the individual steps of the lighting ladder match the theoretical shape extremely well, as shown in Figure 5.2: the overall shape is clearly concave, not linear.
Nevertheless, the estimates of WTP depend critically on assumptions about the shape of the
13 The quantity of lumen-hours provided by candles is even smaller than that provided by wick lamps, and the cost per lumen hours is more than four times than that of kerosene (see Figure 5.6).
Source: INEI, 2005.
WICK
HURRICANE
CAR BATTERY
PETROMAXGRID
DEMAND CURVEBOTTOM QUINTILE
DEMAND CURVETOP QUINTILE
lighting, kLmh/month
1_poorest2345_best off
4
3
2
1
00 100 200 300 400
pric
e, S
/kLm
h
Figure 5.2Figure 5.2
Demand Curve for Lighting (Actual)
Table 5.3Table 5.3
Percentage of Households Reporting Use of Lamps
Wick Hurricane Petromax
1_poorest 49.1% 30.2% 1.0%
2 55.4% 30.6% 0.8%
3 59.3% 26.7% 2.2%
4 56.2% 31.3% 3.0%
5_richest 57.6% 39.7% 5.3%
Lumens 11.4 32 2,040
Source: INEI, 2005.
7134-CH05.pdf 44 7/27/10 6:55 AM
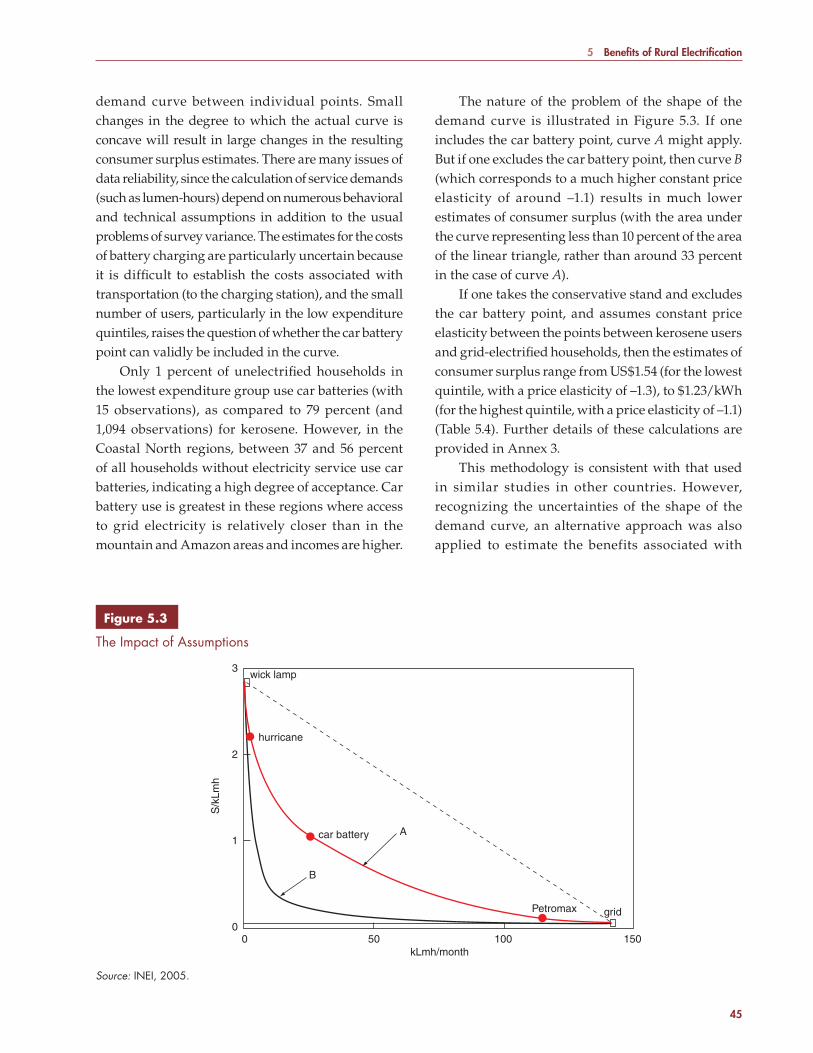
5 Benefi ts of Rural Electrifi cation
45
demand curve between individual points. Small changes in the degree to which the actual curve is concave will result in large changes in the resulting consumer surplus estimates. There are many issues of data reliability, since the calculation of service demands (such as lumen-hours) depend on numerous behavioral and technical assumptions in addition to the usual problems of survey variance. The estimates for the costs of battery charging are particularly uncertain because it is diffi cult to establish the costs associated with transportation (to the charging station), and the small number of users, particularly in the low expenditure quintiles, raises the question of whether the car battery point can validly be included in the curve.
Only 1 percent of unelectrifi ed households in the lowest expenditure group use car batteries (with 15 observations), as compared to 79 percent (and 1,094 observations) for kerosene. However, in the Coastal North regions, between 37 and 56 percent of all households without electricity service use car batteries, indicating a high degree of acceptance. Car battery use is greatest in these regions where access to grid electricity is relatively closer than in the mountain and Amazon areas and incomes are higher.
The nature of the problem of the shape of the demand curve is illustrated in Figure 5.3. If one includes the car battery point, curve A might apply. But if one excludes the car battery point, then curve B (which corresponds to a much higher constant price elasticity of around –1.1) results in much lower estimates of consumer surplus (with the area under the curve representing less than 10 percent of the area of the linear triangle, rather than around 33 percent in the case of curve A).
If one takes the conservative stand and excludes the car battery point, and assumes constant price elasticity between the points between kerosene users and grid-electrifi ed households, then the estimates of consumer surplus range from US$1.54 (for the lowest quintile, with a price elasticity of –1.3), to $1.23/kWh (for the highest quintile, with a price elasticity of –1.1) (Table 5.4). Further details of these calculations are provided in Annex 3.
This methodology is consistent with that used in similar studies in other countries. However, recognizing the uncertainties of the shape of the demand curve, an alternative approach was also applied to estimate the benefits associated with
Source: INEI, 2005.
3wick lamp
A
B
hurricane
car battery
Petromax
kLmh/month
S/k
Lmh
grid
2
1
00 50 100 150
Figure 5.3Figure 5.3
The Impact of Assumptions
7134-CH05.pdf 45 7/27/10 6:55 AM
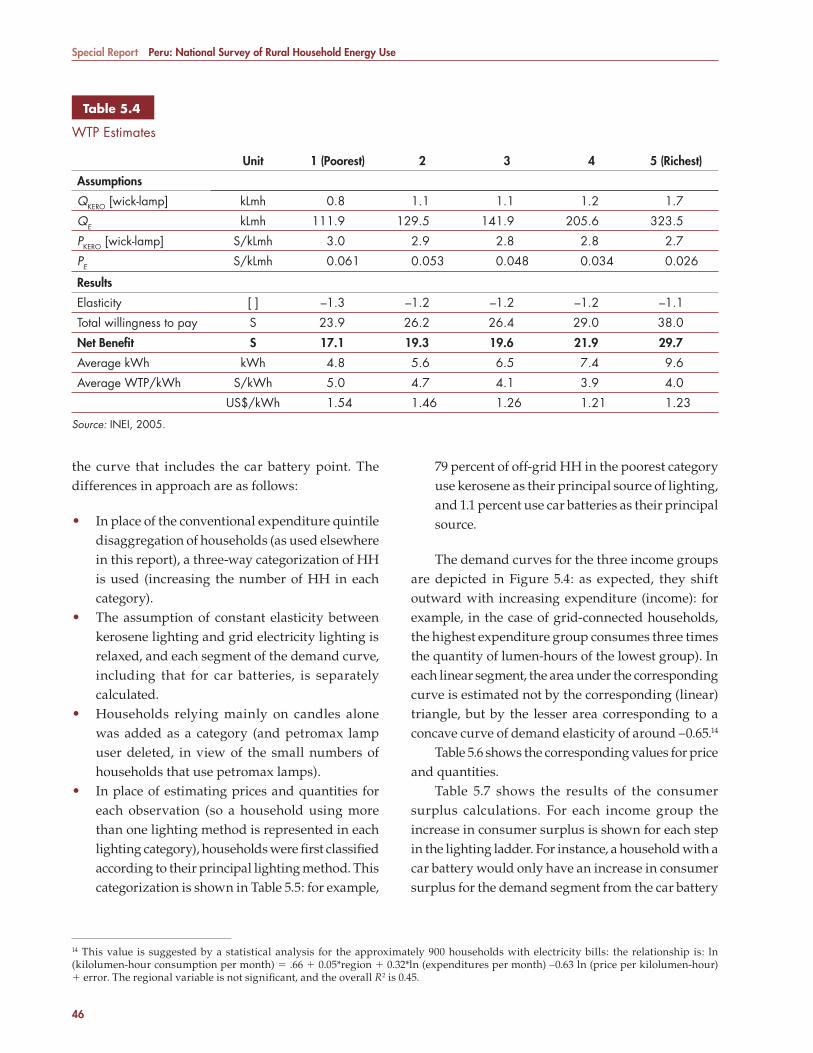
Special Report Peru: National Survey of Rural Household Energy Use
46
the curve that includes the car battery point. The differences in approach are as follows:
• In place of the conventional expenditure quintile disaggregation of households (as used elsewhere in this report), a three-way categorization of HH is used (increasing the number of HH in each category).
• The assumption of constant elasticity between kerosene lighting and grid electricity lighting is relaxed, and each segment of the demand curve, including that for car batteries, is separately calculated.
• Households relying mainly on candles alone was added as a category (and petromax lamp user deleted, in view of the small numbers of households that use petromax lamps).
• In place of estimating prices and quantities for each observation (so a household using more than one lighting method is represented in each lighting category), households were fi rst classifi ed according to their principal lighting method. This categorization is shown in Table 5.5: for example,
79 percent of off-grid HH in the poorest category use kerosene as their principal source of lighting, and 1.1 percent use car batteries as their principal source.
The demand curves for the three income groups are depicted in Figure 5.4: as expected, they shift outward with increasing expenditure (income): for example, in the case of grid-connected households, the highest expenditure group consumes three times the quantity of lumen-hours of the lowest group). In each linear segment, the area under the corresponding curve is estimated not by the corresponding (linear) triangle, but by the lesser area corresponding to a concave curve of demand elasticity of around –0.65.14
Table 5.6 shows the corresponding values for price and quantities.
Table 5.7 shows the results of the consumer surplus calculations. For each income group the increase in consumer surplus is shown for each step in the lighting ladder. For instance, a household with a car battery would only have an increase in consumer surplus for the demand segment from the car battery
Table 5.4Table 5.4
WTP Estimates
Unit 1 (Poorest) 2 3 4 5 (Richest)
Assumptions
QKERO [wick-lamp] kLmh 0.8 1.1 1.1 1.2 1.7
QE kLmh 111.9 129.5 141.9 205.6 323.5
PKERO [wick-lamp] S/kLmh 3.0 2.9 2.8 2.8 2.7
PE S/kLmh 0.061 0.053 0.048 0.034 0.026
Results
Elasticity [ ] –1.3 –1.2 –1.2 –1.2 –1.1
Total willingness to pay S 23.9 26.2 26.4 29.0 38.0
Net Benefi t S 17.1 19.3 19.6 21.9 29.7
Average kWh kWh 4.8 5.6 6.5 7.4 9.6
Average WTP/kWh S/kWh 5.0 4.7 4.1 3.9 4.0
US$/kWh 1.54 1.46 1.26 1.21 1.23
Source: INEI, 2005.
14 This value is suggested by a statistical analysis for the approximately 900 households with electricity bills: the relationship is: ln (kilolumen-hour consumption per month) � .66 � 0.05*region � 0.32*ln (expenditures per month) –0.63 ln (price per kilolumen-hour) � error. The regional variable is not signifi cant, and the overall R2 is 0.45.
7134-CH05.pdf 46 7/27/10 6:55 AM
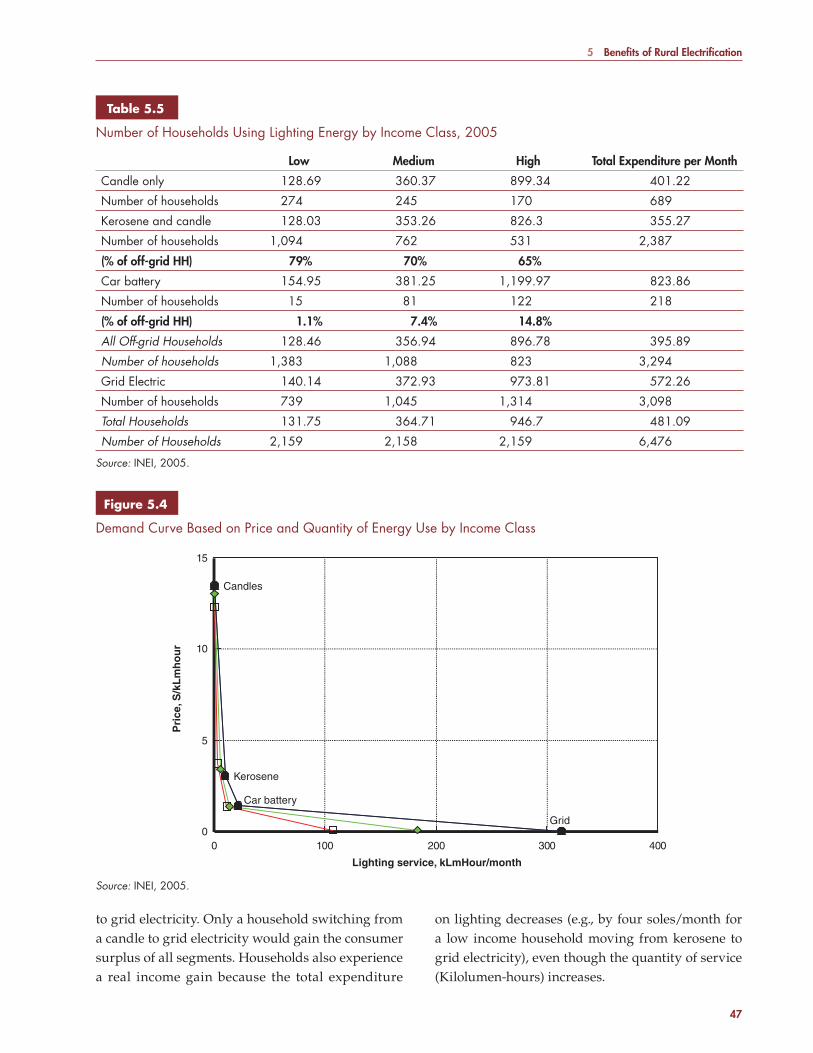
5 Benefi ts of Rural Electrifi cation
47
to grid electricity. Only a household switching from a candle to grid electricity would gain the consumer surplus of all segments. Households also experience a real income gain because the total expenditure
on lighting decreases (e.g., by four soles/month for a low income household moving from kerosene to grid electricity), even though the quantity of service (Kilolumen-hours) increases.
Table 5.5Table 5.5
Number of Households Using Lighting Energy by Income Class, 2005
Low Medium High Total Expenditure per Month
Candle only 128.69 360.37 899.34 401.22
Number of households 274 245 170 689
Kerosene and candle 128.03 353.26 826.3 355.27
Number of households 1,094 762 531 2,387
(% of off-grid HH) 79% 70% 65%
Car battery 154.95 381.25 1,199.97 823.86
Number of households 15 81 122 218
(% of off-grid HH) 1.1% 7.4% 14.8%
All Off-grid Households 128.46 356.94 896.78 395.89
Number of households 1,383 1,088 823 3,294
Grid Electric 140.14 372.93 973.81 572.26
Number of households 739 1,045 1,314 3,098
Total Households 131.75 364.71 946.7 481.09
Number of Households 2,159 2,158 2,159 6,476
Source: INEI, 2005.
Source: INEI, 2005.
0 100 200 300 4000
5
10
15
Candles
Kerosene
Car battery Grid
Lighting service, kLmHour/month
Pri
ce, S
/kL
mh
ou
r
Figure 5.4Figure 5.4
Demand Curve Based on Price and Quantity of Energy Use by Income Class
7134-CH05.pdf 47 7/27/10 6:55 AM

Special Report Peru: National Survey of Rural Household Energy Use
48
When the results are weighted by the proportion of households in each starting category, the calculations for average WTP per kWh and total monthly benefi ts are as shown in Table 5.8. These estimates of benefi t are signifi cantly higher than those derived in Table 5.4 (e.g., US$2.25/kWh for the lowest expenditure group, as opposed to US$1.54).15
Despite the uncertainties and the substantial range of the estimates of benefi t, the conclusion is that households switching from candles, kerosene, or car batteries to grid electricity for lighting enjoy high economic benefi ts. The estimates have high variance, but even at the low end of the range, the economic benefits are substantial. Not only do electrified
15 One of the issues in these calculations is that the expenditure, defi ned by Average kLmhrs consumed � Average price/kLmhr, does not equal the estimate of expenditure derived from the expenditure data. When the kLmhr and price/kLmhr estimates are scaled to expenditure estimates, the resulting values of consumer surplus would be about 20 percent lower.
Table 5.6Table 5.6
Estimates of Lighting Service and Price
Low Expenditure Medium Expenditure High Expenditure
Q kLmhrs Price S/kLmh Q Klmhrs Price S/klmh Q KLmh Price S/kLmh
Candles 0.48 12.28 0.68 13.01 0.83 13.45
Kerosene 3.16 3.69 5.76 3.41 10.28 3.03
Car battery 11.17 1.35 14.37 1.2 22.03 1.23
Electricity grid 107.66 0.048 183.64 0.031 313.48 0.021
Source: INEI, 2005.
Table 5.7Table 5.7
Increases of Consumer Surplus by Income Class (Soles/month)
Expenditure ClassIncrease in
Consumer SurplusEnding Expenditure
on LightingDifference in Expenditures
Low Expenditure (<236.11S/.)
Candle to kerosene and candle 8 7 2
Kerosen and candle to car battery 10 13 6
Car battery to electric grid electricity 34 3 –10
Total: Candle to Grid Electricity CS 52 3 –4
Medium Expenditure (236.11–511.33 S/.)
Candle to kerosene and candle 14 12 4
Kerosene and candle to car battery 15 17 5
Car battery to electric grid electricity 51 4 –13
Total: Candle to Grid Electricity CS 79 4 –4
High Expenditure (>511.33 S/.)
Candle to kerosene and candle 23 18 8
Kerosene and candle to car battery 20 22 4
Car battery to electric grid electricity 88 5 –17
Total: Candle to Grid Electricity CS 132 5 –5
Source: INEI, 2005.
7134-CH05.pdf 48 7/27/10 6:55 AM

5 Benefi ts of Rural Electrifi cation
49
households enjoy much greater levels of lighting service, they also obtain a real income gain since their total expenditure on lighting service decreases. In the interest of using conservative assumptions, the economic analysis of the new rural electrifi cation approach has used the lower values of WTP, but the results suggest that actual returns may be greater.
Benefi ts of CommunicationsRadio and television are among the most important sources of communication and entertainment for rural households. Typically, after electric lighting, plug-in radio and television are the most common appliances in households with electricity. Without electricity, the cost to operate radio and/or television is extremely high, and the total hours listening to radio and viewing television tend to be relatively low or limited.
Television
Television viewing is one of the most desired aspects of electrifi cation. Almost 20 percent of households without electricity in rural Peru have a television set operated by car batteries, which requires signifi cant money and time (because battery recharging is often at considerable distance to the home). Television viewing (and particularly color TV) is a normal good, so it is possible to estimate the consumer surplus of
television viewing in a similar manner to household lighting. The survey fi nds that about 158,000 rural households without electricity in Peru—or about 12 percent of all rural households without electricity—are still using black-and-white (B&W) television. Table 5.9 shows the viewing hours and costs of the three main television types: B&W powered by car batteries, plug-in B&W, and plug-in color.
With these input assumptions, the total monthly benefi t of television viewing is estimated at 24.2 soles/month. Alternatively, the benefit associated with 212 viewing-hours per month of plug-in color television averages to 0.11 soles/viewing-hour. The net benefi t, namely, the increase in consumer surplus, is 14.7 soles/month.
These estimates of net benefi t may be overstated, because they include only the lower cost of electricity itself. The cost of acquiring a color television is signifi cantly greater than that of the black-and-white television that it replaces. Assuming a price difference of US$100 (cost of a new color television less the cost of selling the existing B&W television on the secondhand market), and assuming a fi ve-year life, the transition to color television translates into an additional cost of 0.0226 soles/viewing hour,16 or 5.17 soles per month. However, it should be kept in mind that this is the value of moving from using car batteries for watching television to using grid electricity. The benefi ts of television viewing for households without car batteries (that do not have television) would be higher.
Table 5.8Table 5.8
WTP per kWh (Alternate Method)
Low Medium High Avg
Net benefi t Soles/month 46.5 67.5 110.2 74.7
Expenditure Soles/month 3.0 4.0 5.0
Total WTP Soles/month 49.5 71.5 115.2
Average kWh kWh/month 6.82 10.00 10.42
Average price S/kWh 0.44 0.4 0.48
Average WTP S/kWh 7.26 7.15 11.05
$/kWh 2.25 2.21 3.42
Annual Net Benefi t S/year 558 810 1,322 897
$/year 173 251 409 278
Source: INEI, 2005.
7134-CH05.pdf 49 7/27/10 6:55 AM
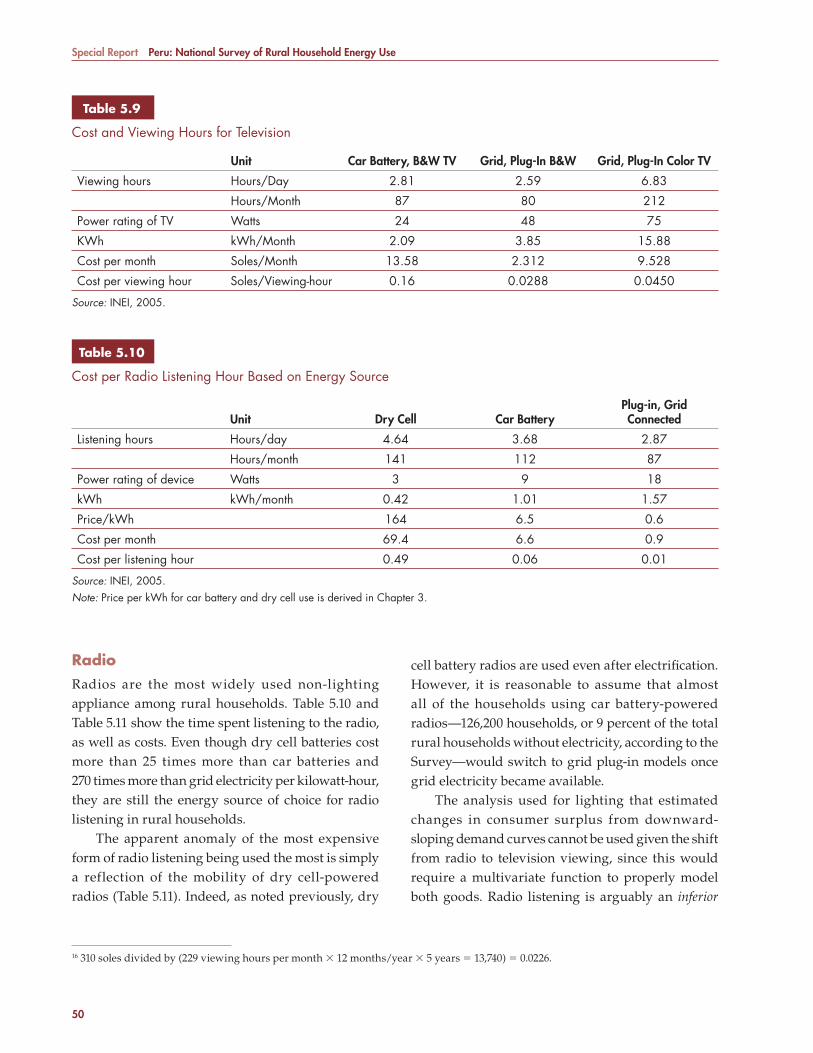
Special Report Peru: National Survey of Rural Household Energy Use
50
Radio Radios are the most widely used non-lighting appliance among rural households. Table 5.10 and Table 5.11 show the time spent listening to the radio, as well as costs. Even though dry cell batteries cost more than 25 times more than car batteries and 270 times more than grid electricity per kilowatt-hour, they are still the energy source of choice for radio listening in rural households.
The apparent anomaly of the most expensive form of radio listening being used the most is simply a reflection of the mobility of dry cell-powered radios (Table 5.11). Indeed, as noted previously, dry
cell battery radios are used even after electrifi cation. However, it is reasonable to assume that almost all of the households using car battery-powered radios—126,200 households, or 9 percent of the total rural households without electricity, according to the Survey—would switch to grid plug-in models once grid electricity became available.
The analysis used for lighting that estimated changes in consumer surplus from downward-sloping demand curves cannot be used given the shift from radio to television viewing, since this would require a multivariate function to properly model both goods. Radio listening is arguably an inferior
16 310 soles divided by (229 viewing hours per month � 12 months/year � 5 years � 13,740) � 0.0226.
Table 5.10Table 5.10
Cos t per Radio Listening Hour Based on Energy Source
Unit Dry Cell Car BatteryPlug-in, Grid Connected
Listening hours Hours/day 4.64 3.68 2.87
Hours/month 141 112 87
Power rating of device Watts 3 9 18
kWh kWh/month 0.42 1.01 1.57
Price/kWh 164 6.5 0.6
Cost per month 69.4 6.6 0.9
Cost per listening hour 0.49 0.06 0.01
Source: INEI, 2005.Note: Price per kWh for car battery and dry cell use is derived in Chapter 3.
Table 5.9Table 5.9
Cost and Viewing Hours for Television
Unit Car Battery, B&W TV Grid, Plug-In B&W Grid, Plug-In Color TV
Viewing hours Hours/Day 2.81 2.59 6.83
Hours/Month 87 80 212
Power rating of TV Watts 24 48 75
KWh kWh/Month 2.09 3.85 15.88
Cost per month Soles/Month 13.58 2.312 9.528
Cost per viewing hour Soles/Viewing-hour 0.16 0.0288 0.0450
Source: INEI, 2005.
7134-CH05.pdf 50 7/27/10 6:55 AM
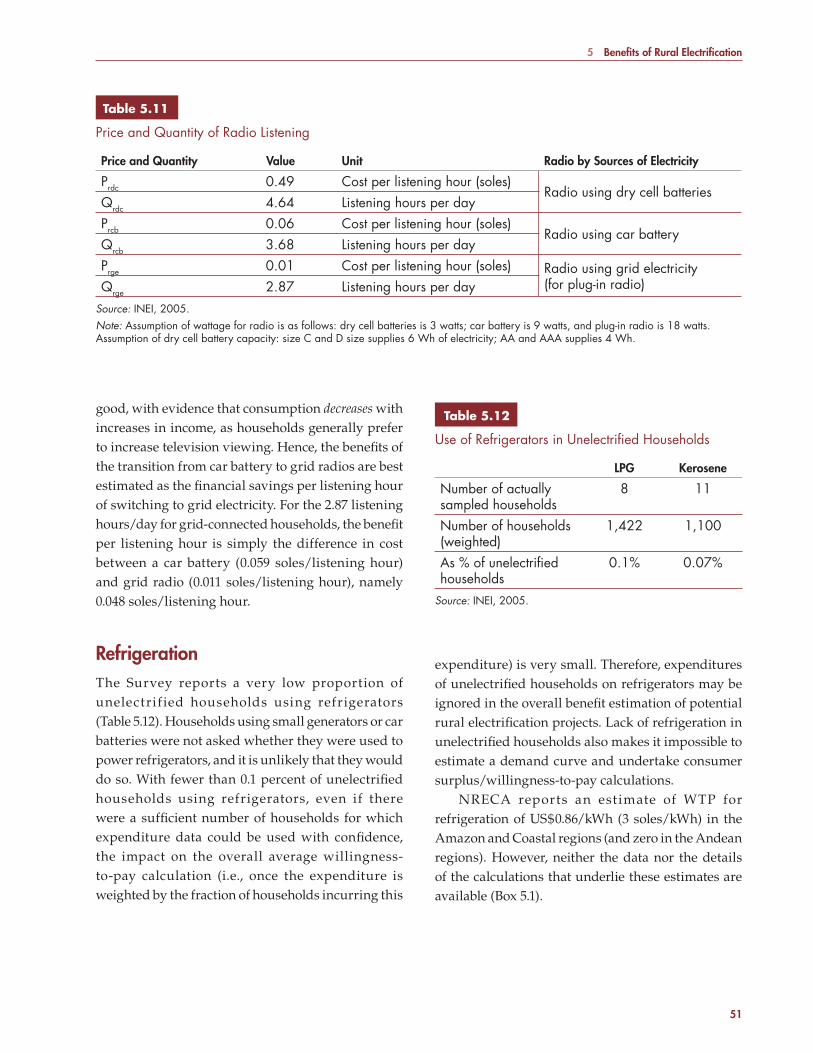
5 Benefi ts of Rural Electrifi cation
51
good, with evidence that consumption decreases with increases in income, as households generally prefer to increase television viewing. Hence, the benefi ts of the transition from car battery to grid radios are best estimated as the fi nancial savings per listening hour of switching to grid electricity. For the 2.87 listening hours/day for grid-connected households, the benefi t per listening hour is simply the difference in cost between a car battery (0.059 soles/listening hour) and grid radio (0.011 soles/listening hour), namely 0.048 soles/listening hour.
RefrigerationThe Survey reports a very low proportion of unelectrif ied households using refrigerators (Table 5.12). Households using small generators or car batteries were not asked whether they were used to power refrigerators, and it is unlikely that they would do so. With fewer than 0.1 percent of unelectrifi ed households using refrigerators, even if there were a suffi cient number of households for which expenditure data could be used with confi dence, the impact on the overall average willingness-to-pay calculation (i.e., once the expenditure is weighted by the fraction of households incurring this
expenditure) is very small. Therefore, expenditures of unelectrifi ed households on refrigerators may be ignored in the overall benefi t estimation of potential rural electrifi cation projects. Lack of refrigeration in unelectrifi ed households also makes it impossible to estimate a demand curve and undertake consumer surplus/willingness-to-pay calculations.
NRECA reports an est imate of WTP for refrigeration of US$0.86/kWh (3 soles/kWh) in the Amazon and Coastal regions (and zero in the Andean regions). However, neither the data nor the details of the calculations that underlie these estimates are available (Box 5.1).
Table 5.11Table 5.11
Price and Quantity of Radio Listening
Price and Quantity Value Unit Radio by Sources of Electricity
Prdc 0.49 Cost per listening hour (soles)Radio using dry cell batteries
Qrdc 4.64 Listening hours per dayPrcb 0.06 Cost per listening hour (soles)
Radio using car batteryQrcb 3.68 Listening hours per dayPrge 0.01 Cost per listening hour (soles) Radio using grid electricity
(for plug-in radio)Qrge 2.87 Listening hours per daySource: INEI, 2005. Note: Assumption of wattage for radio is as follows: dry cell batteries is 3 watts; car battery is 9 watts, and plug-in radio is 18 watts. Assumption of dry cell battery capacity: size C and D size supplies 6 Wh of electricity; AA and AAA supplies 4 Wh.
Table 5.12Table 5.12
Use o f Refrigerators in Unelectrifi ed Households
LPG Kerosene
Number of actually sampled households
8 11
Number of households (weighted)
1,422 1,100
As % of unelectrifi ed households
0.1% 0.07%
Source: INEI, 2005.
7134-CH05.pdf 51 7/27/10 6:55 AM
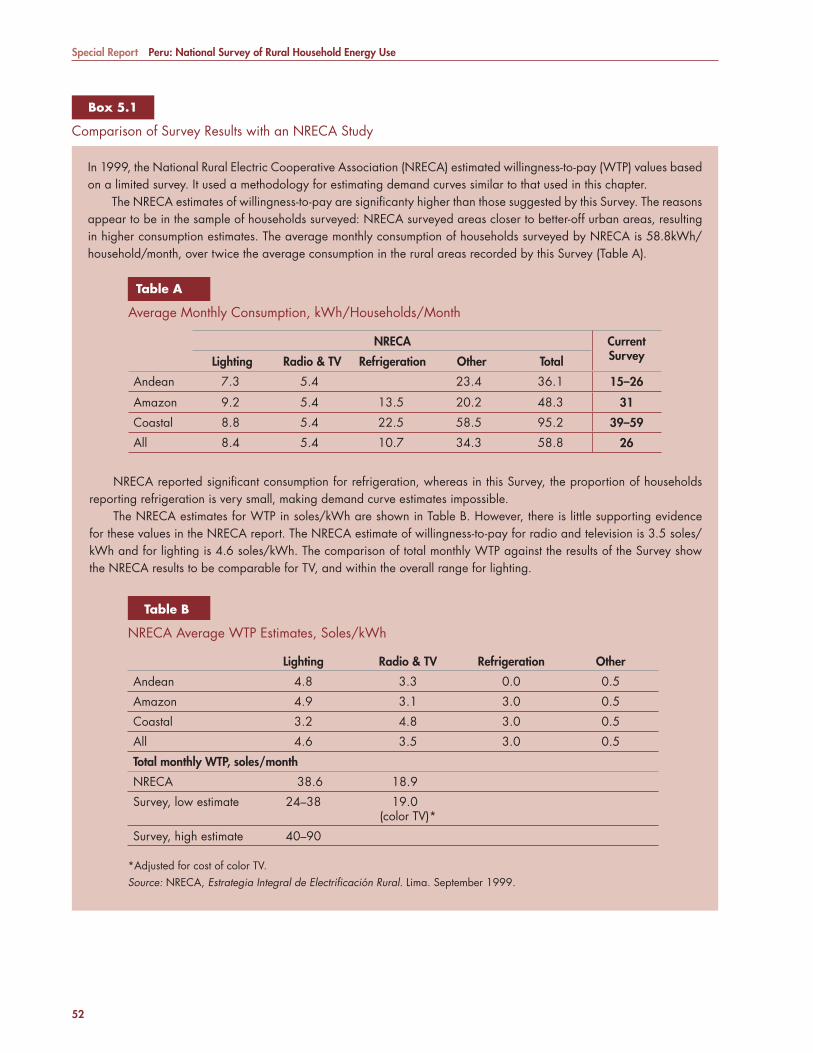
Special Report Peru: National Survey of Rural Household Energy Use
52
Box 5.1 Box 5.1
Compariso n of Survey Results with an NRECA Study
In 1999, the National Rural Electric Cooperative Association (NRECA) estimated willingness-to-pay (WTP) values based on a limited survey. It used a methodology for estimating demand curves similar to that used in this chapter. The NRECA estimates of willingness-to-pay are signifi canty higher than those suggested by this Survey. The reasons appear to be in the sample of households surveyed: NRECA surveyed areas closer to better-off urban areas, resulting in higher consumption estimates. The average monthly consumption of households surveyed by NRECA is 58.8kWh/household/month, over twice the average consumption in the rural areas recorded by this Survey (Table A).
Table ATable A
Average M onthly Consumption, kWh/Households/Month
NRECA Current SurveyLighting Radio & TV Refrigeration Other Total
Andean 7.3 5.4 23.4 36.1 15–26
Amazon 9.2 5.4 13.5 20.2 48.3 31
Coastal 8.8 5.4 22.5 58.5 95.2 39–59
All 8.4 5.4 10.7 34.3 58.8 26
Table BTable B
NRECA Ave rage WTP Estimates, Soles/kWh
Lighting Radio & TV Refrigeration Other
Andean 4.8 3.3 0.0 0.5
Amazon 4.9 3.1 3.0 0.5
Coastal 3.2 4.8 3.0 0.5
All 4.6 3.5 3.0 0.5
Total monthly WTP, soles/month
NRECA 38.6 18.9
Survey, low estimate 24–38 19.0(color TV)*
Survey, high estimate 40–90
*Adjusted for cost of color TV.Source: NRECA, Estrategia Integral de Electrifi cación Rural. Lima. September 1999.
NRECA reported signifi cant consumption for refrigeration, whereas in this Survey, the proportion of households reporting refrigeration is very small, making demand curve estimates impossible. The NRECA estimates for WTP in soles/kWh are shown in Table B. However, there is little supporting evidence for these values in the NRECA report. The NRECA estimate of willingness-to-pay for radio and television is 3.5 soles/kWh and for lighting is 4.6 soles/kWh. The comparison of total monthly WTP against the results of the Survey show the NRECA results to be comparable for TV, and within the overall range for lighting.
7134-CH05.pdf 52 7/27/10 6:55 AM

5 Benefi ts of Rural Electrifi cation
53
Benefi ts of Education and HealthThis section describes the indirect benefits of electrification, including education, health, and environmental benefi ts. Given the diffi culties noted previously, a formal quantifi cation of these benefi ts is not attempted. Indeed one of the major problems in such a quantification is double-counting: for example, it is likely that households internalize the benefi t associated with the reduction in kerosene lamp-related burn injuries to children in their WTP for electric lighting.
EducationEmpirical data on the indirect economic benefits of electrification for education are not as well documented as the direct economic benefits of education. It is clear that electricity extends evening lighting hours, making it easier for children to study, do homework, and read. The survey found that children aged 6 to 18 in households with electricity who are currently attending school spend an average of 65 minutes per night reading and/or studying, whereas in households without electricity, the fi gure is only 51 minutes (Table 5.13). The increase of 27 percent in reading/study time is statistically signifi cant. However, caution should be used when interpreting this result since the correlation could be due to a third variable, such as household income, and not necessarily demonstrate a causal relationship.
The survey shows that there is no difference in levels of school enrollment of children aged 6 to 12: almost all children aged 6 to 12 are reported to be attending school regardless of their home electrifi cation status. This appears to confi rm that the educational campaign in Peru during the past decade is working. Undoubtedly, electrifi cation will reinforce this success and make it sustainable, since it is reasonable to assume that electrifi cation gives children more fl exibility in choosing when to do schoolwork. Empirical evidence elsewhere has also shown that children who are doing well at school or can keep up with their peers are more likely to stay in school longer than those who do not do well at school. Similarly, electricity enables schools to be equipped
with modern teaching equipment and information and communication technologies, especially access to the Internet.
Unlike at the primary school level, school enrollment at the secondary level is signifi cantly higher for households with a grid electricity connection. The survey reveals that school enrollment of children aged 13 to 18 from households with a grid connection is about 82 percent, which is 20 percent higher than in households without electricity (Table 5.14). Thus, there is strong evidence that having electricity in rural households involves educational benefi ts. There is a strong likelihood that these educational benefi ts are already quantifi ed as part of the consumer surplus for household lighting. As a consequence, we do not make an attempt to quantify those benefi ts for this chapter.
Table 5.13 Table 5.13
Averag e Number of Hours per Night Household Members Read/Study (Weighted)
No Grid Access
Grid Access
Children Aged 6 to 18 Attending School Read/Study (Hours/Night)
0.86 1.09
Number of households 750,283 496,154
All Household Members Read (Hours/Night)
0.33 0.47
Number of households 1,339,829 845,03
Source: INEI, 2005.
Table 5.14Table 5.14
Percent age of Children in the Household Attending School (Weighted)
Without Grid Access Grid Access
Children 6 to 12 Years Old
93.6% 92%
Population 415,112 695,010
Children 13 to 18 Years Old
62% 82%
Population 517,277 326,547
Source: INEI, 2005.
7134-CH05.pdf 53 7/27/10 6:55 AM
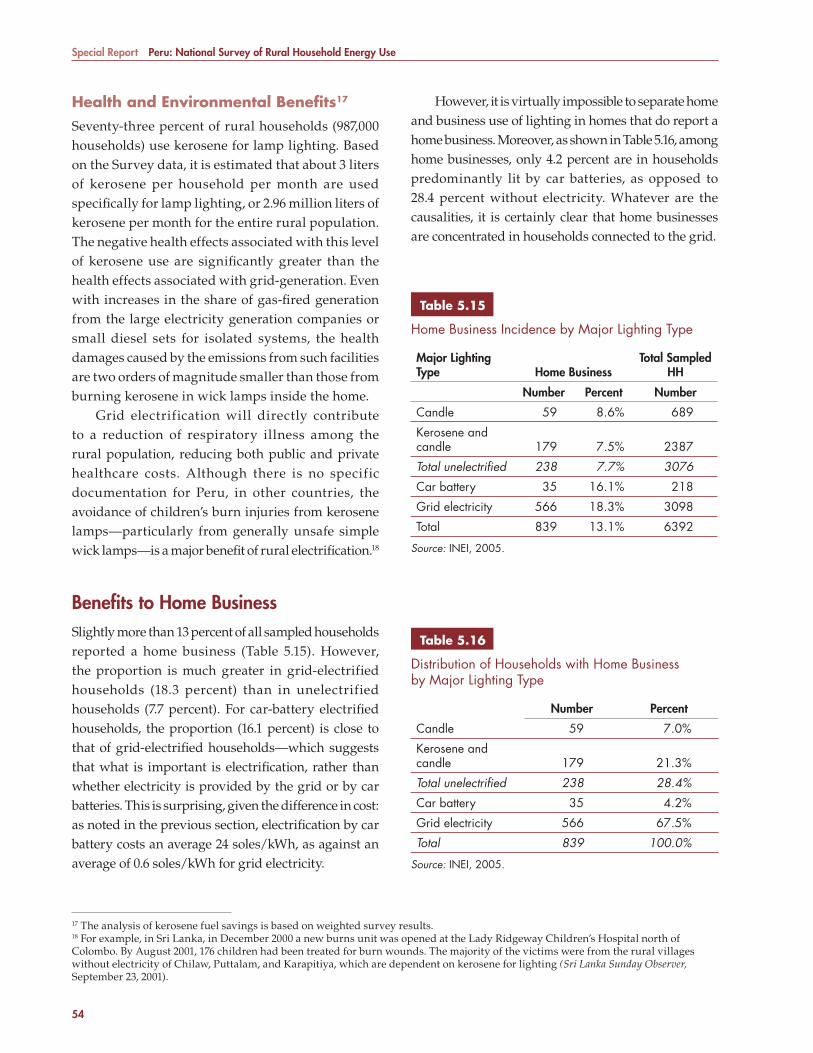
Special Report Peru: National Survey of Rural Household Energy Use
54
Health and Environmental Benefi ts17
Seventy-three percent of rural households (987,000 households) use kerosene for lamp lighting. Based on the Survey data, it is estimated that about 3 liters of kerosene per household per month are used specifi cally for lamp lighting, or 2.96 million liters of kerosene per month for the entire rural population. The negative health effects associated with this level of kerosene use are signifi cantly greater than the health effects associated with grid-generation. Even with increases in the share of gas-fi red generation from the large electricity generation companies or small diesel sets for isolated systems, the health damages caused by the emissions from such facilities are two orders of magnitude smaller than those from burning kerosene in wick lamps inside the home.
Grid electrification will directly contribute to a reduction of respiratory illness among the rural population, reducing both public and private healthcare costs. Although there is no specific documentation for Peru, in other countries, the avoidance of children’s burn injuries from kerosene lamps—particularly from generally unsafe simple wick lamps—is a major benefi t of rural electrifi cation.18
Benefi ts to Home BusinessSlightly more than 13 percent of all sampled households reported a home business (Table 5.15). However, the proportion is much greater in grid-electrified households (18.3 percent) than in unelectrified households (7.7 percent). For car-battery electrifi ed households, the proportion (16.1 percent) is close to that of grid-electrifi ed households—which suggests that what is important is electrifi cation, rather than whether electricity is provided by the grid or by car batteries. This is surprising, given the difference in cost: as noted in the previous section, electrifi cation by car battery costs an average 24 soles/kWh, as against an average of 0.6 soles/kWh for grid electricity.
However, it is virtually impossible to separate home and business use of lighting in homes that do report a home business. Moreover, as shown in Table 5.16, among home businesses, only 4.2 percent are in households predominantly lit by car batteries, as opposed to 28.4 percent without electricity. Whatever are the causalities, it is certainly clear that home businesses are concentrated in households connected to the grid.
Table 5.15Table 5.15
Home Busi ness Incidence by Major Lighting Type
Major Lighting Type Home Business
Total Sampled HH
Number Percent Number
Candle 59 8.6% 689
Kerosene and candle 179 7.5% 2387
Total unelectrifi ed 238 7.7% 3076
Car battery 35 16.1% 218
Grid electricity 566 18.3% 3098
Total 839 13.1% 6392
Source: INEI, 2005.
Table 5.16Table 5.16
Distributi on of Households with Home Business by Major Lighting Type
Number Percent
Candle 59 7.0%
Kerosene and candle 179 21.3%
Total unelectrifi ed 238 28.4%
Car battery 35 4.2%
Grid electricity 566 67.5%
Total 839 100.0%
Source: INEI, 2005.
17 The analysis of kerosene fuel savings is based on weighted survey results.18 For example, in Sri Lanka, in December 2000 a new burns unit was opened at the Lady Ridgeway Children’s Hospital north of Colombo. By August 2001, 176 children had been treated for burn wounds. The majority of the victims were from the rural villages without electricity of Chilaw, Puttalam, and Karapitiya, which are dependent on kerosene for lighting (Sri Lanka Sunday Observer, September 23, 2001).
7134-CH05.pdf 54 7/27/10 6:55 AM
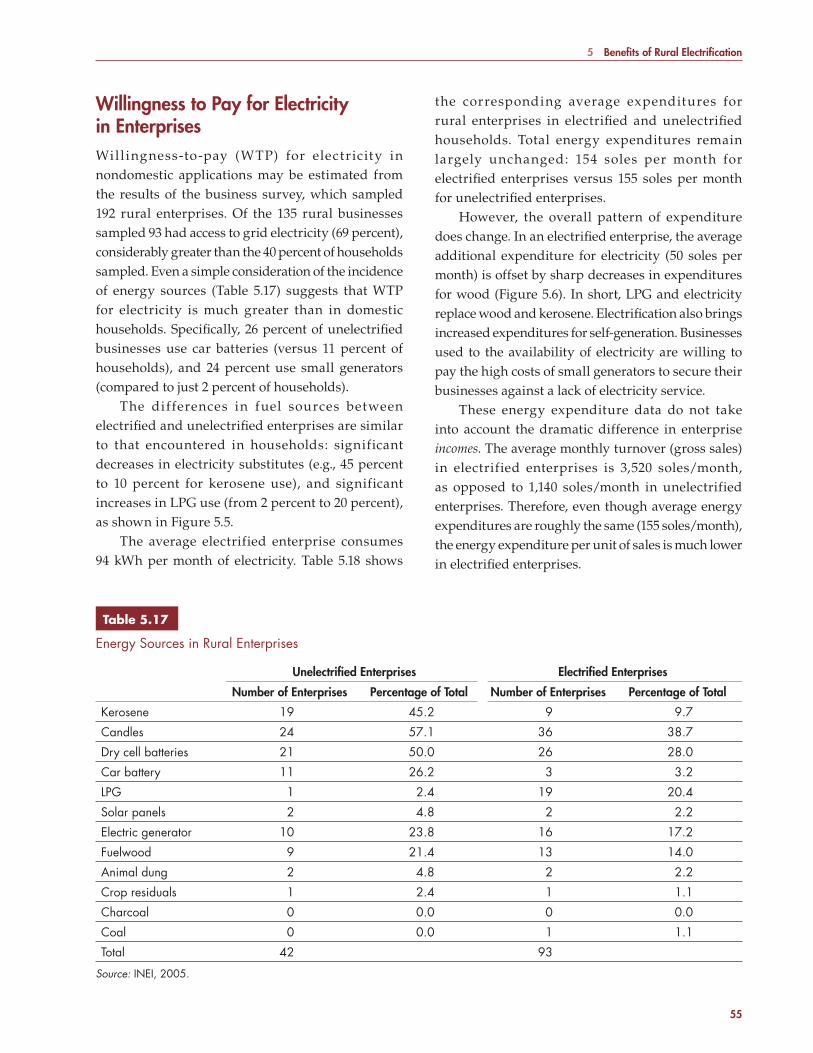
5 Benefi ts of Rural Electrifi cation
55
Willingness to Pay for Electricity in EnterprisesWill ingness-to-pay (WTP) for electr icity in nondomestic applications may be estimated from the results of the business survey, which sampled 192 rural enterprises. Of the 135 rural businesses sampled 93 had access to grid electricity (69 percent), considerably greater than the 40 percent of households sampled. Even a simple consideration of the incidence of energy sources (Table 5.17) suggests that WTP for electricity is much greater than in domestic households. Specifi cally, 26 percent of unelectrifi ed businesses use car batteries (versus 11 percent of households), and 24 percent use small generators (compared to just 2 percent of households).
The differences in fuel sources between electrifi ed and unelectrifi ed enterprises are similar to that encountered in households: significant decreases in electricity substitutes (e.g., 45 percent to 10 percent for kerosene use), and significant increases in LPG use (from 2 percent to 20 percent), as shown in Figure 5.5.
The average electrified enterprise consumes 94 kWh per month of electricity. Table 5.18 shows
the corresponding average expenditures for rural enterprises in electrifi ed and unelectrifi ed households. Total energy expenditures remain largely unchanged: 154 soles per month for electrifi ed enterprises versus 155 soles per month for unelectrifi ed enterprises.
However, the overall pattern of expenditure does change. In an electrifi ed enterprise, the average additional expenditure for electricity (50 soles per month) is offset by sharp decreases in expenditures for wood (Figure 5.6). In short, LPG and electricity replace wood and kerosene. Electrifi cation also brings increased expenditures for self-generation. Businesses used to the availability of electricity are willing to pay the high costs of small generators to secure their businesses against a lack of electricity service.
These energy expenditure data do not take into account the dramatic difference in enterprise incomes. The average monthly turnover (gross sales) in electrified enterprises is 3,520 soles/month, as opposed to 1,140 soles/month in unelectrified enterprises. Therefore, even though average energy expenditures are roughly the same (155 soles/month), the energy expenditure per unit of sales is much lower in electrifi ed enterprises.
Table 5.17Table 5.17
Energy Sourc es in Rural Enterprises
Unelectrifi ed Enterprises Electrifi ed Enterprises
Number of Enterprises Percentage of Total Number of Enterprises Percentage of Total
Kerosene 19 45.2 9 9.7
Candles 24 57.1 36 38.7
Dry cell batteries 21 50.0 26 28.0
Car battery 11 26.2 3 3.2
LPG 1 2.4 19 20.4
Solar panels 2 4.8 2 2.2
Electric generator 10 23.8 16 17.2
Fuelwood 9 21.4 13 14.0
Animal dung 2 4.8 2 2.2
Crop residuals 1 2.4 1 1.1
Charcoal 0 0.0 0 0.0
Coal 0 0.0 1 1.1
Total 42 93
Source: INEI, 2005.
7134-CH05.pdf 55 7/27/10 6:55 AM
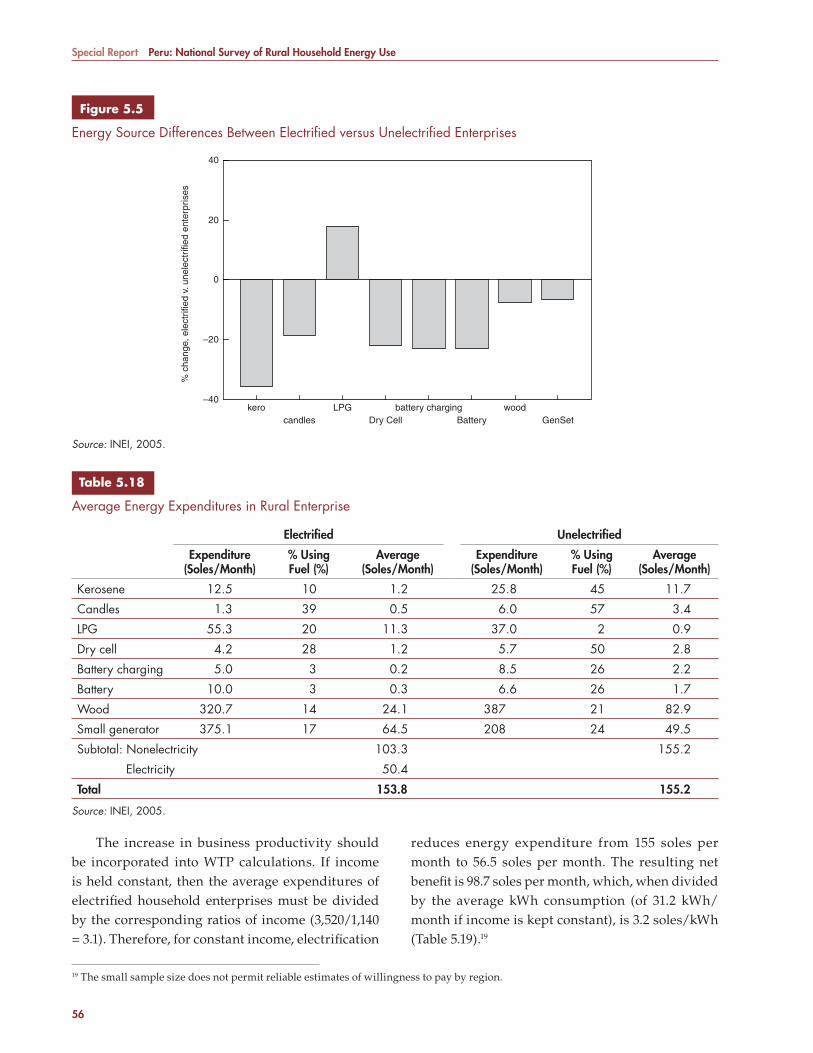
Special Report Peru: National Survey of Rural Household Energy Use
56
The increase in business productivity should be incorporated into WTP calculations. If income is held constant, then the average expenditures of electrifi ed household enterprises must be divided by the corresponding ratios of income (3,520/1,140 = 3.1). Therefore, for constant income, electrifi cation
reduces energy expenditure from 155 soles per month to 56.5 soles per month. The resulting net benefi t is 98.7 soles per month, which, when divided by the average kWh consumption (of 31.2 kWh/month if income is kept constant), is 3.2 soles/kWh (Table 5.19).19
Source: INEI, 2005.
–40
–20
0
20
40
kerocandles
LPGDry Cell
battery chargingBattery
woodGenSet
% c
hang
e, e
lect
rifie
d v.
une
lect
rifie
d en
terp
rises
Figure 5.5Figure 5.5
Energy Source Differences Between Electrifi ed versus Unelectrifi ed Enterprises
Table 5.18Table 5.18
Average Energy Expenditures in Rural Enterprise
Electrifi ed Unelectrifi ed
Expenditure (Soles/Month)
% Using Fuel (%)
Average (Soles/Month)
Expenditure (Soles/Month)
% Using Fuel (%)
Average (Soles/Month)
Kerosene 12.5 10 1.2 25.8 45 11.7
Candles 1.3 39 0.5 6.0 57 3.4
LPG 55.3 20 11.3 37.0 2 0.9
Dry cell 4.2 28 1.2 5.7 50 2.8
Battery charging 5.0 3 0.2 8.5 26 2.2
Battery 10.0 3 0.3 6.6 26 1.7
Wood 320.7 14 24.1 387 21 82.9
Small generator 375.1 17 64.5 208 24 49.5
Subtotal: Nonelectricity 103.3 155.2
Electricity 50.4
Total 153.8 155.2
Source: INEI, 2005.
19 The small sample size does not permit reliable estimates of willingness to pay by region.
7134-CH05.pdf 56 7/27/10 6:55 AM

5 Benefi ts of Rural Electrifi cation
57
Source: INEI, 2005.
Sol
es/m
onth
60
40
20
0
–20–10.5
–2.9
KeroseneCandles
LPGDry Cell
Battery chargingBattery
WoodGenSet
Electricity
–1.6 –2.0 –1.4
–58.8
10.415.0
50.4
–40
–60
–80
Figure 5.6Figure 5.6
Change in Monthl y Expenditure with Electrifi cation
Table 5.19Table 5.19
Enterprise Willin gness to Pay for Electricity
Electrifi ed Unelectrifi ed
Expenditure (Soles/ Month)
% Using Fuel
Average (Soles/ Month)
Income Adjusted Average
(Soles/Month)
Expenditure (Soles/ Month)
% Using Fuel
Average (Soles/ Month)
Kerosene 12.5 10 1.2 0.4 25.8 45 11.7
Candles 1.3 39 0.5 0.2 6.0 57 3.4LPG 55.3 20 11.3 3.7 37.0 2 0.9Dry cell 4.2 28 1.2 0.4 5.7 50 2.8Battery charging 5.0 3 0.2 0.1 8.5 26 2.2Battery 10.0 3 0.3 0.1 6.6 26 1.7Wood 320.7 14 44.8 14.5 387 21 82.9Small generator 375.1 17 64.5 20.9 208 24 49.5Subtotal: Nonelectricity 124.0 40.2 155.2 Electricity 50.4 16.3Total 174.5 56.5 155
Minus Electrifi ed Average –56.5Net Benefi t 98.7
KWh 93.6 31.2 31.2WTP, Soles/kWh 3.2
Source: INEI, 2005.
7134-CH05.pdf 57 7/27/10 6:55 AM
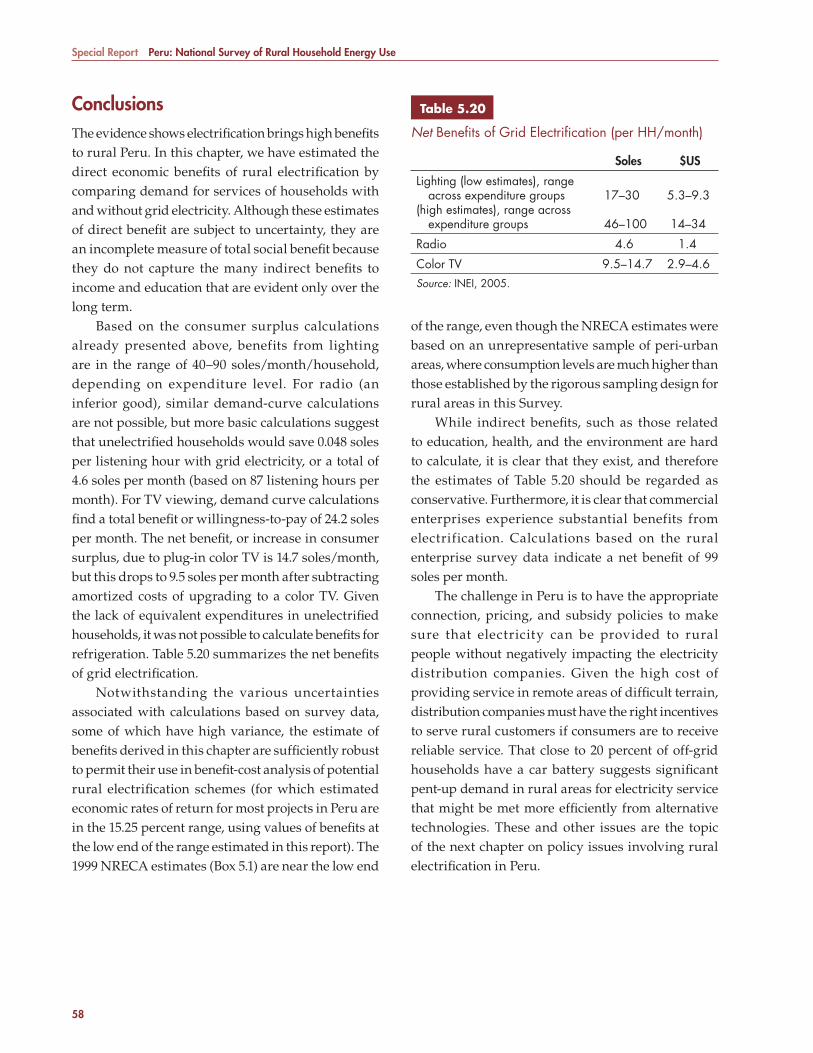
Special Report Peru: National Survey of Rural Household Energy Use
58
ConclusionsThe evidence shows electrifi cation brings high benefi ts to rural Peru. In this chapter, we have estimated the direct economic benefi ts of rural electrifi cation by comparing demand for services of households with and without grid electricity. Although these estimates of direct benefi t are subject to uncertainty, they are an incomplete measure of total social benefi t because they do not capture the many indirect benefi ts to income and education that are evident only over the long term.
Based on the consumer surplus calculations already presented above, benefits from lighting are in the range of 40–90 soles/month/household, depending on expenditure level. For radio (an inferior good), similar demand-curve calculations are not possible, but more basic calculations suggest that unelectrifi ed households would save 0.048 soles per listening hour with grid electricity, or a total of 4.6 soles per month (based on 87 listening hours per month). For TV viewing, demand curve calculations fi nd a total benefi t or willingness-to-pay of 24.2 soles per month. The net benefi t, or increase in consumer surplus, due to plug-in color TV is 14.7 soles/month, but this drops to 9.5 soles per month after subtracting amortized costs of upgrading to a color TV. Given the lack of equivalent expenditures in unelectrifi ed households, it was not possible to calculate benefi ts for refrigeration. Table 5.20 summarizes the net benefi ts of grid electrifi cation.
Notwithstanding the various uncertainties associated with calculations based on survey data, some of which have high variance, the estimate of benefi ts derived in this chapter are suffi ciently robust to permit their use in benefi t-cost analysis of potential rural electrifi cation schemes (for which estimated economic rates of return for most projects in Peru are in the 15.25 percent range, using values of benefi ts at the low end of the range estimated in this report). The 1999 NRECA estimates (Box 5.1) are near the low end
of the range, even though the NRECA estimates were based on an unrepresentative sample of peri-urban areas, where consumption levels are much higher than those established by the rigorous sampling design for rural areas in this Survey.
While indirect benefi ts, such as those related to education, health, and the environment are hard to calculate, it is clear that they exist, and therefore the estimates of Table 5.20 should be regarded as conservative. Furthermore, it is clear that commercial enterprises experience substantial benefits from electrification. Calculations based on the rural enterprise survey data indicate a net benefi t of 99 soles per month.
The challenge in Peru is to have the appropriate connection, pricing, and subsidy policies to make sure that electricity can be provided to rural people without negatively impacting the electricity distribution companies. Given the high cost of providing service in remote areas of diffi cult terrain, distribution companies must have the right incentives to serve rural customers if consumers are to receive reliable service. That close to 20 percent of off-grid households have a car battery suggests signifi cant pent-up demand in rural areas for electricity service that might be met more effi ciently from alternative technologies. These and other issues are the topic of the next chapter on policy issues involving rural electrifi cation in Peru.
Table 5.20Table 5.20
Net Benefi ts of Gr id Electrifi cation (per HH/month)
Soles $US
Lighting (low estimates), range across expenditure groups (high estimates), range across expenditure groups
17–30
46–100
5.3–9.3
14–34
Radio 4.6 1.4
Color TV 9.5 –14.7 2.9–4.6Source: INEI, 2005.
7134-CH05.pdf 58 7/27/10 6:55 AM

59
6 Policy Implications of Survey Results
This chapter uses data from the Survey to consider policy issues relevant to rural electrifi cation programs. First, the chapter examines connection rates in electrifi ed villages and reasons why over 20 percent of households in electrifi ed villages do not have grid connections. Next, the breakdown of average village electricity consumption is considered. Estimated growth in rural electricity consumption is also examined, since this can be important when making fi nancial feasibility assumptions for potential new projects as well as generation requirement projections. Pricing policy is discussed, with a special focus on the targeting performance of the social subsidy through the Fondo de Compensación Social Eléctrica (FOSE). The chapter concludes with a brief discussion of effi cient lighting programs and the rate of return of replacing incandescent light bulbs with compact fl uorescent lamps (CFLs).
Co nnection Rates in Electrifi ed Villages Connection rates and average consumption at the village level are critical variables in the design of rural electrifi cation projects. The fi nancial viability of a rural electrifi cation scheme depends on the ability of the tariff to generate suffi cient revenue to cover operations and maintenance (O&M) and energy purchases, which in turn is a function of how many households in a village actually connect to the grid if extended, and the average level of consumption of the connected households (World Bank 2005b).
The Survey sampled 764 villages and an average of about 9 households per village. If an electrifi ed village is defined as one where at least one of the sampled households is connected, then 374, or
48.9 percent of villages, may be considered electrifi ed. In only 30 percent of villages are 100 percent of households actually connected. There is very little variation in connection rates within electrified villages across regions (Table 6.1), although the village electrifi cation rate varies from a low of 26 percent in the Amazon region to a high of 71 percent in the Coastal Central region.
Of the 3,378 households surveyed that are without electricity, 727, or 21.5 percent, are in villages that are electrifi ed. In other words, almost one-quarter of households that have no grid connection are in villages that are electrifi ed. This is a high rate of nonconnection that has important implications for future rural electrifi cation projects.
There are signifi cant differences in explanations given for having no access between households in electrifi ed villages and households in unelectrifi ed vi l lages (Table 6.2) . In electr i f ied vi l lages, 44 percent of respondents stated that they could not pay the connection fee, versus 10 percent in unelectrified villages. In electrified villages, 35 percent of respondents considered the costs of house wiring to be a constraint, while 28 percent stated that they could not pay the monthly bill; equivalent numbers in unelectrifi ed villages were 8 percent for house wiring and 7 percent for the monthly bill.
This confi rms the widely held view that the upfront costs of connection, wiring, and equipment represent the predominant constraint to connection. The fi nancial sustainability of projects is strongly infl uenced by having as many households connect as possible, from which follows that connection costs, perhaps including house-wiring, should be included as part of the overall cost eligible for subsidy.
7134-CH06.pdf 59 7/27/10 6:56 AM
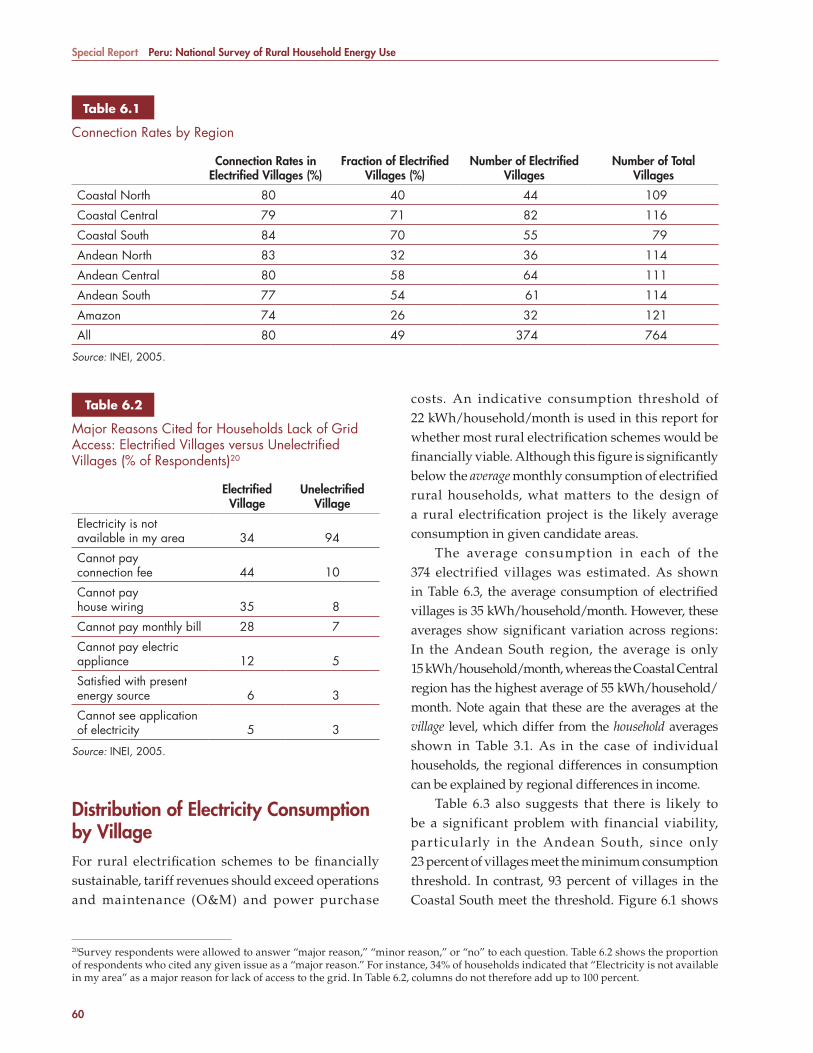
Special Report Peru: National Survey of Rural Household Energy Use
60
Dist ribution of Electricity Consumption by VillageFor rural electrifi cation schemes to be fi nancially sustainable, tariff revenues should exceed operations and maintenance (O&M) and power purchase
costs. An indicative consumption threshold of 22 kWh/household/month is used in this report for whether most rural electrifi cation schemes would be fi nancially viable. Although this fi gure is signifi cantly below the average monthly consumption of electrifi ed rural households, what matters to the design of a rural electrifi cation project is the likely average consumption in given candidate areas.
The average consumption in each of the 374 electrified villages was estimated. As shown in Table 6.3, the average consumption of electrifi ed villages is 35 kWh/household/month. However, these averages show significant variation across regions: In the Andean South region, the average is only 15 kWh/household/month, whereas the Coastal Central region has the highest average of 55 kWh/household/month. Note again that these are the averages at the village level, which differ from the household averages shown in Table 3.1. As in the case of individual households, the regional differences in consumption can be explained by regional differences in income.
Table 6.3 also suggests that there is likely to be a significant problem with financial viability, particularly in the Andean South, since only 23 percent of villages meet the minimum consumption threshold. In contrast, 93 percent of villages in the Coastal South meet the threshold. Figure 6.1 shows
20Survey respondents were allowed to answer “major reason,” “minor reason,” or “no” to each question. Table 6.2 shows the proportion of respondents who cited any given issue as a “major reason.” For instance, 34% of households indicated that “Electricity is not available in my area” as a major reason for lack of access to the grid. In Table 6.2, columns do not therefore add up to 100 percent.
Table 6.1Table 6.1
Connection Rates by Region
Connection Rates in
Electrifi ed Villages (%)Fraction of Electrifi ed
Villages (%)Number of Electrifi ed
VillagesNumber of Total
Villages
Coastal North 80 40 44 109
Coastal Central 79 71 82 116
Coastal South 84 70 55 79
Andean North 83 32 36 114
Andean Central 80 58 64 111
Andean South 77 54 61 114
Amazon 74 26 32 121
All 80 49 374 764
Source: INEI, 2005.
Table 6.2Table 6.2
Major Reasons Cited for Households Lack of Grid Access: Electrifi ed Villages versus Unelectrifi ed Villages (% of Respondents)20
Electrifi ed Village
Unelectrifi ed Village
Electricity is not available in my area 34 94
Cannot pay connection fee 44 10
Cannot pay house wiring 35 8
Cannot pay monthly bill 28 7
Cannot pay electric appliance 12 5
Satisfi ed with present energy source 6 3
Cannot see application of electricity 5 3
Source: INEI, 2005.
7134-CH06.pdf 60 7/27/10 6:56 AM
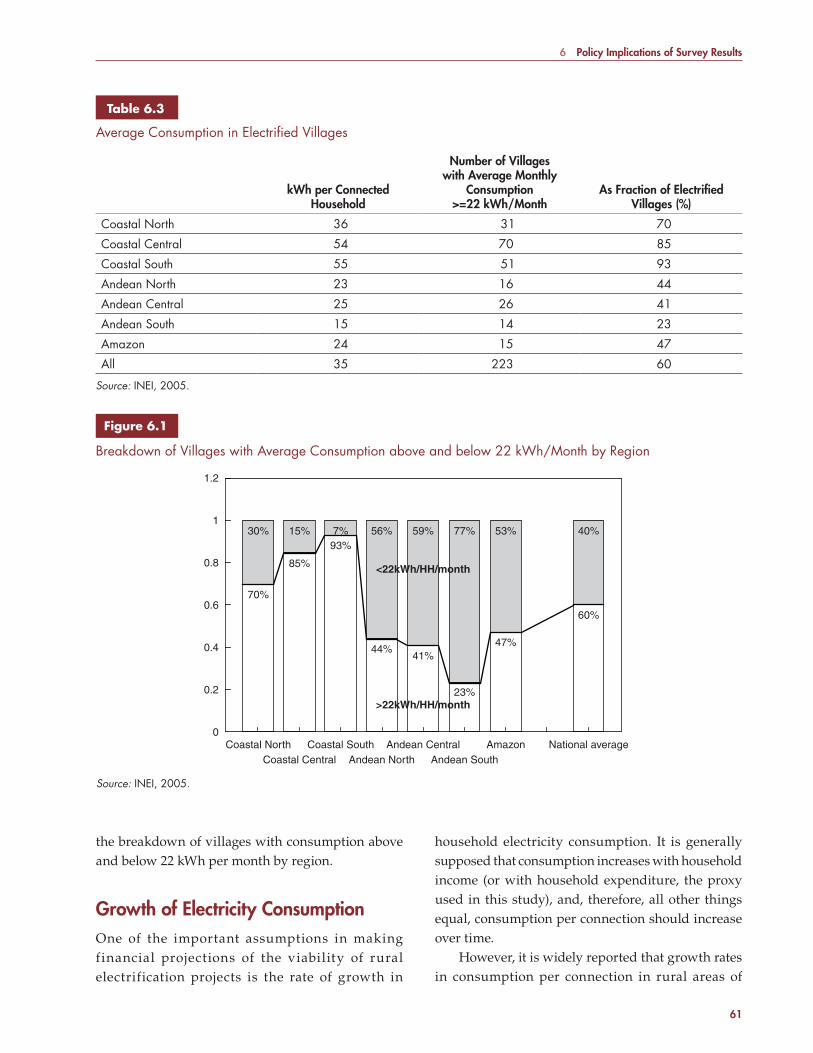
6 Policy Implications of Survey Results
61
household electricity consumption. It is generally supposed that consumption increases with household income (or with household expenditure, the proxy used in this study), and, therefore, all other things equal, consumption per connection should increase over time.
However, it is widely reported that growth rates in consumption per connection in rural areas of
the breakdown of villages with consumption above and below 22 kWh per month by region.
Growth of Electricity ConsumptionOne of the important assumptions in making financial projections of the viability of rural electrification projects is the rate of growth in
Table 6.3Table 6.3
Average Consumption in Electrifi ed Villages
kWh per Connected
Household
Number of Villages with Average Monthly
Consumption >=22 kWh/Month
As Fraction of Electrifi ed Villages (%)
Coastal North 36 31 70
Coastal Central 54 70 85
Coastal South 55 51 93
Andean North 23 16 44
Andean Central 25 26 41
Andean South 15 14 23
Amazon 24 15 47
All 35 223 60
Source: INEI, 2005.
Source: INEI, 2005.
1.2
1
0.8
0.6
0.4
0.2
0Coastal North
70%
30%
85%
15%93%7%
44%
56%
41%
59%
23%
77%
47%
53%
60%
40%
Coastal CentralCoastal South
Andean NorthAndean Central
>22kWh/HH/month
<22kWh/HH/month
Andean SouthAmazon National average
Figure 6.1 Figure 6.1
Breakdown of Villages with Average Consumption above and below 22 kWh/Month by Region
7134-CH06.pdf 61 7/27/10 6:56 AM
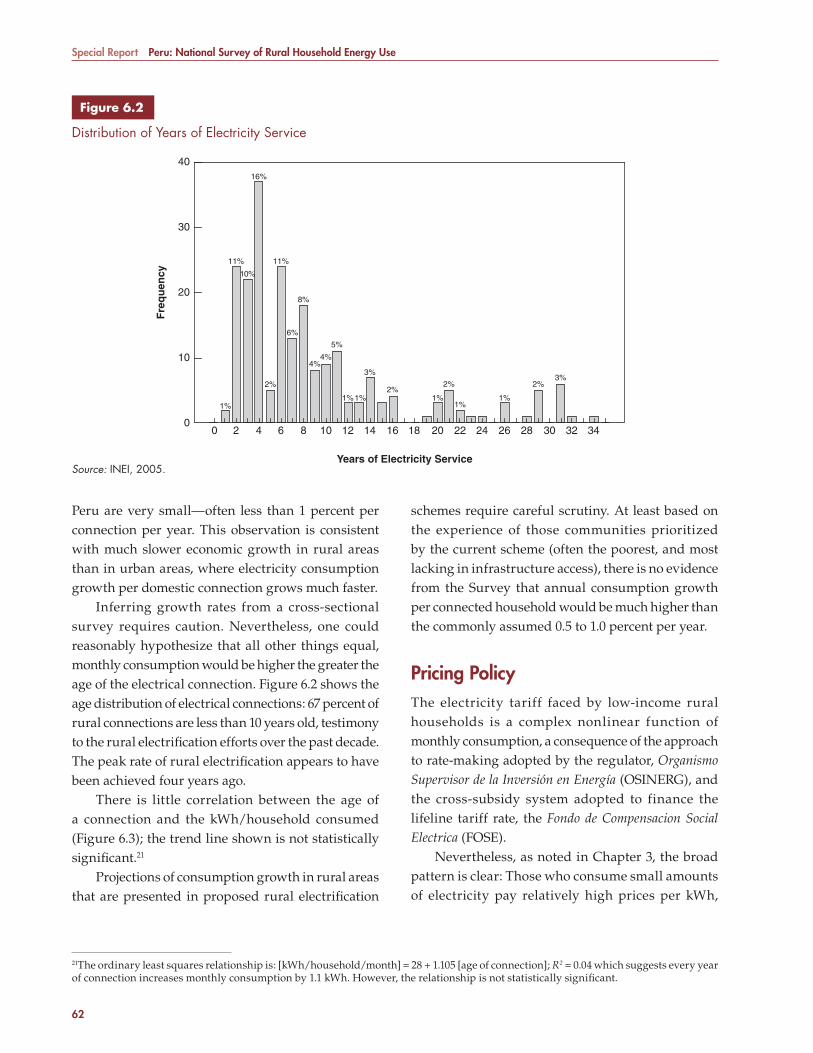
Special Report Peru: National Survey of Rural Household Energy Use
62
schemes require careful scrutiny. At least based on the experience of those communities prioritized by the current scheme (often the poorest, and most lacking in infrastructure access), there is no evidence from the Survey that annual consumption growth per connected household would be much higher than the commonly assumed 0.5 to 1.0 percent per year.
Pricing P olicy The electricity tariff faced by low-income rural households is a complex nonlinear function of monthly consumption, a consequence of the approach to rate-making adopted by the regulator, Organismo Supervisor de la Inversión en Energía (OSINERG), and the cross-subsidy system adopted to finance the lifeline tariff rate, the Fondo de Compensacion Social Electrica (FOSE).
Nevertheless, as noted in Chapter 3, the broad pattern is clear: Those who consume small amounts of electricity pay relatively high prices per kWh,
Peru are very small—often less than 1 percent per connection per year. This observation is consistent with much slower economic growth in rural areas than in urban areas, where electricity consumption growth per domestic connection grows much faster.
Inferring growth rates from a cross-sectional survey requires caution. Nevertheless, one could reasonably hypothesize that all other things equal, monthly consumption would be higher the greater the age of the electrical connection. Figure 6.2 shows the age distribution of electrical connections: 67 percent of rural connections are less than 10 years old, testimony to the rural electrifi cation efforts over the past decade. The peak rate of rural electrifi cation appears to have been achieved four years ago.
There is little correlation between the age of a connection and the kWh/household consumed (Figure 6.3); the trend line shown is not statistically signifi cant.21
Projections of consumption growth in rural areas that are presented in proposed rural electrifi cation
21The ordinary least squares relationship is: [kWh/household/month] = 28 + 1.105 [age of connection]; R2 = 0.04 which suggests every year of connection increases monthly consumption by 1.1 kWh. However, the relationship is not statistically signifi cant.
40
30
20
10
00
1%1%1% 1% 1%
1%
3%3%
11% 11%
2%2%
2% 2%
6%
8%
4%4%
5%
16%
10%
2 4 6 8 10 12 14 16 18
Years of Electricity Service
Fre
qu
ency
20 22 24 26 28 30 32 34
Figure 6.2 Figure 6.2
Distribution of Years of Electricity Service
Source: INEI, 2005.
7134-CH06.pdf 62 7/27/10 6:56 AM
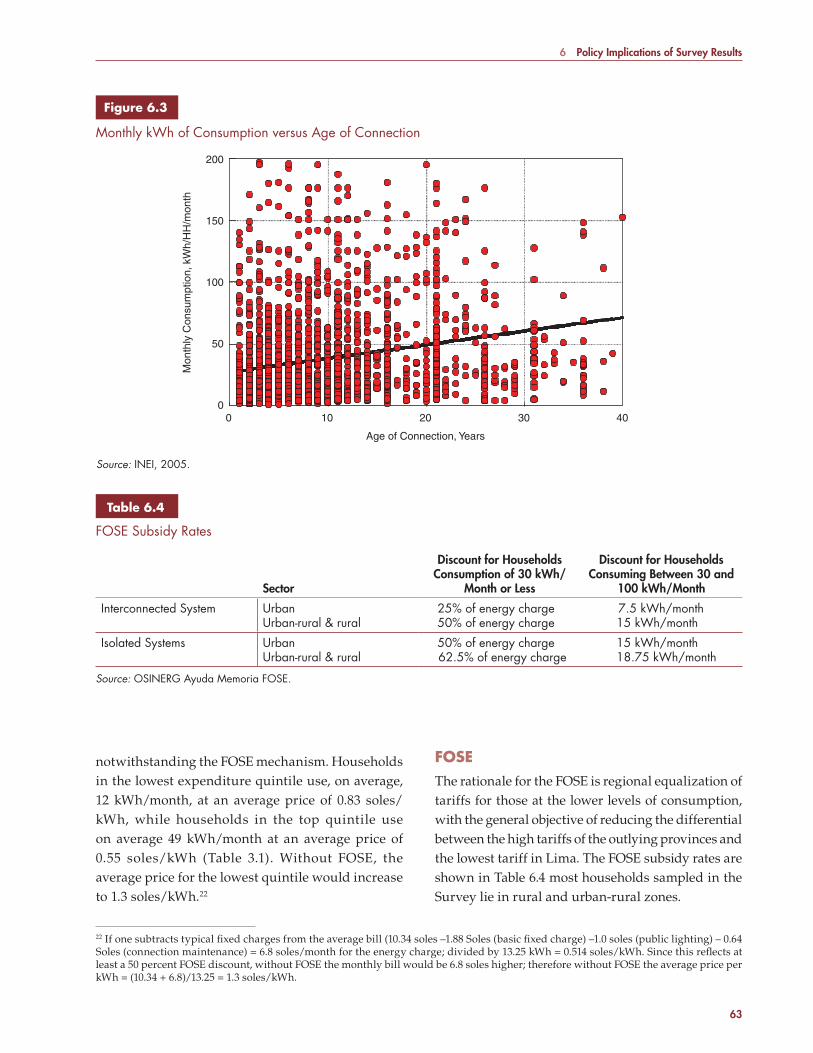
6 Policy Implications of Survey Results
63
FOSEThe rationale for the FOSE is regional equalization of tariffs for those at the lower levels of consumption, with the general objective of reducing the differential between the high tariffs of the outlying provinces and the lowest tariff in Lima. The FOSE subsidy rates are shown in Table 6.4 most households sampled in the Survey lie in rural and urban-rural zones.
notwithstanding the FOSE mechanism. Households in the lowest expenditure quintile use, on average, 12 kWh/month, at an average price of 0.83 soles/kWh, while households in the top quintile use on average 49 kWh/month at an average price of 0.55 soles/kWh (Table 3.1). Without FOSE, the average price for the lowest quintile would increase to 1.3 soles/kWh.22
22 If one subtracts typical fi xed charges from the average bill (10.34 soles –1.88 Soles (basic fi xed charge) –1.0 soles (public lighting) – 0.64 Soles (connection maintenance) = 6.8 soles/month for the energy charge; divided by 13.25 kWh = 0.514 soles/kWh. Since this refl ects at least a 50 percent FOSE discount, without FOSE the monthly bill would be 6.8 soles higher; therefore without FOSE the average price per kWh = (10.34 + 6.8)/13.25 = 1.3 soles/kWh.
Source: INEI, 2005.
200
150
100
Mon
thly
Con
sum
ptio
n, k
Wh/
HH
/mon
th
50
00 10 20
Age of Connection, Years
30 40
Figure 6.3 Figure 6.3
Monthly kWh of Consumption versus Age of Connection
Table 6.4Table 6.4
FOSE Subsidy Rates
Sector
Discount for Households Consumption of 30 kWh/
Month or Less
Discount for Households Consuming Between 30 and
100 kWh/Month
Interconnected System UrbanUrban-rural & rural
25% of energy charge50% of energy charge
7.5 kWh/month15 kWh/month
Isolated Systems UrbanUrban-rural & rural
50% of energy charge62.5% of energy charge
15 kWh/month18.75 kWh/month
Source: OSINERG Ayuda Memoria FOSE.
7134-CH06.pdf 63 7/27/10 6:56 AM
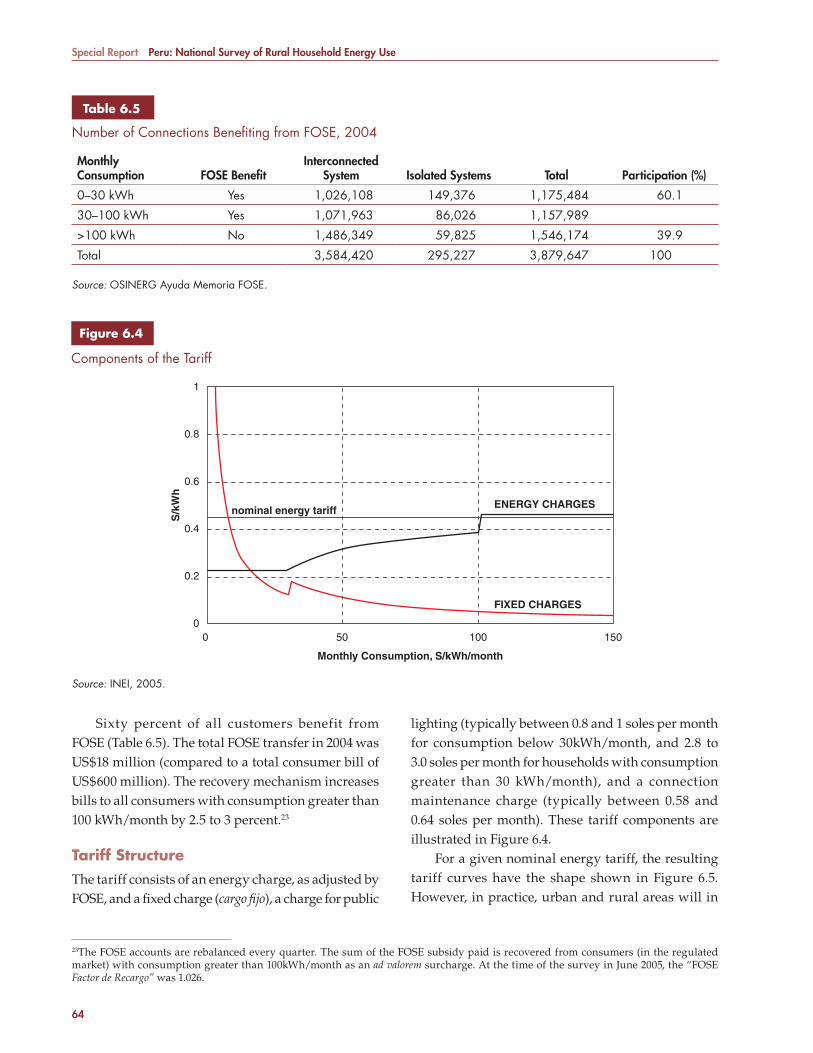
Special Report Peru: National Survey of Rural Household Energy Use
64
lighting (typically between 0.8 and 1 soles per month for consumption below 30kWh/month, and 2.8 to 3.0 soles per month for households with consumption greater than 30 kWh/month), and a connection maintenance charge (typically between 0.58 and 0.64 soles per month). These tariff components are illustrated in Figure 6.4.
For a given nominal energy tariff, the resulting tariff curves have the shape shown in Figure 6.5. However, in practice, urban and rural areas will in
Sixty percent of all customers benefit from FOSE (Table 6.5). The total FOSE transfer in 2004 was US$18 million (compared to a total consumer bill of US$600 million). The recovery mechanism increases bills to all consumers with consumption greater than 100 kWh/month by 2.5 to 3 percent.23
Tariff StructureThe tariff consists of an energy charge, as adjusted by FOSE, and a fi xed charge (cargo fi jo), a charge for public
23The FOSE accounts are rebalanced every quarter. The sum of the FOSE subsidy paid is recovered from consumers (in the regulated market) with consumption greater than 100kWh/month as an ad valorem surcharge. At the time of the survey in June 2005, the “FOSE Factor de Recargo” was 1.026.
Table 6.5Table 6.5
Number of Connections Benefi ting from FOSE, 2004
Monthly Consumption FOSE Benefi t
Interconnected System Isolated Systems Total Participation (%)
0–30 kWh Yes 1,026,108 149,376 1,175,484 60.1
30–100 kWh Yes 1,071,963 86,026 1,157,989
>100 kWh No 1,486,349 59,825 1,546,174 39.9
Total 3,584,420 295,227 3,879,647 100
Source: OSINERG Ayuda Memoria FOSE.
Source: INEI, 2005.
1
0.8
0.6
0.4
0
0.2
0 50 100
Monthly Consumption, S/kWh/month
nominal energy tariff ENERGY CHARGES
FIXED CHARGES
S/k
Wh
150
Figure 6.4 Figure 6.4
Components of the Tariff
7134-CH06.pdf 64 7/27/10 6:56 AM

6 Policy Implications of Survey Results
65
across the country. This is in part due to the complexity of tariff setting, in which every major area has its own tariff based on the assignment of sector tipicos for distribution costs and for various power generation costs. There are fi ve sectors tipicos based on the degree of urbanization. For example, sector 1 applies to Lima (high-density urban) while sector 5 is for rural areas.
general have different nominal energy tariffs, so the two curves do not in fact converge as suggested here.24
Table 6.6 shows the fixed charges for five distribution companies for which a sample of actual consumer bills have been obtained.
Although there is little variation in fi xed charges, the nominal energy charge shows large variation
Source: INEI, 2005.
1.2
1
0.8
0.6
0.4
0.20 50 100
Monthly Consumption, S/kWh/month
URBAN
RURAL
S/k
Wh
150
Figure 6.5 Figure 6.5
Typical Tariff Curves
24See Figure 6.6 for Electrosur, for example.
Table 6.6Table 6.6
Fixed Charges
Fixed ChargePublic Lighting,<30kwh/Month
Public Lighting,>30 kWh/Month
ConnectionCharges
Electrosur 1.87–2.00 0.79 2.37 0.64
ElectroCentro 1.87 1.01 3.04 0.64
ENOSA 1.87 1.05 3.15 0.64
Hidrandina 1.88 0.87 2.58 0.67
ElectroOriente 1.87 1.24 3.81 0.64
Source: INEI, 2005.
7134-CH06.pdf 65 7/27/10 6:56 AM
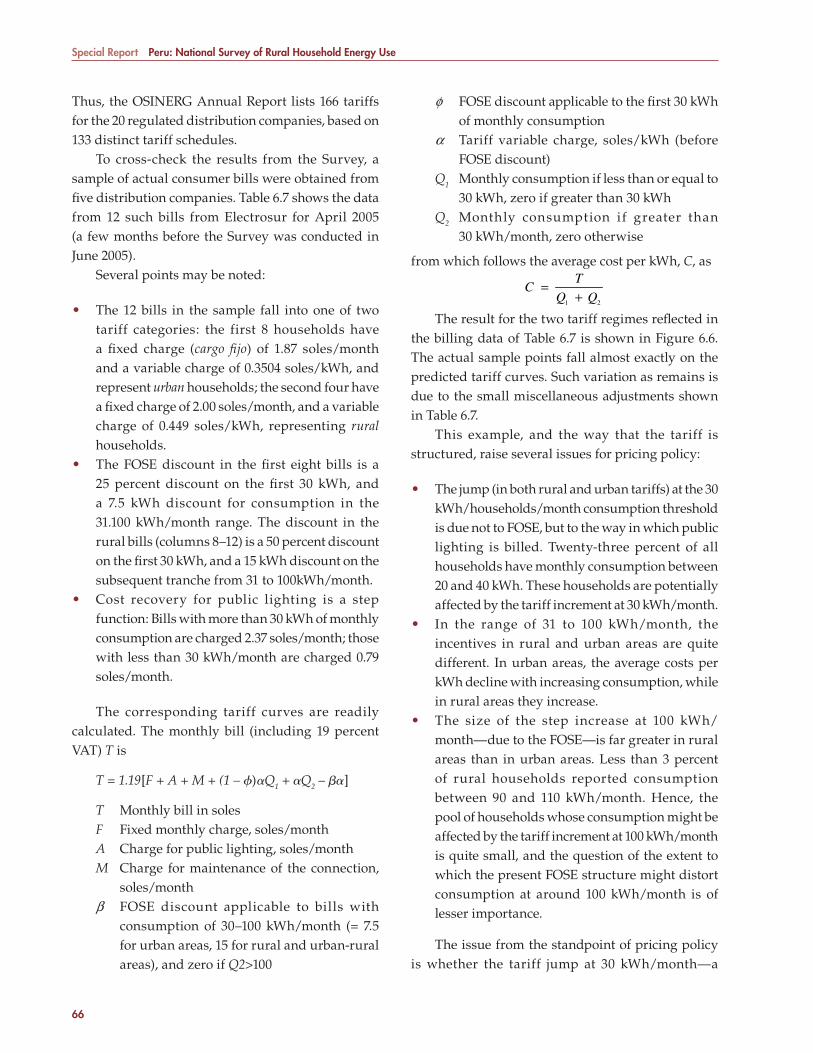
Special Report Peru: National Survey of Rural Household Energy Use
66
f FOSE discount applicable to the fi rst 30 kWh of monthly consumption
a Tariff variable charge, soles/kWh (before FOSE discount)
Q1 Monthly consumption if less than or equal to 30 kWh, zero if greater than 30 kWh
Q2 Monthly consumption if greater than 30 kWh/month, zero otherwise
from which follows the average cost per kWh, C, as
The result for the two tariff regimes refl ected in the billing data of Table 6.7 is shown in Figure 6.6. The actual sample points fall almost exactly on the predicted tariff curves. Such variation as remains is due to the small miscellaneous adjustments shown in Table 6.7.
This example, and the way that the tariff is structured, raise several issues for pricing policy:
• The jump (in both rural and urban tariffs) at the 30 kWh/households/month consumption threshold is due not to FOSE, but to the way in which public lighting is billed. Twenty-three percent of all households have monthly consumption between 20 and 40 kWh. These households are potentially affected by the tariff increment at 30 kWh/month.
• In the range of 31 to 100 kWh/month, the incentives in rural and urban areas are quite different. In urban areas, the average costs per kWh decline with increasing consumption, while in rural areas they increase.
• The size of the step increase at 100 kWh/month—due to the FOSE—is far greater in rural areas than in urban areas. Less than 3 percent of rural households reported consumption between 90 and 110 kWh/month. Hence, the pool of households whose consumption might be affected by the tariff increment at 100 kWh/month is quite small, and the question of the extent to which the present FOSE structure might distort consumption at around 100 kWh/month is of lesser importance.
The issue from the standpoint of pricing policy is whether the tariff jump at 30 kWh/month—a
Thus, the OSINERG Annual Report lists 166 tariffs for the 20 regulated distribution companies, based on 133 distinct tariff schedules.
To cross-check the results from the Survey, a sample of actual consumer bills were obtained from fi ve distribution companies. Table 6.7 shows the data from 12 such bills from Electrosur for April 2005 (a few months before the Survey was conducted in June 2005).
Several points may be noted:
• The 12 bills in the sample fall into one of two tariff categories: the first 8 households have a fi xed charge (cargo fi jo) of 1.87 soles/month and a variable charge of 0.3504 soles/kWh, and represent urban households; the second four have a fi xed charge of 2.00 soles/month, and a variable charge of 0.449 soles/kWh, representing rural households.
• The FOSE discount in the fi rst eight bills is a 25 percent discount on the fi rst 30 kWh, and a 7.5 kWh discount for consumption in the 31.100 kWh/month range. The discount in the rural bills (columns 8–12) is a 50 percent discount on the fi rst 30 kWh, and a 15 kWh discount on the subsequent tranche from 31 to 100kWh/month.
• Cost recovery for public lighting is a step function: Bills with more than 30 kWh of monthly consumption are charged 2.37 soles/month; those with less than 30 kWh/month are charged 0.79 soles/month.
The corresponding tariff curves are readily calculated. The monthly bill (including 19 percent VAT) T is
T = 1.19[F + A + M + (1 – �)�Q1 + �Q2 – ��]
T Monthly bill in soles F Fixed monthly charge, soles/month A Charge for public lighting, soles/month M Charge for maintenance of the connection,
soles/month b FOSE discount applicable to bills with
consumption of 30–100 kWh/month (= 7.5 for urban areas, 15 for rural and urban-rural areas), and zero if Q2>100
C = T
Q1 + Q2
7134-CH06.pdf 66 7/27/10 6:56 AM
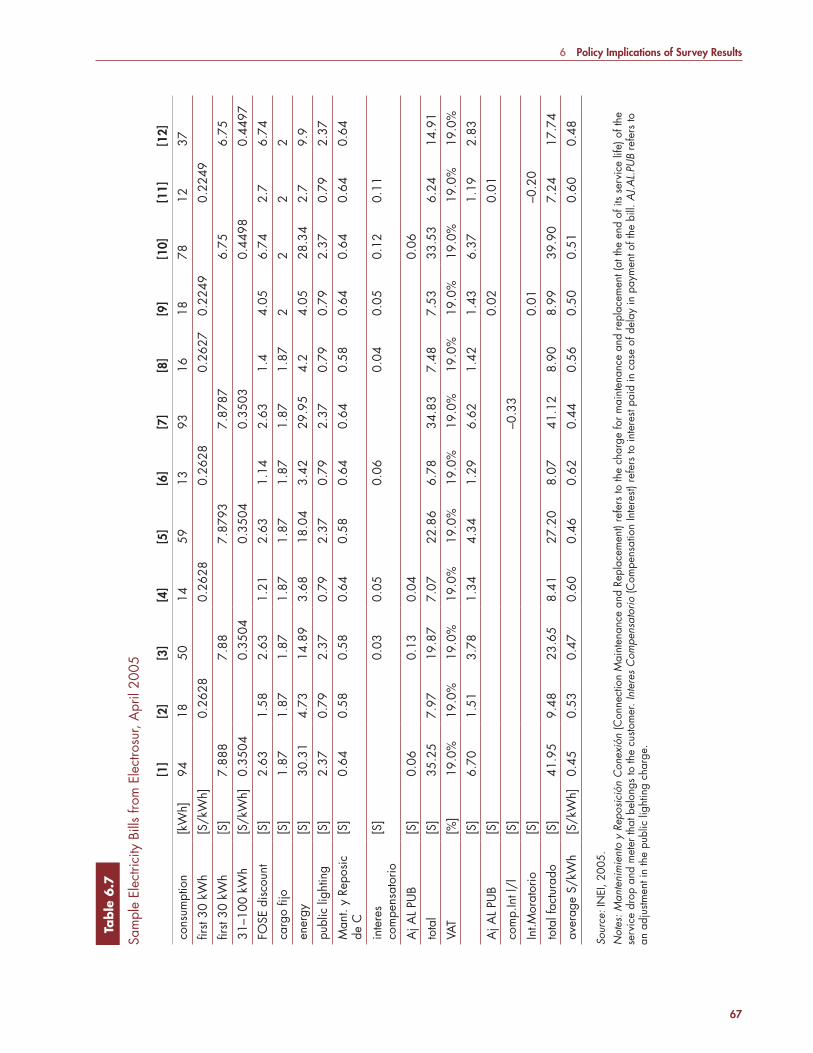
6 Policy Implications of Survey Results
67
Table
6.7
Table
6.7
Sam
ple
Elec
trici
ty B
ills
from
Ele
ctro
sur,
Apr
il 20
05
[1]
[2]
[3]
[4]
[5]
[6]
[7]
[8]
[9]
[10]
[11]
[12]
cons
umpt
ion
[kW
h]94
1850
1459
1393
1618
7812
37
fi rst
30 k
Wh
[S/k
Wh]
0.26
280.
2628
0.26
280.
2627
0.22
490.
2249
fi rst
30 k
Wh
[S]
7.88
87.
887.
8793
7.87
876.
756.
75
31–1
00 k
Wh
[S/k
Wh]
0.35
040.
3504
0.35
040.
3503
0.44
980.
4497
FOSE
dis
coun
t[S
]2.
631.
582.
631.
212.
631.
142.
631.
44.
056.
742.
76.
74
carg
o fi j
o[S
]1.
871.
871.
871.
871.
871.
871.
871.
872
22
2
ener
gy[S
]30
.31
4.73
14.8
93.
6818
.04
3.42
29.9
54.
24.
0528
.34
2.7
9.9
publ
ic li
ghtin
g[S
]2.
370.
792.
370.
792.
370.
792.
370.
790.
792.
370.
792.
37
Man
t. y
Repo
sic
de C
[S]
0.64
0.58
0.58
0.64
0.58
0.64
0.64
0.58
0.64
0.64
0.64
0.64
inte
res
com
pens
ator
io[S
]0.
030.
050.
060.
040.
050.
120.
11
Aj A
L PU
B[S
]0.
060.
130.
040.
06
tota
l[S
]35
.25
7.97
19.8
77.
0722
.86
6.78
34.8
37.
487.
5333
.53
6.24
14.9
1
VAT
[%]
19.0
%19
.0%
19.0
%19
.0%
19.0
%19
.0%
19.0
%19
.0%
19.0
%19
.0%
19.0
%19
.0%
[S]
6.70
1.51
3.78
1.34
4.34
1.29
6.62
1.42
1.43
6.37
1.19
2.83
Aj A
L PU
B[S
]0.
020.
01
com
p.In
t l/l
[S]
–0.3
3
Int.M
orat
orio
[S]
0.01
–0.2
0
tota
l fac
tura
do[S
]41
.95
9.48
23.6
58.
4127
.20
8.07
41.1
28.
908.
9939
.90
7.24
17.7
4
aver
age
S/kW
h[S
/kW
h]0.
450.
530.
470.
600.
460.
620.
440.
560.
500.
510.
600.
48
Sour
ce: I
NEI
, 200
5.N
otes
: Man
teni
mie
nto
y Re
posi
ción
Con
exió
n (C
onne
ctio
n M
aint
enan
ce a
nd R
epla
cem
ent)
refe
rs to
the
char
ge fo
r mai
nten
ance
and
repl
acem
ent (
at th
e en
d of
its
serv
ice
life)
of t
he
serv
ice
drop
and
met
er th
at b
elon
gs to
the
custo
mer
. Int
eres
Com
pens
ator
io (C
ompe
nsat
ion
Inte
rest)
refe
rs to
inte
rest
paid
in c
ase
of d
elay
in p
aym
ent o
f the
bill
. AJ.A
L.PU
B re
fers
to
an a
djus
tmen
t in
the
publ
ic li
ghtin
g ch
arge
.
7134-CH06.pdf 67 7/27/10 6:56 AM
Special Report Peru: National Survey of Rural Household Energy Use
68
marginalized end-users who consume less than 15 kWh/month (the average monthly consumption of the poorest quintile is 13.3 kWh) benefi t much less in terms of the value of the subsidy in Soles than the average consumer with 25 to 35 kWh/month, because at low consumption levels it is the fi xed charges that dominate the bill. The fi xed charges are not subject to FOSE.
Indeed, recent research raises some questions about the targeting performance of cross-subsidies such as FOSE to achieve lifeline rates (Komives et al. 2005). The effectiveness of a subsidy to reduce income inequality can be gauged by the proportion of each sole of subsidy that reaches the poor. Since the Survey does not cover urban areas, the overall targeting performance of the FOSE cannot be assessed. However, one can assess the targeting performance within rural households as a whole by calculating how much of the total FOSE transfer reaches the poorer rural households. Using the tariff curves discussed above, the FOSE benefi t received by households in each quintile can be assessed and the
consequence of the way that public lighting is billed—signifi cantly discourages households from increasing their consumption from less than (or equal to) 30 kWh/month to more than 30 kWh/month. Figure 6.7 suggests that, indeed, the consumption in the 30 to 35 KWh/month interval is smaller than would be expected from a smooth regression of consumption.
However, when the deviations between 25 To 35 kWh/month are compared to other parts of the frequency distribution curve, similar deviations from a smooth consumption curve (for example between 40 and 60 kWh/month) make it more diffi cult to argue that the fi rst deviation is actually caused by the tariff jump at 30kWh/month. In short, there is no evidence that the present billing practice limits consumption to below 30 kWh/month.
Targeting Performance of FOSEThere is no question that FOSE signifi cantly reduces the energy charge to rural consumers (by 50 percent if supplied by the interconnected system, 62.5 percent in the case of isolated systems) (Figure 6.8). However,
Source: INEI, 2005.Note: The square boxes represent the urban households in, the diamonds the rural households.
0.8
0.7
0.6
0.5
0.4
0.30 20 40 60
kWh/month
Ave
rage
Pric
e, S
/kW
h
RURAL
URBAN
80 100 120 140
Figure 6.6 Figure 6.6
Average Cost/kWh, Electrosur
7134-CH06.pdf 68 7/27/10 6:56 AM
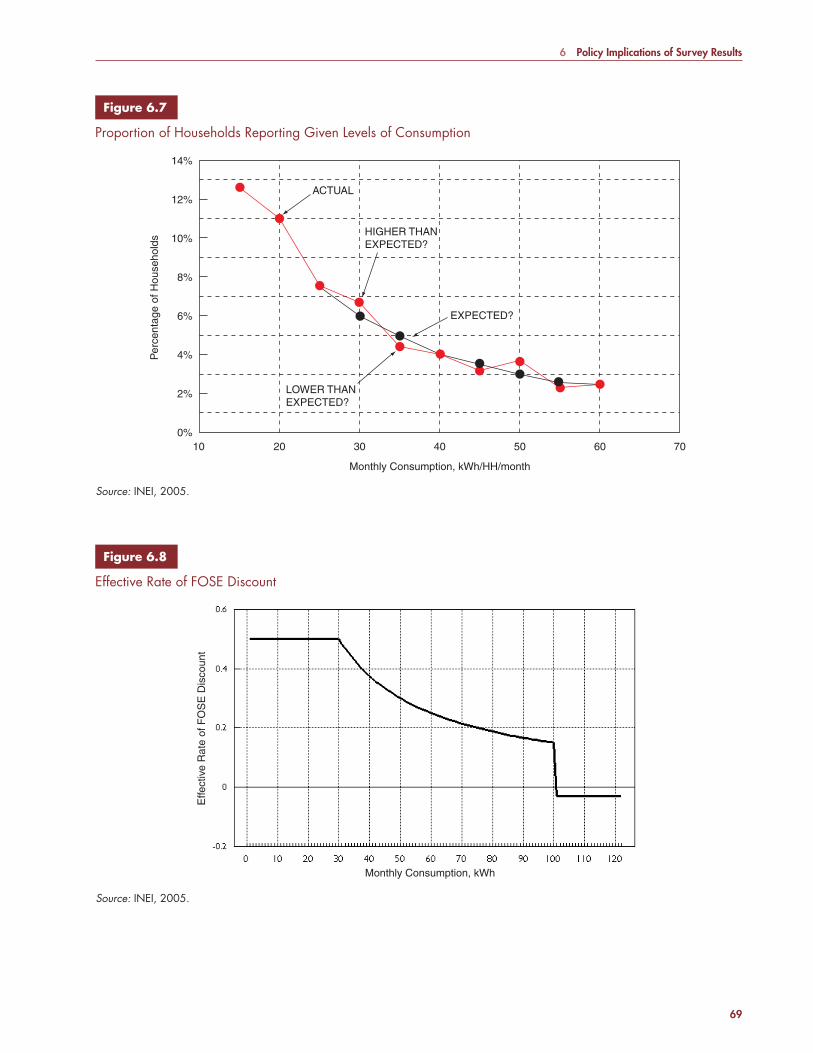
6 Policy Implications of Survey Results
69
Source: INEI, 2005.
10%
12%
14%
8%
6%
4%
0%
2%
10 20 30 40 50
Monthly Consumption, kWh/HH/month
LOWER THANEXPECTED?
ACTUAL
EXPECTED?
HIGHER THANEXPECTED?
Per
cent
age
of H
ouse
hold
s
60 70
Figure 6.7 Figure 6.7
Proportion of Households Reporting Given Levels of Consumption
Source: INEI, 2005.
Monthly Consumption, kWh
Effe
ctiv
e R
ate
of F
OS
E D
isco
unt
Figure 6.8 Figure 6.8
Effective Rate of FOSE Discount
7134-CH06.pdf 69 7/27/10 6:56 AM
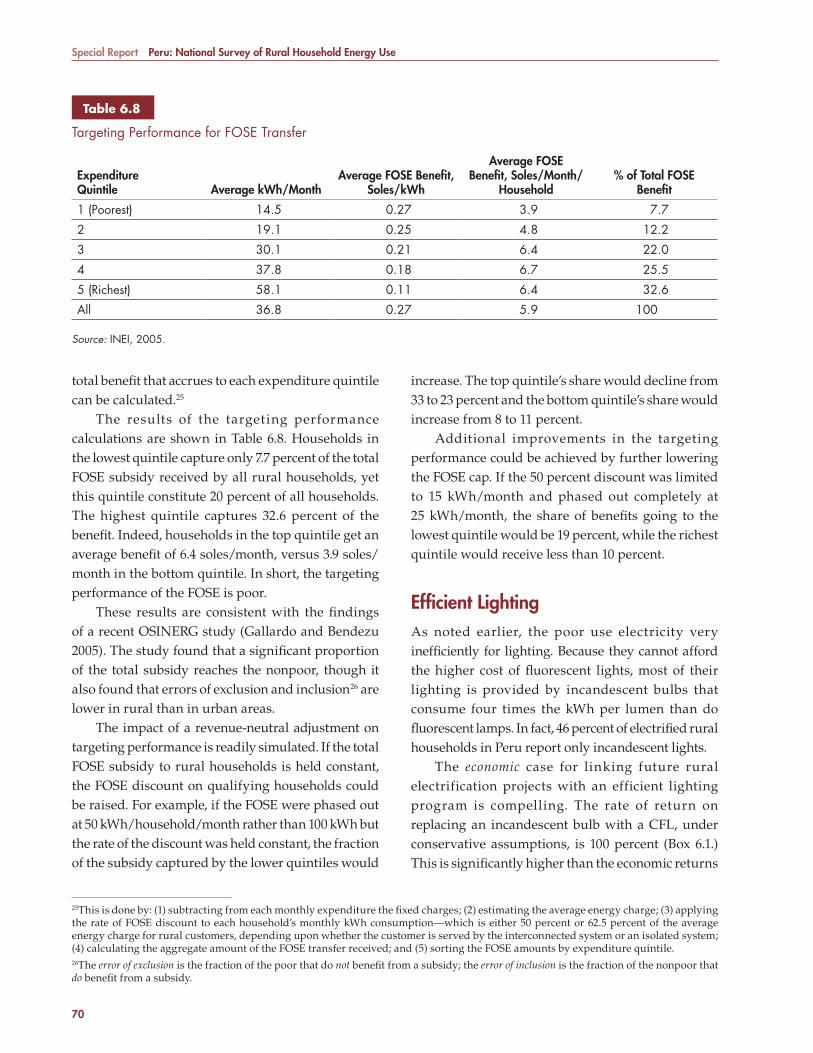
Special Report Peru: National Survey of Rural Household Energy Use
70
increase. The top quintile’s share would decline from 33 to 23 percent and the bottom quintile’s share would increase from 8 to 11 percent.
Additional improvements in the targeting performance could be achieved by further lowering the FOSE cap. If the 50 percent discount was limited to 15 kWh/month and phased out completely at 25 kWh/month, the share of benefi ts going to the lowest quintile would be 19 percent, while the richest quintile would receive less than 10 percent.
Effi cient LightingAs noted earlier, the poor use electricity very ineffi ciently for lighting. Because they cannot afford the higher cost of fl uorescent lights, most of their lighting is provided by incandescent bulbs that consume four times the kWh per lumen than do fl uorescent lamps. In fact, 46 percent of electrifi ed rural households in Peru report only incandescent lights.
The economic case for linking future rural electrification projects with an efficient lighting program is compelling. The rate of return on replacing an incandescent bulb with a CFL, under conservative assumptions, is 100 percent (Box 6.1.) This is signifi cantly higher than the economic returns
total benefi t that accrues to each expenditure quintile can be calculated.25
The results of the targeting performance calculations are shown in Table 6.8. Households in the lowest quintile capture only 7.7 percent of the total FOSE subsidy received by all rural households, yet this quintile constitute 20 percent of all households. The highest quintile captures 32.6 percent of the benefi t. Indeed, households in the top quintile get an average benefi t of 6.4 soles/month, versus 3.9 soles/month in the bottom quintile. In short, the targeting performance of the FOSE is poor.
These results are consistent with the fi ndings of a recent OSINERG study (Gallardo and Bendezu 2005). The study found that a signifi cant proportion of the total subsidy reaches the nonpoor, though it also found that errors of exclusion and inclusion26 are lower in rural than in urban areas.
The impact of a revenue-neutral adjustment on targeting performance is readily simulated. If the total FOSE subsidy to rural households is held constant, the FOSE discount on qualifying households could be raised. For example, if the FOSE were phased out at 50 kWh/household/month rather than 100 kWh but the rate of the discount was held constant, the fraction of the subsidy captured by the lower quintiles would
25This is done by: (1) subtracting from each monthly expenditure the fi xed charges; (2) estimating the average energy charge; (3) applying the rate of FOSE discount to each household’s monthly kWh consumption—which is either 50 percent or 62.5 percent of the average energy charge for rural customers, depending upon whether the customer is served by the interconnected system or an isolated system; (4) calculating the aggregate amount of the FOSE transfer received; and (5) sorting the FOSE amounts by expenditure quintile.26The error of exclusion is the fraction of the poor that do not benefi t from a subsidy; the error of inclusion is the fraction of the nonpoor that do benefi t from a subsidy.
Table 6.8Table 6.8
Targeting Performance for FOSE Transfer
ExpenditureQuintile Average kWh/Month
Average FOSE Benefi t, Soles/kWh
Average FOSE Benefi t, Soles/Month/
Household% of Total FOSE
Benefi t
1 (Poorest) 14.5 0.27 3.9 7.7
2 19.1 0.25 4.8 12.2
3 30.1 0.21 6.4 22.0
4 37.8 0.18 6.7 25.5
5 (Richest) 58.1 0.11 6.4 32.6
All 36.8 0.27 5.9 100
Source: INEI, 2005.
7134-CH06.pdf 70 7/27/10 6:56 AM

6 Policy Implications of Survey Results
71
electricity bills than those with incandescent lights (i.e., the savings from effi cient lighting would be spent on nonenergy items), or whether household energy expenditure would be roughly the same (i.e., savings from effi cient lighting would be spent on more TV, radio, or appliance use).
Table 6.9 shows that households with only fl uorescent lamps spend more per month on their total electricity bill than households with incandescent lamps only—a fi nding that is common to all quintiles.
on rural electrifi cation per se (which is in the range of 26 to 59 percent for individual schemes, according to the World Bank’s Peru Rural Electrifi cation Project (2005b) economic analysis). It necessarily follows that including an effi cient lighting component would improve the aggregate economic returns.
The impact of an effi cient lighting scheme on the fi nances of distribution companies would also have to be analyzed. The key question would be whether households with fl uorescent lights would have lower
Compact fl uorescent lamps (CFLs) are typically guaranteed for 8,000 hours. At 3 hours of use per day, a 15-watt CFL should last 7 years. The equivalent incandescent bulb typically lasts from 500 to 4,000 hours, depending on exposure to voltage spikes. If the economic cost of electricity delivered to the distribution company is taken at US$0.04/kWh (actual costs are in the range of 0.13 to 0.3 soles/kWh, or US$0.04 to 0.09/kWh), a cost of $2.75 for a 15 watt CFL, and US$0.75 for a 60 watt incandescent, then the rate of return can be calculated as shown in Table A.
Box 6.1Box 6.1
Rate of Return for Replacement of Incandescent Lighting with CFLs
Table ATable A
Rate of Return Calculations for Replacement of Incandescent Bulbs with CFLs
Year 0 1 2 3 4 5 6 7
Assumptions
Cost of electricity US$/kWh 0.04 0.04 0.04 0.04 0.04 0.04 0.04
Usage per day Hours/day 3 3 3 3 3 3 3
Usage per year Hours/year 1,095 1,095 1,095 1,095 1,095 1,095 1,095
Cumulative hours Hours 1,095 2,190 3,285 4,380 5,475 6,570 7,665
15-Watt CFL
Energy kWh/year 16.4 16.4 16.4 16.4 16.4 16.4 16.4
Cost of electricity $ 0.657 0.657 0.657 0.657 0.657 0.657 0.657
CFL cost $ 2.75
Total costs $ 2.75 0.657 0.657 0.657 0.657 0.657 0.657 0.657
60-Watt Incandescent
Energy kWh/year 65.7 65.7 65.7 65.7 65.7 65.7 65.7
Cost of electricity $ 2.628 2.628 2.628 2.628 2.628 2.628 2.628
Incandescent cost $ 0.75 0.75 0.75
Total costs $ 0.75 2.628 2.628 3.378 2.628 2.628 3.378 2.628
Net Flows $ –2.00 1.97 1.97 2.72 1.97 1.97 2.72 1.97
Rate of Return % 103%
The estimated return of 103 percent is conservative insofar as the capacity benefi ts and avoided distribution losses are ignored.
7134-CH06.pdf 71 7/27/10 6:56 AM
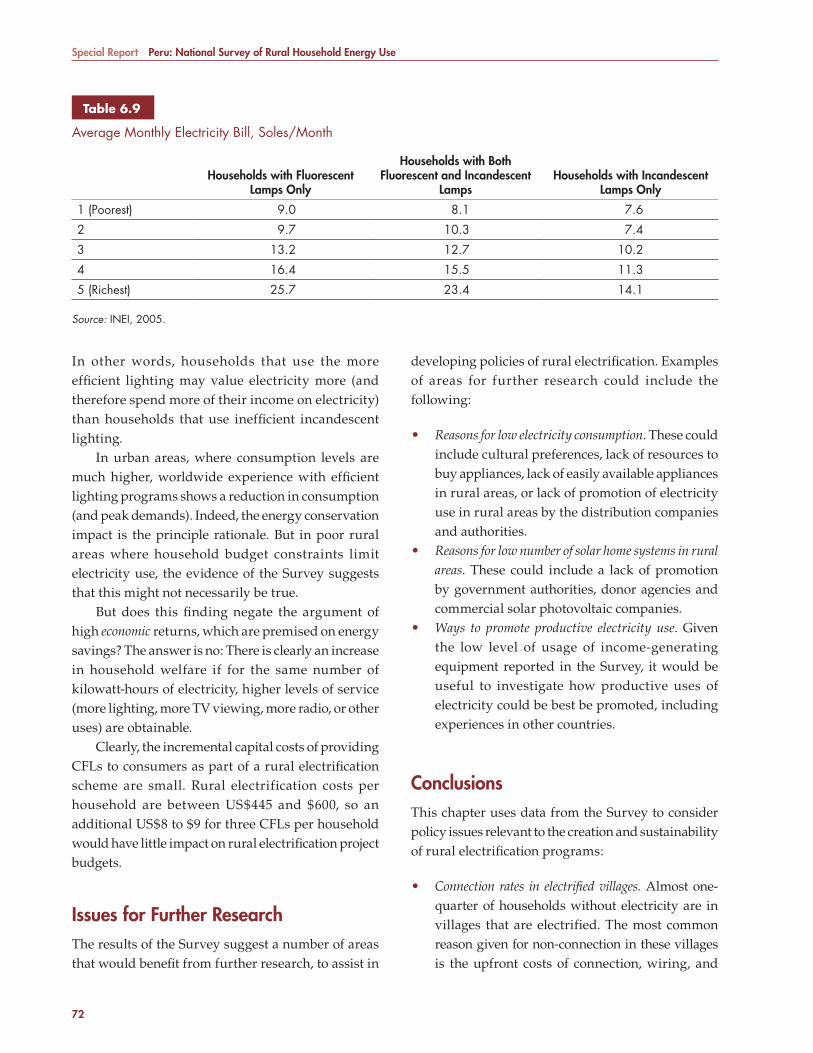
Special Report Peru: National Survey of Rural Household Energy Use
72
developing policies of rural electrifi cation. Examples of areas for further research could include the following:
• Reasons for low electricity consumption. These could include cultural preferences, lack of resources to buy appliances, lack of easily available appliances in rural areas, or lack of promotion of electricity use in rural areas by the distribution companies and authorities.
• Reasons for low number of solar home systems in rural areas. These could include a lack of promotion by government authorities, donor agencies and commercial solar photovoltaic companies.
• Ways to promote productive electricity use. Given the low level of usage of income-generating equipment reported in the Survey, it would be useful to investigate how productive uses of electricity could be best be promoted, including experiences in other countries.
ConclusionsThis chapter uses data from the Survey to consider policy issues relevant to the creation and sustainability of rural electrifi cation programs:
• Connection rates in electrifi ed villages. Almost one-quarter of households without electricity are in villages that are electrified. The most common reason given for non-connection in these villages is the upfront costs of connection, wiring, and
In other words, households that use the more effi cient lighting may value electricity more (and therefore spend more of their income on electricity) than households that use ineffi cient incandescent lighting.
In urban areas, where consumption levels are much higher, worldwide experience with effi cient lighting programs shows a reduction in consumption (and peak demands). Indeed, the energy conservation impact is the principle rationale. But in poor rural areas where household budget constraints limit electricity use, the evidence of the Survey suggests that this might not necessarily be true.
But does this fi nding negate the argument of high economic returns, which are premised on energy savings? The answer is no: There is clearly an increase in household welfare if for the same number of kilowatt-hours of electricity, higher levels of service (more lighting, more TV viewing, more radio, or other uses) are obtainable.
Clearly, the incremental capital costs of providing CFLs to consumers as part of a rural electrifi cation scheme are small. Rural electrification costs per household are between US$445 and $600, so an additional US$8 to $9 for three CFLs per household would have little impact on rural electrifi cation project budgets.
Issues for Further ResearchThe results of the Survey suggest a number of areas that would benefi t from further research, to assist in
Table 6.9Table 6.9
Average Monthly Electricity Bill, Soles/Month
Households with Fluorescent Lamps Only
Households with Both Fluorescent and Incandescent
LampsHouseholds with Incandescent
Lamps Only
1 (Poorest) 9.0 8.1 7.6
2 9.7 10.3 7.4
3 13.2 12.7 10.2
4 16.4 15.5 11.3
5 (Richest) 25.7 23.4 14.1
Source: INEI, 2005.
7134-CH06.pdf 72 7/27/10 6:56 AM
6 Policy Implications of Survey Results
73
higher than the commonly assumed 0.5 to 1.0 percent per year.
• Pricing policy. Those who consume small amounts of electricity pay relatively high prices per kWh, notwithstanding the FOSE mechanism. Households in the lowest quintile capture only 7.7 percent of the total FOSE subsidy received by all rural households, yet this quintile constitutes 20 percent of all households. The highest quintile captures 32.6 percent of the benefi t. In short, the targeting performance of the FOSE is poor. Additional improvements in the targeting performance could be achieved by further lowering the FOSE cap. If the 50 percent discount were limited to 15 kWh/month and phased out at 25 kWh/month, the share of benefi ts going to the lowest quintile would be 19 percent, while the richest would receive less than 10 percent.
• Effi cient lighting. The economic case for linking future rural electrification projects with an efficient lighting program using compact fl uorescent lamps (CFLs) is compelling. Rural electrifi cation costs per household are between US$445 and $600, so an additional $8 to $9 for three CFLs per household would have little impact on rural electrifi cation project budgets.
equipment. The fi nancial sustainability of projects is strongly influenced by connecting as many households as possible, from which follows that connection costs, perhaps including house wiring, should be part of the overall cost eligible for subsidy.
• Distribution of electricity consumption by village. An indicative consumption threshold of 22 kWh/household is used in this report for whether most rural electrifi cation schemes would be fi nancially viable. Although the average consumption in 374 electrifi ed villages is 35 kWh/household/month, these averages show signifi cant variation across regions. In the Andean South region, the average is only 15 kWh/household/month. As in the case of individual households, the regional differences in consumption can be explained by regional differences in income.
• Growth of electricity consumption. One of the important assumptions in making financial projections of the viability of rural electrifi cation projects is the rate of growth in consumption. At least based on the experience of those communities prioritized by the current scheme (often the poorest and most lacking in infrastructure access), there is no evidence that annual consumption growth per connected household would be much
7134-CH06.pdf 73 7/27/10 6:56 AM

7134-CH06.pdf 74 7/27/10 6:56 AM
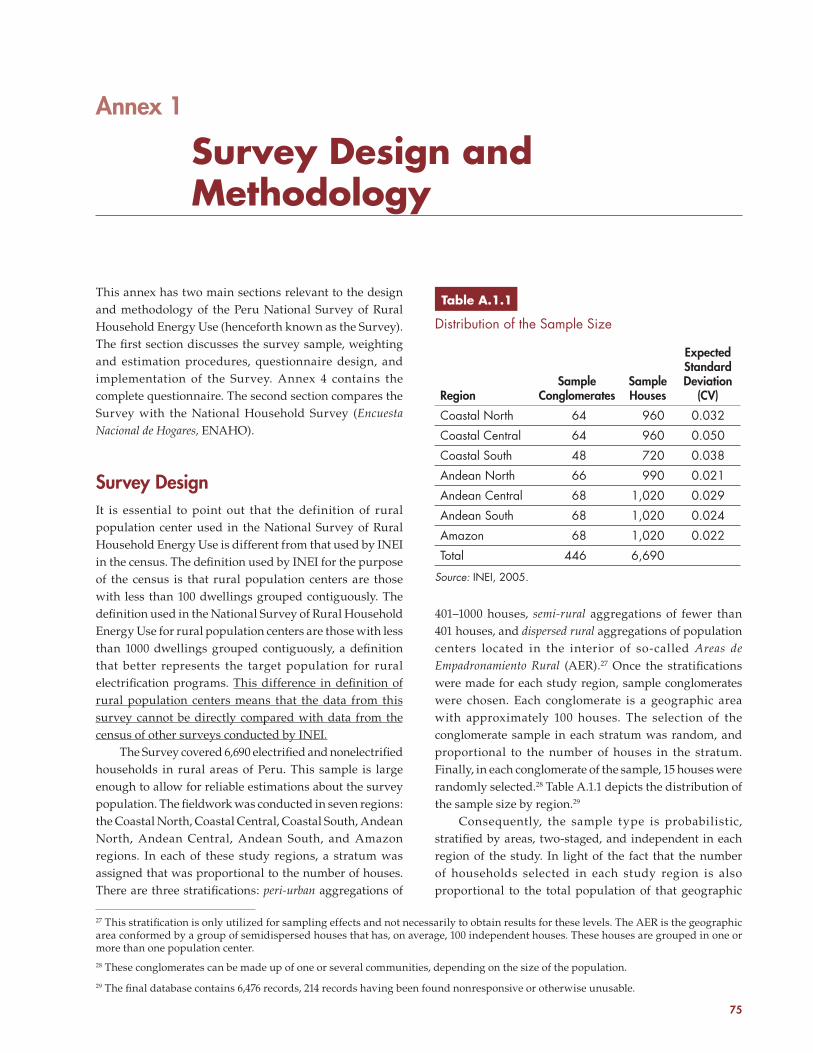
75
Annex 1
Survey Design and Methodology
This annex has two main sections relevant to the design and methodology of the Peru National Survey of Rural Household Energy Use (henceforth known as the Survey). The fi rst section discusses the survey sample, weighting and estimation procedures, questionnaire design, and implementation of the Survey. Annex 4 contains the complete questionnaire. The second section compares the Survey with the National Household Survey (Encuesta Nacional de Hogares, ENAHO).
Survey DesignIt is essential to point out that the definition of rural population center used in the National Survey of Rural Household Energy Use is different from that used by INEI in the census. The defi nition used by INEI for the purpose of the census is that rural population centers are those with less than 100 dwellings grouped contiguously. The defi nition used in the National Survey of Rural Household Energy Use for rural population centers are those with less than 1000 dwellings grouped contiguously, a defi nition that better represents the target population for rural electrifi cation programs. This difference in defi nition of rural population centers means that the data from this survey cannot be directly compared with data from the census of other surveys conducted by INEI.
The Survey covered 6,690 electrifi ed and nonelectrifi ed households in rural areas of Peru. This sample is large enough to allow for reliable estimations about the survey population. The fi eldwork was conducted in seven regions: the Coastal North, Coastal Central, Coastal South, Andean North, Andean Central, Andean South, and Amazon regions. In each of these study regions, a stratum was assigned that was proportional to the number of houses. There are three stratifi cations: peri-urban aggregations of
401–1000 houses, semi-rural aggregations of fewer than 401 houses, and dispersed rural aggregations of population centers located in the interior of so-called Areas de Empadronamiento Rural (AER).27 Once the stratifi cations were made for each study region, sample conglomerates were chosen. Each conglomerate is a geographic area with approximately 100 houses. The selection of the conglomerate sample in each stratum was random, and proportional to the number of houses in the stratum. Finally, in each conglomerate of the sample, 15 houses were randomly selected.28 Table A.1.1 depicts the distribution of the sample size by region.29
Consequently, the sample type is probabilistic, stratifi ed by areas, two-staged, and independent in each region of the study. In light of the fact that the number of households selected in each study region is also proportional to the total population of that geographic
27 This stratifi cation is only utilized for sampling effects and not necessarily to obtain results for these levels. The AER is the geographic area conformed by a group of semidispersed houses that has, on average, 100 independent houses. These houses are grouped in one or more than one population center.28 These conglomerates can be made up of one or several communities, depending on the size of the population.
29 The fi nal database contains 6,476 records, 214 records having been found nonresponsive or otherwise unusable.
Table A.1.1Table A.1.1
Distribution of the Sample Size
RegionSample
ConglomeratesSample Houses
Expected Standard Deviation
(CV)
Coastal North 64 960 0.032
Coastal Central 64 960 0.050
Coastal South 48 720 0.038
Andean North 66 990 0.021
Andean Central 68 1,020 0.029
Andean South 68 1,020 0.024
Amazon 68 1,020 0.022
Total 446 6,690
Source: INEI, 2005.
7134-CHAnnex1.pdf 75 7/27/10 6:56 AM
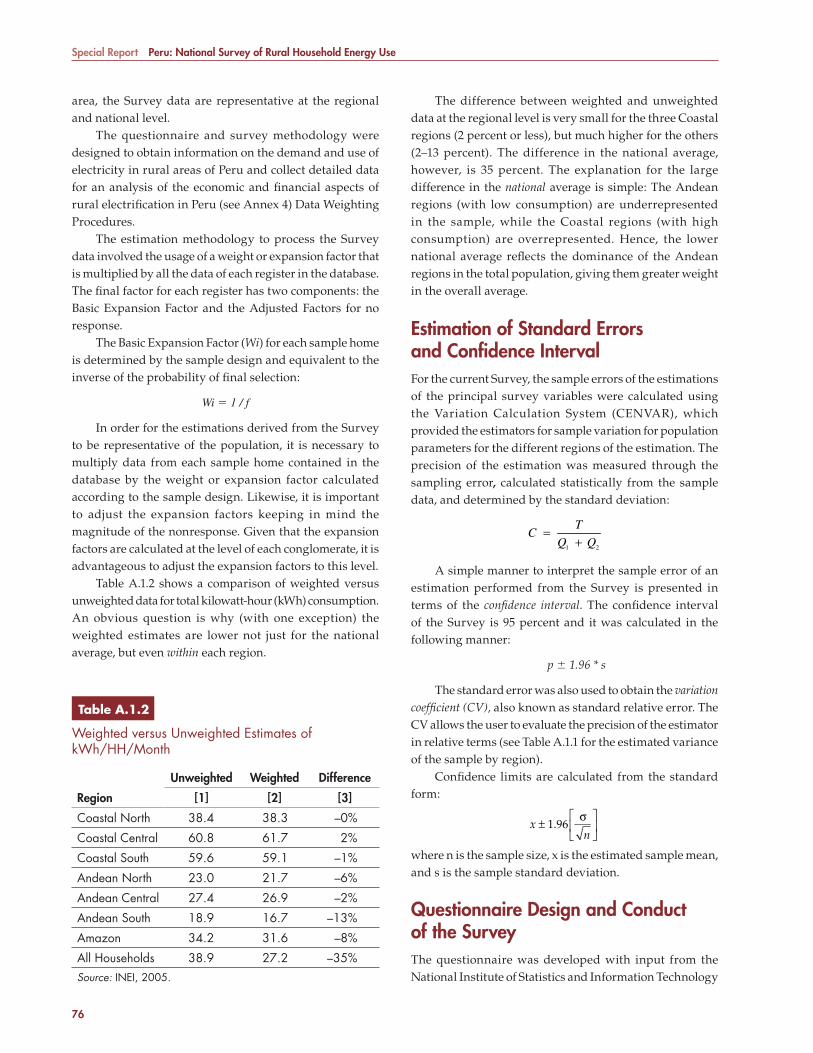
Special Report Peru: National Survey of Rural Household Energy Use
76
The difference between weighted and unweighted data at the regional level is very small for the three Coastal regions (2 percent or less), but much higher for the others (2–13 percent). The difference in the national average, however, is 35 percent. The explanation for the large difference in the national average is simple: The Andean regions (with low consumption) are underrepresented in the sample, while the Coastal regions (with high consumption) are overrepresented. Hence, the lower national average refl ects the dominance of the Andean regions in the total population, giving them greater weight in the overall average.
Estimation of Standard Errors and Confi dence Interval For the current Survey, the sample errors of the estimations of the principal survey variables were calculated using the Variation Calculation System (CENVAR), which provided the estimators for sample variation for population parameters for the different regions of the estimation. The precision of the estimation was measured through the sampling error, calculated statistically from the sample data, and determined by the standard deviation:
C = T
Q1 + Q2
A simple manner to interpret the sample error of an estimation performed from the Survey is presented in terms of the confi dence interval. The confi dence interval of the Survey is 95 percent and it was calculated in the following manner:
p � 1.96 * s
The standard error was also used to obtain the variation coeffi cient (CV), also known as standard relative error. The CV allows the user to evaluate the precision of the estimator in relative terms (see Table A.1.1 for the estimated variance of the sample by region).
Confi dence limits are calculated from the standard form:
x ± 1.96σn
⎡
⎣⎢
⎤
⎦⎥
where n is the sample size, x is the estimated sample mean, and s is the sample standard deviation.
Questionnaire Design and Conduct of the SurveyThe questionnaire was developed with input from the National Institute of Statistics and Information Technology
area, the Survey data are representative at the regional and national level.
The questionnaire and survey methodology were designed to obtain information on the demand and use of electricity in rural areas of Peru and collect detailed data for an analysis of the economic and fi nancial aspects of rural electrifi cation in Peru (see Annex 4) Da ta Weighting Procedures.
The estimation methodology to process the Survey data involved the usage of a weight or expansion factor that is multiplied by all the data of each register in the database. The fi nal factor for each register has two components: the Basic Expansion Factor and the Adjusted Factors for no response.
The Basic Expansion Factor (Wi) for each sample home is determined by the sample design and equivalent to the inverse of the probability of fi nal selection:
Wi � 1 / f
In order for the estimations derived from the Survey to be representative of the population, it is necessary to multiply data from each sample home contained in the database by the weight or expansion factor calculated according to the sample design. Likewise, it is important to adjust the expansion factors keeping in mind the magnitude of the nonresponse. Given that the expansion factors are calculated at the level of each conglomerate, it is advantageous to adjust the expansion factors to this level.
Table A.1.2 shows a comparison of weighted versus unweighted data for total kilowatt-hour (kWh) consumption. An obvious question is why (with one exception) the weighted estimates are lower not just for the national average, but even within each region.
Table A.1.2Table A.1.2
Weighted versus Unweighted Estimates of kWh/HH/Month
Region
Unweighted Weighted Difference
[1] [2] [3]
Coastal North 38.4 38.3 –0%
Coastal Central 60.8 61.7 2%
Coastal South 59.6 59.1 –1%
Andean North 23.0 21.7 –6%
Andean Central 27.4 26.9 –2%
Andean South 18.9 16.7 –13%
Amazon 34.2 31.6 –8%
All Households 38.9 27.2 –35%Source: INEI, 2005.
7134-CHAnnex1.pdf 76 7/27/10 6:56 AM
Annex 1 Survey Design and Methodology
77
• Section 2: Use of Kerosene• Section 3: Use of Candles• Section 4: Use of Dry Cell Batteries• Section 5: Use of Car Batteries• Section 5: Use of LPG• Section 7: Use of Solar PV Home System• Section 8: Electric Generator Set• Section 9: Use of Firewood• Section 10: Use of Agriculture Residue• Section 11: Animal Dung• Section 12: Use of Cooking Stove and Cooking
• 400. Productive Equipment• Section 1: Electric Pumps• Section 2: Diesel Pumps
• 500. Time Use• 600. Household Income
• Section 1: Income from Work• Section 2: Income from Agricultural Activities• Section 3: Income from Livestock Activities• Section 4: Income from Fisheries• Section 5: Other Income• Section 6: Household Expenditures
• 700. Attitude• 800. Business Module
• Section 1: Basic Characteristics of the Business or Establishment
• Section 2: Financing Sources for Business• Section 3: Uses of Motors (Motive Power) in
Business• Section 4: Income from Business
• 900. Opinion and Attitude on Energy and Business
Compari son between the National Survey of Rural Household Energy Use and the National Household SurveyThis section compares the estimates of energy expenditures and total household expenditures obtained by the National Survey of Rural Household Energy Use (the Survey) described in the main text of this report with those from the ENAHO, a national household survey done by INEI every year to estimate socioeconomic characteristics and poverty conditions in Peru.
This exercise is performed even though it is clear that the Survey and the ENAHO are not strictly comparable. First, the ENAHO is carried out continuously throughout the year, while the Survey was implemented during June and July of 2005, which creates seasonality issues that are beyond the scope of this study. In addition, the ENAHO data used here are from 2004. Second, the sampling design and
(INEI). The Technical Directorate of Demographics and Social Indicators of INEI was responsible for executing the fieldwork from April through July 2005 in the 24 departamentos of Peru. The Technical Directorate was also in charge of the data processing.
The questionnaire was drafted and revised by both the World Bank team and the MEM. Adjustments were made to the health, energy use, time use, and income sections of the initial survey, which was then tested in the fi eld. In April 2005, the questionnaire was piloted in rural villages in three different geographic regions of Peru: Ica (Coastal), Huancayo (Andean), and Chanchamayo (Amazon). Discussions were held with the surveyors during the pilot survey implementation to identify problematic questions and diffi culties that arose in the fi eld and to eliminate any confusion. The questionnaire was then revised based on feedback from the surveyors and lessons learned in the fi eld. The fi nal survey questionnaire was designed to collect very detailed information on energy use and consumption.
In May 2005, the World Bank held a training session with the survey supervision team at INEI, which was followed by a six-day workshop held in Lima by INEI for the surveyors hired to execute the fi nal Survey. A total of 75 surveyors and 24 supervisors (one for each departamento of Peru) were selected to implement the survey. Generally, teams included surveyors who were native to the area or who had prior work experience in the area to which they were assigned. Regional INEI offi ces and the regional supervisors provided additional support to the survey teams. The central INEI offi ce in Lima was responsible for providing the statistic and cartographic information, providing technical and logistical support, and delivering the fi nal survey results.
Completed survey forms were sent to the regional INEI offi ce in Arequipa, where the data entry was performed. Once completed, the survey results were sent back to Lima, where INEI took additional steps to check the accuracy of data entry. The fi nal data editing and preparation for data analysis was performed and completed in Washington, DC.
Househo ld Energy Questionnaire Outline
The following is an outline of the survey questionnaire. The full survey questionnaire is included in Annex 3.
• 100. Characteristics of the House and Household• 200. Characteristics of the Household Members• 300. Sources of Energy
• Section 1: Use of Electricity from Interconnected Grid and Isolated System
7134-CHAnnex1.pdf 77 8/25/10 10:16 AM
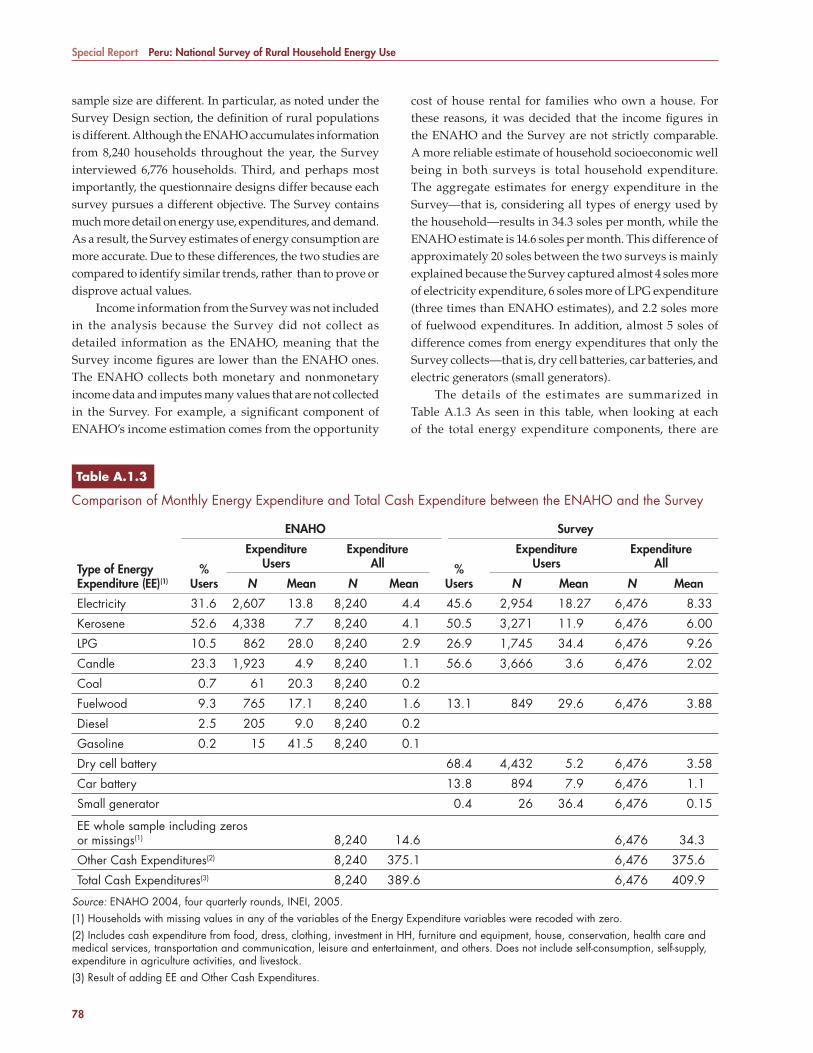
Special Report Peru: National Survey of Rural Household Energy Use
78
cost of house rental for families who own a house. For these reasons, it was decided that the income fi gures in the ENAHO and the Survey are not strictly comparable. A more reliable estimate of household socioeconomic well being in both surveys is total household expenditure. The aggregate estimates for energy expenditure in the Survey—that is, considering all types of energy used by the household—results in 34.3 soles per month, while the ENAHO estimate is 14.6 soles per month. This difference of approximately 20 soles between the two surveys is mainly explained because the Survey captured almost 4 soles more of electricity expenditure, 6 soles more of LPG expenditure (three times than ENAHO estimates), and 2.2 soles more of fuelwood expenditures. In addition, almost 5 soles of difference comes from energy expenditures that only the Survey collects—that is, dry cell batteries, car batteries, and electric generators (small generators).
The details of the estimates are summarized in Table A.1.3 As seen in this table, when looking at each of the total energy expenditure components, there are
sample size are different. In particular, as noted under the Survey Design section, the defi nition of rural populations is different. Although the ENAHO accumulates information from 8,240 households throughout the year, the Survey interviewed 6,776 households. Third, and perhaps most importantly, the questionnaire designs differ because each survey pursues a different objective. The Survey contains much more detail on energy use, expenditures, and demand. As a result, the Survey estimates of energy consumption are more accurate. Due to these differences, the two studies are compared to identify similar trends, rather than to prove or disprove actual values.
Income information from the Survey was not included in the analysis because the Survey did not collect as detailed information as the ENAHO, meaning that the Survey income fi gures are lower than the ENAHO ones. The ENAHO collects both monetary and nonmonetary income data and imputes many values that are not collected in the Survey. For example, a signifi cant component of ENAHO’s income estimation comes from the opportunity
Table A.1.3Table A.1.3
Comparison of Monthly Energy Expenditure and Total Cash Expenditure between the ENAHO and the Survey
Type of Energy Expenditure (EE)(1)
ENAHO Survey
% Users
Expenditure Users
ExpenditureAll %
Users
ExpenditureUsers
ExpenditureAll
N Mean N Mean N Mean N Mean
Electricity 31.6 2,607 13.8 8,240 4.4 45.6 2,954 18.27 6,476 8.33
Kerosene 52.6 4,338 7.7 8,240 4.1 50.5 3,271 11.9 6,476 6.00
LPG 10.5 862 28.0 8,240 2.9 26.9 1,745 34.4 6,476 9.26
Candle 23.3 1,923 4.9 8,240 1.1 56.6 3,666 3.6 6,476 2.02
Coal 0.7 61 20.3 8,240 0.2
Fuelwood 9.3 765 17.1 8,240 1.6 13.1 849 29.6 6,476 3.88
Diesel 2.5 205 9.0 8,240 0.2
Gasoline 0.2 15 41.5 8,240 0.1
Dry cell battery 68.4 4,432 5.2 6,476 3.58
Car battery 13.8 894 7.9 6,476 1.1
Small generator 0.4 26 36.4 6,476 0.15
EE whole sample including zeros or missings(1) 8,240 14.6 6,476 34.3
Other Cash Expenditures(2) 8,240 375.1 6,476 375.6
Total Cash Expenditures(3) 8,240 389.6 6,476 409.9
Source: ENAHO 2004, four quarterly rounds, INEI, 2005.(1) Households with missing values in any of the variables of the Energy Expenditure variables were recoded with zero.(2) Includes cash expenditure from food, dress, clothing, investment in HH, furniture and equipment, house, conservation, health care and medical services, transportation and communication, leisure and entertainment, and others. Does not include self-consumption, self-supply, expenditure in agriculture activities, and livestock.(3) Result of adding EE and Other Cash Expenditures.
7134-CHAnnex1.pdf 78 7/27/10 6:56 AM
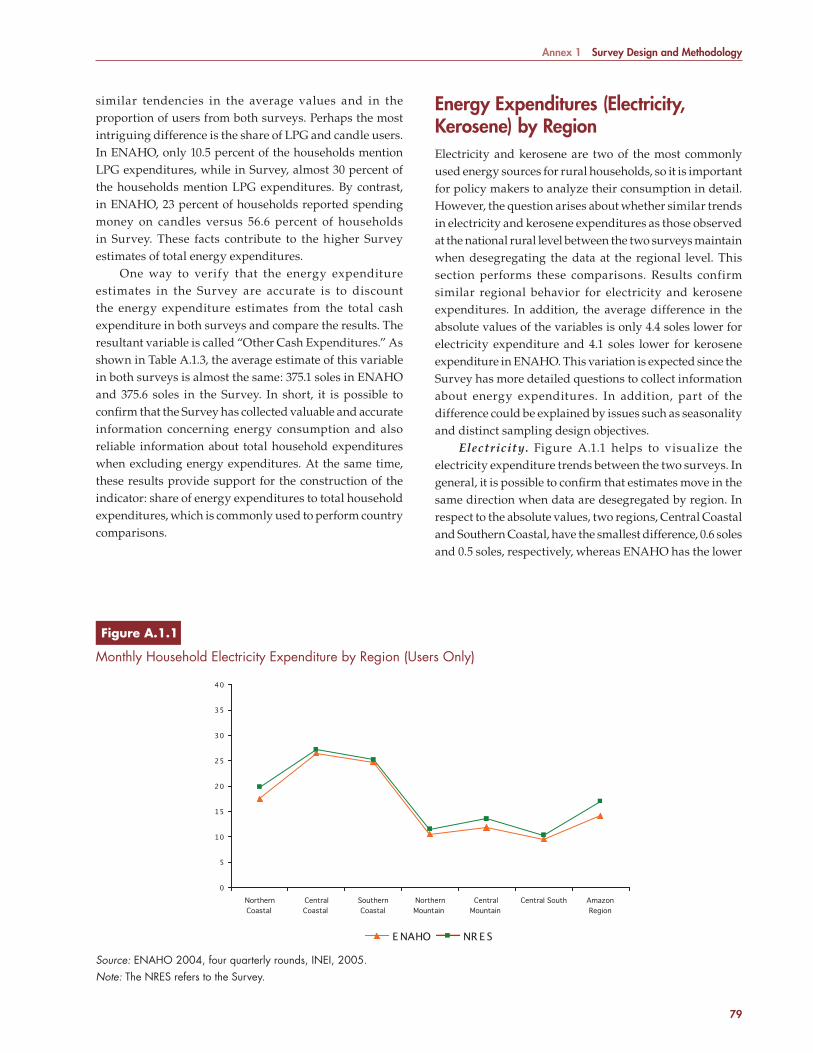
Annex 1 Survey Design and Methodology
79
Energy Expenditures (Electricity, Kerosene) by RegionElectricity and kerosene are two of the most commonly used energy sources for rural households, so it is important for policy makers to analyze their consumption in detail. However, the question arises about whether similar trends in electricity and kerosene expenditures as those observed at the national rural level between the two surveys maintain when desegregating the data at the regional level. This section performs these comparisons. Results confirm similar regional behavior for electricity and kerosene expenditures. In addition, the average difference in the absolute values of the variables is only 4.4 soles lower for electricity expenditure and 4.1 soles lower for kerosene expenditure in ENAHO. This variation is expected since the Survey has more detailed questions to collect information about energy expenditures. In addition, part of the difference could be explained by issues such as seasonality and distinct sampling design objectives.
Electricity. Figure A.1.1 helps to visualize the electricity expenditure trends between the two surveys. In general, it is possible to confi rm that estimates move in the same direction when data are desegregated by region. In respect to the absolute values, two regions, Central Coastal and Southern Coastal, have the smallest difference, 0.6 soles and 0.5 soles, respectively, whereas ENAHO has the lower
similar tendencies in the average values and in the proportion of users from both surveys. Perhaps the most intriguing difference is the share of LPG and candle users. In ENAHO, only 10.5 percent of the households mention LPG expenditures, while in Survey, almost 30 percent of the households mention LPG expenditures. By contrast, in ENAHO, 23 percent of households reported spending money on candles versus 56.6 percent of households in Survey. These facts contribute to the higher Survey estimates of total energy expenditures.
One way to verify that the energy expenditure estimates in the Survey are accurate is to discount the energy expenditure estimates from the total cash expenditure in both surveys and compare the results. The resultant variable is called “Other Cash Expenditures.” As shown in Table A.1.3, the average estimate of this variable in both surveys is almost the same: 375.1 soles in ENAHO and 375.6 soles in the Survey. In short, it is possible to confi rm that the Survey has collected valuable and accurate information concerning energy consumption and also reliable information about total household expenditures when excluding energy expenditures. At the same time, these results provide support for the construction of the indicator: share of energy expenditures to total household expenditures, which is commonly used to perform country comparisons.
Source: ENAHO 2004, four quarterly rounds, INEI, 2005.Note: The NRES refers to the Survey.
0
5
10
15
20
25
30
35
40
NorthernCoastal
CentralCoastal
SouthernCoastal
NorthernMountain
CentralMountain
Central South AmazonRegion
E NAHO NRE S
Figure A.1.1Figure A.1.1
Monthly Household Electricity Expenditure by Region (Users Only)
7134-CHAnnex1.pdf 79 7/27/10 6:56 AM

Special Report Peru: National Survey of Rural Household Energy Use
80
diffi culties involved for surveyors to reach the most isolated households in the Amazon region.30
Table A.1.4 shows detailed information for estimated values and percentage differences from the two surveys. It is important to note that in the ENAHO survey, there is a higher frequency of households in regions with low levels of electricity expenditure, while the inverse is true for the Survey. These different frequencies arise due to the distinct sampling design of each survey. Consequently,
monthly electricity expenditure fi gures. This difference can be visualized in Figure A.1.1 as the gap between the two lines.
The Amazon region has the highest disparities between the electricity estimates. The monthly expenditure for the ENAHO survey is 2.8 soles lower than the Survey. One possible explanation is that the Survey may have surveyed more semirural households—those who use electricity more intensively—due to the geographic
Source: ENAHO 2004, four quarterly rounds, INEI, 2005.Note: The NRES refers to the Survey.
0
5
10
15
20
25
30
35
40
NorthernCoastal
CentralCoastal
SouthernCoastal
NorthernMountain
CentralMountain
Central South AmazonRegion
E NAHO NR E S
Figure A.1.2Figure A.1.2
Monthly Kerosene Expenditure by Region (Users Only)
Table A.1.4Table A.1.4
Monthly Household Electricity Expenditure by Region (Users Only)
Region
ENAHO Survey
Mean (soles) N Mean (soles) N Difference (soles)
Coastal North 17.5 259 19.9 371 2.3
Coastal Central 26.5 192 27.1 565 0.6
Coastal South 24.6 117 25.1 445 0.5
Andean North 10.5 123 11.4 311 0.9
Andean Central 11.8 764 13.6 540 1.8
Andean South 9.5 669 10.3 453 0.8
Amazon 14.2 483 17.0 269 2.8
Total Rural Peru 13.8 2,607 18.3 2954 4.4
Source: ENAHO 2004, four quarterly rounds, INEI, 2005.
30 Isolated Amazon areas are also very dangerous not only because of drug traffi cking, but also because the communities themselves are reluctant to have contact with people outside their communities. A few months prior to the Survey implementation, four health professionals from the Ministry of Health were assassinated by native people from Tagkijap community (El Comercio, 05/21/2005).
7134-CHAnnex1.pdf 80 7/27/10 6:56 AM
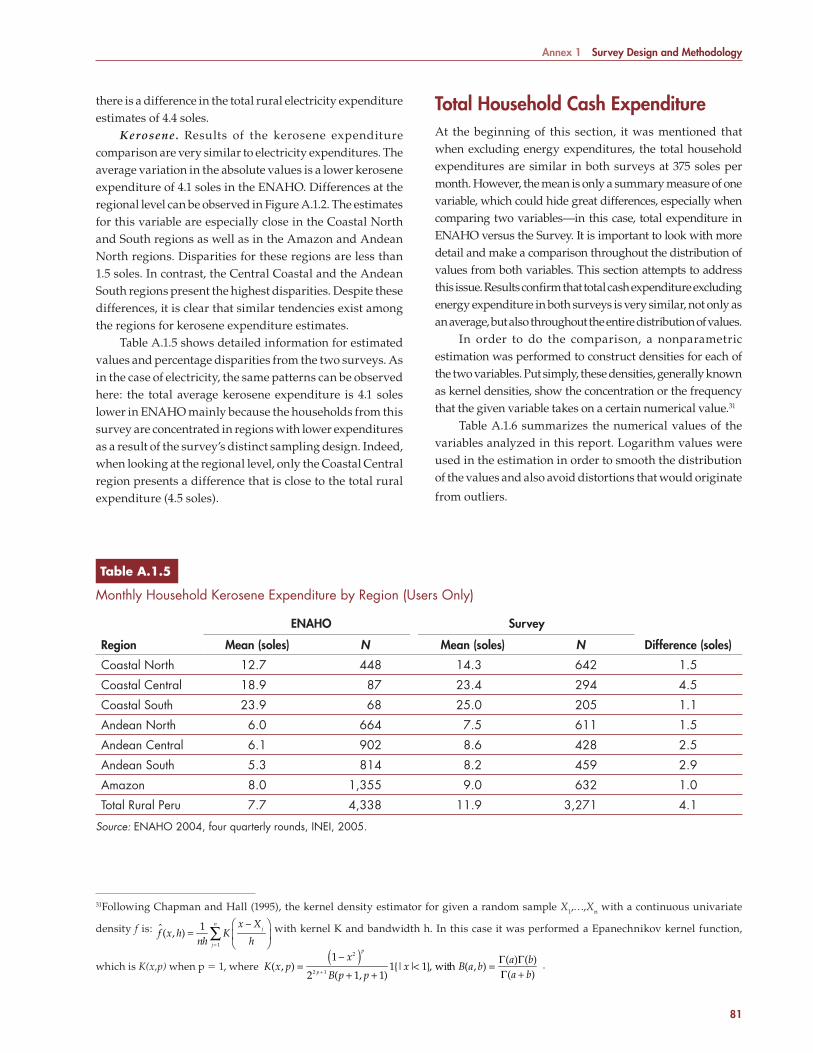
Annex 1 Survey Design and Methodology
81
Total Household Cash ExpenditureAt the beginning of this section, it was mentioned that when excluding energy expenditures, the total household expenditures are similar in both surveys at 375 soles per month. However, the mean is only a summary measure of one variable, which could hide great differences, especially when comparing two variables—in this case, total expenditure in ENAHO versus the Survey. It is important to look with more detail and make a comparison throughout the distribution of values from both variables. This section attempts to address this issue. Results confi rm that total cash expenditure excluding energy expenditure in both surveys is very similar, not only as an average, but also throughout the entire distribution of values.
In order to do the comparison, a nonparametric estimation was performed to construct densities for each of the two variables. Put simply, these densities, generally known as kernel densities, show the concentration or the frequency that the given variable takes on a certain numerical value.31
Table A.1.6 summarizes the numerical values of the variables analyzed in this report. Logarithm values were used in the estimation in order to smooth the distribution of the values and also avoid distortions that would originate
from outliers.
there is a difference in the total rural electricity expenditure estimates of 4.4 soles.
Kerosene. Results of the kerosene expenditure comparison are very similar to electricity expenditures. The average variation in the absolute values is a lower kerosene expenditure of 4.1 soles in the ENAHO. Differences at the regional level can be observed in Figure A.1.2. The estimates for this variable are especially close in the Coastal North and South regions as well as in the Amazon and Andean North regions. Disparities for these regions are less than 1.5 soles. In contrast, the Central Coastal and the Andean South regions present the highest disparities. Despite these differences, it is clear that similar tendencies exist among the regions for kerosene expenditure estimates.
Table A.1.5 shows detailed information for estimated values and percentage disparities from the two surveys. As in the case of electricity, the same patterns can be observed here: the total average kerosene expenditure is 4.1 soles lower in ENAHO mainly because the households from this survey are concentrated in regions with lower expenditures as a result of the survey’s distinct sampling design. Indeed, when looking at the regional level, only the Coastal Central region presents a difference that is close to the total rural expenditure (4.5 soles).
31Following Chapman and Hall (1995), the kernel density estimator for given a random sample X1,…,Xn with a continuous univariate
density f is: f (x, h) = 1nh
Kj= 1
n
∑x – Xj
h
⎛
⎝⎜
⎞
⎠⎟
with kernel K and bandwidth h. In this case it was performed a Epanechnikov kernel function,
which is K(x,p) when p � 1, where K(x, p) =1 – x2( )p
22 p + 1 B(p + 1, p + 1)1{|x|< 1}, with B(a, b) = Γ(a)Γ(b)
Γ(a + b).
Table A.1.5Table A.1.5
Monthly Household Kerosene Expenditure by Region (Users Only)
Region
ENAHO Survey
Mean (soles) N Mean (soles) N Difference (soles)
Coastal North 12.7 448 14.3 642 1.5
Coastal Central 18.9 87 23.4 294 4.5
Coastal South 23.9 68 25.0 205 1.1
Andean North 6.0 664 7.5 611 1.5
Andean Central 6.1 902 8.6 428 2.5
Andean South 5.3 814 8.2 459 2.9
Amazon 8.0 1,355 9.0 632 1.0
Total Rural Peru 7.7 4,338 11.9 3,271 4.1
Source: ENAHO 2004, four quarterly rounds, INEI, 2005.
7134-CHAnnex1.pdf 81 7/27/10 6:56 AM
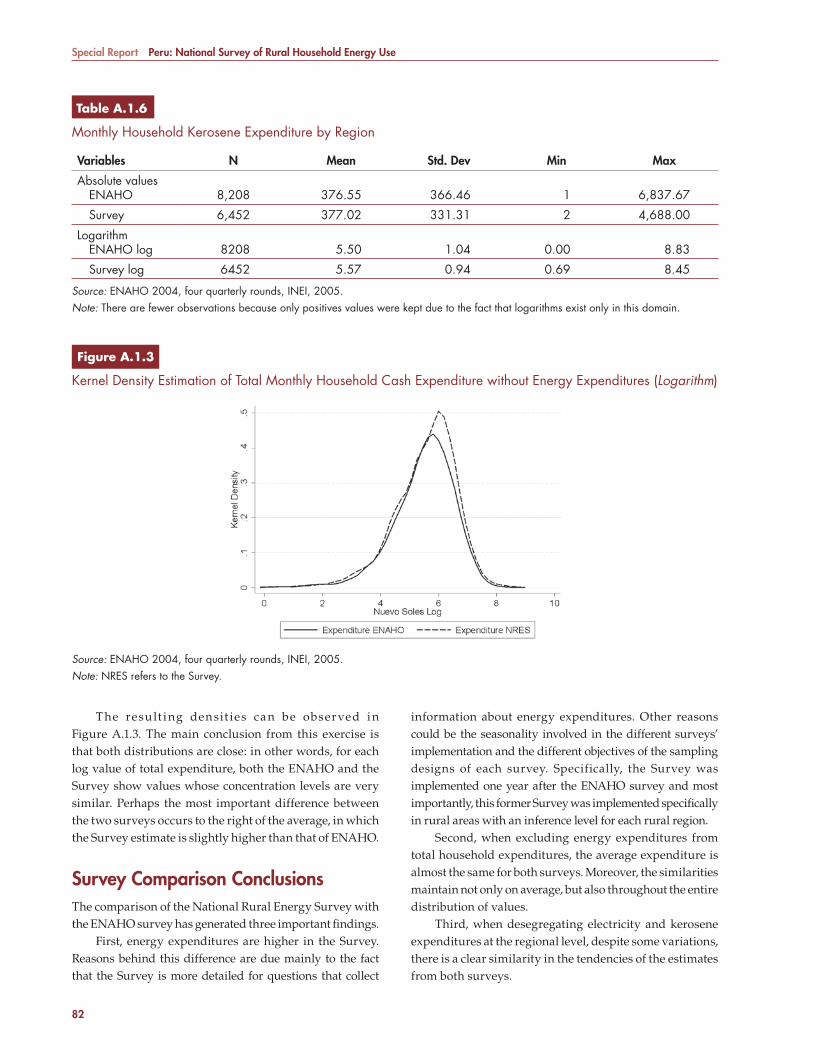
Special Report Peru: National Survey of Rural Household Energy Use
82
Table A.1.6Table A.1.6
Monthly Household Kerosene Expenditure by Region
Variables N Mean Std. Dev Min Max
Absolute values ENAHO 8,208 376.55 366.46 1 6,837.67
Survey 6,452 377.02 331.31 2 4,688.00
Logarithm ENAHO log 8208 5.50 1.04 0.00 8.83
Survey log 6452 5.57 0.94 0.69 8.45
Source: ENAHO 2004, four quarterly rounds, INEI, 2005.Note: There are fewer observations because only positives values were kept due to the fact that logarithms exist only in this domain.
Source: ENAHO 2004, four quarterly rounds, INEI, 2005.Note: NRES refers to the Survey.
Figure A.1.3Figure A.1.3
Kernel Density Estimation of Total Monthly Household Cash Expenditure without Energy Expenditures (Logarithm)
The result ing densit ies can be observed in Figure A.1.3. The main conclusion from this exercise is that both distributions are close: in other words, for each log value of total expenditure, both the ENAHO and the Survey show values whose concentration levels are very similar. Perhaps the most important difference between the two surveys occurs to the right of the average, in which the Survey estimate is slightly higher than that of ENAHO.
Survey Comparison ConclusionsThe comparison of the National Rural Energy Survey with the ENAHO survey has generated three important fi ndings.
First, energy expenditures are higher in the Survey. Reasons behind this difference are due mainly to the fact that the Survey is more detailed for questions that collect
information about energy expenditures. Other reasons could be the seasonality involved in the different surveys’ implementation and the different objectives of the sampling designs of each survey. Specifically, the Survey was implemented one year after the ENAHO survey and most importantly, this former Survey was implemented specifi cally in rural areas with an inference level for each rural region.
Second, when excluding energy expenditures from total household expenditures, the average expenditure is almost the same for both surveys. Moreover, the similarities maintain not only on average, but also throughout the entire distribution of values.
Third, when desegregating electricity and kerosene expenditures at the regional level, despite some variations, there is a clear similarity in the tendencies of the estimates from both surveys.
7134-CHAnnex1.pdf 82 7/27/10 6:56 AM

83
Annex 2
Survey Results
All the tables shown in Annex 2 summarize the results of the National Survey of Rural Household Energy Use (INEI, 2005). The results reported in this annex are after applying the weighting factors discussed in Annex 1, Section 4, unless otherwise specifi ed.
32 Source for Annex 2 is: Peru National Survey of Rural Household Energy Use, INEI, 2005.
Table A.2.1Table A.2.1
Percentage of Households that Use Each Type of Energy, by Region
Coastal Region Andean Region
AmazonAll
RegionsNorth Central South North Central South
Candle 47% 53% 60% 56% 69% 66% 46% 60%
Kerosene 71% 32% 31% 71% 44% 52% 73% 57%
Small generator 0.9% 1.3% — — 1.0% 0.2% 0.9% 0.6%
Dry cell battery 71% 51% 55% 78% 66% 74% 91% 74%
Car battery 31% 23% 13% 9% 8% 7% 15% 11%
Grid electricity 35% 60% 71% 22% 52% 44% 18% 39%
LPG 28% 63% 53% 5% 17% 10% 7% 14%
Fuelwood 85% 74% 68% 94% 92% 64% 95% 84%
Solar PV 0.3% 0.1% 0.1% 0.4% — 0.9% 1.1% 0.5%
Ag. residue 8% 7% 5% 5% 18% 13% 3% 11%
Dung 0.4% 0.5% 15% 3.6% 26% 65% 0.1% 25%
All Households 156,419 75,314 27,787 362,029 634,240 565,024 383,403 2,204,216
100% 100% 100% 100% 100% 100% 100% 100%Source: Authors’ calculations, 2005.
7134-CHAnnex2.pdf 83 8/25/10 10:16 AM
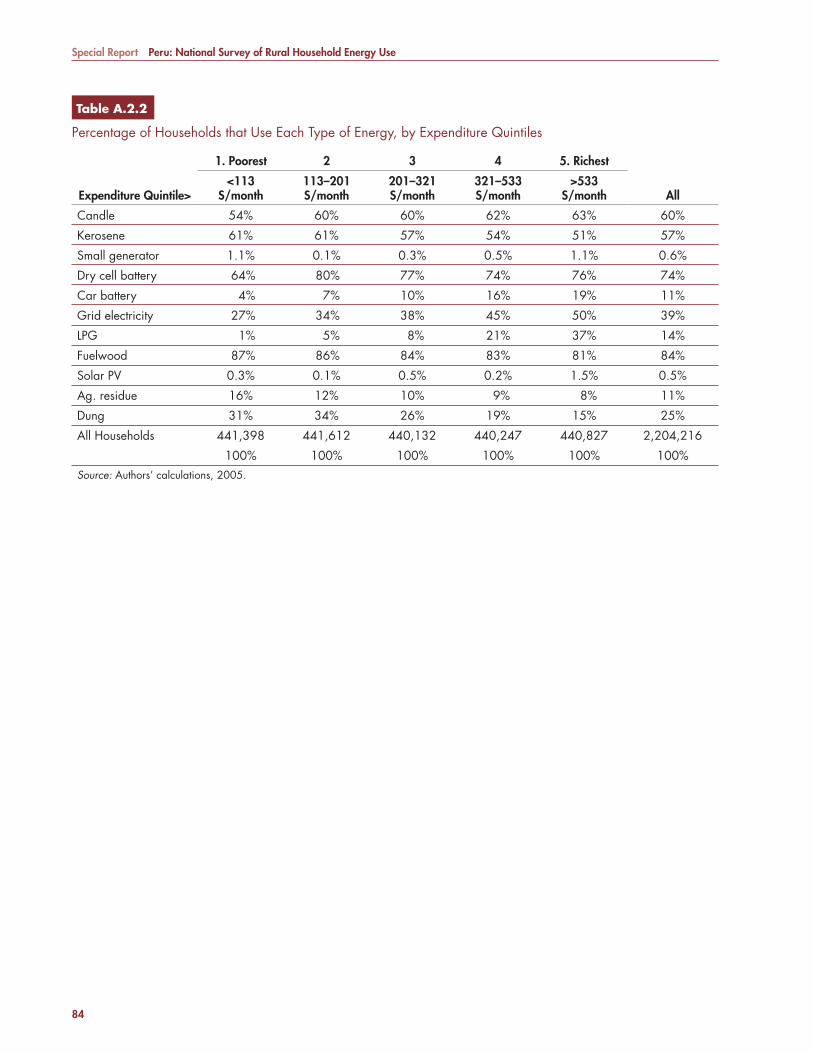
Special Report Peru: National Survey of Rural Household Energy Use
84
Table A.2.2Table A.2.2
Percentage of Households that Use Each Type of Energy, by Expenditure Quintiles
Expenditure Quintile>
1. Poorest 2 3 4 5. Richest
All<113
S/month113–201 S/month
201–321 S/month
321–533 S/month
>533 S/month
Candle 54% 60% 60% 62% 63% 60%
Kerosene 61% 61% 57% 54% 51% 57%
Small generator 1.1% 0.1% 0.3% 0.5% 1.1% 0.6%
Dry cell battery 64% 80% 77% 74% 76% 74%
Car battery 4% 7% 10% 16% 19% 11%
Grid electricity 27% 34% 38% 45% 50% 39%
LPG 1% 5% 8% 21% 37% 14%
Fuelwood 87% 86% 84% 83% 81% 84%
Solar PV 0.3% 0.1% 0.5% 0.2% 1.5% 0.5%
Ag. residue 16% 12% 10% 9% 8% 11%
Dung 31% 34% 26% 19% 15% 25%
All Households 441,398 441,612 440,132 440,247 440,827 2,204,216
100% 100% 100% 100% 100% 100%Source: Authors’ calculations, 2005.
7134-CHAnnex2.pdf 84 8/25/10 10:16 AM
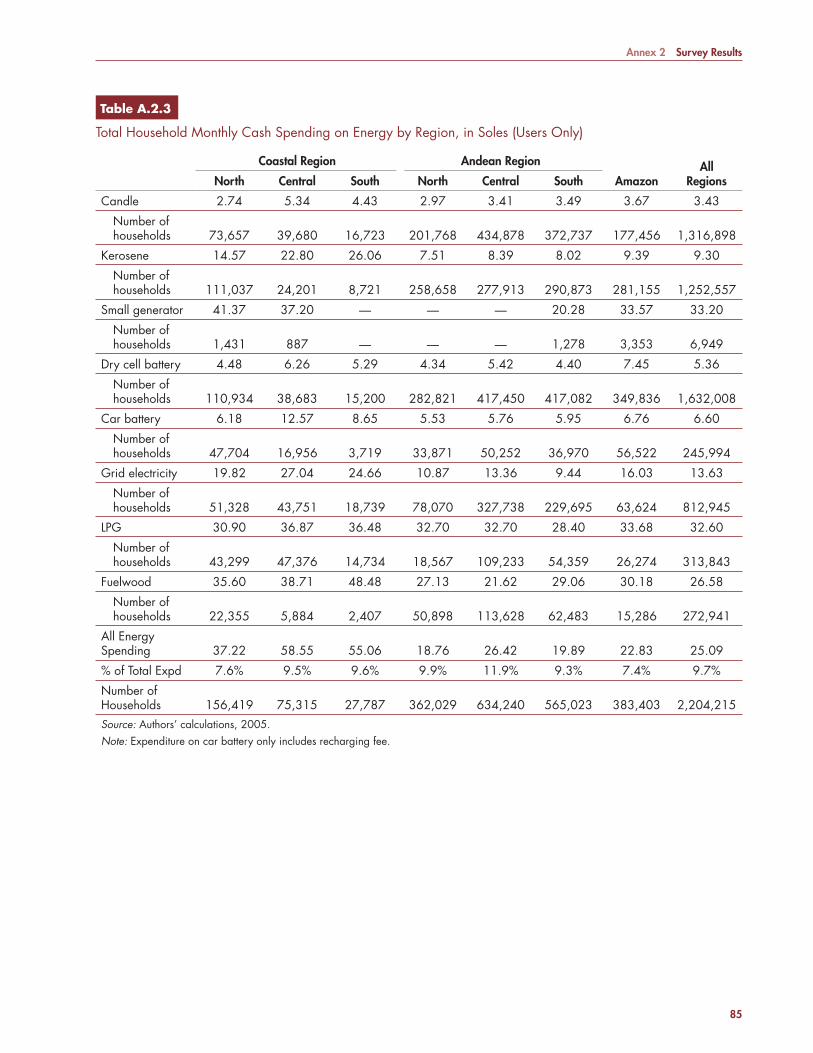
Annex 2 Survey Results
85
Table A.2.3Table A.2.3
Total Household Monthly Cash Spending on Energy by Region, in Soles (Users Only)
Coastal Region Andean Region
AmazonAll
RegionsNorth Central South North Central South
Candle 2.74 5.34 4.43 2.97 3.41 3.49 3.67 3.43
Number of households 73,657 39,680 16,723 201,768 434,878 372,737 177,456 1,316,898
Kerosene 14.57 22.80 26.06 7.51 8.39 8.02 9.39 9.30
Number of households 111,037 24,201 8,721 258,658 277,913 290,873 281,155 1,252,557
Small generator 41.37 37.20 — — — 20.28 33.57 33.20
Number of households 1,431 887 — — — 1,278 3,353 6,949
Dry cell battery 4.48 6.26 5.29 4.34 5.42 4.40 7.45 5.36
Number of households 110,934 38,683 15,200 282,821 417,450 417,082 349,836 1,632,008
Car battery 6.18 12.57 8.65 5.53 5.76 5.95 6.76 6.60
Number of households 47,704 16,956 3,719 33,871 50,252 36,970 56,522 245,994
Grid electricity 19.82 27.04 24.66 10.87 13.36 9.44 16.03 13.63
Number of households 51,328 43,751 18,739 78,070 327,738 229,695 63,624 812,945
LPG 30.90 36.87 36.48 32.70 32.70 28.40 33.68 32.60
Number of households 43,299 47,376 14,734 18,567 109,233 54,359 26,274 313,843
Fuelwood 35.60 38.71 48.48 27.13 21.62 29.06 30.18 26.58
Number of households 22,355 5,884 2,407 50,898 113,628 62,483 15,286 272,941
All Energy Spending 37.22 58.55 55.06 18.76 26.42 19.89 22.83 25.09
% of Total Expd 7.6% 9.5% 9.6% 9.9% 11.9% 9.3% 7.4% 9.7%
Number of Households 156,419 75,315 27,787 362,029 634,240 565,023 383,403 2,204,215Source: Authors’ calculations, 2005.Note: Expenditure on car battery only includes recharging fee.
7134-CHAnnex2.pdf 85 7/27/10 6:57 AM
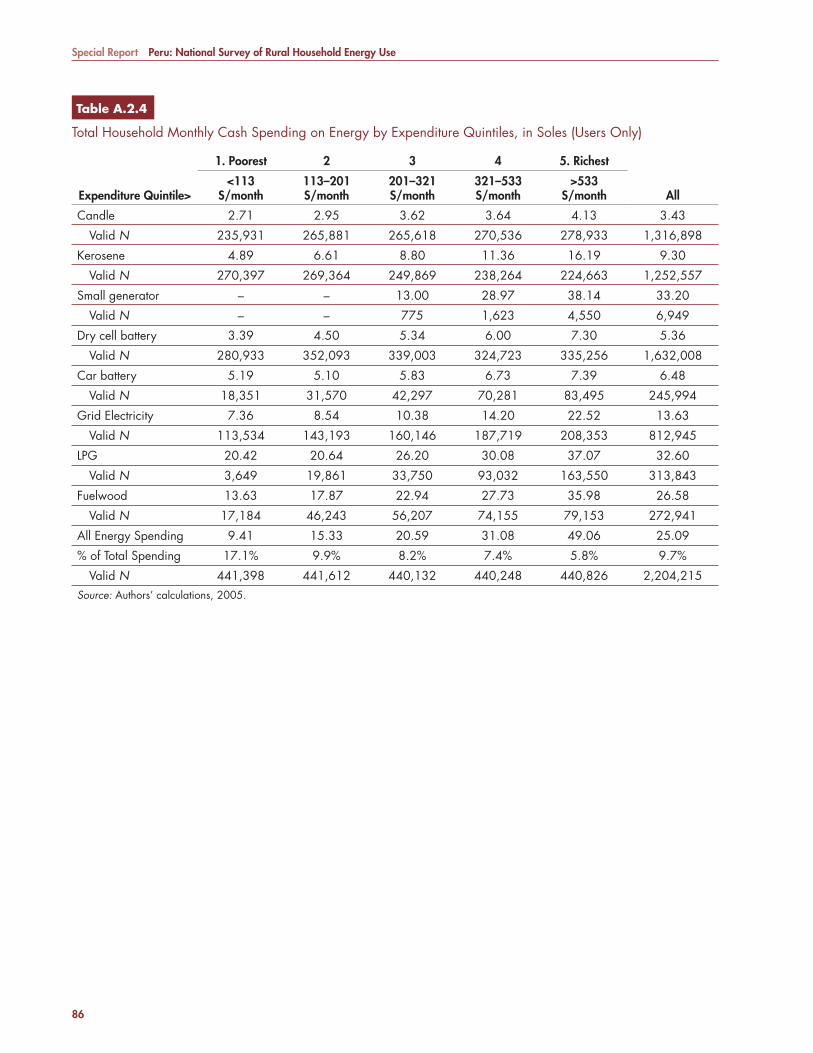
Special Report Peru: National Survey of Rural Household Energy Use
86
Table A.2.4Table A.2.4
Total Household Monthly Cash Spending on Energy by Expenditure Quintiles, in Soles (Users Only)
Expenditure Quintile>
1. Poorest 2 3 4 5. Richest
All<113
S/month113–201 S/month
201–321 S/month
321–533 S/month
>533 S/month
Candle 2.71 2.95 3.62 3.64 4.13 3.43
Valid N 235,931 265,881 265,618 270,536 278,933 1,316,898
Kerosene 4.89 6.61 8.80 11.36 16.19 9.30
Valid N 270,397 269,364 249,869 238,264 224,663 1,252,557
Small generator – – 13.00 28.97 38.14 33.20
Valid N – – 775 1,623 4,550 6,949
Dry cell battery 3.39 4.50 5.34 6.00 7.30 5.36
Valid N 280,933 352,093 339,003 324,723 335,256 1,632,008
Car battery 5.19 5.10 5.83 6.73 7.39 6.48
Valid N 18,351 31,570 42,297 70,281 83,495 245,994
Grid Electricity 7.36 8.54 10.38 14.20 22.52 13.63
Valid N 113,534 143,193 160,146 187,719 208,353 812,945
LPG 20.42 20.64 26.20 30.08 37.07 32.60
Valid N 3,649 19,861 33,750 93,032 163,550 313,843
Fuelwood 13.63 17.87 22.94 27.73 35.98 26.58
Valid N 17,184 46,243 56,207 74,155 79,153 272,941
All Energy Spending 9.41 15.33 20.59 31.08 49.06 25.09
% of Total Spending 17.1% 9.9% 8.2% 7.4% 5.8% 9.7%
Valid N 441,398 441,612 440,132 440,248 440,826 2,204,215Source: Authors’ calculations, 2005.
7134-CHAnnex2.pdf 86 7/27/10 6:57 AM
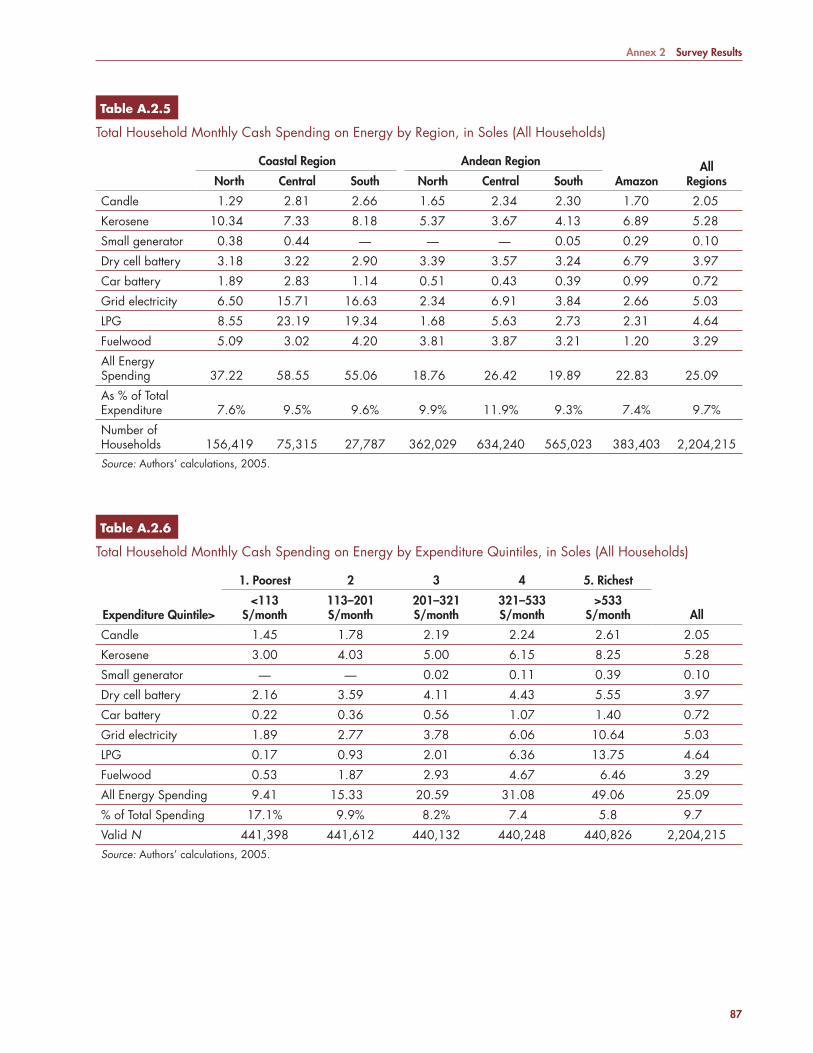
Annex 2 Survey Results
87
Table A.2.5Table A.2.5
Total Household Monthly Cash Spending on Energy by Region, in Soles (All Households)
Coastal Region Andean Region
AmazonAll
RegionsNorth Central South North Central South
Candle 1.29 2.81 2.66 1.65 2.34 2.30 1.70 2.05
Kerosene 10.34 7.33 8.18 5.37 3.67 4.13 6.89 5.28
Small generator 0.38 0.44 — — — 0.05 0.29 0.10
Dry cell battery 3.18 3.22 2.90 3.39 3.57 3.24 6.79 3.97
Car battery 1.89 2.83 1.14 0.51 0.43 0.39 0.99 0.72
Grid electricity 6.50 15.71 16.63 2.34 6.91 3.84 2.66 5.03
LPG 8.55 23.19 19.34 1.68 5.63 2.73 2.31 4.64
Fuelwood 5.09 3.02 4.20 3.81 3.87 3.21 1.20 3.29
All Energy Spending 37.22 58.55 55.06 18.76 26.42 19.89 22.83 25.09
As % of Total Expenditure 7.6% 9.5% 9.6% 9.9% 11.9% 9.3% 7.4% 9.7%
Number of Households 156,419 75,315 27,787 362,029 634,240 565,023 383,403 2,204,215Source: Authors’ calculations, 2005.
Table A.2.6Table A.2.6
Total Household Monthly Cash Spending on Energy by Expenditure Quintiles, in Soles (All Households)
Expenditure Quintile>
1. Poorest 2 3 4 5. Richest
All<113
S/month113–201 S/month
201–321 S/month
321–533 S/month
>533 S/month
Candle 1.45 1.78 2.19 2.24 2.61 2.05
Kerosene 3.00 4.03 5.00 6.15 8.25 5.28
Small generator — — 0.02 0.11 0.39 0.10
Dry cell battery 2.16 3.59 4.11 4.43 5.55 3.97
Car battery 0.22 0.36 0.56 1.07 1.40 0.72
Grid electricity 1.89 2.77 3.78 6.06 10.64 5.03
LPG 0.17 0.93 2.01 6.36 13.75 4.64
Fuelwood 0.53 1.87 2.93 4.67 6.46 3.29
All Energy Spending 9.41 15.33 20.59 31.08 49.06 25.09
% of Total Spending 17.1% 9.9% 8.2% 7.4 5.8 9.7
Valid N 441,398 441,612 440,132 440,248 440,826 2,204,215Source: Authors’ calculations, 2005.
7134-CHAnnex2.pdf 87 7/27/10 6:57 AM

Special Report Peru: National Survey of Rural Household Energy Use
88
Table A.2.7Table A.2.7
Percentage of Households that Use Each Type of Energy by Electrifi cation Status and Region
Coastal Region Andean Region AmazonRegion
AllRegionsNorth Central South North Central South
With Access to Grid Electricity
Candle 50% 31% 49% 41% 57% 52% 48% 51%
Kerosene 31% 15% 21% 12% 19% 20% 26% 20%
Small generator — — — — — — 0.2% 0.0%
Dry cell battery 46% 34% 42% 50% 52% 61% 77% 55%
Car battery 0.3% 0.2% 3.5% 1.0% 0.4% 0.8% 1.5% 0.7%
Grid electricity 100% 100% 100% 100% 100% 100% 100% 100%
LPG 58% 74% 65% 18% 27% 14% 29% 28%
Fuelwood 70% 66% 60% 89% 89% 74% 87% 81%
Solar PV — — — — — — 0.2% 0.0%
Ag. residue 4% 4% 4% 1.6% 17% 14% 5% 12%
Dung 0.1% 0.4% 12% 1.7% 25% 54% 0.7% 26.2%
All Households 54,585 45,378 19,651 80,260 332,084 250,561 68,990 851,509
100% 100% 100% 100% 100% 100% 100% 100%
Without Access to Grid Electricity
Candle 46% 85% 88% 60% 81% 77% 46% 65%
Kerosene 93% 58% 57% 89% 71% 76% 84% 80%
Small generator 1.4% 3.2% — — 2.0% 0.4% 1.0% 1.0%
Dry cell battery 85% 77% 85% 86% 81% 84% 95% 86%
Car battery 47% 56% 37% 12% 16% 11% 18% 18%
Grid electricity — — — — — — — —
LPG 11% 46% 24% 2% 6% 6% 2% 6%
Fuelwood 93% 85% 86% 95% 95% 57% 97% 86%
Solar PV 0.4% 0.3% 0.5% 0.5% — 1.6% 1.3% 0.8%
Ag. residue 10% 12% 8% 6% 19% 13% 3% 10%
Animal dung 0.5% 0.5% 21% 4% 28% 73% — 24%
All Households 101,835 29,936 8,136 281,769 302,156 314,462 314,413 1,352,707
Source: Authors’ calculations, 2005.
7134-CHAnnex2.pdf 88 8/25/10 10:17 AM
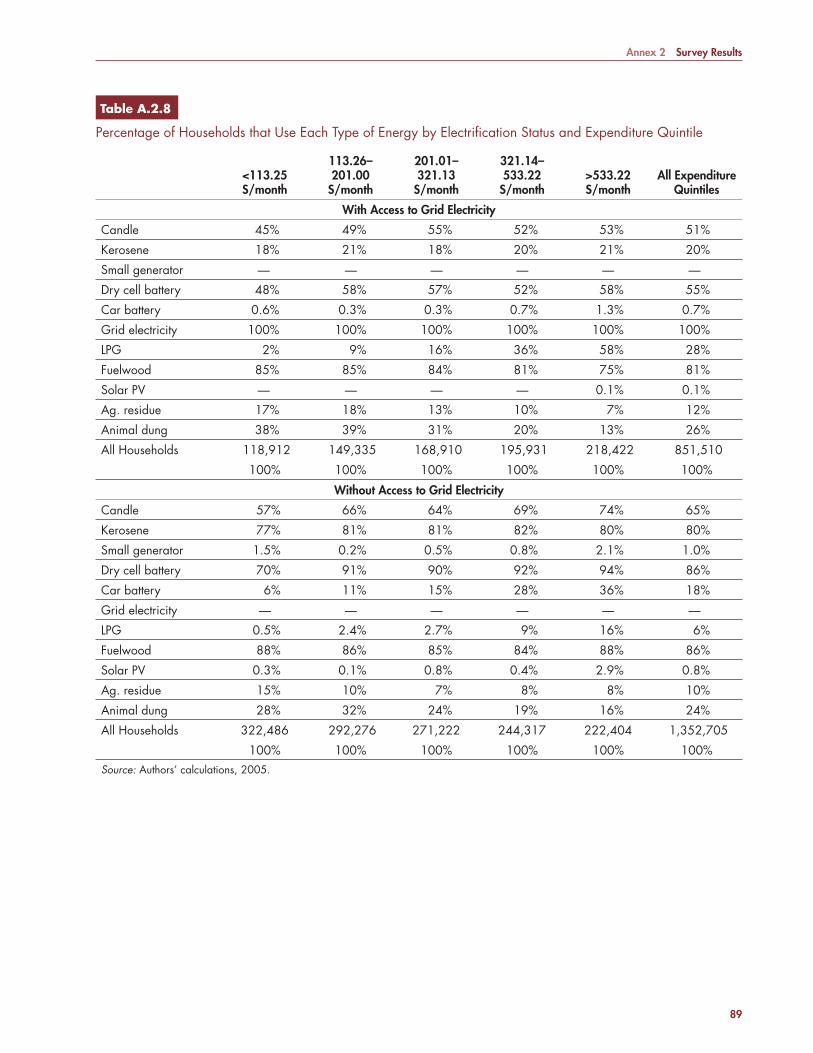
Annex 2 Survey Results
89
Table A.2.8Table A.2.8
Percentage of Households that Use Each Type of Energy by Electrifi cation Status and Expenditure Quintile
<113.25 S/month
113.26–201.00
S/month
201.01–321.13
S/month
321.14–533.22
S/month>533.22 S/month
All Expenditure Quintiles
With Access to Grid Electricity
Candle 45% 49% 55% 52% 53% 51%
Kerosene 18% 21% 18% 20% 21% 20%
Small generator — — — — — —
Dry cell battery 48% 58% 57% 52% 58% 55%
Car battery 0.6% 0.3% 0.3% 0.7% 1.3% 0.7%
Grid electricity 100% 100% 100% 100% 100% 100%
LPG 2% 9% 16% 36% 58% 28%
Fuelwood 85% 85% 84% 81% 75% 81%
Solar PV — — — — 0.1% 0.1%
Ag. residue 17% 18% 13% 10% 7% 12%
Animal dung 38% 39% 31% 20% 13% 26%
All Households 118,912 149,335 168,910 195,931 218,422 851,510
100% 100% 100% 100% 100% 100%
Without Access to Grid Electricity
Candle 57% 66% 64% 69% 74% 65%
Kerosene 77% 81% 81% 82% 80% 80%
Small generator 1.5% 0.2% 0.5% 0.8% 2.1% 1.0%
Dry cell battery 70% 91% 90% 92% 94% 86%
Car battery 6% 11% 15% 28% 36% 18%
Grid electricity — — — — — —
LPG 0.5% 2.4% 2.7% 9% 16% 6%
Fuelwood 88% 86% 85% 84% 88% 86%
Solar PV 0.3% 0.1% 0.8% 0.4% 2.9% 0.8%
Ag. residue 15% 10% 7% 8% 8% 10%
Animal dung 28% 32% 24% 19% 16% 24%
All Households 322,486 292,276 271,222 244,317 222,404 1,352,705
100% 100% 100% 100% 100% 100%Source: Authors’ calculations, 2005.
7134-CHAnnex2.pdf 89 8/25/10 10:17 AM
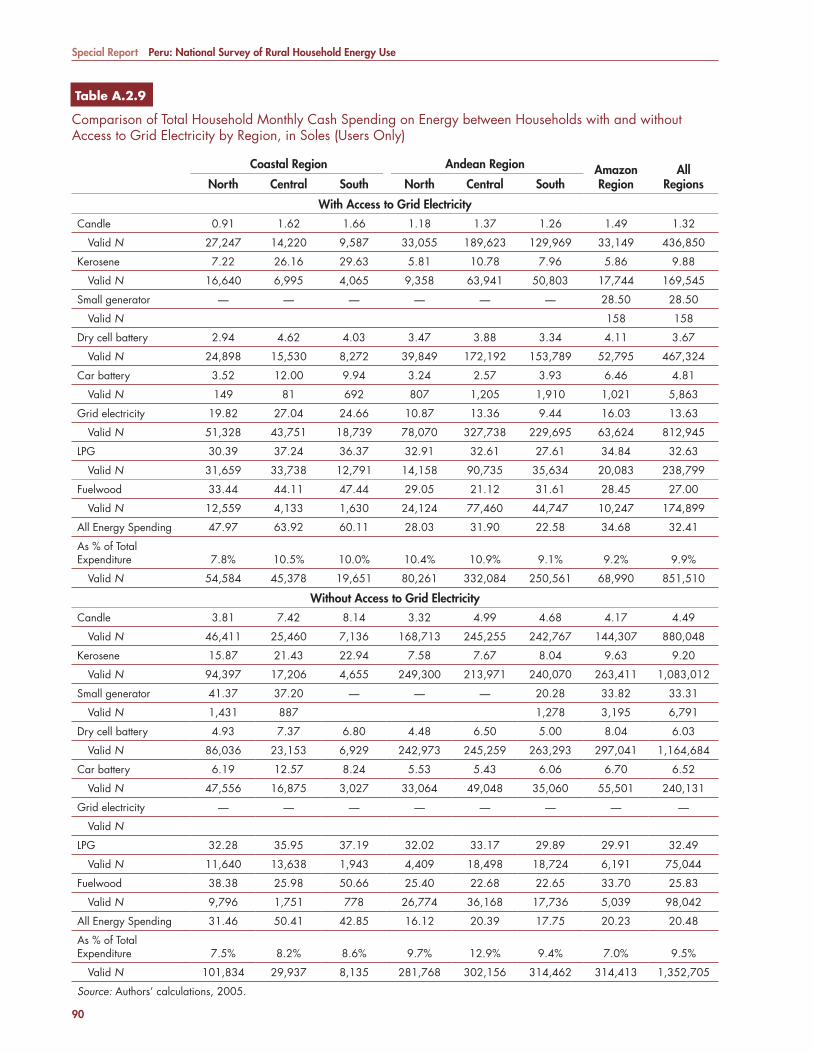
Special Report Peru: National Survey of Rural Household Energy Use
90
Table A.2.9Table A.2.9
Comparison of Total Household Monthly Cash Spending on Energy between Households with and without Access to Grid Electricity by Region, in Soles (Users Only)
Coastal Region Andean Region AmazonRegion
AllRegionsNorth Central South North Central South
With Access to Grid Electricity
Candle 0.91 1.62 1.66 1.18 1.37 1.26 1.49 1.32
Valid N 27,247 14,220 9,587 33,055 189,623 129,969 33,149 436,850
Kerosene 7.22 26.16 29.63 5.81 10.78 7.96 5.86 9.88
Valid N 16,640 6,995 4,065 9,358 63,941 50,803 17,744 169,545
Small generator — — — — — — 28.50 28.50
Valid N 158 158
Dry cell battery 2.94 4.62 4.03 3.47 3.88 3.34 4.11 3.67
Valid N 24,898 15,530 8,272 39,849 172,192 153,789 52,795 467,324
Car battery 3.52 12.00 9.94 3.24 2.57 3.93 6.46 4.81
Valid N 149 81 692 807 1,205 1,910 1,021 5,863
Grid electricity 19.82 27.04 24.66 10.87 13.36 9.44 16.03 13.63
Valid N 51,328 43,751 18,739 78,070 327,738 229,695 63,624 812,945
LPG 30.39 37.24 36.37 32.91 32.61 27.61 34.84 32.63
Valid N 31,659 33,738 12,791 14,158 90,735 35,634 20,083 238,799
Fuelwood 33.44 44.11 47.44 29.05 21.12 31.61 28.45 27.00
Valid N 12,559 4,133 1,630 24,124 77,460 44,747 10,247 174,899
All Energy Spending 47.97 63.92 60.11 28.03 31.90 22.58 34.68 32.41
As % of Total Expenditure 7.8% 10.5% 10.0% 10.4% 10.9% 9.1% 9.2% 9.9%
Valid N 54,584 45,378 19,651 80,261 332,084 250,561 68,990 851,510
Without Access to Grid Electricity
Candle 3.81 7.42 8.14 3.32 4.99 4.68 4.17 4.49
Valid N 46,411 25,460 7,136 168,713 245,255 242,767 144,307 880,048
Kerosene 15.87 21.43 22.94 7.58 7.67 8.04 9.63 9.20
Valid N 94,397 17,206 4,655 249,300 213,971 240,070 263,411 1,083,012
Small generator 41.37 37.20 — — — 20.28 33.82 33.31
Valid N 1,431 887 1,278 3,195 6,791
Dry cell battery 4.93 7.37 6.80 4.48 6.50 5.00 8.04 6.03
Valid N 86,036 23,153 6,929 242,973 245,259 263,293 297,041 1,164,684
Car battery 6.19 12.57 8.24 5.53 5.43 6.06 6.70 6.52
Valid N 47,556 16,875 3,027 33,064 49,048 35,060 55,501 240,131
Grid electricity — — — — — — — —
Valid N
LPG 32.28 35.95 37.19 32.02 33.17 29.89 29.91 32.49
Valid N 11,640 13,638 1,943 4,409 18,498 18,724 6,191 75,044
Fuelwood 38.38 25.98 50.66 25.40 22.68 22.65 33.70 25.83
Valid N 9,796 1,751 778 26,774 36,168 17,736 5,039 98,042
All Energy Spending 31.46 50.41 42.85 16.12 20.39 17.75 20.23 20.48
As % of Total Expenditure 7.5% 8.2% 8.6% 9.7% 12.9% 9.4% 7.0% 9.5%
Valid N 101,834 29,937 8,135 281,768 302,156 314,462 314,413 1,352,705
Source: Authors’ calculations, 2005.
7134-CHAnnex2.pdf 90 7/27/10 6:57 AM
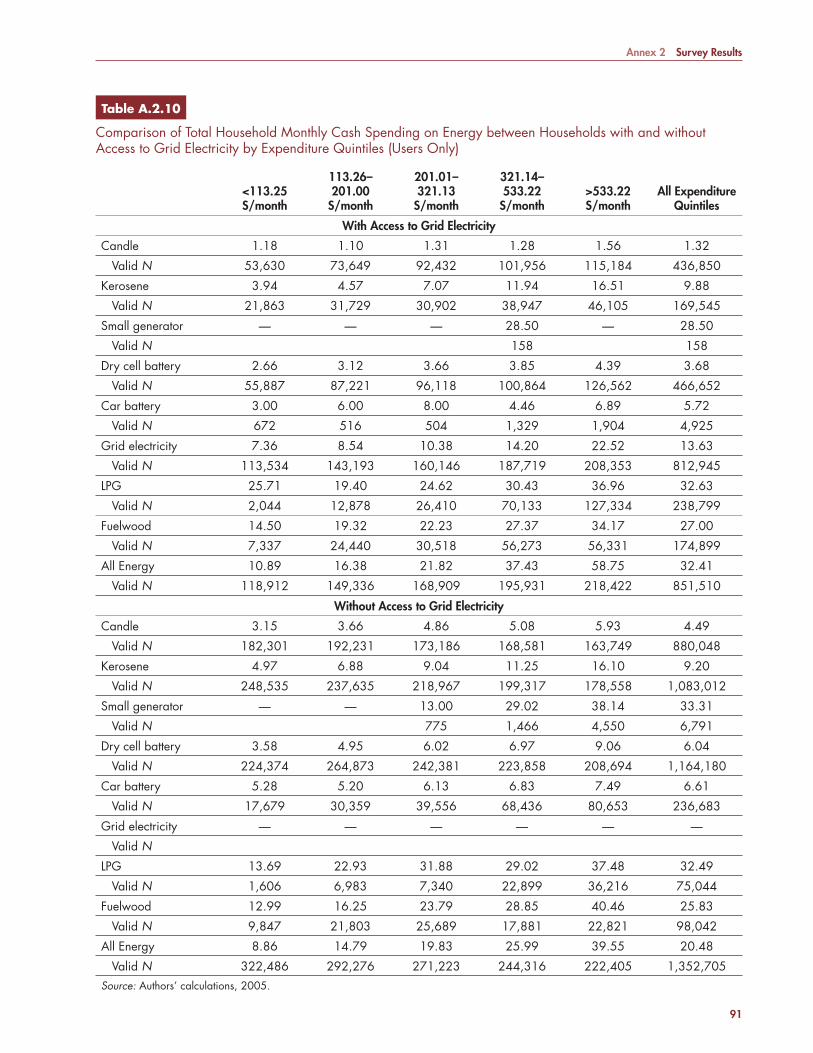
Annex 2 Survey Results
91
Table A.2.10Table A.2.10
Comparison of Total Household Monthly Cash Spending on Energy between Households with and without Access to Grid Electricity by Expenditure Quintiles (Users Only)
<113.25 S/month
113.26–201.00
S/month
201.01–321.13
S/month
321.14–533.22
S/month>533.22 S/month
All Expenditure Quintiles
With Access to Grid Electricity
Candle 1.18 1.10 1.31 1.28 1.56 1.32
Valid N 53,630 73,649 92,432 101,956 115,184 436,850
Kerosene 3.94 4.57 7.07 11.94 16.51 9.88
Valid N 21,863 31,729 30,902 38,947 46,105 169,545
Small generator — — — 28.50 — 28.50
Valid N 158 158
Dry cell battery 2.66 3.12 3.66 3.85 4.39 3.68
Valid N 55,887 87,221 96,118 100,864 126,562 466,652
Car battery 3.00 6.00 8.00 4.46 6.89 5.72
Valid N 672 516 504 1,329 1,904 4,925
Grid electricity 7.36 8.54 10.38 14.20 22.52 13.63
Valid N 113,534 143,193 160,146 187,719 208,353 812,945
LPG 25.71 19.40 24.62 30.43 36.96 32.63
Valid N 2,044 12,878 26,410 70,133 127,334 238,799
Fuelwood 14.50 19.32 22.23 27.37 34.17 27.00
Valid N 7,337 24,440 30,518 56,273 56,331 174,899
All Energy 10.89 16.38 21.82 37.43 58.75 32.41
Valid N 118,912 149,336 168,909 195,931 218,422 851,510
Without Access to Grid Electricity
Candle 3.15 3.66 4.86 5.08 5.93 4.49
Valid N 182,301 192,231 173,186 168,581 163,749 880,048
Kerosene 4.97 6.88 9.04 11.25 16.10 9.20
Valid N 248,535 237,635 218,967 199,317 178,558 1,083,012
Small generator — — 13.00 29.02 38.14 33.31
Valid N 775 1,466 4,550 6,791
Dry cell battery 3.58 4.95 6.02 6.97 9.06 6.04
Valid N 224,374 264,873 242,381 223,858 208,694 1,164,180
Car battery 5.28 5.20 6.13 6.83 7.49 6.61
Valid N 17,679 30,359 39,556 68,436 80,653 236,683
Grid electricity — — — — — —
Valid N
LPG 13.69 22.93 31.88 29.02 37.48 32.49
Valid N 1,606 6,983 7,340 22,899 36,216 75,044
Fuelwood 12.99 16.25 23.79 28.85 40.46 25.83
Valid N 9,847 21,803 25,689 17,881 22,821 98,042
All Energy 8.86 14.79 19.83 25.99 39.55 20.48
Valid N 322,486 292,276 271,223 244,316 222,405 1,352,705Source: Authors’ calculations, 2005.
7134-CHAnnex2.pdf 91 7/27/10 6:57 AM
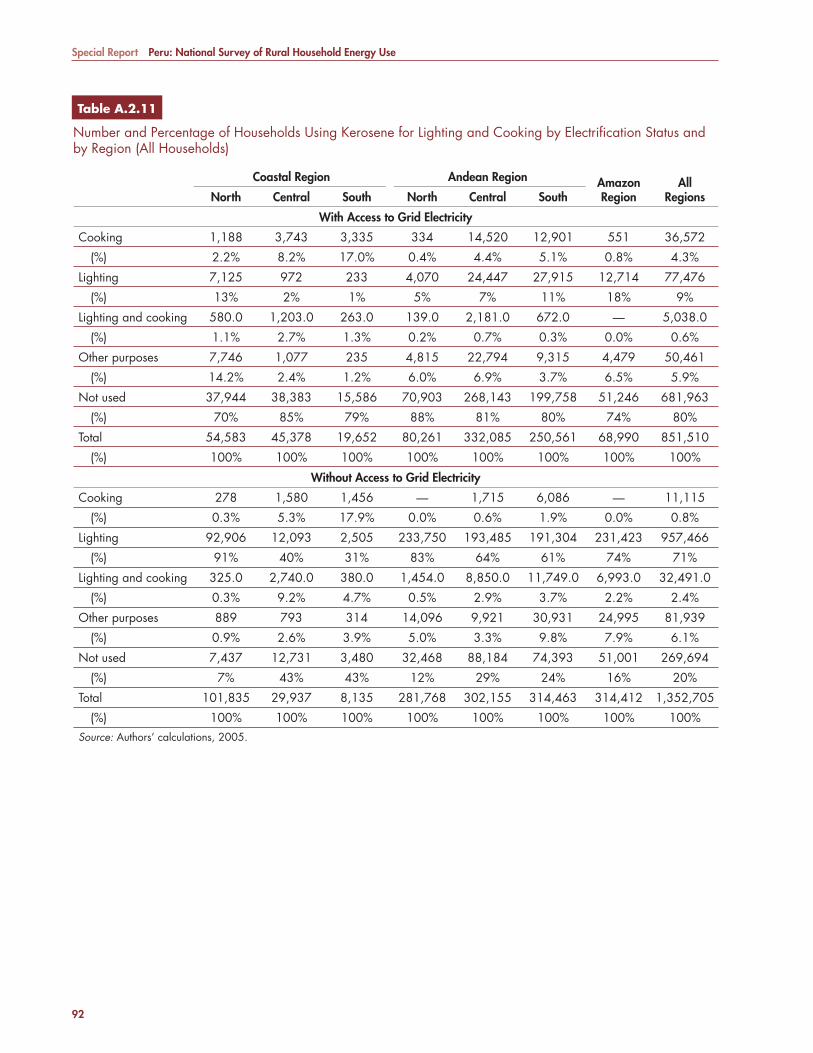
Special Report Peru: National Survey of Rural Household Energy Use
92
Table A.2.11Table A.2.11
Number and Percentage of Households Using Kerosene for Lighting and Cooking by Electrifi cation Status and by Region (All Households)
Coastal Region Andean Region AmazonRegion
AllRegionsNorth Central South North Central South
With Access to Grid Electricity
Cooking 1,188 3,743 3,335 334 14,520 12,901 551 36,572
(%) 2.2% 8.2% 17.0% 0.4% 4.4% 5.1% 0.8% 4.3%
Lighting 7,125 972 233 4,070 24,447 27,915 12,714 77,476
(%) 13% 2% 1% 5% 7% 11% 18% 9%
Lighting and cooking 580.0 1,203.0 263.0 139.0 2,181.0 672.0 — 5,038.0
(%) 1.1% 2.7% 1.3% 0.2% 0.7% 0.3% 0.0% 0.6%
Other purposes 7,746 1,077 235 4,815 22,794 9,315 4,479 50,461
(%) 14.2% 2.4% 1.2% 6.0% 6.9% 3.7% 6.5% 5.9%
Not used 37,944 38,383 15,586 70,903 268,143 199,758 51,246 681,963
(%) 70% 85% 79% 88% 81% 80% 74% 80%
Total 54,583 45,378 19,652 80,261 332,085 250,561 68,990 851,510
(%) 100% 100% 100% 100% 100% 100% 100% 100%
Without Access to Grid Electricity
Cooking 278 1,580 1,456 — 1,715 6,086 — 11,115
(%) 0.3% 5.3% 17.9% 0.0% 0.6% 1.9% 0.0% 0.8%
Lighting 92,906 12,093 2,505 233,750 193,485 191,304 231,423 957,466
(%) 91% 40% 31% 83% 64% 61% 74% 71%
Lighting and cooking 325.0 2,740.0 380.0 1,454.0 8,850.0 11,749.0 6,993.0 32,491.0
(%) 0.3% 9.2% 4.7% 0.5% 2.9% 3.7% 2.2% 2.4%
Other purposes 889 793 314 14,096 9,921 30,931 24,995 81,939
(%) 0.9% 2.6% 3.9% 5.0% 3.3% 9.8% 7.9% 6.1%
Not used 7,437 12,731 3,480 32,468 88,184 74,393 51,001 269,694
(%) 7% 43% 43% 12% 29% 24% 16% 20%
Total 101,835 29,937 8,135 281,768 302,155 314,463 314,412 1,352,705
(%) 100% 100% 100% 100% 100% 100% 100% 100%Source: Authors’ calculations, 2005.
7134-CHAnnex2.pdf 92 7/27/10 6:57 AM

Annex 2 Survey Results
93
Table A.2.12Table A.2.12
Number and Percentage of Households Using Kerosene for Lighting and Cooking by Region (All Households)
Coastal Region Andean Region AmazonRegion
AllRegionsNorth Central South North Central South
All Areas (Electrifi ed and Unelectrifi ed)
Cooking 1,467 5,323 4,790 334 16,235 18,986 551 47,686
(%) 0.9% 7.1% 17.2% 0.1% 2.6% 3.4% 0.1% 2%
Lighting 100,031 13,066 2,738 237,820 217,932 219,219 244,137 1,034,943
(%) 64% 17% 10% 66% 34% 39% 64% 47%
Lighting and cooking 905 3,943 643 1,593 11,031 12,420 6,993 37,528
(%) 0.6% 5.2% 2.3% 0.4% 1.7% 2.2% 1.8% 1.7%
Other purposes 8,634 1,869 549 18,911 32,715 40,247 29,474 132,399
(%) 5.5% 2.5% 2.0% 5.2% 5.2% 7.1% 7.7% 6.00%
Not used 45,382 51,114 19,066 103,371 356,327 274,151 102,248 951,659
(%) 29% 68% 69% 29% 56% 49% 27% 43%
Total 156,419 75,315 27,786 362,029 634,240 565,023 383,403 2,204,215
(%) 100% 100% 100% 100% 100% 100% 100% 100%Source: Authors’ calculations, 2005.
7134-CHAnnex2.pdf 93 7/27/10 6:57 AM
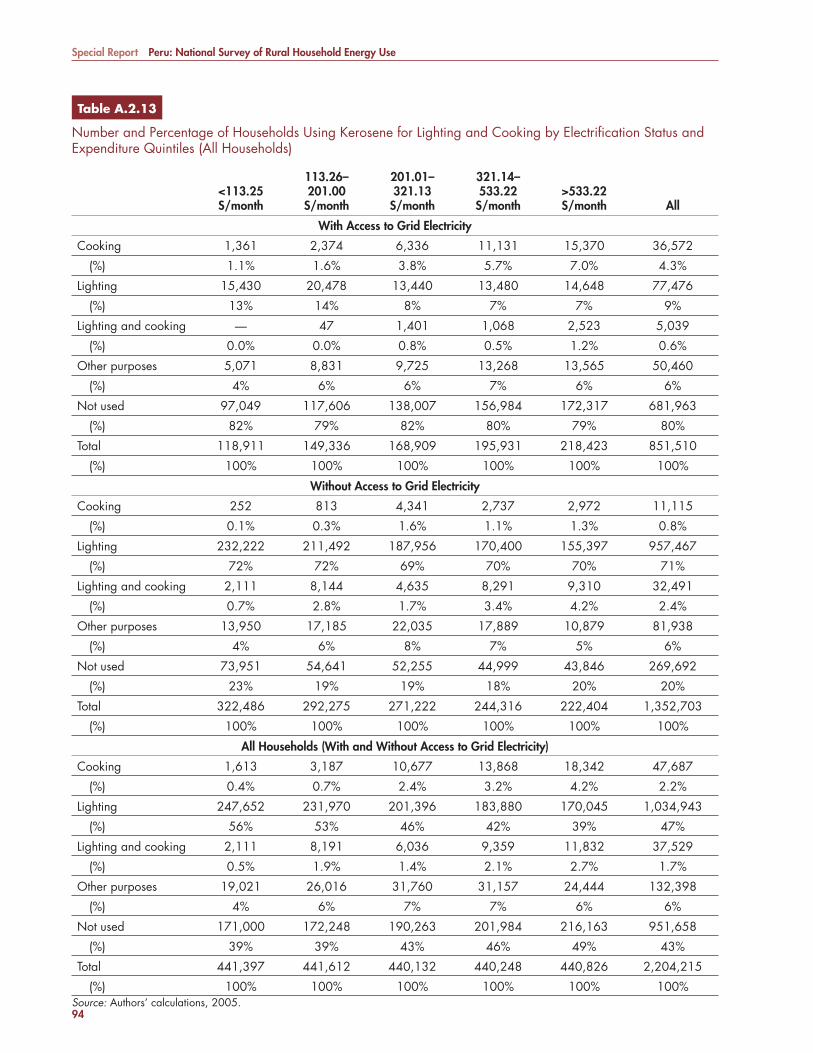
Special Report Peru: National Survey of Rural Household Energy Use
94
Table A.2.13Table A.2.13
Number and Percentage of Households Using Kerosene for Lighting and Cooking by Electrifi cation Status and Expenditure Quintiles (All Households)
<113.25 S/month
113.26–201.00
S/month
201.01–321.13
S/month
321.14–533.22
S/month>533.22 S/month All
With Access to Grid Electricity
Cooking 1,361 2,374 6,336 11,131 15,370 36,572
(%) 1.1% 1.6% 3.8% 5.7% 7.0% 4.3%
Lighting 15,430 20,478 13,440 13,480 14,648 77,476
(%) 13% 14% 8% 7% 7% 9%
Lighting and cooking — 47 1,401 1,068 2,523 5,039
(%) 0.0% 0.0% 0.8% 0.5% 1.2% 0.6%
Other purposes 5,071 8,831 9,725 13,268 13,565 50,460
(%) 4% 6% 6% 7% 6% 6%
Not used 97,049 117,606 138,007 156,984 172,317 681,963
(%) 82% 79% 82% 80% 79% 80%
Total 118,911 149,336 168,909 195,931 218,423 851,510
(%) 100% 100% 100% 100% 100% 100%
Without Access to Grid Electricity
Cooking 252 813 4,341 2,737 2,972 11,115
(%) 0.1% 0.3% 1.6% 1.1% 1.3% 0.8%
Lighting 232,222 211,492 187,956 170,400 155,397 957,467
(%) 72% 72% 69% 70% 70% 71%
Lighting and cooking 2,111 8,144 4,635 8,291 9,310 32,491
(%) 0.7% 2.8% 1.7% 3.4% 4.2% 2.4%
Other purposes 13,950 17,185 22,035 17,889 10,879 81,938
(%) 4% 6% 8% 7% 5% 6%
Not used 73,951 54,641 52,255 44,999 43,846 269,692
(%) 23% 19% 19% 18% 20% 20%
Total 322,486 292,275 271,222 244,316 222,404 1,352,703
(%) 100% 100% 100% 100% 100% 100%
All Households (With and Without Access to Grid Electricity)
Cooking 1,613 3,187 10,677 13,868 18,342 47,687
(%) 0.4% 0.7% 2.4% 3.2% 4.2% 2.2%
Lighting 247,652 231,970 201,396 183,880 170,045 1,034,943
(%) 56% 53% 46% 42% 39% 47%
Lighting and cooking 2,111 8,191 6,036 9,359 11,832 37,529
(%) 0.5% 1.9% 1.4% 2.1% 2.7% 1.7%
Other purposes 19,021 26,016 31,760 31,157 24,444 132,398
(%) 4% 6% 7% 7% 6% 6%
Not used 171,000 172,248 190,263 201,984 216,163 951,658
(%) 39% 39% 43% 46% 49% 43%
Total 441,397 441,612 440,132 440,248 440,826 2,204,215
(%) 100% 100% 100% 100% 100% 100%Source: Authors’ calculations, 2005.
7134-CHAnnex2.pdf 94 7/27/10 6:57 AM

Annex 2 Survey Results
95
Table A.2.14Table A.2.14
Number and Percentage of Households Using Kerosene and Candles for Lighting by Electrifi cation Status and Region (All Households)
Coastal Region Andean Region AmazonRegion
AllRegionsNorth Central South North Central South
Without Access to Grid Electricity
Do not use candles/kero 22,822 30,226 9,850 44,838 133,034 105,537 26,993 373,300
(%) 42% 67% 50% 56% 40% 42% 39% 44%
Kerosene only 4,516 932 214 2,367 9,427 15,055 8,849 41,360
(%) 8% 2% 1% 3% 3% 6% 13% 5%
Candles only 24,056 12,976 9,306 31,214 172,423 116,437 29,284 395,696
(%) 44% 29% 47% 39% 52% 47% 42% 47%
Candles and kerosene 3,190 1,244 281 1,842 17,200 13,532 3,865 41,154
(%) 6% 3% 1% 2% 5% 5% 6% 5%
Total 54,584 45,378 19,651 80,261 332,084 250,561 68,991 851,510
(%) 100% 100% 100% 100% 100% 100% 100% 100%
Without Access to Grid Electricity
Do not use candles/kero 3,173 812 266 5,101 2,576 10,263 36,576 58,767
(%) 3% 3% 3% 2% 1% 3% 12% 4%
Kerosene only 52,251 3,664 734 107,954 54,325 61,432 133,530 413,890
(%) 51% 12% 9% 38% 18% 20% 43% 31%
Candles only 5,431 14,291 4,984 41,462 97,245 101,146 39,421 303,980
(%) 5% 48% 61% 15% 32% 32% 13% 23%
Candles and kerosene 40,979 11,169 2,152 127,250 148,010 141,621 104,886 576,067
(%) 40% 37% 27% 45% 49% 45% 33% 43%
Total 101,834 29,936 8,136 281,767 302,156 314,462 314,413 1,352,704
(%) 100% 100% 100% 100% 100% 100% 100% 100%Source: Authors’ calculations, 2005.
7134-CHAnnex2.pdf 95 7/27/10 6:57 AM
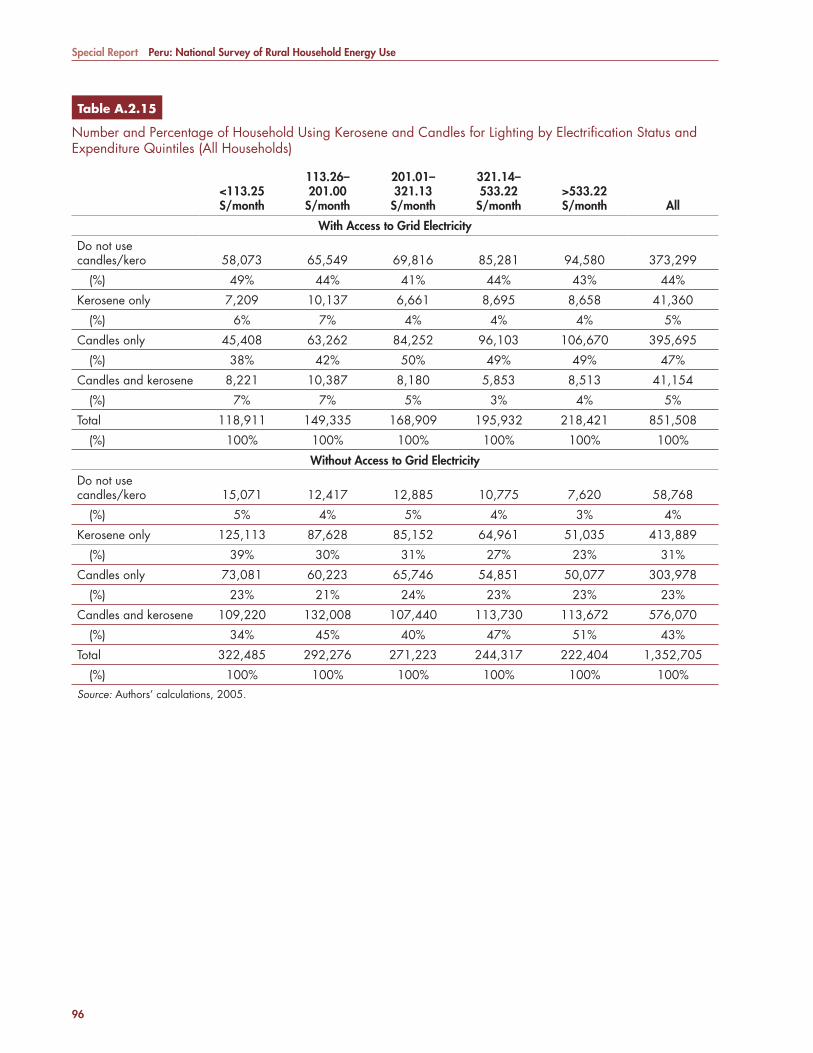
Special Report Peru: National Survey of Rural Household Energy Use
96
Table A.2.15Table A.2.15
Number and Percentage of Household Using Kerosene and Candles for Lighting by Electrifi cation Status and Expenditure Quintiles (All Households)
<113.25 S/month
113.26–201.00
S/month
201.01–321.13
S/month
321.14–533.22
S/month>533.22 S/month All
With Access to Grid Electricity
Do not use candles/kero 58,073 65,549 69,816 85,281 94,580 373,299
(%) 49% 44% 41% 44% 43% 44%
Kerosene only 7,209 10,137 6,661 8,695 8,658 41,360
(%) 6% 7% 4% 4% 4% 5%
Candles only 45,408 63,262 84,252 96,103 106,670 395,695
(%) 38% 42% 50% 49% 49% 47%
Candles and kerosene 8,221 10,387 8,180 5,853 8,513 41,154
(%) 7% 7% 5% 3% 4% 5%
Total 118,911 149,335 168,909 195,932 218,421 851,508
(%) 100% 100% 100% 100% 100% 100%
Without Access to Grid Electricity
Do not use candles/kero 15,071 12,417 12,885 10,775 7,620 58,768
(%) 5% 4% 5% 4% 3% 4%
Kerosene only 125,113 87,628 85,152 64,961 51,035 413,889
(%) 39% 30% 31% 27% 23% 31%
Candles only 73,081 60,223 65,746 54,851 50,077 303,978
(%) 23% 21% 24% 23% 23% 23%
Candles and kerosene 109,220 132,008 107,440 113,730 113,672 576,070
(%) 34% 45% 40% 47% 51% 43%
Total 322,485 292,276 271,223 244,317 222,404 1,352,705
(%) 100% 100% 100% 100% 100% 100%Source: Authors’ calculations, 2005.
7134-CHAnnex2.pdf 96 7/27/10 6:57 AM
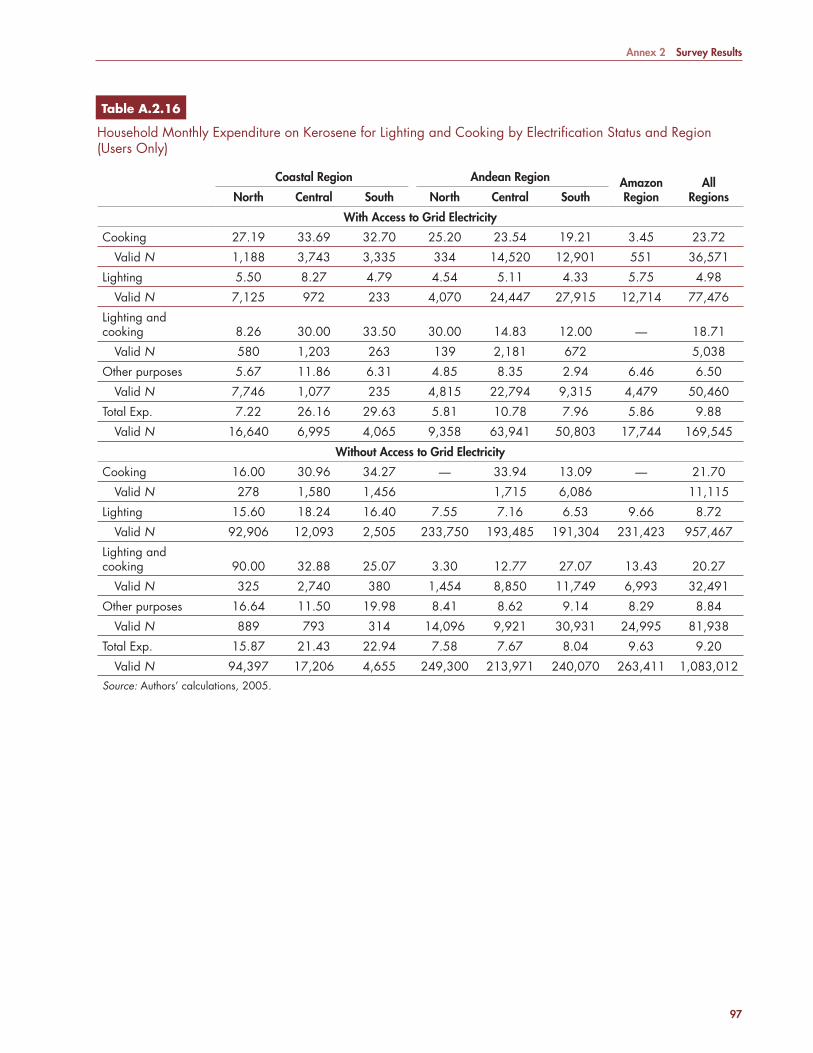
Annex 2 Survey Results
97
Table A.2.16Table A.2.16
Household Monthly Expenditure on Kerosene for Lighting and Cooking by Electrifi cation Status and Region (Users Only)
Coastal Region Andean Region Amazon Region
AllRegionsNorth Central South North Central South
With Access to Grid Electricity
Cooking 27.19 33.69 32.70 25.20 23.54 19.21 3.45 23.72
Valid N 1,188 3,743 3,335 334 14,520 12,901 551 36,571
Lighting 5.50 8.27 4.79 4.54 5.11 4.33 5.75 4.98
Valid N 7,125 972 233 4,070 24,447 27,915 12,714 77,476
Lighting and cooking 8.26 30.00 33.50 30.00 14.83 12.00 — 18.71
Valid N 580 1,203 263 139 2,181 672 5,038
Other purposes 5.67 11.86 6.31 4.85 8.35 2.94 6.46 6.50
Valid N 7,746 1,077 235 4,815 22,794 9,315 4,479 50,460
Total Exp. 7.22 26.16 29.63 5.81 10.78 7.96 5.86 9.88
Valid N 16,640 6,995 4,065 9,358 63,941 50,803 17,744 169,545
Without Access to Grid Electricity
Cooking 16.00 30.96 34.27 — 33.94 13.09 — 21.70
Valid N 278 1,580 1,456 1,715 6,086 11,115
Lighting 15.60 18.24 16.40 7.55 7.16 6.53 9.66 8.72
Valid N 92,906 12,093 2,505 233,750 193,485 191,304 231,423 957,467
Lighting and cooking 90.00 32.88 25.07 3.30 12.77 27.07 13.43 20.27
Valid N 325 2,740 380 1,454 8,850 11,749 6,993 32,491
Other purposes 16.64 11.50 19.98 8.41 8.62 9.14 8.29 8.84
Valid N 889 793 314 14,096 9,921 30,931 24,995 81,938
Total Exp. 15.87 21.43 22.94 7.58 7.67 8.04 9.63 9.20
Valid N 94,397 17,206 4,655 249,300 213,971 240,070 263,411 1,083,012Source: Authors’ calculations, 2005.
7134-CHAnnex2.pdf 97 7/27/10 6:57 AM
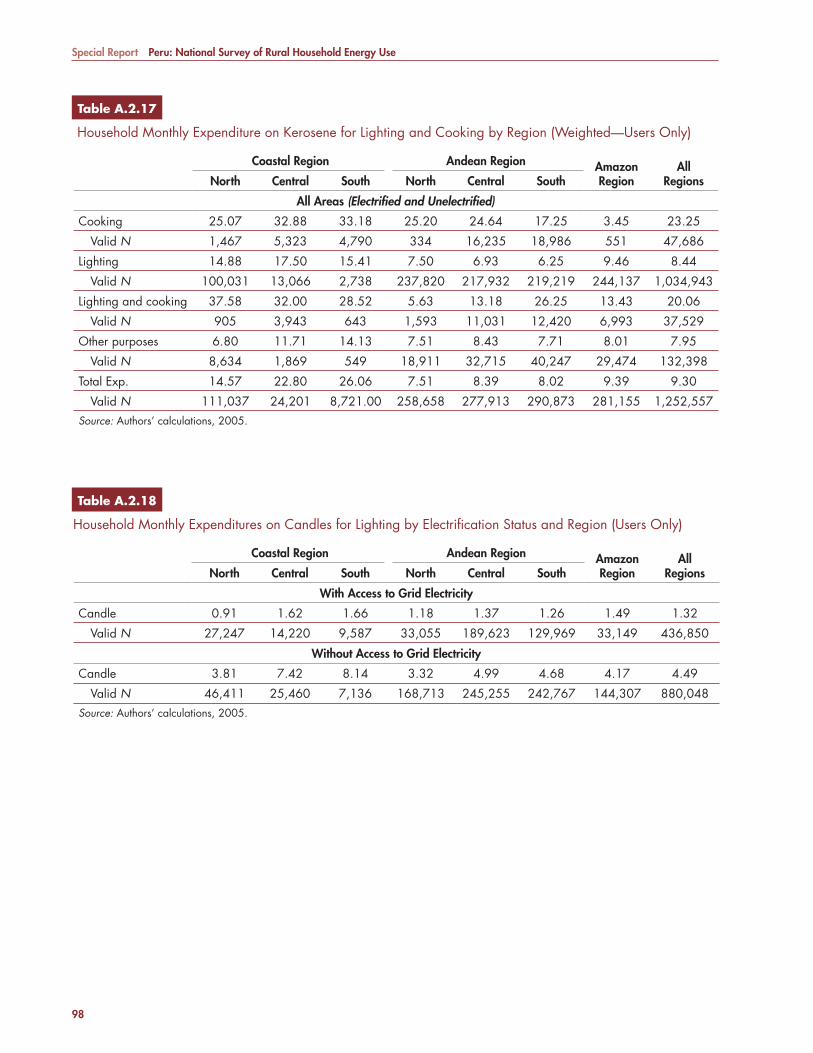
Special Report Peru: National Survey of Rural Household Energy Use
98
Table A.2.17Table A.2.17
Household Monthly Expenditure on Kerosene for Lighting and Cooking by Region (Weighted—Users Only)
Coastal Region Andean Region Amazon Region
AllRegionsNorth Central South North Central South
All Areas (Electrifi ed and Unelectrifi ed)
Cooking 25.07 32.88 33.18 25.20 24.64 17.25 3.45 23.25
Valid N 1,467 5,323 4,790 334 16,235 18,986 551 47,686
Lighting 14.88 17.50 15.41 7.50 6.93 6.25 9.46 8.44
Valid N 100,031 13,066 2,738 237,820 217,932 219,219 244,137 1,034,943
Lighting and cooking 37.58 32.00 28.52 5.63 13.18 26.25 13.43 20.06
Valid N 905 3,943 643 1,593 11,031 12,420 6,993 37,529
Other purposes 6.80 11.71 14.13 7.51 8.43 7.71 8.01 7.95
Valid N 8,634 1,869 549 18,911 32,715 40,247 29,474 132,398
Total Exp. 14.57 22.80 26.06 7.51 8.39 8.02 9.39 9.30
Valid N 111,037 24,201 8,721.00 258,658 277,913 290,873 281,155 1,252,557Source: Authors’ calculations, 2005.
Table A.2.18Table A.2.18
Household Monthly Expenditures on Candles for Lighting by Electrifi cation Status and Region (Users Only)
Coastal Region Andean Region Amazon Region
AllRegionsNorth Central South North Central South
With Access to Grid Electricity
Candle 0.91 1.62 1.66 1.18 1.37 1.26 1.49 1.32
Valid N 27,247 14,220 9,587 33,055 189,623 129,969 33,149 436,850
Without Access to Grid Electricity
Candle 3.81 7.42 8.14 3.32 4.99 4.68 4.17 4.49
Valid N 46,411 25,460 7,136 168,713 245,255 242,767 144,307 880,048Source: Authors’ calculations, 2005.
7134-CHAnnex2.pdf 98 7/27/10 6:57 AM
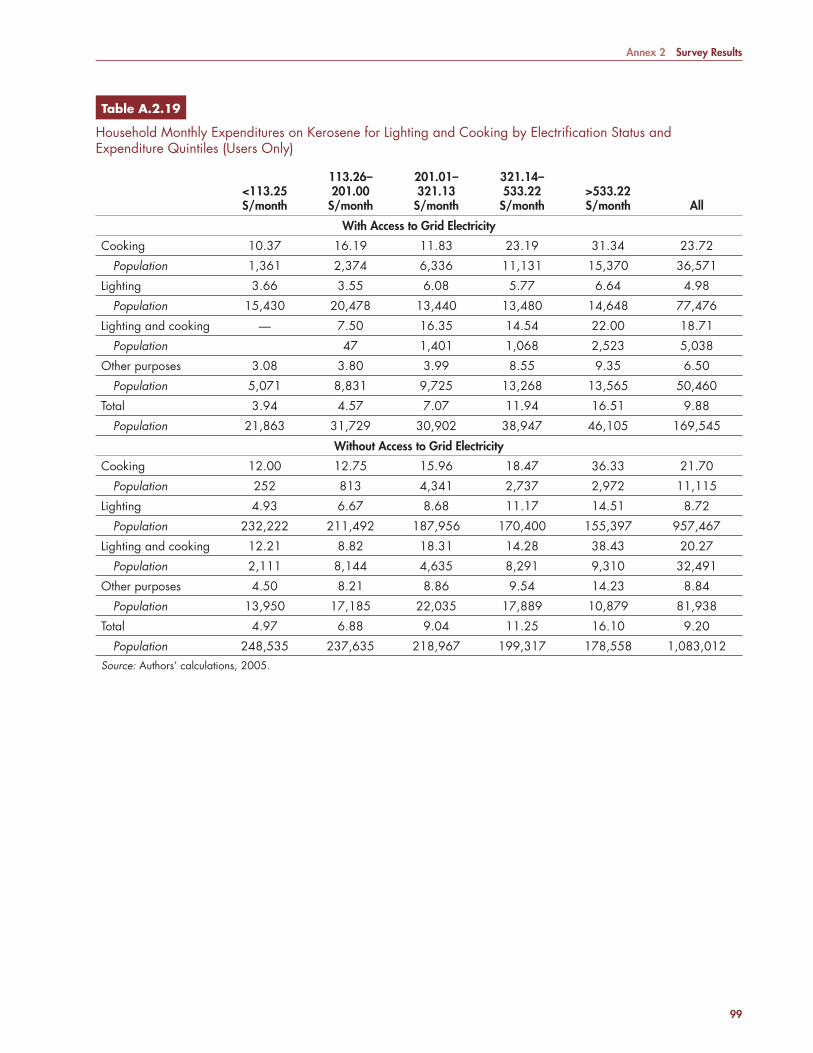
Annex 2 Survey Results
99
Table A.2.19Table A.2.19
Household Monthly Expenditures on Kerosene for Lighting and Cooking by Electrifi cation Status and Expenditure Quintiles (Users Only)
<113.25 S/month
113.26–201.00
S/month
201.01–321.13
S/month
321.14–533.22
S/month>533.22 S/month All
With Access to Grid Electricity
Cooking 10.37 16.19 11.83 23.19 31.34 23.72
Population 1,361 2,374 6,336 11,131 15,370 36,571
Lighting 3.66 3.55 6.08 5.77 6.64 4.98
Population 15,430 20,478 13,440 13,480 14,648 77,476
Lighting and cooking — 7.50 16.35 14.54 22.00 18.71
Population 47 1,401 1,068 2,523 5,038
Other purposes 3.08 3.80 3.99 8.55 9.35 6.50
Population 5,071 8,831 9,725 13,268 13,565 50,460
Total 3.94 4.57 7.07 11.94 16.51 9.88
Population 21,863 31,729 30,902 38,947 46,105 169,545
Without Access to Grid Electricity
Cooking 12.00 12.75 15.96 18.47 36.33 21.70
Population 252 813 4,341 2,737 2,972 11,115
Lighting 4.93 6.67 8.68 11.17 14.51 8.72
Population 232,222 211,492 187,956 170,400 155,397 957,467
Lighting and cooking 12.21 8.82 18.31 14.28 38.43 20.27
Population 2,111 8,144 4,635 8,291 9,310 32,491
Other purposes 4.50 8.21 8.86 9.54 14.23 8.84
Population 13,950 17,185 22,035 17,889 10,879 81,938
Total 4.97 6.88 9.04 11.25 16.10 9.20
Population 248,535 237,635 218,967 199,317 178,558 1,083,012Source: Authors’ calculations, 2005.
7134-CHAnnex2.pdf 99 7/27/10 6:57 AM

Special Report Peru: National Survey of Rural Household Energy Use
100
Table A.2.20Table A.2.20
Household Monthly Expenditures on Kerosene for Lighting and Cooking by Expenditure Quintiles, in Soles (Users Only)
<113.25 S/month
113.26–201.00
S/month
201.01–321.13
S/month
321.14–533.22
S/month>533.22 S/month All
All Areas (Electrifi ed and Unelectrifi ed)
Cooking 10.62 15.31 13.51 22.26 32.15 23.25
Population 1,613 3,187 10,677 13,868 18,342 47,686
Lighting 4.85 6.40 8.51 10.77 13.83 8.44
Population 247,652 231,970 201,396 183,880 170,045 1,034,943
Lighting & Cooking 12.21 8.81 17.86 14.31 34.92 20.06
Population 2,111 8,191 6,036 9,359 11,832 37,529
Other Purposes 4.12 6.71 7.37 9.12 11.52 7.95
Population 19,021 26,016 31,760 31,157 24,444 132,398
Total 4.89 6.61 8.80 11.36 16.19 9.30
Population 270,397 269,364 249,869 238,264 224,663 1,252,557Source: Authors’ calculations, 2005.
Table A.2.21Table A.2.21
Household Monthly Expenditures on Candles for Lighting by Electrifi cation Status and Expenditure Quintiles, in Soles (Users Only)
<113.25 S/month
113.26–201.00
S/month
201.01–321.13
S/month
321.14–533.22
S/month>533.22 S/month All
With Access to Grid Electricity
Candle 1.18 1.10 1.31 1.28 1.56 1.32
Valid N 53,630 73,649 92,432 101,956 115,184 436,850
Without Access to Grid Electricity
Candle 3.15 3.66 4.86 5.08 5.93 4.49
Valid N 182,301 192,231 173,186 168,581 163,749 880,048Source: Authors’ calculations, 2005.
7134-CHAnnex2.pdf 100 7/27/10 6:57 AM
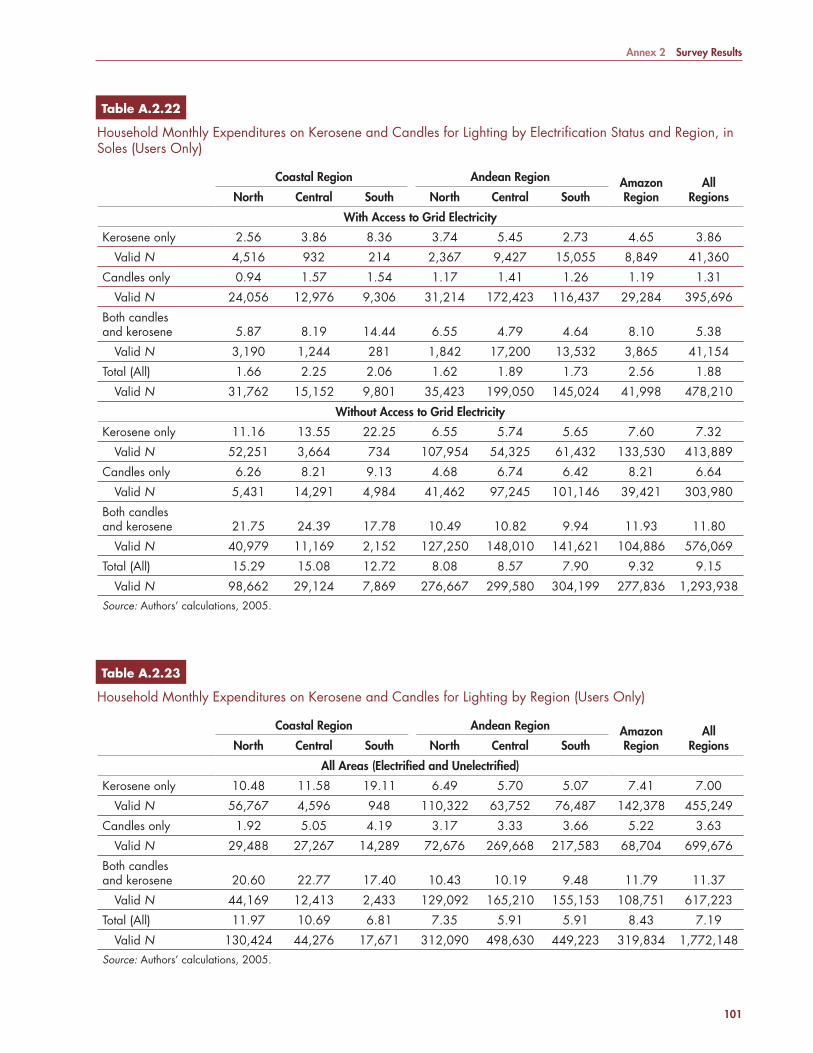
Annex 2 Survey Results
101
Table A.2.22Table A.2.22
Household Monthly Expenditures on Kerosene and Candles for Lighting by Electrifi cation Status and Region, in Soles (Users Only)
Coastal Region Andean Region Amazon Region
AllRegionsNorth Central South North Central South
With Access to Grid Electricity
Kerosene only 2.56 3.86 8.36 3.74 5.45 2.73 4.65 3.86
Valid N 4,516 932 214 2,367 9,427 15,055 8,849 41,360
Candles only 0.94 1.57 1.54 1.17 1.41 1.26 1.19 1.31
Valid N 24,056 12,976 9,306 31,214 172,423 116,437 29,284 395,696
Both candles and kerosene 5.87 8.19 14.44 6.55 4.79 4.64 8.10 5.38
Valid N 3,190 1,244 281 1,842 17,200 13,532 3,865 41,154
Total (All) 1.66 2.25 2.06 1.62 1.89 1.73 2.56 1.88
Valid N 31,762 15,152 9,801 35,423 199,050 145,024 41,998 478,210
Without Access to Grid Electricity
Kerosene only 11.16 13.55 22.25 6.55 5.74 5.65 7.60 7.32
Valid N 52,251 3,664 734 107,954 54,325 61,432 133,530 413,889
Candles only 6.26 8.21 9.13 4.68 6.74 6.42 8.21 6.64
Valid N 5,431 14,291 4,984 41,462 97,245 101,146 39,421 303,980
Both candles and kerosene 21.75 24.39 17.78 10.49 10.82 9.94 11.93 11.80
Valid N 40,979 11,169 2,152 127,250 148,010 141,621 104,886 576,069
Total (All) 15.29 15.08 12.72 8.08 8.57 7.90 9.32 9.15
Valid N 98,662 29,124 7,869 276,667 299,580 304,199 277,836 1,293,938Source: Authors’ calculations, 2005.
Table A.2.23Table A.2.23
Household Monthly Expenditures on Kerosene and Candles for Lighting by Region (Users Only)
Coastal Region Andean Region Amazon Region
AllRegionsNorth Central South North Central South
All Areas (Electrifi ed and Unelectrifi ed)
Kerosene only 10.48 11.58 19.11 6.49 5.70 5.07 7.41 7.00
Valid N 56,767 4,596 948 110,322 63,752 76,487 142,378 455,249
Candles only 1.92 5.05 4.19 3.17 3.33 3.66 5.22 3.63
Valid N 29,488 27,267 14,289 72,676 269,668 217,583 68,704 699,676
Both candles and kerosene 20.60 22.77 17.40 10.43 10.19 9.48 11.79 11.37
Valid N 44,169 12,413 2,433 129,092 165,210 155,153 108,751 617,223
Total (All) 11.97 10.69 6.81 7.35 5.91 5.91 8.43 7.19
Valid N 130,424 44,276 17,671 312,090 498,630 449,223 319,834 1,772,148Source: Authors’ calculations, 2005.
7134-CHAnnex2.pdf 101 7/27/10 6:57 AM
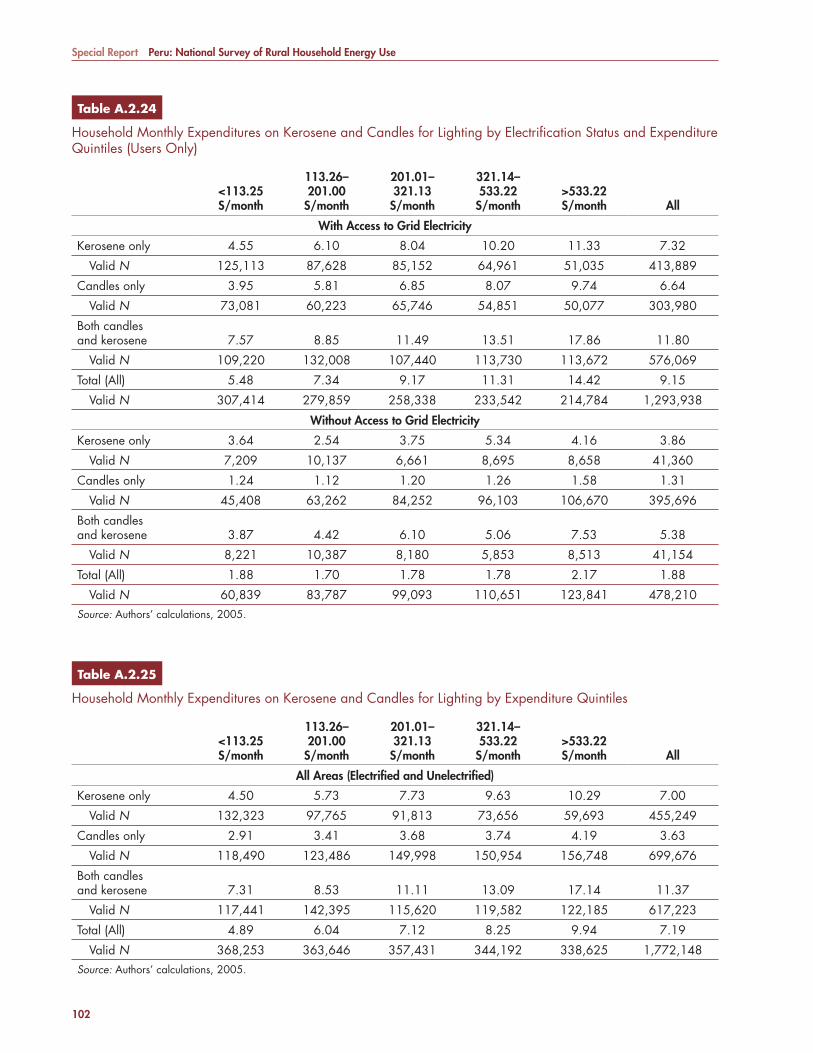
Special Report Peru: National Survey of Rural Household Energy Use
102
Table A.2.24Table A.2.24
Household Monthly Expenditures on Kerosene and Candles for Lighting by Electrifi cation Status and Expenditure Quintiles (Users Only)
<113.25 S/month
113.26–201.00
S/month
201.01–321.13
S/month
321.14–533.22
S/month>533.22 S/month All
With Access to Grid Electricity
Kerosene only 4.55 6.10 8.04 10.20 11.33 7.32
Valid N 125,113 87,628 85,152 64,961 51,035 413,889
Candles only 3.95 5.81 6.85 8.07 9.74 6.64
Valid N 73,081 60,223 65,746 54,851 50,077 303,980
Both candles and kerosene 7.57 8.85 11.49 13.51 17.86 11.80
Valid N 109,220 132,008 107,440 113,730 113,672 576,069
Total (All) 5.48 7.34 9.17 11.31 14.42 9.15
Valid N 307,414 279,859 258,338 233,542 214,784 1,293,938
Without Access to Grid Electricity
Kerosene only 3.64 2.54 3.75 5.34 4.16 3.86
Valid N 7,209 10,137 6,661 8,695 8,658 41,360
Candles only 1.24 1.12 1.20 1.26 1.58 1.31
Valid N 45,408 63,262 84,252 96,103 106,670 395,696
Both candles and kerosene 3.87 4.42 6.10 5.06 7.53 5.38
Valid N 8,221 10,387 8,180 5,853 8,513 41,154
Total (All) 1.88 1.70 1.78 1.78 2.17 1.88
Valid N 60,839 83,787 99,093 110,651 123,841 478,210Source: Authors’ calculations, 2005.
Table A.2.25Table A.2.25
Household Monthly Expenditures on Kerosene and Candles for Lighting by Expenditure Quintiles
<113.25 S/month
113.26–201.00
S/month
201.01–321.13
S/month
321.14–533.22
S/month>533.22 S/month All
All Areas (Electrifi ed and Unelectrifi ed)
Kerosene only 4.50 5.73 7.73 9.63 10.29 7.00
Valid N 132,323 97,765 91,813 73,656 59,693 455,249
Candles only 2.91 3.41 3.68 3.74 4.19 3.63
Valid N 118,490 123,486 149,998 150,954 156,748 699,676
Both candles and kerosene 7.31 8.53 11.11 13.09 17.14 11.37
Valid N 117,441 142,395 115,620 119,582 122,185 617,223
Total (All) 4.89 6.04 7.12 8.25 9.94 7.19
Valid N 368,253 363,646 357,431 344,192 338,625 1,772,148Source: Authors’ calculations, 2005.
7134-CHAnnex2.pdf 102 7/27/10 6:57 AM

Annex 2 Survey Results
103
Table A.2.26Table A.2.26
Household Monthly Expenditures on Lighting and Electricity by Electrifi cation Status and Region (Weighted—Users Only)
Coastal Region Andean Region Amazon Region
AllRegionsNorth Central South North Central South
With Access to Grid Electricity
Candles 0.91 1.62 1.66 1.18 1.37 1.26 1.49 1.32
Valid N 27,247 14,220 9,587 33,055 189,623 129,969 33,149 436,850
Kerosene (Light only) 3.62 5.12 8.52 4.39 4.40 3.04 4.55 3.92
Valid N 7,706 2,175 496 4,209 26,628 28,587 12,714 82,514
LPG (Light only) — 1.05 2.00 — 20.67 — — 18.26
Valid N 100 47 1,032 1,180
Small generator — — — — — — 28.50 28.50
Valid N 158 158
Dry cell battery 2.94 4.62 4.03 3.47 3.88 3.36 4.11 3.68
Valid N 24,898 15,530 8,272 39,849 172,192 153,117 52,795 466,652
Car battery 3.52 12.00 10.56 3.24 6.00 3.93 8.13 5.72
Valid N 149 81 651 807 516 1,910 812 4,925
Electricity (Grid) 19.82 27.04 24.66 10.87 13.36 9.44 16.03 13.63
Valid N 51,328 43,751 18,739 78,070 327,738 229,695 63,624 812,945
All Expend
(Lighting and electricity) 21.40 28.59 26.95 13.25 16.46 11.83 19.70 16.26
Valid N 53,461 45,118 19,390 79,041 331,055 248,678 68,781 845,522
Without Access to Grid Electricity
Candles 3.81 7.42 8.14 3.32 4.99 4.68 4.17 4.49
Valid N 46,411 25,460 7,136 168,713 245,255 242,767 144,307 880,048
Kerosene (Light only) 14.28 16.89 14.56 7.12 6.64 6.24 8.33 7.98
Valid N 93,230 14,833 2,886 235,205 202,335 203,053 238,416 989,958
LPG (Light only) 12.67 13.07 — — — 18.00 — 16.24
Valid N 437 154 1,162 1,753
Small generator 41.37 37.20 — — — 20.28 33.82 33.31
Valid N 1,431 887 1,278 3,195 6,791
Dry cell battery 4.93 7.37 6.80 4.48 6.50 5.01 8.04 6.04
Valid N 86,036 23,153 6,929 242,973 245,259 262,790 297,041 1,164,180
Car battery 6.19 12.57 8.24 5.59 5.76 6.06 6.74 6.61
Valid N 47,556 16,875 3,027 32,730 46,295 35,060 55,140 236,683
Electricity (Grid) — — — — — — — —
Valid N
All Expend
(Lighting and electricity)
22.65 28.76 21.16 12.50 14.74 12.85 17.57 15.44
Valid N 101,149 29,804 8,135 280,593 300,612 309,684 310,512 1,340,491Source: Authors’ calculations, 2005.
7134-CHAnnex2.pdf 103 7/27/10 6:57 AM
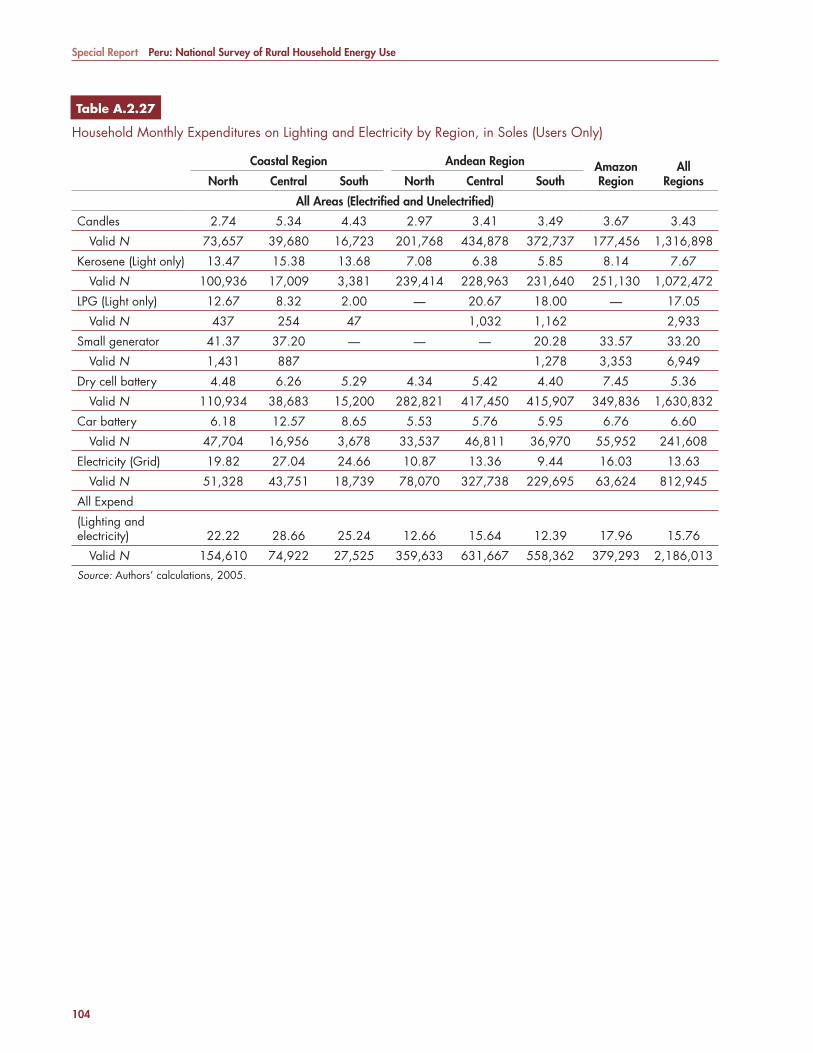
Special Report Peru: National Survey of Rural Household Energy Use
104
Table A.2.27Table A.2.27
Household Monthly Expenditures on Lighting and Electricity by Region, in Soles (Users Only)
Coastal Region Andean Region Amazon Region
AllRegionsNorth Central South North Central South
All Areas (Electrifi ed and Unelectrifi ed)
Candles 2.74 5.34 4.43 2.97 3.41 3.49 3.67 3.43
Valid N 73,657 39,680 16,723 201,768 434,878 372,737 177,456 1,316,898
Kerosene (Light only) 13.47 15.38 13.68 7.08 6.38 5.85 8.14 7.67
Valid N 100,936 17,009 3,381 239,414 228,963 231,640 251,130 1,072,472
LPG (Light only) 12.67 8.32 2.00 — 20.67 18.00 — 17.05
Valid N 437 254 47 1,032 1,162 2,933
Small generator 41.37 37.20 — — — 20.28 33.57 33.20
Valid N 1,431 887 1,278 3,353 6,949
Dry cell battery 4.48 6.26 5.29 4.34 5.42 4.40 7.45 5.36
Valid N 110,934 38,683 15,200 282,821 417,450 415,907 349,836 1,630,832
Car battery 6.18 12.57 8.65 5.53 5.76 5.95 6.76 6.60
Valid N 47,704 16,956 3,678 33,537 46,811 36,970 55,952 241,608
Electricity (Grid) 19.82 27.04 24.66 10.87 13.36 9.44 16.03 13.63
Valid N 51,328 43,751 18,739 78,070 327,738 229,695 63,624 812,945
All Expend
(Lighting and electricity) 22.22 28.66 25.24 12.66 15.64 12.39 17.96 15.76
Valid N 154,610 74,922 27,525 359,633 631,667 558,362 379,293 2,186,013Source: Authors’ calculations, 2005.
7134-CHAnnex2.pdf 104 7/27/10 6:57 AM
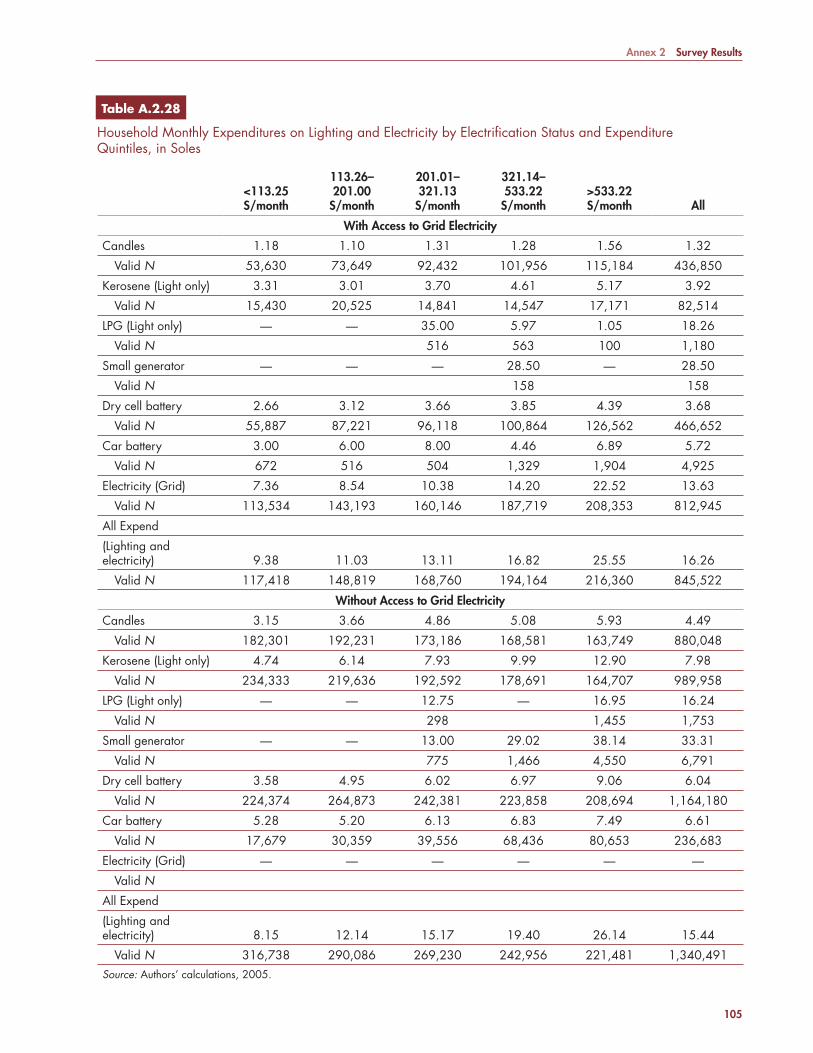
Annex 2 Survey Results
105
Table A.2.28Table A.2.28
Household Monthly Expenditures on Lighting and Electricity by Electrifi cation Status and Expenditure Quintiles, in Soles
<113.25 S/month
113.26–201.00
S/month
201.01–321.13
S/month
321.14–533.22
S/month>533.22 S/month All
With Access to Grid Electricity
Candles 1.18 1.10 1.31 1.28 1.56 1.32
Valid N 53,630 73,649 92,432 101,956 115,184 436,850
Kerosene (Light only) 3.31 3.01 3.70 4.61 5.17 3.92
Valid N 15,430 20,525 14,841 14,547 17,171 82,514
LPG (Light only) — — 35.00 5.97 1.05 18.26
Valid N 516 563 100 1,180
Small generator — — — 28.50 — 28.50
Valid N 158 158
Dry cell battery 2.66 3.12 3.66 3.85 4.39 3.68
Valid N 55,887 87,221 96,118 100,864 126,562 466,652
Car battery 3.00 6.00 8.00 4.46 6.89 5.72
Valid N 672 516 504 1,329 1,904 4,925
Electricity (Grid) 7.36 8.54 10.38 14.20 22.52 13.63
Valid N 113,534 143,193 160,146 187,719 208,353 812,945
All Expend
(Lighting and electricity) 9.38 11.03 13.11 16.82 25.55 16.26
Valid N 117,418 148,819 168,760 194,164 216,360 845,522
Without Access to Grid Electricity
Candles 3.15 3.66 4.86 5.08 5.93 4.49
Valid N 182,301 192,231 173,186 168,581 163,749 880,048
Kerosene (Light only) 4.74 6.14 7.93 9.99 12.90 7.98
Valid N 234,333 219,636 192,592 178,691 164,707 989,958
LPG (Light only) — — 12.75 — 16.95 16.24
Valid N 298 1,455 1,753
Small generator — — 13.00 29.02 38.14 33.31
Valid N 775 1,466 4,550 6,791
Dry cell battery 3.58 4.95 6.02 6.97 9.06 6.04
Valid N 224,374 264,873 242,381 223,858 208,694 1,164,180
Car battery 5.28 5.20 6.13 6.83 7.49 6.61
Valid N 17,679 30,359 39,556 68,436 80,653 236,683
Electricity (Grid) — — — — — —
Valid N
All Expend
(Lighting and electricity) 8.15 12.14 15.17 19.40 26.14 15.44
Valid N 316,738 290,086 269,230 242,956 221,481 1,340,491Source: Authors’ calculations, 2005.
7134-CHAnnex2.pdf 105 7/27/10 6:57 AM
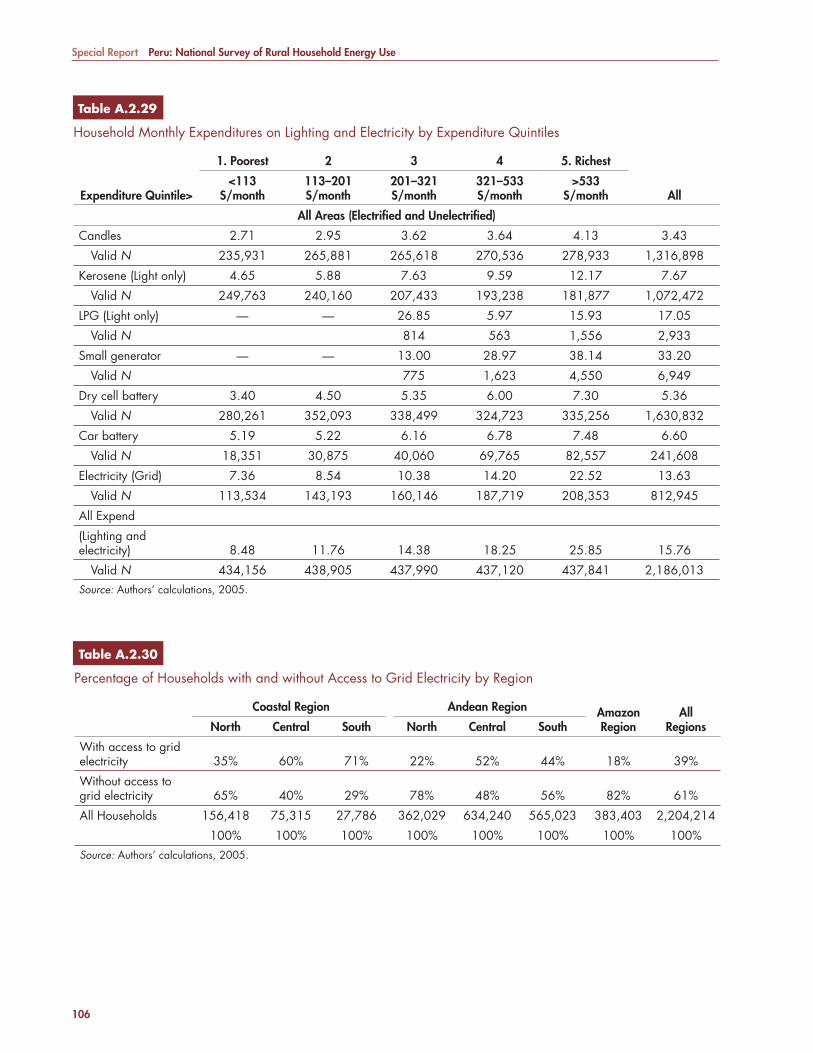
Special Report Peru: National Survey of Rural Household Energy Use
106
Table A.2.29Table A.2.29
Household Monthly Expenditures on Lighting and Electricity by Expenditure Quintiles
Expenditure Quintile>
1. Poorest 2 3 4 5. Richest
All<113
S/month113–201 S/month
201–321 S/month
321–533 S/month
>533 S/month
All Areas (Electrifi ed and Unelectrifi ed)
Candles 2.71 2.95 3.62 3.64 4.13 3.43
Valid N 235,931 265,881 265,618 270,536 278,933 1,316,898
Kerosene (Light only) 4.65 5.88 7.63 9.59 12.17 7.67
Valid N 249,763 240,160 207,433 193,238 181,877 1,072,472
LPG (Light only) — — 26.85 5.97 15.93 17.05
Valid N 814 563 1,556 2,933
Small generator — — 13.00 28.97 38.14 33.20
Valid N 775 1,623 4,550 6,949
Dry cell battery 3.40 4.50 5.35 6.00 7.30 5.36
Valid N 280,261 352,093 338,499 324,723 335,256 1,630,832
Car battery 5.19 5.22 6.16 6.78 7.48 6.60
Valid N 18,351 30,875 40,060 69,765 82,557 241,608
Electricity (Grid) 7.36 8.54 10.38 14.20 22.52 13.63
Valid N 113,534 143,193 160,146 187,719 208,353 812,945
All Expend
(Lighting and electricity) 8.48 11.76 14.38 18.25 25.85 15.76
Valid N 434,156 438,905 437,990 437,120 437,841 2,186,013Source: Authors’ calculations, 2005.
Table A.2.30Table A.2.30
Percentage of Households with and without Access to Grid Electricity by Region
Coastal Region Andean Region Amazon Region
AllRegionsNorth Central South North Central South
With access to grid electricity 35% 60% 71% 22% 52% 44% 18% 39%
Without access to grid electricity 65% 40% 29% 78% 48% 56% 82% 61%
All Households 156,418 75,315 27,786 362,029 634,240 565,023 383,403 2,204,214
100% 100% 100% 100% 100% 100% 100% 100%Source: Authors’ calculations, 2005.
7134-CHAnnex2.pdf 106 7/27/10 6:57 AM

Annex 2 Survey Results
107
Table A.2.31Table A.2.31
Percentage of Households with and without Access to Grid Electricity by Expenditure Quintiles
Expenditure Quintile>
1. Poorest 2 3 4 5. Richest
All<113
S/month113–201 S/month
201–321 S/month
321–533 S/month
>533 S/month
With access to grid electricity 27% 34% 38% 45% 50% 39%
Without access to grid electricity 73% 66% 62% 56% 51% 61%
All Households 441,398 441,612 440,132 440,247 440,827 2,204,216
100% 100% 100% 100% 100% 100%Source: Authors’ calculations, 2005.
Table A.2.32Table A.2.32
Household Electricity Consumption, Expenditure in Soles, Effective Price per kWh, and Electricity Used for Lighting by Region
Coastal Region Andean Region Amazon Region
AllRegionsNorth Central South North Central South
kWh used/month 38.30 61.73 59.06 21.68 26.87 16.66 31.56 27.19
Valid N 51,328 43,751 18,699 78,070 327,738 229,695 63,624 812,904
Spend per month 19.82 27.04 24.66 10.87 13.36 9.44 16.03 13.63
Valid N 51,328 43,751 18,739 78,070 327,738 229,695 63,624 812,945
Effective price per kWh 0.57 0.49 0.47 0.60 0.62 0.83 0.71 0.67
Valid N 51,328 43,751 18,699 78,070 327,738 229,695 63,624 812,904
% of electricity used for lighting 28.00 24.01 24.16 43.71 41.07 54.61 38.55 42.87
Valid N 50,109 42,503 17,731 74,548 316,196 224,429 57,883 783,398
kWh for lighting per month 6.99 10.38 9.32 6.44 7.70 5.82 6.92 7.10
51,328 43,751 18,498 76,739 319,949 229,695 61,330 812,904Source: Authors’ calculations, 2005.
7134-CHAnnex2.pdf 107 7/27/10 6:57 AM
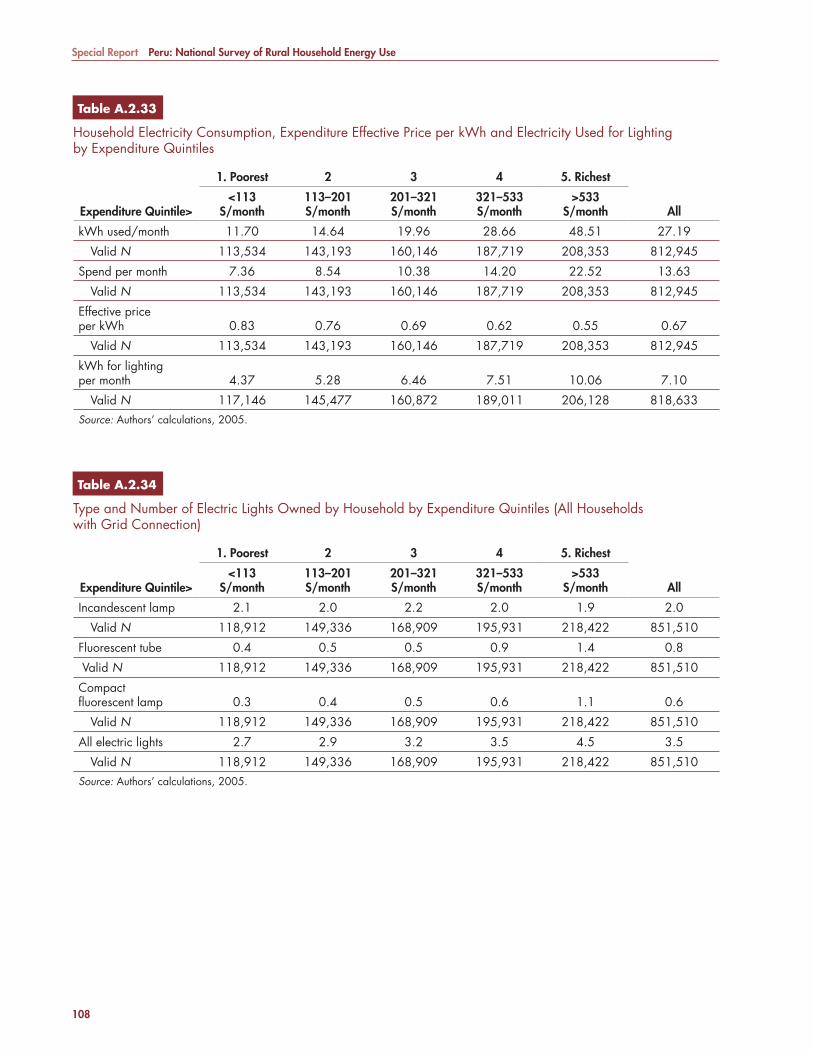
Special Report Peru: National Survey of Rural Household Energy Use
108
Table A.2.33Table A.2.33
Household Electricity Consumption, Expenditure Effective Price per kWh and Electricity Used for Lighting by Expenditure Quintiles
Expenditure Quintile>
1. Poorest 2 3 4 5. Richest
All<113
S/month113–201 S/month
201–321 S/month
321–533 S/month
>533 S/month
kWh used/month 11.70 14.64 19.96 28.66 48.51 27.19
Valid N 113,534 143,193 160,146 187,719 208,353 812,945
Spend per month 7.36 8.54 10.38 14.20 22.52 13.63
Valid N 113,534 143,193 160,146 187,719 208,353 812,945
Effective price per kWh 0.83 0.76 0.69 0.62 0.55 0.67
Valid N 113,534 143,193 160,146 187,719 208,353 812,945
kWh for lighting per month 4.37 5.28 6.46 7.51 10.06 7.10
Valid N 117,146 145,477 160,872 189,011 206,128 818,633Source: Authors’ calculations, 2005.
Table A.2.34Table A.2.34
Type and Number of Electric Lights Owned by Household by Expenditure Quintiles (All Households with Grid Connection)
Expenditure Quintile>
1. Poorest 2 3 4 5. Richest
All<113
S/month113–201 S/month
201–321 S/month
321–533 S/month
>533 S/month
Incandescent lamp 2.1 2.0 2.2 2.0 1.9 2.0
Valid N 118,912 149,336 168,909 195,931 218,422 851,510
Fluorescent tube 0.4 0.5 0.5 0.9 1.4 0.8
Valid N 118,912 149,336 168,909 195,931 218,422 851,510
Compact fl uorescent lamp 0.3 0.4 0.5 0.6 1.1 0.6
Valid N 118,912 149,336 168,909 195,931 218,422 851,510
All electric lights 2.7 2.9 3.2 3.5 4.5 3.5
Valid N 118,912 149,336 168,909 195,931 218,422 851,510Source: Authors’ calculations, 2005.
7134-CHAnnex2.pdf 108 7/27/10 6:57 AM
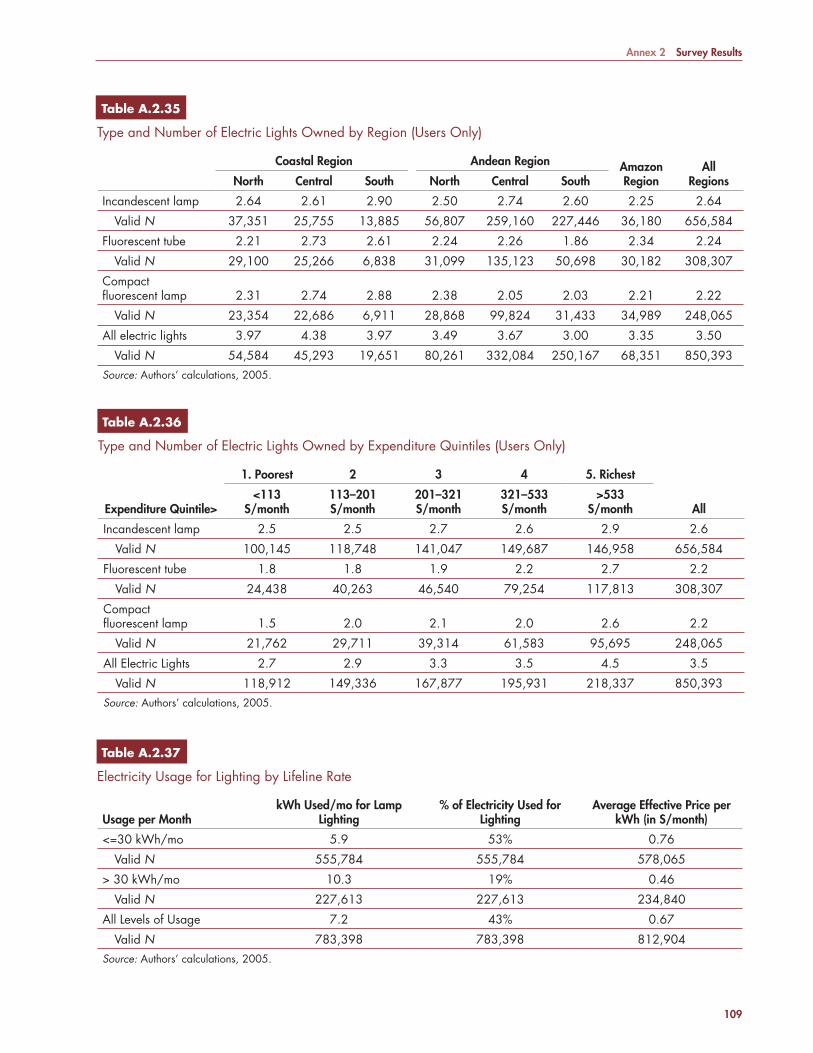
Annex 2 Survey Results
109
Table A.2.36Table A.2.36
Type and Number of Electric Lights Owned by Expenditure Quintiles (Users Only)
Expenditure Quintile>
1. Poorest 2 3 4 5. Richest
All<113
S/month113–201 S/month
201–321 S/month
321–533 S/month
>533 S/month
Incandescent lamp 2.5 2.5 2.7 2.6 2.9 2.6
Valid N 100,145 118,748 141,047 149,687 146,958 656,584
Fluorescent tube 1.8 1.8 1.9 2.2 2.7 2.2
Valid N 24,438 40,263 46,540 79,254 117,813 308,307
Compact fl uorescent lamp 1.5 2.0 2.1 2.0 2.6 2.2
Valid N 21,762 29,711 39,314 61,583 95,695 248,065
All Electric Lights 2.7 2.9 3.3 3.5 4.5 3.5
Valid N 118,912 149,336 167,877 195,931 218,337 850,393Source: Authors’ calculations, 2005.
Table A.2.37Table A.2.37
Electricity Usage for Lighting by Lifeline Rate
Usage per MonthkWh Used/mo for Lamp
Lighting% of Electricity Used for
Lighting Average Effective Price per
kWh (in S/month)
<=30 kWh/mo 5.9 53% 0.76
Valid N 555,784 555,784 578,065
> 30 kWh/mo 10.3 19% 0.46
Valid N 227,613 227,613 234,840
All Levels of Usage 7.2 43% 0.67
Valid N 783,398 783,398 812,904Source: Authors’ calculations, 2005.
Table A.2.35Table A.2.35
Type and Number of Electric Lights Owned by Region (Users Only)
Coastal Region Andean Region Amazon Region
AllRegionsNorth Central South North Central South
Incandescent lamp 2.64 2.61 2.90 2.50 2.74 2.60 2.25 2.64
Valid N 37,351 25,755 13,885 56,807 259,160 227,446 36,180 656,584
Fluorescent tube 2.21 2.73 2.61 2.24 2.26 1.86 2.34 2.24
Valid N 29,100 25,266 6,838 31,099 135,123 50,698 30,182 308,307
Compact fl uorescent lamp 2.31 2.74 2.88 2.38 2.05 2.03 2.21 2.22
Valid N 23,354 22,686 6,911 28,868 99,824 31,433 34,989 248,065
All electric lights 3.97 4.38 3.97 3.49 3.67 3.00 3.35 3.50
Valid N 54,584 45,293 19,651 80,261 332,084 250,167 68,351 850,393Source: Authors’ calculations, 2005.
7134-CHAnnex2.pdf 109 7/27/10 6:57 AM
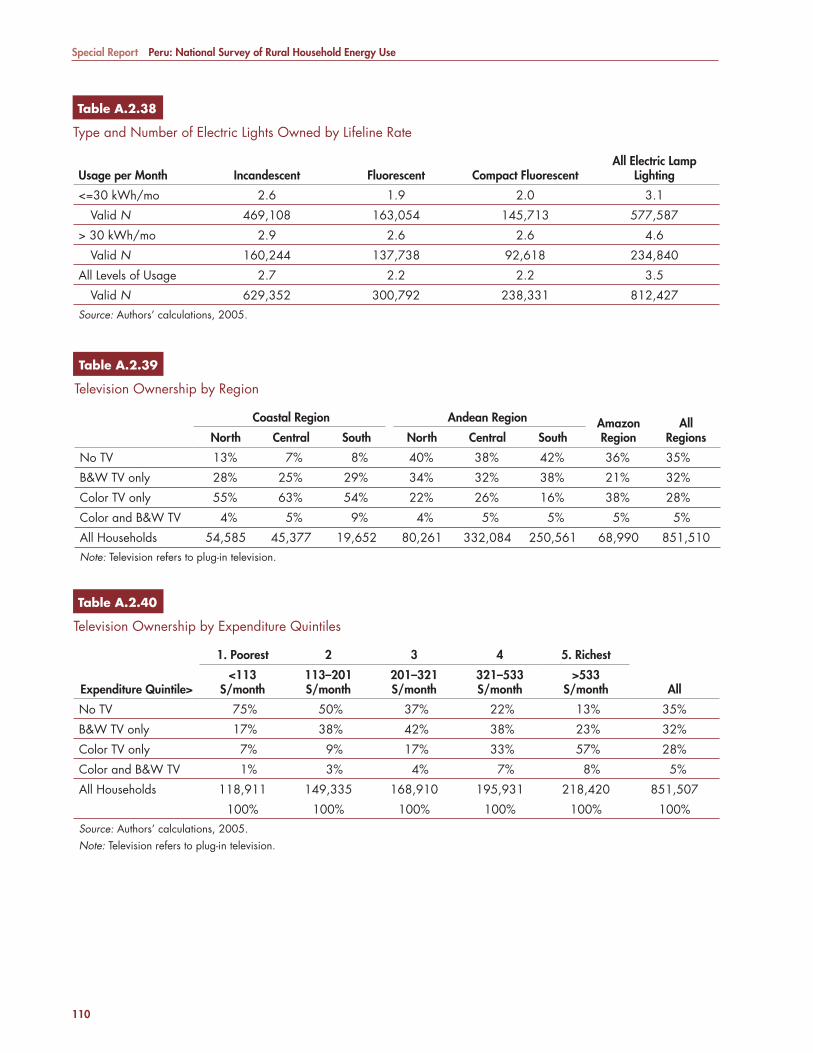
Special Report Peru: National Survey of Rural Household Energy Use
110
Table A.2.38Table A.2.38
Type and Number of Electric Lights Owned by Lifeline Rate
Usage per Month Incandescent Fluorescent Compact FluorescentAll Electric Lamp
Lighting
<=30 kWh/mo 2.6 1.9 2.0 3.1
Valid N 469,108 163,054 145,713 577,587
> 30 kWh/mo 2.9 2.6 2.6 4.6
Valid N 160,244 137,738 92,618 234,840
All Levels of Usage 2.7 2.2 2.2 3.5
Valid N 629,352 300,792 238,331 812,427Source: Authors’ calculations, 2005.
Table A.2.40Table A.2.40
Television Ownership by Expenditure Quintiles
Expenditure Quintile>
1. Poorest 2 3 4 5. Richest
All<113
S/month113–201 S/month
201–321 S/month
321–533 S/month
>533 S/month
No TV 75% 50% 37% 22% 13% 35%
B&W TV only 17% 38% 42% 38% 23% 32%
Color TV only 7% 9% 17% 33% 57% 28%
Color and B&W TV 1% 3% 4% 7% 8% 5%
All Households 118,911 149,335 168,910 195,931 218,420 851,507
100% 100% 100% 100% 100% 100%Source: Authors’ calculations, 2005.Note: Television refers to plug-in television.
Table A.2.39Table A.2.39
Television Ownership by Region
Coastal Region Andean Region Amazon Region
AllRegionsNorth Central South North Central South
No TV 13% 7% 8% 40% 38% 42% 36% 35%
B&W TV only 28% 25% 29% 34% 32% 38% 21% 32%
Color TV only 55% 63% 54% 22% 26% 16% 38% 28%
Color and B&W TV 4% 5% 9% 4% 5% 5% 5% 5%
All Households 54,585 45,377 19,652 80,261 332,084 250,561 68,990 851,510Note: Television refers to plug-in television.
7134-CHAnnex2.pdf 110 7/27/10 6:57 AM

Annex 2 Survey Results
111
Table A.2.42Table A.2.42
Plug-in Radio and Television Ownership by Expenditure Quintiles
Expenditure Quintile>
1. Poorest 2 3 4 5. Richest
All<113
S/month113–201 S/month
201–321 S/month
321–533 S/month
>533 S/month
No Radio/TV 39% 21% 13% 8% 5% 15%
Radio only 36% 29% 25% 14% 8% 20%
TV only 10% 13% 16% 22% 28% 19%
Radio and TV 15% 37% 47% 56% 59% 46%
All Households 118,911 149,336 168,909 195,931 218,422 851,509
100% 100% 100% 100% 100% 100%Source: Authors’ calculations, 2005.Note: Television refers to plug-in television.
Table A.2.41Table A.2.41
Plug-in Radio and Television Ownership by Region
Coastal Region Andean Region Amazon Region
AllRegionsNorth Central South North Central South
No Radio/TV 8% 4% 2% 24% 11% 21% 21% 15%
Radio only 5% 4% 6% 17% 27% 21% 15% 20%
TV only 46% 28% 19% 23% 14% 15% 27% 19%
Radio and TV 42% 65% 73% 37% 49% 43% 37% 46%
All Households 54,583 45,377 19,651 80,260 332,085 250,561 68,990 851,507Source: Authors’ calculations, 2005.Note: Television refers to plug-in television.
7134-CHAnnex2.pdf 111 7/27/10 6:57 AM
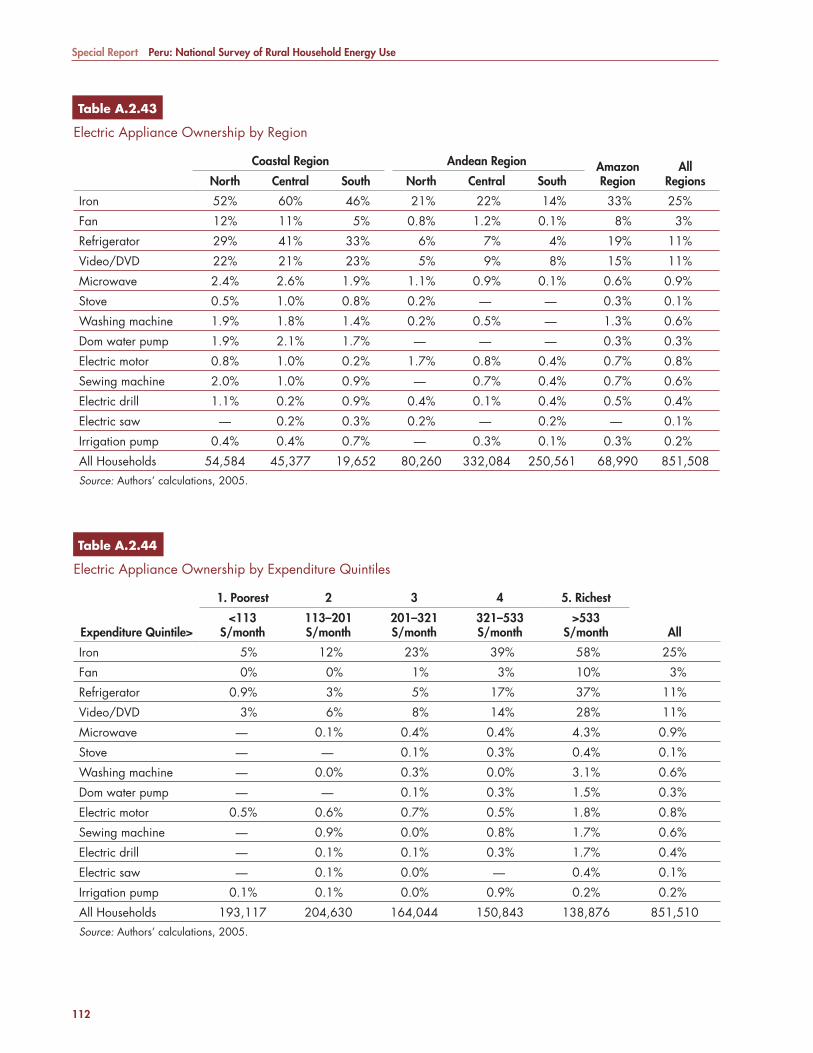
Special Report Peru: National Survey of Rural Household Energy Use
112
Table A.2.43Table A.2.43
Electric Appliance Ownership by Region
Coastal Region Andean Region Amazon Region
AllRegionsNorth Central South North Central South
Iron 52% 60% 46% 21% 22% 14% 33% 25%
Fan 12% 11% 5% 0.8% 1.2% 0.1% 8% 3%
Refrigerator 29% 41% 33% 6% 7% 4% 19% 11%
Video/DVD 22% 21% 23% 5% 9% 8% 15% 11%
Microwave 2.4% 2.6% 1.9% 1.1% 0.9% 0.1% 0.6% 0.9%
Stove 0.5% 1.0% 0.8% 0.2% — — 0.3% 0.1%
Washing machine 1.9% 1.8% 1.4% 0.2% 0.5% — 1.3% 0.6%
Dom water pump 1.9% 2.1% 1.7% — — — 0.3% 0.3%
Electric motor 0.8% 1.0% 0.2% 1.7% 0.8% 0.4% 0.7% 0.8%
Sewing machine 2.0% 1.0% 0.9% — 0.7% 0.4% 0.7% 0.6%
Electric drill 1.1% 0.2% 0.9% 0.4% 0.1% 0.4% 0.5% 0.4%
Electric saw — 0.2% 0.3% 0.2% — 0.2% — 0.1%
Irrigation pump 0.4% 0.4% 0.7% — 0.3% 0.1% 0.3% 0.2%
All Households 54,584 45,377 19,652 80,260 332,084 250,561 68,990 851,508Source: Authors’ calculations, 2005.
Table A.2.44Table A.2.44
Electric Appliance Ownership by Expenditure Quintiles
Expenditure Quintile>
1. Poorest 2 3 4 5. Richest
All<113
S/month113–201 S/month
201–321 S/month
321–533 S/month
>533 S/month
Iron 5% 12% 23% 39% 58% 25%
Fan 0% 0% 1% 3% 10% 3%
Refrigerator 0.9% 3% 5% 17% 37% 11%
Video/DVD 3% 6% 8% 14% 28% 11%
Microwave — 0.1% 0.4% 0.4% 4.3% 0.9%
Stove — — 0.1% 0.3% 0.4% 0.1%
Washing machine — 0.0% 0.3% 0.0% 3.1% 0.6%
Dom water pump — — 0.1% 0.3% 1.5% 0.3%
Electric motor 0.5% 0.6% 0.7% 0.5% 1.8% 0.8%
Sewing machine — 0.9% 0.0% 0.8% 1.7% 0.6%
Electric drill — 0.1% 0.1% 0.3% 1.7% 0.4%
Electric saw — 0.1% 0.0% — 0.4% 0.1%
Irrigation pump 0.1% 0.1% 0.0% 0.9% 0.2% 0.2%
All Households 193,117 204,630 164,044 150,843 138,876 851,510Source: Authors’ calculations, 2005.
7134-CHAnnex2.pdf 112 7/27/10 6:57 AM
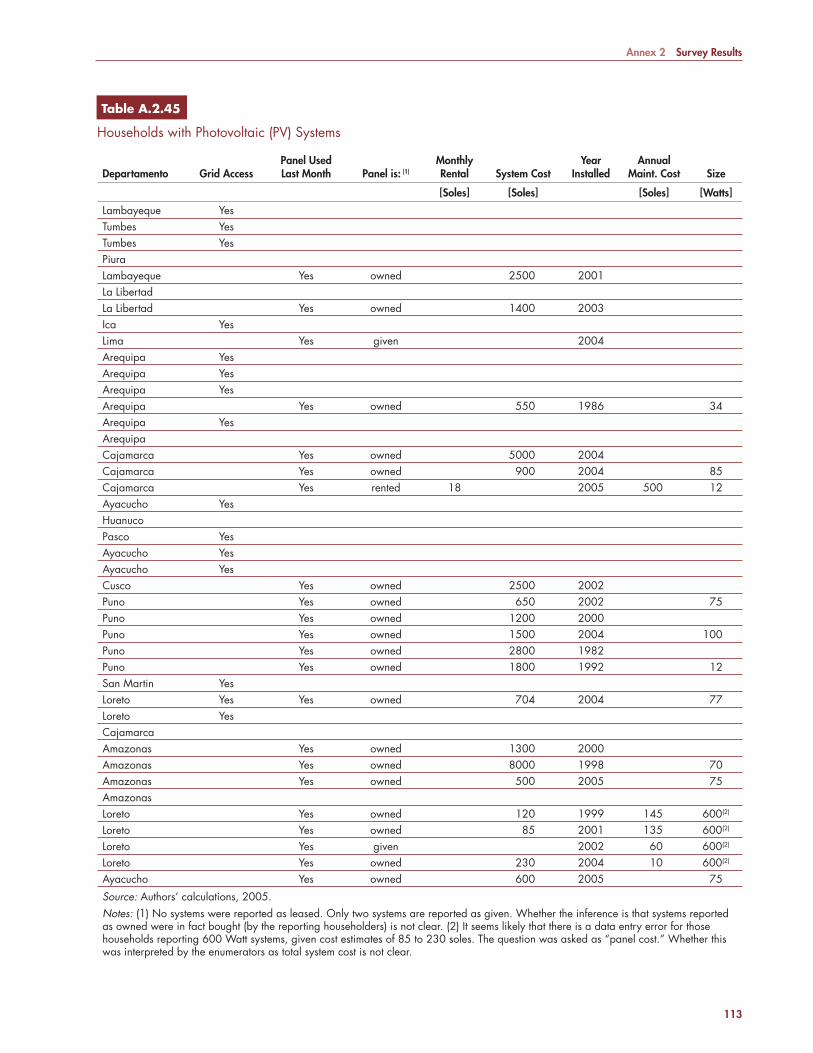
Annex 2 Survey Results
113
Table A.2.45Table A.2.45
Households with Photovoltaic (PV) Systems
Departamento Grid AccessPanel Used Last Month Panel is: (1)
Monthly Rental System Cost
Year Installed
Annual Maint. Cost Size
[Soles] [Soles] [Soles] [Watts]
Lambayeque YesTumbes YesTumbes YesPiura Lambayeque Yes owned 2500 2001La Libertad La Libertad Yes owned 1400 2003Ica YesLima Yes given 2004Arequipa YesArequipa YesArequipa YesArequipa Yes owned 550 1986 34Arequipa YesArequipa Cajamarca Yes owned 5000 2004Cajamarca Yes owned 900 2004 85Cajamarca Yes rented 18 2005 500 12Ayacucho YesHuanuco Pasco YesAyacucho YesAyacucho YesCusco Yes owned 2500 2002Puno Yes owned 650 2002 75Puno Yes owned 1200 2000Puno Yes owned 1500 2004 100Puno Yes owned 2800 1982Puno Yes owned 1800 1992 12San Martin YesLoreto Yes Yes owned 704 2004 77Loreto YesCajamarca Amazonas Yes owned 1300 2000Amazonas Yes owned 8000 1998 70Amazonas Yes owned 500 2005 75Amazonas Loreto Yes owned 120 1999 145 600(2)
Loreto Yes owned 85 2001 135 600(2)
Loreto Yes given 2002 60 600(2)
Loreto Yes owned 230 2004 10 600(2)
Ayacucho Yes owned 600 2005 75
Source: Authors’ calculations, 2005.Notes: (1) No systems were reported as leased. Only two systems are reported as given. Whether the inference is that systems reported as owned were in fact bought (by the reporting householders) is not clear. (2) It seems likely that there is a data entry error for those households reporting 600 Watt systems, given cost estimates of 85 to 230 soles. The question was asked as “panel cost.” Whether this was interpreted by the enumerators as total system cost is not clear.
7134-CHAnnex2.pdf 113 7/27/10 6:57 AM

Special Report Peru: National Survey of Rural Household Energy Use
114
Table A.2.46Table A.2.46
Small Generator Users, Cost Data
Owned Small Generator Cost Diesel Fuel Cost Gasoline Fuel Cost
Maintenance and Repair Cost
Soles Soles/Month Soles/Month Soles/Month
Coastal North 2,375 17 78 12
Coastal Central 1,716 44 59
Coastal South — — — —
Andean North — — — —
Andean Central — — — —
Andean South 928 18 3
Amazon 2,140 25 60
All 1,919 29 53 7
Number of Households Actually Sampled
Coastal North 7 2 5 4
Coastal Central 7 7 2 0
Coastal South 0 0 0 0
Andean North 0 0 0 0
Andean Central 0 0 0 0
Andean South 3 0 3 1
Amazon 6 3 3 0
All 23 12 13 5Source: Authors’ calculations, 2005.(1) Average cost of gasoline generators = 1703 soles.
7134-CHAnnex2.pdf 114 7/27/10 6:57 AM

115
Annex 3
Estimating the Benefi ts of Rural Electrifi cation
Many issues arise in the estimation of demand curves, and in the use of changes in consumer surplus to measure benefits. These are discussed in this Annex, and the methodology and results are compared with other studies.
The Demand CurveAssumptions about the shape of the demand curve are critical when only few points are available. Many of the early studies of the benefi ts of rural electrifi cation recognized that demand curves were likely concave (as drawn in Figure A.3.1), but then used a linear curve anyway.33
Unfortunately such an assumption will lead to an overestimation of the area C, and of the net benefi ts of electrifi cation, because the empirical evidence is that the demand curve is much more likely to have a concave shape of the type shown in Figure A.3.1. Recognizing this problem, some studies (e.g., the World Bank’s Solar Homes project in Bolivia) take the area C as one third of the area determined by a linear demand curve.
Others have made the assumption of some particular functional form, which has the advantage of calculation of the area under the demand curve by defi nite integrals. One commonly used approach is to use a curve of constant elasticity b :
Q = Q0
PP0
⎡
⎣⎢
⎤
⎦⎥b
Equation A.3.1
For which the corresponding area C (i.e., between QKERO and QE) can be calculated from the corresponding defi nite integral.34
This has the merit of simplicity, but some shortcomings remain. The implication of such a curve is that at zero price, the quantity consumed would be infi nitely large. Yet, in the face of very dramatic electricity price decreases (as are achieved for example by grid-connection vis-à-vis car battery use), in the short run, consumption will be constrained by the stock of appliances required to actually use larger quantities of electricity.35
This approach of estimating changes in welfare by consumer surplus has a number of issues and limitations
33 For example, a linear demand curve was used in the Philippines study of rural electrifi cation benefi ts (Barnes, D. F., A. Domdom, V. Peskin, and H. Peskin, Rural Electrifi cation and Development in the Philippines: Measuring the Social and Economic Benefi ts. ESMAP formal Report 255/02. Washington, DC: World Bank, 2002).34 For details, see P. Meier, Economic Analysis of Solar Home Systems: A Case Study for the Philippines, World Bank, 2003. 35 P. Choynowksi (Measuring Willingness to Pay for Electricity, Asian Development Bank, Economics Research Department Technical Note Series #3, July 2002) has therefore proposed an alternative functional form of the general specifi cation lnq � a � �p . This has the advantage that the upper bound of electricity demand (when the price is zero) is given by ea, which captures the fact that consumption is bounded by the stock of electrical appliances. The price elasticity is given by �p, which varies with price: the greater the price, the greater the elasticity of demand. The implication is that at very high prices (typical of the equivalent price of kerosene), demand is more elastic than at low prices (typical of the price of grid-electricity).
Source: INEI, 2005.
Figure A.3.1Figure A.3.1
Demand for Lighting
QKERO
A
B
C
D E
QE
P KE RO
P E
service level
price
x
y
7134-CHAnnex3.pdf 115 7/27/10 6:57 AM
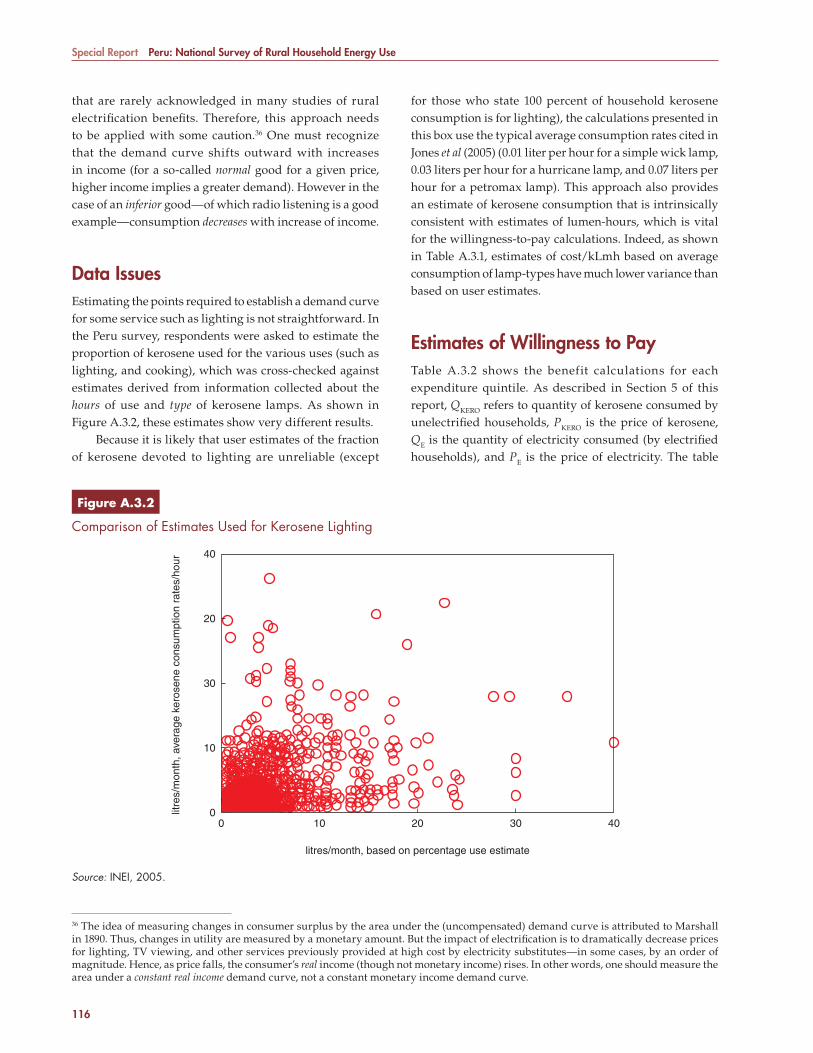
Special Report Peru: National Survey of Rural Household Energy Use
116
that are rarely acknowledged in many studies of rural electrifi cation benefi ts. Therefore, this approach needs to be applied with some caution.36 One must recognize that the demand curve shifts outward with increases in income (for a so-called normal good for a given price, higher income implies a greater demand). However in the case of an inferior good—of which radio listening is a good example—consumption decreases with increase of income.
Data IssuesEstimating the points required to establish a demand curve for some service such as lighting is not straightforward. In the Peru survey, respondents were asked to estimate the proportion of kerosene used for the various uses (such as lighting, and cooking), which was cross-checked against estimates derived from information collected about the hours of use and type of kerosene lamps. As shown in Figure A.3.2, these estimates show very different results.
Because it is likely that user estimates of the fraction of kerosene devoted to lighting are unreliable (except
for those who state 100 percent of household kerosene consumption is for lighting), the calculations presented in this box use the typical average consumption rates cited in Jones et al (2005) (0.01 liter per hour for a simple wick lamp, 0.03 liters per hour for a hurricane lamp, and 0.07 liters per hour for a petromax lamp). This approach also provides an estimate of kerosene consumption that is intrinsically consistent with estimates of lumen-hours, which is vital for the willingness-to-pay calculations. Indeed, as shown in Table A.3.1, estimates of cost/kLmh based on average consumption of lamp-types have much lower variance than based on user estimates.
Estimates of Willingness to PayTable A.3.2 shows the benefit calculations for each expenditure quintile. As described in Section 5 of this report, QKERO refers to quantity of kerosene consumed by unelectrifi ed households, PKERO is the price of kerosene, QE is the quantity of electricity consumed (by electrifi ed households), and PE is the price of electricity. The table
36 The idea of measuring changes in consumer surplus by the area under the (uncompensated) demand curve is attributed to Marshall in 1890. Thus, changes in utility are measured by a monetary amount. But the impact of electrifi cation is to dramatically decrease prices for lighting, TV viewing, and other services previously provided at high cost by electricity substitutes—in some cases, by an order of magnitude. Hence, as price falls, the consumer’s real income (though not monetary income) rises. In other words, one should measure the area under a constant real income demand curve, not a constant monetary income demand curve.
Source: INEI, 2005.
Figure A.3.2Figure A.3.2
Comparison of Estimates Used for Kerosene Lighting
litres/month, based on percentage use estimate
litre
s/m
onth
, ave
rage
ker
osen
e co
nsum
ptio
n ra
tes/
hour
40
20
30
10
00 10 20 30 40
7134-CHAnnex3.pdf 116 7/27/10 6:57 AM
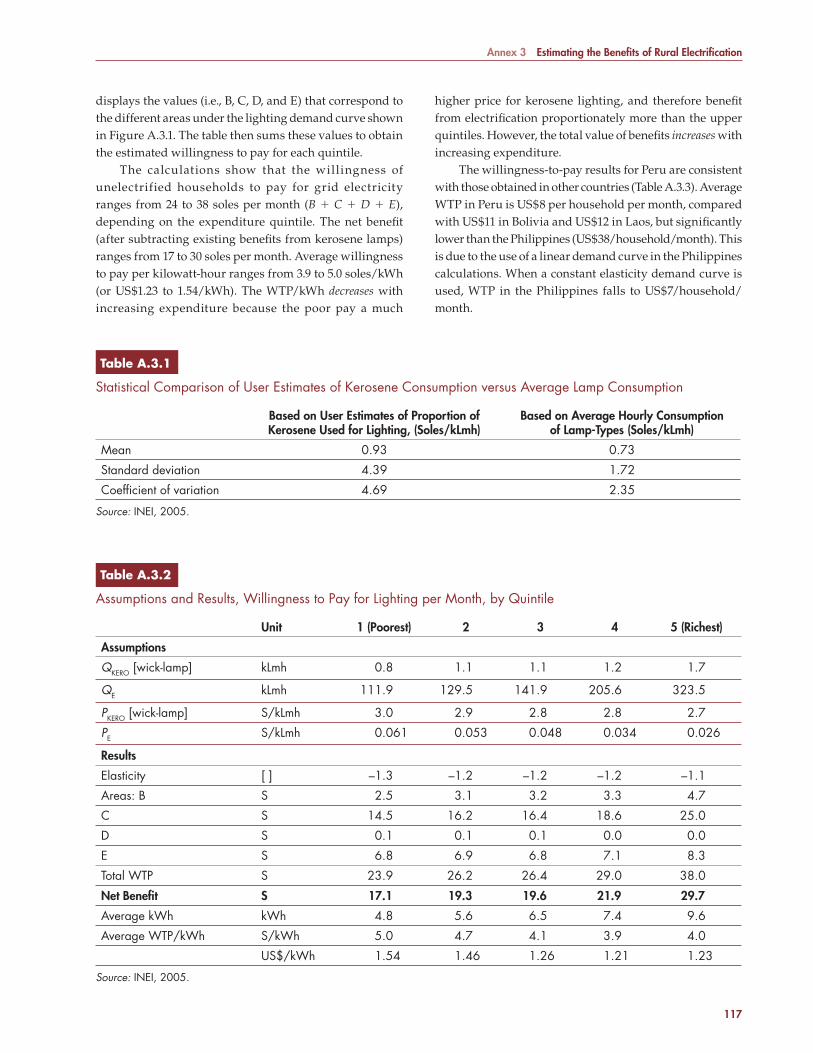
Annex 3 Estimating the Benefi ts of Rural Electrifi cation
117
displays the values (i.e., B, C, D, and E) that correspond to the different areas under the lighting demand curve shown in Figure A.3.1. The table then sums these values to obtain the estimated willingness to pay for each quintile.
The calculations show that the willingness of unelectrified households to pay for grid electricity ranges from 24 to 38 soles per month (B � C � D � E), depending on the expenditure quintile. The net benefi t (after subtracting existing benefi ts from kerosene lamps) ranges from 17 to 30 soles per month. Average willingness to pay per kilowatt-hour ranges from 3.9 to 5.0 soles/kWh (or US$1.23 to 1.54/kWh). The WTP/kWh decreases with increasing expenditure because the poor pay a much
higher price for kerosene lighting, and therefore benefi t from electrifi cation proportionately more than the upper quintiles. However, the total value of benefi ts increases with increasing expenditure.
The willingness-to-pay results for Peru are consistent with those obtained in other countries (Table A.3.3). Average WTP in Peru is US$8 per household per month, compared with US$11 in Bolivia and US$12 in Laos, but signifi cantly lower than the Philippines (US$38/household/month). This is due to the use of a linear demand curve in the Philippines calculations. When a constant elasticity demand curve is used, WTP in the Philippines falls to US$7/household/month.
Table A.3.1Table A.3.1
Statistical Comparison of User Estimates of Kerosene Consumption versus Average Lamp Consumption
Based on User Estimates of Proportion of Kerosene Used for Lighting, (Soles/kLmh)
Based on Average Hourly Consumption of Lamp-Types (Soles/kLmh)
Mean 0.93 0.73
Standard deviation 4.39 1.72
Coeffi cient of variation 4.69 2.35
Source: INEI, 2005.
Table A.3.2Table A.3.2
Assumptions and Results, Willingness to Pay for Lighting per Month, by Quintile
Unit 1 (Poorest) 2 3 4 5 (Richest)
Assumptions
QKERO [wick-lamp] kLmh 0.8 1.1 1.1 1.2 1.7
QE kLmh 111.9 129.5 141.9 205.6 323.5
PKERO [wick-lamp] S/kLmh 3.0 2.9 2.8 2.8 2.7
PE S/kLmh 0.061 0.053 0.048 0.034 0.026
Results
Elasticity [ ] –1.3 –1.2 –1.2 –1.2 –1.1
Areas: B S 2.5 3.1 3.2 3.3 4.7
C S 14.5 16.2 16.4 18.6 25.0
D S 0.1 0.1 0.1 0.0 0.0
E S 6.8 6.9 6.8 7.1 8.3
Total WTP S 23.9 26.2 26.4 29.0 38.0
Net Benefi t S 17.1 19.3 19.6 21.9 29.7
Average kWh kWh 4.8 5.6 6.5 7.4 9.6
Average WTP/kWh S/kWh 5.0 4.7 4.1 3.9 4.0
US$/kWh 1.54 1.46 1.26 1.21 1.23
Source: INEI, 2005.
7134-CHAnnex3.pdf 117 7/27/10 6:57 AM
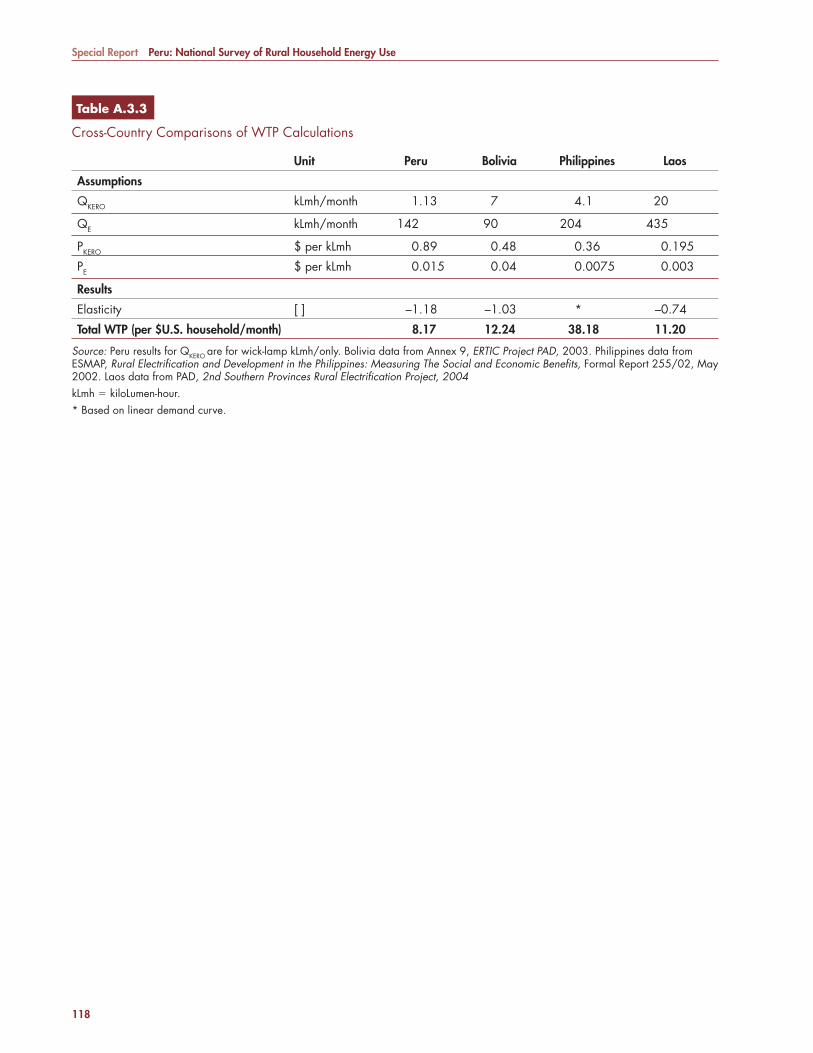
Special Report Peru: National Survey of Rural Household Energy Use
118
Table A.3.3Table A.3.3
Cross-Country Comparisons of WTP Calculations
Unit Peru Bolivia Philippines Laos
Assumptions
QKERO kLmh/month 1.13 7 4.1 20
QE kLmh/month 142 90 204 435
PKERO $ per kLmh 0.89 0.48 0.36 0.195
PE $ per kLmh 0.015 0.04 0.0075 0.003
Results
Elasticity [ ] –1.18 –1.03 * –0.74
Total WTP (per $U.S. household/month) 8.17 12.24 38.18 11.20
Source: Peru results for QKERO are for wick-lamp kLmh/only. Bolivia data from Annex 9, ERTIC Project PAD, 2003. Philippines data from ESMAP, Rural Electrifi cation and Development in the Philippines: Measuring The Social and Economic Benefi ts, Formal Report 255/02, May 2002. Laos data from PAD, 2nd Southern Provinces Rural Electrifi cation Project, 2004kLmh � kiloLumen-hour. * Based on linear demand curve.
7134-CHAnnex3.pdf 118 7/27/10 6:57 AM
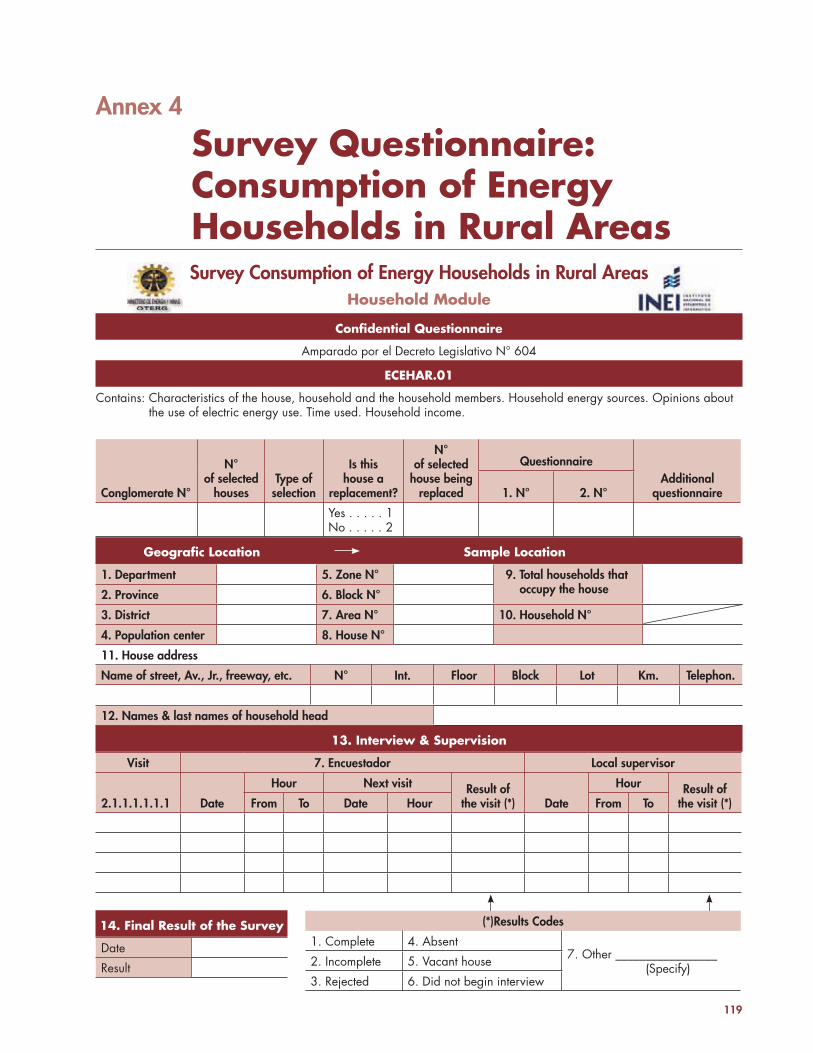
119
Survey Consumption of Energy Households in Rural AreasHousehold Module
Confi dential QuestionnaireConfi dential Questionnaire
Amparado por el Decreto Legislativo N° 604
ECEHAR.01ECEHAR.01
Contains: Characteristics of the house, household and the household members. Household energy sources. Opinions about the use of electric energy use. Time used. Household income.
Conglomerate N°
N° of selected
housesType of
selection
Is this house a
replacement?
N° of selected
house being replaced
QuestionnaireAdditional
questionnaire1. N° 2. N°
Yes . . . . . 1No . . . . . 2
13. Interview & Supervision13. Interview & Supervision
Visit 7. Encuestador Local supervisor
2.1.1.1.1.1.1 Date
Hour Next visit Result of the visit (*) Date
Hour Result of the visit (*)From To Date Hour From To
Geografi c Location Sample Location Geografi c Location Sample Location
1. Department 5. Zone N° 9. Total households that occupy the house2. Province 6. Block N°
3. District 7. Area N° 10. Household N°
4. Population center 8. House N°
11. House address
Name of street, Av., Jr., freeway, etc. N° Int. Floor Block Lot Km. Telephon.
12. Names & last names of household head
14. Final Result of the Survey14. Final Result of the Survey
Date
Result
(*)Results Codes
1. Complete 4. Absent7. Other _________________
(Specify)2. Incomplete 5. Vacant house
3. Rejected 6. Did not begin interview
Annex 4
Survey Questionnaire: Consumption of Energy Households in Rural Areas
7134-CHAnnex4.pdf 119 7/27/10 6:58 AM
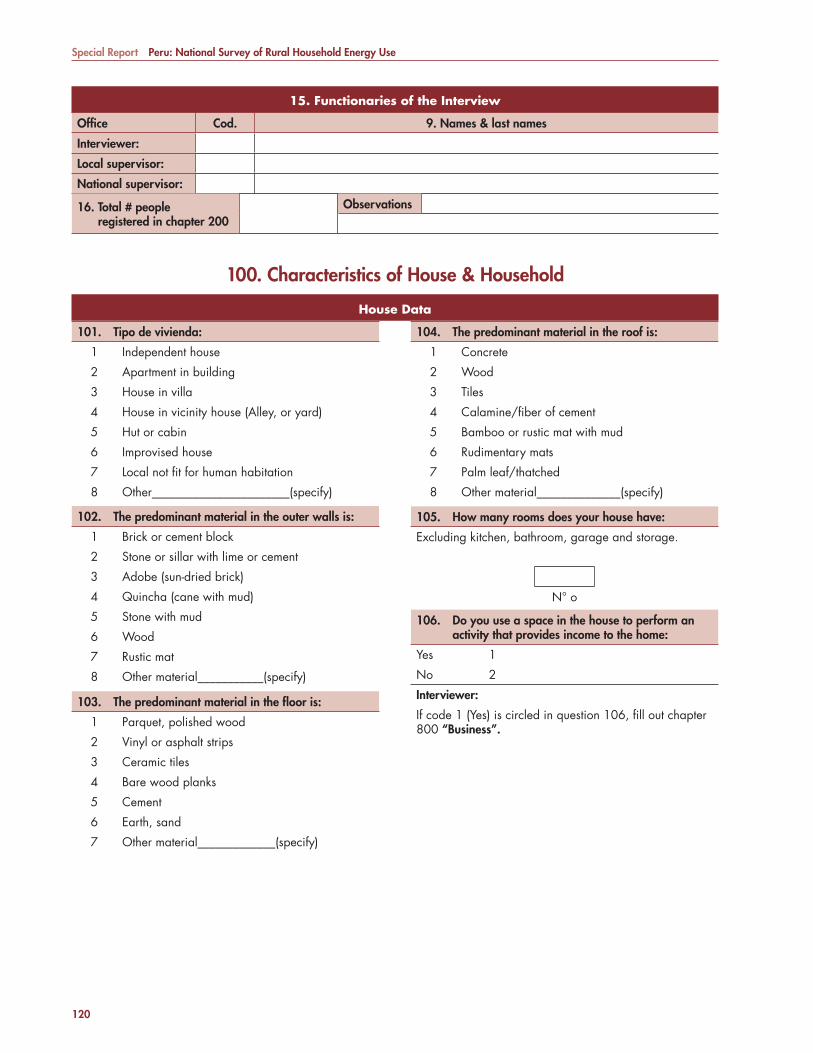
Special Report Peru: National Survey of Rural Household Energy Use
120
100. Characteristics of House & Household
House DataHouse Data
101. Tipo de vivienda:
1 Independent house
2 Apartment in building
3 House in villa
4 House in vicinity house (Alley, or yard)
5 Hut or cabin
6 Improvised house
7 Local not fi t for human habitation
8 Other_______________________(specify)
103. The predominant material in the fl oor is:
1 Parquet, polished wood
2 Vinyl or asphalt strips
3 Ceramic tiles
4 Bare wood planks
5 Cement
6 Earth, sand
7 Other material_____________(specify)
102. The predominant material in the outer walls is:
1 Brick or cement block
2 Stone or sillar with lime or cement
3 Adobe (sun-dried brick)
4 Quincha (cane with mud)
5 Stone with mud
6 Wood
7 Rustic mat
8 Other material___________(specify)
105. How many rooms does your house have:
Excluding kitchen, bathroom, garage and storage.
N° o
106. Do you use a space in the house to perform an activity that provides income to the home:
Yes 1
No 2
Interviewer:
If code 1 (Yes) is circled in question 106, fi ll out chapter 800 “Business”.
104. The predominant material in the roof is:
1 Concrete
2 Wood
3 Tiles
4 Calamine/fi ber of cement
5 Bamboo or rustic mat with mud
6 Rudimentary mats
7 Palm leaf/thatched
8 Other material ______________(specify)
15. Functionaries of the Interview15. Functionaries of the Interview
Offi ce Cod. 9. Names & last names
Interviewer:
Local supervisor:
National supervisor:
16. Total # people registered in chapter 200
Observations
7134-CHAnnex4.pdf 120 7/27/10 6:58 AM
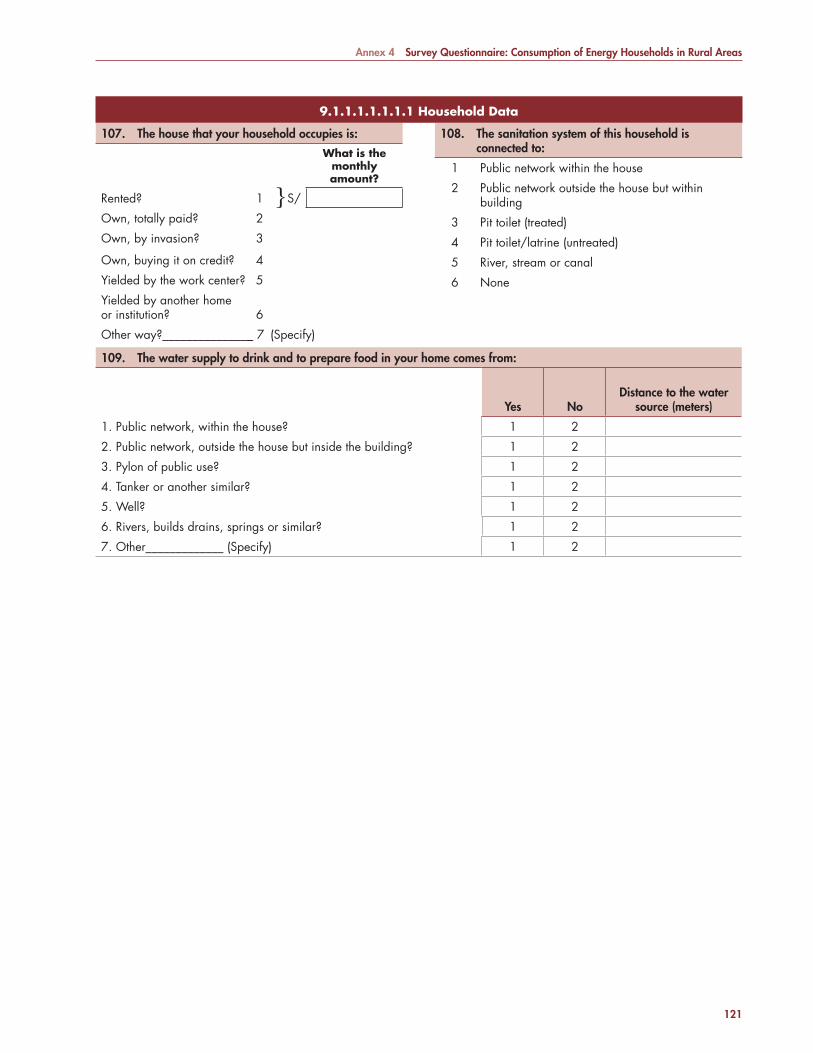
Annex 4 Survey Questionnaire: Consumption of Energy Households in Rural Areas
121
108. The sanitation system of this household is connected to:
1 Public network within the house
2 Public network outside the house but within building
3 Pit toilet (treated)
4 Pit toilet/latrine (untreated)
5 River, stream or canal
6 None
109. The water supply to drink and to prepare food in your home comes from:
Yes NoDistance to the water
source (meters)
1. Public network, within the house? 1 2
2. Public network, outside the house but inside the building? 1 2
3. Pylon of public use? 1 2
4. Tanker or another similar? 1 2
5. Well? 1 2
6. Rivers, builds drains, springs or similar? 1 2
7. Other_____________ (Specify) 1 2
107. The house that your household occupies is:
What is the monthly amount?
Rented? 1 S/
Own, totally paid? 2
Own, by invasion? 3
Own, buying it on credit? 4
Yielded by the work center? 5
Yielded by another home or institution? 6
Other way?________________ 7 (Specify)
}
9.1.1.1.1.1.1.1 Household Data9.1.1.1.1.1.1.1 Household Data
7134-CHAnnex4.pdf 121 7/27/10 6:58 AM
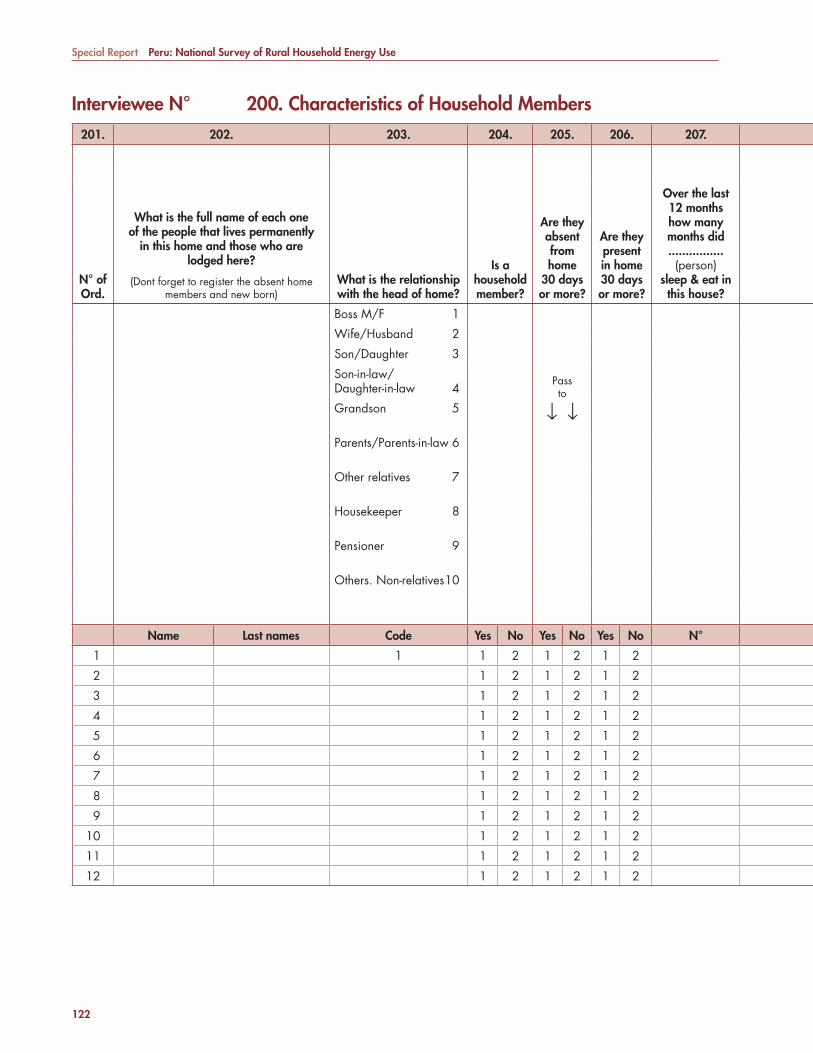
Special Report Peru: National Survey of Rural Household Energy Use
122
Interviewee N° 200. Characteristics of Household Members201. 202. 203. 204. 205. 206. 207.
N° of Ord.
What is the full name of each one of the people that lives permanently
in this home and those who are lodged here?
(Dont forget to register the absent home members and new born)
What is the relationship with the head of home?
Is a household member?
Are they absent from home
30 days or more?
Are they present in home 30 days or more?
Over the last 12 months how many months did ................ (person)
sleep & eat in this house?
Boss M/F 1
Wife/Husband 2
Son/Daughter 3
Son-in-law/Daughter-in-law 4
Passto
↓ ↓Grandson 5
Parents/Parents-in-law 6
Other relatives 7
Housekeeper 8
Pensioner 9
Others. Non-relatives 10
Name Last names Code Yes No Yes No Yes No N°
1 1 1 2 1 2 1 2
2 1 2 1 2 1 2
3 1 2 1 2 1 2
4 1 2 1 2 1 2
5 1 2 1 2 1 2
6 1 2 1 2 1 2
7 1 2 1 2 1 2
8 1 2 1 2 1 2
9 1 2 1 2 1 2
10 1 2 1 2 1 2
11 1 2 1 2 1 2
12 1 2 1 2 1 2
7134-CHAnnex4.pdf 122 7/27/10 6:58 AM
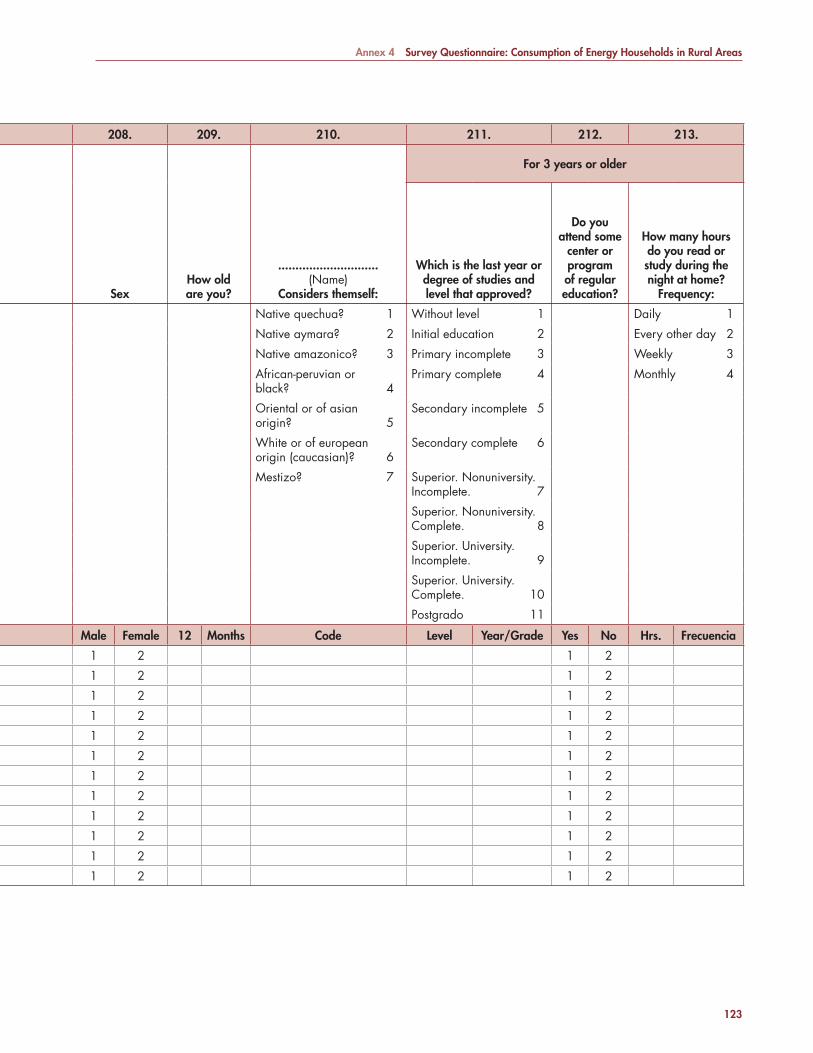
Annex 4 Survey Questionnaire: Consumption of Energy Households in Rural Areas
123
208. 209. 210. 211. 212. 213.
For 3 years or older
Sex How old are you?
.............................(Name)
Considers themself:
Which is the last year or degree of studies and level that approved?
Do you attend some
center or program of regular education?
How many hours do you read or study during the night at home?
Frequency:
Native quechua? 1 Without level 1 Daily 1
Native aymara? 2 Initial education 2 Every other day 2
Native amazonico? 3 Primary incomplete 3 Weekly 3
African-peruvian or black? 4
Primary complete 4 Monthly 4
Oriental or of asian origin? 5
Secondary incomplete 5
White or of european origin (caucasian)? 6
Secondary complete 6
Mestizo? 7 Superior. Nonuniversity. Incomplete. 7
Superior. Nonuniversity. Complete. 8
Superior. University. Incomplete. 9
Superior. University. Complete. 10
Postgrado 11
Male Female 12 Months Code Level Year/Grade Yes No Hrs. Frecuencia
1 2 1 2
1 2 1 2
1 2 1 2
1 2 1 2
1 2 1 2
1 2 1 2
1 2 1 2
1 2 1 2
1 2 1 2
1 2 1 2
1 2 1 2
1 2 1 2
7134-CHAnnex4.pdf 123 7/27/10 6:58 AM
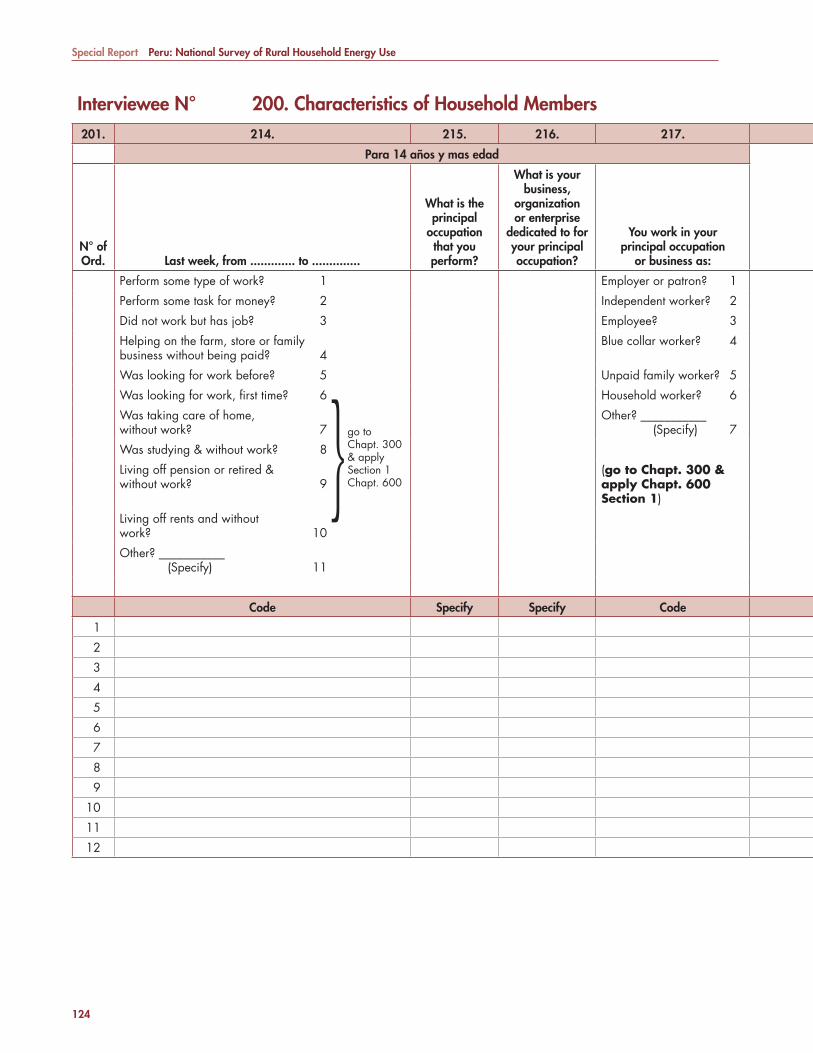
Special Report Peru: National Survey of Rural Household Energy Use
124
Interviewee N° 200. Characteristics of Household Members201. 214. 215. 216. 217.
Para 14 años y mas edad
N° of Ord. Last week, from ............. to ..............
What is the principal
occupation that you perform?
What is your business,
organization or enterprise
dedicated to for your principal occupation?
You work in yourprincipal occupation
or business as:
Perform some type of work? 1 Employer or patron? 1
Perform some task for money? 2 Independent worker? 2
Did not work but has job? 3 Employee? 3
Helping on the farm, store or family business without being paid? 4
Blue collar worker? 4
Was looking for work before? 5 Unpaid family worker? 5
Was looking for work, fi rst time? 6 Household worker? 6
Was taking care of home, without work? 7
Other? ___________ (Specify) 7
Was studying & without work? 8
Living off pension or retired & without work? 9
(go to Chapt. 300 & apply Chapt. 600 Section 1)
Living off rents and without work? 10
Other? ___________ (Specify) 11
Code Specify Specify Code
1
2
3
4
5
6
7
8
9
10
11
12
go toChapt. 300& apply Section 1 Chapt. 600}
7134-CHAnnex4.pdf 124 7/27/10 6:58 AM
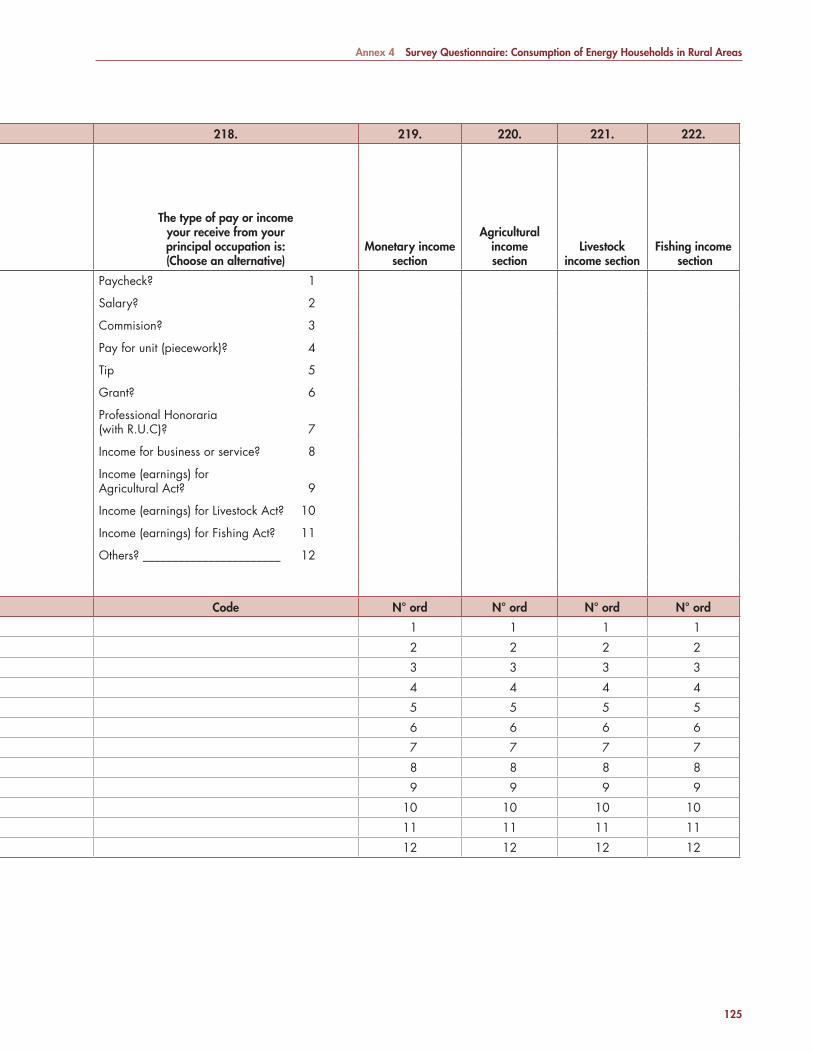
Annex 4 Survey Questionnaire: Consumption of Energy Households in Rural Areas
125
218. 219. 220. 221. 222.
The type of pay or income your receive from your principal occupation is: (Choose an alternative)
Monetary income section
Agricultural income section
Livestock income section
Fishing income section
Paycheck? 1
Salary? 2
Commision? 3
Pay for unit (piecework)? 4
Tip 5
Grant? 6
Professional Honoraria(with R.U.C)? 7
Income for business or service? 8
Income (earnings) for Agricultural Act? 9
Income (earnings) for Livestock Act? 10
Income (earnings) for Fishing Act? 11
Others? _______________________ 12
Code N° ord N° ord N° ord N° ord
1 1 1 1
2 2 2 2
3 3 3 3
4 4 4 4
5 5 5 5
6 6 6 6
7 7 7 7
8 8 8 8
9 9 9 9
10 10 10 10
11 11 11 11
12 12 12 12
7134-CHAnnex4.pdf 125 7/27/10 6:58 AM
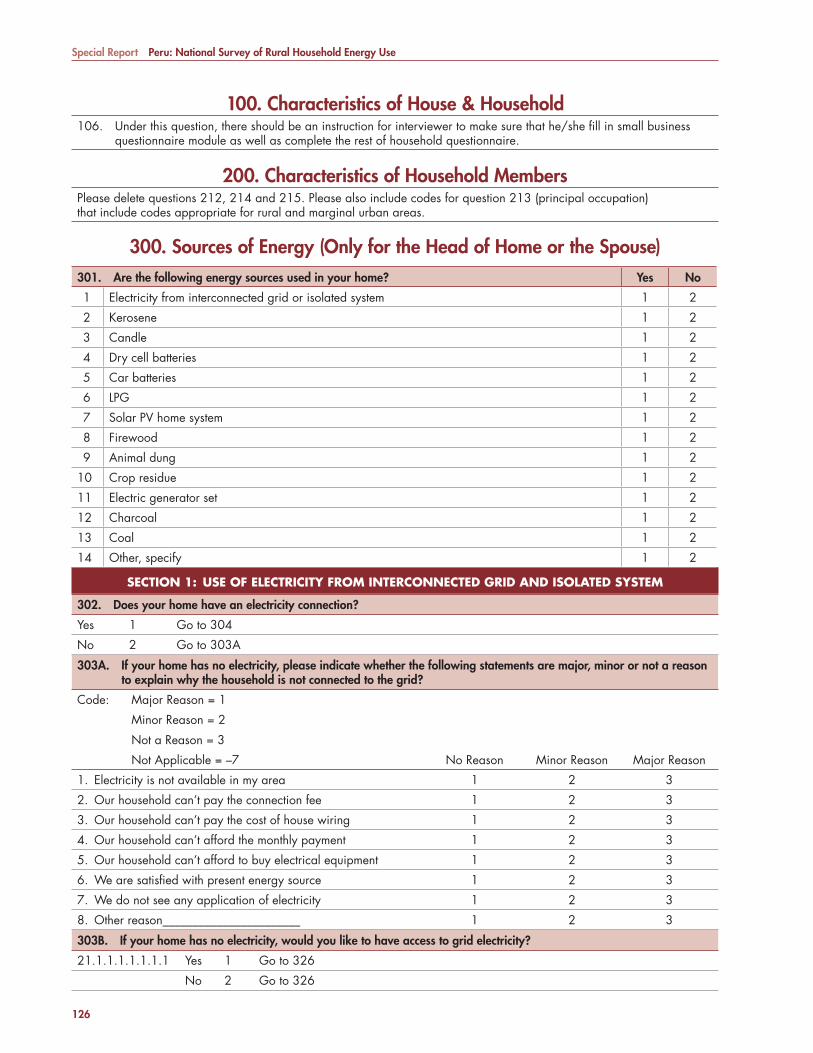
Special Report Peru: National Survey of Rural Household Energy Use
100. Characteristics of House & Household106. Under this question, there should be an instruction for interviewer to make sure that he/she fi ll in small business
questionnaire module as well as complete the rest of household questionnaire.
200. Characteristics of Household MembersPlease delete questions 212, 214 and 215. Please also include codes for question 213 (principal occupation) that include codes appropriate for rural and marginal urban areas.
300. Sources of Energy (Only for the Head of Home or the Spouse)301. Are the following energy sources used in your home? Yes No
1 Electricity from interconnected grid or isolated system 1 2
2 Kerosene 1 2
3 Candle 1 2
4 Dry cell batteries 1 2
5 Car batteries 1 2
6 LPG 1 2
7 Solar PV home system 1 2
8 Firewood 1 2
9 Animal dung 1 2
10 Crop residue 1 2
11 Electric generator set 1 2
12 Charcoal 1 2
13 Coal 1 2
14 Other, specify 1 2
SECTION 1: USE OF ELECTRICITY FROM INTERCONNECTED GRID AND ISOLATED SYSTEMSECTION 1: USE OF ELECTRICITY FROM INTERCONNECTED GRID AND ISOLATED SYSTEM
302. Does your home have an electricity connection?
Yes 1 Go to 304
No 2 Go to 303A
303A. If your home has no electricity, please indicate whether the following statements are major, minor or not a reason to explain why the household is not connected to the grid?
Code: Major Reason = 1
Minor Reason = 2
Not a Reason = 3
Not Applicable = –7 No Reason Minor Reason Major Reason
1. Electricity is not available in my area 1 2 3
2. Our household can’t pay the connection fee 1 2 3
3. Our household can’t pay the cost of house wiring 1 2 3
4. Our household can’t afford the monthly payment 1 2 3
5. Our household can’t afford to buy electrical equipment 1 2 3
6. We are satisfi ed with present energy source 1 2 3
7. We do not see any application of electricity 1 2 3
8. Other reason_______________________ 1 2 3
303B. If your home has no electricity, would you like to have access to grid electricity?
21.1.1.1.1.1.1.1 Yes 1 Go to 326
No 2 Go to 326
126
7134-CHAnnex4.pdf 126 7/27/10 6:58 AM

Annex 4 Survey Questionnaire: Consumption of Energy Households in Rural Areas
127
304. What is the name of the distribution company that provides electricity service in your home?
Code: Write down name of the company
__________________________________________________________________________________________________________
305. In what year was the electrical connection fi rst made to your home?
Code: Year of connection of home (ie. 1958)
Does not know –8
__________________________________________________________________________________________________________
306. Does your home have an electric meter?
21.1.1.1.1.1.1.2 Yes 1
21.1.1.1.1.1.1.3 No 2 Go to 308
307. How many households are connected to the same electric meter including yours?
Code: Number of homes or “1” if the responding household is the only home that connect to electric meter
308. How many hours per day does your home typically have electricity service?
309. How many days per month does your household typically have electricity service in your home?
310. During the last 12 months, how many months has your home had electricity service?
Code: Hours per day of service Code: Days per month of service Code: Months with service for the last 12 months
Don’t know –8 Don’t know –8 Don’t know –8
_____________________________ _____________________________ _____________________________
311. To whom does your household pay for the electricity service that you receive at home?
Directly to the distributing company 1
Pay to the neighbor or relative 2
The electricity is included in the rent 3 Go to 315A
Others_______________________________________________________ 4
(Specify)
Do not pay 5 Go to 315A
7134-CHAnnex4.pdf 127 7/27/10 6:58 AM
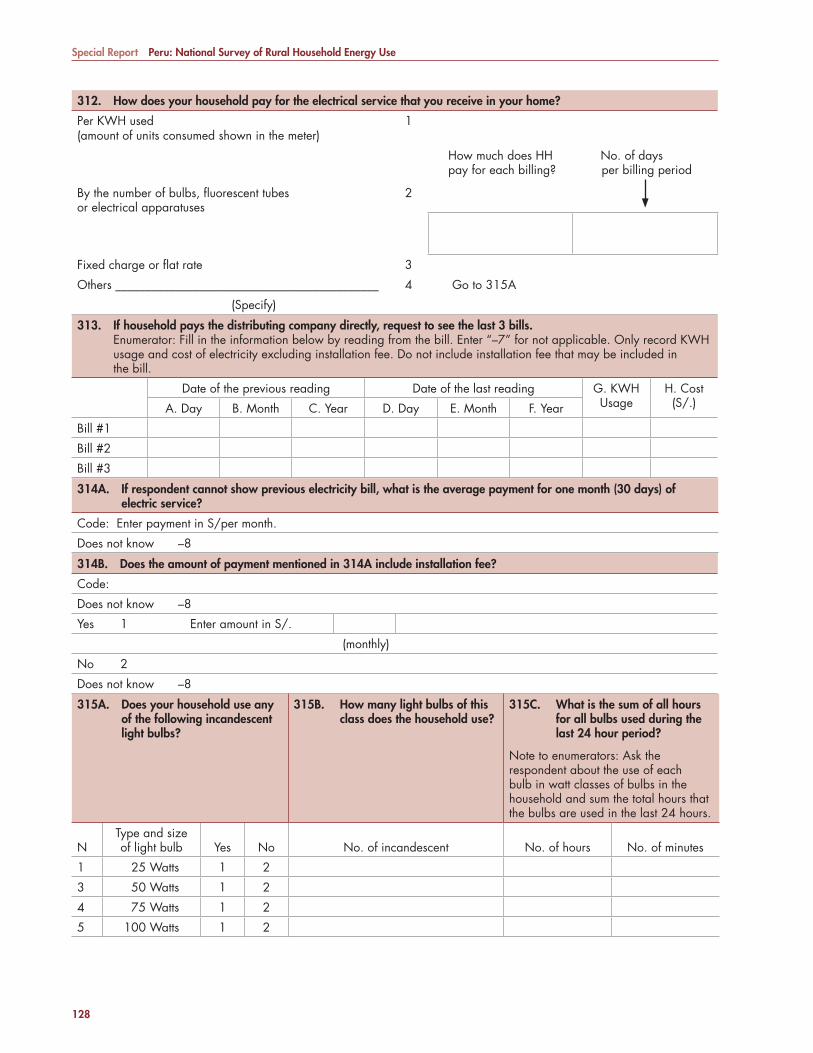
Special Report Peru: National Survey of Rural Household Energy Use
128
312. How does your household pay for the electrical service that you receive in your home?
Per KWH used 1(amount of units consumed shown in the meter)
By the number of bulbs, fl uorescent tubes 2or electrical apparatuses
How much does HH No. of dayspay for each billing? per billing period
Fixed charge or fl at rate 3
Others ____________________________________________ 4 Go to 315A
(Specify)
313. If household pays the distributing company directly, request to see the last 3 bills. Enumerator: Fill in the information below by reading from the bill. Enter “–7” for not applicable. Only record KWH usage and cost of electricity excluding installation fee. Do not include installation fee that may be included in the bill.
Date of the previous reading Date of the last reading G. KWH Usage
H. Cost (S/.)A. Day B. Month C. Year D. Day E. Month F. Year
Bill #1
Bill #2
Bill #3
314A. If respondent cannot show previous electricity bill, what is the average payment for one month (30 days) of electric service?
Code: Enter payment in S/per month.
Does not know –8
314B. Does the amount of payment mentioned in 314A include installation fee?
Code:
Does not know –8
Yes 1 Enter amount in S/.
(monthly)
No 2
Does not know –8
315A. Does your household use any of the following incandescent light bulbs?
315B. How many light bulbs of this class does the household use?
315C. What is the sum of all hours for all bulbs used during the last 24 hour period?
Note to enumerators: Ask the respondent about the use of each bulb in watt classes of bulbs in the household and sum the total hours that the bulbs are used in the last 24 hours.
NType and size of light bulb Yes No No. of incandescent No. of hours No. of minutes
1 25 Watts 1 2
3 50 Watts 1 2
4 75 Watts 1 2
5 100 Watts 1 2
7134-CHAnnex4.pdf 128 7/27/10 6:58 AM
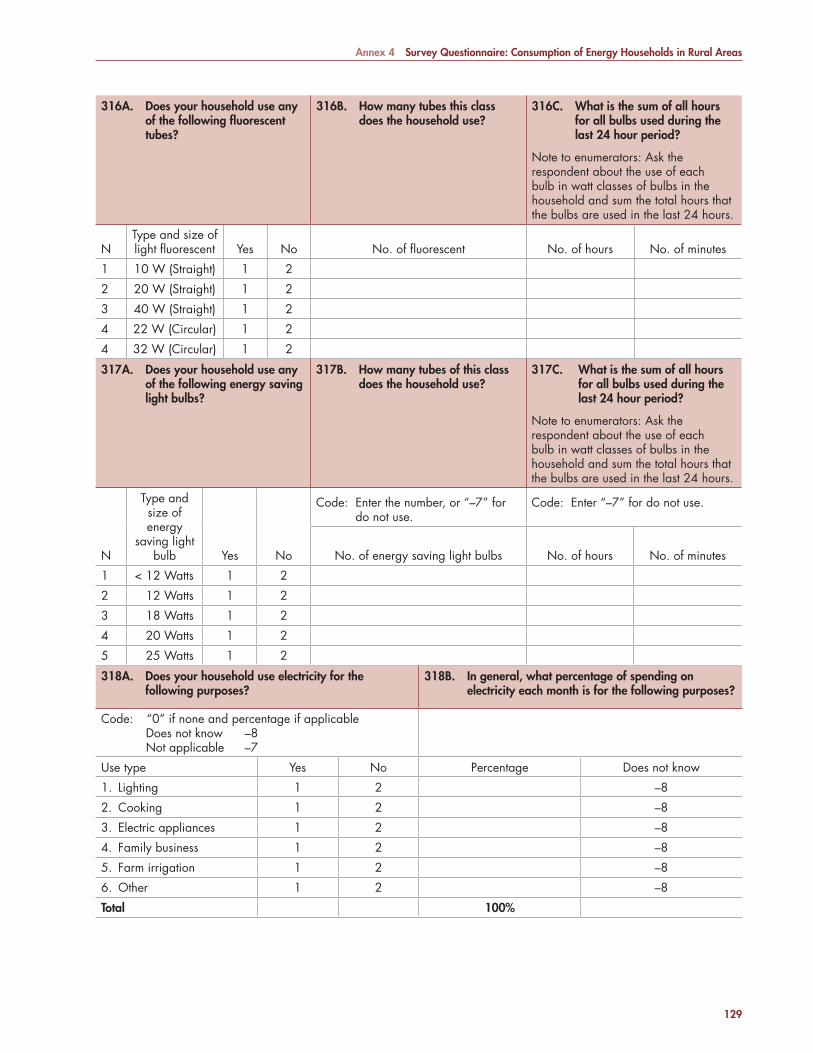
Annex 4 Survey Questionnaire: Consumption of Energy Households in Rural Areas
129
316A. Does your household use any of the following fl uorescent tubes?
316B. How many tubes this class does the household use?
316C. What is the sum of all hours for all bulbs used during the last 24 hour period?
Note to enumerators: Ask the respondent about the use of each bulb in watt classes of bulbs in the household and sum the total hours that the bulbs are used in the last 24 hours.
NType and size of light fl uorescent Yes No No. of fl uorescent No. of hours No. of minutes
1 10 W (Straight) 1 2
2 20 W (Straight) 1 2
3 40 W (Straight) 1 2
4 22 W (Circular) 1 2
4 32 W (Circular) 1 2
317A. Does your household use any of the following energy saving light bulbs?
317B. How many tubes of this class does the household use?
317C. What is the sum of all hours for all bulbs used during the last 24 hour period?
Note to enumerators: Ask the respondent about the use of each bulb in watt classes of bulbs in the household and sum the total hours that the bulbs are used in the last 24 hours.
N
Type and size of energy
saving light bulb Yes No
Code: Enter the number, or “–7” for do not use.
Code: Enter “–7” for do not use.
No. of energy saving light bulbs No. of hours No. of minutes
1 < 12 Watts 1 2
2 12 Watts 1 2
3 18 Watts 1 2
4 20 Watts 1 2
5 25 Watts 1 2
318A. Does your household use electricity for the following purposes?
318B. In general, what percentage of spending on electricity each month is for the following purposes?
Code: “0” if none and percentage if applicable Does not know –8 Not applicable –7
Use type Yes No Percentage Does not know
1. Lighting 1 2 –8
2. Cooking 1 2 –8
3. Electric appliances 1 2 –8
4. Family business 1 2 –8
5. Farm irrigation 1 2 –8
6. Other 1 2 –8
Total 100%
7134-CHAnnex4.pdf 129 7/27/10 6:58 AM

Special Report Peru: National Survey of Rural Household Energy Use
130
319A
. D
oes
your
hou
seho
ld u
se th
e fo
llow
ing
plug
-in e
lect
ric a
pplia
nces
?31
9B.
How
man
y of
eac
h ap
plia
nce
does
the
hous
ehol
d us
e?31
9C.
Wha
t is
the
aver
age
wat
tage
ra
ting
of th
e ap
plia
nce?
Not
e: E
stim
ate
the
aver
age
wat
tage
if
mor
e th
an o
ne a
pplia
nce
in u
se.
319D
. W
hat i
s th
e su
m o
f all
hour
s fo
r al
l app
lianc
es u
sed
durin
g th
e la
st 2
4 ho
ur
perio
d?
Not
e to
enu
mer
ator
s: I
f the
ho
useh
old
has
mor
e th
an o
ne
appl
ianc
e of
this
type
, ask
the
resp
onde
nt a
bout
the
use
of e
ach
appl
ianc
e in
the
hous
ehol
d an
d su
m
the
tota
l hou
rs th
at th
e ap
plia
nces
are
us
ed in
the
last
24 h
ours
.
App
lianc
e Ty
peY
N
Cod
e: E
nter
the
num
ber
or “
–7”
for d
o no
t use
.C
ode:
Ent
er th
e av
erag
e nu
mbe
r of
wat
ts of
app
lianc
es o
r “–7
” fo
r do
not u
se.
Cod
e: E
nter
hou
rs o
f use
with
frac
tion.
, or
“–7
” fo
r do
not u
se.
No.
of h
ours
No.
of m
inut
es 1
Radi
o1
2
2So
und
equi
pmen
t1
2
3TV
bla
ck a
nd w
hite
12
4TV
col
or1
2
5Re
cord
ing
vide
o/D
VD1
2
6El
ectri
c m
otor
s1
2
7Re
frige
rato
r1
2
8M
icro
wav
e ov
en1
2
9El
ectri
c sto
ve1
2
10El
ectri
c iro
n1
2
11Fa
n1
2
12W
ashi
ng m
achi
ne1
2
13D
omes
tic w
ater
pum
p1
2
14El
ectri
cal s
ewer
mac
hine
12
15El
ectri
c dr
ill1
2
16El
ectri
c sa
w1
2
17El
ectri
c pu
mp
for i
rrig
atio
n1
2
18O
ther
s?__
____
____
__(S
peci
fy)
12
19O
ther
s?__
____
____
__(S
peci
fy)
12
20O
ther
s?__
____
____
__(S
peci
fy)
12
7134-CHAnnex4.pdf 130 7/27/10 6:58 AM

Annex 4 Survey Questionnaire: Consumption of Energy Households in Rural Areas
131
320A. I n your opinion, your household electricity supply during the dry season is:
Normal 1
Irregular 2
Not applicable –7
320B. In your opinion, your household electricity supply during the rainy season is:
Normal 1
Irregular 2
Not applicable –7
321. Over the past month, how many times has the household’s electricity services failed for more than 30 minutes?
Code: Number of times
Never 0 Go to 323
Does not know –8
322. Over the past one month, could you please estimate the amount of hours (in total) electricity service has not been available to your home due to electricity cuts or blackouts?
Code: Enter hours with fraction
Does not know –8
_____________________
323. Over the past one month, how often did the household experience dimming of the light?
Often 1
Rarely 2
Never 3
324. In case of power failure, what backup equipment does the household use, if any?
Yes No
A. Candles 1 2
B. Kerosene wick lamp 1 2
C. Petromax 1 2
D. Gas lamp 1 2
E. Car/Motorcycle battery 1 2
F. Generator 1 2
325. Please indicate whether the following are major, minor, or not reasons for your household connecting to grid electricity.
Code: Major Reason = 1 Minor Reason = 2 No Reason = 3
Major Reason Minor Reason No Reason
1. For entertainment 1 2 3
2. For information and/or the news 1 2 3
3. For better lighting within the home 1 2 3
4. For better safety outside the home 1 2 3
5. To improve income 1 2 3
6. Because electricity is cheaper than other fuels 1 2 3
7. For education of your children 1 2 3
8. Other reason_______________________ 1 2 3
7134-CHAnnex4.pdf 131 7/27/10 6:58 AM
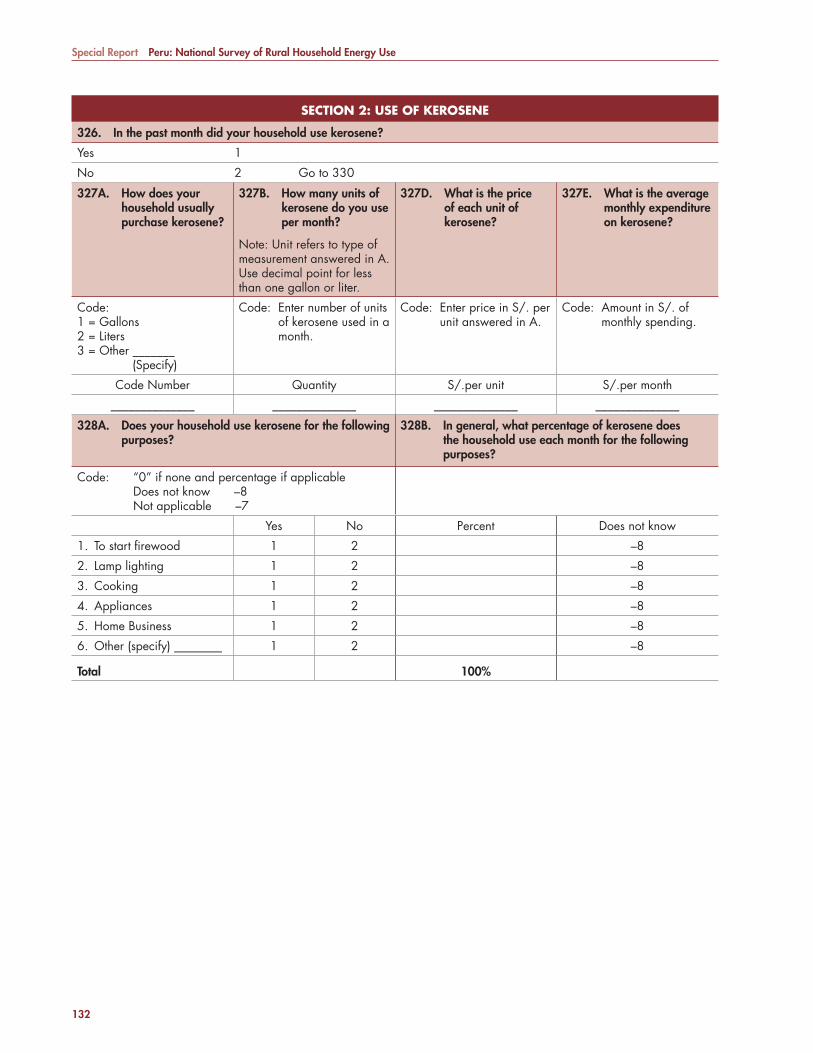
Special Report Peru: National Survey of Rural Household Energy Use
132
SECTION 2: USE OF KEROSENESECTION 2: USE OF KEROSENE
326. In the past month did your household use kerosene?
Yes 1
No 2 Go to 330
327A. How does your household usually purchase kerosene?
327B. How many units of kerosene do you use per month?
Note: Unit refers to type of measurement answered in A. Use decimal point for less than one gallon or liter.
327D. What is the price of each unit of kerosene?
327E. What is the average monthly expenditure on kerosene?
Code: 1 = Gallons2 = Liters3 = Other _______ (Specify)
Code: Enter number of units of kerosene used in a month.
Code: Enter price in S/. per unit answered in A.
Code: Amount in S/. of monthly spending.
Code Number Quantity S/.per unit S/.per month
______________ ______________ ______________ ______________
328A. Does your household use kerosene for the following purposes?
328B. In general, what percentage of kerosene does the household use each month for the following purposes?
Code: “0” if none and percentage if applicableDoes not know –8Not applicable –7
Yes No Percent Does not know
1. To start fi rewood 1 2 –8
2. Lamp lighting 1 2 –8
3. Cooking 1 2 –8
4. Appliances 1 2 –8
5. Home Business 1 2 –8
6. Other (specify) ________ 1 2 –8
Total 100%
7134-CHAnnex4.pdf 132 7/27/10 6:58 AM
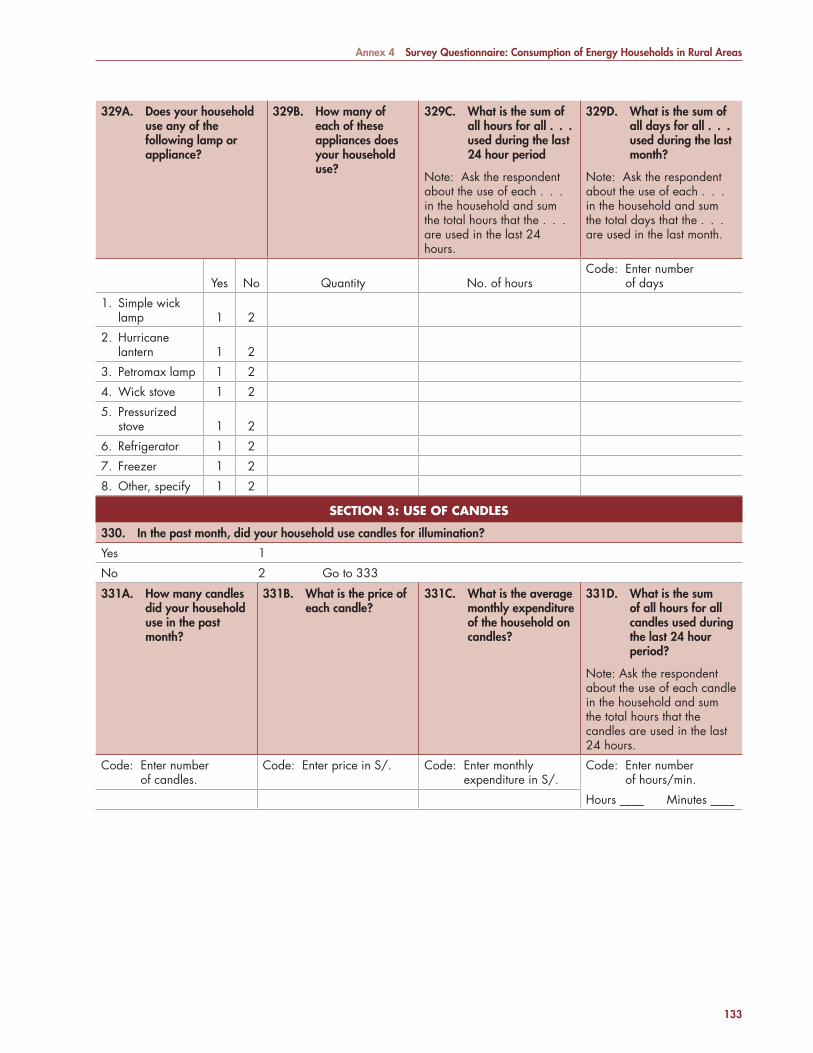
Annex 4 Survey Questionnaire: Consumption of Energy Households in Rural Areas
133
329A. Does your household use any of the following lamp or appliance?
329B. How many of each of these appliances does your household use?
329C. What is the sum of all hours for all . . . used during the last 24 hour period
Note: Ask the respondent about the use of each . . . in the household and sum the total hours that the . . . are used in the last 24 hours.
329D. What is the sum of all days for all . . . used during the last month?
Note: Ask the respondent about the use of each . . . in the household and sum the total days that the . . . are used in the last month.
Yes No Quantity No. of hoursCode: Enter number
of days
1. Simple wick lamp 1 2
2. Hurricane lantern 1 2
3. Petromax lamp 1 2
4. Wick stove 1 2
5. Pressurized stove 1 2
6. Refrigerator 1 2
7. Freezer 1 2
8. Other, specify 1 2
SECTION 3: USE OF CANDLESSECTION 3: USE OF CANDLES
330. In the past month, did your household use candles for illumination?
Yes 1
No 2 Go to 333
331A. How many candles did your household use in the past month?
331B. What is the price of each candle?
331C. What is the average monthly expenditure of the household on candles?
331D. What is the sum of all hours for all candles used during the last 24 hour period?
Note: Ask the respondent about the use of each candle in the household and sum the total hours that the candles are used in the last 24 hours.
Code: Enter number of candles.
Code: Enter price in S/. Code: Enter monthly expenditure in S/.
Code: Enter number of hours/min.
Hours ____ Minutes ____
7134-CHAnnex4.pdf 133 7/27/10 6:58 AM
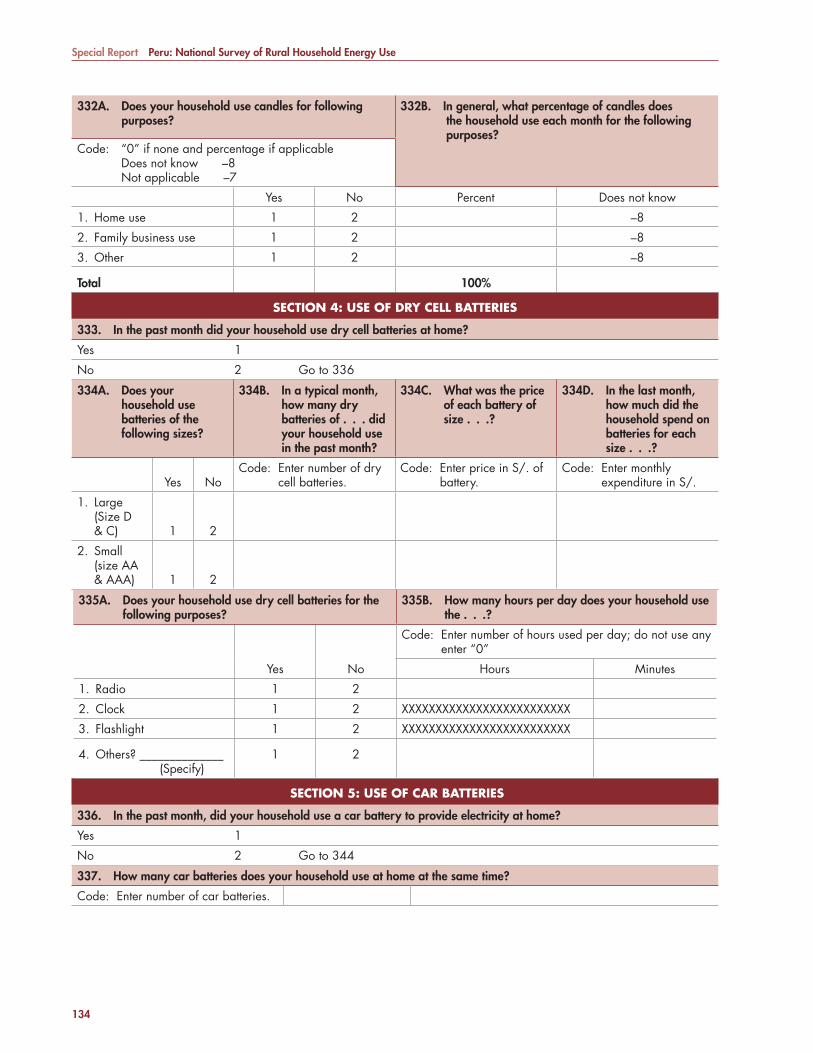
Special Report Peru: National Survey of Rural Household Energy Use
134
332A. Does your household use candles for following purposes?
332B. I n general, what percentage of candles does the household use each month for the following purposes?
Code: “0” if none and percentage if applicableDoes not know –8Not applicable –7
Yes No Percent Does not know
1. Home use 1 2 –8
2. Family business use 1 2 –8
3. Other 1 2 –8
Total 100%
SECTION 4: USE OF DRY CELL BATTERIESSECTION 4: USE OF DRY CELL BATTERIES
333. In the past month did your household use dry cell batteries at home?
Yes 1
No 2 Go to 336
334A. Does your household use batteries of the following sizes?
334B. In a typical month, how many dry batteries of . . . did your household use in the past month?
334C. What was the price of each battery of size . . .?
334D. In the last month, how much did the household spend on batteries for each size . . .?
Yes NoCode: Enter number of dry
cell batteries.Code: Enter price in S/. of
battery.Code: Enter monthly
expenditure in S/.
1. Large (Size D & C) 1 2
2. Small (size AA & AAA) 1 2
335A. Does your household use dry cell batteries for the following purposes?
335B. How many hours per day does your household use the . . .?
Yes No
Code: Enter number of hours used per day; do not use any enter “0”
Hours Minutes
1. Radio 1 2
2. Clock 1 2 XXXXXXXXXXXXXXXXXXXXXXXXX
3. Flashlight 1 2 XXXXXXXXXXXXXXXXXXXXXXXXX
4. Others? ______________ (Specify)
1 2
SECTION 5: SECTION 5: USE OF CAR BATTERIESUSE OF CAR BATTERIES
336. In the past month, did your household use a car battery to provide electricity at home?
Yes 1
No 2 Go to 344
337. How many car batteries does your household use at home at the same time?
Code: Enter number of car batteries.
7134-CHAnnex4.pdf 134 7/27/10 6:58 AM

Annex 4 Survey Questionnaire: Consumption of Energy Households in Rural Areas
135
338A. What is the cost of the car battery?
338B. What is the voltage of the battery?
Enumerator: Ask to see the batteries.
338C. What is the amperage of the battery?
Code: Enter cost in S/. of car battery
Code: Enter voltage of car battery, if no battery enter –7 if do not know enter –8
Code: Enter ampere of car battery
Batt No. 6 V 8 V 12 V 24 V Other
Do not know
Not applicable
1 6 8 12 24 –8 –7
2 6 8 12 24 –8 –7
3 6 8 12 24 –8 –7
338D. If your household used a battery previous to this one, how many months did the previous battery last?
Code: Enter number of months previous battery lasted.Does not apply –7
_____________________________
338E. What is the cost per recharge for the fi rst battery listed?
338F. How many recharges for all car batteries does your household have each month?
338G. How many days does each recharge last?
338H. What is the average monthly expenditure for recharging car batteries?
338I. What is the cost of round trip transportation per recharge?
Code: Amount in S/Does not know –8
Code: Enter number of recharges
Code: Enter number of days each recharge last
Code: Enter monthly expenditure in S/.
Code: Enter roundtrip transportation cost in S/.
____________ ____________ ____________ ____________ ____________
339A. Does your household use any of the following incandescent light bulbs, which are energized by car batteries?
339B. How many light bulbs of this class does the household use?
339C. What is the sum of all hours for all bulbs used during the last 24 hour period?
Note to enumerators: Ask the respondent about the use of each bulb in watt classes of bulbs in the household and sum the total hours that the bulbs are used in the last 24 hours.
Type and sizeof light bulb Yes No
Code: Enter the number, or “–7” for do not use
Code: Enter hours of use with fraction., or “–7” for do not use
Hours Minutes
1 < 10 Watts 1 2
2 15 Watts 1 2
3 25 Watts 1 2
7134-CHAnnex4.pdf 135 7/27/10 6:58 AM
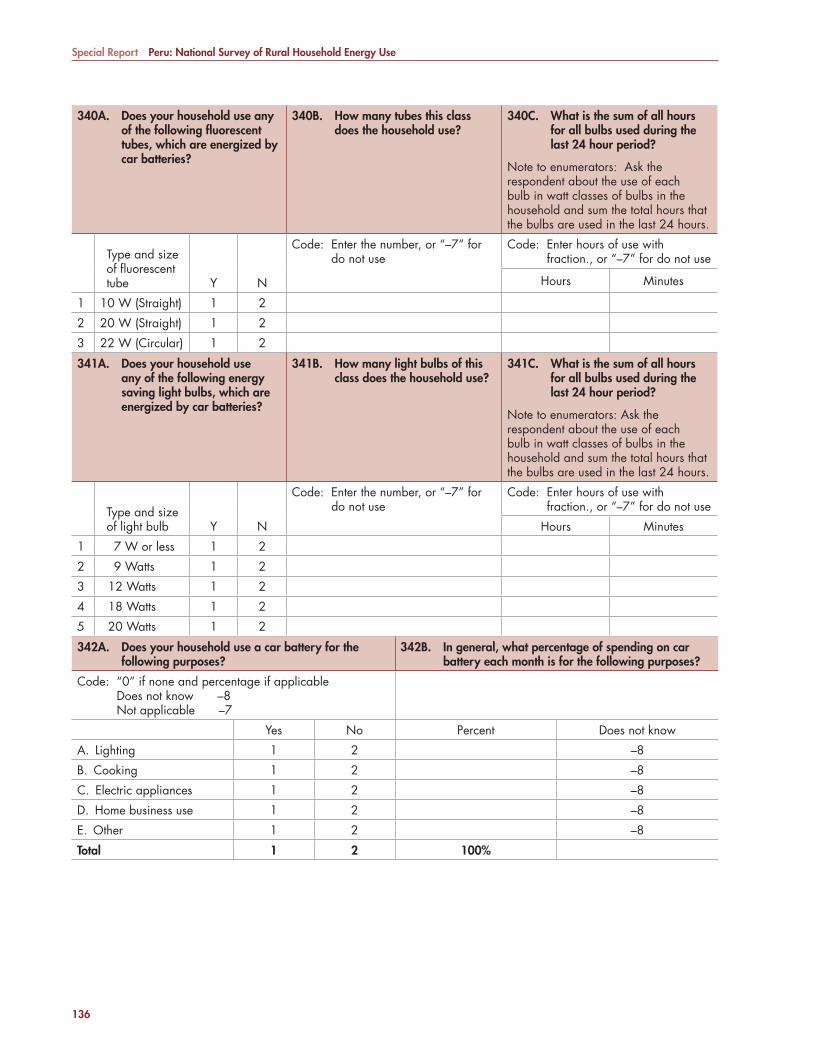
Special Report Peru: National Survey of Rural Household Energy Use
136
340A. Does your household use any of the following fl uorescent tubes, which are energized by car batteries?
340B. How many tubes this class does the household use?
340C. What is the sum of all hours for all bulbs used during the last 24 hour period?
Note to enumerators: Ask the respondent about the use of each bulb in watt classes of bulbs in the household and sum the total hours that the bulbs are used in the last 24 hours.
Type and sizeof fl uorescenttube Y N
Code: Enter the number, or “–7” for do not use
Code: Enter hours of use with fraction., or “–7” for do not use
Hours Minutes
1 10 W (Straight) 1 2
2 20 W (Straight) 1 2
3 22 W (Circular) 1 2
341A. Does your household use any of the following energy saving light bulbs, which are energized by car batteries?
341B. How many light bulbs of this class does the household use?
341C. What is the sum of all hours for all bulbs used during the last 24 hour period?
Note to enumerators: Ask the respondent about the use of each bulb in watt classes of bulbs in the household and sum the total hours that the bulbs are used in the last 24 hours.
Type and sizeof light bulb Y N
Code: Enter the number, or “–7” for do not use
Code: Enter hours of use with fraction., or “–7” for do not use
Hours Minutes
1 7 W or less 1 2
2 9 Watts 1 2
3 12 Watts 1 2
4 18 Watts 1 2
5 20 Watts 1 2
342A. Does your household use a car battery for the following purposes?
342B. In general, what percentage of spending on car battery each month is for the following purposes?
Code: “0” if none and percentage if applicableDoes not know –8Not applicable –7
Yes No Percent Does not know
A. Lighting 1 2 –8
B. Cooking 1 2 –8
C. Electric appliances 1 2 –8
D. Home business use 1 2 –8
E. Other 1 2 –8
Total 1 2 100%
7134-CHAnnex4.pdf 136 7/27/10 6:58 AM
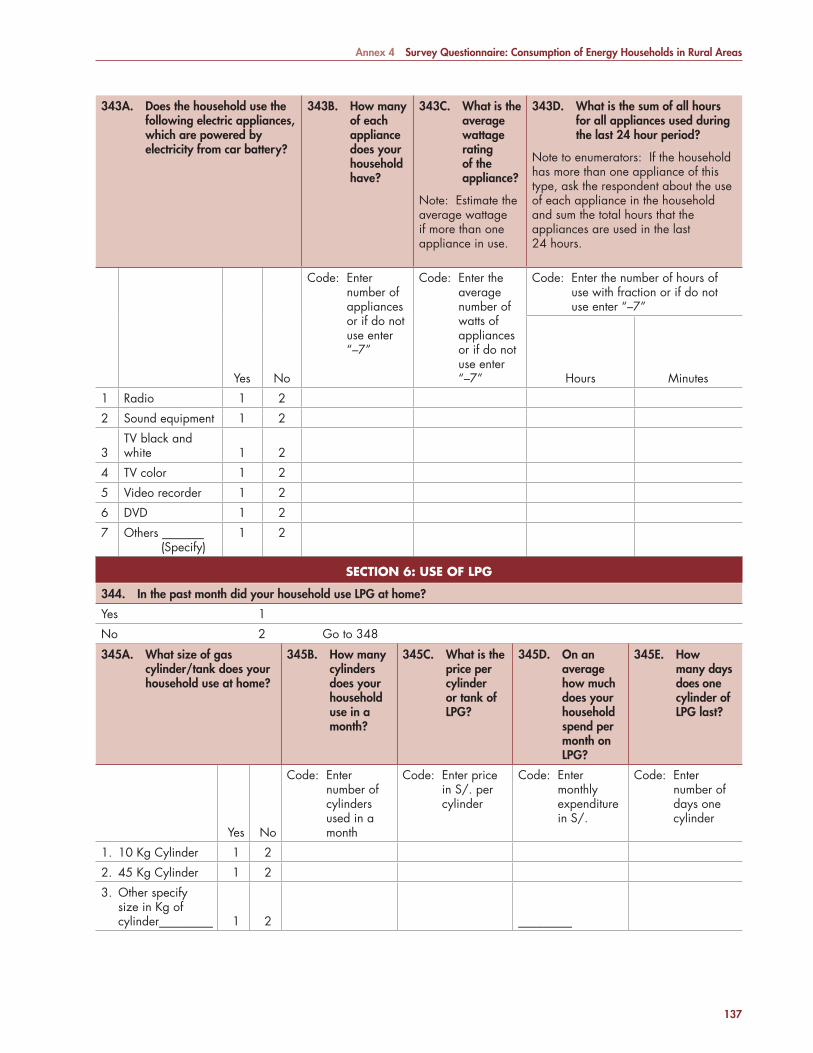
Annex 4 Survey Questionnaire: Consumption of Energy Households in Rural Areas
137
343A. Does the household use the following electric appliances, which are powered by electricity from car battery?
343B. How many of each appliance does your household have?
343C. What is the average wattage rating of the appliance?
Note: Estimate the average wattage if more than one appliance in use.
343D. What is the sum of all hours for all appliances used during the last 24 hour period?
Note to enumerators: If the household has more than one appliance of this type, ask the respondent about the use of each appliance in the household and sum the total hours that the appliances are used in the last 24 hours.
Yes No
Code: Enter number of appliances or if do not use enter “–7”
Code: Enter the average number of watts of appliances or if do not use enter “–7”
Code: Enter the number of hours of use with fraction or if do not use enter “–7”
Hours Minutes
1 Radio 1 2
2 Sound equipment 1 2
3TV black and white 1 2
4 TV color 1 2
5 Video recorder 1 2
6 DVD 1 2
7 Others _______ (Specify)
1 2
SECTION 6: USE OF LPGSECTION 6: USE OF LPG
344. In the past month did your household use LPG at home?
Yes 1
No 2 Go to 348
345A. What size of gas cylinder/tank does your household use at home?
345B. How many cylinders does your household use in a month?
345C. What is the price per cylinder or tank of LPG?
345D. On an average how much does your household spend per month on LPG?
345E. How many days does one cylinder of LPG last?
Yes No
Code: Enter number of cylinders used in a month
Code: Enter price in S/. per cylinder
Code: Enter monthly expenditure in S/.
Code: Enter number of days one cylinder
1. 10 Kg Cylinder 1 2
2. 45 Kg Cylinder 1 2
3. Other specify size in Kg of cylinder_________ 1 2 _________
7134-CHAnnex4.pdf 137 7/27/10 6:58 AM

Special Report Peru: National Survey of Rural Household Energy Use
138
346A. Does your household use LPG following purposes? 346B. In general, what percentage of LPG does your household use each month for the following purposes?
Code: “0” if none and percentage if applicableDoes not know –8Not applicable –7
Yes No Percent Does not know
1. Lamp lighting 1 2 –8
2. Cooking 1 2 –8
3. Appliances 1 2 –8
4. Home business 1 2 –8
5. Other _____________ (Specify) 1 2 –8
Total 100%
347A. Does the household use the following gas appliance?
347B. How many of each appliance does your household have?
347C. What is the sum of all hours for all . . . used during the last 24 hour period?
Note: Ask the respondent about the use of each . . . in the household and sum the total hours that the . . . are used in the last 24 hours.
347D. What is the sum of all days for all . . . used during the last month?
Note: Ask the respondent about the use of each . . . in the household and sum the total days that the . . . are used in the last month.
Type of Appliance Yes No
Code: Enter number of appliances
Code: Enter number of hours, or if do not use any enter “–7”.
Code: Enter number of days, or if do not use any enter “–7”.
Hours Minutes
1. Gas lamp 1 2
2. LPG stove 1 2
3. LPG stove & oven 1 2
4. Refrigerator 1 2
5. Freezer 1 2
6. Other __________ (Specify) 1 2
SECTION 7: USE OF SOLAR PV HOME SYSTEMSECTION 7: USE OF SOLAR PV HOME SYSTEM
348. In the past month did your household use a solar PV home system (SHS) to provide electricity at home?
Yes 1
No 2 Go to 360
349. The solar PV home system that you use is:
Owned? 1
Leased? 2 Go to 351
Rented? 3 Monthly rent S/.
Given to the hh? 4 Go to 352
Not applicable. –7
7134-CHAnnex4.pdf 138 7/27/10 6:58 AM
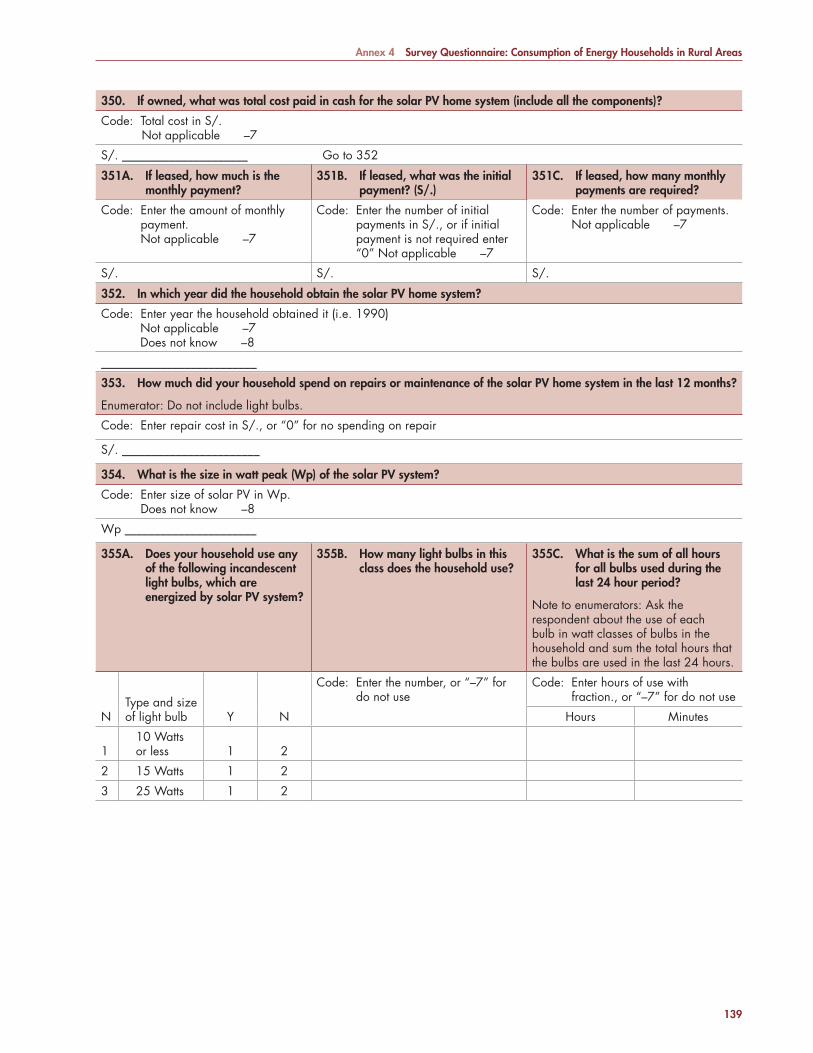
Annex 4 Survey Questionnaire: Consumption of Energy Households in Rural Areas
139
350. If owned, what was total cost paid in cash for the solar PV home system (include all the components)?
Code: Total cost in S/. Not applicable –7
S/. _____________________ Go to 352
351A. If leased, how much is the monthly payment?
351B. If leased, what was the initial payment? (S/.)
351C. If leased, how many monthly payments are required?
Code: Enter the amount of monthly payment. Not applicable –7
Code: Enter the number of initial payments in S/., or if initial payment is not required enter “0” Not applicable –7
Code: Enter the number of payments.Not applicable –7
S/. S/. S/.
352. In which year did the household obtain the solar PV home system?
Code: Enter year the household obtained it (i.e. 1990) Not applicable –7 Does not know –8
__________________________
353. How much did your household spend on repairs or maintenance of the solar PV home system in the last 12 months?
Enumerator: Do not include light bulbs.
Code: Enter repair cost in S/., or “0” for no spending on repair
S/. _______________________
354. What is the size in watt peak (Wp) of the solar PV system?
Code: Enter size of solar PV in Wp.Does not know –8
Wp ______________________
355A. Does your household use any of the following incandescent light bulbs, which are energized by solar PV system?
355B. How many light bulbs in this class does the household use?
355C. What is the sum of all hours for all bulbs used during the last 24 hour period?
Note to enumerators: Ask the respondent about the use of each bulb in watt classes of bulbs in the household and sum the total hours that the bulbs are used in the last 24 hours.
NType and size of light bulb Y N
Code: Enter the number, or “–7” for do not use
Code: Enter hours of use with fraction., or “–7” for do not use
Hours Minutes
110 Watts or less 1 2
2 15 Watts 1 2
3 25 Watts 1 2
7134-CHAnnex4.pdf 139 7/27/10 6:58 AM

Special Report Peru: National Survey of Rural Household Energy Use
140
356A. Does your household use any of the following fl uorescent tubes, which are energized by solar PV system?
356B. How many tubes in this class does the household use?
356C. What is the sum of all hours for all tubes used during the last 24 hour period?
Note to enumerators: Ask the respondent about the use of each bulb in watt classes of bulbs in the household and sum the total hours that the bulbs are used in the last 24 hours.
Type and size of fl uorescent tube Y N
Code: Enter the number, or “–7” for do not use
Code: Enter hours of use with fraction., or “–7” for do not use
Hours Minutes
110 W (Straight) 1 2
220 W (Straight) 1 2
322 W (Circular) 1 2
357A. Does your household use any of the following energy saving light bulbs, which are energized by solar PV system?
357B. How many light bulbs in this class does the household use?
357C. What is the sum of all hours for all bulbs used during the last 24 hour period?
Note to enumerators: Ask the respondent about the use of each bulb in watt classes of bulbs in the household and sum the total hours that the bulbs are used in the last 24 hours.
Type and size of light bulb Y N
Code: Enter the number, or “–7” for do not use
Code: Enter hours of use with fraction., or “–7” for do not use
Hours Minutes
1 7 Watts or less 1 2
2 9 Watts 1 2
3 12 Watts 1 2
4 18 Watts 1 2
5 20 Watts 1 2
358A. Does your household use PV system for the following purposes?
358B. In general, what percentage of solar energy does your household use each month for the following purposes?
Code: “0” if none and percentage if applicableDoes not know –8Not applicable –7
Yes No Percent Does not know
1. Lamp lighting 1 2 –8
2. Cooking 1 2 –8
3. Appliances 1 2 –8
4. Home business 1 2 –8
5. Other _____________ (Specify)
1 2 –8
Total 100%
7134-CHAnnex4.pdf 140 7/27/10 6:58 AM
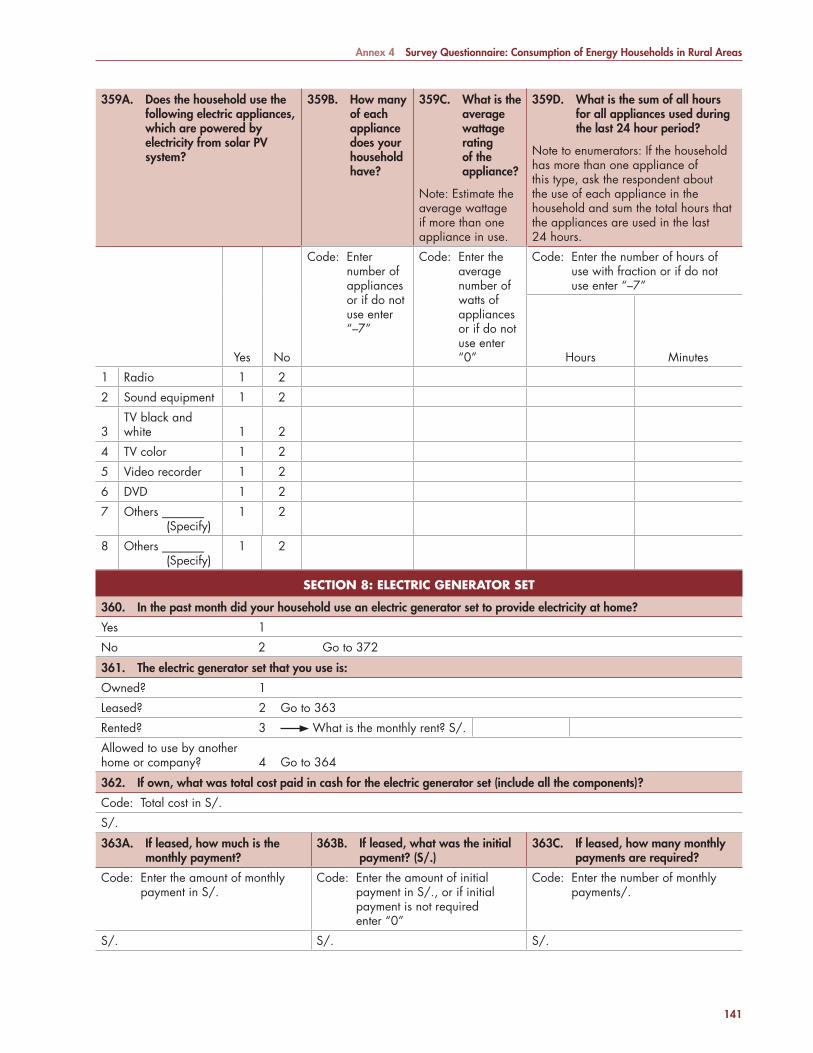
Annex 4 Survey Questionnaire: Consumption of Energy Households in Rural Areas
141
359A. Does the household use the following electric appliances, which are powered by electricity from solar PV system?
359B. How many of each appliance does your household have?
359C. What is the average wattage rating of the appliance?
Note: Estimate the average wattage if more than one appliance in use.
359D. What is the sum of all hours for all appliances used during the last 24 hour period?
Note to enumerators: If the household has more than one appliance of this type, ask the respondent about the use of each appliance in the household and sum the total hours that the appliances are used in the last 24 hours.
Yes No
Code: Enter number of appliances or if do not use enter “–7”
Code: Enter the average number of watts of appliances or if do not use enter “0”
Code: Enter the number of hours of use with fraction or if do not use enter “–7”
Hours Minutes
1 Radio 1 2
2 Sound equipment 1 2
3TV black and white 1 2
4 TV color 1 2
5 Video recorder 1 2
6 DVD 1 2
7 Others _______ (Specify)
1 2
8 Others _______ (Specify)
1 2
SECTION 8: ELECTRIC GENERATOR SETSECTION 8: ELECTRIC GENERATOR SET
360. In the past month did your household use an electric generator set to provide electricity at home?
Yes 1
No 2 Go to 372
361. The electric generator set that you use is:
Owned? 1
Leased? 2 Go to 363
Rented? 3 What is the monthly rent? S/.
Allowed to use by another home or company? 4 Go to 364
362. If own, what was total cost paid in cash for the electric generator set (include all the components)?
Code: Total cost in S/.
S/.
363A. If leased, how much is the monthly payment?
363B. If leased, what was the initial payment? (S/.)
363C. If leased, how many monthly payments are required?
Code: Enter the amount of monthly payment in S/.
Code: Enter the amount of initial payment in S/., or if initial payment is not required enter “0”
Code: Enter the number of monthly payments/.
S/. S/. S/.
7134-CHAnnex4.pdf 141 7/27/10 6:58 AM
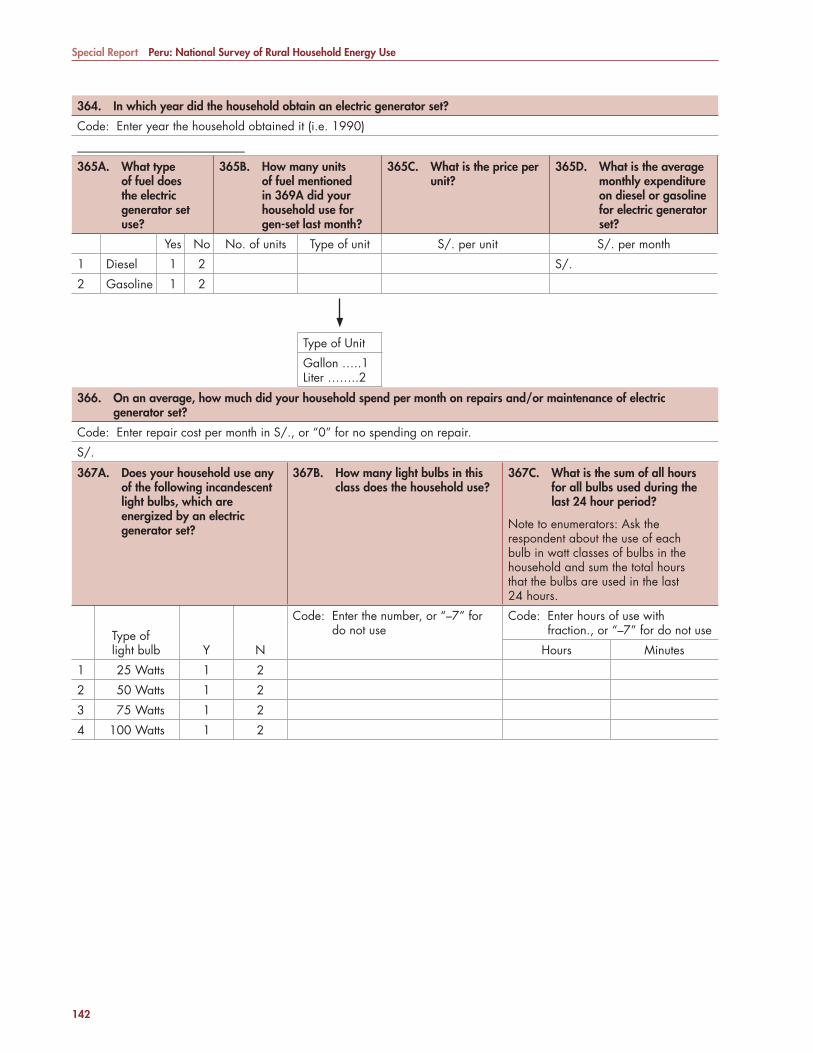
Special Report Peru: National Survey of Rural Household Energy Use
142
364. In which year did the household obtain an electric generator set?
Code: Enter year the household obtained it (i.e. 1990)
____________________________
365A. What type of fuel does the electric generator set use?
365B. How many units of fuel mentioned in 369A did your household use for gen-set last month?
365C. What is the price per unit?
365D. What is the average monthly expenditure on diesel or gasoline for electric generator set?
Yes No No. of units Type of unit S/. per unit S/. per month
1 Diesel 1 2 S/.
2 Gasoline 1 2
Type of Unit
Gallon …..1Liter ……..2
366. On an average, how much did your household spend per month on repairs and/or maintenance of electric generator set?
Code: Enter repair cost per month in S/., or “0” for no spending on repair.
S/.
367A. Does your household use any of the following incandescent light bulbs, which are energized by an electric generator set?
367B. How many light bulbs in this class does the household use?
367C. What is the sum of all hours for all bulbs used during the last 24 hour period?
Note to enumerators: Ask the respondent about the use of each bulb in watt classes of bulbs in the household and sum the total hours that the bulbs are used in the last 24 hours.
Type of light bulb Y N
Code: Enter the number, or “–7” for do not use
Code: Enter hours of use with fraction., or “–7” for do not use
Hours Minutes
1 25 Watts 1 2
2 50 Watts 1 2
3 75 Watts 1 2
4 100 Watts 1 2
7134-CHAnnex4.pdf 142 7/27/10 6:58 AM

Annex 4 Survey Questionnaire: Consumption of Energy Households in Rural Areas
143
368A. Does your household use any of the following fl uorescent tubes, which are energized by an electric generator set?
368B. How many light bulbs in this class does the household use?
368C. What is the sum of all hours for all bulbs used during the last 24 hour period?
Note to enumerators: Ask the respondent about the use of each bulb in watt classes of bulbs in the household and sum the total hours that the bulbs are used in the last 24 hours.
Type and size of fl uorescent Y N
Code: Enter the number, or “–7” for do not use
Code: Enter hours of use with fraction., or “–7” for do not use
Hours Minutes
1 10 W (Straight) 1 2
2 20 W (Straight) 1 2
3 40 W (Straight)
4 22 W (Circular) 1 2
5 32 W (Circular)
369A. Does your household use any of the following energy saving light bulbs, which are energized by an electric generator set?
369B. How many light bulbs in this class does the household use?
369C. What is the sum of all hours for all bulbs used during the last 24 hour period?
Note to enumerators: Ask the respondent about the use of each bulb in watt classes of bulbs in the household and sum the total hours that the bulbs are used in the last 24 hours.
Type and size of light bulb Y N
Code: Enter the number, or “–7” for do not use
Code: Enter hours of use with fraction., or “–7” for do not use
Hours Minutes
1 Less than 12 W 1 2
2 12 Watts 1 2
3 18 Watts 1 2
4 20 Watts 1 2
5 25 Watts 1 2
370A. Does your household use electric generator set for the following purposes?
370B. In general, what percentage of your household monthly spending on electric generator set is for the following purposes?
Code: “0” if none and percentage if applicableDoes not know –8Not applicable –7
Yes No Percent Does not know
1. Lamp lighting 1 2 –8
2. Cooking 1 2 –8
3. Appliances 1 2 –8
4. Home business 1 2 –8
5. Other _____________ (Specify)
1 2 –8
Total 100%
7134-CHAnnex4.pdf 143 7/27/10 6:58 AM
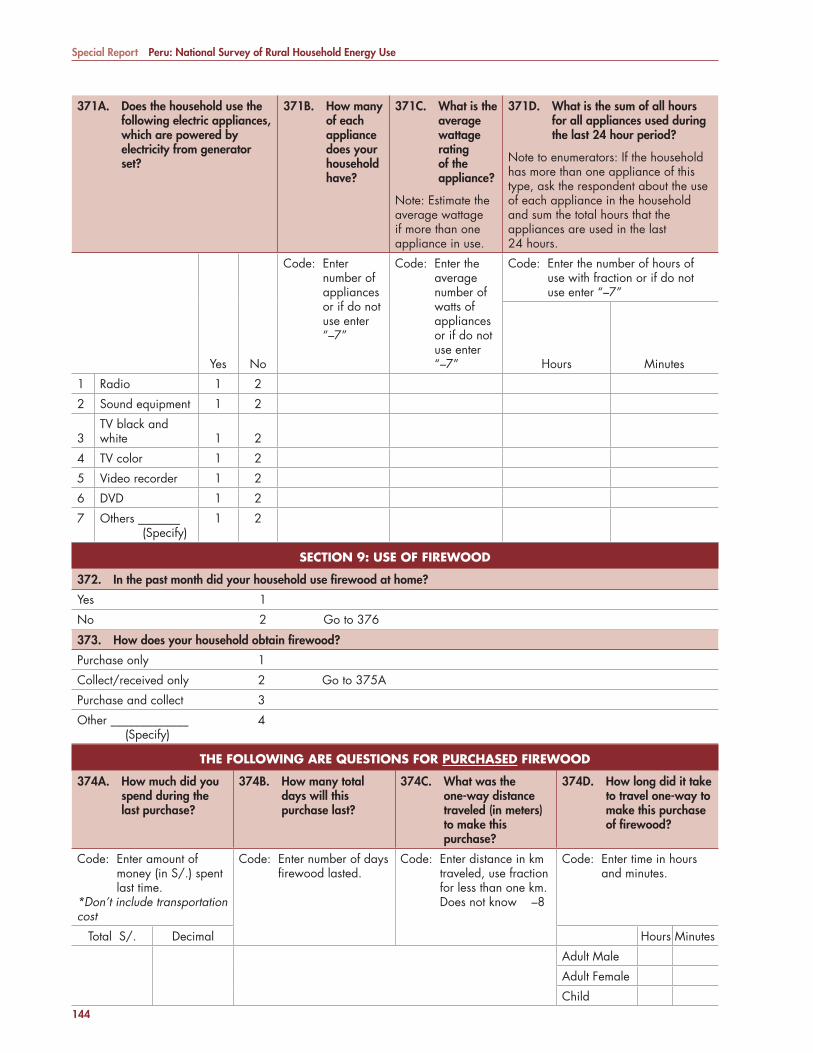
Special Report Peru: National Survey of Rural Household Energy Use
144
371A. Does the household use the following electric appliances, which are powered by electricity from generator set?
371B. How many of each appliance does your household have?
371C. What is the average wattage rating of the appliance?
Note: Estimate the average wattage if more than one appliance in use.
371D. What is the sum of all hours for all appliances used during the last 24 hour period?
Note to enumerators: If the household has more than one appliance of this type, ask the respondent about the use of each appliance in the household and sum the total hours that the appliances are used in the last 24 hours.
Yes No
Code: Enter number of appliances or if do not use enter “–7”
Code: Enter the average number of watts of appliances or if do not use enter “–7”
Code: Enter the number of hours of use with fraction or if do not use enter “–7”
Hours Minutes
1 Radio 1 2
2 Sound equipment 1 2
3TV black and white 1 2
4 TV color 1 2
5 Video recorder 1 2
6 DVD 1 2
7 Others _______ (Specify)
1 2
SECTION 9: USE OF FIREWOODSECTION 9: USE OF FIREWOOD
372. In the past month did your household use fi rewood at home?
Yes 1
No 2 Go to 376
373. How does your household obtain fi rewood?
Purchase only 1
Collect/received only 2 Go to 375A
Purchase and collect 3
Other _____________ (Specify)
4
THE FOLLOWING ARE QUESTIONS FOR THE FOLLOWING ARE QUESTIONS FOR PURCHASEDPURCHASED FIREWOOD FIREWOOD
374A. How much did you spend during the last purchase?
374B. How many total days will this purchase last?
374C. What was the one-way distance traveled (in meters) to make this purchase?
374D. How long did it take to travel one-way to make this purchase of fi rewood?
Code: Enter amount of money (in S/.) spent last time.
*Don’t include transportation cost
Code: Enter number of days fi rewood lasted.
Code: Enter distance in km traveled, use fraction for less than one km.Does not know –8
Code: Enter time in hours and minutes.
Total S/. Decimal Hours Minutes
Adult Male
Adult Female
Child
7134-CHAnnex4.pdf 144 7/27/10 6:58 AM
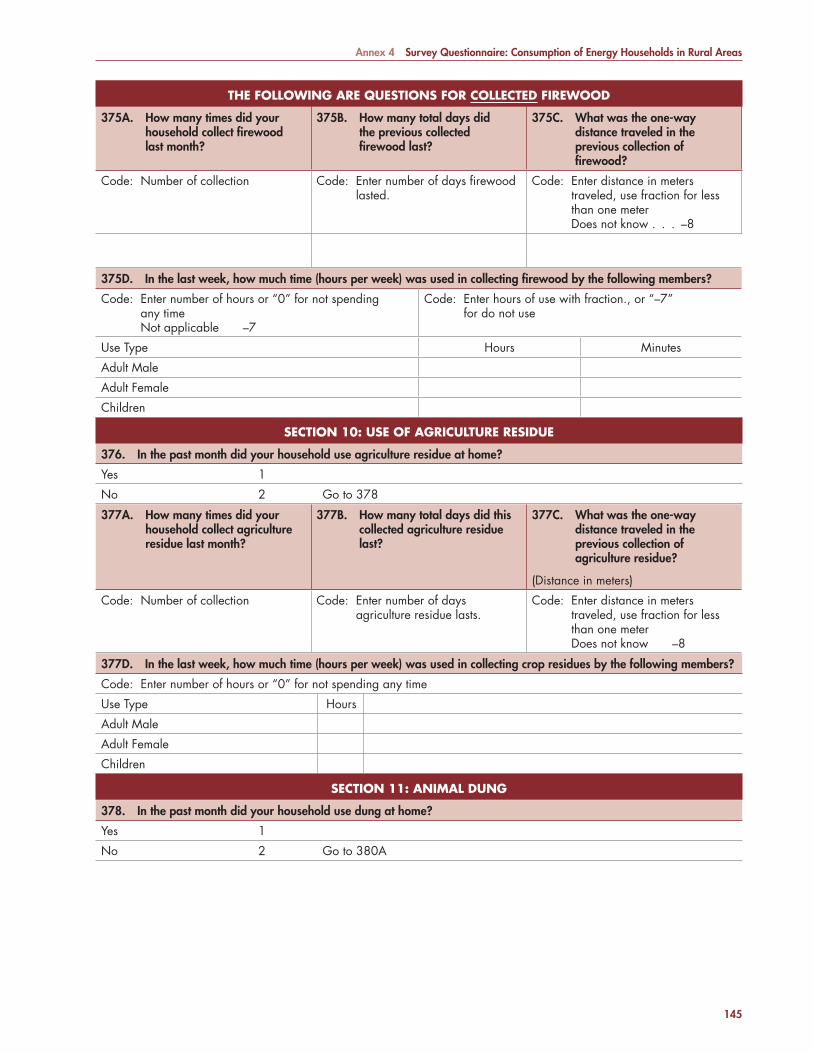
Annex 4 Survey Questionnaire: Consumption of Energy Households in Rural Areas
145
THE FOLLOWING ARE QUESTIONS FOR THE FOLLOWING ARE QUESTIONS FOR COLLECTEDCOLLECTED FIREWOOD FIREWOOD
375A. How many times did your household collect fi rewood last month?
375B. How many total days did the previous collected fi rewood last?
375C. What was the one-way distance traveled in the previous collection of fi rewood?
Code: Number of collection Code: Enter number of days fi rewood lasted.
Code: Enter distance in meters traveled, use fraction for less than one meterDoes not know . . . –8
375D. In the last week, how much time (hours per week) was used in collecting fi rewood by the following members?
Code: Enter number of hours or “0” for not spending any time Not applicable –7
Code: Enter hours of use with fraction., or “–7” for do not use
Use Type Hours Minutes
Adult Male
Adult Female
Children
SECTION 10: USE OF AGRICULTURE RESIDUESECTION 10: USE OF AGRICULTURE RESIDUE
376. In the past month did your household use agriculture residue at home?
Yes 1
No 2 Go to 378
377A. How many times did your household collect agriculture residue last month?
377B. How many total days did this collected agriculture residue last?
377C. What was the one-way distance traveled in the previous collection of agriculture residue?
(Distance in meters)
Code: Number of collection Code: Enter number of days agriculture residue lasts.
Code: Enter distance in meters traveled, use fraction for less than one meterDoes not know –8
377D. In the last week, how much time (hours per week) was used in collecting crop residues by the following members?
Code: Enter number of hours or “0” for not spending any time
Use Type Hours
Adult Male
Adult Female
Children
SECTION 11: ANIMAL DUNGSECTION 11: ANIMAL DUNG
378. In the past month did your household use dung at home?
Yes 1
No 2 Go to 380A
7134-CHAnnex4.pdf 145 8/25/10 10:17 AM

Special Report Peru: National Survey of Rural Household Energy Use
146
379A. How many times did your household collect dung last month?
379B. How many total days did this collected dung last?
379C. What was the one-way distance traveled in the previous collection of dung?
Distance in meters
Number of collection Code: Enter number of days dung lasted.
Code: Enter distance in meters traveled, use fraction for less than one meter.
379D. In the last week, how much time (hours per week) was used in collecting dung by the following members?
Code: Enter number of hours or “0” for not spending any timeNot applicable –7
Use Type Hours
Adult Male
Adult Female
Children
7134-CHAnnex4.pdf 146 7/27/10 6:58 AM
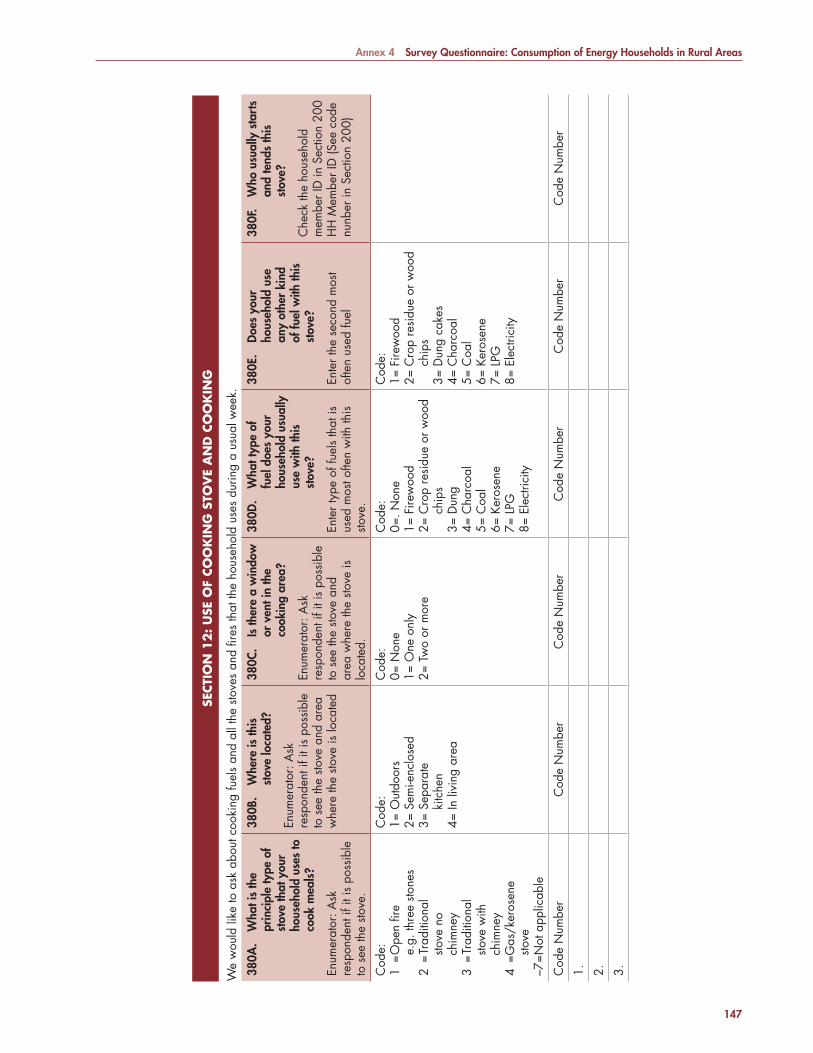
Annex 4 Survey Questionnaire: Consumption of Energy Households in Rural Areas
147
SECTI
ON
12
: U
SE O
F CO
OK
ING
STO
VE
AN
D C
OO
KIN
GSE
CTI
ON
12
: U
SE O
F CO
OK
ING
STO
VE
AN
D C
OO
KIN
G
We
wou
ld li
ke to
ask
abo
ut c
ooki
ng fu
els
and
all t
he s
tove
s an
d fi r
es th
at th
e ho
useh
old
uses
dur
ing
a us
ual w
eek.
380A
. W
hat i
s th
e pr
inci
ple
type
of
stov
e th
at y
our
hous
ehol
d us
es to
co
ok m
eals
?
Enum
erat
or: A
sk
resp
onde
nt if
it is
pos
sibl
e to
see
the
stove
.
380B
. W
here
is th
is
stov
e lo
cate
d?
Enum
erat
or: A
sk
resp
onde
nt if
it is
pos
sibl
e to
see
the
stove
and
are
a w
here
the
stove
is lo
cate
d
380C
. Is
ther
e a
win
dow
or
ven
t in
the
cook
ing
area
?
Enum
erat
or: A
sk
resp
onde
nt if
it is
pos
sibl
e to
see
the
stove
and
ar
ea w
here
the
stove
is
loca
ted.
380D
. W
hat t
ype
of
fuel
doe
s yo
ur
hous
ehol
d us
ually
us
e w
ith th
is
stov
e?
Ente
r typ
e of
fuel
s th
at is
us
ed m
ost o
ften
with
this
sto
ve.
380E
. D
oes
your
ho
useh
old
use
any
othe
r ki
nd
of fu
el w
ith th
is
stov
e?
Ente
r the
sec
ond
mos
t of
ten
used
fuel
380F
. W
ho u
sual
ly s
tart
s an
d te
nds
this
st
ove?
Che
ck th
e ho
useh
old
mem
ber I
D in
Sec
tion
200
HH
Mem
ber I
D (S
ee c
ode
nunb
er in
Sec
tion
200)
Cod
e:1
= O
pen
fi re
e.g.
thre
e sto
nes
2 =
Trad
ition
al
stove
no
chim
ney
3 =
Trad
ition
al
stove
with
ch
imne
y4
=G
as/k
eros
ene
stove
–7=N
ot a
pplic
able
Cod
e:1=
Out
door
s2=
Sem
i-enc
lose
d3=
Sep
arat
e
kitc
hen
4= In
livi
ng a
rea
Cod
e:0=
Non
e1=
One
onl
y2=
Tw
o or
mor
e
Cod
e:0=
. Non
e1=
Fire
woo
d2=
Cro
p re
sidu
e or
woo
d ch
ips
3= D
ung
4= C
harc
oal
5= C
oal
6= K
eros
ene
7= L
PG8=
Ele
ctric
ity
Cod
e:1=
Fire
woo
d2=
Cro
p re
sidu
e or
woo
d ch
ips
3= D
ung
cake
s4=
Cha
rcoa
l5=
Coa
l6=
Ker
osen
e7=
LPG
8= E
lect
ricity
Cod
e N
umbe
rC
ode
Num
ber
Cod
e N
umbe
rC
ode
Num
ber
Cod
e N
umbe
rC
ode
Num
ber
1. 2. 3.
7134-CHAnnex4.pdf 147 7/27/10 6:58 AM
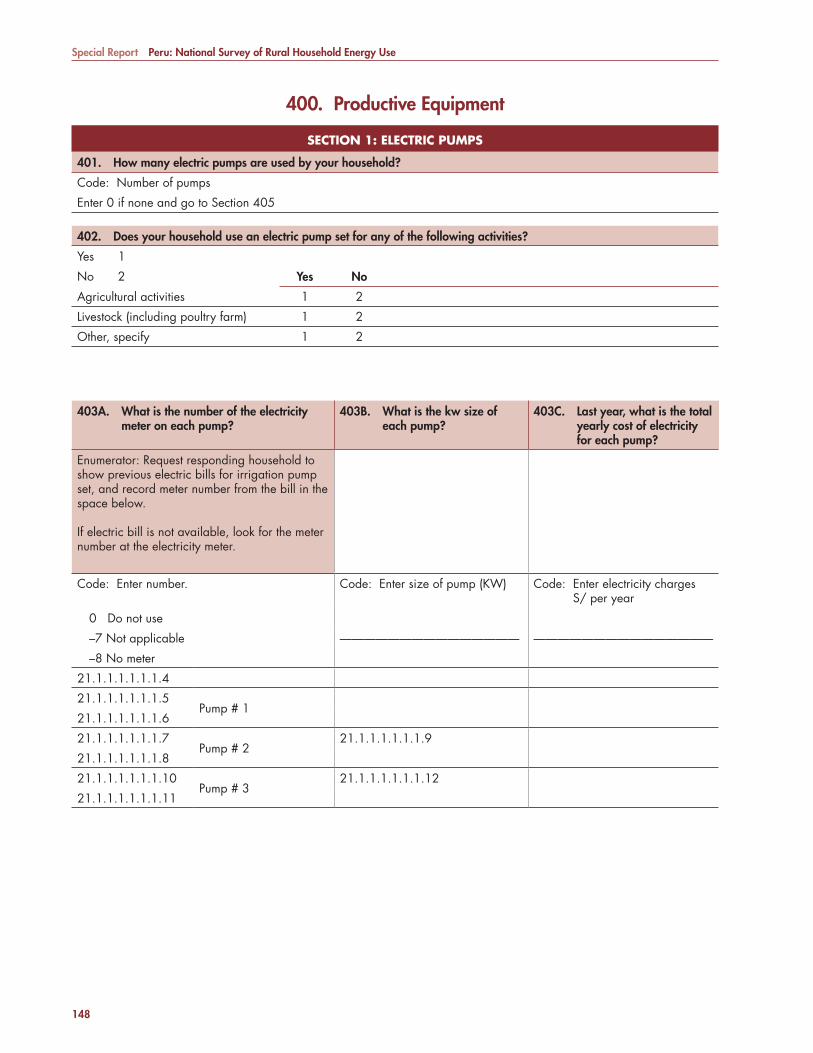
Special Report Peru: National Survey of Rural Household Energy Use
148
SECTION 1: ELECTRIC PUMPSSECTION 1: ELECTRIC PUMPS
401. How many electric pumps are used by your household?
Code: Number of pumps
Enter 0 if none and go to Section 405
402. Does your household use an electric pump set for any of the following activities?
Yes 1
No 2 Yes No
Agricultural activities 1 2
Livestock (including poultry farm) 1 2
Other, specify 1 2
400. Productive Equipment
403A. What is the number of the electricity meter on each pump?
403B. What is the kw size of each pump?
403C. Last year, what is the total yearly cost of electricity for each pump?
Enumerator: Request responding household to show previous electric bills for irrigation pump set, and record meter number from the bill in the space below.
If electric bill is not available, look for the meter number at the electricity meter.
Code: Enter number. Code: Enter size of pump (KW) Code: Enter electricity charges S/ per year
0 Do not use
–7 Not applicable ——————————————— ———————————————
–8 No meter
21.1.1.1.1.1.1.4
21.1.1.1.1.1.1.5Pump # 1
21.1.1.1.1.1.1.6
21.1.1.1.1.1.1.7Pump # 2
21.1.1.1.1.1.1.9
21.1.1.1.1.1.1.8
21.1.1.1.1.1.1.10Pump # 3
21.1.1.1.1.1.1.12
21.1.1.1.1.1.1.11
7134-CHAnnex4.pdf 148 7/27/10 6:58 AM
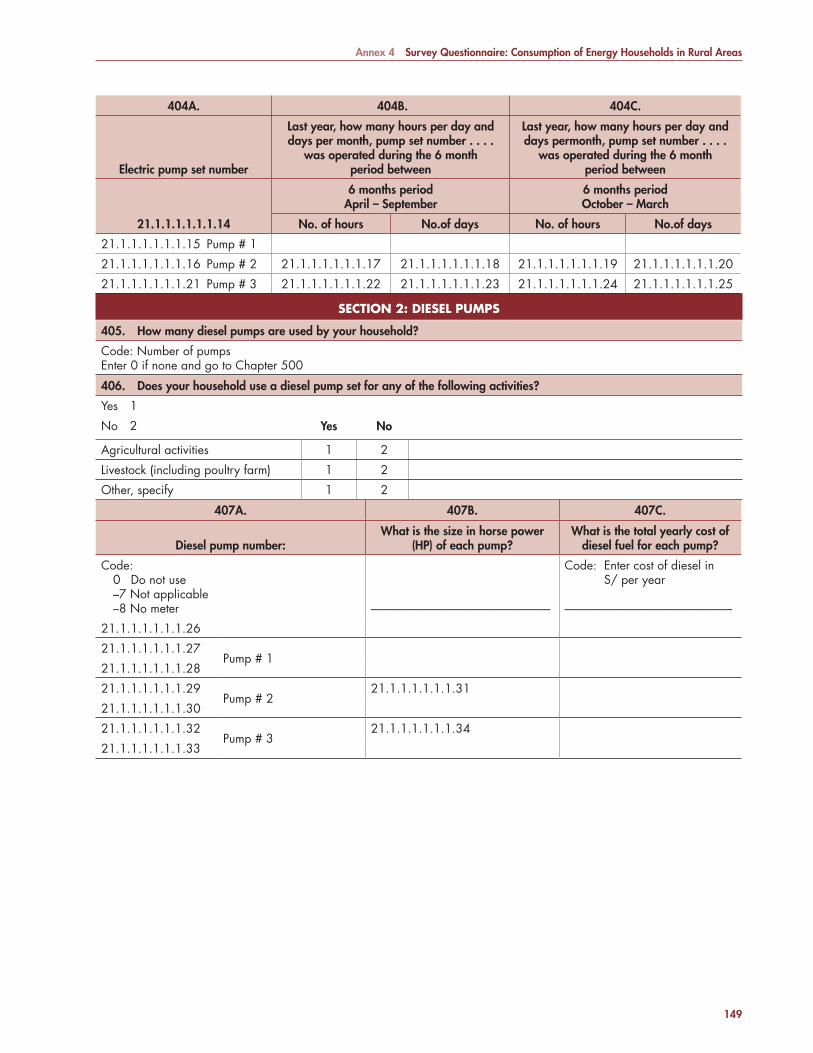
Annex 4 Survey Questionnaire: Consumption of Energy Households in Rural Areas
149
404A. 404B. 404C.
Electric pump set number
Last year, how many hours per day and days per month, pump set number . . . .
was operated during the 6 month period between
Last year, how many hours per day and days permonth, pump set number . . . .
was operated during the 6 month period between
6 months period April – September
6 months period October – March
21.1.1.1.1.1.1.14 No. of hours No.of days No. of hours No.of days
21.1.1.1.1.1.1.15 Pump # 1
21.1.1.1.1.1.1.16 Pump # 2 21.1.1.1.1.1.1.17 21.1.1.1.1.1.1.18 21.1.1.1.1.1.1.19 21.1.1.1.1.1.1.20
21.1.1.1.1.1.1.21 Pump # 3 21.1.1.1.1.1.1.22 21.1.1.1.1.1.1.23 21.1.1.1.1.1.1.24 21.1.1.1.1.1.1.25
SECTION 2: DIESEL PUMPSSECTION 2: DIESEL PUMPS
405. How many diesel pumps are used by your household?
Code: Number of pumpsEnter 0 if none and go to Chapter 500
406. Does your household use a diesel pump set for any of the following activities?
Yes 1
No 2 Yes No
Agricultural activities 1 2
Livestock (including poultry farm) 1 2
Other, specify 1 2
407A. 407B. 407C.
Diesel pump number:What is the size in horse power
(HP) of each pump?What is the total yearly cost of
diesel fuel for each pump?
Code: 0 Do not use –7 Not applicable –8 No meter ———————————————
Code: Enter cost of diesel in S/ per year
——————————————
21.1.1.1.1.1.1.26
21.1.1.1.1.1.1.27Pump # 1
21.1.1.1.1.1.1.28
21.1.1.1.1.1.1.29Pump # 2
21.1.1.1.1.1.1.31
21.1.1.1.1.1.1.30
21.1.1.1.1.1.1.32Pump # 3
21.1.1.1.1.1.1.34
21.1.1.1.1.1.1.33
7134-CHAnnex4.pdf 149 7/27/10 6:58 AM
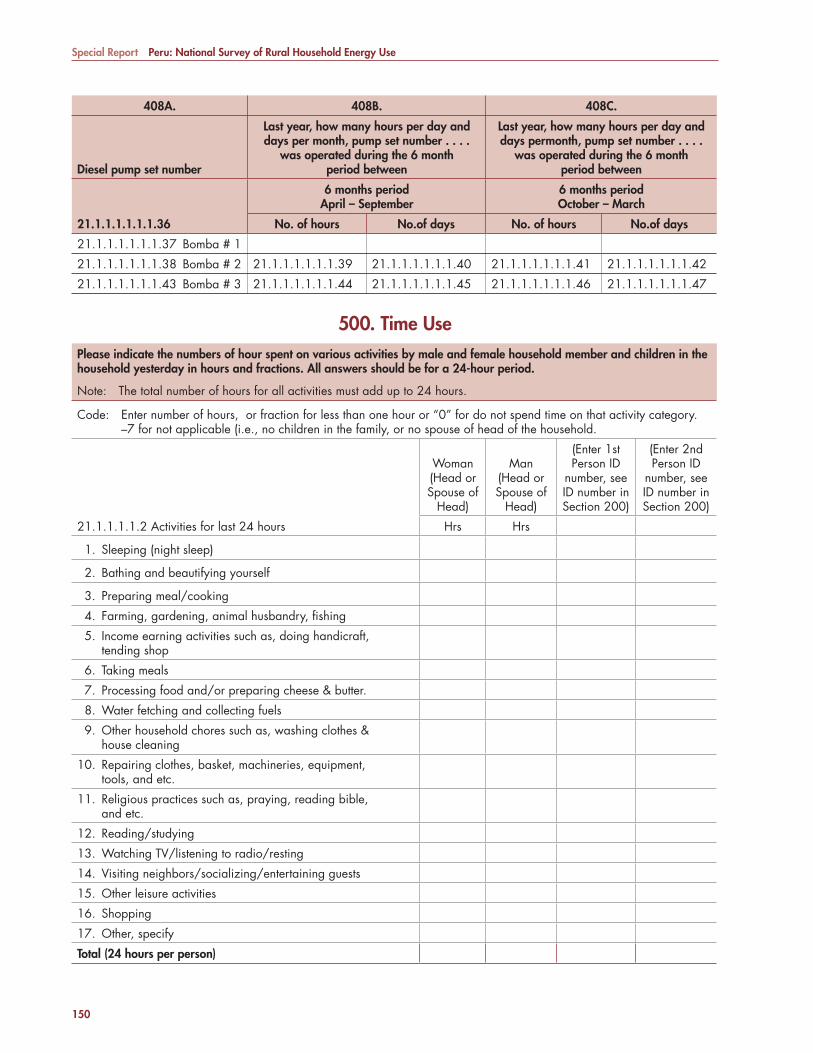
Special Report Peru: National Survey of Rural Household Energy Use
150
408A. 408B. 408C.
Diesel pump set number
Last year, how many hours per day and days per month, pump set number . . . .
was operated during the 6 month period between
Last year, how many hours per day and days permonth, pump set number . . . .
was operated during the 6 month period between
6 months period April – September
6 months period October – March
21.1.1.1.1.1.1.36 No. of hours No.of days No. of hours No.of days
21.1.1.1.1.1.1.37 Bomba # 1
21.1.1.1.1.1.1.38 Bomba # 2 21.1.1.1.1.1.1.39 21.1.1.1.1.1.1.40 21.1.1.1.1.1.1.41 21.1.1.1.1.1.1.42
21.1.1.1.1.1.1.43 Bomba # 3 21.1.1.1.1.1.1.44 21.1.1.1.1.1.1.45 21.1.1.1.1.1.1.46 21.1.1.1.1.1.1.47
500. Time UsePlease indicate the numbers of hour spent on various activities by male and female household member and children in the household yesterday in hours and fractions. All answers should be for a 24-hour period.
Note: The total number of hours for all activities must add up to 24 hours.
Code: Enter number of hours, or fraction for less than one hour or “0” for do not spend time on that activity category.–7 for not applicable (i.e., no children in the family, or no spouse of head of the household.
21.1.1.1.1.2 Activities for last 24 hours
Woman(Head or Spouse of
Head)
Man(Head or Spouse of
Head)
(Enter 1st Person ID
number, see ID number in Section 200)
(Enter 2nd Person ID
number, see ID number in Section 200)
Hrs Hrs
1. Sleeping (night sleep)
2. Bathing and beautifying yourself
3. Preparing meal/cooking
4. Farming, gardening, animal husbandry, fi shing
5. Income earning activities such as, doing handicraft,tending shop
6. Taking meals
7. Processing food and/or preparing cheese & butter.
8. Water fetching and collecting fuels
9. Other household chores such as, washing clothes & house cleaning
10. Repairing clothes, basket, machineries, equipment, tools, and etc.
11. Religious practices such as, praying, reading bible, and etc.
12. Reading/studying
13. Watching TV/listening to radio/resting
14. Visiting neighbors/socializing/entertaining guests
15. Other leisure activities
16. Shopping
17. Other, specify
Total (24 hours per person)
7134-CHAnnex4.pdf 150 7/27/10 6:58 AM
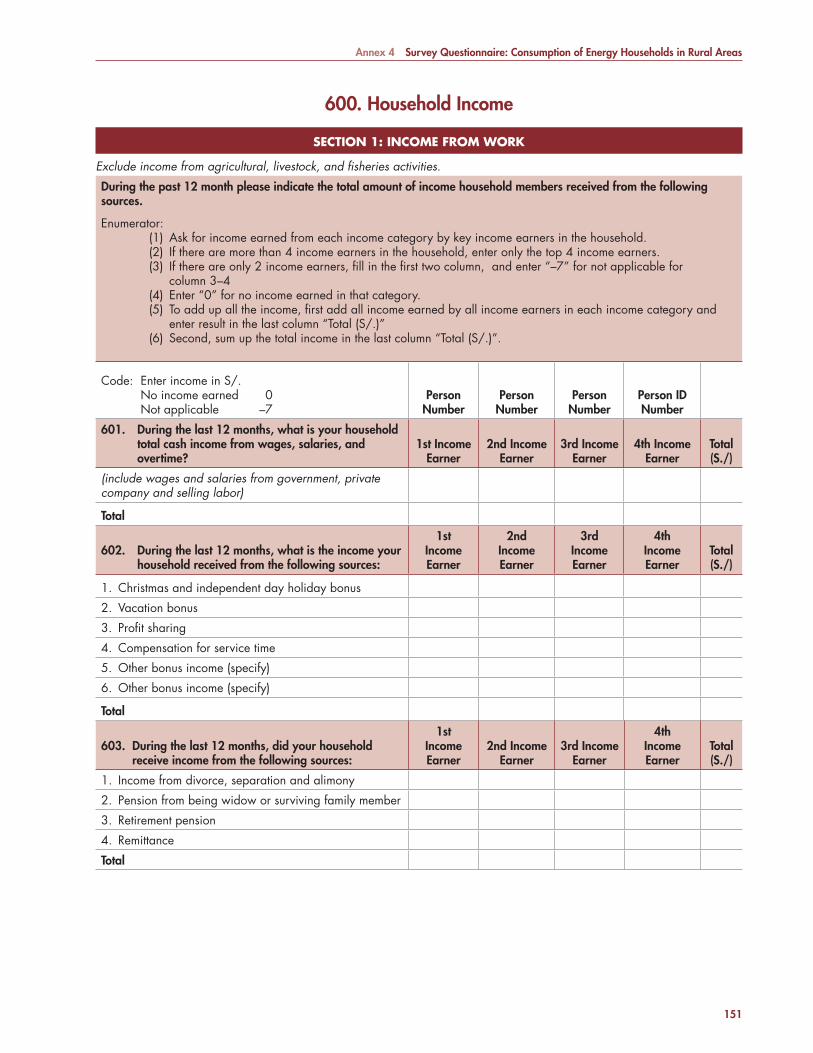
Annex 4 Survey Questionnaire: Consumption of Energy Households in Rural Areas
151
600. Household Income
SECTION 1: INCOME FROM WORKSECTION 1: INCOME FROM WORK
Exclude income from agricultural, livestock, and fi sheries activities.
During the past 12 month please indicate the total amount of income household members received from the following sources.
Enumerator: (1) Ask for income earned from each income category by key income earners in the household. (2) If there are more than 4 income earners in the household, enter only the top 4 income earners. (3) If there are only 2 income earners, fi ll in the fi rst two column, and enter “–7” for not applicable for
column 3–4 (4) Enter “0” for no income earned in that category. (5) To add up all the income, fi rst add all income earned by all income earners in each income category and
enter result in the last column “Total (S/.)” (6) Second, sum up the total income in the last column “Total (S/.)”.
Code: Enter income in S/.No income earned 0Not applicable –7
Person Number
Person Number
Person Number
Person ID Number
601. During the last 12 months, what is your household total cash income from wages, salaries, and overtime?
1st IncomeEarner
2nd IncomeEarner
3rd IncomeEarner
4th IncomeEarner
Total (S./)
(include wages and salaries from government, private company and selling labor)
Total
602. During the last 12 months, what is the income your household received from the following sources:
1st IncomeEarner
2nd IncomeEarner
3rd IncomeEarner
4th IncomeEarner
Total (S./)
1. Christmas and independent day holiday bonus
2. Vacation bonus
3. Profi t sharing
4. Compensation for service time
5. Other bonus income (specify)
6. Other bonus income (specify)
Total
603. During the last 12 months, did your household receive income from the following sources:
1st IncomeEarner
2nd IncomeEarner
3rd IncomeEarner
4th IncomeEarner
Total (S./)
1. Income from divorce, separation and alimony
2. Pension from being widow or surviving family member
3. Retirement pension
4. Remittance
Total
7134-CHAnnex4.pdf 151 7/27/10 6:58 AM
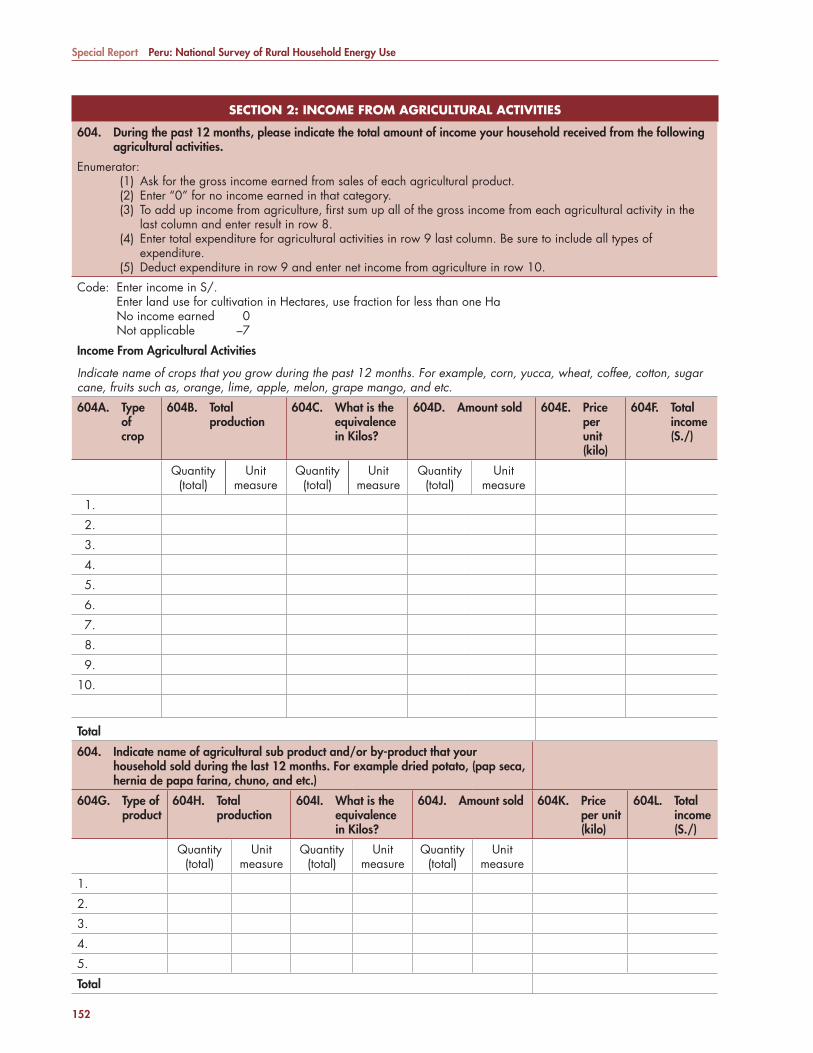
Special Report Peru: National Survey of Rural Household Energy Use
152
SECTION 2: INCOME FROM AGRICULTURAL ACTIVITIESSECTION 2: INCOME FROM AGRICULTURAL ACTIVITIES
604. During the past 12 months, please indicate the total amount of income your household received from the following agricultural activities.
Enumerator: (1) Ask for the gross income earned from sales of each agricultural product. (2) Enter “0” for no income earned in that category. (3) To add up income from agriculture, fi rst sum up all of the gross income from each agricultural activity in the
last column and enter result in row 8. (4) Enter total expenditure for agricultural activities in row 9 last column. Be sure to include all types of
expenditure. (5) Deduct expenditure in row 9 and enter net income from agriculture in row 10.
Code: Enter income in S/.Enter land use for cultivation in Hectares, use fraction for less than one HaNo income earned 0Not applicable –7
Income From Agricultural Activities
Indicate name of crops that you grow during the past 12 months. For example, corn, yucca, wheat, coffee, cotton, sugar cane, fruits such as, orange, lime, apple, melon, grape mango, and etc.
604A. Type of crop
604B. Total production
604C. What is the equivalence in Kilos?
604D. Amount sold 604E. Price per unit (kilo)
604F. Total income (S./)
Quantity (total)
Unit measure
Quantity (total)
Unit measure
Quantity (total)
Unit measure
1.
2.
3.
4.
5.
6.
7.
8.
9.
10.
Total
604. Indicate name of agricultural sub product and/or by-product that your household sold during the last 12 months. For example dried potato, (pap seca, hernia de papa farina, chuno, and etc.)
604G. Type of product
604H. Total production
604I. What is the equivalence in Kilos?
604J. Amount sold 604K. Priceper unit (kilo)
604L. Total income (S./)
Quantity (total)
Unit measure
Quantity (total)
Unit measure
Quantity (total)
Unit measure
1.
2.
3.
4.
5.
Total
7134-CHAnnex4.pdf 152 7/27/10 6:58 AM
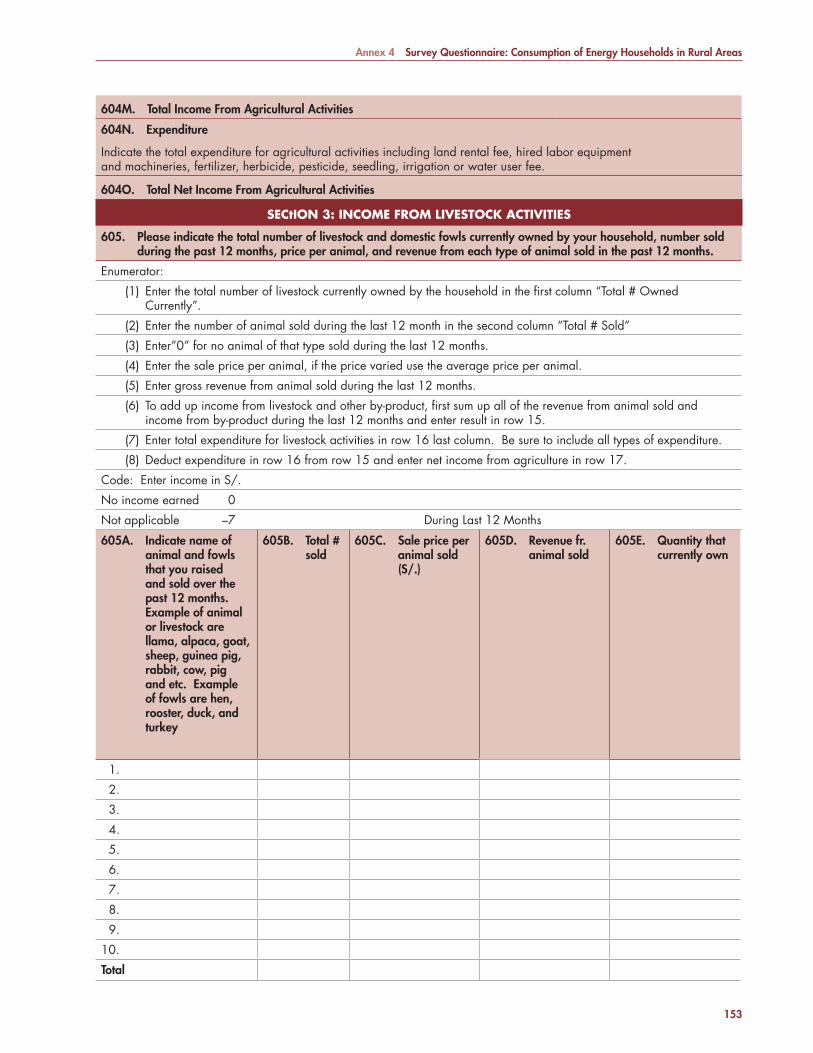
Annex 4 Survey Questionnaire: Consumption of Energy Households in Rural Areas
153
604M. Total Income From Agricultural Activities
604N. Expenditure
Indicate the total expenditure for agricultural activities including land rental fee, hired labor equipment and machineries, fertilizer, herbicide, pesticide, seedling, irrigation or water user fee.
604O. Total Net Income From Agricultural Activities
SECtION 3: INCOME FROM LIVESTOCK ACTIVITIESSECtION 3: INCOME FROM LIVESTOCK ACTIVITIES
605. Please indicate the total number of livestock and domestic fowls currently owned by your household, number sold during the past 12 months, price per animal, and revenue from each type of animal sold in the past 12 months.
Enumerator:
(1) Enter the total number of livestock currently owned by the household in the fi rst column “Total # Owned Currently”.
(2) Enter the number of animal sold during the last 12 month in the second column “Total # Sold”
(3) Enter”0” for no animal of that type sold during the last 12 months.
(4) Enter the sale price per animal, if the price varied use the average price per animal.
(5) Enter gross revenue from animal sold during the last 12 months.
(6) To add up income from livestock and other by-product, fi rst sum up all of the revenue from animal sold and income from by-product during the last 12 months and enter result in row 15.
(7) Enter total expenditure for livestock activities in row 16 last column. Be sure to include all types of expenditure.
(8) Deduct expenditure in row 16 from row 15 and enter net income from agriculture in row 17.
Code: Enter income in S/.
No income earned 0
Not applicable –7 During Last 12 Months
605A. Indicate name of animal and fowls that you raised and sold over the past 12 months. Example of animal or livestock are llama, alpaca, goat, sheep, guinea pig, rabbit, cow, pig and etc. Example of fowls are hen, rooster, duck, and turkey
605B. Total # sold
605C. Sale price per animal sold (S/.)
605D. Revenue fr. animal sold
605E. Quantity that currently own
1.
2.
3.
4.
5.
6.
7.
8.
9.
10.
Total
7134-CHAnnex4.pdf 153 7/27/10 6:58 AM

Special Report Peru: National Survey of Rural Household Energy Use
154
605. Income from by-product of livestock activities and product from animal.Indicate name of livestock by-product that were sold over the past 12 months. Example of by-products are wool, milk, cheese, butter, and etc.
605F. Types of products 605G. Total # produced 605H. Average sale price of each product (S/.)
605I. Total Revenue from sale of each product S/
Total quantity Unit measure Total amount S/ Total amount in S/
1.
2.
3.
4.
5.
Total
605J. Total income from livestock activities
Expenditure
605K. Please indicate the total expenditure for livestock activities including land rental fee, hired labor, fodders or feedstock, vaccination, medicines, water, and etc.
605L. Total net income from livestock activities and their by-product
21.1.1.1.1.2.1.1 SECTION 4: INCOME FROM FISHERIES21.1.1.1.1.2.1.1 SECTION 4: INCOME FROM FISHERIES
606A. During the past 12 months, please indicate the total amount of income your household earned from fi sheries.
Monto en S/.
Income from fi sheries
606B. Please indicate the total expenditure for fi sheries including boat repair and maintenance, fuels, fi shing net, and related equipment.
606C. Total net income from fi shery activities
SECTION 5: OTHER INCOMESECTION 5: OTHER INCOME
607. During the past 12 months . . . to . . . did your household receive income from the following sources:
TOTAL S/.
1. House, apartment or room rental
2. Income from renting agricultural land, or animal
3. Income from renting machinery and vechicle
4. Income from dividend stock and bond
5. Interest from savings or lending
6. Reward and prizes
7. Other income (Specify)
Total
SECTION 6: HOUESHOLD EXPENDITURESSECTION 6: HOUESHOLD EXPENDITURES
608A. Last month (May) . . . what was the total household spending for? TOTAL S/.
1. Food for household members
2. Household expenditure for water, telephone, and transportation
3. Home maintenance and repair
4. Household expenditure for personal hygine–soap, detergent, shampoo–and clothing
5. Recreation activities, entertainment, cultural services
Total
7134-CHAnnex4.pdf 154 7/27/10 6:58 AM
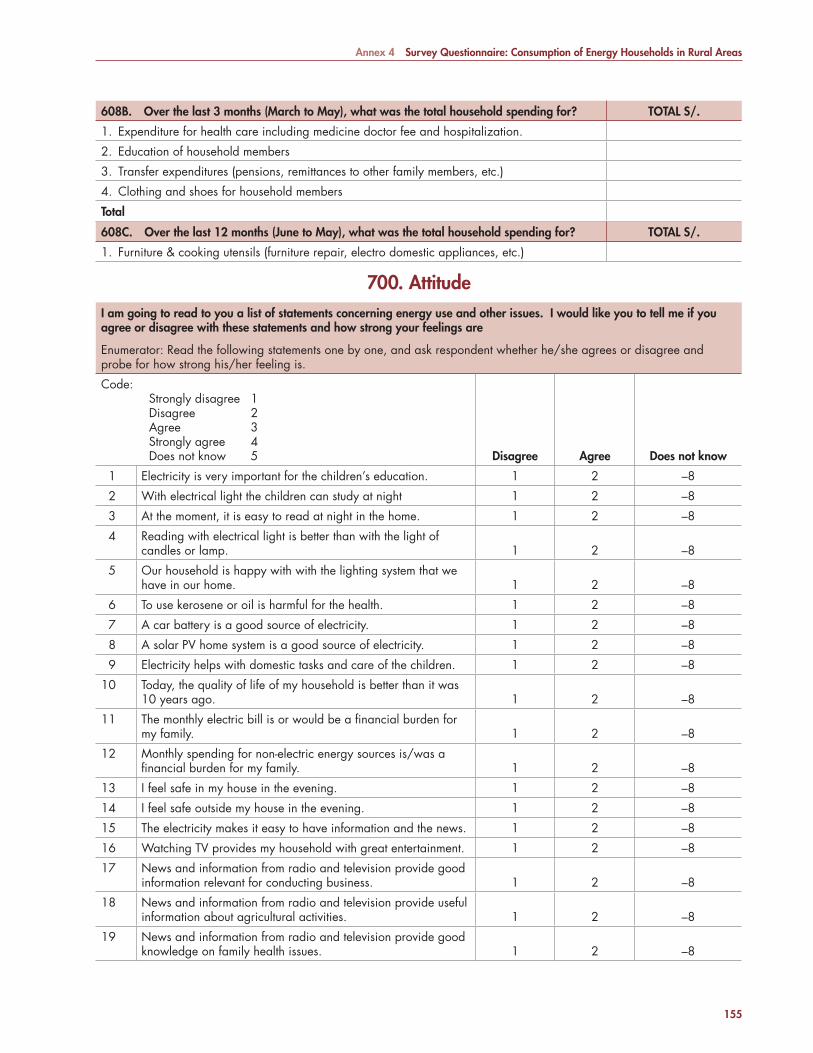
Annex 4 Survey Questionnaire: Consumption of Energy Households in Rural Areas
155
608B. Over the last 3 months (March to May), what was the total household spending for? TOTAL S/.
1. Expenditure for health care including medicine doctor fee and hospitalization.
2. Education of household members
3. Transfer expenditures (pensions, remittances to other family members, etc.)
4. Clothing and shoes for household members
Total
608C. Over the last 12 months (June to May), what was the total household spending for? TOTAL S/.
1. Furniture & cooking utensils (furniture repair, electro domestic appliances, etc.)
700. AttitudeI am going to read to you a list of statements concerning energy use and other issues. I would like you to tell me if you agree or disagree with these statements and how strong your feelings are
Enumerator: Read the following statements one by one, and ask respondent whether he/she agrees or disagree and probe for how strong his/her feeling is.
Code: Strongly disagree 1 Disagree 2 Agree 3 Strongly agree 4 Does not know 5 Disagree Agree Does not know
1 Electricity is very important for the children’s education. 1 2 –8
2 With electrical light the children can study at night 1 2 –8
3 At the moment, it is easy to read at night in the home. 1 2 –8
4 Reading with electrical light is better than with the light of candles or lamp. 1 2 –8
5 Our household is happy with with the lighting system that we have in our home. 1 2 –8
6 To use kerosene or oil is harmful for the health. 1 2 –8
7 A car battery is a good source of electricity. 1 2 –8
8 A solar PV home system is a good source of electricity. 1 2 –8
9 Electricity helps with domestic tasks and care of the children. 1 2 –8
10 Today, the quality of life of my household is better than it was 10 years ago. 1 2 –8
11 The monthly electric bill is or would be a fi nancial burden for my family. 1 2 –8
12 Monthly spending for non-electric energy sources is/was a fi nancial burden for my family. 1 2 –8
13 I feel safe in my house in the evening. 1 2 –8
14 I feel safe outside my house in the evening. 1 2 –8
15 The electricity makes it easy to have information and the news. 1 2 –8
16 Watching TV provides my household with great entertainment. 1 2 –8
17 News and information from radio and television provide good information relevant for conducting business. 1 2 –8
18 News and information from radio and television provide useful information about agricultural activities. 1 2 –8
19 News and information from radio and television provide good knowledge on family health issues. 1 2 –8
7134-CHAnnex4.pdf 155 7/27/10 6:58 AM
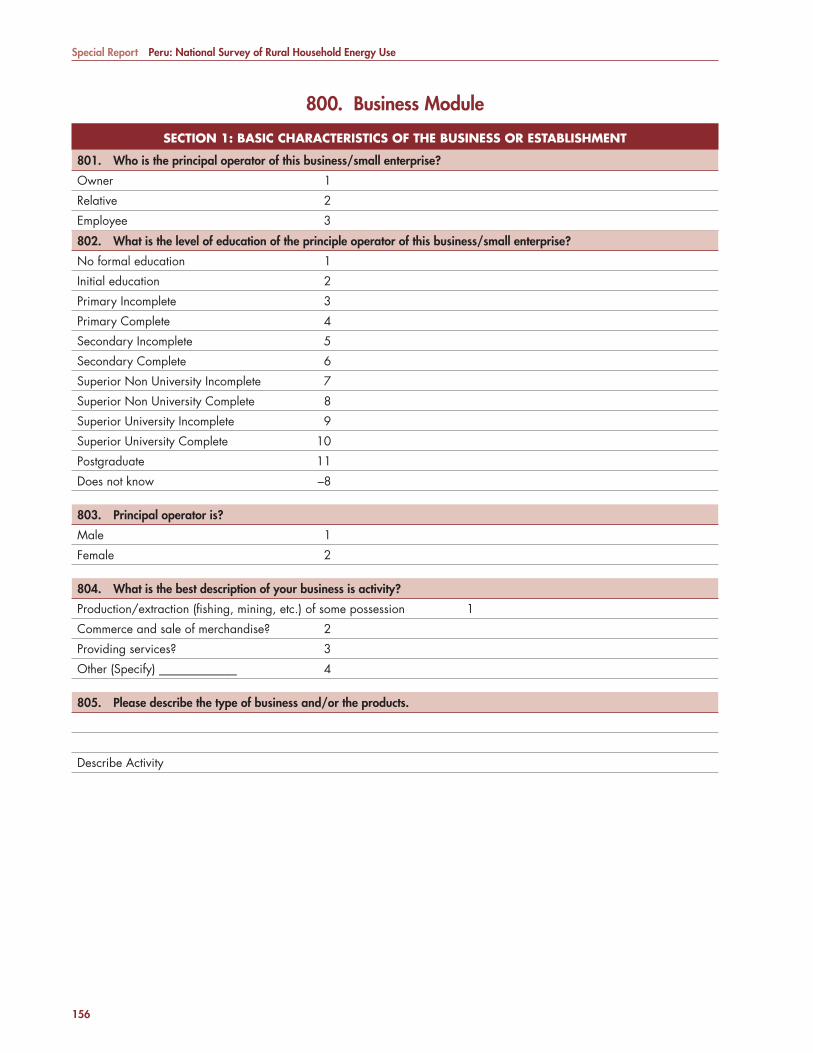
Special Report Peru: National Survey of Rural Household Energy Use
156
800. Business Module
SECTION 1: BASIC CHARACTERISTICS OF THE BUSINESS OR ESTABLISHMENTSECTION 1: BASIC CHARACTERISTICS OF THE BUSINESS OR ESTABLISHMENT
801. Who is the principal operator of this business/small enterprise?
Owner 1
Relative 2
Employee 3
802. What is the level of education of the principle operator of this business/small enterprise?
No formal education 1
Initial education 2
Primary Incomplete 3
Primary Complete 4
Secondary Incomplete 5
Secondary Complete 6
Superior Non University Incomplete 7
Superior Non University Complete 8
Superior University Incomplete 9
Superior University Complete 10
Postgraduate 11
Does not know –8
803. Principal operator is?
Male 1
Female 2
804. What is the best description of your business is activity?
Production/extraction (fi shing, mining, etc.) of some possession 1
Commerce and sale of merchandise? 2
Providing services? 3
Other (Specify) _____________ 4
805. Please describe the type of business and/or the products.
Describe Activity
7134-CHAnnex4.pdf 156 7/27/10 6:58 AM
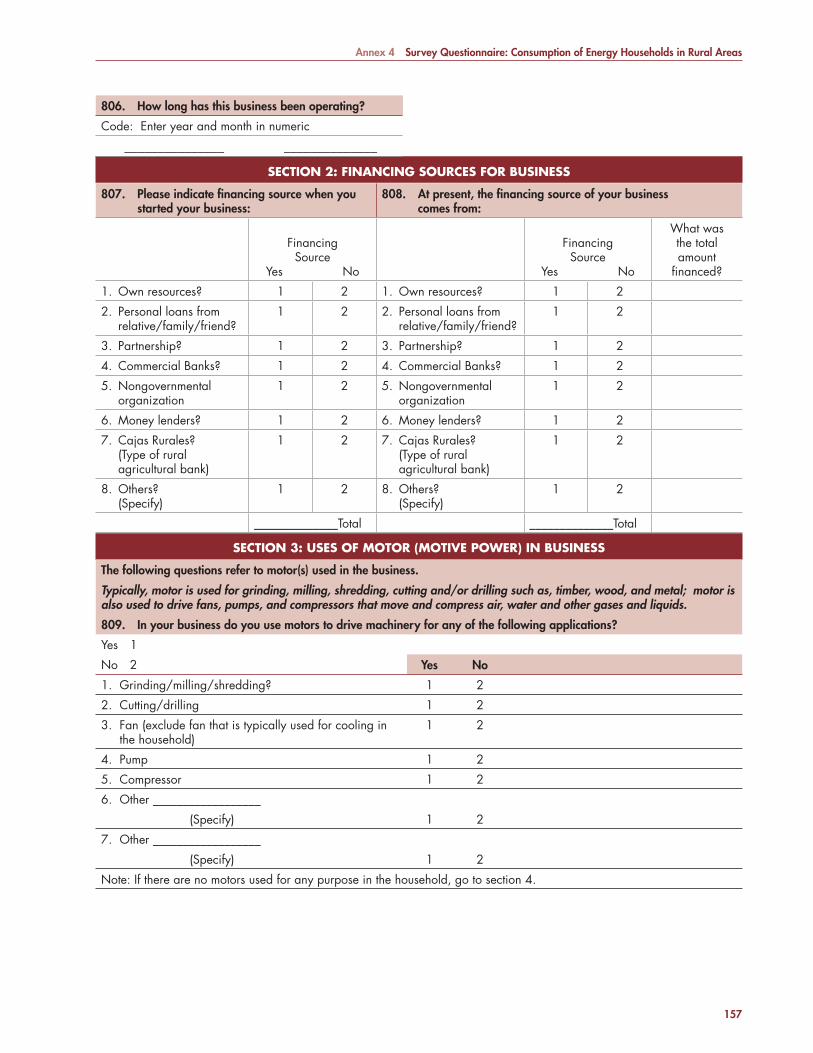
Annex 4 Survey Questionnaire: Consumption of Energy Households in Rural Areas
157
806. How long has this business been operating?
Code: Enter year and month in numeric
_______________ ______________
SECTION 2: FINANCING SOURCES FOR BUSINESSSECTION 2: FINANCING SOURCES FOR BUSINESS
807. Please indicate fi nancing source when you started your business:
808. At present, the fi nancing source of your business comes from:
FinancingSource
Yes No
FinancingSource
Yes No
What was the totalamount
fi nanced?
1. Own resources? 1 2 1. Own resources? 1 2
2. Personal loans fromrelative/family/friend?
1 2 2. Personal loans fromrelative/family/friend?
1 2
3. Partnership? 1 2 3. Partnership? 1 2
4. Commercial Banks? 1 2 4. Commercial Banks? 1 2
5. Nongovernmental organization
1 2 5. Nongovernmental organization
1 2
6. Money lenders? 1 2 6. Money lenders? 1 2
7. Cajas Rurales?(Type of rural agricultural bank)
1 2 7. Cajas Rurales?(Type of rural agricultural bank)
1 2
8. Others?(Specify)
1 2 8. Others?(Specify)
1 2
______________Total ______________Total
SECTION 3: USES OF MOTOR (MOTIVE POWER) IN BUSINESSSECTION 3: USES OF MOTOR (MOTIVE POWER) IN BUSINESS
The following questions refer to motor(s) used in the business.
Typically, motor is used for grinding, milling, shredding, cutting and/or drilling such as, timber, wood, and metal; motor is also used to drive fans, pumps, and compressors that move and compress air, water and other gases and liquids.
809. In your business do you use motors to drive machinery for any of the following applications?
Yes 1
No 2 Yes No
1. Grinding/milling/shredding? 1 2
2. Cutting/drilling 1 2
3. Fan (exclude fan that is typically used for cooling in the household)
1 2
4. Pump 1 2
5. Compressor 1 2
6. Other __________________
(Specify) 1 2
7. Other __________________
(Specify) 1 2
Note: If there are no motors used for any purpose in the household, go to section 4.
7134-CHAnnex4.pdf 157 7/27/10 6:58 AM
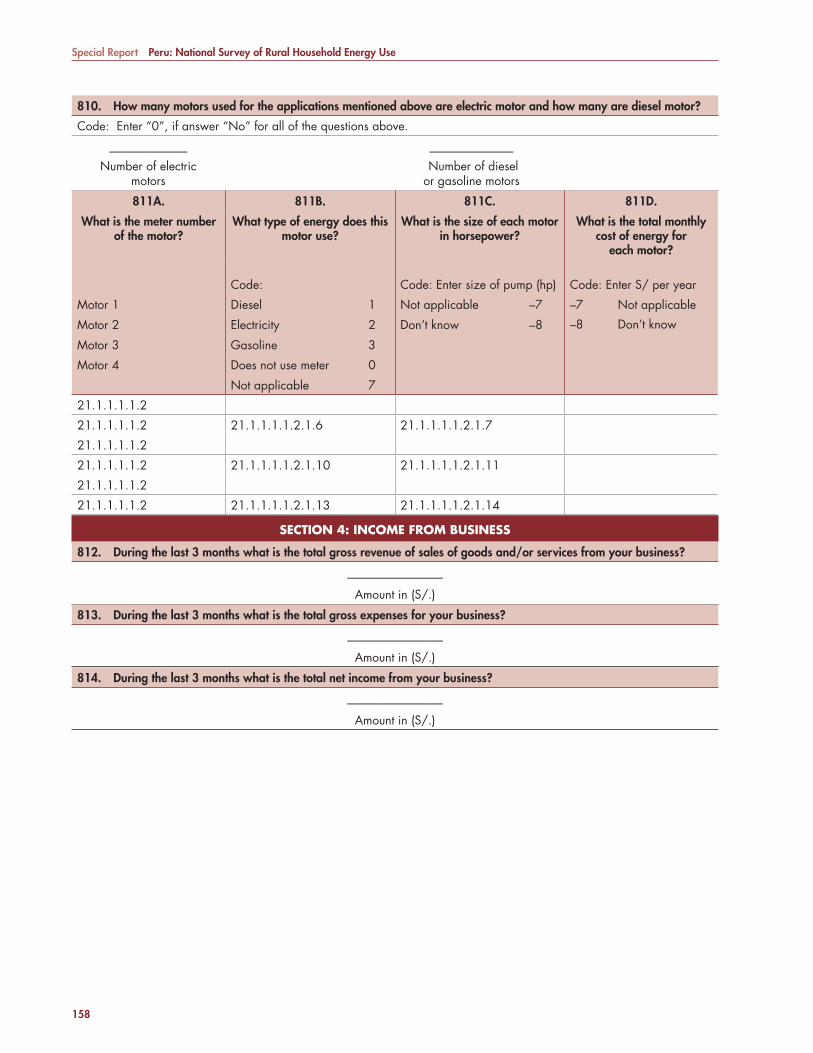
Special Report Peru: National Survey of Rural Household Energy Use
158
810. How many motors used for the applications mentioned above are electric motor and how many are diesel motor?
Code: Enter “0”, if answer “No” for all of the questions above.
_____________ ______________
Number of electric Number of dieselmotors or gasoline motors
811A. 811B. 811C. 811D.
What is the meter number of the motor?
What type of energy does this motor use?
What is the size of each motor in horsepower?
What is the total monthly cost of energy for
each motor?
Code: Code: Enter size of pump (hp) Code: Enter S/ per year
Motor 1 Diesel 1 Not applicable –7 –7 Not applicable
–8 Don’t knowMotor 2 Electricity 2 Don’t know –8
Motor 3 Gasoline 3
Motor 4 Does not use meter 0
Not applicable 7
21.1.1.1.1.2
21.1.1.1.1.2 21.1.1.1.1.2.1.6 21.1.1.1.1.2.1.7
21.1.1.1.1.2
21.1.1.1.1.2 21.1.1.1.1.2.1.10 21.1.1.1.1.2.1.11
21.1.1.1.1.2
21.1.1.1.1.2 21.1.1.1.1.2.1.13 21.1.1.1.1.2.1.14
SECTION 4: INCOME FROM BUSINESSSECTION 4: INCOME FROM BUSINESS
812. During the last 3 months what is the total gross revenue of sales of goods and/or services from your business?
________________
Amount in (S/.)
813. During the last 3 months what is the total gross expenses for your business?
________________
Amount in (S/.)
814. During the last 3 months what is the total net income from your business?
________________
Amount in (S/.)
7134-CHAnnex4.pdf 158 7/27/10 6:58 AM

Annex 4 Survey Questionnaire: Consumption of Energy Households in Rural Areas
159
900. OPINION AND ATTITUDE ON ENERGY AND BUSINESS
914. Opinion And Attitude On Energy And Business914. Opinion And Attitude On Energy And Business
I am going to read to you a list of statements concerning energy use and other issues. I would like you to tell me if you agree or disagree with these statements and how strong your feelings are
Enumerator: Read the following statements one by one, and ask respondent whether he/she agrees or disagree and probe for how strong his/her feeling is.
Code: Disagree 1Agree 2Does not know 3 Disagree Agree Does not know
1 News and information from radio provide good knowledge for conducting business activities.
1 2 –8
2 The use of electricity has allowed or will allow me to keep my business open for longer hours.
1 2 –8
3 The low quality of the electrical service can be harmful for my business.
1 2 –8
4 The quality of the electrical service has gone down during the last 2 or 3 years.
1 2 –8
5 The cost of electricity at the prevailing rate is quite reasonable for my business.
1 2 –8
6 The purchase of diesel for my business is not a problem to me.
1 2 –8
7 With greater availability of credit (loan), I would buy more electric appliances.
1 2 –8
8 With electricity I could/can make more money from my business.
1 2 –8
9 Electricity would help me run my business effi ciently. 1 2 –8
10 Lighting with Solar PV Home System is the next best thing to electric lighting from the grid.
1 2 –8
7134-CHAnnex4.pdf 159 7/27/10 6:58 AM

7134-CHAnnex4.pdf 160 7/27/10 6:58 AM

161
Bibliography
Barnes, D. F., A. Domdom, V. Peskin, and H. Peskin. 2002. Rural Electrifi cation and Development in the Philippines: Measuring the Social and Economic Benefi ts. ESMAP Report 255/02. Washington, D.C.: World Bank.
Bogach, S.V., Papathanasiou, D., Zolezzi, E. H. 2007. “Electricity Sector” in An Opportunity for a Different Peru. Washington D.C.: World Bank.
Carrasco, Alfonso V. 1989. La Electricidad en el Perú: Política estatal y electrifi cación rural. Tecnología Intermedia ITDG, Lima.
Choynowksi , P. 2002. Measuring Willingness to Pay for Electricity, Asian Development Bank, Economics Research Department Technical Note Series #3. ADB.
CNE (Comisión Nacional de Energía). 2005. Programa de Electrifi cación Rural. Santiago, Chile. Available at http://www.cne.cl
ECN (Netherlands Energy Research Foundation). 1998. Rural Lighting Services: A Comparison of Lamps for Domestic Lighting in Developing Countries, ECN-CX—98-032, July.
Gallardo, J. and Bendezu, L. 2005. Evaluación del Fondo Social de Compensación Eléctrica. OSINERG, Ofi cina de Estudios Económicos, Documento de Trabajo #7, Lima.
INEI (Instituto Nacional de Estadísticas e Informática). 1993. Censo Nacional de Población y Vivienda, Lima, Perú.
——— . 2000. Factores que Determinan el Ingreso de los Hogares en el Perú: Formulación de un modelo Estadístico. Lima. Available at http://www1.inei.gob.pe/biblioineipub/bancopub/est/lib0385/indice.htm
——— . 2004. Encuesta Nacional de Hogares: Condiciones de Vida y Pobreza. Rondas I, II, III y IV, Lima.——— . 2005. Encuesta de Consumo de Energía a Hogares en el Ámbito Rural 2005. Base de Datos. Lima,
Perú. Komives,K., Foster, V., Halpern, J., and Wodon, Q. 2005. Water, Electricity and the Poor: Who Benefi ts from
Utility Subsidies.” World Bank, Washington, DC.MEM (Ministerio de Energía y Minas). 2004. Plan Nacional de Electrifi cación Rural. Lima. MEM.——— . 2005. Plan Nacional de Electrifi cación Rural 2005-2014. Lima.——— . 2006. Plan Nacional de Electrifi cación Rural 2006-2014. Lima. NRECA (National Rural Electricity Cooperative Association). 1999. Estrategia Integral de Electrifi cación
Rural, Lima. Meier, P. 2003. Economic Analysis of Solar Home Systems: A Case Study for the Philippines, World Bank.——— . 2007. Estimating Benefi ts of Rural Electrifi cation from Household Energy Surveys: A Guidebook for
Practitioners. World Bank.Waddle, Dan. 2005. Propuesta para un Nuevo Marco General para la Electrifi cación Rural en Perú. NRECA.World Bank. 2004. Project Appraisal Document Second Southern Provinces Rural Electrifi cation Project.
Washington D.C.——— . 2005a. Opportunities for All: Peru Poverty Assessment. Report No. 29825-PE, Prepared by Poverty
Reduction and Economic Management Sector Unit, Latin America and the Caribbean Region. Washington D.C.
——— . 2005b. Peru Rural Electrifi cation Project: Economic and Financial Analysis. Washington D.C. (unpblished).
——— . 2005c. Project Appraisal Document Peru Rural Electrifi cation Project. Washington D.C. Available at www.worldbank.org.
7134-CHBib.pdf 161 8/25/10 10:18 AM

7134-CHBib.pdf 162 8/25/10 10:18 AM
163
Special Report Series
RENEWABLE ENERGY THEMATIC AREA
East Asia and Pacifi c Region (EAP)Sustainable and Effi cient Energy Use to Alleviate Indoor Air Pollution in Poor Rural Areas in China (002/07)
Latin America and the Caribbean Region (LCR)Nicaragua Policy & Strategy for the Promotion of Renewable Energy Resources (003/07)
Global (GLB)Considering Trade Policies for Liquid Biofuels (004/07)
ENERGY POVERTY THEMATIC AREA
Global (GLB)Risk Assessment Methods for Power Utility Planning (001/07)
South Asia Region (SAR)Restoring Balance: Bangladesh’s Rural Energy Realities (006/09)
Latin America and the Caribbean (LCR)Peru: National Survey of Rural Household Energy Use (007/10)
ENERGY SECURITY THEMATIC AREA
Global (GLB)Coping with High Oil Price Volatility (005/08)
7134-CHList.pdf 163 7/27/10 6:59 AM

7134-CHList.pdf 164 7/27/10 6:59 AM

Energy Sector Management Assistance Program (ESMAP)
PurposeThe Energy Sector Management Assistance Program is a global knowledge and technical assistance program administered by the World Bank and assists low-income, emerging and transition economies to acquire know-how and increase institutional capability to secure clean, reliable, and affordable energy services for sustainable economic development.
ESMAP’s work focuses on three global thematic energy challenges:
• Energy Security• Poverty Reduction• Climate Change
Governance and OperationsESMAP is governed and funded by a Consultative Group (CG) composed of representatives of Australia, Austria, Canada, Denmark, Finland, France, Germany, Iceland, Norway, Sweden, The Netherlands, United Kingdom, and The World Bank Group. The ESMAP CG is chaired by a World Bank Vice President and advised by a Technical Advisory Group of independent, international energy experts who provide informed opinions to the CG about the purpose, strategic direction, and priorities of ESMAP. The TAG also provides advice and suggestions to the CG on current and emerging global issues in the energy sector likely to impact ESMAP’s client countries. ESMAP relies on a cadre of engineers, energy planners, and economists from the World Bank, and from the energy and development community at large, to conduct its activities.
Further InformationFor further information or copies of project reports, please visit www.esmap.org. ESMAP can also be reached by email at [email protected] or by mail at:
ESMAPc/o Energy, Transport, and Water Department
The World Bank Group1818 H Street, NW
Washington, DC 20433, USATel.: 202-473-4594; Fax: 202-522-3018
7134-EnglishCover.pdf 2 8/25/10 10:13 AM
Energy Sector Management Assistance Program1818 H Street, NWWashington, DC 20433 USATel: 202-458-2321Fax: 202-522-3018Internet: www.esmap.orgEmail: [email protected]
Just less than one-half of the people in devel-oping countries have no access to electricity and a similar number are reliant on biomass energy for cooking and heating. As a con-sequence, they are deprived of the means of moving out of poverty. Greater access to mod-ern energy services can improve poor people’s income through enhancement of productive use of energy and it can also increase their quality of life by providing quality lighting, communication, and other important services.
ESMAP has the goal of substantially improv-ing energy use by poor people through ad-dressing the widespread problems of the household energy. This is done through high quality analytical work on energy access, promoting an increase in the quality and number of projects dealing with energy and poverty issues by international donors, and by disseminating successful approaches to the international development community.
ENERGYAND POVERTY
7134-EnglishCover.pdf 1 8/25/10 10:13 AM