Peru Food Service - Hotel Restaurant Institutional 2013gain.fas.usda.gov/Recent GAIN...
22
THIS REPORT CONTAINS ASSESSMENTS OF COMMODITY AND TRADE ISSUES MADE BY USDA STAFF AND NOT NECESSARILY STATEMENTS OF OFFICIAL U.S. GOVERNMENT POLICY Date: GAIN Report Number: Approved By: Prepared By: Report Highlights: Peru’s Hotel, Restaurant and Institutional (HRI) food service sector continues to grow thanks to the combination of a strong economy and a growing number of foreign and domestic tourists. According to the National Institute of Statistics, the tourism sector grew 9 percent in 2012, trailing only the construction and finance and insurance sectors in importance. High-end hotels and restaurants offer U.S. food and agricultural, especially consumer-oriented, product exporters good to very good opportunities. Alvaro Loza and Mariano J. Beillard Emiko Purdy 2013 Food Service - Hotel Restaurant Institutional Peru Required Report - public distribution
Transcript of Peru Food Service - Hotel Restaurant Institutional 2013gain.fas.usda.gov/Recent GAIN...

THIS REPORT CONTAINS ASSESSMENTS OF COMMODITY AND TRADE ISSUES MADE BY
USDA STAFF AND NOT NECESSARILY STATEMENTS OF OFFICIAL U.S. GOVERNMENT
POLICY
Date:
GAIN Report Number:
Approved By:
Prepared By:
Report Highlights:
Peru’s Hotel, Restaurant and Institutional (HRI) food service sector continues to grow thanks to the
combination of a strong economy and a growing number of foreign and domestic tourists. According to
the National Institute of Statistics, the tourism sector grew 9 percent in 2012, trailing only the
construction and finance and insurance sectors in importance. High-end hotels and restaurants offer
U.S. food and agricultural, especially consumer-oriented, product exporters good to very good
opportunities.
Alvaro Loza and Mariano
J. Beillard
Emiko Purdy
2013
Food Service - Hotel Restaurant Institutional
Peru
Required Report - public distribution
Post:
Executive Summary:
Section I. Market Summary
Peru’s strong economic growth is boosting the country’s hotel, restaurant, and institutional (HRI)
sector. Gross domestic product (GDP) grew by over 5 percent in 2013, slightly down from the 6.3
percent level registered last year. Strong domestic demand along with rising household incomes, good
export commodity (i.e., metals, gold and copper) prices, and foreign investment inflows continue to fuel
the economy. With more money in most pockets, consumers are consequently demanding new, more
varied food products and food services.
With 7.6 million inhabitants, Lima is Peru’s capital and largest city. Here nearly a third of the country’s
30.4 million (July 2013, est.) reside and over 60 percent of the national income is generated. Lima
counts with 1.8 million middle- and high-income consumers whose monthly household incomes are in
excess of $1,400; making Lima the country’s major market for consumer-oriented food products. The
food service industry is also benefitting from urban expansion, greater numbers of women in the work
force (roughly 38 percent), and a growing, youthful population that often lacks the time to prepare
meals at home.
To help reduce the economy’s exposure to metals’ price fluctuations, the Ministry of Foreign Trade and
Tourism (MINCETUR) is allocating $40 million to promote Peru as a tourist and business travel
destination. Deemed South America’s leading culinary destination, Peru attracted 2.8 million visitors in
2012, generating some $3.3 billion in revenues (up 11 percent compared to 2011). Peruvians are also
travelling more within their country; generating over $7.5 billion in revenues. Peru, with 51
international conventions alone in 2012 ($110 million in revenues) is quickly becoming a major
business travel destination.
The National Institute of Statistics reports that the country’s tourism sector grew over 9 percent in 2012,
trailing only the booming construction and financial and insurance sectors. The sector’s financial
leverage grew 20 percent in 2012; attracting over $1.1 billion in infrastructure expansion. Tourism is
responsible for the creation of 1 million new direct and indirect jobs in recent years.
The consumer food service industry is booming thanks to consumers’ growing disposable income. The
Peruvian Gastronomy Association (APEGA) informs that that the takeoff of Peruvian gastronomy is
contributing to economic development. The country’s vibrant cuisine is also reinvigorating agricultural
production especially at the small farmer level. Sources report that small farmers provide upwards of 61
percent of the food and agricultural products that supply the HRI sector; some 6 million people are
employed in the gastronomy chain.
As Peru’s cuisine wins new converts worldwide, the country is churning out an impressive number of
chefs, culinary technicians, and food service professionals to satisfy the demand for all foods Peruvian.
Eighty-five culinary institutes graduate about 15,000 students yearly into the job market. Improved
Lima

food preparation techniques and greater awareness regarding the proper handling of ingredients is
growing with culinary expertise.
Food service sales in Peru reached $7.5 billion in 2011. FAS Lima sources report that sales generated
by full service restaurants and fast food outlets account for 40 and 35 percent respectively of total sales
value. FAS Lima believes that the best prospects for U.S.-origin food and agricultural product exporters
include high-end hotels and restaurants, casual-dining and family style restaurants, fast food chains, and
coffee shops. Fast food chains for example have seen growth of upwards of 8 percent on average over
the past 5 years.
We believe that best product prospects include U.S.-origin fruits, cheeses, processed fruits and
vegetables, beef and beef products. These products benefit from either duty-free treatment or very low
duties thanks to the U.S.-Peru Trade Promotion Agreement (PTPA).
Advantages and Challenges of U.S. products to Peru’s Food Service Sector
Advantages Challenges
Peru’s economy continues to
experience strong growth, albeit at a
slower pace than in previous years.
Appreciation for U.S. food quality
and culture.
Food service products benefit from
the PTPA with low or no tariffs.
Peru is opening its market for new
competitors in the sector.
Fast food chains are expanding in
Lima suburbs and in major cities
(Arequipa, Trujillo, Chiclayo, and Piura).
Peru is actively promoting tourism.
Culinary culture is growing,
demanding high quality food products.
Increasing investment interest of
international chains in association with
local investors for new project
developments.
Peruvians prefer meals using
fresh products.
Limited number of five star
hotel chains in Peru makes it harder for
U.S. products to penetrate into Peru’s
market.
Peruvian food is tasty. U.S.
exporters need to incorporate food
ingredients in international and
traditional menus.
Limited infrastructure and low
quality service discourage longer stays
of international tourists.
Section II. Road Map for Market Entry
A. A. Entry Strategy
U.S. exporters can gain access to the Peruvian food service market through large
importers, wholesalers/distributors or specialized importers. Most food service companies buy
imported goods from local intermediaries.

Personal visits are highly recommended. The local partner should be well known by the
U.S. exporter before any permanent contractual arrangement is made. Exporters are encouraged
to maintain close contact with local importers.
Exporters should provide support to food service customers by participating in technical
seminars, product demonstrations, and local trade shows whenever possible.
The import partner should be able to provide updated information on consumer trends,
current market developments, trade, and business practices.
In addition, it is recommended that U.S. exporters work with chefs and local importers to conduct
innovative marketing activities in the high-end food service sector. Specifically, U.S. exporters are
encouraged to:
Incorporate U.S. food ingredients in local and international menus.
Emphasize the superior quality of U.S. food products.
A. B. Market Structure
Food service institutions mainly source food ingredients domestically. This is due to Peruvians’
strong preference for locally produced fresh food products at lower prices.
Food service importers are also suppliers for the retail market, which represents, in most
cases, more than 70 percent of their profits.
Almost all food service businesses purchase through intermediaries (95 percent).
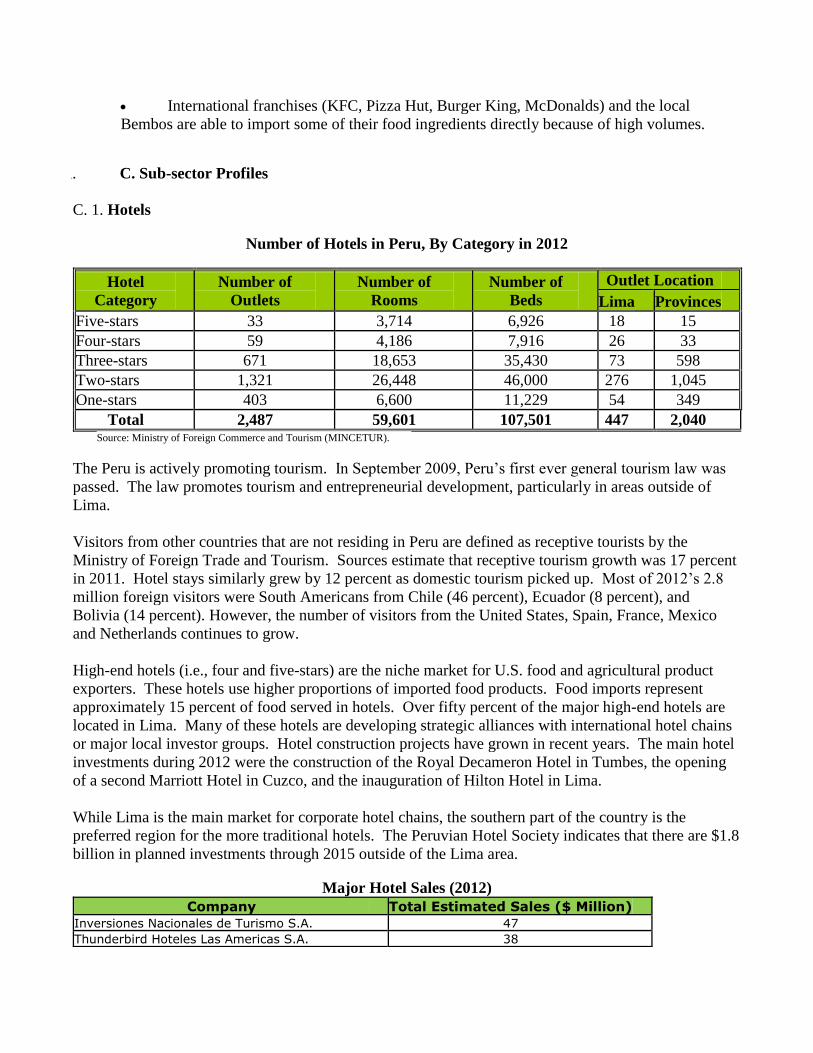
International franchises (KFC, Pizza Hut, Burger King, McDonalds) and the local
Bembos are able to import some of their food ingredients directly because of high volumes.
A. C. Sub-sector Profiles
C. 1. Hotels
Number of Hotels in Peru, By Category in 2012
Hotel
Category
Number of
Outlets
Number of
Rooms
Number of
Beds
Outlet Location
Lima Provinces
Five-stars 33 3,714 6,926 18 15
Four-stars 59 4,186 7,916 26 33
Three-stars 671 18,653 35,430 73 598
Two-stars 1,321 26,448 46,000 276 1,045
One-stars 403 6,600 11,229 54 349
Total 2,487 59,601 107,501 447 2,040
Source: Ministry of Foreign Commerce and Tourism (MINCETUR).
The Peru is actively promoting tourism. In September 2009, Peru’s first ever general tourism law was
passed. The law promotes tourism and entrepreneurial development, particularly in areas outside of
Lima.
Visitors from other countries that are not residing in Peru are defined as receptive tourists by the
Ministry of Foreign Trade and Tourism. Sources estimate that receptive tourism growth was 17 percent
in 2011. Hotel stays similarly grew by 12 percent as domestic tourism picked up. Most of 2012’s 2.8
million foreign visitors were South Americans from Chile (46 percent), Ecuador (8 percent), and
Bolivia (14 percent). However, the number of visitors from the United States, Spain, France, Mexico
and Netherlands continues to grow.
High-end hotels (i.e., four and five-stars) are the niche market for U.S. food and agricultural product
exporters. These hotels use higher proportions of imported food products. Food imports represent
approximately 15 percent of food served in hotels. Over fifty percent of the major high-end hotels are
located in Lima. Many of these hotels are developing strategic alliances with international hotel chains
or major local investor groups. Hotel construction projects have grown in recent years. The main hotel
investments during 2012 were the construction of the Royal Decameron Hotel in Tumbes, the opening
of a second Marriott Hotel in Cuzco, and the inauguration of Hilton Hotel in Lima.
While Lima is the main market for corporate hotel chains, the southern part of the country is the
preferred region for the more traditional hotels. The Peruvian Hotel Society indicates that there are $1.8
billion in planned investments through 2015 outside of the Lima area.
Major Hotel Sales (2012)
Company Total Estimated Sales ($ Million)
Inversiones Nacionales de Turismo S.A. 47 Thunderbird Hoteles Las Americas S.A. 38

Inversiones La Rioja S.A. 31 Nessus Hotel Peru S.A. – Casa Andina 27 Orient-Express Peru S.A. 22 Costa del Sol S.A. 22 Hotelera Costa del Pacifico S.A. 19 Corporacion el Golf S.A. / Los Delfines 16 Peru OEH S.A. 18 Hoteles Sheraton del Peru S.A. 14 Peru OEH Machu Picchu S.A. 12 Corporacion Hotelera Metor S.A. 11 Consorcio Hotelero Las Palmeras S.A.C. 10 Sociedad de Desarrollo de Hoteles Peruanos S.A. 10 Hoteles Estelar del Peru S.A.C. 8 Source: The 10,000 Major Companies in Peru.
Source: Ministry of Foreign Commerce and Tourism (MINCETUR).
C.2. Restaurants
Peruvian gastronomy is earning international accolades; leading to the rapid development of national
restaurant franchises abroad and the growing number of publications about the local cuisine. Food
offerings are highly diversified and new restaurant venues are continuously opening. In 2011, full
service restaurants reported $2.7 billion in sales, up 11 percent from the previous year. The number of
restaurant outlets in shopping centers, particularly outside of Lima, is fostering the growth of
international and local fast food chains.
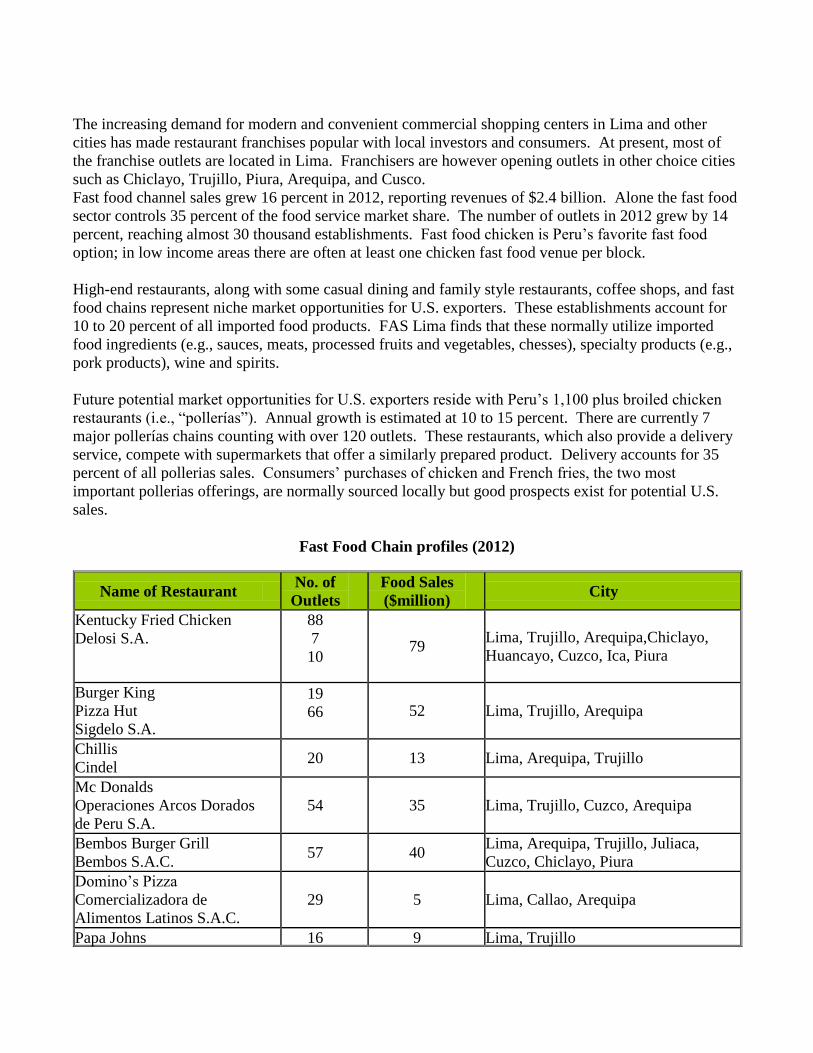
The increasing demand for modern and convenient commercial shopping centers in Lima and other
cities has made restaurant franchises popular with local investors and consumers. At present, most of
the franchise outlets are located in Lima. Franchisers are however opening outlets in other choice cities
such as Chiclayo, Trujillo, Piura, Arequipa, and Cusco.
Fast food channel sales grew 16 percent in 2012, reporting revenues of $2.4 billion. Alone the fast food
sector controls 35 percent of the food service market share. The number of outlets in 2012 grew by 14
percent, reaching almost 30 thousand establishments. Fast food chicken is Peru’s favorite fast food
option; in low income areas there are often at least one chicken fast food venue per block.
High-end restaurants, along with some casual dining and family style restaurants, coffee shops, and fast
food chains represent niche market opportunities for U.S. exporters. These establishments account for
10 to 20 percent of all imported food products. FAS Lima finds that these normally utilize imported
food ingredients (e.g., sauces, meats, processed fruits and vegetables, chesses), specialty products (e.g.,
pork products), wine and spirits.
Future potential market opportunities for U.S. exporters reside with Peru’s 1,100 plus broiled chicken
restaurants (i.e., “pollerías”). Annual growth is estimated at 10 to 15 percent. There are currently 7
major pollerías chains counting with over 120 outlets. These restaurants, which also provide a delivery
service, compete with supermarkets that offer a similarly prepared product. Delivery accounts for 35
percent of all pollerias sales. Consumers’ purchases of chicken and French fries, the two most
important pollerias offerings, are normally sourced locally but good prospects exist for potential U.S.
sales.
Fast Food Chain profiles (2012)
Name of Restaurant No. of
Outlets
Food Sales
($million) City
Kentucky Fried Chicken
Delosi S.A.
88
7
10
79 Lima, Trujillo, Arequipa,Chiclayo,
Huancayo, Cuzco, Ica, Piura
Burger King
Pizza Hut
Sigdelo S.A.
19
66
52 Lima, Trujillo, Arequipa
Chillis
Cindel 20 13 Lima, Arequipa, Trujillo
Mc Donalds
Operaciones Arcos Dorados
de Peru S.A.
54 35 Lima, Trujillo, Cuzco, Arequipa
Bembos Burger Grill
Bembos S.A.C. 57 40
Lima, Arequipa, Trujillo, Juliaca,
Cuzco, Chiclayo, Piura
Domino’s Pizza
Comercializadora de
Alimentos Latinos S.A.C.
29 5 Lima, Callao, Arequipa
Papa Johns 16 9 Lima, Trujillo

Corporacion Peruana de
Restaurantes S.A. Note: Estimated values for 2012. Source: The 10,000 Major Companies in Peru (2013).
C. 3. Institutional Contractors
This sub-sector accounts for approximately 9 percent of total food service sales with an
estimated growth of 13 percent in 2012.
The potential market for U.S. food products includes large caterers that supply the
country’s airports and mining companies. These companies currently use mainly local products
in their menus.
Vending machines and stores in mining camps provide imported goods such as snacks,
canned goods, and sweets. These items are supplied through local importers, wholesalers,
distributors, or major caterers.
Major Peruvian Suppliers for the Food Service Sector (2012)
Company
Name
Total Sales
($Million)
Type of
Company Food Supply
Imported Food
Products
Alicorp S.A. 1,315
Processor,
importer,
distributor
Pasta, wheat flour,
margarine, food
ingredients,
mayonnaise, breakfast
cereals, cookies, jelly,
ice cream, sauces, pet
food.
Wheat, wheat flour,
edible oils, soy cake,
sauces.
Gloria S.A. 712
Processor,
importer,
distributor
Dairy and pork
products, juices, canned
seafood.
Dairy ingredients,
juices, lactose and
other sugars.
Corporacion
Jose R.
Lindley S.A.
472 Processor,
importer. Sodas, juices. Canned fruit, gelatin.
Química Suiza
S.A. 393
Importer,
distributor
Sweeteners, fishmeal,
chocolate, wine,
processed fruit.
Canned food, food
ingredients,
sweeteners, animal
feed.
Deprodeca
S.A.C 389 Distributor
Dairy Products, jellies,
canned food,
Nestle Peru
S.A. 377
Processor,
importer,
distributor
Dairy products, soups
and broths, infant
formula, instant coffee
and chocolate, breakfast
cereal, cookies,
Dairy ingredients,
chocolate, infant
formula, food
preparations, baked
goods, chicory extract,

chocolates, bakery
goods.
sauces, soup
preparations.
Axur S.A. 158 Importer,
Distributor
Canned Food, Food
preparations, Bakery
goods, Liquors
Canned fruit, bakery
G.W.Yi Chang
& Cia S.A. 114
Importer,
distributor
Canned fruits, canned
seafood, chocolate,
wine and spirits.
Canned fruits, canned
seafood, chocolate,
wine and spirits.
Laive S.A. 102 Processor,
importer
Dairy and pork
products,
Cheese, butter and
pork products.
Kraft Foods
Peru S.A. 90
Processor,
importer,
distributor
Cookies, juices,
cheeses.
Cheese, sauces, bakery
and dairy ingredients,
chocolates.
Unilever
Andina Peru
S.A.
75 Processor,
importer Sauces, soups. Sauces, soups.
Perufarma
S.A. 71
Importer,
distributor
Chocolate,
confectionary, wine and
liquors.
Chocolate,
confectionary, wine
and liquors.
Delosi S.A. 50 Fast food
franchise Hamburgers, salads.
French fries, bakery
goods, sauces, cheese.
Sociedad
Suizo Peruana
de Embutidos
S.A.
44 Processor,
importer Sausages, cheese.
Pork products, poultry,
edible offals, cheese
Mayorsa S.A. 40 Wholesaler,
importer
Peas and lentils,
popcorn, canned fruit,
starch.
Peas and lentils,
popcorn, canned fruit,
starch.
Sigdelo S.A. 38 Fast food
chain Hamburgers, pizza
Cheese, meat
preparations, sauces,
French fries,
condiments
Braedt S.A. 33
Processor,
importer,
distributor.
Pork products, cheese.
Pork products, cheese,
dairy ingredients,
condiments.
Arcor del Peru
S.A. 30
Processor,
importer,
distributor
Chocolate,
confectionary, bakery
goods, canned fruit.
Chocolate,
confectionary, canned
fruit, bakery goods,
bakery ingredients.
Bembos
S.A.C. 26
Fast food
chain Hamburgers
French fries, meat,
cheeses
Diageo Peru
S.A. 22
Importer,
distributor Liquors. Liquors.
Drokasa Peru
S.A. 17
Importer,
distributor Wine and liquors. Wine and liquors.

Halema S.A. 15 Processor,
importer
Processed meats, meats
and edible offals.
Meats and edible
offals.
Agro
Corporacion
S.A.C.
15 Processor,
importer
Processed meats, meats
and edible offals.
Meats and edible
offals.
Oregon Foods
S.A.C. 15
Importer,
distributor
Processed meats, meats
and edible offals, fresh
fruits.
Meats and edible
offals, fresh fruits.
Servicios
Frigorificos
S.A.
10
Processor,
importer,
distributor
Processed meats, meats
and edible offals.
Meats and edible
offals.
L.S. Andina
S.A. 7
Importer,
distributor
French fries preserved,
chocolates, sweeteners,
confectionary, olive oil,
baked goods
French fries preserved,
chocolates, sweeteners,
confectionary, olive
oil, baked goods
KMC
International
S.A.C.
4 Importer,
distributor
Microwave popcorn,
soups, baked goods
Microwave popcorn,
soups, baked goods.
Destileria
Peruana S.A. 6
Processor,
importer
Wholesalers, retailers,
food service Liquors.
L C e Hijos
S.A. 6
Importer,
distributor Wine and liquors Wine and liquors
Industrias
Molitalia S.A. 4
Processor,
importer,
distributor.
Chocolates, pasta,
confectionary, sauces. Wheat.
Note: Total food imports are distributed between the three food sectors: HRI, Retail and Food Processing. Source: The 10,000 Major Companies in Peru 2010 and Peru’s Customs (SUNAT).
Section III. Competition
Peru gives tariff preferences to the Andean Community of Nations (CAN - Bolivia, Colombia
and Ecuador), and to Mexico, Paraguay, Argentina, Brazil, Uruguay and Cuba.
According to Peru’s customs data, total consumer-oriented products exports to Peru from United
States grew to $176 million in 2012, up 36 percent from the 2011 level. The United States
became the second largest supplier of consumer-oriented products, accounting for 17 percent of
the market share. Peru’s foreign trade policy supports open markets. In this regard, Peru has
signed several different commercial and trade agreements; some have not entered into force.
Others are still being neotiated:
Country Type Status
Andean Community (Bolivia, Ecuador and
Colombia) Free Trade Agreement In force
MERCOSUR (Argentina, Brasil, Uruguay,
Paraguay)
Economic Complementation
Agreement In force

Cuba Economic Complementation
Agreement In force
Chile Free Trade Agreement In force
Mexico Trade Integration Agreement In force
United States Free Trade Agreement In force
Canada Free Trade Agreement In force
Singapore Free Trade Agreement In force
China Free Trade Agreement In force
South Korea Free Trade Agreement In force
European Free Trade Association (EFTA) Free Trade Agreement In force
European Union Free Trade Agreement In force
Thailand Third Protocol In force
Japan Economic Partnership Agreement In force
Costa Rica Free Trade Agreement In force
Panama Free Trade Agreement In force
Guatemala Free Trade Agreement Negotiating
El Salvador Free Trade Agreement Negotiating
Honduras Free Trade Agreement Negotiating
The PTPA strengthens U.S.-origin food and agricultural products’ competitiveness within the
Peruvian market. High-end consumers are familiar with the quality of U.S. products.
For a complete list of products that have benefited from PTPA, please check
http://www.ustr.gov/Trade_Agreements/Bilateral/Peru_TPA/Section_Index.html.

Source: World Trade Atlas.
Competitive Situation facing U.S. Suppliers in the HRI Food Service Market in 2012
Product
Category/ Net Imports
Major Supply
Sources
Strengths of Key Supply
Countries
Advantages and
Disadvantages of Local
Suppliers
Dairy
Products
(Excl.
Cheese)
($231
million)
New Zealand:
45 percent
U.S.: 18
percent
Bolivia: 6
percent
UK: 5 percent
Chile: 4
percent
- New Zealand is a major
supplier of dairy ingredients,
especially HS 040221 and
040210 accounting almost 80
percent of total imports.
- Only two companies are
major producers of
evaporated milk and yogurt.
Cheese
3,782 tons
($18.23
million)
U.S: 48 percent
Argentina: 19
percent
Netherlands: 6
percent
New Zealand:
6 percent
Uruguay: 5
percent
percent
Argentina and Uruguay are
part of MERCOSUR and have
tariff preferences
Local homemade cheeses are
commonly sold.
Gourmet cheeses are not
made locally.
Snack Foods
(excl nuts)
22,000 tons
($71 million)
Colombia: 50
percent
U.S.: 8 percent
Brazil: 7
percent
Chile: 6
percent
Argentina: 6
percent
- Tariff preferences are applied
to neighboring countries.
- Local producers are major
food processors. They import
food ingredients for snacks
and snacks in bulk.
Processed
Fruits and
Vegetables
58,000 tons
($90 million)
Chile: 55
percent
U.S.: 10
percent
Netherlands: 9
percent
Argentina: 6
percent
- EU products are viewed as
good quality.
-Chile sells at cheaper prices
due to proximity and tariff
preferences
- Netherlands has increased its
potato preparations exports
- Local processors are major
exporters, but their local
supply is limited.

China: 4
percent
due to fast food growth.
Fresh Fruits
78,000 tons
($65 million)
Chile: 76
percent
Argentina: 11
percent
U.S.: 10
percent
- Chile is the main supplier
because of proximity, price
and duty free entrance.
- Argentina has a window for
pears and apples.
- There is an open window
from November to February
for that will benefit the United
Stated
- Local fruit sold in retail
markets is of lower quality.
Fruit and
vegetable
juices
1,960,000 L
($ 6 million)
U.S.: 32
percent
Mexico: 20
percent
Brazil: 20
percent
Chile: 19
percent
Argentina: 4
percent
- Chile has tariff and proximity
advantages.
- Mexico has increased its
exports of lime juice
- Local brands are well
positioned in the market at
competitive prices.
Wine and
Beer
21 Million
liters
($43 million)
Argentina:
35percent
Chile: 20
percent
Spain: 10
percent
Italy: 10
percent
Brazil: 10
percent
France: 4
percent
U.S.: 3 percent
- Proximity and recognized
quality of Chilean and
Argentinean wines.
- Brazil is the major supplier of
imported beer.
- Major local breweries are
well positioned, price
competitive, and belong to
international companies,
representing 95 percent of the
market.
- Local wine is well
positioned and price
competitive, but does not
satisfy demand.
Red Meats
(fresh, chilled
or frozen)
23,000 tons
($61 million)
U.S.: 33
percent
Brazil: 29
percent
Chile: 17
percent
Argentina: 11
percent
Bolivia: 4
percent
Neighbor countries
export lower price
cuts.
80 percent of Brazilian
exports are offals
- Peru’s market for U.S. meats
reopened in October 2006.
- U.S. meats are of superior
quality.
- Peru imports three times
more offals than meats.
- Local meat does not satisfy
the demand.
Red Meats
(prepared,
preserved)
1,480 tons
Bolivia: 43
percent U.S.:
13 percent
Denmark: 11
- Bolivia has growth 14
percent respect 2011. Bolivian
manufacturers have
customized production
- The pork products industry
also imports prepared meats.
- U.S. product tariffs will
decrease throughout 5 to 7

($7 million) percent Chile:
10 percent
Italia: 9 percent
Spain: 9
percent
according to local demand.
years.
Poultry Meat
27,000 tons
($38 million)
Brazil: 31
percent
U.S.: 27
percent
Chile: 25
percent
Argentina: 11
percent
Bolivia: 6
percent
- Brazil diversifies its supply
including offals, turkey and
chicken cuts
- Chile is strong in turkey
cuts.
- Imports of U.S. poultry
products reopened in October
2006.
- TRQ for U.S. chicken leg
quarters
- Local poultry producers are
major suppliers with good
distribution channels.
- Imports are mainly chicken
and turkey parts. Note: Net imports correspond to the three food sectors: Food Service, Retail and Food Processing. Source: World Trade Atlas
Source: World Trade Atlas

A. Products Present in the Market Which Have Good Sales Potential:
Product/
Product
Category
Market
Size
2012
est.
Imports
2012
Average
Annual
Import
Growth
(2007-
12)
Import
Tariff
Rate
Key
Constraints
Over Market
Development
Market
Attractiveness
for the U.S.
Cheese
(HS 0406)
12,720
MT
3,782
tons
($18
million)
14.4
percent
040610,
20 and
40
0
percent
040630
040690
0
percent
- U.S.
competitors
are: Argentina
(19percent)
and
Netherlands
(6percent).
- Strong
preference for
EU cheese at
high-end HRI
and Retail
Sectors.
- U.S. cheeses
are mainly used
in the food
processing
sector, but have
potential in the
HRI and Retail
Food Sectors.
- In 2012, the
United States
was the first
supplier with a
market share of
48 percent.
- TPA*: 17 years
linear, 2,500 MT
quotas with 12
percent increase
per year.
Confectionary
– non
chocolate
(HS 1704)
N/A
15,630
tons
($46
million)
16.1
percent
0
percent
- Major
suppliers are
Colombia ($31
million) and
China ($3
million).
- Local
industry is
strong. Major
owners are
foreign
companies.
- United States
represents 3
percent of total
imports,
however, U.S.
imports grew 25
percent in 2012.
.
Confectionary
– chocolate
(HS 1806)
N/A
5,000
tons
($22
million)
12.2
percent
0
percent
- Local
industry is
competitive.
- The U.S. is the
largest supplier
with 19 percent.
The U.S.
strength is in

chocolate for the
retail sector.
Imports grew 24
percent in 2012.
Food
Preparations
(HS 210690)
N/A
16,600
tons
($153
million)
16.4
percent
0
percent
- Local
Production is
strong
- Chile is the
major exporter
(28 percent).
- United States is
the second
largest supplier
and holds 20
percent of
market share.
- In 2012 imports
grew 28 percent
due to retail
sector growth.
Prime and
choice beef
(HS 020230)
Total
beef and
offals
market:
230,000
MT
1,250
tons
($9
million)
7.9
percent
0
percent
- Competes
with quality
meats from
Colombia,
Argentina,
Uruguay,
Brazil and
Bolivia.
- Due to an
increment of
income levels,
local consumers
are demanding
high quality
products, such as
beef.
- U.S. imports
keeps growing
(15 percent) as a
result of higher
demand created
but supermarket
chains.
- United States
became the
second largest
beef supplier in
2012 and holds
28 percent of
import market
share
Edible Beef
Offals (liver)
(HS,
020622)
10,000
MT
3,800
tons
($6.5
million)
16.4
percent
0
percent
Local
production
covers most of
the market
size.
- The United
States holds 97
percent of import
market.
Fruit and
Vegetable
juices
(HS 2009)
N/A
19,600
hl
($6
30
percent
0
percent
- Mexico is the
second largest
supplier and
holds 20
U.S. imports
grew 145 percent
in 2012 and
remains as the

million) percent of
market share
in 2012.
largest supplier
holding 32
percent of
market share.
Pet foods
(HS 230910)
50,000
MT
14,730
MT
($19
million)
17.6
percent
0
percent
- Growing
local pet
industry.
- There is an
informal
industry
arising.
- Argentina 37
percent), and
Colombia (27
percent) are
major
competitors.
- The United
States holds 24
percent of the
market.
Turkey
(HS 020727)
23,000
MT
6,409
tons
(12
million)
27.2
percent
6
percent
- Major
competitors
are Brazil (34
percent) and
Chile (28
percent)
- Local poultry
industry is
strong.
- Peruvians are
major consumers
of turkey during
Christmas and
New Year’s.
- The food retail
sector is
becoming more
popular not only
in Lima, but also
in the province.
- USAPEEC has
initiated a market
penetration plan.
Chicken cuts
(HS 020714)
$60,000
MT
10,000
tons
($10
million)
56.2
percent
TRQ:
13,997
tons
0
percent
- Strong local
industry.
- Frozen
presentation is
not common
- Peruvians are
major consumers
of poultry.
- TRQ: 6 percent
increase per
year.
Bread, pastry,
cookies
(HS 1905)
N/A
4,390
tons
($12
million)
21.1
percent
0
percent
- Colombia is
the major
import supplier
and holds 30
percent of
market share.
Local
companies are
The United
States holds 14
percent of import
market share.
very strong.
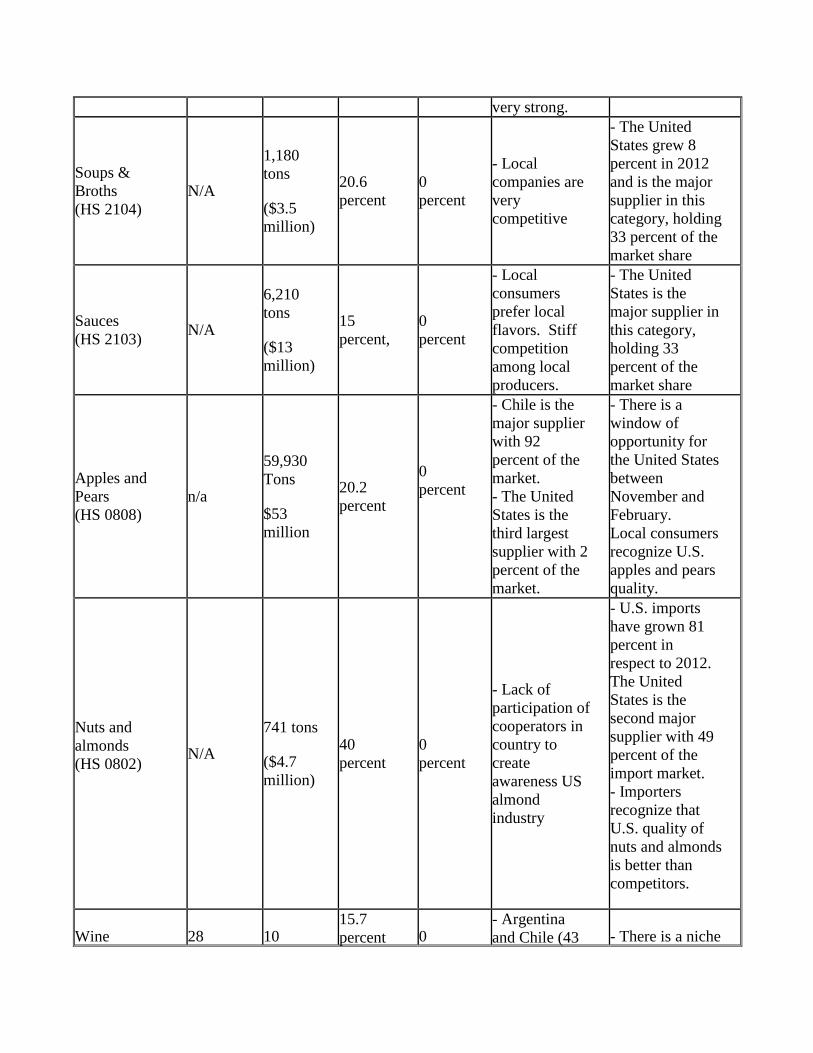
Soups &
Broths
(HS 2104)
N/A
1,180
tons
($3.5
million)
20.6
percent
0
percent
- Local
companies are
very
competitive
- The United
States grew 8
percent in 2012
and is the major
supplier in this
category, holding
33 percent of the
market share
Sauces
(HS 2103) N/A
6,210
tons
($13
million)
15
percent,
0
percent
- Local
consumers
prefer local
flavors. Stiff
competition
among local
producers.
- The United
States is the
major supplier in
this category,
holding 33
percent of the
market share
Apples and
Pears
(HS 0808)
n/a
59,930
Tons
$53
million
20.2
percent
0
percent
- Chile is the
major supplier
with 92
percent of the
market.
- The United
States is the
third largest
supplier with 2
percent of the
market.
- There is a
window of
opportunity for
the United States
between
November and
February.
Local consumers
recognize U.S.
apples and pears
quality.
Nuts and
almonds
(HS 0802)
N/A
741 tons
($4.7
million)
40
percent
0
percent
- Lack of
participation of
cooperators in
country to
create
awareness US
almond
industry
- U.S. imports
have grown 81
percent in
respect to 2012.
The United
States is the
second major
supplier with 49
percent of the
import market.
- Importers
recognize that
U.S. quality of
nuts and almonds
is better than
competitors.
Wine
28
10 15.7
percent
0 - Argentina
and Chile (43
- There is a niche

(HS 2204) million
liters
million
liters
($35
million)
percent
and 25
percent)
domain the
market
- Lack of
awareness of
local importers
about US wine
industry.
market for
quality wines for
which the United
States can be
appreciated and
price
competitive.
- Peru’s wine
consumption is
growing.
Currently, it is
above 1.3 liters
per person.
Note: TRQ = Tariff Rate Quota, on a first-come first-serve basis. Sources: World Trade Atlas, USTR, Ministry of Agriculture (Minag), Gestion and El Comercio Newspapers.
B. Products Not Present in Significant Quantities, but which have good sales Potential:
Product/
Product
Category
Imports
2012
Average
Annual
Import
Growth
(2007-12)
Import
Tariff
Rate
Key Constraints
Over Market
Development
Market Attractiveness
for the U.S.
Peaches,
cherries and
Nectarines
(HS 0809)
4,148
tons
($4
million)
13.6
percent
0
percent
- Chile is major
supplier with 96
percent of the
market.
- Importers are interested
in U.S. peaches and
nectarines.
- Duty free access for
this category.
Grapes,
raisins
(HS
080620)
6,040
tons
($15
million)
11 percent
0
percent
- Chile holds
almost 88 percent
of the market.
- U.S. window:
September to December.
Citrus
(HS 0805)
876 tons
$886,024
6 percent
0
percent
- Local production
is strong.
- United States holds 77
percent of import market
and exports have grown
500 percent in 2012
- Recognized quality of
U.S. oranges and
tangerines.
- Export window for the
United States is from

January to March.
Pork Meat
(HS 0203)
3,685
tons
($10
million)
54 percent 0
percent
- Peruvians are
not used to eating
pork.
- Local industry
produces more
than 100,000 MT
- The industry is
the same as the
poultry industry.
- Chile is the
major supplier
with 81 percent of
the market
- Pork imports are
growing due to
outstanding market
development by USMEF
representative.
- U.S. pork benefit from
TPA implementation.
-
Sausages
(HS 1601)
577 tons
($2
million)
18 percent 0
percent
- Strong local
industry.
- There is a high-end
segment for gourmet
sausages, in which the
United States can
compete.
US exports have grown (
12percent) and currently
holds 40 percent of
import market. Fast
food restaurants are main
channel for this category.
Ham,
processed
HS 160241
81 tons
($0.93
million)
26 percent 7
percent
- Major suppliers
are Italy (42
percent of the
market) and Spain
(38 percent).
- The United States has
quality products to
introduce to the gourmet
market.
- TPA: 5 years
Beer
(HS 2203)
11
million
liters
($8
million)
12 percent 0
percent
- Local breweries
are very strong
and owned by
international
companies.
- Local breweries
produce and
import new brands
for introduction in
the market.
Brazil is the major
supplier (52
percent of the
market).
- Niche market for
premium beers.
- Growing consumption
of beer (over 40 lts per
capita)
- Duty free entrance.
- few U.S. brands within
the market.
Note: TRQ = Tariff Rate Quota, on a first-come first-serve basis.

Sources: World Trade Atlas, USTR, Ministry of Agriculture (Minag), Gestion and El Comercio Newspapers
C. Products not Present Because They Face Significant Barriers
None.
Section V. Key Contacts and Further Information
U.S. Embassy Lima, Foreign Agricultural Service (FAS)/ Office of Agricultural Affairs
Mailing Address: Unit 3785, APO AA 34031
Address: Av. La Encalada cdra. 17, Monterrico, Lima 33
Phone: (511) 434-3042
Fax: (511) 434-3043
E-mail: [email protected]
For further information, check the FAS web site www.fas.usda.gov or our web site
www.usdaperu.org.pe. Please, also refer to our other current food market related reports: Exporter
Guide, Food and Agricultural Import Regulations and Standards (FAIRS), FAIRS Export Certificate
and Retail Food Sector.
Ministry of Foreign Trade and Tourism (MINCETUR)
Minister: Magali Silva
Address: Calle Uno Oeste 050, Urb. Corpac, San Isidro, Lima 27
Phone: (511) 513-6100
Fax: (511) 224-3362
Web site: www.mincetur.gob.pe
Hotel and Restaurant Association (AHORA)
President: Fredy Gamarra
Address: Av. Benavides 881, Miraflores, Lima 18
Phone: (511) 444-4303
Fax: (511) 444-7825
E-mail: [email protected]
Web site: www.ahora-peru.com
American Chamber of Commerce (AmCham Peru)
Executive Director: Aldo Defilippi
Address: Av. Ricardo Palma 836, Miraflores, Lima 18
Phone: (511) 705-8000
Fax: (511) 241-0709
E-mail: [email protected]
Web site: www.amcham.org.pe