
Peru Food Processing Ingredients 2011 - Amazon S3 · this report contains assessments of commodity...
23
THIS REPORT CONTAINS ASSESSMENTS OF COMMODITY AND TRADE ISSUES MADE BY USDA STAFF AND NOT NECESSARILY STATEMENTS OF OFFICIAL U.S. GOVERNMENT POLICY Date: GAIN Report Number: Approved By: Prepared By: Report Highlights: In 2010, total sales of the 90 major food processing companies in Peru reached $8.5 billion. The food industry recovered 7 percent in 2010 from its downturn in 2009. It was mainly triggered by higher income levels, more employment and credit offer. Tariff reductions after the implementation of the U.S. - Peru Trade Promotion Agreement, supported by favorable market conditions in Peru, could significantly expand U.S. food exports in this sector, especially for food ingredients, food preparations, snacks, confectionary, fruit and vegetable juices, dairy products and meat products. Alvaro Loza Emiko Purdy 2011 Food Processing Ingredients Peru 12/22/2011 Required Report - public distribution
Transcript of Peru Food Processing Ingredients 2011 - Amazon S3 · this report contains assessments of commodity...

THIS REPORT CONTAINS ASSESSMENTS OF COMMODITY AND TRADE ISSUES MADE BY
USDA STAFF AND NOT NECESSARILY STATEMENTS OF OFFICIAL U.S. GOVERNMENT
POLICY
Date:
GAIN Report Number:
Approved By:
Prepared By:
Report Highlights:
In 2010, total sales of the 90 major food processing companies in Peru reached $8.5 billion. The
food industry recovered 7 percent in 2010 from its downturn in 2009. It was mainly triggered by
higher income levels, more employment and credit offer.
Tariff reductions after the implementation of the U.S. - Peru Trade Promotion Agreement,
supported by favorable market conditions in Peru, could significantly expand U.S. food exports in
this sector, especially for food ingredients, food preparations, snacks, confectionary, fruit and vegetable juices, dairy products and meat products.
Alvaro Loza
Emiko Purdy
2011
Food Processing Ingredients
Peru
12/22/2011
Required Report - public distribution
Post:
Executive Summary:
Section I. Market Summary
The Peruvian economy is one of the most successful economies in Latin America. Increasing
income and expenditure levels are creating opportunities for companies. A growing middle class
and changes in consumer attitudes complete an attractive landscape for businesses that are able
to capitalize on these trends. Peru has demonstrated to the world its economic stability and
continuous growth within the region, even during times of world financial crisis. Peru posted
impressive results in 2010, such as 8.8 percent growth of GDP – a proof that Peru’s economy is
highly dynamic and driven mostly by private investment, foreign trade, and domestic demand.
The food industry recovered 7 percent in 2010 from its downturn in 2009. It was mainly triggered
by higher income levels, employment and credit.
There were two distinct trends defined by the direction taken by the market for goods. The first
one was pushed by prepared and preserved meat production that climbed 4.8 percent -- the rate
that has shown a steadily growth for twelve straight years. The leading companies, mainly from
poultry and sausage industry, have been able to further diversify their offering of foodstuffs. The
second trend relies on the notable expansion of oils and fat industry that grew 17 percent in 2010,
mainly boosted by an aggressive competitive behavior between key players, being locals who had
best performance at the end.
According to food industry perspectives for 2011, there is high growth expectancy for this sector
due to expansion of local demand especially at provinces. Despite the rise of ingredients prices in
the international market, the industry remains solid and it is gaining more presence abroad. In
that sense, major companies such as Alicorp has acquired new plants in Central America and
Uruguay. In respect of local market, Alicorp has announced a $25 million investment for enlarging
and improving its products lines.
The performance of the beverage industry has been positive over the past twelve years, boosted
by the domestic market and particularly by the development of soft drinks and mineral waters. In
2010, sector’s growth recovered and expanded 7 percent basically by an increment of domestic
demand resulting from country’s economic progress. Distilled beverages and spirits rose barely
0.5 percent as a result of lower production of pisco (4 percent) and other distilled spirits compared
to previous year, closing the year with $550 million in sales.
Consumption of spirits in Peru can be divided in two groups: low-priced spirits, which have
achieved good penetration within the provinces, and high-value products that appeal to upper- and
middle-income consumers in urban areas. The first group is constituted by low-priced rum, vodka
and economy pisco, whilst the second one is formed by Whisky, tequila, standard pisco and rum.
Pisco production expects to grow 15 percent in 2011 as a result of an increment of new pisco
producers driven by higher international demand aligned with Peruvian culinary expansion,
receiving $50 million new investments.
On the other hand, wine production showed a surprising recovery, achieving 21 percent growth in
Lima
2010. Peruvian wineries have launched new products resulting in the increased market shares
domestically as well as in overseas’ market. As a result, per capita wine consumption has climbed
to 1.3 liters from 1 liter in a three year period.
The brewing industry also showed an increment of 6.2 percent in 2010 reaching $1.2 billion of the
total sales. New products were released for uncovered segments. Peru has the lowest per capita
beer consumption in the region with 42 liters.
Soft drinks and mineral water have obtained over 7 percent growth in the same period, mainly
boosted by vigorous growth of bottled water (22 percent) and energy drinks (14 percent).
According to Peru’s customs data, total agricultural imports to Peru from United States grew to
$787 million in 2010, up 41 percent from the 2009 level. Moreover, consumer oriented products
reached $107 million in 2010 growing 81 percent in respect 2009. The United States became the
second largest supplier of consumer oriented products, accounting the 14 percent of the market
share which has certainly decreased the reach of Chile and has left Colombia as the third largest
supplier of this category.
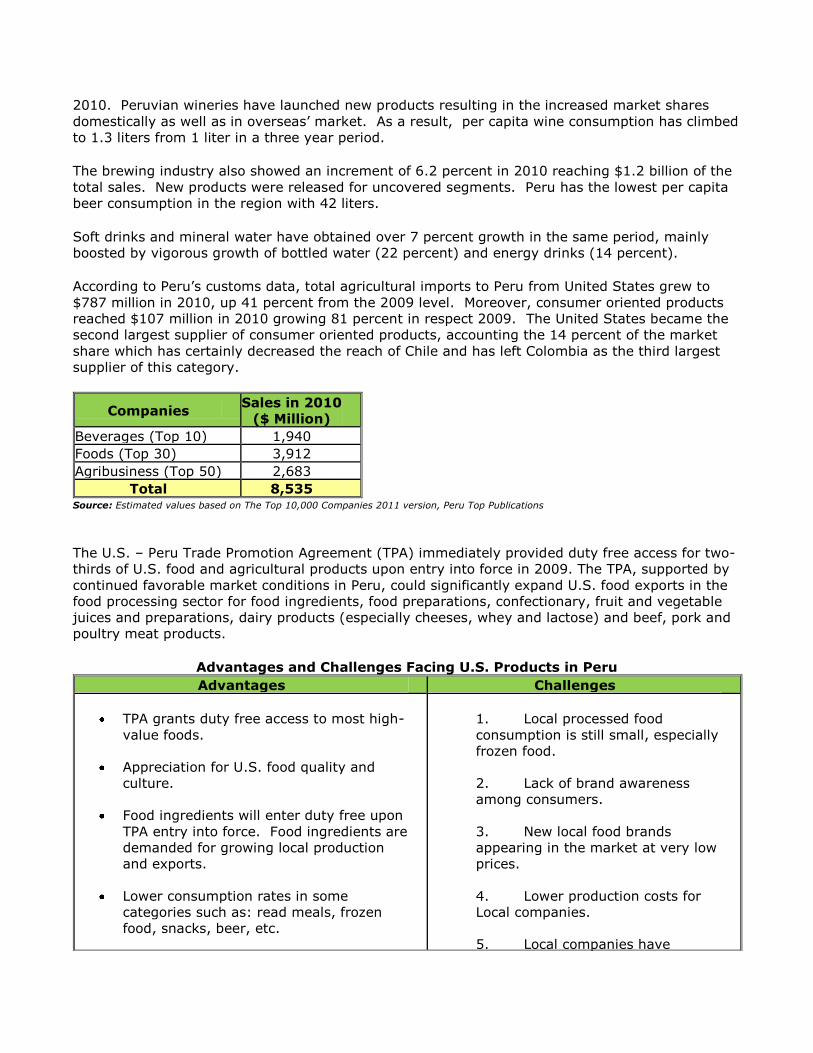
Companies Sales in 2010
($ Million)
Beverages (Top 10) 1,940
Foods (Top 30) 3,912
Agribusiness (Top 50) 2,683
Total 8,535 Source: Estimated values based on The Top 10,000 Companies 2011 version, Peru Top Publications
The U.S. – Peru Trade Promotion Agreement (TPA) immediately provided duty free access for two-
thirds of U.S. food and agricultural products upon entry into force in 2009. The TPA, supported by
continued favorable market conditions in Peru, could significantly expand U.S. food exports in the
food processing sector for food ingredients, food preparations, confectionary, fruit and vegetable
juices and preparations, dairy products (especially cheeses, whey and lactose) and beef, pork and
poultry meat products.
Advantages and Challenges Facing U.S. Products in Peru
Advantages Challenges
TPA grants duty free access to most high-
value foods.
Appreciation for U.S. food quality and
culture.
Food ingredients will enter duty free upon
TPA entry into force. Food ingredients are
demanded for growing local production
and exports.
Lower consumption rates in some
categories such as: read meals, frozen
food, snacks, beer, etc.
1. Local processed food
consumption is still small, especially
frozen food.
2. Lack of brand awareness
among consumers.
3. New local food brands
appearing in the market at very low
prices.
4. Lower production costs for
Local companies.
5. Local companies have
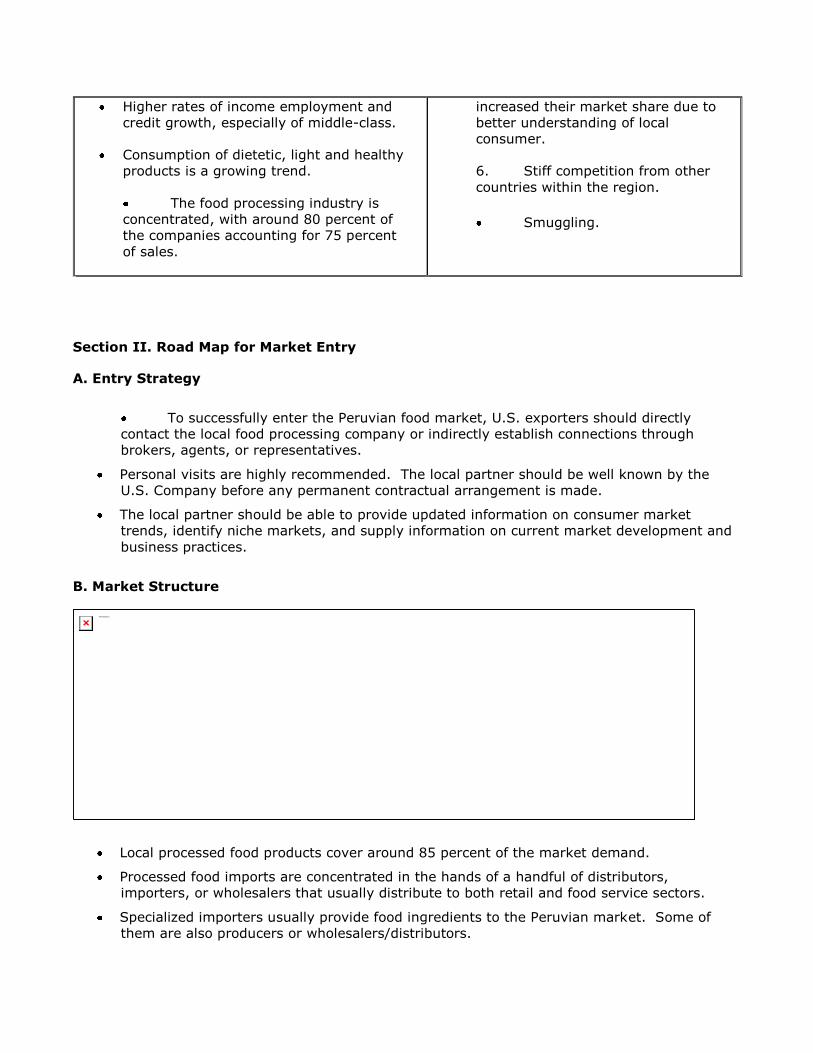
Higher rates of income employment and
credit growth, especially of middle-class.
Consumption of dietetic, light and healthy
products is a growing trend.
The food processing industry is
concentrated, with around 80 percent of
the companies accounting for 75 percent
of sales.
increased their market share due to
better understanding of local
consumer.
6. Stiff competition from other
countries within the region.
Smuggling.
Section II. Road Map for Market Entry
A. Entry Strategy
To successfully enter the Peruvian food market, U.S. exporters should directly
contact the local food processing company or indirectly establish connections through
brokers, agents, or representatives.
Personal visits are highly recommended. The local partner should be well known by the
U.S. Company before any permanent contractual arrangement is made.
The local partner should be able to provide updated information on consumer market
trends, identify niche markets, and supply information on current market development and
business practices.
B. Market Structure
Local processed food products cover around 85 percent of the market demand.
Processed food imports are concentrated in the hands of a handful of distributors,
importers, or wholesalers that usually distribute to both retail and food service sectors.
Specialized importers usually provide food ingredients to the Peruvian market. Some of
them are also producers or wholesalers/distributors.
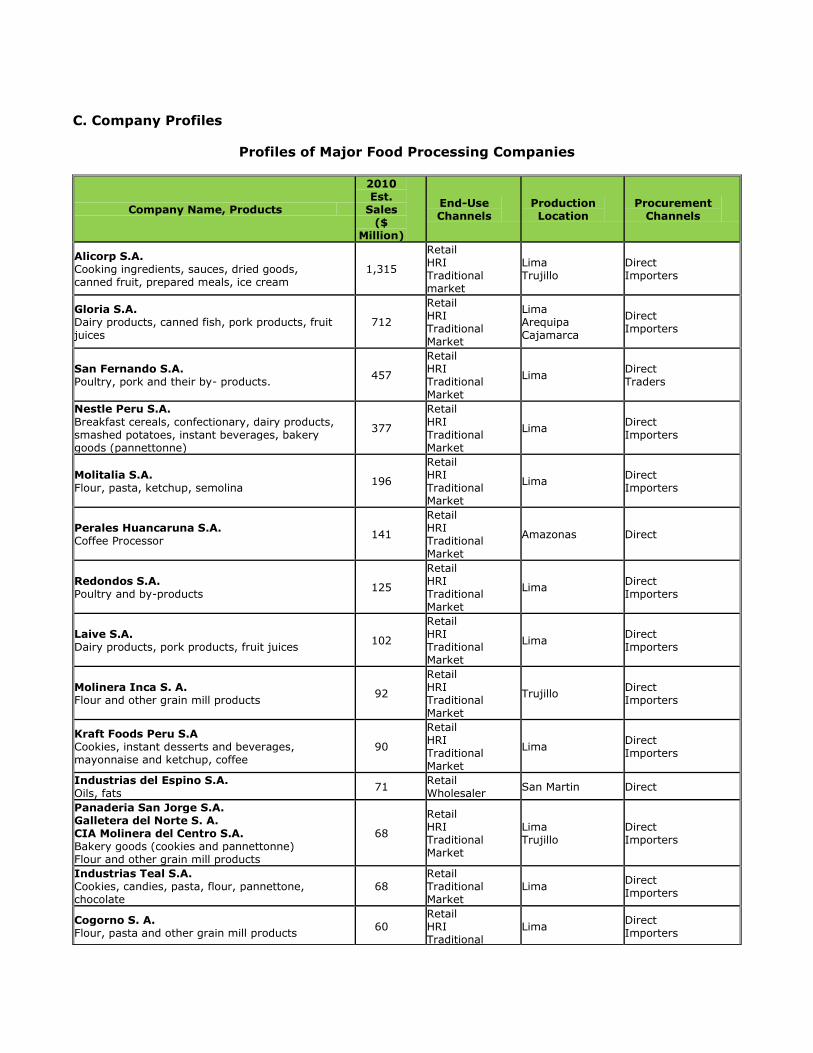
C. Company Profiles
Profiles of Major Food Processing Companies
Company Name, Products
2010 Est.
Sales ($
Million)
End-Use Channels
Production Location
Procurement Channels
Alicorp S.A. Cooking ingredients, sauces, dried goods, canned fruit, prepared meals, ice cream
1,315
Retail HRI Traditional market
Lima Trujillo
Direct Importers
Gloria S.A. Dairy products, canned fish, pork products, fruit juices
712
Retail HRI Traditional Market
Lima Arequipa Cajamarca
Direct Importers
San Fernando S.A. Poultry, pork and their by- products. 457
Retail HRI Traditional Market
Lima Direct Traders
Nestle Peru S.A. Breakfast cereals, confectionary, dairy products, smashed potatoes, instant beverages, bakery goods (pannettonne)
377
Retail HRI Traditional Market
Lima Direct Importers
Molitalia S.A. Flour, pasta, ketchup, semolina
196
Retail HRI Traditional Market
Lima Direct Importers
Perales Huancaruna S.A. Coffee Processor 141
Retail HRI Traditional Market
Amazonas Direct
Redondos S.A. Poultry and by-products
125
Retail HRI Traditional Market
Lima Direct Importers
Laive S.A. Dairy products, pork products, fruit juices 102
Retail HRI Traditional Market
Lima Direct Importers
Molinera Inca S. A. Flour and other grain mill products
92
Retail HRI Traditional Market
Trujillo Direct Importers
Kraft Foods Peru S.A Cookies, instant desserts and beverages, mayonnaise and ketchup, coffee
90
Retail HRI Traditional Market
Lima Direct Importers
Industrias del Espino S.A. Oils, fats 71
Retail Wholesaler San Martin Direct
Panaderia San Jorge S.A. Galletera del Norte S. A. CIA Molinera del Centro S.A. Bakery goods (cookies and pannettonne) Flour and other grain mill products
68
Retail HRI Traditional Market
Lima Trujillo
Direct Importers
Industrias Teal S.A. Cookies, candies, pasta, flour, pannettone, chocolate
68 Retail Traditional Market
Lima Direct Importers
Cogorno S. A. Flour, pasta and other grain mill products 60
Retail HRI Traditional
Lima Direct Importers
Market
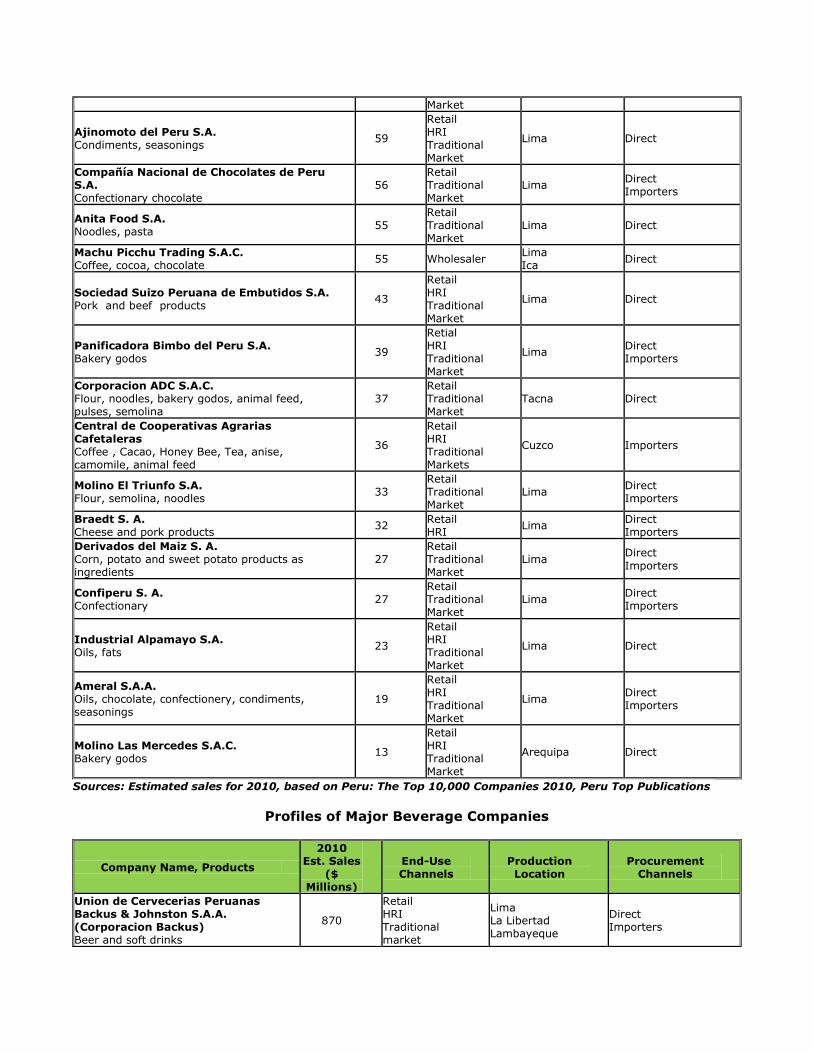
Ajinomoto del Peru S.A. Condiments, seasonings
59
Retail HRI Traditional Market
Lima Direct
Compañía Nacional de Chocolates de Peru S.A. Confectionary chocolate
56 Retail Traditional Market
Lima Direct Importers
Anita Food S.A. Noodles, pasta 55
Retail Traditional Market
Lima Direct
Machu Picchu Trading S.A.C. Coffee, cocoa, chocolate 55 Wholesaler
Lima Ica Direct
Sociedad Suizo Peruana de Embutidos S.A. Pork and beef products
43
Retail HRI Traditional Market
Lima Direct
Panificadora Bimbo del Peru S.A. Bakery godos
39
Retial HRI Traditional Market
Lima Direct Importers
Corporacion ADC S.A.C. Flour, noodles, bakery godos, animal feed, pulses, semolina
37 Retail Traditional Market
Tacna Direct
Central de Cooperativas Agrarias Cafetaleras Coffee , Cacao, Honey Bee, Tea, anise, camomile, animal feed
36
Retail HRI Traditional Markets
Cuzco Importers
Molino El Triunfo S.A. Flour, semolina, noodles
33 Retail Traditional Market
Lima Direct Importers
Braedt S. A. Cheese and pork products
32 Retail HRI
Lima Direct Importers
Derivados del Maiz S. A. Corn, potato and sweet potato products as ingredients
27 Retail Traditional Market
Lima Direct Importers
Confiperu S. A. Confectionary
27 Retail Traditional Market
Lima Direct Importers
Industrial Alpamayo S.A. Oils, fats
23
Retail HRI Traditional Market
Lima Direct
Ameral S.A.A. Oils, chocolate, confectionery, condiments, seasonings
19
Retail HRI Traditional Market
Lima Direct Importers
Molino Las Mercedes S.A.C. Bakery godos
13
Retail HRI Traditional Market
Arequipa Direct
Sources: Estimated sales for 2010, based on Peru: The Top 10,000 Companies 2010, Peru Top Publications
Profiles of Major Beverage Companies
Company Name, Products
2010 Est. Sales
($ Millions)
End-Use Channels
Production Location
Procurement Channels
Union de Cervecerias Peruanas Backus & Johnston S.A.A. (Corporacion Backus) Beer and soft drinks
870
Retail HRI Traditional market
Lima La Libertad Lambayeque
Direct Importers
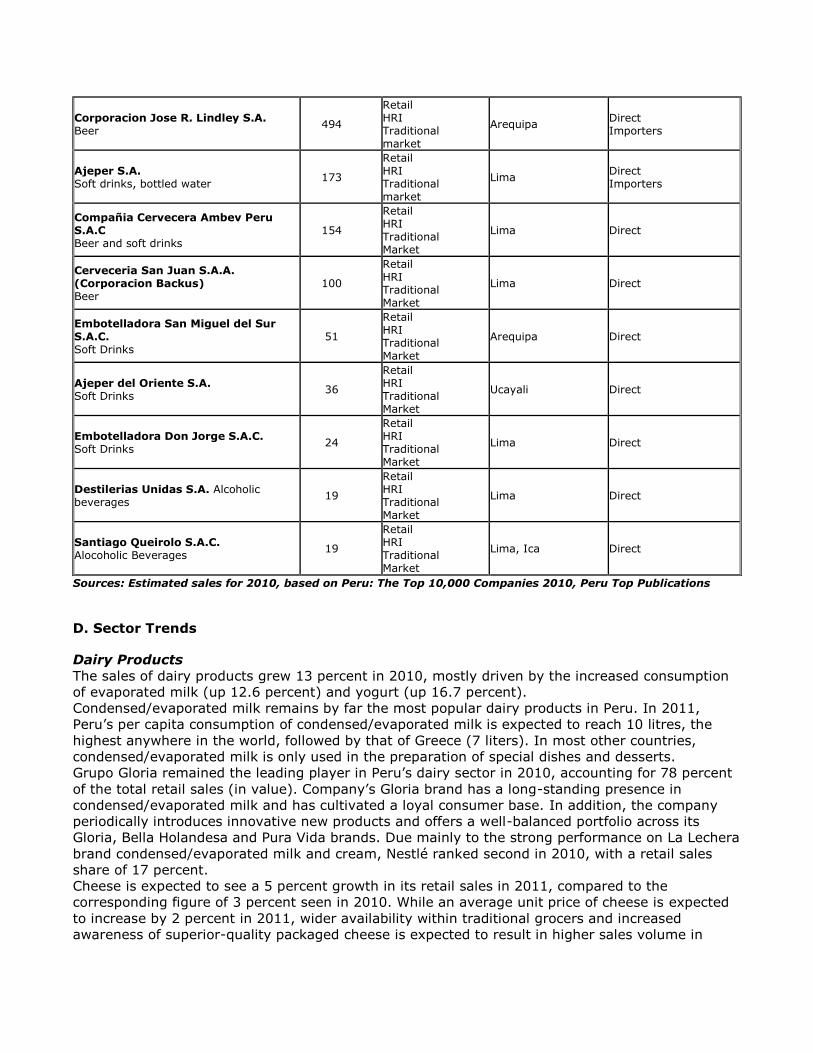
Corporacion Jose R. Lindley S.A. Beer
494
Retail HRI Traditional market
Arequipa Direct Importers
Ajeper S.A. Soft drinks, bottled water 173
Retail HRI Traditional market
Lima Direct Importers
Compañia Cervecera Ambev Peru S.A.C Beer and soft drinks
154
Retail HRI Traditional Market
Lima Direct
Cerveceria San Juan S.A.A. (Corporacion Backus) Beer
100
Retail HRI Traditional Market
Lima Direct
Embotelladora San Miguel del Sur S.A.C. Soft Drinks
51
Retail HRI Traditional Market
Arequipa Direct
Ajeper del Oriente S.A. Soft Drinks
36
Retail HRI Traditional Market
Ucayali Direct
Embotelladora Don Jorge S.A.C. Soft Drinks 24
Retail HRI Traditional Market
Lima Direct
Destilerias Unidas S.A. Alcoholic beverages
19
Retail HRI Traditional Market
Lima Direct
Santiago Queirolo S.A.C. Alocoholic Beverages
19
Retail HRI Traditional Market
Lima, Ica Direct
Sources: Estimated sales for 2010, based on Peru: The Top 10,000 Companies 2010, Peru Top Publications
D. Sector Trends
Dairy Products
The sales of dairy products grew 13 percent in 2010, mostly driven by the increased consumption
of evaporated milk (up 12.6 percent) and yogurt (up 16.7 percent).
Condensed/evaporated milk remains by far the most popular dairy products in Peru. In 2011,
Peru’s per capita consumption of condensed/evaporated milk is expected to reach 10 litres, the
highest anywhere in the world, followed by that of Greece (7 liters). In most other countries,
condensed/evaporated milk is only used in the preparation of special dishes and desserts.
Grupo Gloria remained the leading player in Peru’s dairy sector in 2010, accounting for 78 percent
of the total retail sales (in value). Company’s Gloria brand has a long-standing presence in
condensed/evaporated milk and has cultivated a loyal consumer base. In addition, the company
periodically introduces innovative new products and offers a well-balanced portfolio across its
Gloria, Bella Holandesa and Pura Vida brands. Due mainly to the strong performance on La Lechera
brand condensed/evaporated milk and cream, Nestlé ranked second in 2010, with a retail sales
share of 17 percent.
Cheese is expected to see a 5 percent growth in its retail sales in 2011, compared to the
corresponding figure of 3 percent seen in 2010. While an average unit price of cheese is expected
to increase by 2 percent in 2011, wider availability within traditional grocers and increased
awareness of superior-quality packaged cheese is expected to result in higher sales volume in
2011 compared to 2010.
Furthermore, processed cheese spread is expected to achieve the highest retail sales growth rate
of 6 percent in 2011. This category will benefit from a vast array of flavors available in small pack
sizes, which make products more affordable to middle income consumers. In Peru processed
cheese spread is mainly represented by soft spreadable cheese, as the presence of spray/aerosol
remained negligible [what does this mean???]. Low and middle income consumers have,
traditionally, shown a preference for unpackaged cheese, available at independent small grocers
and open markets. Consumers appreciate low prices and convenience of unpackaged cheese, as
they can purchase the exact quantity they desire and taste products prior to purchase.
Grupo Gloria, with its Bonlé brand, remained as the leading player in cheese in Peru in 2010,
accounting for 41 percent of the total retail value. Company’s position was based on the good
quality of its products, their product availability through both modern and traditional retail
channels, highly innovative products and affordable prices.
Local players are expected to introduce low-calorie and value-added products, in order to target
health-conscious, upper-middle, and high income consumers. In addition, busier lifestyle,
especially in urban areas, is likely to result in more middle income consumers relying on
supermarkets/hypermarkets to obtain both packaged and unpackaged cheese.
Peru is expected to have a $6 per capita consumption of drinking yogurt in 2011, substantially
lower than that of other countries in the region, such as Uruguay and Brazil, which are expected to
see corresponding figures of $26 and $12, respectively. This shows that potential exists for
expansion in Peru.
Drinking yoghurt is very popular in Peru and expected to capture 71 percent of market share of
total yogurt sales in 2011. Drinking yogurt is consumed both by adults and teenagers. In contrast,
yogurt in conventional type of container is less popular and is mainly consumed as a snack by
children.
Grupo Gloria remained the leading player of yoghurt in Peru in 2010, accounting for 82 percent
market share of Peru’s total yoghurt sales. The company benefitted from its longstanding presence
in the country, excellent distribution network, good segmentation, frequent product innovation and
strong advertising.
Health concerns and a desire to keep fit will drive demand for yogurt. It is expected that
companies will focus on increasing the availability of pro/pre biotic and low-calorie products, in
order to appeal to health conscious consumers.
Beer
In 2010, beer accounted for 95 percent of the total consumption of alcoholic drinks in Peru, in
terms of volume. The popularity of this product is based on its appeal to every socio-economic
segment, its wide accessibility, intense competition amongst beer companies – which resulted in
prices decreasing from 2001 to 2010 – and frequent product innovation to better meet Peruvian
consumers’ tastes. Nevertheless, Peru’s per capita consumption of beer stood at 42 liters in 2010,
which was still below the average of the Latin American region, and significantly lower than Brazil
and Mexico, which had 65 and 61 liters per capita consumption respectively. In order to increase
beer consumption in Peru, beer companies are promoting the idea that beer is suitable to drink
with meals, the concept already being practiced in other Latin American countries.
Glass bottles is the most popular packaging style used in Peru, due to tradition and preservation of
flavor. Beer in aluminum cans is mostly for individual consumption, while bottled beer is shared by
several people. Canned beer carries the highest unit price.
Imported premium lager was the fastest-growing category, up 6 percent in volume in 2010
compared with a year ago level. Imported premium lager constitutes a niche segment in Peru,
accounting for less than 1 percent of beer consumption in 2010, due to the strong tradition of
consuming domestic beers, the high price of imported premium lagers and their limited
distribution. Nevertheless, as Peru has the second lowest per capita consumption of imported
premium lager in Latin America, it has a good potential to grow, as Peruvian consumers’
purchasing power grows and the availability of the products through modern retail channels
increases.
Product innovation and further segmentation are the trends expected in this category. Local
companies will continue to develop new flavors to better meet upper-income consumers’
preferences and as a tool to strengthen current premium brands. Advertising and promotions are
used to penetrate the market.
Wine
Thanks to the consumer education, wine consumption has continued to expand in Peru in 2010.
Wine companies have proactively participated in wine promotional activities held in
supermarkets/hypermarkets and the trade press, and educated consumers about wine-dish
combinations, the wine temperature that guarantees wine’s preservation, and health benefit of
wine, etc.
During 2010, wine sales achieved a 9 percent growth in terms of volume, after a drop of the same
magnitude during the previous year. In 2010, as the Peruvian economy gradually recovered from
the slowdown registered in 2009, consumers benefited from higher incomes and therefore
increased their purchases of wine. Some consumers traded up to more expensive brands.
Red wine is still the leading category accounting for 73 percent of total wine sales in terms of
volume, registering the fastest growth of 10 percent in terms of volume in 2010. The performance
can be explained by the increased availability of good-quality red wines at affordable prices,
through supermarkets/hypermarkets and liquor stores that periodically carry promotions and price
discounts to boost sales.
Men and women between 25 and 45 years of age are considered to be major wine consumers.
There are two different types of consumers in Peru: the first one are low and middle income
consumers, who do not have the habit of drinking wine, and prefer the sweetest flavor provided by
Burgundy variety of wines. The second type of consumers belongs to middle-high to high
socioeconomic segments, have a long wine culture and prefer dry wines and know which type of
wine is suitable for different meals as well as the appropriate temperature for drinking it. Demands
for wine among women are rising, as more women join the workforce and earn higher income.
Baked Goods
Baked goods, in particular bread, are a staple in Peruvian diet. Traditionally, most consumers
choose artisanal bread (what is artisanal bread?) as they appreciate its freshness. A typical
Peruvian buys bread at least once a day for breakfast, children’s lunch, and afternoon tea.
Artisanal bread can be found at small grocers, bakeries, andsupermarkets/hypermarkets.
It is expected to achieve a growth of 2 percent in retail volume for these products in 2011, which is
in line with the performance registered the previous year. This moderate performance is explained
by the fact that the largest category, artisanal bread, is a mature one, and therefore its growth
follows the population growth.
Packaged/industrial bread is expected to be the fastest-growing category in 2011, with a value
growth of 7 percent. Even if consumers prefer the freshness provided by artisanal bread, some
high- and middle-income consumers are gradually turning towards packaged bread, either because
they appreciate the value-added features provided such as wheat bread or fortified bread or
because hectic lives favor the consumption of such products (as packaged bread has a longer
shelf-life than artisanal bread).
Although artisanal bread will continue driving sales of the category, as it will continue to represent
the main product sold within baked goods, there is a good potential for developing
packaged/industrial products, as high- and middle-income consumers become more concerned
about health issues and seek for products that can help them keep a healthy diet. Consumers in
urban areas living busier lifestyles will also increase their demands for packaged products.
Biscuits
Biscuit is expected to obtain a 6 percent growth in sales in terms of value during 2011, which is in
line with the performance registered the previous year. Savory biscuits and crackers are expected
to be the fastest-growing category in 2011, with a 7 percent growth. This performance can be
explained by the fact that savory biscuits effectively addressed the trend towards innovation, in an
effort to expand its consumer base. In addition, busier lifestyles favored the consumption of
crackers as some people turn to them as a substitute of artisanal bread at breakfast and consume
it at their workplaces.
Alicorp and Kraft Foods led sales in 2010, with a market share of 33 percent each with Alicorp
slightly leading. Their privileged position is explained by the longstanding presence of their most
representative brands.
Private labels offered by supermarkets/hypermarkets such as Wong, Metro, and Plaza Vea focus on
offering products within the most affordable categories such as savory biscuits and sandwich
biscuits. In addition, since 2009, they have adopted the strategy of favoring the companies
thatoffer discounts for bulk sales. In 2010, private label accounted for only 2 percent of the total
retail sales.
As consumers increasingly become health conscious, product innovation will be focused on value-
added products that provide, for example, fewer calories or contain extra fibre. In addition,
companies will try to update their portfolios with more premium biscuits that can attract
consumers who are not willing to spend more money on expensive chocolate confectionery.
Frozen Processed Food
Peru is the country with the lowest per capita consumption of frozen processed food in Latin
America. Traditionally, Peruvian consumers prefer to consume fresh food which is generally
purchased daily at wet markets and independent small grocery stores. Peruvian consumers are not
only attracted to the natural flavor of fresh food, but they also believe that fresh ingredients
contain higher nutrition value than frozen food. This cultural norm stands against the development
of frozen processed food in the country. Despite this, however, the increasingly hectic lifestyles of
Peruvians living in urban areas and the increasing numbers of women joining the Peruvian
workforce determine that more consumers are now purchasing frozen processed food as it is a
category which constitutes practical meal solutions and convenient ingredients.
Frozen processed red meat and frozen processed poultry are the most popular categories in frozen
processed food in Peru, together accounting for 95 percent of total retail sales. Frozen hamburgers
are easy to prepare and cheaper than hamburgers eaten at restaurants. Frozen chicken meat is
also popular in Peru as it comes with wide range of product presentations which include burgers,
nuggets, fillets and breaded chicken.
Frozen processed food is set to increase in value by 9 percent during 2011, commensurate with
the value growth registered during 2010. The rising need for convenient packaged food products is
combined with the increase in affordable frozen processed food options, especially under private
label.
Supermarkets/hypermarkets represent the predominant distribution channel for frozen processed
food in Peru, accounting for 85 percent of total retail sales in terms of value during 2011, while
bodegas (traditional food retail channel) accounted for the remaining 15 percent. This can be
explained by the fact that supermarkets/hypermarkets generally have the refrigeration equipment
required to adequately preserve frozen processed food, while very few bodegas can afford to invest
in this type of equipment. Furthermore, manufacturers of frozen processed food are not interested
in providing the refrigeration equipment to small grocers as low demand would hardly justify the
expense.
Frozen processed food will be a beneficiary of fast changing lifestyle of urban Peruvians, as they
increasingly become interested in packaged food products which demand less preparation time.
Furthermore, the growing trends towards wellness and health will enhance Peruvians’ demands for
value added and low-calorie products.
Breakfast cereals
Whereas in the past breakfast cereals in Peru were mainly purchased by upper income consumers
due to their high prices, in recent times manufacturers have responded to the expansion of the
middle income segment and introduced more affordable variants in smaller package sizes. This
trend continued during the review period, helping to maintain growth in retail sales, both in volume
and in value. Another notable trend in breakfast cereals was the launch of new health and wellness
products made from wheat or fortified with ingredients that provide functional health benefits. This
trend was especially strong in the hot cereal category, where consumers can now purchase added
value products fortified with ingredients that have traditionally had a very healthy image in Peru.
Sales of breakfast cereals are expected to register a 7 percent in 2011. As more people live in
urban areas and lead busier lifestyles, they try to take a balanced breakfast by increasing their
consumption of this types of product.
Domestic company Global Alimentos SAC led sales in 2010, with a 28 percent share in value. The
privileged position of the company is explained by its wide range of products at affordable prices
that successfully attracted middle-income consumers. In addition, the company was the first to
offer flexible packages and different package sizes to adjust to Peruvian consumers’ preferences.
Canned Preserved Food
Canned/preserved fish/seafood is the most popular category in canned/preserved food in Peru,
accounting for 76 percent of total canned/preserved food retail sales. Moreover, Peru has the third
highest per capita consumption of canned/preserved fish/seafood in Latin America. This can be
explained by several reasons. First, Peru is a coastal country on the Pacific Ocean and as most of
its population lives in close proximity to the coast, they are used to consuming fish and seafood.
Second, canned/preserved fish has a well established widespread distribution channel both within
traditional and modern grocery retail stores. Third, canned/preserved fish/seafood benefits from
intense competition which determines that unit prices remain fairly stable and the leading
companies generally launch new products quite regularly. The most common types of canned fish
in Peru include tuna, mackerel, sardines and anchovies, all of which can easily be preserved either
in oil or in water.
Canned/preserved food is set to increase by 7 percent in value during 2011. This growth will be
higher than the 5 percent value growth recorded during 2010. Products in canned/preserved food
are gradually increasing in popularity as more consumers value the convenience it offers. Higher
incomes allow consumers to purchase more canned/preserved food.
GW Yichang & Cia SA led sales of canned/preserved food in Peru during 2010 with a market share
of 30 percent, thanks to the popularity and high quality of its Florida brand within
canned/preserved fish/seafood and the high level of distribution the brand has achieved within the
country’s main distribution channels.
Domestic companies have a strong hold on canned/preserved food, since fishing and agriculture
are main economic activities in Peru, which gives them a significant advantage over the
multinationals. In addition, domestic companies are first to introduce product innovations, such as
canned fish in tomato sauce, or a spicy sauce of tomatoes, ají and onions. Furthermore, the prices
of the domestic brands are considerably more affordable than the international ones, thus
attracting low- and middle-income consumers.
Dried Processed Food
Dried processed food accounted for 11 percent of total retail value sales in packaged food in Peru
during 2011. This performance can be explained by the fact that rice is a staple in the Peruvian
diet and is an essential item for lunch and dinner across every socioeconomic segment in the
country. It is also worth noting that middle income and low income consumers in Peru still prefer
unpackaged rice as it carries substantially lower unit prices than packaged options and it can be
purchased the exact weight desired such as 200g, 500g or any weight which suits the individual
customer. Rice companies offer several different package sizes and types of rice with a variety of
prices that include economy, standard, and premium, in order to cater to the widely varying
preferences and budgets of Peruvian consumers.
Dessert mixes accounts for less than 1 percent of retail sales of dried processed food in Peru.
There are two main underlying reasons for this situation. First, the most popular dessert mix is
jelly, which carries very low unit prices. Jelly benefits from its widespread availability and appeals
mainly to low income and middle income consumers. Second, busier lifestyles coupled with higher
disposable incomes determine that middle income consumers generally purchase ready-to-eat
desserts, many of which are artisanal products prepared at bakeries and independent small
grocers, rather than taking the time to prepare a dessert at home.
Alicorp led in 2010 with a 32 percent market share in overall dried food thanks to its strong
presence in pasta. In rice and dessert mixes Corporación Transcontinental del Perú SAC led in Peru
during 2010 with a 42 percent share thanks to the popularity of its Costeño brand in rice. This
brand is appreciated for its high quality and also benefits from an excellent distribution network
within both traditional and modern retail channels. Furthermore, the company has a well-balanced
product portfolio with premium, standard and economy varieties which allows the company’s
products to appeal to different socioeconomic segments.
Oils and Fats
Vegetable oil and oil (do you mean rape oil?), which remained the most popular oils and fats
category in Peru is expected to account for an 85 percent share of retail sales in volume in 2011.
Vegetable and rape oil is a staple in most households in Peru and is traditionally used on a daily
basis in the preparation of meals. There is a wide array of brands and packaging sizes available
targeting low, middle and upper income consumers. Moreover, vegetable and rape oil is widely
available both within traditional and modern grocery retail outlets. Despite this, more niche
categories offered the best opportunity for higher growth. Producers focused on developing
healthier options, such as low-calorie products and fortified products, in order to retain the interest
of health-conscious consumers.
This category is expected to register retail sales growth of 9 percent in value in 2011, compared to
the decline of 1 percent seen in 2010. In terms of retail sales in volume, oils and fats are expected
to see growth of 3 percent in 2011, similar to that seen in 2010. As such, the strong retail sales
growth in terms of volume is expected in 2011 which will be largely driven by price increases. The
largest category, vegetable and rape oil is only expected to see modest retail sales growth of 3
percent in 2011, as a result of upper income consumers migrating to healthier alternatives, such
as olive oil.
The local company Alicorp remained the leading player in oils and fats in 2010, accounting for 56
percent of market share in value . Alicorp continued to enjoy a very strong position in vegetable
and seed oil, the largest category. The company offered a well balanced portfolio of brands,
including Primor, Cocinero, Capri, Cil and Friol, which targeted different segments. In addition, the
company’s excellent distribution network ensured its presence through every grocery retail
channel.
Peru was expected to have the third lowest per capita consumption of olive oil within Latin America
in 2011, at 0.3kg. This represents an attractive opportunity for companies to increase penetration
by offering more affordable options to middle income consumers, whose interest in consuming
olive oil increased over the review period, due to the health benefits it offers.
Ready Meals
Peru is the country with the lowest per capita consumption of ready meals in Latin America, mainly
due to two reasons. Firstly, traditionally, Peruvians prefer consuming fresh food, as they perceive it
to be more nutritious than frozen products or ready meals. Secondly, the high prices of these
products represent a big obstacle to their development: there are many affordable options at
foodservice establishments, which can be cheaper than a ready meal or include several courses
like an appetizer, main meal and soft drink. Despite this, time constraints of Peruvians living in
urban areas; cause some of them to turn to ready meals. Due to the small size of the ready meals
market, there are plenty of opportunities for other brands to enter the market and rapidly gain
considerable share.
It is expected to increase ready meals value by 5 percent during 2011, which will be a slightly
better performance than the 4 percent value growth registered during 2010. However, the 2
percent volume growth expected in 2011 is set to be in line with the 2 percent volume growth
recorded in 2010. This suggests that increasing unit prices is the main factor behind the higher
value growth expected in 2011. There was no significant investment by any of the major
companies in ready meals during 2010 or the first half of 2011.
Dried ready meals are expected to be the fastest growing category in ready meals in Peru during
2011, increasing by 5 percent in value. Dried ready meals continue to benefit from the fact that
there are several traditional Peruvian dishes available in dried ready meals. Therefore, many
consumers in search of practical options for a quick meal which offers a familiar taste, are
attracted by dried ready meals.
Local company Redondos leads ready meals in Peru thanks to its wide range of ready meals based
on traditional Peruvian dishes. Moreover, these products are offered in canned/preserved format
and are therefore ready to be consumed after heating, a factor which appeals to the convenience
that many upper income Peruvian are in search of. It is worth noting that, given the small size of
ready meals in Peru, there remain ample possibilities for other brands to enter the category and
quickly gain a significant value share.
Sauces, dressings and condiments
Peruvian consumers are very fond of spicy sauces to complement their meals. However,
traditionally Peruvian consumers rely on home-made sauces which use Peruvian ingredients, such
as different types of ají (a spicy ingredient which can be yellow, red or orange), or rocoto (another
spicy Peruvian ingredient, which is red). However, packaged sauces, dressings and condiments
registered healthy rates of growth in recent years, based on several factors. Firstly, local company
Alicorp SAA has been at the forefront of the development of sauces which look to capture the
flavour of home-made sauce, but offer the practicality of a ready-to-use sauce. Its most successful
launches have been a Peruvian-style mayonnaise, a rocoto sauce and ají sauce. Secondly, busier
lifestyles, especially in urban households, meant that a growing number of Peruvian consumers
relied on sauces, dressing and condiments to save time when cooking. Thirdly, companies have
eagerly launched a good variety of packaging formats and sizes, targeting every socio-economic
segment.
It is expected to growth 7 percent in 2011, which will be slightly above of 2010 results. Peruvian
consumers are increasingly relying on products in sauces, dressings and condiments as opposed to
those that are artisanally produced, owing to concern about the sanitary conditions in which
artisanal products are made. Moreover, leading companies in sauces, dressings and condiments
offer periodic discounts on bulk sales and products in a variety of packaging size formats in order
to meet the budgetary requirements of different consumers.
Soy based sauces is expected to register the strongest current retail value growth, of 8 percent, in
sauces, dressings and condiments in 2011. However, in terms of retail volume growth, this
category is expected to register growth of only 4 percent.
Like in other categories, Alicorp was the leading player in sauces, dressings and condiments in
2010 with a retail value share of 41 percent. The company has cultivated loyalty among many
consumers due to its offer of good quality products that are carefully developed according to
traditional homemade recipes. In addition, the company benefits from a widespread distribution
network, its affordable product pricing and its wide array of packaging formats and packaging
sizes, as a result of which its products meet the needs of a wide base of Peruvian consumers.
Consumer migration from artisanal to branded packaged products, the continued search for
increasingly convenient products, increased availability of products and new product development
in line with the tastes of Peruvian consumers are all factors that are expected to help to boost
demand for sauces, dressings and condiments in the future.
Spreads
Jams and preserves remained the dominant category within spreads in terms of retail volume
sales. Jams and preserves are a traditional part of the Peruvian diet, usually consumed at
breakfast and teatime. Rising health awareness and public concern over diet-related conditions like
obesity and diabetes led to increased demand for jams and preserves products with reduced sugar
content. Another notable trend in the category was the introduction of new flavour variants based
on traditional Peruvian plants and fruits like coca and aguaymanto by smaller local companies.
In 2011, spreads is expected to achieve an 8 percent value growth, which is above the 6 percent
growth achieved the previous year. Upper-income consumers continue to increase their demand
for categories that constitute niches such as chocolate and nut-based spreads. In addition, higher
incomes have resulted in some middle-income consumers opting to buy larger packaging formats
or beginning to demand low-calorie versions of their preferred jams and preserves.
Grupo Gloria continued to lead sales in 2010 with a value share of 33 percent, due to its
longstanding presence in the market and the availability of different packaging formats and sizes
within traditional and modern retail grocers to appeal to a large consumer base. Ranking in second
position was GW Yichang & Cia with a 25 percent value share. This company frequently introduces
new flavors and has developed an interesting line of light brands to meet preferences of health-
conscious consumers.
Sweet and Savory Snacks
Per capita volume consumption of sweet and savory snacks in Peru is relatively low compared to in
other countries in Latin America thus there are plenty of possibilities for further development of the
category through the launch of products that better meet the preferences of Peruvian consumers.
Peru has the third lowest per capita consumption of sweet and savory snacks in the region,
standing at 0.5kg, while the average for the region is nearly 1.5kg. This determines that there are
plenty of opportunities for the category to develop. The latest focus of the main companies in the
category was the launch of products which better met Peruvians’ tastes and preferences. This
trend began in 2008 with the launch of chips based on native Peruvian potatoes by Snacks America
Latina SRL, a move which was later replicated by local companies such as Deprodeca SAC. Snacks
America Latina SRL remained the undisputed leading player in sweet and savory snacks in 2010,
with a retail value share of 59 percent. Its leading position is due to its strong distribution network,
the offer of products in various packaging sizes and frequent product innovation in order to better
satisfy the preferences of Peruvian consumers
Product innovation is expected to continue to boost demand for products in sweet and savory
snacks over the forecast period. It is expected that multinational player Snacks America Latina SRL
will continue to update its product portfolio with brand extensions and new product launches that
develop niche categories
Section III. Competition
Source: World Trade Atlas (2010)
Peru grants tariff preferences to the Andean Community of Nations (CAN - Bolivia, Colombia
and Ecuador), and to Mexico, Paraguay, Argentina, Brazil, Uruguay and Cuba.
Peru’s trade policy is oriented towards open markets. Peru has signed different commercial
and trade agreements, while others have not entered into force yet and just a few still in
negotiations:
Country Type Status
Andean Community (Bolivia, Ecuador
and Colombia) Free Trade Agreement In force
MERCOSUR (Argentina, Brasil, Uruguay,
Paraguay)
Economic Complementation
Agreement In force
Cuba Economic Complementation
Agreement In force
Chile Free Trade Agreement In force
Mexico Trade Integration Agreement In force
United States Free Trade Agreement In force
Canada Free Trade Agreement In force
Singapore Free Trade Agreement In force
China Free Trade Agreement In force
South Korea Free Trade Agreement In force
European Free Trade Association (EFTA) Free Trade Agreement In force
Thailand Third Protocol To come into
force
Japan Economic Partnership Agreement To come into
force
European Union Free Trade Agreement To come into
force
Costa Rica Free Trade Agreement To come into
force
Panama Free Trade Agreement To come into
force
Guatemala Free Trade Agreemnent Negotiating
El Salvador Free Trade Agreemnent Negotiating
Honduras Free Trade Agreemnent Negotiating
The PTPA reinforces U.S. competitiveness within the Peruvian market. The quality of U.S.
products is already appreciated among the high-end consumers.
For a complete list of products that have benefited from PTPA, please check
http://www.ustr.gov/Trade_Agreements/Bilateral/Peru_TPA/Section_Index.html.
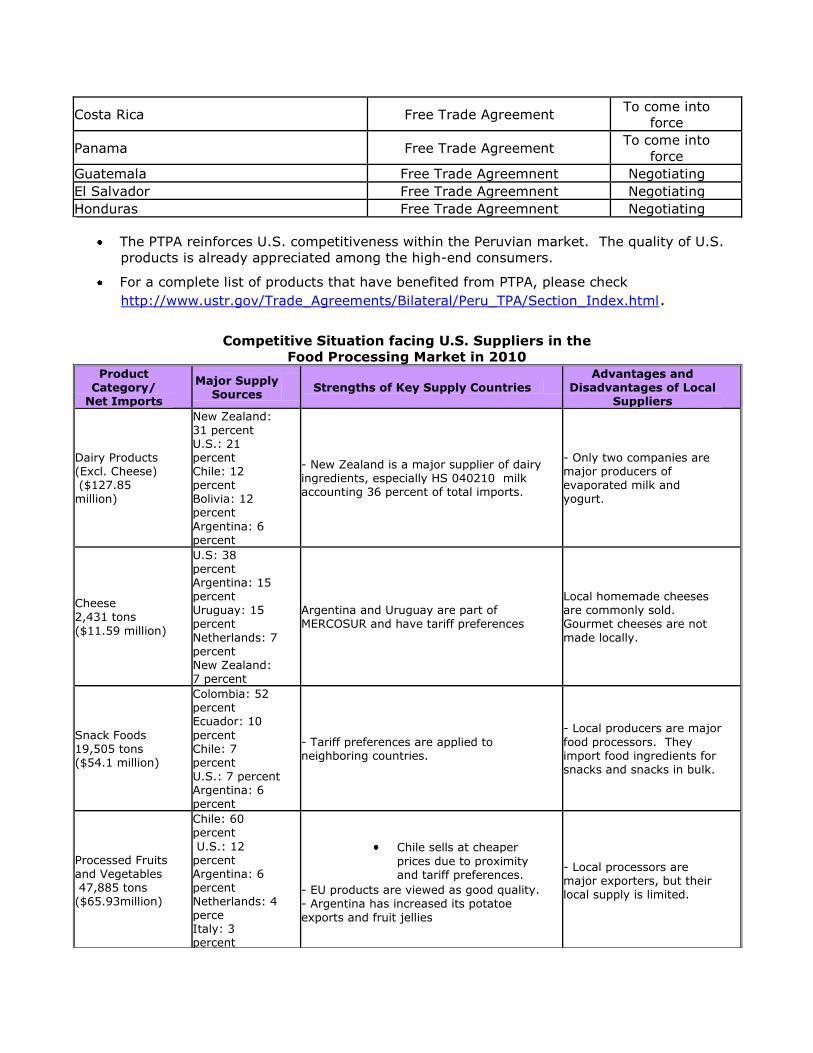
Competitive Situation facing U.S. Suppliers in the
Food Processing Market in 2010
Product Category/
Net Imports
Major Supply Sources
Strengths of Key Supply Countries
Advantages and Disadvantages of Local
Suppliers
Dairy Products (Excl. Cheese) ($127.85 million)
New Zealand: 31 percent U.S.: 21 percent Chile: 12 percent Bolivia: 12 percent
Argentina: 6 percent
- New Zealand is a major supplier of dairy ingredients, especially HS 040210 milk accounting 36 percent of total imports.
- Only two companies are major producers of evaporated milk and yogurt.
Cheese
2,431 tons
($11.59 million)
U.S: 38 percent Argentina: 15 percent Uruguay: 15 percent
Netherlands: 7 percent New Zealand: 7 percent
Argentina and Uruguay are part of MERCOSUR and have tariff preferences
Local homemade cheeses are commonly sold. Gourmet cheeses are not
made locally.
Snack Foods
19,505 tons ($54.1 million)
Colombia: 52 percent Ecuador: 10
percent Chile: 7 percent U.S.: 7 percent Argentina: 6 percent
- Tariff preferences are applied to neighboring countries.
- Local producers are major
food processors. They import food ingredients for snacks and snacks in bulk.
Processed Fruits and Vegetables
47,885 tons ($65.93million)
Chile: 60 percent
U.S.: 12 percent Argentina: 6 percent Netherlands: 4 perce
Italy: 3 percent
Chile sells at cheaper
prices due to proximity and tariff preferences.
- EU products are viewed as good quality. - Argentina has increased its potatoe
exports and fruit jellies
- Local processors are major exporters, but their local supply is limited.
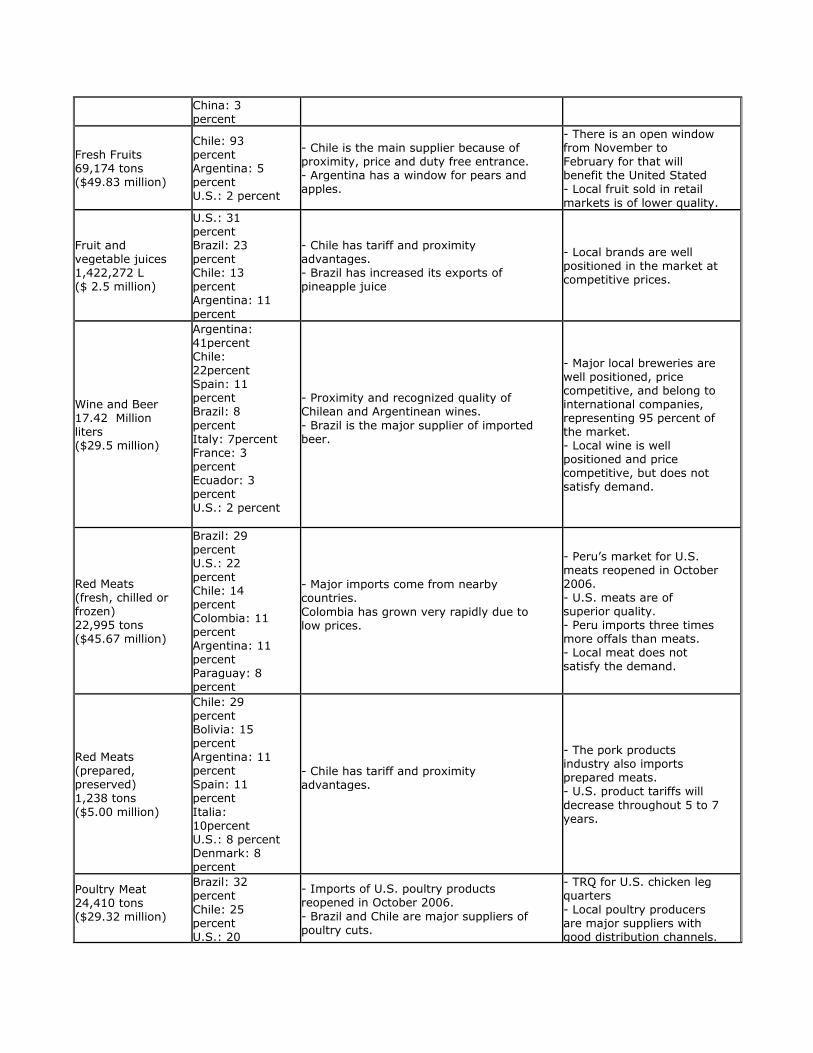
China: 3 percent
Fresh Fruits
69,174 tons ($49.83 million)
Chile: 93 percent Argentina: 5 percent U.S.: 2 percent
- Chile is the main supplier because of proximity, price and duty free entrance. - Argentina has a window for pears and apples.
- There is an open window from November to February for that will benefit the United Stated
- Local fruit sold in retail
markets is of lower quality.
Fruit and vegetable juices
1,422,272 L
($ 2.5 million)
U.S.: 31 percent Brazil: 23 percent Chile: 13 percent Argentina: 11
percent
- Chile has tariff and proximity advantages. - Brazil has increased its exports of pineapple juice
- Local brands are well positioned in the market at competitive prices.
Wine and Beer 17.42 Million liters ($29.5 million)
Argentina: 41percent Chile: 22percent Spain: 11 percent Brazil: 8
percent Italy: 7percent France: 3 percent Ecuador: 3 percent U.S.: 2 percent
- Proximity and recognized quality of Chilean and Argentinean wines.
- Brazil is the major supplier of imported beer.
- Major local breweries are well positioned, price competitive, and belong to international companies, representing 95 percent of the market. - Local wine is well positioned and price competitive, but does not satisfy demand.
Red Meats (fresh, chilled or frozen) 22,995 tons ($45.67 million)
Brazil: 29 percent U.S.: 22 percent Chile: 14 percent Colombia: 11 percent Argentina: 11 percent Paraguay: 8 percent
- Major imports come from nearby countries.
Colombia has grown very rapidly due to low prices.
- Peru’s market for U.S. meats reopened in October 2006. - U.S. meats are of superior quality. - Peru imports three times more offals than meats. - Local meat does not satisfy the demand.
Red Meats (prepared, preserved) 1,238 tons
($5.00 million)
Chile: 29 percent Bolivia: 15 percent Argentina: 11 percent Spain: 11 percent
Italia: 10percent U.S.: 8 percent Denmark: 8 percent
- Chile has tariff and proximity advantages.
- The pork products industry also imports prepared meats. - U.S. product tariffs will
decrease throughout 5 to 7 years.
Poultry Meat 24,410 tons ($29.32 million)
Brazil: 32 percent
Chile: 25 percent U.S.: 20
- Imports of U.S. poultry products reopened in October 2006.
- Brazil and Chile are major suppliers of poultry cuts.
- TRQ for U.S. chicken leg quarters
- Local poultry producers are major suppliers with good distribution channels.
percent Argentina: 16 percent Bolivia: 8 percent
- Imports are mainly chicken and turkey parts.
Note: Net imports correspond to the three food sectors: Food Service, Retail and Food Processing.
Source: World Trade Atlas
Section IV. Best Product Prospects
Source: World Trade Atlas (2010)
A. Products Present in the Market Which Have Good Sales Potential:
Product/ Product Category
Market Size 2010
est.
Imports 2010
Average Annual Import Growth
(2005-10)
Import Tariff Rate
Key Constraints Over Market Development
Market Attractiveness for the U.S.
Cheese (HS 0406)
18,480 MT
2,341 tons
14.4 percent
040610, 20 and
- U.S. competitors are: Uruguay
- U.S. cheeses are mainly used in the
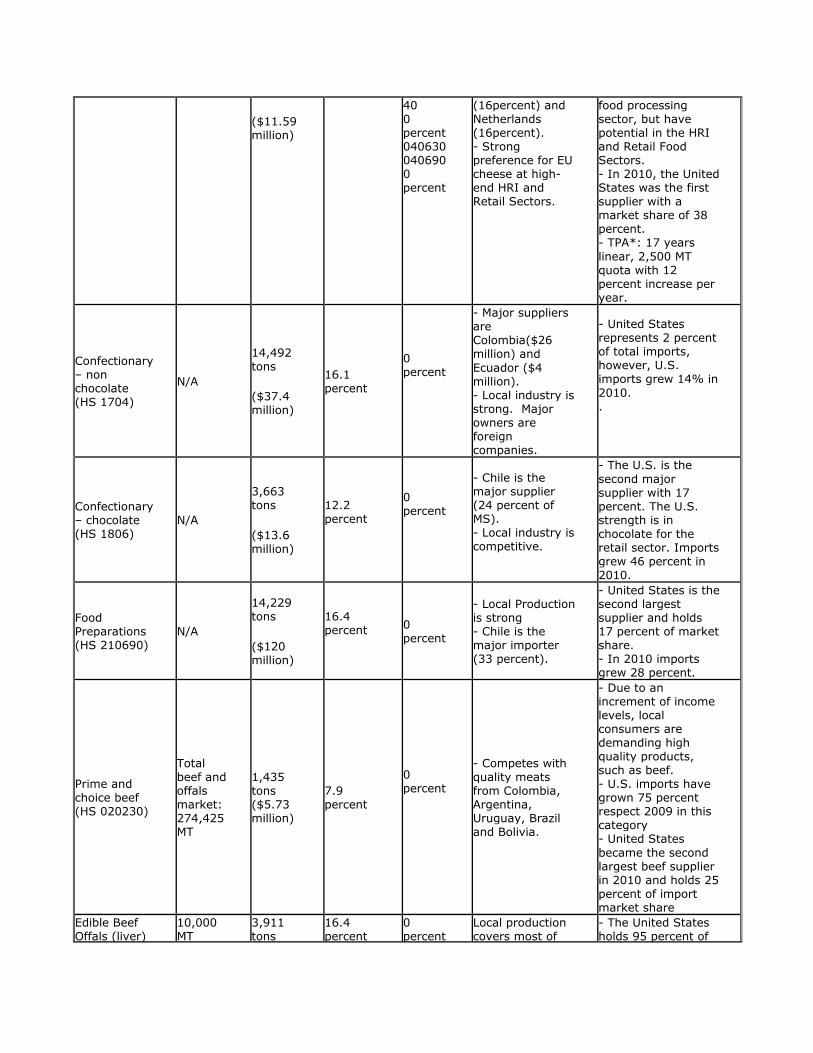
($11.59 million)
40 0 percent 040630 040690 0 percent
(16percent) and Netherlands (16percent). - Strong preference for EU cheese at high-end HRI and Retail Sectors.
food processing sector, but have potential in the HRI and Retail Food Sectors. - In 2010, the United States was the first supplier with a market share of 38 percent. - TPA*: 17 years
linear, 2,500 MT quota with 12 percent increase per year.
Confectionary – non chocolate (HS 1704)
N/A
14,492 tons ($37.4 million)
16.1 percent
0 percent
- Major suppliers are Colombia($26 million) and
Ecuador ($4 million). - Local industry is strong. Major owners are foreign companies.
- United States represents 2 percent of total imports, however, U.S. imports grew 14% in
2010. .
Confectionary – chocolate (HS 1806)
N/A
3,663 tons ($13.6 million)
12.2 percent
0 percent
- Chile is the major supplier (24 percent of MS). - Local industry is competitive.
- The U.S. is the
second major supplier with 17 percent. The U.S. strength is in chocolate for the retail sector. Imports grew 46 percent in 2010.
Food Preparations (HS 210690)
N/A
14,229 tons ($120 million)
16.4 percent
0 percent
- Local Production is strong - Chile is the major importer (33 percent).
- United States is the second largest supplier and holds 17 percent of market share. - In 2010 imports grew 28 percent.
Prime and choice beef (HS 020230)
Total beef and offals market: 274,425 MT
1,435 tons ($5.73 million)
7.9 percent
0 percent
- Competes with quality meats from Colombia, Argentina, Uruguay, Brazil and Bolivia.
- Due to an increment of income levels, local consumers are demanding high quality products, such as beef. - U.S. imports have grown 75 percent respect 2009 in this category - United States
became the second largest beef supplier in 2010 and holds 25 percent of import market share
Edible Beef Offals (liver)
10,000 MT
3,911 tons
16.4 percent
0 percent
Local production covers most of
- The United States holds 95 percent of
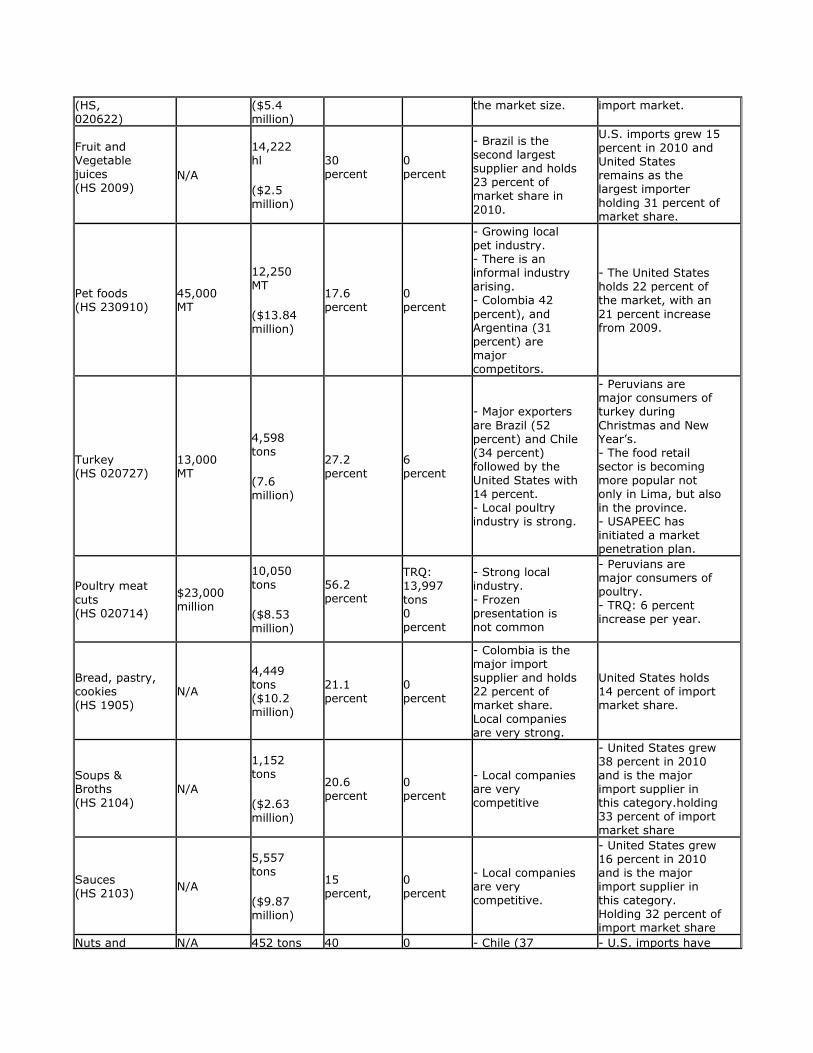
(HS, 020622)
($5.4 million)
the market size. import market.
Fruit and Vegetable juices (HS 2009)
N/A
14,222 hl ($2.5 million)
30 percent
0 percent
- Brazil is the second largest supplier and holds 23 percent of market share in
2010.
U.S. imports grew 15 percent in 2010 and United States remains as the largest importer
holding 31 percent of market share.
Pet foods (HS 230910)
45,000 MT
12,250 MT ($13.84 million)
17.6 percent
0 percent
- Growing local pet industry. - There is an informal industry arising. - Colombia 42
percent), and Argentina (31 percent) are major competitors.
- The United States holds 22 percent of the market, with an
21 percent increase from 2009.
Turkey (HS 020727)
13,000 MT
4,598 tons (7.6 million)
27.2 percent
6 percent
- Major exporters
are Brazil (52 percent) and Chile (34 percent) followed by the United States with 14 percent. - Local poultry industry is strong.
- Peruvians are major consumers of turkey during
Christmas and New Year’s. - The food retail sector is becoming more popular not only in Lima, but also in the province. - USAPEEC has initiated a market penetration plan.
Poultry meat
cuts (HS 020714)
$23,000 million
10,050 tons ($8.53 million)
56.2 percent
TRQ: 13,997
tons 0 percent
- Strong local industry. - Frozen presentation is not common
- Peruvians are major consumers of poultry. - TRQ: 6 percent increase per year.
Bread, pastry, cookies (HS 1905)
N/A
4,449 tons ($10.2 million)
21.1 percent
0 percent
- Colombia is the major import supplier and holds 22 percent of market share. Local companies are very strong.
United States holds 14 percent of import market share.
Soups & Broths (HS 2104)
N/A
1,152 tons ($2.63 million)
20.6 percent
0 percent
- Local companies are very competitive
- United States grew 38 percent in 2010 and is the major import supplier in this category.holding 33 percent of import market share
Sauces (HS 2103)
N/A
5,557 tons ($9.87 million)
15 percent,
0 percent
- Local companies are very competitive.
- United States grew 16 percent in 2010 and is the major import supplier in this category. Holding 32 percent of import market share
Nuts and N/A 452 tons 40 0 - Chile (37 - U.S. imports have
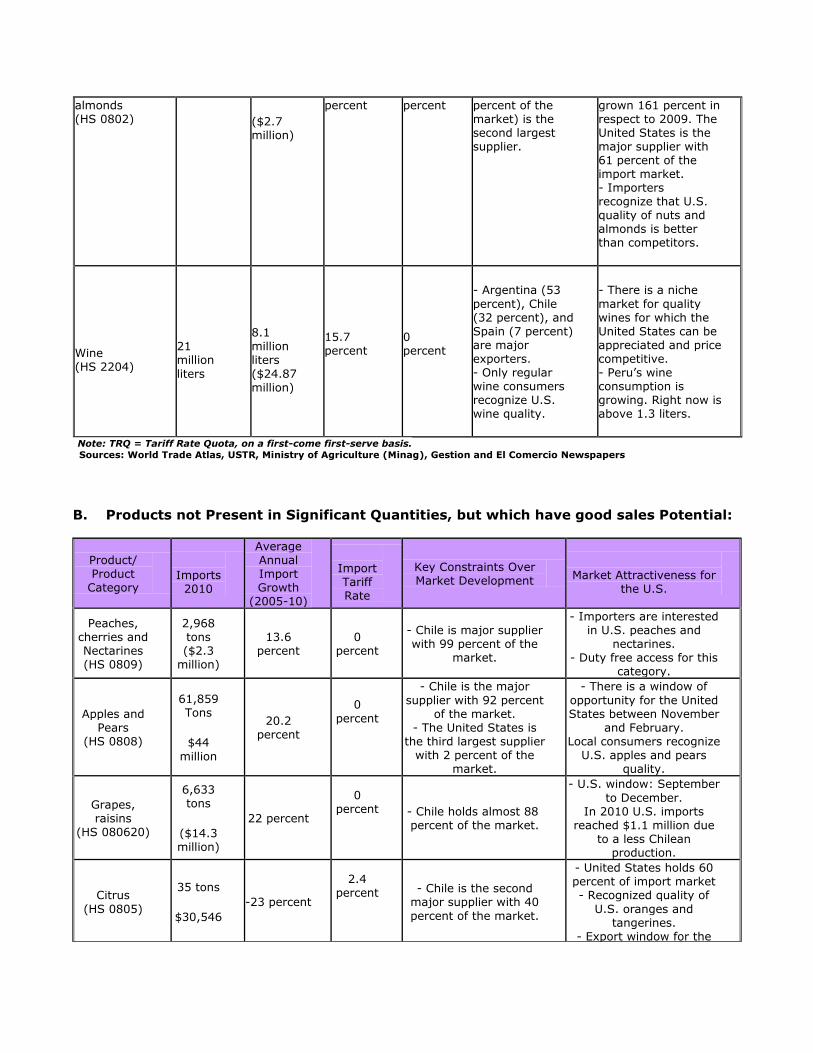
almonds (HS 0802)
($2.7 million)
percent percent percent of the market) is the second largest supplier.
grown 161 percent in respect to 2009. The United States is the major supplier with 61 percent of the import market. - Importers recognize that U.S. quality of nuts and almonds is better than competitors.
Wine (HS 2204)
21 million
liters
8.1 million liters ($24.87 million)
15.7 percent
0 percent
- Argentina (53
percent), Chile (32 percent), and Spain (7 percent) are major exporters. - Only regular wine consumers recognize U.S. wine quality.
- There is a niche
market for quality wines for which the United States can be appreciated and price competitive. - Peru’s wine consumption is growing. Right now is above 1.3 liters.
Note: TRQ = Tariff Rate Quota, on a first-come first-serve basis. Sources: World Trade Atlas, USTR, Ministry of Agriculture (Minag), Gestion and El Comercio Newspapers
B. Products not Present in Significant Quantities, but which have good sales Potential:
Product/ Product
Category
Imports
2010
Average Annual Import Growth
(2005-10)
Import Tariff Rate
Key Constraints Over Market Development
Market Attractiveness for
the U.S.
Peaches, cherries and Nectarines (HS 0809)
2,968 tons ($2.3
million)
13.6 percent
0 percent
- Chile is major supplier with 99 percent of the
market.
- Importers are interested in U.S. peaches and
nectarines. - Duty free access for this
category.
Apples and Pears
(HS 0808)
61,859 Tons
$44
million
20.2 percent
0
percent
- Chile is the major
supplier with 92 percent of the market.
- The United States is the third largest supplier
with 2 percent of the market.
- There is a window of
opportunity for the United States between November
and February. Local consumers recognize
U.S. apples and pears quality.
Grapes, raisins
(HS 080620)
6,633 tons
($14.3 million)
22 percent
0 percent
- Chile holds almost 88 percent of the market.
- U.S. window: September
to December. In 2010 U.S. imports
reached $1.1 million due to a less Chilean
production.
Citrus (HS 0805)
35 tons
$30,546 -23 percent
2.4 percent
- Chile is the second major supplier with 40
percent of the market.
- United States holds 60 percent of import market - Recognized quality of
U.S. oranges and tangerines.
- Export window for the
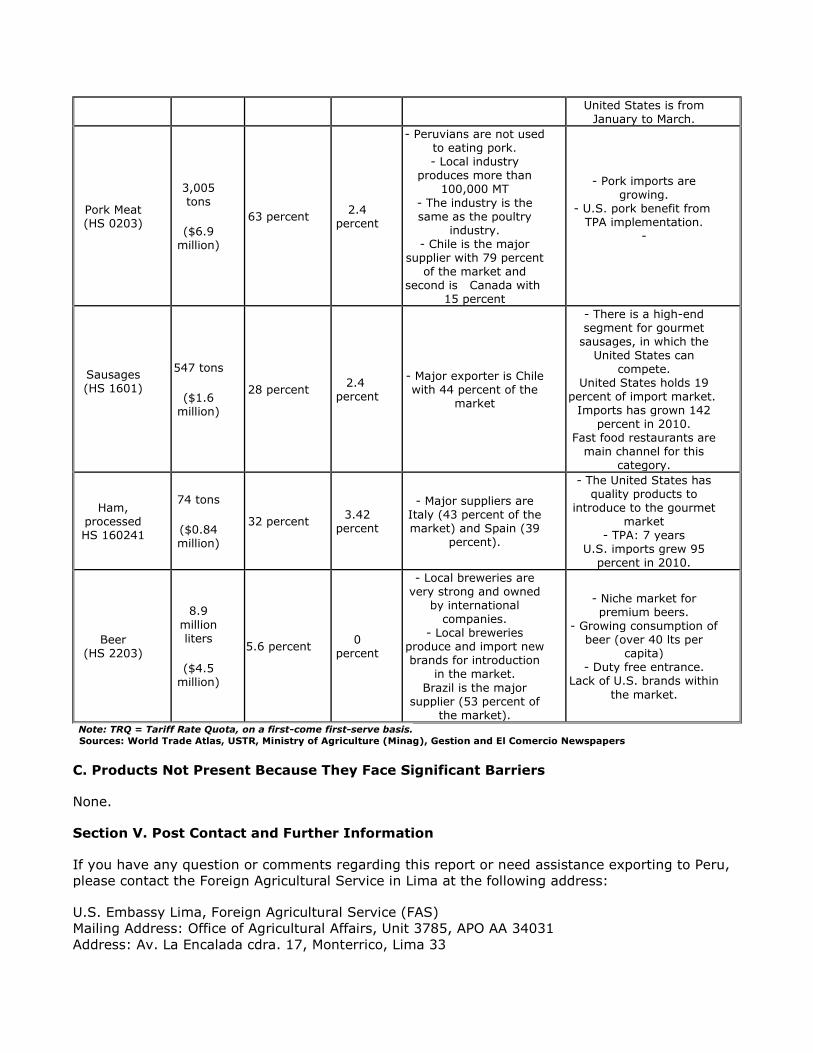
United States is from January to March.
Pork Meat (HS 0203)
3,005 tons
($6.9
million)
63 percent 2.4
percent
- Peruvians are not used to eating pork. - Local industry
produces more than 100,000 MT
- The industry is the same as the poultry
industry. - Chile is the major
supplier with 79 percent of the market and
second is Canada with 15 percent
- Pork imports are growing.
- U.S. pork benefit from TPA implementation.
-
Sausages (HS 1601)
547 tons
($1.6 million)
28 percent 2.4
percent
- Major exporter is Chile with 44 percent of the
market
- There is a high-end segment for gourmet
sausages, in which the United States can
compete. United States holds 19
percent of import market. Imports has grown 142
percent in 2010. Fast food restaurants are
main channel for this category.
Ham, processed HS 160241
74 tons
($0.84 million)
32 percent 3.42
percent
- Major suppliers are Italy (43 percent of the market) and Spain (39
percent).
- The United States has quality products to
introduce to the gourmet market
- TPA: 7 years U.S. imports grew 95
percent in 2010.
Beer (HS 2203)
8.9
million liters
($4.5
million)
5.6 percent 0
percent
- Local breweries are very strong and owned
by international companies.
- Local breweries produce and import new brands for introduction
in the market. Brazil is the major
supplier (53 percent of the market).
- Niche market for premium beers.
- Growing consumption of beer (over 40 lts per
capita) - Duty free entrance.
Lack of U.S. brands within
the market.
Note: TRQ = Tariff Rate Quota, on a first-come first-serve basis. Sources: World Trade Atlas, USTR, Ministry of Agriculture (Minag), Gestion and El Comercio Newspapers
C. Products Not Present Because They Face Significant Barriers
None.
Section V. Post Contact and Further Information
If you have any question or comments regarding this report or need assistance exporting to Peru,
please contact the Foreign Agricultural Service in Lima at the following address:
U.S. Embassy Lima, Foreign Agricultural Service (FAS)
Mailing Address: Office of Agricultural Affairs, Unit 3785, APO AA 34031
Address: Av. La Encalada cdra. 17, Monterrico, Lima 33