Peru Food Processing Ingredients 2010 - … · this report contains assessments of commodity and...
21
THIS REPORT CONTAINS ASSESSMENTS OF COMMODITY AND TRADE ISSUES MADE BY USDA STAFF AND NOT NECESSARILY STATEMENTS OF OFFICIAL U.S. GOVERNMENT POLICY Date: GAIN Report Number: Approved By: Prepared By: Report Highlights: In 2009, total sales of the 90 major food processing companies in Peru reached almost $9 billion. The food industry contracted by 0.7 percent in 2009, but private consumption rose 2.4 percent because of the impact the international financial crisis has on exports. Tariff reductions after the implementation of the U.S. - Peru Trade Promotion Agreement, supported by favorable market conditions in Peru, could significantly expand U.S. food exports in this sector, specifically for food ingredients, food preparations, snacks, confectionary, fruit and vegetable juices, dairy products, and meat products. Alvaro Loza Emiko Purdy 2010 Food Processing Ingredients Peru 12/27/2010 Required Report - public distribution
Transcript of Peru Food Processing Ingredients 2010 - … · this report contains assessments of commodity and...

THIS REPORT CONTAINS ASSESSMENTS OF COMMODITY AND TRADE ISSUES MADE BY
USDA STAFF AND NOT NECESSARILY STATEMENTS OF OFFICIAL U.S. GOVERNMENT
POLICY
Date:
GAIN Report Number:
Approved By:
Prepared By:
Report Highlights: In 2009, total sales of the 90 major food processing companies in Peru reached almost $9 billion. The food industry
contracted by 0.7 percent in 2009, but private consumption rose 2.4 percent because of the impact the international financial
crisis has on exports. Tariff reductions after the implementation of the U.S. - Peru Trade Promotion Agreement, supported
by favorable market conditions in Peru, could significantly expand U.S. food exports in this sector, specifically for food
ingredients, food preparations, snacks, confectionary, fruit and vegetable juices, dairy products, and meat products.
Alvaro Loza
Emiko Purdy
2010
Food Processing Ingredients
Peru
12/27/2010
Required Report - public distribution
Post:
Executive Summary: Section I. Market Summary
The Peruvian economy is one of the most successful in Latin America. Increasing income and expenditure levels are
creating opportunities for companies. A growing middle class and changes in consumer attitudes complete an attractive
landscape for businesses that are able to capitalize on these trends. However, income inequality and high levels of poverty
remain, preventing a sizeable portion of the population from accessing additional goods and services.
The global economic crisis of 2008-2009 significantly affected the two pillars that made the Peruvian economy one of the
most dynamic in Latin America between 2004 and 2008: investment and exports. Gross fixed capital formation, which had
been growing at an average annual rate of 20.2 percent in real terms during the period 2004-2008, dipped by 14.2 percent in
2009. Similarly, total exports dropped by 15.2 percent in 2009 after averaging an annual growth rate of 25.3 percent
between 2004 and 2008. The industrial sector was hard-hit by the global slowdown but began to recover in the fourth
quarter of 2009. Manufacturing is widely diversified and food service among other sectors has been the most prominent.
However, adequate fiscal policy during the boom periods meant that the country had enough resources to afford a significant
government stimulus package, avoiding economic contraction during the global economic crisis. Real GDP growth was 0.9
percent in 2009 and is expected to be 6.3 percent in 2010.
Several years of economic stability prior to the global economic crisis of 2008-2009, together with increasing openness to
foreign direct investment (FDI) and free trade have increased Peru's visibility among investors. During the period 2003-2008,
FDI inflows to Peru as a percentage of GDP averaged 3.4 percent, compared to the Latin American average of 2.6 percent.
Peru ranks fifth in Latin America in terms of population, with 29 million inhabitants in 2009. However, due to the country's
high levels of poverty, both per capita income levels and consumer expenditure levels compare unfavorably to regional
averages. In 2009, per capita consumer expenditure in Peru reached $2,826, well below the Latin American average of
$4,609.
However, Peru was one of the few countries in the region where per capita consumer expenditure did not contract during the
global economic crisis of 2008-2009, largely as a result of significant government stimulus packages. Per capita consumer
expenditure increased by 0.8 percent in real terms in 2009 after growing at an average annual rate of 5.4 percent between
2004 and 2008.
Peru's per capita disposable income stood at $3,200, below the regional average of $4,291. Additionally, the country's
savings ratio at 12.9 percent of disposable income in 2009 is among the highest in Latin America, which further limits
spending potential. Consumer credit, which cooled down during the global economic crisis is satisfactorily recovering in
2010.
Peru is entering a demographic window in 2010 that is expected to last 35 years and that will have beneficial effects on the
economy given the increase in production and consumption that the higher percentage of the population in working age will
provide during this year. In 2009, 34.8 percent of the population lived in poverty, which limits consumer spending.
However, the markedly different segments according to income can prove profitable if approached correctly.
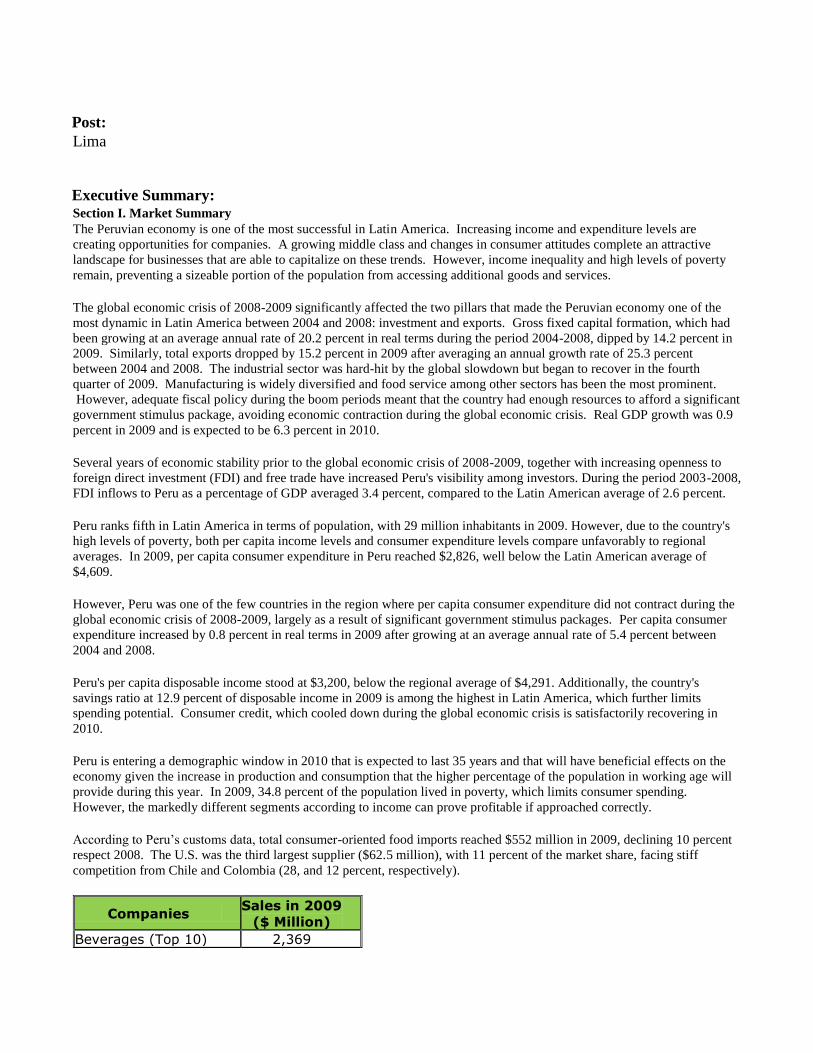
According to Peru‘s customs data, total consumer-oriented food imports reached $552 million in 2009, declining 10 percent
respect 2008. The U.S. was the third largest supplier ($62.5 million), with 11 percent of the market share, facing stiff
competition from Chile and Colombia (28, and 12 percent, respectively).
Companies Sales in 2009
($ Million)
Beverages (Top 10) 2,369
Lima

Foods (Top 30) 4,009
Agribusiness (Top 50) 2,610
Total 8,988 Source: Estimated values based on Peru: The Top 10,000 Companies 2010, Peru Top Publications
The U.S. – Peru Trade Promotion Agreement (PTPA) provided duty free access for two-thirds of U.S. food and agricultural
products. PTPA, supported by continued favorable market conditions in Peru, will continue to create opportunities to expand
U.S. food exports in the retail market for snacks, fruit and vegetable juices, fresh fruits (especially pears, apples and grapes),
canned fruits and vegetables, dairy products (especially cheeses), beef and poultry meats and their products, wines and
liquors and pet foods.
Advantages and Challenges Facing U.S. Products in Peru
Advantages Challenges
TPA will grant duty free access to most
high-value foods.
Appreciation for U.S. food quality and
culture.
Food ingredients enter duty free upon as
a result of TPA. Food ingredients are
increasing in demand as a result of
growing local production and exports.
Income growth, especially within the
middle-class.
Consumption of dietetic, light and
healthy products is a growing trend.
Eighty percent of the food
processing companies account for 75
percent of sales.
1. Local processed food
consumption is still small.
2. Lack of brand awareness
among consumers.
3. New local food brands
appearing in the market at very low
prices.
4. Relatively small market due to
limited purchasing power; 78 percent
of the Peruvian population are low-
income consumers.
5. A government-promoted
campaign called “Buy Peruvian.”
Smuggling.
Section II. Road Map for Market Entry
A. Entry Strategy
To successfully enter the Peruvian food market, U.S. exporters should directly contact the local food
processing company or indirectly establish connections through brokers, agents, or representatives.
Personal visits are highly recommended. The local partner should be well known by the U.S. company before any
permanent contractual arrangement is made.
The local partner should be able to provide updated information on consumer market trends, identify niche markets,
and supply information on current market development and business practices.
B. Market Structure
Local food processing products cover around 85 percent of the market demand.
Food processed imports are concentrated through a handful of distributors, importers, or wholesalers that usually
distribute to both retail and food service sectors.
Specialized importers usually provide food ingredients to the Peruvian market. Some of them are also producers or
wholesalers/distributors.
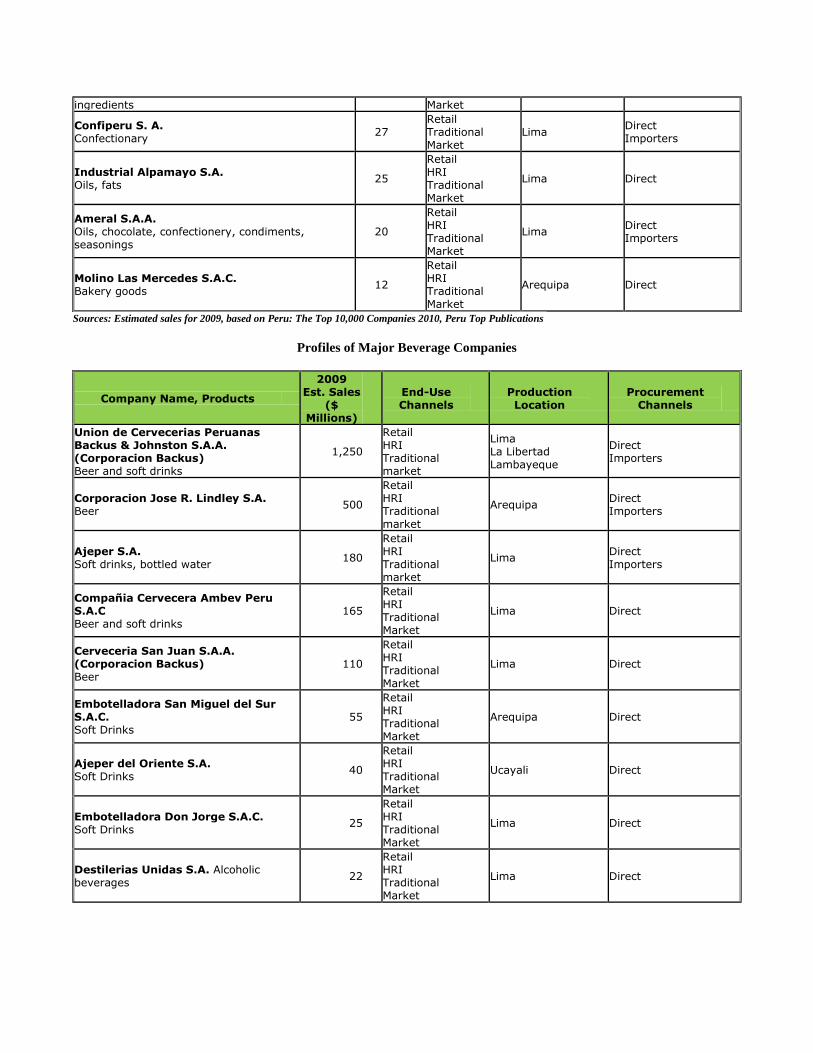
C. Company Profiles
Profiles of Major Food Processing Companies
Company Name, Products
2009 Est.
Sales ($
Million)
End-Use Channels
Production Location
Procurement Channels
Alicorp S.A. Cooking ingredients, sauces, dried goods, canned fruit, prepared meals, ice cream
1,283
Retail HRI Traditional market
Lima Trujillo
Direct Importers
Gloria S.A. Dairy products, canned fish, pork products, fruit juices
881
Retail HRI Traditional Market
Lima Arequipa Cajamarca
Direct Importers
San Fernando S.A. Poultry, pork and their by- products.
500
Retail HRI Traditional Market
Lima Direct Traders
Nestle Peru S.A. Breakfast cereals, confectionary, dairy products, smashed potatoes, instant beverages, bakery goods (pannettonne)
352
Retail HRI Traditional Market
Lima Direct Importers
Molitalia S.A. Flour, pasta, ketchup, semolina 165
Retail HRI Traditional Market
Lima Direct Importers
Perales Huancaruna S.A. Coffee Processor
145
Retail HRI Traditional Market
Amazonas Direct

Redondos S.A. Poultry and by-products
135
Retail HRI Traditional Market
Lima Direct Importers
Laive S.A. Dairy products, pork products, fruit juices 108
Retail HRI Traditional Market
Lima Direct Importers
Molinera Inca S. A. Flour and other grain mill products 95
Retail HRI Traditional Market
Trujillo Direct Importers
Kraft Foods Peru S.A Cookies, instant desserts and beverages, mayonnaise and ketchup, coffee
94
Retail HRI Traditional Market
Lima Direct Importers
Industrias del Espino S.A. Oils, fats 86
Retail Wholesaler San Martin Direct
Panaderia San Jorge S.A. Galletera del Norte S. A. CIA Molinera del Centro S.A. Bakery goods (cookies and pannettonne) Flour and other grain mill products
72
Retail HRI Traditional Market
Lima Trujillo
Direct Importers
Industrias Teal S.A. Cookies, candies, pasta, flour, pannettone, chocolate
70 Retail Traditional Market
Lima Direct Importers
Compañía Nacional de Chocolates de Peru
S.A. Confectionary chocolate
63 Retail Traditional Market
Lima Direct Importers
Cogorno S. A. Flour, pasta and other grain mill products
62
Retail HRI Traditional Market
Lima Direct Importers
Anita Food S.A. Noodles, pasta
61 Retail Traditional Market
Lima Direct
Ajinomoto del Peru S.A. Condiments, seasonings
60
Retail HRI Traditional Market
Lima Direct
Machu Picchu Trading S.A.C. Coffee, cocoa, chocolate 54 Wholesaler
Lima Ica Direct
Sociedad Suizo Peruana de Embutidos S.A. Pork and beef products
44
Retail HRI Traditional Market
Lima Direct
Panificadora Bimbo del Peru S.A. Bakery goods
41
Retial HRI Traditional Market
Lima Direct Importers
Corporacion ADC S.A.C. Flour, noodles, bakery godos, animal feed, pulses, semolina
38 Retail Traditional Market
Tacna Direct
Central de Cooperativas Agrarias Cafetaleras Coffee , Cacao, Honey Bee, Tea, anise, camomile, animal feed
38
Retail HRI Traditional Markets
Cuzco Importers
Molino El Triunfo S.A. Flour, semolina, noodles
38 Retail Traditional Market
Lima Direct Importers
Braedt S. A. Cheese and pork products
32 Retail HRI
Lima Direct Importers
Derivados del Maiz S. A. Corn, potato and sweet potato products as
28 Retail Traditional
Lima Direct Importers
ingredients Market
Confiperu S. A. Confectionary 27
Retail Traditional Market
Lima Direct Importers
Industrial Alpamayo S.A. Oils, fats 25
Retail HRI Traditional Market
Lima Direct
Ameral S.A.A. Oils, chocolate, confectionery, condiments, seasonings
20
Retail HRI Traditional Market
Lima Direct Importers
Molino Las Mercedes S.A.C. Bakery goods 12
Retail HRI Traditional Market
Arequipa Direct
Sources: Estimated sales for 2009, based on Peru: The Top 10,000 Companies 2010, Peru Top Publications
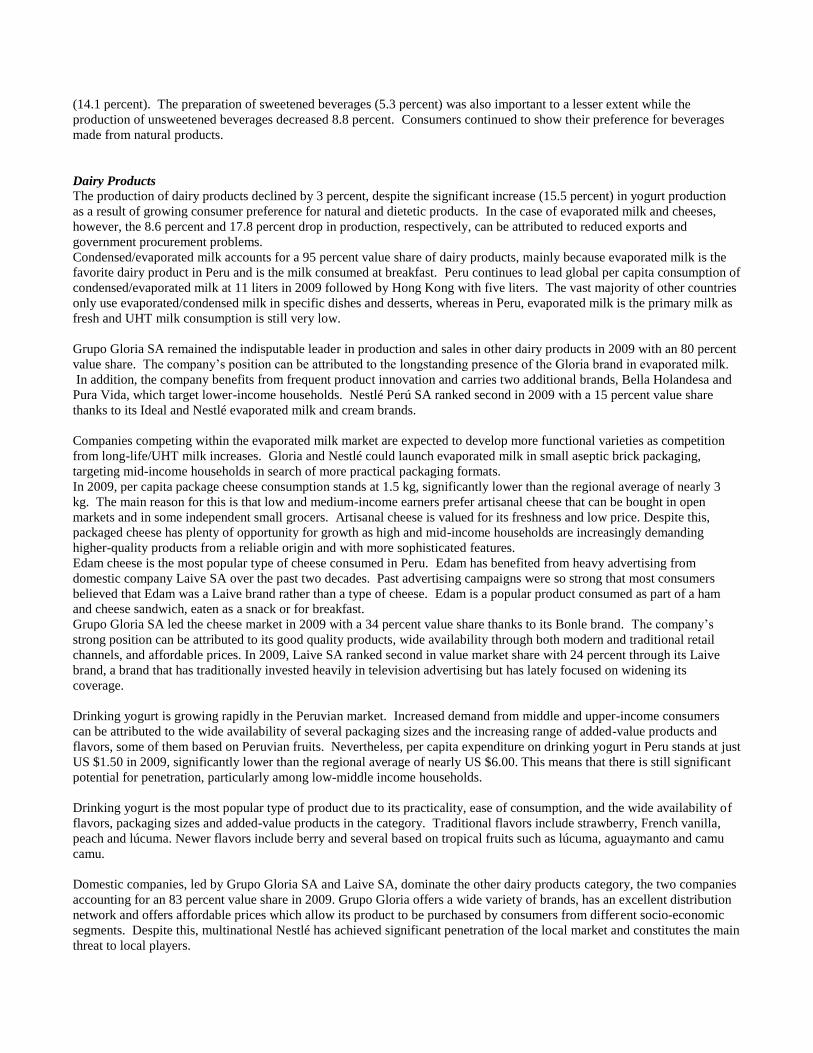
Profiles of Major Beverage Companies
Company Name, Products
2009 Est. Sales
($ Millions)
End-Use Channels
Production Location
Procurement Channels
Union de Cervecerias Peruanas Backus & Johnston S.A.A. (Corporacion Backus) Beer and soft drinks
1,250
Retail HRI Traditional market
Lima La Libertad Lambayeque
Direct Importers
Corporacion Jose R. Lindley S.A. Beer
500
Retail HRI Traditional market
Arequipa Direct Importers
Ajeper S.A. Soft drinks, bottled water
180
Retail HRI Traditional market
Lima Direct Importers
Compañia Cervecera Ambev Peru S.A.C Beer and soft drinks
165
Retail HRI Traditional Market
Lima Direct
Cerveceria San Juan S.A.A. (Corporacion Backus) Beer
110
Retail HRI Traditional Market
Lima Direct
Embotelladora San Miguel del Sur S.A.C. Soft Drinks
55
Retail HRI Traditional Market
Arequipa Direct
Ajeper del Oriente S.A. Soft Drinks 40
Retail HRI Traditional Market
Ucayali Direct
Embotelladora Don Jorge S.A.C. Soft Drinks
25
Retail HRI Traditional Market
Lima Direct
Destilerias Unidas S.A. Alcoholic beverages 22
Retail HRI Traditional Market
Lima Direct

Santiago Queirolo S.A.C. Alocoholic Beverages
22
Retail HRI Traditional Market
Lima, Ica Direct
Sources: Estimated sales for 2009, based on Peru: The Top 10,000 Companies 2010, Peru Top Publications
D. Sector Trends
Food Sector
The food industry contracted by 0.7 percent in 2009, but private consumption rose 2.4 percent because of the impact on
exports of the international financial crisis. As a result, there were two distinct trends emerged. In the case of prepared and
preserved meat, production climbed 4.6 percent, a rate that has held steady for eleven straight years. The leading companies
in the domestic market have been able to further diversify their offering of foodstuffs. The sausage industry, with a wider
variety of products, continued to enter households advantageously.
The production of vegetable and animal oils and fat was slightly higher (1.6 percent) than last year. The industry showed
heavy plant capacity use (83 percent) and was able to cope despite strong competition from Bolivian and Argentinean
imports. Margarine output, because of its replacement of imports, rose 8.3 percent.
Growth in the milling industry was moderate (1.7 percent). Although the drop in international wheat prices kept the demand
steady, wheat flour smuggling continued to plague southern Peru. The baked goods and noodles branches evolved favorably,
rising 4.1 percent and 4.6 percent, respectively. Fruit and vegetable processing and preserving, on the other hand, were down
9.5 percent because international shipments of these products were reduced. Frozen and canned asparagus manufacturing
dropped heavily by 27 percent.
The economic crisis affected other food products demand (gelatins, snacks and aromatic drinks, etc) by 2.7 percent. This
was reflected in the decline in diverse snacks (-3.2 percent), although growth was positive in the case of teas (8.0 percent),
instant desserts (7.5 percent), and instant beverages (0.9 percent).
Beverage Sector The performance of the beverage industry has been positive over the past eleven years, boosted by the domestic market and
particularly by the development of soft drinks and mineral waters. In 2009, however, sector growth slowed from 15 percent
to 2.1 percent. The decline in production of distilled alcohol and spirits (-11.4 percent) for the second straight year can be
attributed to the reduced consumption of luxury products brought on by the crisis. The main spirit lines were hardest hit with
rectified ethyl alcohol and pisco showing the sharpest drops (9.4 percent and 7.5 percent, respectively).
Pisco, Peru‘s emblematic beverage, of which 5.7 million liters were manufactured in 2009, is entering foreign markets as a
high quality gourmet liquor. It has out sold the Chilean eau-de-vie as a result of the marketing strategy associating pisco
with the country‘s cuisine and agricultural products. Pisco production will increase 20 percent in 2010, which could raise
total output to 6.7 million liters. This larger demand is the result of winemakers‘ investments, growing demand of local
consumers, and the tariff benefits from trade agreements.
Wine production dropped 8.9 percent after having showed steady growth over the previous ten years as a result of the
promotion of imported wines at discounted prices. A noteworthy new element is that Peruvian wineries are launching new
brands of wine in the market and have expanded their offerings to take in innovative varieties. Wine exports were 3 percent
higher than in 2008, with de United States being the favored market (73 percent). Bodegas y Viñedos Tabernero has played
a leading part in this showing.
Beer production declined by 1.5 percent although the year proved favorable for breweries in economic terms. Premium beer
exports to Europe rose while consumption remained unchanged in the domestic market.
Production in the soft drinks and mineral water industry, on the other hand, was up 9.1 percent due to the vigorous growth of
energy drinks (41.6 percent), followed by the expansion of water sold in jugs for dispensers (21.8 percent) and bottled water
(14.1 percent). The preparation of sweetened beverages (5.3 percent) was also important to a lesser extent while the
production of unsweetened beverages decreased 8.8 percent. Consumers continued to show their preference for beverages
made from natural products.
Dairy Products The production of dairy products declined by 3 percent, despite the significant increase (15.5 percent) in yogurt production
as a result of growing consumer preference for natural and dietetic products. In the case of evaporated milk and cheeses,
however, the 8.6 percent and 17.8 percent drop in production, respectively, can be attributed to reduced exports and
government procurement problems.
Condensed/evaporated milk accounts for a 95 percent value share of dairy products, mainly because evaporated milk is the
favorite dairy product in Peru and is the milk consumed at breakfast. Peru continues to lead global per capita consumption of
condensed/evaporated milk at 11 liters in 2009 followed by Hong Kong with five liters. The vast majority of other countries
only use evaporated/condensed milk in specific dishes and desserts, whereas in Peru, evaporated milk is the primary milk as
fresh and UHT milk consumption is still very low.
Grupo Gloria SA remained the indisputable leader in production and sales in other dairy products in 2009 with an 80 percent
value share. The company‘s position can be attributed to the longstanding presence of the Gloria brand in evaporated milk.
In addition, the company benefits from frequent product innovation and carries two additional brands, Bella Holandesa and
Pura Vida, which target lower-income households. Nestlé Perú SA ranked second in 2009 with a 15 percent value share
thanks to its Ideal and Nestlé evaporated milk and cream brands.
Companies competing within the evaporated milk market are expected to develop more functional varieties as competition
from long-life/UHT milk increases. Gloria and Nestlé could launch evaporated milk in small aseptic brick packaging,
targeting mid-income households in search of more practical packaging formats.
In 2009, per capita package cheese consumption stands at 1.5 kg, significantly lower than the regional average of nearly 3
kg. The main reason for this is that low and medium-income earners prefer artisanal cheese that can be bought in open
markets and in some independent small grocers. Artisanal cheese is valued for its freshness and low price. Despite this,
packaged cheese has plenty of opportunity for growth as high and mid-income households are increasingly demanding
higher-quality products from a reliable origin and with more sophisticated features.
Edam cheese is the most popular type of cheese consumed in Peru. Edam has benefited from heavy advertising from
domestic company Laive SA over the past two decades. Past advertising campaigns were so strong that most consumers
believed that Edam was a Laive brand rather than a type of cheese. Edam is a popular product consumed as part of a ham
and cheese sandwich, eaten as a snack or for breakfast.
Grupo Gloria SA led the cheese market in 2009 with a 34 percent value share thanks to its Bonle brand. The company‘s
strong position can be attributed to its good quality products, wide availability through both modern and traditional retail
channels, and affordable prices. In 2009, Laive SA ranked second in value market share with 24 percent through its Laive
brand, a brand that has traditionally invested heavily in television advertising but has lately focused on widening its
coverage.
Drinking yogurt is growing rapidly in the Peruvian market. Increased demand from middle and upper-income consumers
can be attributed to the wide availability of several packaging sizes and the increasing range of added-value products and
flavors, some of them based on Peruvian fruits. Nevertheless, per capita expenditure on drinking yogurt in Peru stands at just
US $1.50 in 2009, significantly lower than the regional average of nearly US $6.00. This means that there is still significant
potential for penetration, particularly among low-middle income households.
Drinking yogurt is the most popular type of product due to its practicality, ease of consumption, and the wide availability of
flavors, packaging sizes and added-value products in the category. Traditional flavors include strawberry, French vanilla,
peach and lúcuma. Newer flavors include berry and several based on tropical fruits such as lúcuma, aguaymanto and camu
camu.
Domestic companies, led by Grupo Gloria SA and Laive SA, dominate the other dairy products category, the two companies
accounting for an 83 percent value share in 2009. Grupo Gloria offers a wide variety of brands, has an excellent distribution
network and offers affordable prices which allow its product to be purchased by consumers from different socio-economic
segments. Despite this, multinational Nestlé has achieved significant penetration of the local market and constitutes the main
threat to local players.
Beer In 2009 beer accounted for 95 percent of the total consumption of alcoholic drinks in Peru in volume. The popularity of this
product is based on its appeal to every socio-economic segment, its wide accessibility, intense competition amongst beer
companies – which resulted in a decrease in prices from 2001 to 2010 – and frequent product innovation to better meet
Peruvian consumers‘ tastes. Nevertheless, Peru‘s per capita consumption of beer stood at 42 liters in 2009, which was still
below the Latin American average, and significantly lower than other countries such as Brazil and Mexico, which had 65 and
61 liters per capita consumption, respectively. According to trade interviews, an important factor to continue developing the
Peruvian market will be to increase the occasions for drinking.
Beer production has increased from 6 million hectoliters in 2003 to 12 million hectoliters in 2009. Currently, eight plants
exist throughout the country and the distribution goes through almost 200 thousand sales points. The three largest companies
in this sector handle 17 brands and 60 different formats.
Glass bottles are the most popular packaging format used in Peru, due to tradition and also because consumers perceive it to
be the ideal format to preserve products‘ flavor. Beer in aluminum cans is mostly purchased for individual consumption,
which contrasts with the habit of consuming beer in the company of many people sharing glass bottles. Furthermore, canned
formats carry the highest unit prices in beer. PET is not used to package beer in Peru.
According to PRODUCE, the Ministry of Production in Peru, beer production (without considering dark beer) decreased by
1 percent in 2009. According to SUNAT, the Superintendent‘s Office of Tax Collection, while beer imports increased by 6
percent in 2009, exports rose by 22 percent in the same year. As 2009 was characterized by the slowdown of the Peruvian
economy, local demand for beer slightly decreased. Companies in response were cautious and opted to moderately increase
their imports to satisfy demand amongst upper-income segments while they increased their exports as they entered new
markets or strengthened sales amongst Peruvian expatriates living in the United States, Japan and Spain.
Domestic lager accounts for over 99 percent of beer sales in the Peruvian market. This hegemonic position has been
achieved through the company Unión de Cervecerías Peruanas Backus & Johnston SAA, which carries a wide portfolio of
brands, several with a longstanding presence in the market, and with products that aim at high and middle-income
consumers. Other companies such as Ajeper SA and Compania Cervecera Ambev Perú SAC also participate in this
competitive category and continue to strengthen their efforts to increase their penetration in the domestic market.
Imported premium lager was the fastest-growing category, with a 6 percent growth in volume in 2010. Imported premium
lager constitutes a niche segment in Peru, accounting for less than 1 percent of beer consumption in 2010, due to the strong
tradition of consuming domestic beers, the high price of imported premium lagers and their limited distribution.
Nevertheless, as Peru has the second lowest per capita consumption of imported premium lager in Latin America, it has
potential to grow at healthy rates as Peruvian consumers benefit from higher purchasing power and the products obtain
increased availability through modern retail channels such as supermarkets and hypermarkets.
Baked Goods Baked goods, in particular bread, are a staple in the Peruvian diet. Most Peruvians prefer artisanal bread for its freshness,
consuming it at breakfast and for the traditional late afternoon meal of ‗lonche,‘ or using it to make sandwiches for children‘s
lunchboxes. Despite this, some high income urban consumers are turning towards packaged bread products, either because
they live hectic lives and desire greater convenience or because they are health conscious and prefer added value variants
such as wheat bread or fortified/functional bread.
Retail volume sales in baked goods grew by 3 percent to reach 950 thousand MT in 2009. This was mainly due to the
maturity of artisanal bread, the dominant category, the development of which tends to follow population growth. Growth in
baked goods sales meanwhile were up slightly on 2009, partly due to inflation but also due to rising demand for more
expensive packaged/industrial products.
Peruvian consumers traditionally prefer unpackaged/artisanal baked goods, for a number of reasons. Most notably,
unpackaged/artisanal baked goods are fresher than packaged/industrial alternatives and also tend to offer greater variety;
artisanal bread can be sweet or salty, for example. In addition, artisanal baked goods can usually be purchased in smaller
quantities or portions than packaged/industrial products. This appeals to lower income consumers and those who want to
avoid wastage. For example, while unpackaged/ artisanal bread is available in a range of different sizes, packaged/industrial
bread products usually contain at least 20 individual slices. Despite this, packaged/ industrial bread showed faster growth in
retail volume and current value sales than the unpackaged/ artisanal bread category over the review period as a whole. This
was partly due to growing consumer demands for convenience, especially among urban dwellers leading busy lifestyles, and
also attributes to increasing consumer appreciation for the potential health benefits provided by packaged whole grain bread
and fortified/functional variants.
Independent small grocers continued to dominate baked goods distribution with a value sales share of 64 percent. Retailers
that sell baked goods are mainly bakeries or bodegas that receive fresh bread from artisanal suppliers every day. The
proximity of these retailers to consumers (they are usually found in or close to residential areas) and the fact that their prices
are significantly cheaper than those of supermarkets/hypermarkets outlets are the main reasons for the dominance of the
independent small grocers channel.
Supermarkets/hypermarkets was the second leading distribution channel for bakes goods in 2009 with a value share of 22
percent, followed by other grocery retailers (street vendors etc.) with a share of 13 percent. To cater to the traditional
preferences of Peruvian consumers, most supermarkets/hypermarkets outlets carry unpackaged/artisanal bread as well as
packaged/industrial alternatives.
Artisanal producers continued to dominate baked goods in 2009, accounting for 96 percent of total sales. This share
remained largely unchanged as a result of the strong preference of Peruvian consumers for buying unpackaged/artisanal
baked goods (especially bread) fresh from neighborhood bakeries or bodegas every day.
Panificadora Bimbo was the leading branded manufacturer in baked goods in 2009, with a value share of 2 percent. The
company offers a broad range of packaged/industrial bread and cakes products under its Bimbo and Pyc brands, both of
which are heavily advertised. It also offers the Marinela, Gansitos, Pinguinos and Mankeke brands in packaged/industrial
pastries. Other prominent branded manufacturers in baked goods in 2009 included Universidad Peruana Union, Rolly's
Pastelería SA, and Nestlé, but none of these companies presented a major competitive threat to multinational Panificadora
Bimbo. Coupled with the dominant status of artisanal products, this ensured that there were no significant company value
share movements in baked goods over 2008-2009.
Pasta Per capita consumption of pasta in Peru almost reached 6 kg; pasta is widely popular in Peru because it is used as the base
for many traditional Peruvian dishes. It is worth noting that dried pasta accounted for a 99 percent share of total volume
sales for all pastas. This preference is sustained by affordable prices, the long life of dried pasta, and wide availability
through both traditional and modern retail channels. In addition, the easy and quick preparation of dried pasta means that it
is also one of the favorite ingredients used in meals for consumers leading busy lifestyles in urban areas of the country. Pasta
increased by 4 percent in retail volume and 6 percent in sales reaching almost $300 million in 2009.
Alicorp SAA led the pasta market with a 44 percent share of value sales in 2009 with its main brands Don Vittorio, Nicolini
and Lavaggi. Ranked in second position was Molitalia SA, which achieved a 38 percent share of value sales in 2009, mostly
because of its Molitalia brand. Both companies benefit from brand recognition, affordable prices, good quality and strong
advertising
Molitalia SA increased its value share by nearly one percentage point in 2009. Due to the slowdown in the economy, some
cautious consumers looked for more affordable products, and opted for one of the two brands offered by Molitalia (Molitalia
and Marco Polo), which are lower priced than the most popular brands from Alicorp SAA.
Breakfast cereals Whereas in the past breakfast cereals products in Peru were mainly purchased by upper income consumers due to their high
prices, in recent times manufacturers have responded to the expansion of the middle income segment and introduced more
affordable variants in smaller pack sizes. This trend continued during the review period, helping to maintain growth in retail
volume and current value sales for the sector as a whole. Another notable trend in breakfast cereals was the launch of new
health and wellness products made from wheat cereal or fortified with ingredients that provide functional health benefits.
This trend was especially strong in the hot cereals category, where consumers can now purchase added value products
fortified with ingredients that have traditionally had a very healthy image in Peru.
Breakfast cereals sales accounted 5 percent last year. Sales rose $160 million and retail volume sales grew 4 percent also to
reach 22 thousand MT.
Global Alimentos remained the clear leader in breakfast cereals in 2009 with a sector value share of 28 percent. The
domestic company‘s leadership was attributable to its offering of a wide range of affordably priced products in several
different flavors under its Angel umbrella brand. In addition, the company has traditionally led the way in breakfast cereals
when it comes to adapting its offerings to better meet the needs of Peruvian consumers, most notably via the introduction of
more convenient packaging formats (flexible packages and folding cartons) and smaller pack sizes. Quaker Perú SRL, which
offers the Quaker and Capt‘n Crunch brands, ranked second overall in 2009 with a sector value share of 16 percent, closely
followed by fellow multinational Kellogg‘s Perú SAC (Kellogg‘s Corn Flakes, All Bran, Special K etc) with a share of 15
percent. Other prominent players included Nestlé, Molitalia, Chur Cereal and Industrias Alimenticias Cusco SA.
Canned Preserved Food Canned/preserved fish/seafood is set to continue to be the most valuable category of the sector. This type accounted 70
percent in 2009 of value sales of canned/preserved food.
Canned/preserved beans and fruit are likely to be the most dynamic categories within the sector, with a 7 percent growth in

value. Both categories benefit from a wide range of products, brands (local, multinational and private label), and pack sizes
which target consumers with different budgets. In addition, canned/preserved beans are perceived as convenient products
which significantly reduce cooking time since many types of beans need to be pre-soaked in water hours before being cooked
in order to soften the product and some beans take considerable time to be cook. In addition, Peruvians try to eat beans at
least once a week, as some beans are highly appreciated for their nutritional benefits. Finally, the competition has intensified,
with the entrance of private label lines such as Metro and Bells, which offer more affordable products, targeting middle-
income consumers.
GW Yichang & Cia dominates the canned/preserved food market, with a 30 percent value share in 2009, thanks to the
popularity and high quality of its Florida brand of canned/preserved fish and the imported brand Aconcagua in
canned/preserved fruit.
Pesquera Hayduk increased its value share in canned/preserved food from 9 percent in 2008, to 10 percent in 2009, thanks to
its good quality brand canned/preserved fish, Campomar which is sold at affordable prices and has succeeded in attracting
middle-income consumers.
Domestic companies have a strong hold on canned/preserved food, since fishing and agriculture are main economic activities
in Peru, which gives them a significant advantage over the multinationals. In addition, domestic companies are first to
introduce product innovations, such as canned fish in tomato sauce, or a spicy tomato sauce, ají (hot sauce), and onions.
Furthermore, the domestic brands prices are considerably more affordable than the international ones, thus attracting low
and middle-income consumers.
Confectionary (chocolates) Nestlé remained the clear leader in chocolate confectionery in 2009, claiming a sales share of 39 percent in value with a
strong portfolio that includes well established lines like Sublime, Triángulo D‘Onofrio and Princesa. All of Nestlé‘s brands
benefit from widespread distribution in Peru and most enjoy high levels of consumer loyalty. Molitalia SA, which offers
brands such as Cañonazo, Mecano and Vizzio, was the second leading chocolate confectioner with a value share of 20
percent, while Cía Nacional de Chocolates de Perú SA, which boasts a portfolio that includes the Chin Chin, Chocolate con
nueces y pasas and Chocolate Winter‘s XL brands, ranked third with a share of 16 percent. Other prominent players
included Kraft Foods Perú SA, Arcor de Perú SA, Masterfoods Perú SA and Ferrero SA.
Company value within chocolate confectionery remained fairly stable over 2008-2009, with no parties recording significant
gains or losses. This was partly due to the lingering effects of the global economic downturn, which led companies to focus
on maintaining their competitive positions and limited investment in new launches and marketing activities, particularly
among smaller players.
Multinational companies such as Nestlé, Molitalia and Cia Nacional de Chocolates continued to dominate chocolate
confectionery in 2009 thanks to high levels of consumer loyalty and the widespread distribution of their brands in both
modern and traditional retail channels. Most domestic players were smaller artisanal producers, one notable exception being
La Ibérica, which offers high quality products at premium prices.
Oils and Fats Vegetable and seed oil accounted for an estimated 82 percent share in volume of total sales of oils and fats in 2009. This
type of product is traditionally a staple in every household. The good level of penetration relies on the fact that there are
several brands in the Peruvian market, a wide range of pack sizes, and widespread availability through both traditional and
modern retail outlets. Nevertheless, growth has been moderate in recent years as upper-income consumers are turning to
healthier options such as olive oil. In an effort to attract consumers, vegetable and seed oil companies have increased their
availability of fortified products and low-calorie options.
Domestic company Alicorp SAA led the market for oils and fats in 2009 with a 55 percent value share. Alicorp benefits
from offering several brands, such as Primor, Capri, Cil and Friol, targeting different socio-economic segments and an
excellent distribution network which covers every channel. Furthermore, the company strongly advertises its brands to
maintain penetration.
Alicorp SAA increased its value share by more than two percentage points in 2009. The Peruvian economy‘s slowdown
forced some more cautious consumers to look for more affordable brands, thus benefiting the company‘s lower-priced lines.
Domestic companies lead the category as they have a wider availability of brands, packaging sizes, and formats to meet the
demands of every socio-economic group. Among the most important local manufacturers are Alicorp SAA, Laive SA and
Grupo Gloria SA. The most well-known multinational is Unilever, which is present with the margarine brand Dorina which

has achieved a good level of penetration thanks to its longstanding presence in the marketplace and aggressive television
advertising.
Consumption will be driven by product innovation in most categories. Vegetable and seed oil will most likely launch
fortified products containing vitamins, minerals, and omega-3 in an effort to avoid losing share among upper-income
consumers who are turning towards olive oil as it is perceived as a healthier product.
Ready Meals Peru is the country with the lowest per capita consumption of ready meals in Latin America, mainly due to two reasons:
Peruvians traditionally prefer to consume fresh food as they perceive it to be more nutritious than frozen products or ready
meals and the high prices of these products represent a big obstacle to their development—there are many affordable options
at foodservice establishments which can be cheaper than a ready meal or include several courses like an appetizer, main
meal, and soft drink. Despite this, time constraints of Peruvians living in urban areas cause some of them to turn to ready
meals. Due to the small size of the ready meals market, there are plenty of opportunities for other brands to enter the market
and rapidly gain considerable share.
Redondos, with its Appetit brand, leads ready meals thanks to a variety of meals based on traditional Peruvian dishes. The
products are canned, and after heating, they are ready to be consumed, providing the convenience that some middle- and
high-income consumers seek.
Deshidratadora de Alimentos, with its Provenzal brand, specializing in dried ready meals, achieved the biggest increase in
value sales in 2009. This is because the company offers a good range of products based on traditional Peruvian meals, and
therefore meets consumers‘ tastes. In addition, consumers can add fresh ingredients to the dried ready meals to make them
more nutritious or appealing.
Ready meals is expected to grow slowly, as they are not considered a nutritious option for a meal. In response, companies
may increase their marketing efforts through in-store promotions and launch fortified products that could attract consumers
looking for products that offer convenience and health benefits at the same time. Another big obstacle to the development of
ready meals is their high unit prices. It is expected that local companies will offer smaller pack sizes in an effort to attract
middle-income consumers.
Sauces, dressings and condiments Peruvian consumers are very fond of spicy sauces to complement their meals. However, traditionally Peruvian consumers
rely on home-made sauces which use Peruvian ingredients, such as different types of ají (a spicy ingredient which can be
yellow, red or orange), or rocoto (a red spicy ingredient). However, packaged sauces, dressings and condiments registered
healthy rates of growth in recent years, based on several factors. First, the local company Alicorp SAA has been at the
forefront of the development of sauces which look to capture the flavor of home-made sauce, but offer the practicality of a
ready-to-use sauce. Its most successful launches have been a Peruvian-style mayonnaise, a rocoto sauce and an ají sauce.
Secondly, busier lifestyles, especially in urban households, mean that a growing number of Peruvian consumers relied on
sauces, dressing and condiments to save time when cooking. Thirdly, companies have eagerly launched a good variety of
packaging formats and sizes, targeting every socio-economic segment.
Domestic company Alicorp SAA led sauces, dressings and condiments with a 40 percent value share in 2009. The company
benefits from offering products developed to meet Peruvian consumers‘ tastes and preferences—good quality products with
affordable prices and a good distribution network which allows its products to be present in both modern and traditional
retail channels.
Alicorp SAA increased its value share by two percentage points, from 38 percent in 2008 to 40 percent in 2009. Its
affordable prices and different packaging sizes allowed the company to increase its sales in a context in which cautious
consumers were looking to cut down on non-essential expenses.
Domestic companies dominate the category, led by Alicorp SAA, and followed by Ajinomoto del Perú SA, Agroindustrias
Supe SAC and Productos Encurtidos SA, amongst others. These four companies account for a 50 percent value share as a
result of based on their knowledge of the local market and their launch of products which feature the preferences of Peruvian
consumers. Multinational companies such as Nestlé Perú SA and Unilever Andina Perú SA also have an important share in
the category due to their strong advertising campaigns, good distribution through modern retail channels, and the fact that
they are increasingly trying to adapt some of their products to Peruvians‘ needs and demands.
Spreads Jams and preserves remained the dominant category within spreads in terms of retail volume sales. Jams and preserves are a
traditional part of the Peruvian diet, usually consumed at breakfast and teatime. During the review period, rising health
awareness and public concern over diet-related conditions like obesity and diabetes led to increased demand for jams and
preserves products with a reduced sugar content. Another notable trend in the category was the introduction of new flavor
variants based on traditional Peruvian plants and fruits like coca and aguaymanto by smaller local companies.
GW Yichang was the clear leader in spreads in 2009, claiming a sector value share of 33 percent with its Florida and Florida
Light brands. The company was able to maintain its leadership of the sector thanks to its extensive distribution network,
competitive pricing policy, and success in launching new jams and preserves products and pack sizes to meet the changing
preferences of Peruvian consumers. Grupo Gloria ranked second overall in 2009, claiming a value share of 23 percent
thanks to the popularity of its eponymous brand. The Gloria brand has been available in Peru for many years and is present in
several packaged food sectors other than spreads. With its reputation for offering good quality at reasonable prices, the
brand enjoys a high level of consumer loyalty. Molitalia, which offers the Fanny and Fanny Light brands, finished third in
2009 with a sector value share of 15 percent, followed by Industrias Alimentarias SRL, producer of the A-1 brand, with a
share of 14 percent. Other prominent spreads players included Corporación Sagra SA, Hipermercado Metro SA and Narbasa
SA.
Sweet and Savoury Snacks Peru has the third lowest per capita consumption of sweet and savory snacks in the region, standing at 0.5kg, while the
average for the region is nearly 1.5kg. There are plenty of opportunities for the category to develop. The latest focus of the
main companies in the category was the launch of products which better met Peruvians‘ tastes and preferences. This trend
began in 2008 with the launch of chips based on native Peruvian potatoes by Snacks America Latina SRL, a move which was
later replicated by local companies such as Deprodeca SAC. In the second quarter of 2009, Snacks America Latina SRL
launched Lay‘s Peruanísimas, a new variety of chips based on native spicy ingredients (ají mirasol and rocoto). The launch
was welcomed by Peruvian consumers, both because of its novelty, and because of the pride that Peruvian consumers feel
when purchasing native products. It is worth noting that in Peru there is considerable demand for products such as ―papitas al
hilo‖ (thinly sliced potatoes) and ―canchita‖ (ready-to-eat popcorn), with both products traditionally produced artisanally and
sold through street vendors. In response, Snacks America Latina SRL launched packaged versions of both types of savory
snacks.
Sweet and savory snacks grew by 5 percent during 2009. As the Peruvian economy recovered from the slowdown on last
year, consumers benefited from higher disposable incomes, which allowed them to increase their frequency of consumption
of these non-essential products, or to trade up to more expensive brands.
Snacks America Latina SRL led sweet and savory snacks in 2009 with a value share of 58 percent, based on its excellent
distribution network both within modern and traditional retail channels, and due to the popularity of its brands Lay‘s and
Piqueo Snax. Moreover, the company frequently updates its portfolio to better meet Peruvian consumer tastes. In addition,
the company invests intensively in mass media marketing campaigns to maintain brand awareness in the local market.
Snacks America Latina SRL increased its value share by one percentage point, from less than 58 percent in 2008 to more
than 58 percent in 2009, thanks to the launch of new products which increased consumers‘ interest in its brands.
Multinational companies, led by Snacks America Latina SRL, dominate the sweet and savory snacks market in Peru.
Despite this, local companies such as Gelce International SA and Deprodeca SAC are progressively increasing their
penetration based on good quality products at more affordable prices than international brands.
Section III. Competition

Source: World Trade Atlas (2009)
Peru grants tariff preferences to the Andean Community of Nations (CAN - Bolivia, Colombia and Ecuador), and to
Mexico, Paraguay, Argentina, Brazil, Uruguay and Cuba.
According to Peru‘s customs data, total consumer-oriented food imports reached $552 million in 2009, declining 10
percent respect 2008. The U.S. was the third largest supplier ($62.5 million), with 11 percent of the market share,
facing stiff competition from Chile and Colombia (28, and 12 percent, respectively).
Peru‘s trade policy is oriented towards open markets. Peru has signed an Economic Complementation Agreement
(ECA) with MERCOSUR, a major U.S. competitor in bulk commodities and meats, (dairy products were exempt
from the negotiations). Peru has signed a Commercial Agreement with Chile, Peru‘s primary supplier of food and
agricultural goods and is negotiating the extension of its ECA with Mexico. Peru‘s free trade agreement with
Canada entered into force July 31, 2009. Peru is currently negotiating a free trade agreement with European Union,
China, Singapore, Thailand, EFTA (Switzerland, Iceland, Norway and Liechtenstein) and Korea. Peru is also
seeking a free trade agreement with Japan.
The PTPA will reinforce U.S. competitiveness within the Peruvian market. The quality of U.S. products is already
appreciated among the high-end consumers.
For a complete list of products that will be benefited from the TPA, please check
http://www.ustr.gov/Trade_Agreements/Bilateral/Peru_TPA/Section_Index.html.
Competitive Situation facing U.S. Suppliers in the
HRI Food Service Market in 2009
Product Category/
Net Imports
Major Supply Sources
Strengths of Key Supply Countries Advantages and
Disadvantages of Local Suppliers
Dairy Products 28,945 tons ($72.96 million)
Mexico: 21
percent Chile: 18 percent New Zealand: 11 percent Colombia: 11 percent
- Mexico is major supplier of dairy ingredients, especially preparation of cereals and infant milk. Both are duty free.
- Only two companies are major producers of evaporated milk and yogurt. - Local homemade cheeses are commonly sold.
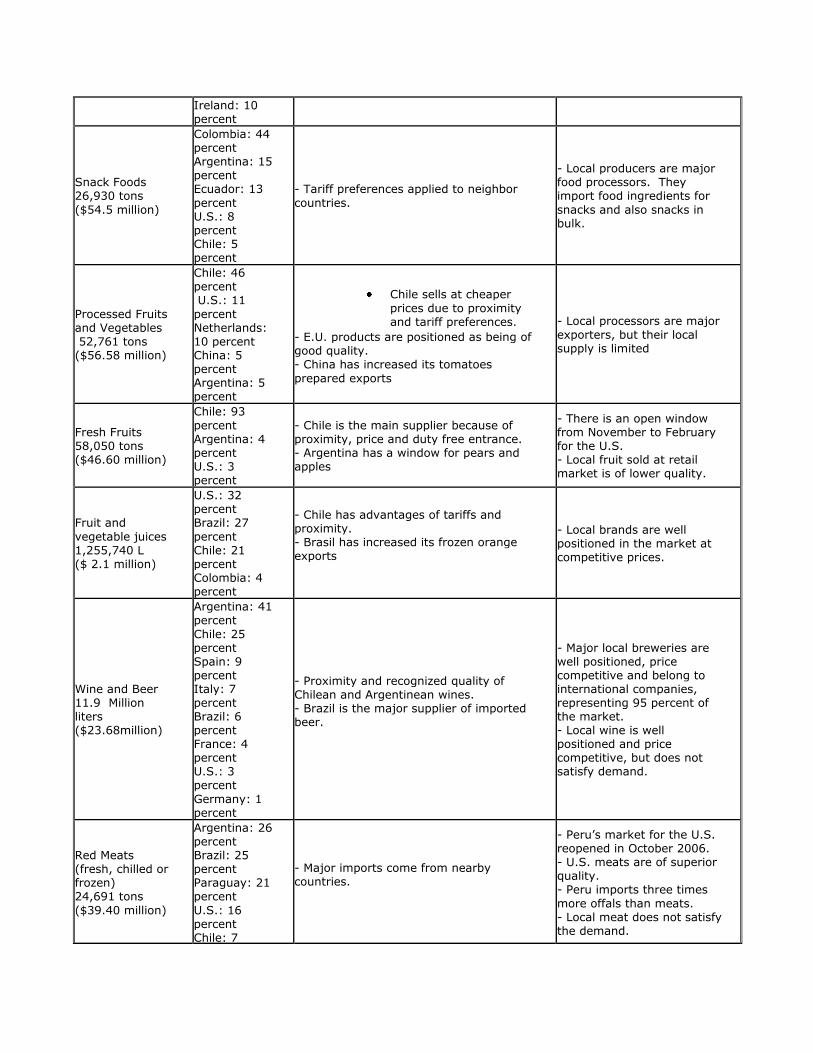
Ireland: 10 percent
Snack Foods 26,930 tons ($54.5 million)
Colombia: 44 percent Argentina: 15 percent Ecuador: 13
percent U.S.: 8 percent Chile: 5 percent
- Tariff preferences applied to neighbor
countries.
- Local producers are major food processors. They import food ingredients for
snacks and also snacks in bulk.
Processed Fruits and Vegetables 52,761 tons ($56.58 million)
Chile: 46 percent U.S.: 11
percent Netherlands: 10 percent China: 5 percent Argentina: 5 percent
Chile sells at cheaper
prices due to proximity and tariff preferences.
- E.U. products are positioned as being of good quality. - China has increased its tomatoes
prepared exports
- Local processors are major exporters, but their local supply is limited
Fresh Fruits 58,050 tons ($46.60 million)
Chile: 93
percent Argentina: 4 percent U.S.: 3 percent
- Chile is the main supplier because of proximity, price and duty free entrance. - Argentina has a window for pears and apples
- There is an open window from November to February for the U.S. - Local fruit sold at retail market is of lower quality.
Fruit and
vegetable juices 1,255,740 L ($ 2.1 million)
U.S.: 32 percent Brazil: 27
percent Chile: 21 percent Colombia: 4 percent
- Chile has advantages of tariffs and proximity. - Brasil has increased its frozen orange exports
- Local brands are well positioned in the market at competitive prices.
Wine and Beer 11.9 Million liters ($23.68million)
Argentina: 41 percent Chile: 25 percent Spain: 9 percent Italy: 7 percent Brazil: 6 percent France: 4 percent U.S.: 3 percent Germany: 1 percent
- Proximity and recognized quality of Chilean and Argentinean wines. - Brazil is the major supplier of imported beer.
- Major local breweries are well positioned, price competitive and belong to international companies, representing 95 percent of the market. - Local wine is well positioned and price competitive, but does not satisfy demand.
Red Meats (fresh, chilled or frozen) 24,691 tons ($39.40 million)
Argentina: 26 percent Brazil: 25 percent Paraguay: 21 percent U.S.: 16 percent Chile: 7
- Major imports come from nearby countries.
- Peru’s market for the U.S. reopened in October 2006. - U.S. meats are of superior quality. - Peru imports three times
more offals than meats. - Local meat does not satisfy the demand.
percent Uruguay: 3 percent
Red Meats (prepared, preserved) 1,126 tons ($4.56 million)
Chile: 31 percent Argentina: 16 percent Bolivia: 10 percent Italia: 10 percent Denmark: 10 percent Spain: 8 percent U.S.: 6 percent Brazil: 6 percent
- Chile has the advantages of tariff preferences and proximity.
- There pork products industry that also imports prepared meats. - U.S. product tariffs will go down from 5 to 7 years linear.
Note: Net imports correspond to the three food sectors: Food Service, Retail and Food Processing.
Source: World Trade Atlas
Section IV. Best Product Prospects
Source: World Trade Atlas (2009)
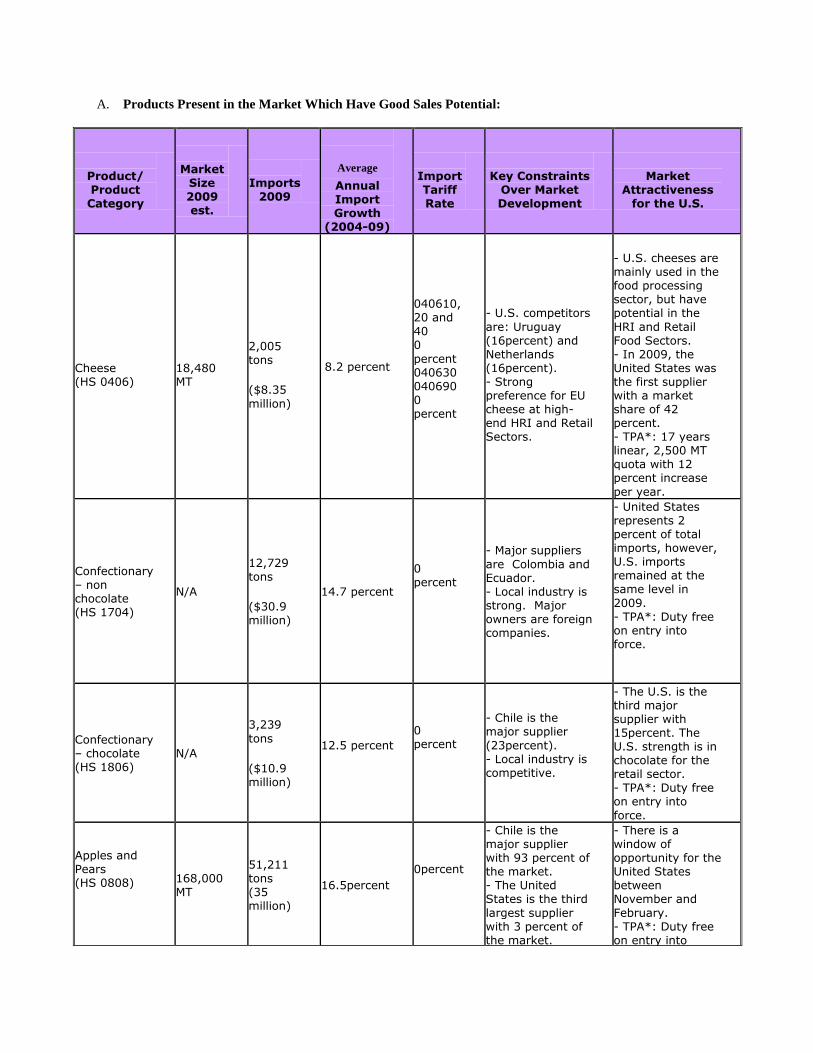
A. Products Present in the Market Which Have Good Sales Potential:
Product/ Product Category
Market
Size 2009 est.
Imports
2009
Average
Annual Import Growth
(2004-09)
Import Tariff Rate
Key Constraints
Over Market Development
Market
Attractiveness for the U.S.
Cheese (HS 0406)
18,480 MT
2,005 tons ($8.35
million)
8.2 percent
040610, 20 and 40 0
percent 040630 040690 0 percent
- U.S. competitors
are: Uruguay (16percent) and Netherlands (16percent). - Strong preference for EU cheese at high-end HRI and Retail Sectors.
- U.S. cheeses are mainly used in the food processing sector, but have potential in the
HRI and Retail Food Sectors. - In 2009, the United States was the first supplier with a market share of 42 percent. - TPA*: 17 years linear, 2,500 MT quota with 12 percent increase
per year.
Confectionary – non chocolate (HS 1704)
N/A
12,729 tons ($30.9 million)
14.7 percent
0 percent
- Major suppliers
are Colombia and Ecuador. - Local industry is strong. Major owners are foreign companies.
- United States represents 2 percent of total imports, however, U.S. imports remained at the same level in
2009. - TPA*: Duty free on entry into force.
Confectionary – chocolate (HS 1806)
N/A
3,239
tons ($10.9 million)
12.5 percent
0 percent
- Chile is the major supplier
(23percent). - Local industry is competitive.
- The U.S. is the third major supplier with 15percent. The U.S. strength is in chocolate for the retail sector. - TPA*: Duty free on entry into
force.
Apples and Pears (HS 0808)
168,000 MT
51,211 tons (35 million)
16.5percent
0percent
- Chile is the major supplier with 93 percent of the market. - The United States is the third
largest supplier with 3 percent of the market.
- There is a window of opportunity for the United States between November and
February. - TPA*: Duty free on entry into

force.
Grapes, fresh (HS 080610)
207,000 MT
3,611
tons ($2.8 million)
62percent
0 percent
- Local production is strong. - Chile is a major importer (96 percent). - Low imports.
- U.S. window: September to December. - TPA*: Duty free on entry into force.
Prime and choice beef (HS 020230)
Total beef and offals market: 268,924 MT
1,253 tons ($4.78 million)
8.9percent
0 percent
- Competes with quality meats from Argentina, Uruguay, Brazil and Bolivia.
- Currently the market is experiencing a shortage of supplies. - TPA*: Duty free on entry into force.
Edible Beef Offals (HS 020621, 020622)
180,000 MT
4,529 tons ($4.7 million)
HS 020621 31percent HS 020622 16.5percent
0 percent
- Major supplier for HS 020621 is Brazil with 68 percent of the market.
- The United States holds 87 percent of the liver import (020622) market. - TPA*: 10 years linear, 800 MT quota with 6
percent increase.
Fruit and Vegetable juices (HS 2009)
N/A
12,557 hl ($2.1 million)
22 percent
9 percent
- Major suppliers are the United States (32percent), Brazil (27percent), and Chile (21percent).
- TPA*: Duty free on entry into force, 5 and 10
years linearly depending on the product.
Pet foods (HS 230910)
38,800 MT
10,035 MT ($11.4 million)
17.6 percent 0 percent
- Growing local pet industry. - There is an informal industry
arising. - Colombia 42 percent), and Argentina (27 percent) are major competitors.
- The United States holds 27 percent of the market, with an 18 percent
increase from 2008. - TPA*: duty free on entry into force, or 5 years linearly for canned pet food.
Pasta (HS 1902)
300,000 tons
1,251 MT ($1.4 million)
3.14 percent
0 percent
- Major competitors are Italy (25percent), Chile (15percent),
- U.S. holds 23
percent of the market and is the second largest supplier. Imports increased by 38 percent in 2009. - TPA*: duty free on entry into force or within 5 years.
Turkey (HS 020725, 020726, 020727)
21,200 MT
4,171 tons (5.45 million)
HS 020725 37.8 percent, HS 020726 0.5 percent, HS 020727 25 percent
9 percent
- Major exporters are Brazil (44percent) and Chile (31percent) followed by the United States with 26 percent. - Local poultry
- Peruvians are major consumers of turkey during Christmas and New Year’s. - The food retail sector is becoming more popular not

industry is strong. only in Lima, but also in the province. - TPA*: 5 years.
Poultry meat cuts (HS 020711, 020712)
$1,230 million
7,242 tons ($7.5 million)
40.5 percent
9 percent
- Strong local industry. - Argentina (35
percent of the market), Brazil (34 percent), Chile (20 percent) and Bolivia (12 percent) are major exporters.
- Peruvians are major consumers of poultry. - TPA*: 10 years.
Bread, pastry, cookies (HS 1905)
N/A
3,644 tons ($7.9 million)
20 percent
0 percent
- Major suppliers
are the United States (21 percent market share), Colombia (20 percent), Ecuador (20 percent), Brazil (10 percent) and Argentina (8 percent)
- TPA*: duty free on entry into force, 3 or 5 years.
Sauces, soups & broths (HS 2103, 2104)
N/A
5,752 tons ($10.97 million)
HS 2103 6.8 percent, HS 2104 17.8 percent
9 percent
- Major suppliers are the United States (33 percent market share), Chile (14 percent) Colombia (13 percent). China (11 percent) and Mexico (9 percent)
- TPA*: duty free on entry into force except for soy sauce and mustard (5 years).
Wine (HS 2204)
21 million liters
7.3 million
liters ($20.5 million)
12.4 percent
9 percent
- Argentina (47 percent market
share), Chile (29 percent), and Spain (11 percent) are major exporters. - Strong promotions. - Only regular wine consumers recognize U.S. wine quality.
- There is a niche market for quality wines for which the United States can be appreciated and price
competitive. - Peru’s wine consumption is growing. - TPA*: 3 to 5 years linear.
Note: TRQ = Tariff Rate Quota, on a first-come first-serve basis. Sources: World Trade Atlas, USTR, Ministry of Agriculture (Minag), Gestion and El Comercio Newspapers
B. Products not Present in Significant Quantities, but which have good sales Potential:
Product/ Product Category
Imports
2009
Average Annual Import Growth
(2004-09)
Import Tariff Rate
Key Constraints Over Market Development
Market Attractiveness
for the U.S.
Chicken leg quarters (HS 020713,
5,575
tons
41 percent
9 percent
- Strong Poultry industry in Peru. - The United States’ major competitor is
- TPA*: 17 years, 12,000 MT quota with 8 percent increase; for mechanically deboned meat (MDM), 3

020714) ($4.3 million)
Chile (81 percent of the market),
years. - The sausage industry demands the product as a lower cost ingredient. - Open market for the United States since April 2006. In 2009, the United States held 20 percent of the market.
Peaches, cherries and Nectarines (HS 0809)
1,798 tons ($1.4 million)
1.2 percent
9 percent
- Chile is major supplier with 98 percent of the market.
- Importers are interested in U.S. peaches and nectarines. - TPA*: Duty free on entry into force.
Nuts and almonds (HS 0802)
277 tons ($1.2 million)
25 percent
9percent
- Chile (47 percent of the market) is the second largest supplier.
- U.S. imports have grown 783 percent in respect to 2008. The United States is the major supplier with 51percent of the market. - Importers recognize that U.S. quality of nuts and almonds is better than competitors. - TPA*: Duty free on entry into force except for chestnut (5 years).
Grapes, raisins (HS 080620)
6,322 tons ($7.6 million)
14 percent
9 percent
- There are no significant imports from the United States. - Chile holds almost 100 percent of the market.
- U.S. window: September to December. - TPA*: Duty free on entry into force.
Citrus (HS 0805)
56 tons ($0.04 million)
-15 percent
9 percent
- Chile is the second major supplier with 44 percent of the market. - The United States holds 49 percent of the market.
- Recognized quality of U.S. oranges and tangerines. - Export window for the United States is from January to March. - TPA*: Duty free on entry into force or 5 years.
Other fresh fruit (HS 0810)
925 tons ($1 million)
34 percent
9 percent
- Chile is practically the only supplier. - Imports are mainly kiwi.
- The TPA will open opportunities for the United States not only to export kiwis, but also cranberries (very well accepted in juice), strawberries, etc. - TPA*: Duty free or 5
years
Pork Meat (HS 0203)
1,251 tons ($2.2 million)
52 percent
9 percent
- Peruvians are not used to eating pork. - Local industry produces more than 100,000 MT - The industry is the same as the poultry
industry. - Chile is the major supplier with 93
- Pork imports are growing. - U.S. pork will benefit from TPA implementation. - TPA*: 5 years
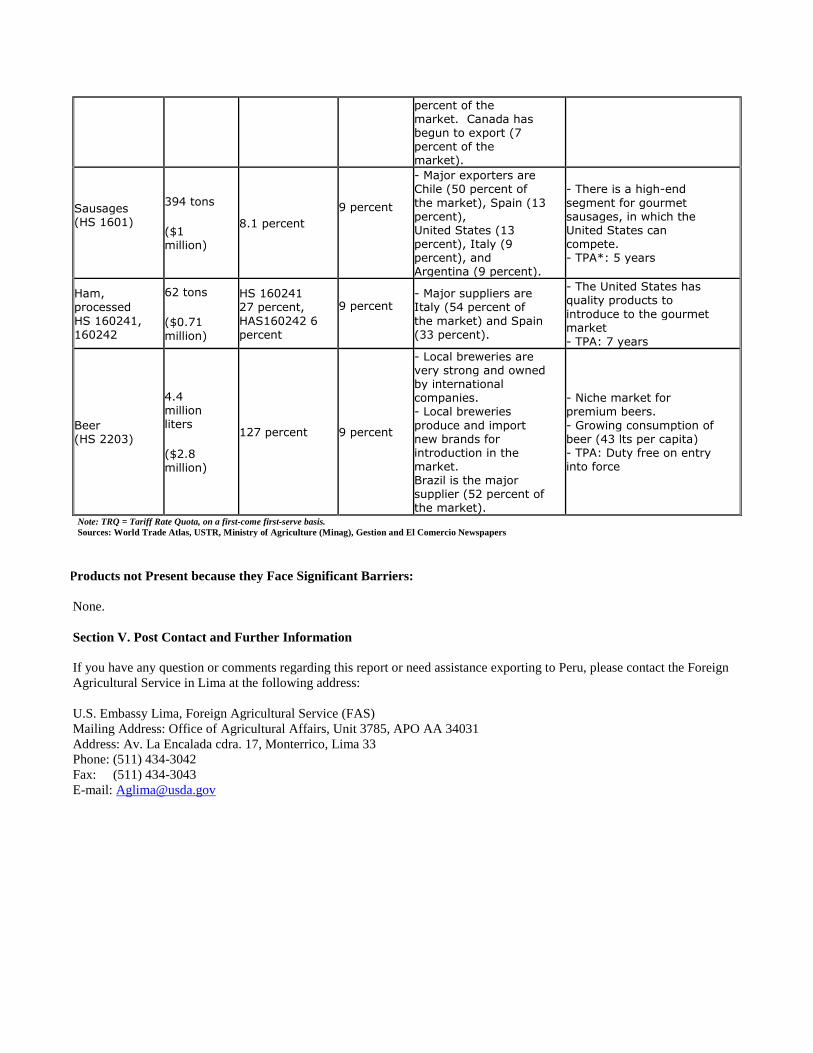
percent of the market. Canada has begun to export (7 percent of the market).
Sausages (HS 1601)
394 tons ($1 million)
8.1 percent
9 percent
- Major exporters are Chile (50 percent of
the market), Spain (13 percent), United States (13 percent), Italy (9 percent), and Argentina (9 percent).
- There is a high-end
segment for gourmet sausages, in which the United States can compete. - TPA*: 5 years
Ham, processed HS 160241, 160242
62 tons ($0.71 million)
HS 160241 27 percent, HAS160242 6 percent
9 percent
- Major suppliers are Italy (54 percent of
the market) and Spain (33 percent).
- The United States has quality products to
introduce to the gourmet market - TPA: 7 years
Beer (HS 2203)
4.4 million liters ($2.8 million)
127 percent 9 percent
- Local breweries are very strong and owned by international companies. - Local breweries
produce and import new brands for introduction in the market. Brazil is the major supplier (52 percent of the market).
- Niche market for premium beers. - Growing consumption of beer (43 lts per capita) - TPA: Duty free on entry into force
Note: TRQ = Tariff Rate Quota, on a first-come first-serve basis. Sources: World Trade Atlas, USTR, Ministry of Agriculture (Minag), Gestion and El Comercio Newspapers
C. Products not Present because they Face Significant Barriers:
None.
Section V. Post Contact and Further Information
If you have any question or comments regarding this report or need assistance exporting to Peru, please contact the Foreign
Agricultural Service in Lima at the following address:
U.S. Embassy Lima, Foreign Agricultural Service (FAS)
Mailing Address: Office of Agricultural Affairs, Unit 3785, APO AA 34031
Address: Av. La Encalada cdra. 17, Monterrico, Lima 33
Phone: (511) 434-3042
Fax: (511) 434-3043
E-mail: [email protected]