Peru: Economic Outlook - mef.gob.pe · PDF filePeru: Economic Outlook Luis Miguel Castilla...
20
Peru: Economic Outlook Luis Miguel Castilla Minister of Economy and Finance May, 2013
Transcript of Peru: Economic Outlook - mef.gob.pe · PDF filePeru: Economic Outlook Luis Miguel Castilla...
Peru: Economic Outlook
Luis Miguel Castilla Minister of Economy and Finance
May, 2013
2
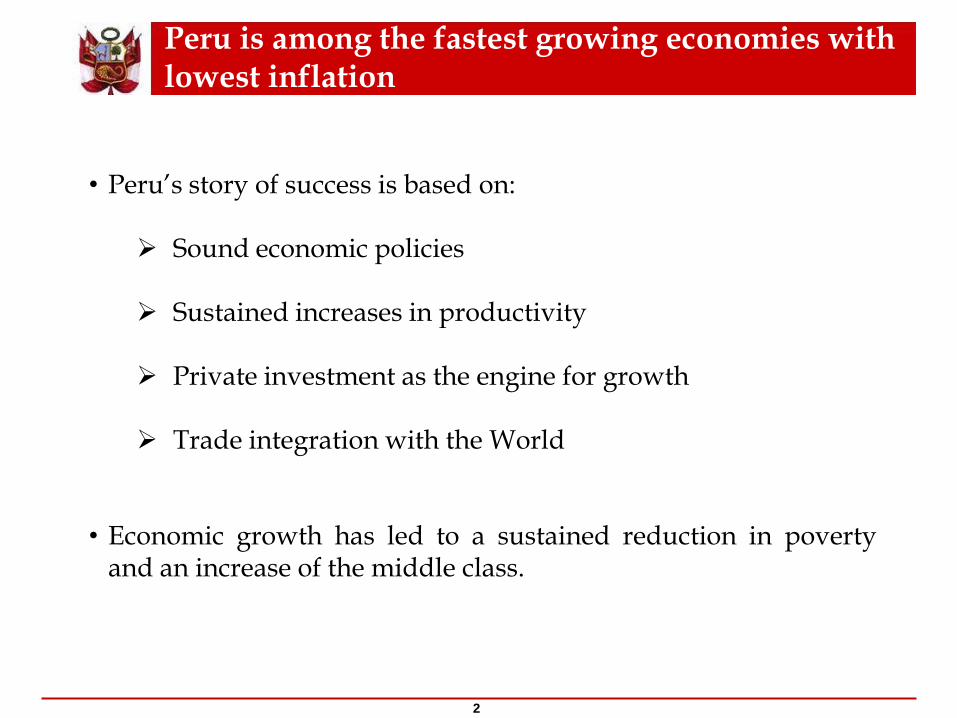
Peru is among the fastest growing economies with lowest inflation
• Peru’s story of success is based on: Sound economic policies
Sustained increases in productivity Private investment as the engine for growth Trade integration with the World
• Economic growth has led to a sustained reduction in poverty and an increase of the middle class.

Peru’s macroeconomic performance over the past decade has been exceptional
3
LATAM: Real GDP Growth and Inflation (2002-2012)
Source: MEF, IMF
LATAM: GDP Growth and Inflation (Average % change)
During 2002-2012, Real GDP grew at an average annual rate of 6.4 percent (the highest in Latin America), and the annual inflation rate fell to 2.8 percent on average (the lowest in Latin America).
GDP Inflation
Peru 6.4 2.8
Chile 4.4 3.3
Mexico 2.3 4.4
Colombia 4.5 4.8
Brazil 3.6 6.4
Argentina 5.6 11.5
0
2
4
6
8
10
12
14
0 1 2 3 4 5 6 7
Avera
ge In
flatio
n r
ate
(%
)
Average Real GDP Growth (%)
Peru
Argentina
Chile
Colombia
Brazil
Mexico

Economic growth has reduced poverty
Source: INEI, MTPE.
More adequate employment (Metropolitan Lima,% of total employment)
2012 2002
Reduction of Poverty and Extreme Poverty
(% of population)
More Decentralized Jobs (Urban Peru firms with 10 or more employees)
(Accumulated% change Jan-Dec. 2012 / Jan-Dec. 2002)
0
20
40
60
80
100
120
Caja
marc
a
Pucallp
a
Pis
co
Iquito
s
Chin
cha
Tacna
Chic
layo
Cusco
Metr
. Lim
a
Tara
po
to
Huancayo
Are
quip
a
Puno
Ica
Tru
jillo
Piu
ra
Peru:average growth 61.4%
39
61
Adequate employment
Underemployment59
41Adequate
employmentUnderemployment
58.755.6
49.1
42.4
37.333.5
30.827.8
25.8
16.4 15.813.8
11.2 10.9 9.57.6 6.3 6.0
0
10
20
30
40
50
60
70
2004 2005 2006 2007 2008 2009 2010 2011 2012
Total poverty Extreme poverty
4

Risk factors
5
• Intensification of the Eurozone crisis.
• Slowdown in China’s economic performance.
• Weaker U.S. growth.
• Plummeting commodity prices (60% of total exports).
• Less private investment due to a deterioration in expectations.
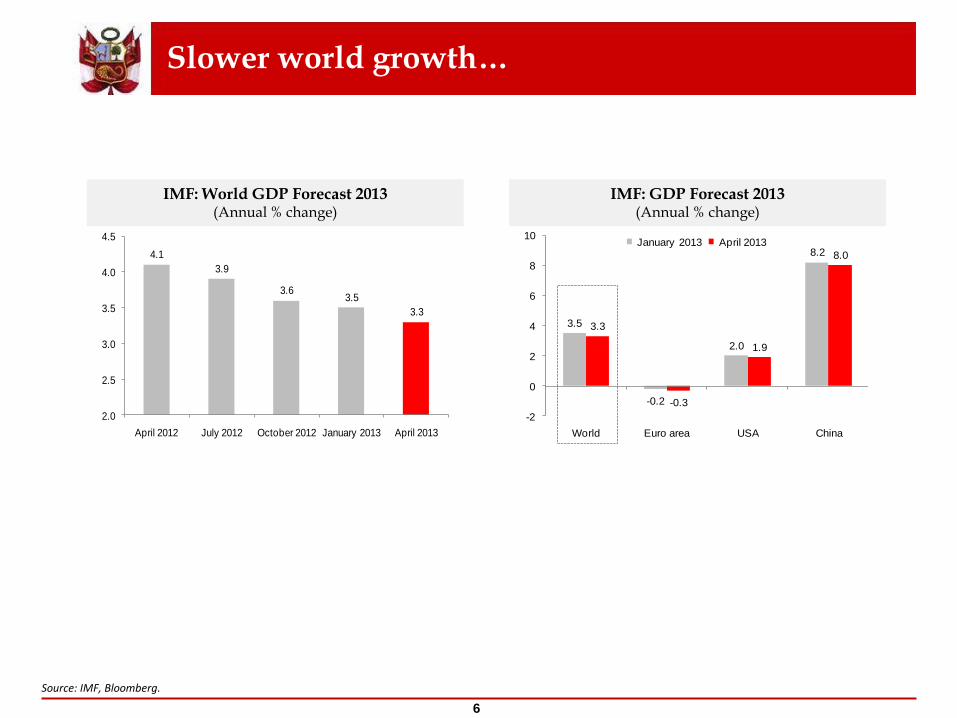
Slower world growth…
Source: IMF, Bloomberg.
IMF: GDP Forecast 2013 (Annual % change)
IMF: World GDP Forecast 2013 (Annual % change)
3.5
-0.2
2.0
8.2
3.3
-0.3
1.9
8.0
-2
0
2
4
6
8
10
World Euro area USA China
January 2013 April 20134.1
3.9
3.63.5
3.3
2.0
2.5
3.0
3.5
4.0
4.5
April 2012 July 2012 October 2012 January 2013 April 2013
6

... is affecting the economic performance of Latin America
Source: IMF, Bloomberg.
7
Chile and Mexico: GDP (Annual % change)
Brazil and Colombia: Industrial Production (Annual % change)
-11.5
-20
-15
-10
-5
0
5
10
15
20
25
M-09 M-10 M-11 M-12 M-13
Brazil Colombia
-3.3
Peru: GDP (Annual % change)
4.1
0.8
-10
-5
0
5
10
06Q1 07Q1 08Q1 09Q1 10Q1 11Q1 12Q1 13Q1
Chile Mexico
-2
0
2
4
6
8
10
12
06Q1 07Q1 08Q1 09Q1 10Q1 11Q1 12Q1 13Q1
4.8

Metals: Prices record strong downward corrections in short periods
1/ Prices updated to May 22, 2013. Source: Bloomberg.
8
Copper Price (US$ cents/pound)
Gold Price (US$/troy ounce)
Metal Prices (Prices, % change)
300
340
380
420
460
500
E-11 A-11 M-12 O-12 M-13
Prices fell 9.8% between 10 and
23 April
1,300
1,400
1,500
1,600
1,700
1,800
1,900
E-11 A-11 M-12 O-12 M-13
Prices fell 12.4% between 10 and
16 April
Closing Price % change % change
22.05.13 vs. 31.12.12 vs. 22.05.12
Copper US$ cents/pound 339 -5.5 -3.8
Gold US$/troy ounce 1,409 -15.0 -11.0
Lead US$ cents/pound 93 -12.2 6.5
Zinc US$ cents/pound 83 -9.5 -3.1
Silver US$/troy ounce 22 -26.5 -20.9

The share of commodities in economic activity and fiscal revenues is less than in other peer countries
9
Sources: IMF, 2012, “Fiscal Frameworks for Resource Rich Developing Countries”, May. IDB, 2013, “Rethinking reforms, How Latin America and the Caribbean Can Escape Suppressed World Growth”, March.
Commodity Revenue (% of total GDP, Average 2006-2010)
Estimated impact on total revenue caused by a fall of 25% in commodity prices
19
17
11
8
7
6
4
Venezuela
Trinidad & Tobago
Bolivia
Mexico
Ecuador
Chile
Peru
-4,5 -4,0 -3,5 -3,0 -2,5 -2,0 -1,5 -1,0 -0,5 0,0
Argentina
Colombia
Peru
Chile
Mexico
Venezuela
Trinidad & Tobago
Bolivia
Ecuador
Percent of potential GDP

411
18 20 2327
33
44
6875
82 8690
0
20
40
60
80
100
Saud
i A
rab
ia
Chile
United
Ara
b
Em
irate
s
Peru
Chin
a
Austr
alia
Co
lom
bia
Mexic
o
Bra
zil
Isra
el
Germ
any
Canad
a
United
Kin
gd
om
Peru has strong economic fundamentals to face external shocks
Peru: Overall Balance of Non-Financial Public Sector (% of GDP)
6 years of fiscal surpluses in the last 9 years
Peru: Net International Reserves (NIR)1
(US$ Million)
Country Risk2 (Basis points, average from May 1st to May 22nd, 2013)
Public Debt
(% of GDP)
8,180
17,275
67,060
0
20,000
40,000
60,000
80,000
2000 2006 2013
NIR for 20 months of imports
8 times
34% of GDP
1/ Updated on May 17th, 2013. 2/ Credit Rating by Moody’s. Source: BCRP,MEF, Bloomberg.
-0.3
2.3
2.9
2.4
-1.3
-0.3
1.92.2
0.7
-2.0
0.0
2.0
4.0
2005 2006 2007 2008 2009 2010 2011 2012 2013e
10
123
125
128
135
135
148
152
168
172
268
341
Peru (Baa2)
Philippines (Ba1)
Colombia (Baa3)
Chile (Aa3)
Mexico (Baa1)
China (Aa3)
Russia (Baa1)
Brazil (Baa2)
Indonesia (Baa3)
Emerging Economies
Latin America

0
1
2
3
4
5
6
7
8
9
10
2002 2003 2004 2005 2006 2007 2008 2009 2010 2011 2012 2013 F 2014 F 2015 F 2016 F
Peru can grow around its potential: 6.0-6.5%
11
Gross Domestic Product (Annual % change)
F: Forecast Source: BCRP, MEF.
Average Growth 2002-2012 6.4%

Ample potential for further economic growth and diversification
0
5
10
15
20
25
30
35
40
45
Peru Chile
0
2
4
6
8
10
Peru Chile Brazil
0
2
4
6
8
10
Peru Chile
0
1
2
3
4
5
6
Peru Colombia Chile Argentina
0
5
10
15
20
25
30
35
40
45
Peru Chile Argentina Brazil
0
10
20
30
40
50
60
Peru Chile Brazil Argentina
Exports of Wood and Paper 2012 (US$ Billion)
Exports of Copper 2012 (US$ Billion)
Agricultural Exports 2012 (US$ Billion)
Exports of Services 2012 (US$ Billion)
Tourist Arrivals 2012 (Million of people)
High-technology Exports 20111
(US$ per capita)
1 / According to the World Bank, high-technology exports are products with high R&D intensity, such as in aerospace, computers, pharmaceuticals, scientific instruments and electrical machinery. Source: SUNAT, BCRP, ministries of commerce of countries, World Bank.
12

There are important investment projects that will reach maturity in the short and medium term
Source: BCRP, MINEM, MTC, PROINVERSION, OSINERGMIN, Apoyo Consultoria.
13
Mining Region Las Bambas – Cu (Xstrata Copper) Apurimac Cerro Verde extension – Cu (Freeport-MacMoran Copper) Arequipa Toromocho – Cu (Chinalco) Junin Constancia – Cu (Hudbay) Cusco Marcona extension – Fe (Shougang) Ica Hydrocarbons Energy security and southern gas pipeline (Called) Cusco, Arequipa, Moquegua Block 58 (Petrobras) Cusco NGL & gas pipeline extension (TGP) Cusco Block 56 & 88 extension (Pluspetrol) Cusco Block 57 (Repsol & Petrobras) Junin, Cusco, Ucayali Block 67 (Perenco & PetroVietman) Loreto Block Z1 (BPZ, Pacific Rubiales Energy) Tumbes, Piura Electricity Chaglla Hydroelectric – 406MW (Odebrecht) Huanuco Cerro del Águila Hydroelectric – 402MW (Inkia Energy) Huancavelica Molloco Hydroelectric – 300MW (Corsan /Engevix/Enex) Arequipa Cheves Hydroelectric – 168 MW (SN Power) Lima Quitaracsa I Hydroelectric – 112MW (GDF Suez) Ancash Ilo Thermoelectric – 569MW (GDF Suez) Moquegua 220 kV Moyobamba – Iquitos transmission line and
associated substations (Called) Loreto, San Martin
Infrastructure Metro of Lima & Callao – Section 2 (Called) Lima Vía Parque Rimac (OAS S.R.L.) Lima Muelle Norte port modernization (APM Terminals) Lima Paita port extension (Tertir Terminais/Cosmos/Translei) Piura Longitudinal de la Sierra road – Section 2 (Called) Cajamarca, La Libertad WWTP & Outfall La Chira (Acciona Agua, GYM) Lima IIRSA Centro Road – Section II (Deviandes) Lima, Junin, Pasco Yurimaguas port terminal (Hidalgo e Hidalgo) Loreto

Sustained high private investment is key to ensure a GDP growth of about 6% per year
14
Source: MEF, Apoyo Consultoría, BCRP, SUNAT, INEI.
Total Investment: 2012 (% of GDP)
21.2
24.4 24.6 2526.7
0
5
10
15
20
25
30
Brazil Chile Colombia Mexico Peru
-1.6
6.2
11.6
-4
-2
0
2
4
6
8
10
12
1982-1991 1992-2001 2002-2012
Private Investment (Average % change )
Private Investment (Annual % change)
GDP (Annual % change )
11.6
0
2
4
6
8
10
12
14
Average2002-2012
t t+1 t+2
Baseline Stress
6.4
2
3
4
5
6
7
Average2002-2012
t t+1 t+2
Baseline Stress
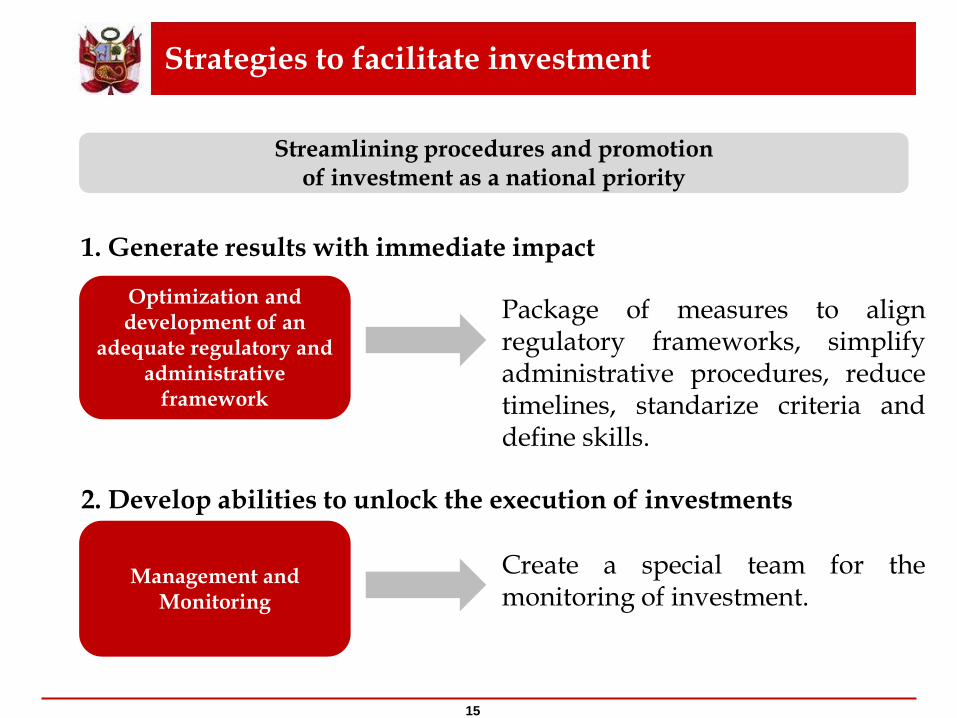
Strategies to facilitate investment
15
Package of measures to align
regulatory frameworks, simplify administrative procedures, reduce timelines, standarize criteria and define skills.
Create a special team for the
monitoring of investment.
Optimization and development of an
adequate regulatory and administrative
framework
Management and Monitoring
Streamlining procedures and promotion of investment as a national priority
1. Generate results with immediate impact
2. Develop abilities to unlock the execution of investments

Effects of initial normative measures: the case of Environmental Impact Assessment (EIA)
16
ANA: Environmental management instruments assessed 2013Q1
(Number of records)
ANA: Investment of Environmental management instruments assessed 2013Q1
(US$ million)
166 projects
US$ 3,307 million
Source: MEF, ANA (National Agency for Water)
0
10
20
30
40
50
60
Aprobado Observado
GORE MEM-AAE MEM-AAM MINAG
MINCETUR MVCS PRODUCE
56
(34%)
110
(66%)
Approved Observed
The measures will double the execution of investment in the same period of time
9701148
633414
2091 31
0
300
600
900
1200
1500
1800
Aprobado Observado
MVCS MINCETUR MEM-AAM MEM-AAE
1,694
(51%)
1,613
(49%)
Approved Observed

Law 30025 to promote investment in infrastructure
17
Railway
Line 1 & 2 of the Basic Netw ork of the Metro of Lima and Callao.
Road
Highw ay of Sol (Trujillo - Chiclay o - Piura -Sullana).
Road sections multimodal ax is Northern Amazon of “Plan de accion para la integracion de
infraestructura regional sudamericana - IIRSA” .
Section Nº 1 South Interoceanic Highw ay Corridor, Peru Brazil (San Juan de Marcona -
Urcos).
Section Nº 2 South Interoceanic Highw ay Corridor, Peru Brazil (Urcos - Inambari).
Section Nº 4 South Interoceanic Highw ay Corridor, Peru Brazil (Inambari - Azangaro).
Section Nº 5 South Interoceanic Highw ay Corridor, Peru Brazil (Ilo - Puno - Juliaca,
Matarani - Juliaca- Azangaro).
Road IIRSA Centro - Section Nº 2 (Bridge Ricardo Palma- La Oroy a - Huancay o & La
Oroy a - Cerro de Pasco).
Road section Nuev o Mocupe - Cay alti - Oy otun -Puente Las Delicias.
Road section Chancay /Variante Pasamay o - Huaral - Acos.
Red Vial Nº 4: Section Pativ ilca - Santa - Trujillo & Puerto Salav erry - Empalme PN1N.
Red Vial Nº 5: Section Ancon - Huacho - Pativ ilca, North Pan-American Highw ay .
Red Vial Nº 6: Section Bridge Pucusana - Cerro Azul - Ica, South Pan-American Highw ay
Longitudinal de la Sierra road: Chiple -Cuterv o - Cochabamba - Chota - Bambamarca-
Hualgay oc - Yanacocha, Cajabamba -Sausacocha, Huamachuco - Shorey - Santiago de
Chuco - Pallasca - Cabana - Tauca, Huallanca- Caraz, Huallanca - La Union -
Huanuco, Izcuchaca - May occ - Huanta Ay acucho -Andahuay las - Abancay .
Road Huancav elica-Santa Inés-Castrov irrey na - Pampano & Santa Ines-Rumichaca.
Road Imperial - Pampas - May occ.
Road Huancav elica - Lircay .
Longitudinal de la Selv a road “Puente Integracion - San Ignacio - Perico, Juanjui -
Campanilla - Pizana - Tocache - Von Humboldt- Puerto Bermudez - Villa Rica - Puente
Reither- Satipo - Mazamari - Puerto Ocopa” .
Port
Paita Port Terminal
San Martin Port Terminal.
Tourism
Gondolas Sy stem of Kuelap.
Others
Fishing complex La Puntilla.
Road
Road Cusco - Quillabamba.
Road Trujillo - Shiran - Shorey .
Road Quinua - San Francisco.
Road Cajamarca - Celendin - Balzas, Soritor - La Calzada.
Road Pimentel - Chiclay o.
Road Lima - Canta - Huay llay - Vicco - Emp. PE-3N (Shelby ).
Ev itamiento Highw ay - Chimbote.
Road Chongoy ape - Cochabamba.
Road La Tina - La Tina - Cachaquito.
Road Quilca - Matarani - Ilo.
Road Cañete - Lunahuana, Roncha -Chupaca - Puente Pilcomay o.
Road Tarata - Mazocruz - Ilav e.
Road Huamachuco - Bridge Pallar – Abra Naranjillo.
Ev itamiento Highw ay - Urcos.
Road Imata - Oscollo - Negromay o - San Genaro - Descanso - Sicuani & Negro May o-
Ocoruro - Pallpata - Yauri.
Road Las Vegas - Tarma.
Road Rio Seco - El Ahorcado - Say an.
Road Mala - Calango - La Capilla.
Linea Amarilla.
Southern Highw ay Project.
New Highw ay Projects, Lima city .
Arequipa La Joy a Regional Road, Arequipa.
Construction of Trunk Road Interconectora: Miraflores, Alto Selv a Alegre, Yanahuara,
Cay ma & Cerro Colorado - Arequipa.
Integrated Transport Sy stem SIT, Arequipa.
Rehabilitation and pav ing of the National Route Highw ay Nº PE - 18, Section Oy on -
Yanahuanca - Ambo.
Airport
“Capitan FAP Pedro Canga Rodriguez” Airport, Zarumilla, Tumbes.
“Capitan FAP Guillermo Concha Iberico” Airport, Castilla, Piura.
“Capitan FAP Victor Montes” International Airport, Talara, Piura.
“Capitan FAP José Abelardo Quiñones Gonzalez” Airport, Chiclay o, Lambay eque.
“Capitan FAP Carlos Martinez Pinillos” Airport, Trujillo, La Libertad.
“May or General FAP Armando Rev oredo Iglesias” Airport, Baños del Inca, Cajamarca.
“Comandante FAP German Arias Graziani” Airport, Carhuaz, Ancash.
“Coronel FAP Francisco Secada Vignetta” International Airport, Iquitos city , Loreto.
“Cadete FAP Guillermo del Castillo Paredes” Airport, Tarapoto city , San Martin.
“Capitan FAP Dav id Abensur Rengifo” Airport, Pucallpa city , Ucay ali.
Pisco International Airport, Pisco city , Ica.
“ Inca Manco Capac” International Airport, Juliaca city , Puno.
“Alfredo Rodriguez Ballon” International Airport, Arequipa city .
“Coronel FAPAlfredo Mendiv il Duarte” Airport, Ay acucho city
“Padre Aldamiz” International Airport, Puerto Maldonado city , Madre de Dios.
“Coronel FAP Carlos Ciriani Santa Rosa” International Airport, Tacna city .
Aerodrome of Puerto May o - Pichari.
Border
Relocation, construction and equipment of the border crossing in Inapari (Peru-Brasil),
Madre de Dios.
Desaguadero Border Crossing (Peru-Boliv ia).
Construction and equipment of the border complex in Tilali-Puerto Acosta.
Construction and equipment of border complex in El Alamor.
Construction and equipment of border complex in Saramiriza-Loja.
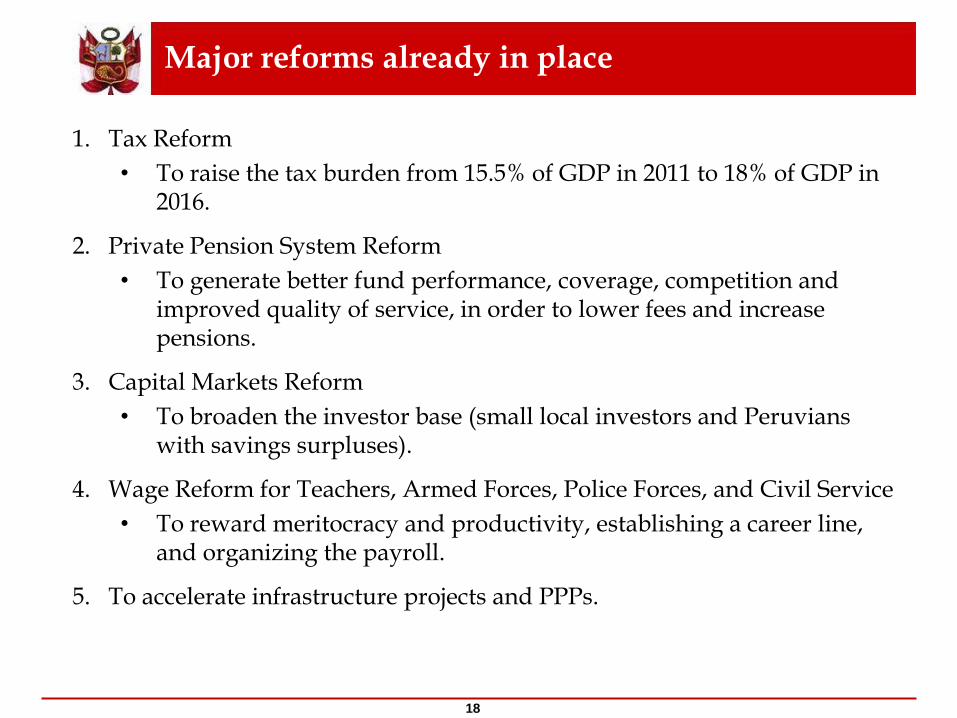
Major reforms already in place
1. Tax Reform
• To raise the tax burden from 15.5% of GDP in 2011 to 18% of GDP in 2016.
2. Private Pension System Reform
• To generate better fund performance, coverage, competition and improved quality of service, in order to lower fees and increase pensions.
3. Capital Markets Reform
• To broaden the investor base (small local investors and Peruvians with savings surpluses).
4. Wage Reform for Teachers, Armed Forces, Police Forces, and Civil Service
• To reward meritocracy and productivity, establishing a career line, and organizing the payroll.
5. To accelerate infrastructure projects and PPPs.
18
19
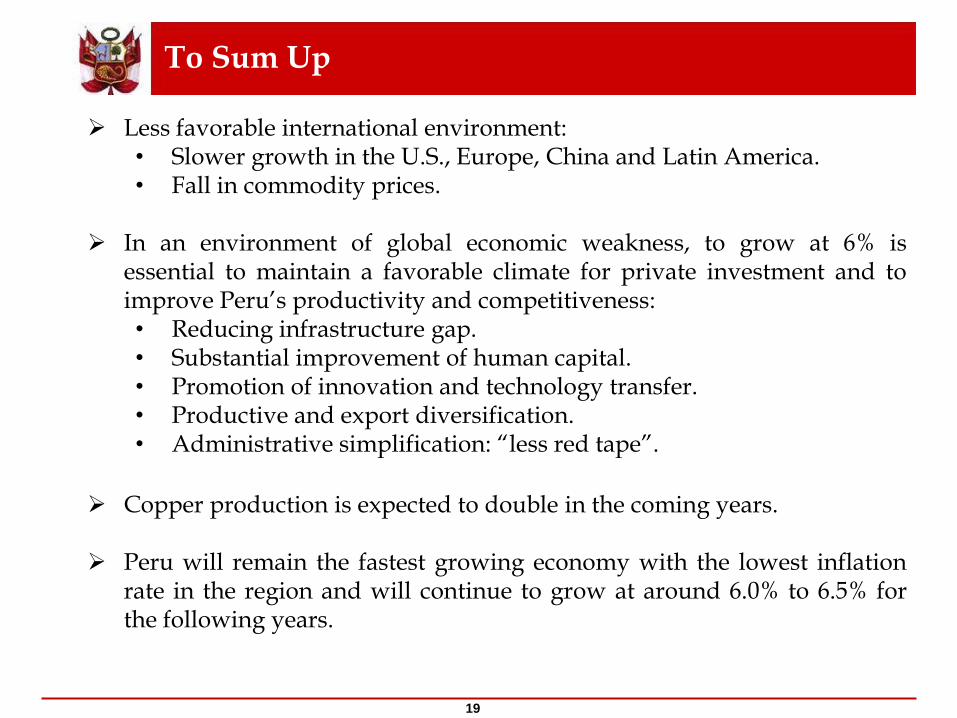
Less favorable international environment: • Slower growth in the U.S., Europe, China and Latin America. • Fall in commodity prices.
In an environment of global economic weakness, to grow at 6% is
essential to maintain a favorable climate for private investment and to improve Peru’s productivity and competitiveness: • Reducing infrastructure gap. • Substantial improvement of human capital. • Promotion of innovation and technology transfer. • Productive and export diversification. • Administrative simplification: “less red tape”.
Copper production is expected to double in the coming years.
Peru will remain the fastest growing economy with the lowest inflation
rate in the region and will continue to grow at around 6.0% to 6.5% for the following years.
To Sum Up

www.mef.gob.pe