Perten Science World - Analysis Instruments · Rapid Visco Analysis of food protein pastes The...
19
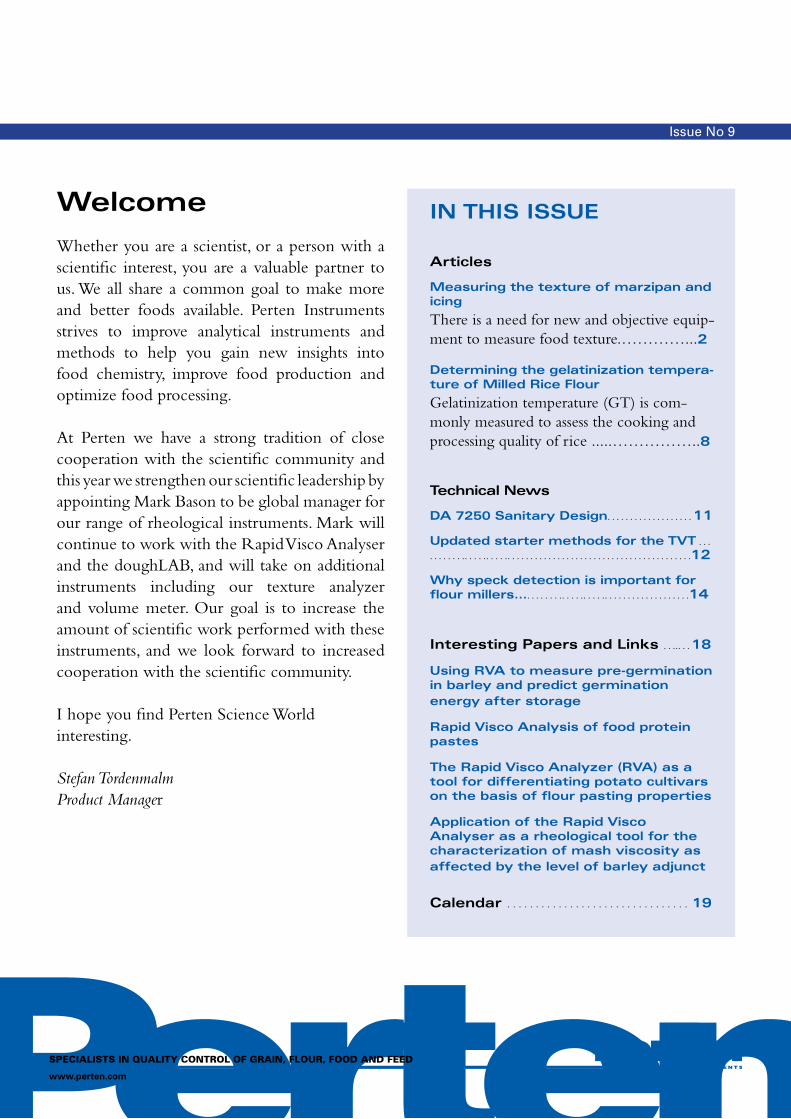
Whether you are a scientist, or a person with a scientific interest, you are a valuable partner to us. We all share a common goal to make more and better foods available. Perten Instruments strives to improve analytical instruments and methods to help you gain new insights into food chemistry, improve food production and optimize food processing. At Perten we have a strong tradition of close cooperation with the scientific community and this year we strengthen our scientific leadership by appointing Mark Bason to be global manager for our range of rheological instruments. Mark will continue to work with the Rapid Visco Analyser and the doughLAB, and will take on additional instruments including our texture analyzer and volume meter. Our goal is to increase the amount of scientific work performed with these instruments, and we look forward to increased cooperation with the scientific community. I hope you find Perten Science World interesting. Stefan Tordenmalm Product Manager SPECIALISTS IN QUALITY CONTROL OF GRAIN, FLOUR, FOOD AND FEED www.perten.com Welcome Perten Science World Issue No 9 IN THIS ISSUE Articles Measuring the texture of marzipan and icing There is a need for new and objective equip- ment to measure food texture.…………...2 Determining the gelatinization tempera- ture of Milled Rice Flour Gelatinization temperature (GT) is com- monly measured to assess the cooking and processing quality of rice .....……………..8 Technical News DA 7250 Sanitary Design. . . . . . . . . . . . . . . . . . . 11 Updated starter methods for the TVT . . . . . . . . . . .. . . . .. . . . .. . . . . . . . . . . . . . . . . . . . . . . . . . . . . . . . . . . . . . . . .12 Why speck detection is important for flour millers.... . . . . . . .. . . . .. . . . .. . . . . . . . . . . . . . . . . . .14 Interesting Papers and Links . . ... . . 18 Using RVA to measure pre-germination in barley and predict germination energy after storage Rapid Visco Analysis of food protein pastes The Rapid Visco Analyzer (RVA) as a tool for differentiating potato cultivars on the basis of flour pasting properties Application of the Rapid Visco Analyser as a rheological tool for the characterization of mash viscosity as affected by the level of barley adjunct Calendar . . . . . . . . . . . . . . . . . . . . . . . . . . . . . . . . 19
Transcript of Perten Science World - Analysis Instruments · Rapid Visco Analysis of food protein pastes The...
Whether you are a scientist, or a person with a scientific interest, you are a valuable partner to us. We all share a common goal to make more and better foods available. Perten Instruments strives to improve analytical instruments and methods to help you gain new insights into food chemistry, improve food production and optimize food processing.
At Perten we have a strong tradition of close cooperation with the scientific community and this year we strengthen our scientific leadership by appointing Mark Bason to be global manager for our range of rheological instruments. Mark will continue to work with the Rapid Visco Analyser and the doughLAB, and will take on additional instruments including our texture analyzer and volume meter. Our goal is to increase the amount of scientific work performed with these instruments, and we look forward to increased cooperation with the scientific community.
I hope you find Perten Science World interesting.
Stefan TordenmalmProduct Manager
SPECIALISTS IN QUALITY CONTROL OF GRAIN, FLOUR, FOOD AND FEED
www.perten.com
Welcome
Perten Science World
Issue No 9
IN THIS ISSUE
Articles
Measuring the texture of marzipan and icing
There is a need for new and objective equip-ment to measure food texture.…………...2 Determining the gelatinization tempera-ture of Milled Rice Flour
Gelatinization temperature (GT) is com-monly measured to assess the cooking and processing quality of rice .....……………..8
Technical News
DA 7250 Sanitary Design. . . . . . . . . . . . . . . . . . . 11
Updated starter methods for the TVT . . . . . . . . . . .. . . . .. . . . .. . . . . . . . . . . . . . . . . . . . . . . . . . . . . . . . . . . . . . . . .12
Why speck detection is important for flour millers.... . . . . . . .. . . . .. . . . .. . . . . . . . . . . . . . . . . . .14
Interesting Papers and Links . . ... . . 18
Using RVA to measure pre-germination in barley and predict germination energy after storage
Rapid Visco Analysis of food protein pastes
The Rapid Visco Analyzer (RVA) as a tool for differentiating potato cultivars on the basis of flour pasting properties
Application of the Rapid Visco Analyser as a rheological tool for the characterization of mash viscosity as affected by the level of barley adjunct
Calendar . . . . . . . . . . . . . . . . . . . . . . . . . . . . . . . . 19
- 2 -
Measuring the texture of marzipan and icing
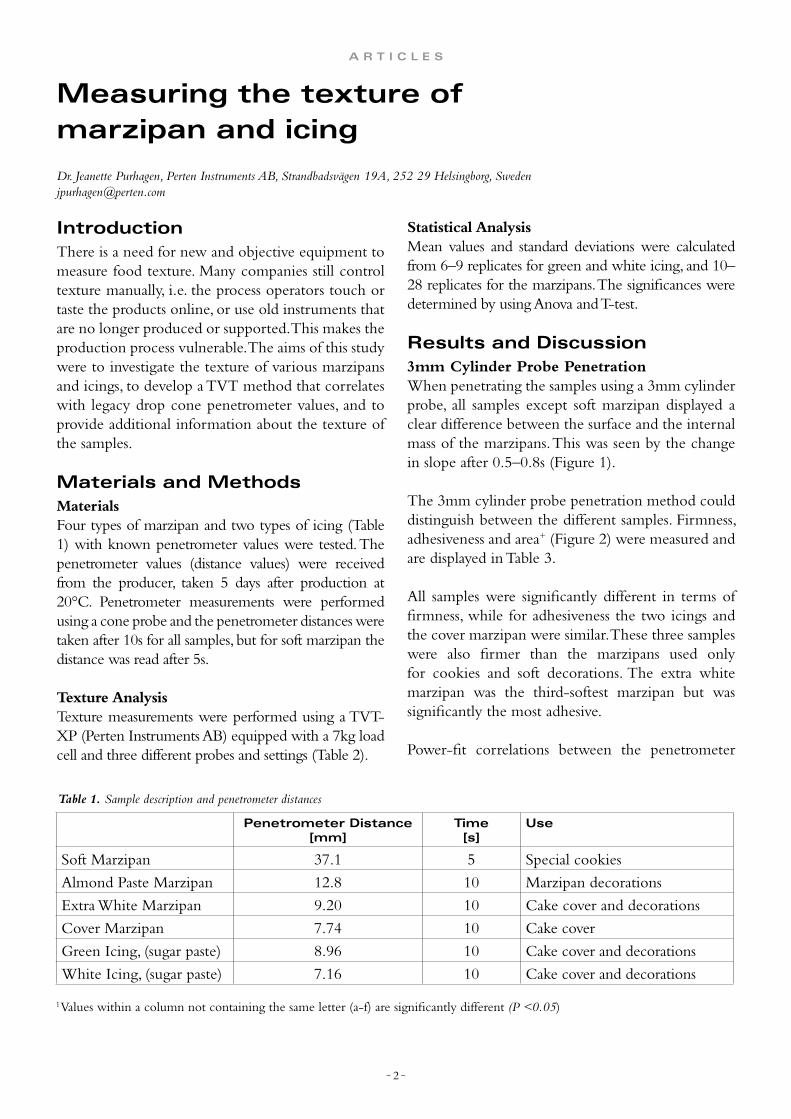
IntroductionThere is a need for new and objective equipment to measure food texture. Many companies still control texture manually, i.e. the process operators touch or taste the products online, or use old instruments that are no longer produced or supported. This makes the production process vulnerable. The aims of this study were to investigate the texture of various marzipans and icings, to develop a TVT method that correlates with legacy drop cone penetrometer values, and to provide additional information about the texture of the samples.
Materials and MethodsMaterialsFour types of marzipan and two types of icing (Table 1) with known penetrometer values were tested. The penetrometer values (distance values) were received from the producer, taken 5 days after production at 20°C. Penetrometer measurements were performed using a cone probe and the penetrometer distances were taken after 10s for all samples, but for soft marzipan the distance was read after 5s.
Texture AnalysisTexture measurements were performed using a TVT-XP (Perten Instruments AB) equipped with a 7kg load cell and three different probes and settings (Table 2).
A R T I C L E S
Statistical AnalysisMean values and standard deviations were calculated from 6–9 replicates for green and white icing, and 10–28 replicates for the marzipans. The significances were determined by using Anova and T-test.
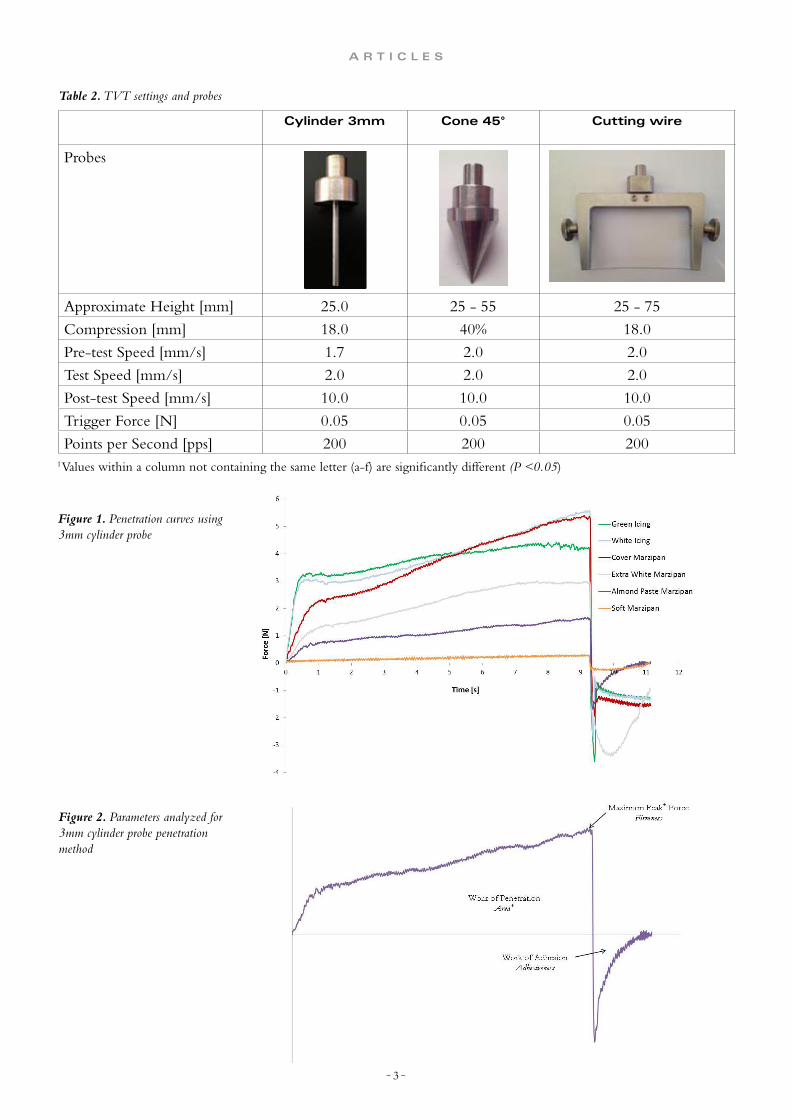
Results and Discussion3mm Cylinder Probe PenetrationWhen penetrating the samples using a 3mm cylinder probe, all samples except soft marzipan displayed a clear difference between the surface and the internal mass of the marzipans. This was seen by the change in slope after 0.5–0.8s (Figure 1).
The 3mm cylinder probe penetration method could distinguish between the different samples. Firmness, adhesiveness and area+ (Figure 2) were measured and are displayed in Table 3.
All samples were significantly different in terms of firmness, while for adhesiveness the two icings and the cover marzipan were similar. These three samples were also firmer than the marzipans used only for cookies and soft decorations. The extra white marzipan was the third-softest marzipan but was significantly the most adhesive.
Power-fit correlations between the penetrometer
Dr. Jeanette Purhagen, Perten Instruments AB, Strandbadsvägen 19A, 252 29 Helsingborg, [email protected]
Table 1. Sample description and penetrometer distances
Penetrometer Distance[mm]
Time[s]
Use
Soft Marzipan 37.1 5 Special cookies
Almond Paste Marzipan 12.8 10 Marzipan decorations
Extra White Marzipan 9.20 10 Cake cover and decorations
Cover Marzipan 7.74 10 Cake cover
Green Icing, (sugar paste) 8.96 10 Cake cover and decorations
White Icing, (sugar paste) 7.16 10 Cake cover and decorations
1 Values within a column not containing the same letter (a-f) are significantly different (P <0.05)
- 3 -
A R T I C L E S
Figure 2. Parameters analyzed for 3mm cylinder probe penetration method
Cylinder 3mm Cone 45° Cutting wire
Probes
Approximate Height [mm] 25.0 25 - 55 25 - 75
Compression [mm] 18.0 40% 18.0
Pre-test Speed [mm/s] 1.7 2.0 2.0
Test Speed [mm/s] 2.0 2.0 2.0
Post-test Speed [mm/s] 10.0 10.0 10.0
Trigger Force [N] 0.05 0.05 0.05
Points per Second [pps] 200 200 200
Table 2. TVT settings and probes
Figure 1. Penetration curves using 3mm cylinder probe
1 Values within a column not containing the same letter (a-f) are significantly different (P <0.05)

- 4 -
Figure 3. Power-fit correlation between penetrometer values at 10s and firmness for 3mm cylinder penetration method
Figure 4. Power-fit correlation between penetrometer values at 10s and area for 3mm cylinder penetration method
Table 3. Penetration with 3mm cylinder probe, mean values and std. dev.1
Sample Firmness[N]
Adhesiveness[N*mm]
Area+[N*mm]
Soft Marzipan 0.3 ± 0.0a 2.9 ± 0.7a 2.8 ± 0.6a
Almond Paste Marzipan 1.6 ± 0.1b 12.1 ± 5.4b 19.7 ± 1.6b
Extra White Marzipan 2.9 ± 0.2c 37.4 ± 6.9e 37.9 ± 3.6c
Cover Marzipan 5.2 ± 0.2e 24.4 ± 2.9d 63.9 ± 1.9d
Green Icing 3.9 ± 0.9d 22.9 ± 2.9cd 64.9 ± 7.2d
White Icing 6.1 ± 0.5f 21.0 ± 1.9c 79.0 ± 5.2e
1 Values within a column not containing the same letter (a-f) are significantly different (P <0.05)
A R T I C L E S

- 5 -
values and the firmness and area+ were found and can be seen in Figures 3 and 4. The firmness gave higher correlation factor (0.9756) than the area+
(0.8806) when compared to the penetrometer values. As expected, no correlation was found between the penetrometer values and the adhesiveness.
45° Cone Probe PenetrationWhen penetrating the samples using a 45° cone probe, all samples gave the same curve pattern but to different force levels (Figure 5).
The 45° cone probe penetration method could distinguish between different samples, with the results and their significant differences displayed in Table 4.
All marzipan products were significantly different
in terms of firmness, adhesiveness and penetration area when using the 45° cone probe. The extra white marzipan was still the most adhesive product. The penetration distances were slightly different, however, the final order in terms of firmness and area was reached after less than 5s (<10 mm).
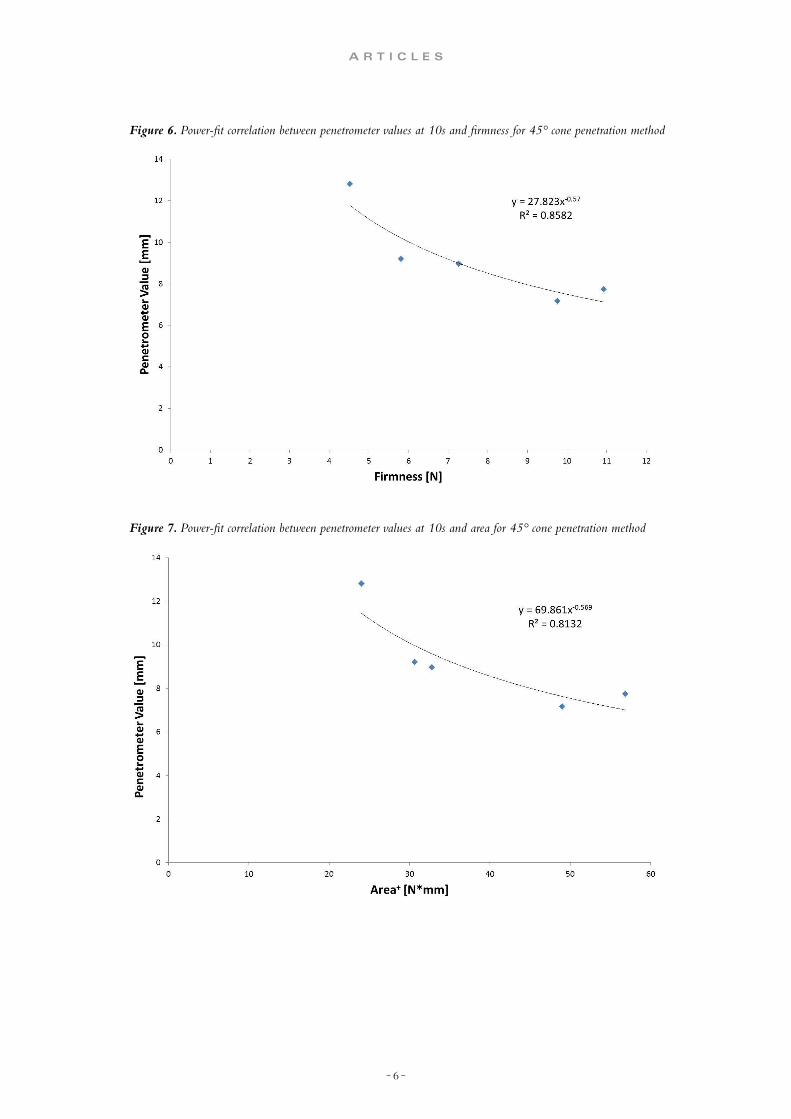
The penetrometer values were correlated with both the firmness and the area+ and can be seen in Figures 6 and 7. The correlation factors were R2=0.8582 and R2=0.8132 respectively.
Wire cutting methodWhen cutting the samples using a wire probe, most samples displayed a clear difference between the sur-face and the internal mass of the marzipan (Figure 8). The firmer the sample, the greater the difference between the surface firmness and the internal mass
A R T I C L E S
Figure 5. Penetration curves using 45° cone probe
Table 4. Penetration with 45° cone probe, mean values and std. dev.1
Sample Firmness[N]
Adhesiveness[N*mm]
Area+
[N*mm]Distance
MAX
[mm]
Soft Marzipan 0.4 ± 0.0a 2.9 ± 0.2a 2.6 ± 0.2a 11.8 ± 0.2
Almond Paste Marzipan 4.5 ± 0.3b 9.7 ± 4.0d 22.9 ± 1.4b 12.3 ± 0.1
Extra White Marzipan 5.8 ± 0.5c 24.4 ± 3.9f 29.5 ± 2.4c 12.1 ± 0.0
Green Icing 7.3 ± 0.6d 4.1 ± 0.6b 31.7 ± 2.3d 10.3 ± 0.1
White Icing 9.8 ± 0.7e 5.5 ± 1.6c 47.3 ± 6.0e 10.8 ± 0.4
Cover Marzipan 10.9 ± 0.4f 14.3 ± 3.2e 53.4 ± 2.0f 12.1 ± 0.0
1 Values within a column not containing the same letter (a-f) are significantly different (P <0.05)
- 6 -
Figure 6. Power-fit correlation between penetrometer values at 10s and firmness for 45° cone penetration method
Figure 7. Power-fit correlation between penetrometer values at 10s and area for 45° cone penetration method
A R T I C L E S

- 7 -
Figure 8. Cutting using wire probe
firmness (plateau firmness) (Figure 8, Table 5). When comparing the two icings, only the surface distances differed significantly.
ConclusionsBoth the 3mm cylinder probe method and the 45° cone probe method gave good power-fit correlations to the given penetrometer values for both firmness and area+. The correlation, R2 factor, would have been even higher if the soft marzipan
Table 5. Cutting with wire probe, mean values and std. dev.1
had been included in the correlation. However, this sample was excluded in the fitting due to the shorter penetrometer reading time. All three methods gave additional information regarding the texture of the marzipans compared to a normal penetrometer measurement. Differences between the surface and internal mass were clearly seen when using the 3mm cylinder penetration method and the wire cutting method and could be useful as a measurement of drying of the surface in open air.
Sample Surface Firmness
[N]
Plateau Firmness
[N]
Surface Distance
[mm]
Area+
[N*mm]
Adhesiveness
[N*mm]
Almond Paste Marzipan 8.3 ± 0.8a 7.7 ± 0.9a 12.6 ± 3.9d 131.3 ± 21.3a 23.0 ± 2.7c
Extra White Marzipan 12.4 ± 2.0b 10.3 ± 0.4b 10.3 ± 2.4bcd 181.5 ± 28.6b 18.9 ± 5.4b
Green Icing 23.6 ± 1.4c 15.5 ± 1.4c 6.8 ± 0.3a 317.1 ± 51.0c 16.2 ± 3.5ab
White Icing 22.6 ± 3.3c 16.0 ± 2.0c 8.2 ± 1.2b 335.0 ± 36.3c 13.2 ± 1.8a
Cover Marzipan 31.9 ± 2.3d 21.9 ± 1.7d 9.4 ± 0.8c 460.7 ± 24.3d 43.3 ± 7.6d
1 Values within a column not containing the same letter (a-d) are significantly different (P <0.05)
A R T I C L E S

- 8 -
A R T I C L E S
Determining the gelatinization temperature of Milled Rice Flour
Summary of the AACCI Approved Methods Technical Committee Report: Collaborative Study on a Method for Determining the Gelatinization Temperature of Milled Rice Flour Using the Rapid Visco Analyser (1).
Gelatinization temperature (GT) is commonly measured to assess the cooking and processing quality of rice. Traditional methods of estimating rice GT using the amylograph and differential scanning calorimetry (DSC) are time-consuming and, in the case of the amylograph, require large quantities of samples, which is not well suited to rice breeding requirements. The Rapid Visco Analyser (RVA) is commonly used in laboratories to measure the pasting properties of rice and provides the advantages of speed, ease of use and small sample size requirements.
A faster and simpler method to accurately determine rice GT using a small quantity of sample has been sought by rice breeders and others in the industry.
A collaborative study was conducted by the AACCI Rice Milling and Quality Technical Committee to assess a new method optimized for determining the GT of milled rice flour using the RVA.
Twelve laboratories analyzed three rice flour samples (Pecos, Dixiebell and Jacinto), representing low-, medium- and high-GT varieties, to evaluate the performance of the method. In addition, seven laboratories returned amylograph data and six returned DSC data. Analysis of variance was performed on the data to obtain precision statistics for the method.
The RVA GT method involved holding a concentrated slurry of rice flour (6.00 ± 0.01 g, corrected to 12% moisture basis) in 24.0 ± 0.1 g of distilled water at 50°C for 5 min, heating it from 50 to 95°C at 3ºC/min (Table 1), and measuring the viscosity of the sample throughout. The GT, observed at the point of rapid increase in viscosity,
Jennifer M.C. Dang1 and Mark L. Bason2, Perten Instruments of Australia, 13/2 Eden Park Drive, Macquarie Park NSW 2113, [email protected], [email protected]
Time (hh:mm:ss) Type Value
00:00:00 Temperature 50ºC
00:00:00 Speed 960 rpm
00:00:10 Speed 160 rpm
00:05:00 Temperature 50ºC
00:20:00 Temperature 95ºC
00:20:10 End of test -
End of test time: 00:20:10
Initial idle temperature: 50 ± 1ºC
Time between readings: 4 s
Viscosity units: centiPoise (cP)a
a12 cP = 1 Rapid Visco Unit (RVU)
Table 1. Test configuration for the RVA GT method

- 9 -
A R T I C L E S
is defined as the temperature at which the viscosity first increases by at least 24 cP (=24 mPa.sec = 2 Rapid Visco units [RVU]) within 6 sec (Figure 1). Because high viscosities were obtained, the tests were manually stopped when viscosity reached ≈1,200 cP (100 RVU), which occurred between 10 and 15 min into the test.
Within-laboratory repeatability (Sr) values were ≤0.15ºC for the method and between-laboratory reproducibility (SR) values were
≤0.25ºC (Table 2). RVA GT results were similar to but more precise (lower RSDr and RSDR for each sample and overall) than those obtained from parallel testing using the amylograph and DSC (Table 2).
The RVA method showed good precision for use in determining the GT of milled rice flour, and has been approved as official AACCI method 61-04.01 (2). The method is simple to perform, rapid and requires only a small amount of sample, making it well suited to the requirements of rice breeders.
Figure 1. Example of rice flour testing using the RVA method
Method Sample No. of Labs
Mean Sr RSDr SR RSDR
RVA GT Pecos 9 66.9 0.14 0.21 0.23 0.34
Dixiebell 10 73.2 0.15 0.20 0.25 0.35
Jacinto 10 76.5 0.12 0.16 0.25 0.33
Amylograph GT Pecos 6 65.9 0.30 0.45 0.85 1.28
Dixiebell 7 70.5 0.29 0.41 1.92 2.73
Jacinto 6 75.4 0.09 0.11 0.89 1.18
DSC To
Pecos 4 64.6 0.37 0.57 0.50 0.77
Dixiebell 6 73.2 0.84 1.14 2.26 3.09
Jacinto 6 77.1 0.90 1.17 2.88 3.73
aAmylograph and DSC results are included for comparison. bSr = repeatability standard deviation (oC), RSDr = repeatability relative standard deviation (%), SR = reproducibility standard deviation (oC), RSDR = reproducibility relative standard deviation (%), GT = gelatinization temperature (oC), T
o = gelatinisation
onset temperature (oC).
Table 2. Precision statistics for the gelatinization temperature of rice flour by RVA, Amylograph and DSC methodsa,b

- 1 0 -
References
1. Dang, J.M.C., and Bason, M.L. 2014. AACCI Approved Methods Technical Committee Report: Collaborative Study on a Method for Determining the Gelatinization Temperature of Milled Rice Flour Using the Rapid Visco Analyser. Cereal Foods World, 59(1): 31–34.
2. AACC International. Approved Methods of Analysis, 11th Ed. Method 61-04.01. Gelatinization Temperature of Milled Rice Flour. AACC International: St. Paul, MN, U.S.A. http://dx.doi.org/10.1094/AACCIntMethod-61-04.01.
A R T I C L E S
- 1 1 -
T E C H N I C A L N E W S
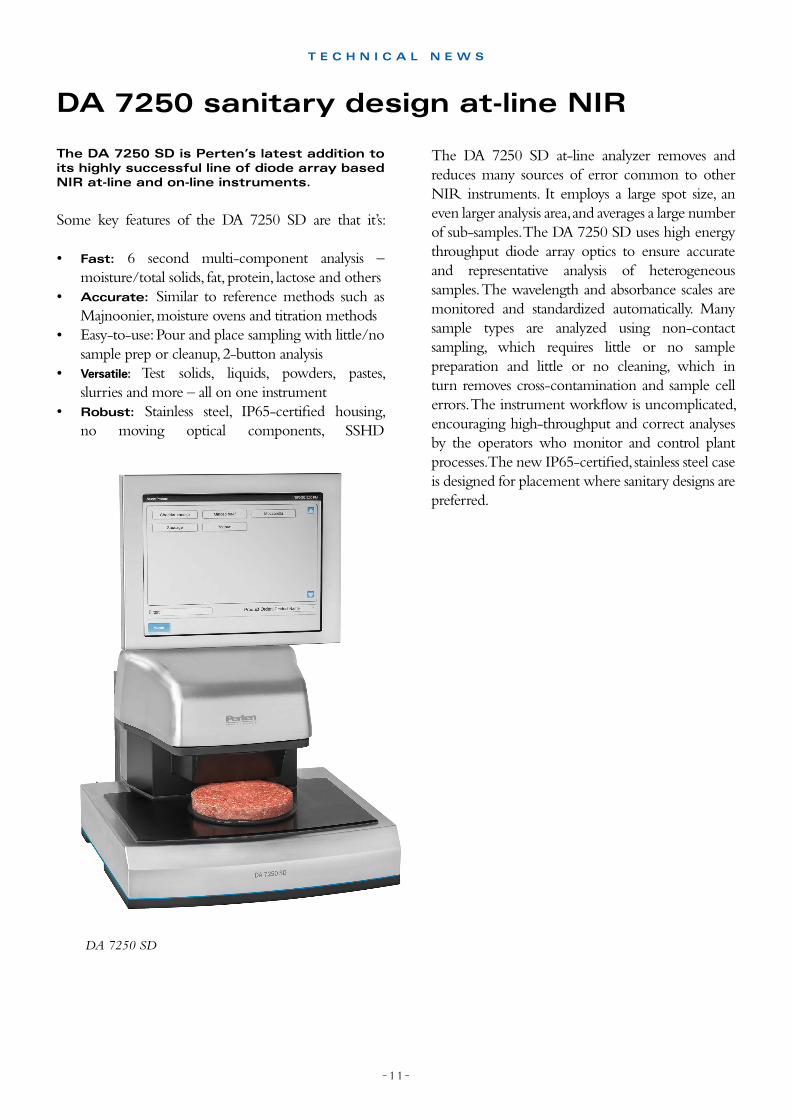
DA 7250 sanitary design at-line NIR
The DA 7250 SD is Perten’s latest addition to its highly successful line of diode array based NIR at-line and on-line instruments.
Some key features of the DA 7250 SD are that it’s:
• Fast: 6 second multi-component analysis – moisture/total solids, fat, protein, lactose and others
• Accurate: Similar to reference methods such as Majnoonier, moisture ovens and titration methods
• Easy-to-use: Pour and place sampling with little/no sample prep or cleanup, 2-button analysis
• Versatile: Test solids, liquids, powders, pastes, slurries and more – all on one instrument
• Robust: Stainless steel, IP65-certified housing, no moving optical components, SSHD
The DA 7250 SD at-line analyzer removes and reduces many sources of error common to other NIR instruments. It employs a large spot size, an even larger analysis area, and averages a large number of sub-samples. The DA 7250 SD uses high energy throughput diode array optics to ensure accurate and representative analysis of heterogeneous samples. The wavelength and absorbance scales are monitored and standardized automatically. Many sample types are analyzed using non-contact sampling, which requires little or no sample preparation and little or no cleaning, which in turn removes cross-contamination and sample cell errors. The instrument workflow is uncomplicated, encouraging high-throughput and correct analyses by the operators who monitor and control plant processes. The new IP65-certified, stainless steel case is designed for placement where sanitary designs are preferred.
DA 7250 SD
- 1 2 -
T E C H N I C A L N E W S
Updated starter methods for the TVT
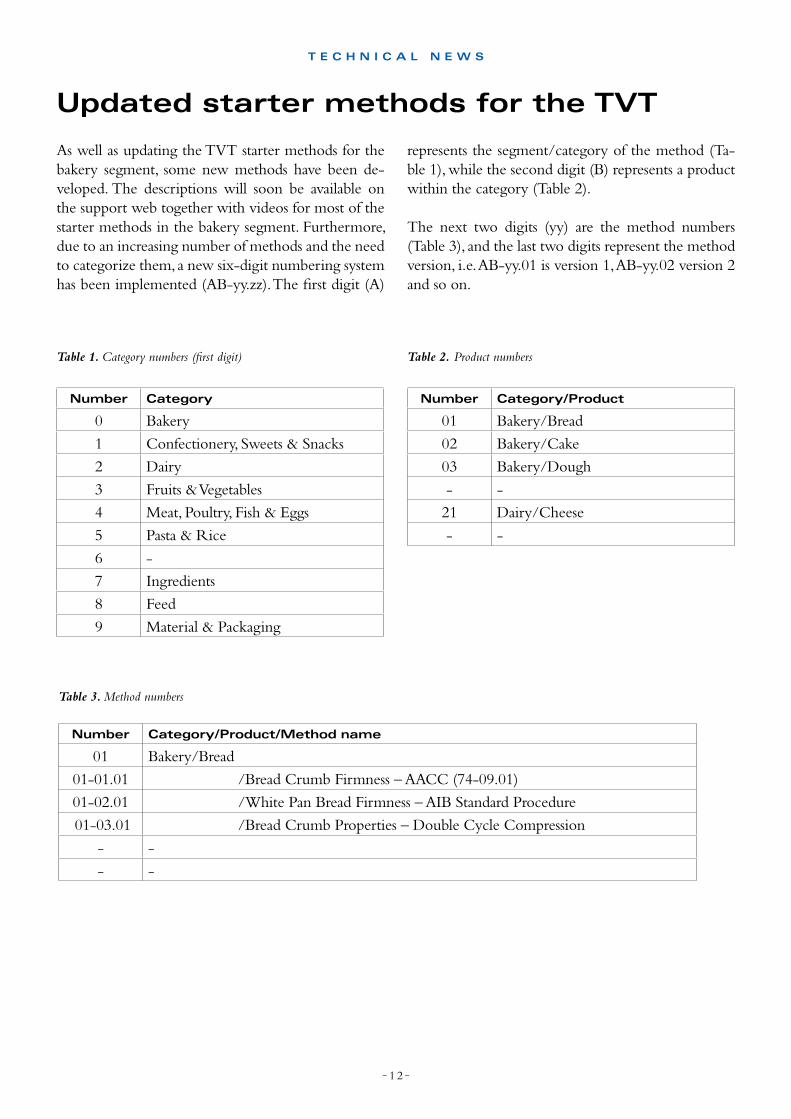
As well as updating the TVT starter methods for the bakery segment, some new methods have been de-veloped. The descriptions will soon be available on the support web together with videos for most of the starter methods in the bakery segment. Furthermore, due to an increasing number of methods and the need to categorize them, a new six-digit numbering system has been implemented (AB-yy.zz). The first digit (A)
represents the segment/category of the method (Ta-ble 1), while the second digit (B) represents a product within the category (Table 2).
The next two digits (yy) are the method numbers (Table 3), and the last two digits represent the method version, i.e. AB-yy.01 is version 1, AB-yy.02 version 2 and so on.
Number Category/Product/Method name
01 Bakery/Bread
01-01.01 /Bread Crumb Firmness – AACC (74-09.01)
01-02.01 /White Pan Bread Firmness – AIB Standard Procedure
01-03.01 /Bread Crumb Properties – Double Cycle Compression
- -
- -
Table 3. Method numbers
Number Category
0 Bakery
1 Confectionery, Sweets & Snacks
2 Dairy
3 Fruits & Vegetables
4 Meat, Poultry, Fish & Eggs
5 Pasta & Rice
6 -
7 Ingredients
8 Feed
9 Material & Packaging
Table 1. Category numbers (first digit)
Number Category/Product
01 Bakery/Bread
02 Bakery/Cake
03 Bakery/Dough
- -
21 Dairy/Cheese
- -
Table 2. Product numbers

- 1 3 -
The new method descriptions contain information about probe selection with part number, test mode settings, sample preparation and curve descriptions (Figure 1).
Figure 1. Example of a new method description
T E C H N I C A L N E W S

- 1 4 -
T E C H N I C A L N E W S
Why speck detection is important for flour millers
Specks, or darker bran particles in flour, have been a specification parameter for durum semolina for quite some time. The specks negatively influence the visual appearance in pasta, and customers perceive the product as poor. In wheat flour milling, the detection of specks is of less concern; it is not a common specification parameter for wheat flour.
From a processing point of view, the detection of specks can help a miller avoid running scrap, customer rejects and costly reworks.
The DA 7300 contains a digital camera and a dedicated illumination system (Figure 1). The camera produces high-quality images of the product
that is measured and provides a live video for the operators so they can continuously visually monitor the product in the stream (Figure 2).
Once the images are captured, the DA 7300 performs an image analysis whereby the specks are detected and counted, the size of the specks is noted, and they are grouped according to their size. Although the
Magnus Lindgren, Perten Instruments AB, Instrumentvägen 29-31, SE-126 53 Hägersten, Sweden, [email protected]
Figure 2. Live camera images and video for visually monitoring the product stream
Figure 1. DA 7300

- 1 5 -
users typically view only one size that corresponds with their manual reference method, the system identifies 16 different groups (Figure 3).
It is also possible to separate specks into two categories based on their darkness. Note the blue circle indicating a dark speck and the red indicating a light speck particle (Figure 4).
While from a quality point of view detecting and counting the specks is of interest, there is one aspect that overshadows the others when milling wheat flour. Tempering is designed to soften the bran particles to ensure they are soft, not brittle, in order to avoid them cracking into small pieces and passing through the sifter. However, a small amount of specks normally appears, as one cannot expect to sift away 100%.
Figure 3. Specks grouped by size
Figure 4. Categories of darkness: blue circle – dark speck; red circle – light speck
T E C H N I C A L N E W S

- 1 6 -
In addition, the woven fabric though which the flour is sifted wears and sometimes breaks. When this happens, the amount of speck particles can increase dramatically in a short time. The miller then needs to stop the milling process and replace the broken cloth. The challenge for the miller though is to know when this happens, and the DA 7300 speck detection provides invaluable information to detect breakages immediately.
Real-life scenarioPlease note how the red trend for specks increases in Figure 5.
By looking at the camera images (Figure 6), the miller, a careful gentleman, verifies that the specks have indeed increased. It now becomes obvious that the mill needs to be stopped and the cause found.
Figure 5. Snapshot of monitoring curves
Figure 6. Snapshot of monitoring images
T E C H N I C A L N E W S

- 1 7 -
The frames are pulled from the sifter cabinets and inspected (Figure 7).
Figure 7. Inspection of the frames
A tear is found quickly, with a minimum of sub-specification flour produced (Figure 8).
Figure 8. The tear causing the problem
In this case, the miller was able to detect the specks, shut the milling down, replace the broken sifter fabric and be up and running again within an hour.
For more information on the DA 7300 speck detection and other DA 7300 functions, please contact Magnus Lindgren, [email protected]
T E C H N I C A L N E W S

- 1 8 -
P E R T E N I N P U B L I C A T I O N S
Cozzolino, D., Roumeliotis, S. and Eglinton, J. 2014. Combining partial least squares (PLS) discriminant analysis and Rapid Visco Analyser (RVA) to classify barley samples according to year of harvest and locality. Food Analytical Methods, 7(4):887–892.
Dang, J.M.C. and Bason, M.L. 2014. AACCI Approved Methods Technical Committee Report: Collaborative study on a method for determining the gelatinization temperature of milled rice flour using the Rapid Visco Analyser. Cereal Foods World, 59(1):31–34.
De la Haba, M.-J., Pérez-Marín, D., Rial-Huerta, D. and Sánchez, A.-T. 2014. Texture prediction in intact green asparagus by near infrared (NIR) spectroscopy, assaying linear and non-linear regression strategies. Food Analytical Methods, 7(3):606–615.
De la Hera, E., Martinez, M., Oliete, B. and Gómez, M. 2013. Influence of flour particle size on quality of gluten-free rice cakes. Food and Bioprocess Technology, 6(9):2280–2288.
Lv, X., Li, H., Wang, J., Dong, Y., Li, J. and Qin, Y. 2013. Quantification of fishmeal in compound feed using NIR spectroscopy. Food Analytical Methods, 6(3):906–914.
Macharia, G.K., Peña, R.J., Simsek, S. and Anderson, J.A. 2014. Variation at glutenin subunit loci, single kernel characterization and evaluation of grain protein in East African bread wheat varieties. Euphytica, DOI:10.1007/s10681-014-1077-5.
Mandge, H.M., Sharma, S. and Dar, B.N. 2014. Instant multigrain porridge: effect of cooking treatment on physicochemical and functional properties. Journal of Food Science and Technology, 51(1):97–103.
Onwulata, C.I., Tunick, M.H. and Thomas-Gahring, A.E. 2013. Rapid Visco Analysis of food protein pastes. Journal of Food Processing and Preservation, DOI:10.1111/jfpp.12188.
Pasqualone, A., Paradiso, V.M., Summo, C., Caponio, F. and Gomes, T. 2014. Influence of drying conditions on volatile compounds of pasta. Food and Bioprocess Technology, 7(3):719–731.
Soltovski de Oliveira, C. Pereira Andrade, M.M., Cenck Colmen, T.A., Oliviera Gomes da Costa, F.J. and Schnitzler, E. 2014. Thermal, structural and rheological behaviour of native and modified waxy corn starch with hydrochloric acid at different temperatures. Journal of Thermal Analysis and Calorimetry, 115(1):13–18.
Wang, G., Leonard, J.M., von Zitzewitz, J., Peterson, C.J., Ross, A.S. and Riera-Lizarazu, O. 2014. Marker–trait association analysis of kernel hardness and related agronomic traits in a core collection of wheat lines - Online First. Molecular Breeding, DOI:10.1007/s11032-014-0028-0.

C A L E N D A R
Come and see Perten Instruments products and meet Perten Instruments representatives.
Bourse maritime des grains: France, la Rochelle, June 20Borgeby Fältdagar: Sweden, Bjärred, June 25-26Australian Grains Industry Conference (AGIC): Australia, Melbourne, July 28-3064th Australian Cereal Chemistry Conference: Australia, Bris-bane, Aug 24-2712th Euro Fed Lipid Congress: France, Montpellier, Sep 14-17WoTS - World of Technology & Science: Netherlands, Utrecht, Sep 30-Oct 3FoodTech 2014: Denmark, Herning, Oct 28-30WT Asia 2014: Singapore, Nov 12-14IAOM 2014: South Africa, Cape Town, Dec 3-6
SPECIALISTS IN QUALITY CONTROL OF GRAIN, FLOUR, FOOD AND FEED
www.perten.com