Pertamina Energy Management System (EMS) - · PDF filePERTAMINA | 1 Energy Efficiency...
21
Pertamina Energy Management System (EMS) PT PERTAMINA (PERSERO) DIREKTORAT PENGOLAHAN January 30, 2014 CONFIDENTIAL AND PROPRIETARY Any use of this material without specific permission of Pertamina is strictly prohibited Dhani Prasetyawan
Transcript of Pertamina Energy Management System (EMS) - · PDF filePERTAMINA | 1 Energy Efficiency...

PertaminaEnergy Management System(EMS)
PT PERTAMINA (PERSERO)DIREKTORAT PENGOLAHAN
January 30, 2014
CONFIDENTIAL AND PROPRIETARYAny use of this material without specific permission of Pertamina is strictly prohibited
Dhani Prasetyawan

PERTAMINA | 1
Energy Efficiency transformation for an oil refining company
1
Performance
▪ Identify EE initiatives to reach best-in-class performance
▪ Implement 3 operational improvement initiatives as Value Accelerators
▪ Set up implementation for 2 Capex Initiatives
People
▪ Build capability to sustain program
▪ Codify technical and non-technical aspects of project in ‘EMS Brick’
▪ Set up frontline engagement system
Process
▪ Improve equipment readiness to supportenergy efficiency
▪ Identify and cascade energy KPIs andKAIs from GM to Operators
▪ Implement performance monitoring anddialogues system
▪ We are a National OilCompany in south eastAsia with a refiningcapacity of 1 MBD i.e.,~1% of global refiningcapacity
▪ For a refinery, energycost forms ~60% ofoperating cost, hencethe opportunity for EEis immense
▪ Set up EnergyManagement System(EMS)
Scope of EMS

PERTAMINA |2
2
Performance Process
EMS has achieved impact across all 3 areas of the transformationframework (for 2 Refinery units)
Million USD inenergy savingopportunityidentified
135
Million USD savedthrough initiatives
implemented19
KPIs cascaded toall functions
Improvement inEquipmentreadiness
Areas whereperformancemeetings are held
121
13%
14
People
EMS Bootcamp modules delivered22
Key stakeholders trained48
Pages of energy best practices (EMSbrick) codified>1000
PERTAMINA |
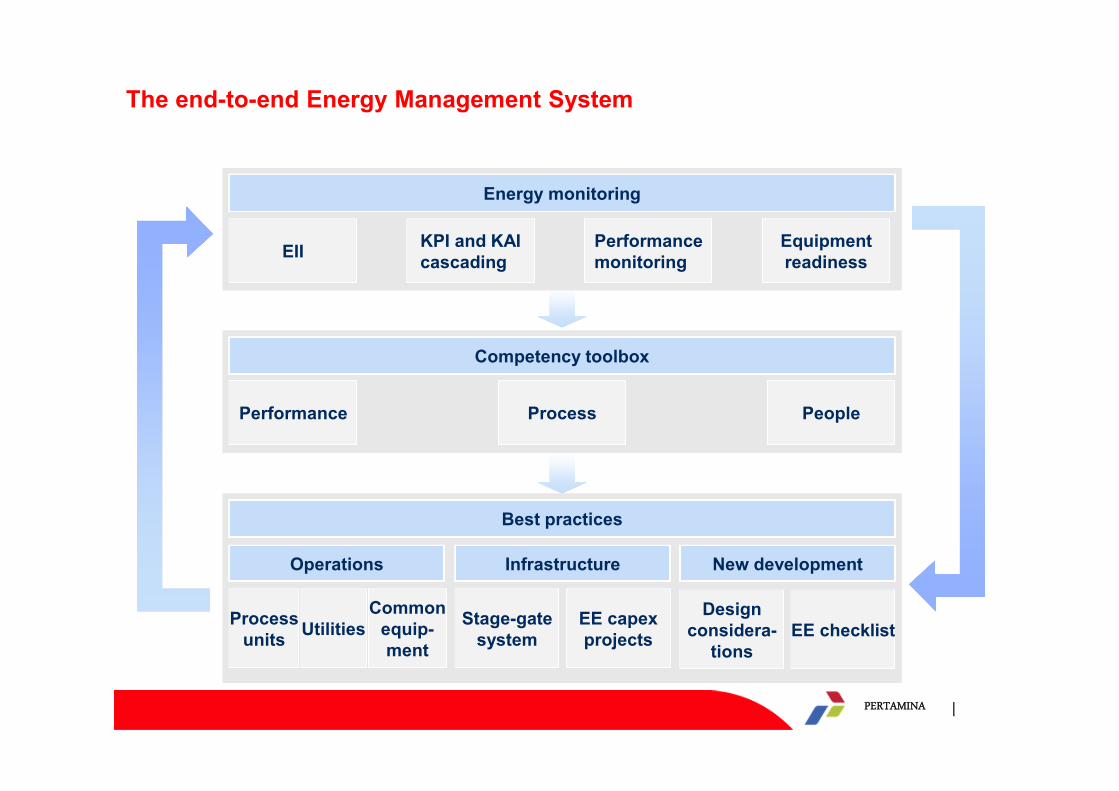
The end-to-end Energy Management System
Best practices
Operations
Processunits
UtilitiesCommon
equip-ment
EII
Energy monitoring
KPI and KAIcascading
Performancemonitoring
Equipmentreadiness
Competency toolbox
Performance Process People
Infrastructure
Stage-gatesystem
EE capexprojects
New development
Designconsidera-
tionsEE checklist

PERTAMINA |
Before and after of EMS program
People
Process
Performance
Before After
▪ Year and year incrementalimprovement target
▪ 4 year target to reach topquartile performance
▪ Distributed initiatives not clearlylinked to meet target
▪ Consolidated initiatives to meettarget
▪ Energy KPIs for selectedfunctions only e.g., production,engineering
▪ Energy KPIs for all energyrelated functions incl.maintenance, procurement
▪ Energy discussed only inselected meeting e.g.,hydrocarbon meeting
▪ Energy discussed in all crucialmeetings e.g., operationsmeeting, reliability meeting
▪ No specific training on energyefficiency
▪ Comprehensive capabilitybuilding toolkit incl. 22 modules
▪ Only 1 unit level energycompetition
▪ 3 different energy competitionsat individual and group levels
Overall ▪ Different energy practicesacross all sites
▪ Standardized energy managementsystem across all sites

PERTAMINA |
However, there are some challenges that we faced in rolling out EMS
5
Adherence tonew processesand procedures
Issue How it was addressed
▪ Communication cascade about the program and whateach member is required to do
▪ Coaching through 3 bootcamps to ensure employees feelconfident that they can implement change
▪ Role modeling by senior management to get involved inproject
▪ Formal mechanisms such as KPIs
Ownership inseniormanagement
▪ In monthly steering committee meetings refinery GeneralManagers presented the progress of EMS in theirrefineries, which put them under pressure to showprogress
Roll out toother refineries
▪ Pull forward program – training sessions conducted bychange agents of the pilot sites for change agents fromother sites

PERTAMINA | 66
Total
We identified initiatives to take us to EII Quartile 1
Potential EII 88.0
Area 4 0.7
Area 3 0.1
Area 2 2.1
Area 1 1.9
Utilities 12.3
Initiativesalready
identified6.1
Current EII 111.2
Sa
vin
gs
op
po
rtu
nit
y
▪ Reduce let down of MP to LP steamU.1
Energy consumptionSolomon EII index Top initiatives quantified
Savings$mn/yr Capex
▪ Maximize steam turbine inlet temperature4U.2
▪ Improve STG condenser performance4U.3
▪ Install air pre heatersU.4
▪ Reduce O2 level of boilersU.7
▪ Replace STGs with CogenerationU.8
▪ Reduce steam leaksU.9
▪ Increase coil inlet temperatureF1.1
▪ Reduce excess O2 level in furnacesF1.3
▪ Reduce radiation loss from furnacesF1.4
▪ Install air pre heatersF1.8
▪ Reduce flaring1F2.1
▪ Increase coil inlet temperatureF2.2
▪ Reduce spillback on platformer compressorsF2.3
▪ Reduce excess O2 level in furnacesF2.4
▪ Reduce radiation loss from furnacesF2.5
▪ Install air pre heatersF2.9
▪ Reduce excess O2 level in furnaces in unit IL.1.1
▪ Reduce excess O2 level in furnaces in unit IIL.2.1
▪ Reduce excess O2 level in furnacesP.1
▪ Reduce radiation loss from furnacesP.2
1 Does not have EII impact but has potential to reduce energy cost 2 Does not require procurement and investment decision 3 Long lead times4 Impact is not counted in the long term EII and cost reduction because of future CoG replacement
Day to day operation
Minor capex2
Heavy capex3
x.x
x.x
x.x
EIIreduction
17.1 77.0
0.28
0.274
0.244
0.14
0.14
11.54
0.20
0.46
0.22
0.23
0.40
n/a
0.98
0.10
0.51
0.51
0.62
0.03
0.08
0.34
0.34
2.06
2.014
1.814
0.57
0.55
45.61
1.45
1.83
0.85
0.90
1.60
7.42
3.87
0.60
2.02
2.03
2.44
0.13
0.32
1.36
1.36
▪ Negligible
▪ Negligible
▪ 0.5
▪ 0.5
▪ Negligible
▪ 50-100
▪ Negligible
▪ 0.15
▪ Negligible
▪ 0.1
▪ 1
▪ Negligible
▪ 0.15
▪ TBD
▪ Negligible
▪ 0.1
▪ 0.5
▪ Negligible
▪ Negligible
▪ Negligible
▪ 0.1
PERFORMANCE: OPPORTUNITY IDENTIFICATION

PERTAMINA | 7
Calculated furnace efficiency
Operational parameters and impact tracking
O2 level, % Stack temp/BWT , oC Furnace efficiency2, %
Operational parameters Operational impact
Fuel consumptionreduction, BSRF
Selected operational levers from were implemented in theplant as proof of concept
1 Baseline period is from Jan – Dec 2012, with abnormal data removed
Implemen-tation startdate
1Apr2013
3 Apr2013
5 Apr2013
85F-201
025F- 101Aand B
012F-101
7070
Mar
N/A
Feb
N/A
Jan
N/A
TotalApr
55
TotalAprMar
N/A
Feb
N/A
Jan
N/A
3.0
4.1
W2 A
3.0
W1 A
3.6
B
3.8335332336
301335
W2 AW1 AB
82.1
86.0
W2 A
83.7
W1 A
82.9
B
82.3
4.0
7.0
W2 A
8.3
W1 A
7.9
B
7.8 302301305
282315
W2 AW1 AB
80.4
83.9
W2 A
79.6
W1 A
80.1
B
80.0
3.43.5
W2 A
3.0
W1 A
3.2
B
4.4 379380383
361393
W2 AW1 AB W2 A
80.7
W1 A
80.6
B
79.2
81.5
79.7
Before implementation
After implementation
Target
Baseline1
More than USD 0.2 million/year of projectedannualized impact from the 3 fired heaters
PERFORMANCE: VALUE ACCELERATOR

PERTAMINA | 8
We engaged an engineering firm to provide expertise for Capex Initiatives
Snapshot of Compabloc PFS report Highlights of report
▪ Loss in CIT due to fouling in HEXE110/E111Root cause
analysis
▪ Welded plate HEX (e.g.,combabloc) 2 parallel sets
▪ Project cost = $4.7mn
Investmentpackage
▪ $21mn/yr from debottlenecking ofCDU
▪ $4.3mn/yr from reduced energyconsumption due to higher CIT
Impactanalysis
▪ 1 yr counting only energy impact▪ 3 months including process impactBusiness
case
▪ Estimated 1 years of projectduration
▪ However, significant increasepossible due to approval andcontracting process
Action planand projecttrackingtemplate
PERFORMANCE: CAPEX INITIATIVE

PERTAMINA | 9
EII achievements
We set up a KPI based system to track normalized energy efficiency foreach refinery…
91
108
9396 -5%
MarFebJanBaseline
Reasons for change
▪ Efficiency increase dueto increase in share offuel gas
Energy KPI breakdown by EE areas
6.0
-8%
5.86.0
6.6
▪ Lower cokeproduction in RCCdue to low MCRT
▪ Catalyst problem inPLF
Reasons for change
UtilitiesTSRF/ton steam
+2%
6.36.1
6.46.5
Ton steam/MW▪ STG B & E operating in
extraction mode tosatisfy increase in MPSdemand
-4%12.8
9.6
11.8 11.4
Area 1%TSRF/ton feed
Area 2%TSRF/ton feed
6.512%
5.836.12
6.65
Area 3%TSRF/ton feed
317.1 0%
MarFeb
422.8
Jan
316.8
Baseline
317.6
24%
35%
21%
20%
% of totalenergy cons.
High EII dueto blackout
▪ While lower MCRT reducesTSRF/ton feed, it alsoreduces the standard energy,thereby increasing EII
▪ TSRF/ton feed has reduced,but due to catalyst problem inPLF, the std energy hasreduced, thereby increasing EII
PROCESS: KPI AND KAI CASCADING

PERTAMINA | 10
Equipment readiness was tracked on a weekly basis and actiontaken for low readiness areas
Low readiness units
Airregisters
Readiness
▪ 11-F-101▪ 12-F-101▪ 13-F-101
FDF /IDF
▪ 11-F-101
Soot-blowing
▪ 52B-101A▪ 52B-101B▪ 52B-101C▪ 52B-101D▪ 52B-101E▪ 52B-101F▪ 15B-101
Stackdamper
▪ 14F-101
Draftgauge
▪ 15B-101▪ 31F-101▪ 31F-102▪ 31F-103▪ 32F-101▪ 32F-102▪ 32F-103▪ 32F-104
Firing
Combustionair supply
Temperatureindicator
Sootblowing
Drafting
Flow andpressuremeasuring
Others
Total
Boilers Furnaces
100
100
100
73
100
100
100
99
100
95
100
83
83
95
100
96
100%
90%-100%
>90%
818080
50
60609090706748
>75%
75
506767670000
PROCESS: EQUIPMENT READINESS

PERTAMINA | 1111
… which was cascaded down to every related position of the organization
General Manager
Production IImanager
MPS manager
ME manager
Turnaroundmanager
Eng & Devmanager
Reliabilitymanager
Procurementmanager
RPO manager
Production Imanager
OPI manager
▪ EII
▪ TSRF/feed1
▪ EII
▪ Equipment & accessories readiness for energy-related equipment2
▪ Lead time in energy-related repair/replacement work
▪ % completion of energy-related initiatives recommended for TA
▪ EII improvement gained from supporting programs based on EII roadmap; EII
▪ % of EE-related program improvement based on Master Plan
▪ Service level of accessories/equipment/ service/catalyst for EE-criticalequipment2
▪ None
▪ EII in Production I area
▪ EII improvement gained from supporting programs based on EII roadmap
Senior Manager
Recommendations
1 Only for units of which EII cannot be calculated 2 Details to be added in equipment readiness addendum
PROCESS: KPI AND KAI CASCADING

PERTAMINA | 12
We created performance dashboards to ensure effective performancedialogues…
PROCESS: PERFORMANCE MONITORING
Overview of Area
Overview of Area
Area CArea BArea A
Each production area canleverage electronicdashboard as a tool totrack energy-related KPIperformance

PERTAMINA | 13
… which were conducted at every level of the refinery
Optional,as-needed basis
Cross-functional
Department-specific
Shift Daily Weekly
Performance monitoring/problem solving meetings
Monthly
Performance dialogue
Sectionhead
Manager
SeniorSuper-visors
Shift super-visors
Operators& panelman
GeneralManager
Performancedialogue
Performancedialogue
Performancedialogue
Performancedialogue
Shift-handover
1
Reliabilitymeeting
4
Hydro-carbonmeeting
Operationmeeting
5
WeeklyAlignmentMeeting(WAM)Daily
Align-mentMeeting(DAM)
2
3
Issuesescalated
Issuesescalated
Directionsand KPIscascaded
Main KPIstracked
▪ Operatingwindowse.g., O2level, stacktemperature
▪ Refineryfuel usage(TSRF/feed)for eacharea
▪ Refineryfuelusage forall areas
▪ %Equipmentreadiness
▪ EII▪ Overall refinery
fuel usage▪ EE initiative
progress
▪ Individual KPIs andKAIs
PROCESS: PERFORMANCE MONITORING

PERTAMINA | 14
Equipmentreadiness II
EMS-PR5
People
Process
3 bootcamps were conducted to upskill employees
Bootcamp 3:“Sustaining impact”
Bootcamp 2:“Leading change”
Bootcamp 1:“Basics of EMS”
Performance
Pinch analysisEMS-PF6
Rotating equipmentanalysis
EMS-PF7
Frontlineengagement
EMS-PE1 Skillassessment system
EMS-PE3
Continuousimprovement
EMS-PE4
Innovative learningmechanisms
EMS-PE5
Load curveEMS-PF5
Cost curveEMS-PF8Energy value
chain
EII EMS-PF4
Energy lossframework
EMS-PF3
Equipmentreadiness I
EMS-PR2
Theoreticallimit
EMS-PF2
Capex stagegate system
EMS-PR7
Equipment readinessIII
EMS-PR8
Performancemonitoring
EMS-PR4
EMS brickarchitecture
EMS-PR1
KPI & KAIcascading
EMS-PR3
Transformationdesign &implementation roadmap
EMS-PR6
Stakeholderownership
EMS-PE2
Energyand product quality
EMS-PF9
EMS-PF1
PEOPLE: ACADEMY

PERTAMINA | 15
Energy related competitions were conducted to keep frontline motivated
Reduce ammoniumsalt deposit in NHTunit by injecting washwater to inlet 31-E-104
Increase vacuumcondition in STG toreduce steamconsumption
We have selected winnersfor best ideas based onimpact and creativity
Best Ideas:
1. Manager – Production 1
2. Operator - RCC
3. Junior Engineer - ProcessEngineering
Next step is to addideas into initiativesroadmap
Actions:
▪ Insert realisticideas intoroadmap forfutureimplementation
120+ ideas have been
submitted
10 different areas involved in
the competition, from manager tooperator level
PEOPLE: FRONTLINE ENGAGEMENT

PERTAMINA | 16
30+ pivotal positions across seven functions have been coached to drivechange and ensure EMS sustainability
▪ Drive positive change to improve EEmindset
▪ Lead key initiatives to driveimplementation and realize impact
▪ Provide guidance and inputs to shapeEMS brick codification
▪ Enable sustainability by acting as EMSrole models for the rest
“Pivotal positions” is an initiative under“People” to …
People
30+ pivotal position from
GM to managers and sectionheads have been identified andcoached in Wave 1
7 different functions are
involved to drive change andensure EMS sustainability
~300 coaching
sessions (formal andinformal) have beenconducted in the last 8months
PEOPLE: PIVOTAL POSITION

PERTAMINA | 1717
A comprehensive guidebook on energy efficiency was created to codify allrelated information
PEOPLE: EMS BRICK
Snapshots of EMS bricksTopic
Chapter 1: Overview
2.1.2 KPI/KAI cascading2.1.3 Performance management2.1.4 Equipment readiness
2.3.1 Operations
2.3.2 Infrastructure
2.3.1.1 Process units
2.3.1.2 Utilities
2.3.1.3 Common equipment
2.3.1.1.1 Columns2.3.1.1.2 Furnaces
2.3.1.2.1 Steam system2.3.1.2.2 Power system2.3.1.2.3 Cooling system2.3.1.2.4 Fuel management2.3.1.2.5 Hydrogen management
2.3.1.3.2 Compressors2.3.1.3.3 Pumps and motors2.3.1.3.4 Tanks
Chapter 3: Knowledge and capability buildingChapter 4: Audit and compliance
Chapter 2: Content
2.1.1 EII baseline2.1 Energy monitoring
2.3.2.2 EE capex projects2.3.2.1 Stage-gate system
2.3.1.3.1 Heat exchangers
2.2 Competency toolbox2.3 Best practice

PERTAMINA |
EMS activities documentary ...................

PERTAMINA |
EMS activities documentary ...................

PERTAMINA | 20