Pert Cpm Theory
59
SCHEDULING: GRAPHIC REPRESENTATION OF PROJECT ACTIVITIES, NETWORK ANALYSIS, NETWORK TECHNIQUES: PERT AND CPM TOPIC :- 1
-
Upload
inderjeet-singh-toor -
Category
Documents
-
view
233 -
download
0
Transcript of Pert Cpm Theory

8/10/2019 Pert Cpm Theory
http://slidepdf.com/reader/full/pert-cpm-theory 1/62
SCHEDULING: GRAPHIC REPRESENTATIONPROJECT ACTIVITIES, NETWORK ANALYSIS,NETWORK TECHNIQUES: PERT AND CPM
TOPIC :-

8/10/2019 Pert Cpm Theory
http://slidepdf.com/reader/full/pert-cpm-theory 2/62
Project Management
Project• A project is an interrelated set of activities that has a definite
starting and ending point and that results in a unique productor service.
Project management • Project management is a scientific way of planning, implementing,
monitoring & controlling the various aspects of a project such as time,money, materials, manpower & other resources.

8/10/2019 Pert Cpm Theory
http://slidepdf.com/reader/full/pert-cpm-theory 3/62
Network Planning Methods
Methods used for network planning are:CPMPERT
Managing a project with network planning methods involves four steps:
1. Describing the Project.2. Diagramming the Network.3. Estimating time of completion.4. Monitoring Project Progress.
8/10/2019 Pert Cpm Theory
http://slidepdf.com/reader/full/pert-cpm-theory 4/62
Network Technique
Project is a word with which we are familiar. It refers to a grouactivities and events having systematic relationship.
A network is a graphic or diagrammatic representation of variactivities and events of a project.
With the help of network we can come to know how the diffeactivities and events are inter related and how much resourneeded by each activity.

8/10/2019 Pert Cpm Theory
http://slidepdf.com/reader/full/pert-cpm-theory 5/62
Techniques of Network
Network analysis is an operation research technique whicuses two methodologies namely:
PERT: Programme Evaluation and Review Technique.CPM: Critical Path Method
8/10/2019 Pert Cpm Theory
http://slidepdf.com/reader/full/pert-cpm-theory 6/62
Fundamentals of Network Analysis
Activity: A project consists of many activities, which have systemarelationship with each others.
Activity is representation by an arrow.
Length of arrow is of no significance and is not related wtime of activity.
Activity flow from left to right. ( May be upward ordownward)

8/10/2019 Pert Cpm Theory
http://slidepdf.com/reader/full/pert-cpm-theory 7/62
Predecessor ActivitySuccessor ActivityConcurrent Activity

8/10/2019 Pert Cpm Theory
http://slidepdf.com/reader/full/pert-cpm-theory 8/62
Event:Event denotes a point of time when an
activity begins or ends. It is shown by O. An Activity is represented by two Events.Events are numbered by 1,2,3…..

8/10/2019 Pert Cpm Theory
http://slidepdf.com/reader/full/pert-cpm-theory 9/62
Interdependency: An activity is called independent if it is not dependents o
any earlier activity otherwise it is called dependentactivity.
8/10/2019 Pert Cpm Theory
http://slidepdf.com/reader/full/pert-cpm-theory 10/62
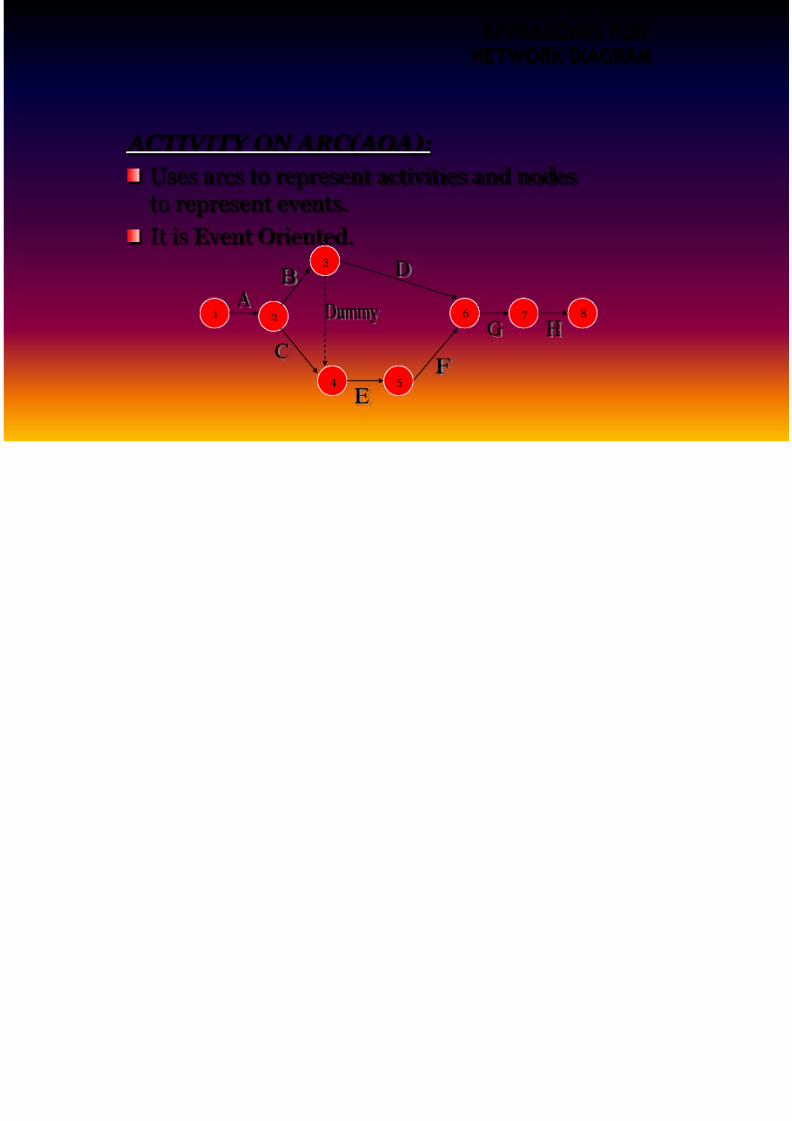
APPRAOCHES FONETWORK DIAGR
ACTIVITY ON ARC(AOA):Uses arcs to represent activities and nodesto represent events.It is Event Oriented.
1 876
54
3
2
8/10/2019 Pert Cpm Theory
http://slidepdf.com/reader/full/pert-cpm-theory 11/62
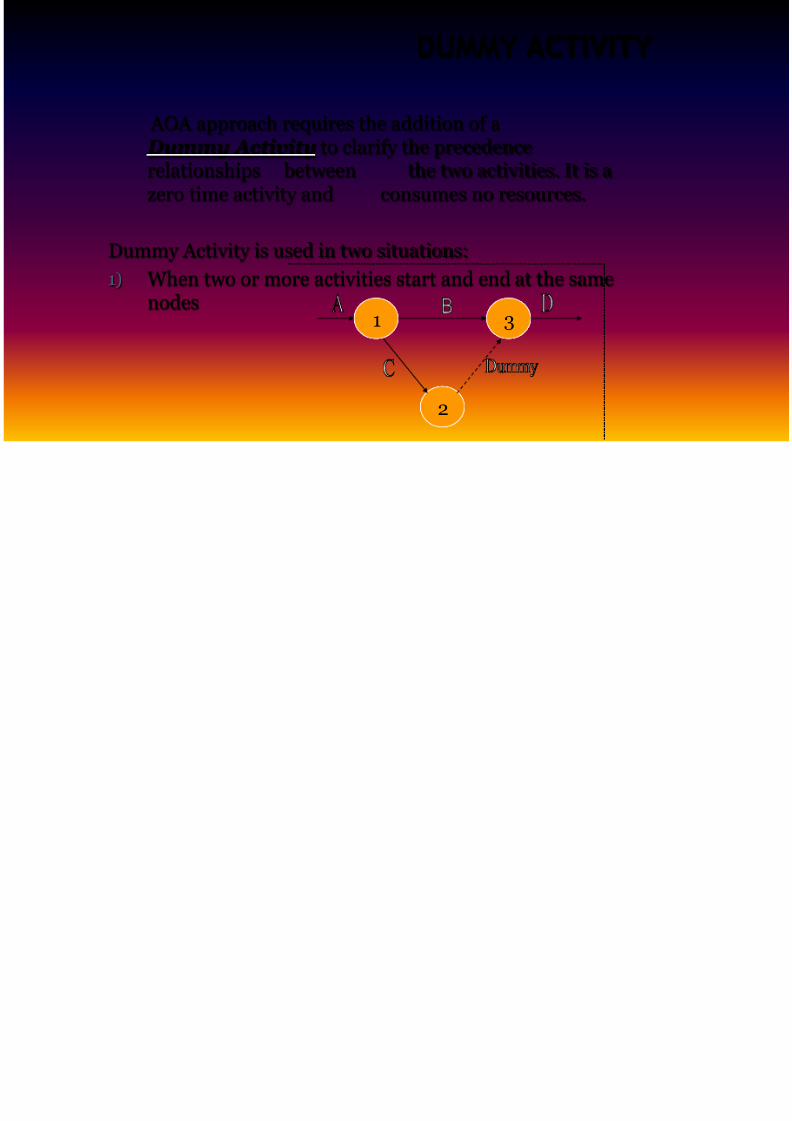
DUMMY ACTIVI
AOA approach requires the addition of a Dummy Activity to clarify the precedencerelationships between the two activities. It is azero time activity and consumes no resources.
Dummy Activity is used in two situations:
1) When two or more activities start and end at the samenodes
1 3
2
8/10/2019 Pert Cpm Theory
http://slidepdf.com/reader/full/pert-cpm-theory 12/62
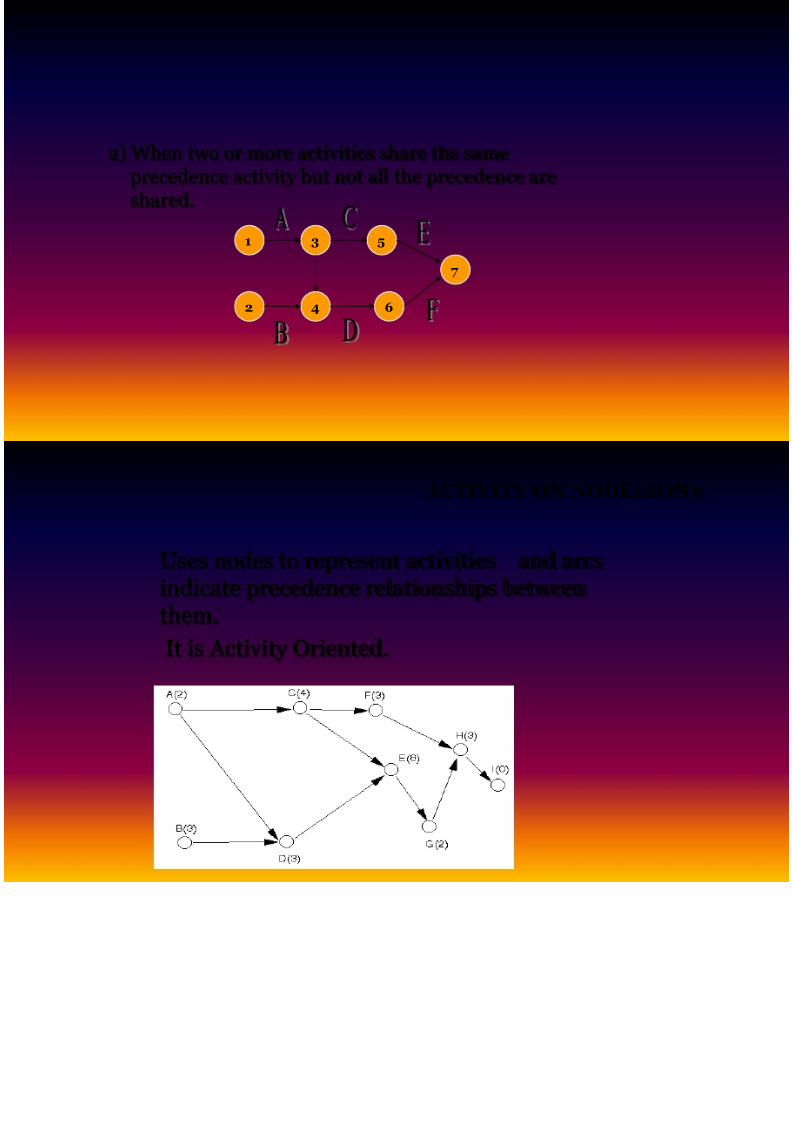
2) When two or more activities share the sameprecedence activity but not all the precedence areshared.
1 53
6
7
2 4
8/10/2019 Pert Cpm Theory
http://slidepdf.com/reader/full/pert-cpm-theory 13/62
Uses nodes to represent activities and arcsindicate precedence relationships betweenthem.It is Activity Oriented.
ACTIVITY ON NODE(AO
8/10/2019 Pert Cpm Theory
http://slidepdf.com/reader/full/pert-cpm-theory 14/62
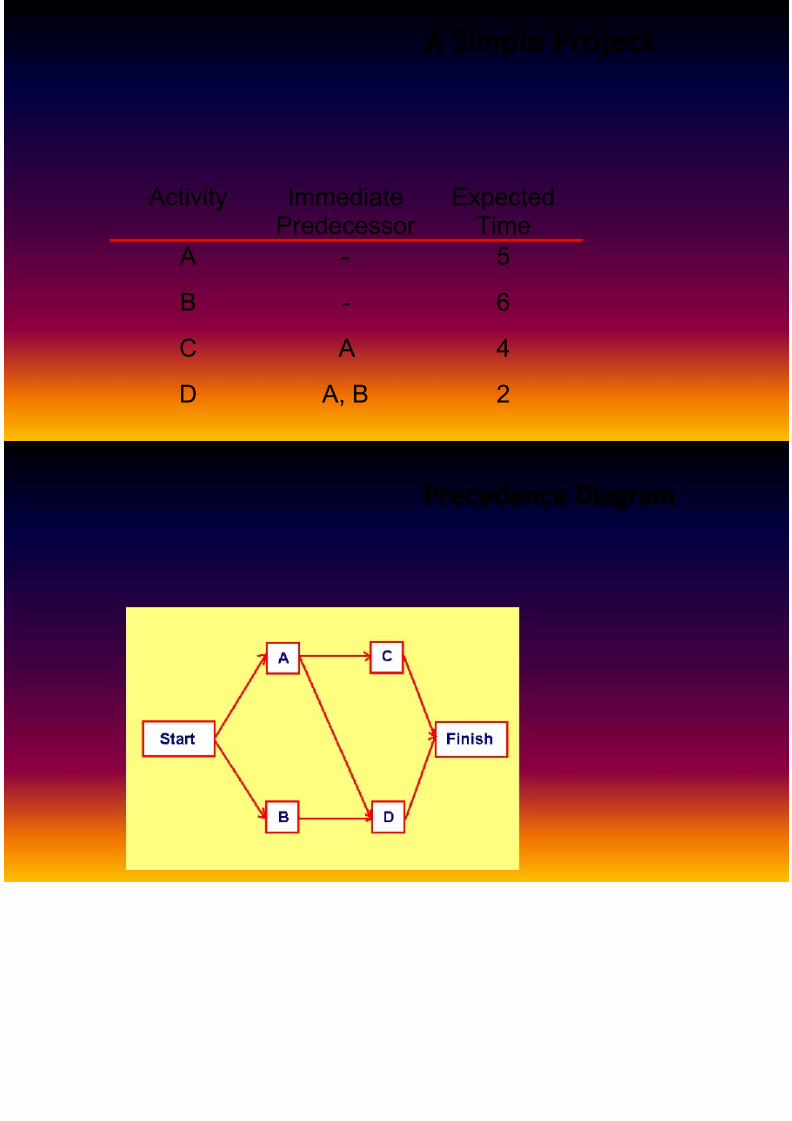
A Simple Project
Activity ImmediatePredecessor
ExpectedTime
A - 5
B - 6
C A 4
D A, B 2
8/10/2019 Pert Cpm Theory
http://slidepdf.com/reader/full/pert-cpm-theory 15/62
Precedence Diagram
8/10/2019 Pert Cpm Theory
http://slidepdf.com/reader/full/pert-cpm-theory 16/62
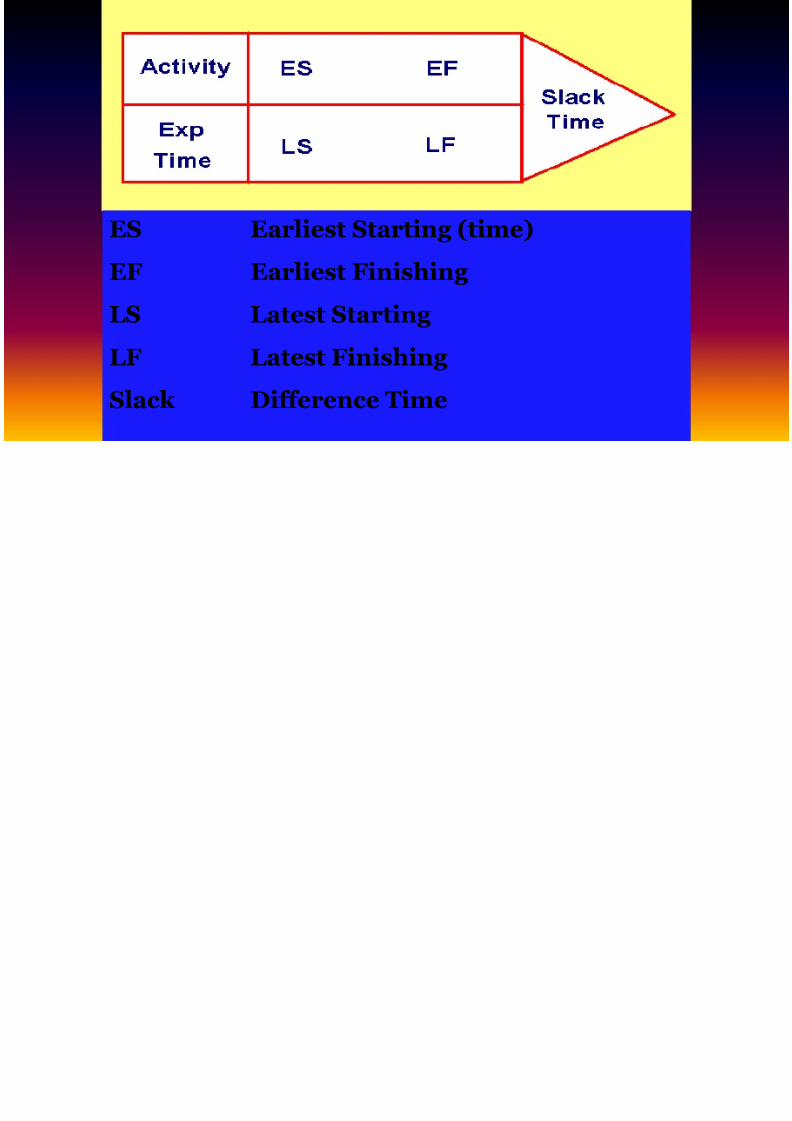
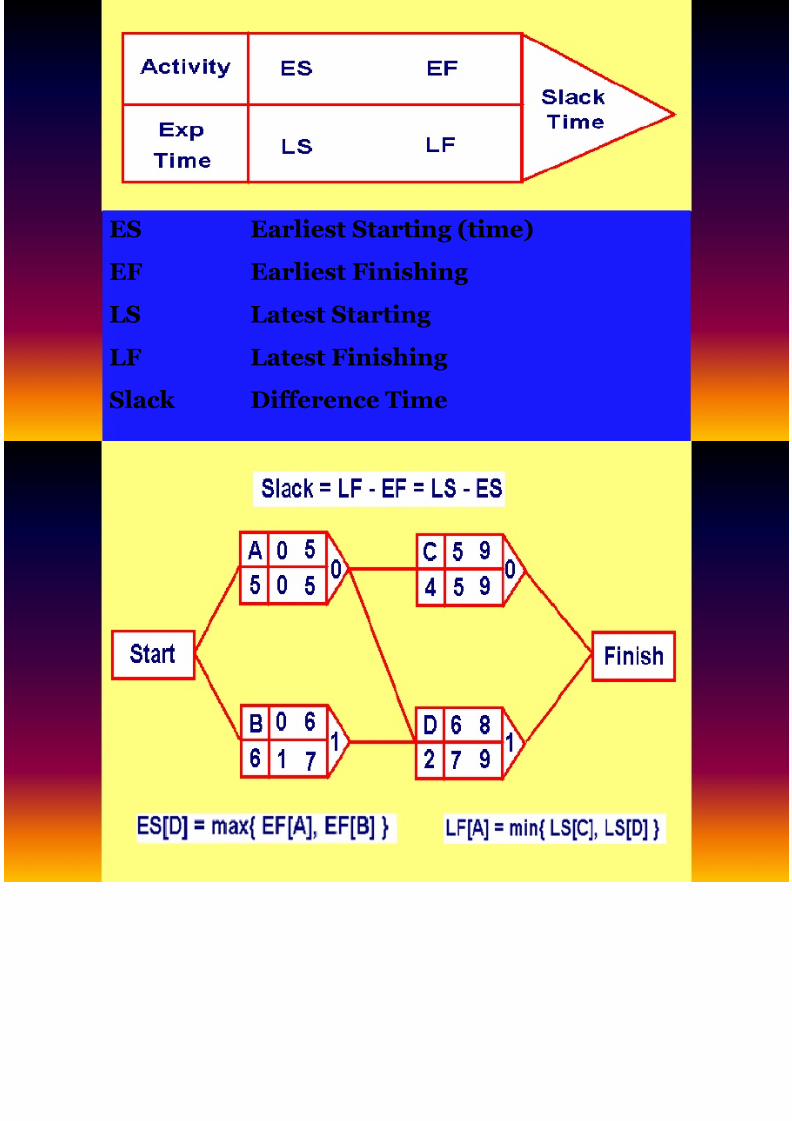
ES Earliest Starting (time)
EF Earliest FinishingLS Latest Starting
LF Latest Finishing
Slack Difference Time
ESTIMATING TIME
8/10/2019 Pert Cpm Theory
http://slidepdf.com/reader/full/pert-cpm-theory 17/62
ESTIMATING TIMEOF
COMPLETION
Planning the schedule of the project
Time estimates include:
1) Total time for completion.
2) ES- Earliest start time : the earliest time at which the activitycan start given that its precedent activities must be completedfirst.
3) EF-Earliest finish time : equals to the earliest start time for theactivity plus the time required to complete the activity.
4) LF- Latest finish time : the latest time in which the activity can becompleted without delaying the project.
5) LS- Latest start time : equal to the latest finish time minus the
time required to complete the activity.
8/10/2019 Pert Cpm Theory
http://slidepdf.com/reader/full/pert-cpm-theory 18/62
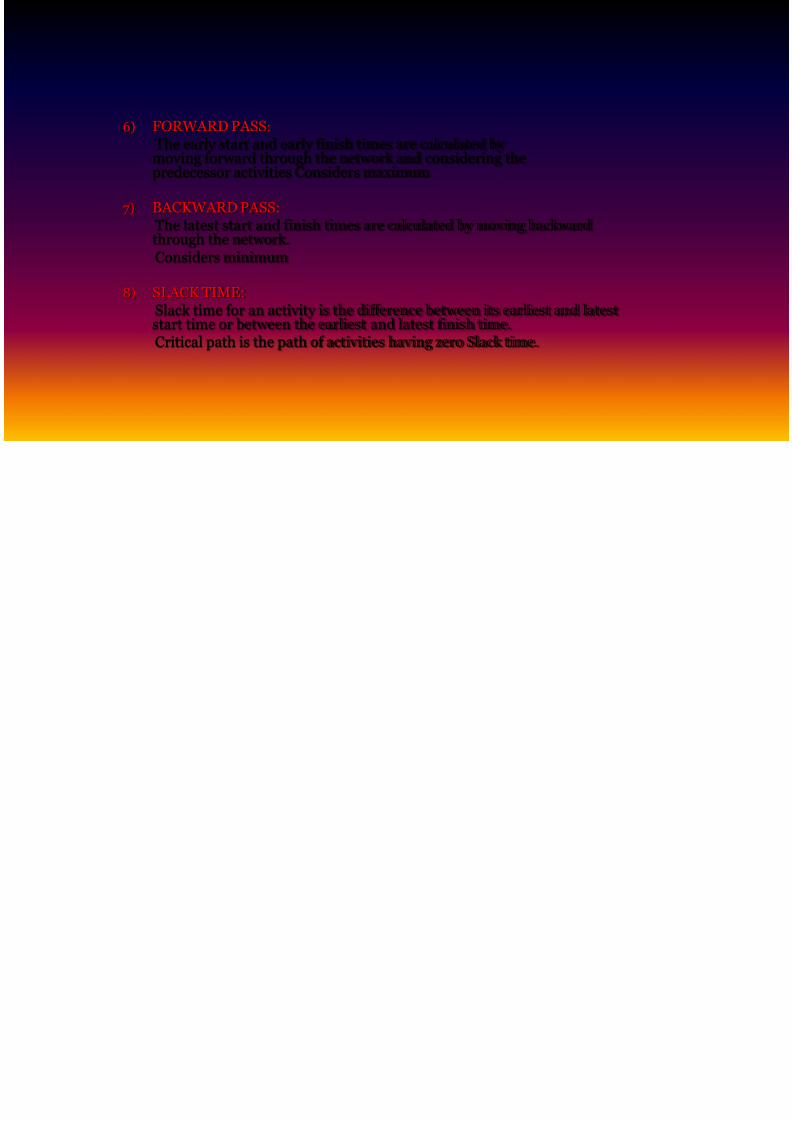
6) FORWARD PASS :
The early start and early finish times are calculated bymoving forward through the network and considering thepredecessor activities Considers maximum
7) BACKWARD PASS:The latest start and finish times are calculated by moving backwardthrough the network.Considers minimum
8) SLACK TIME:Slack time for an activity is the difference between its earliest and lateststart time or between the earliest and latest finish time.Critical path is the path of activities having zero Slack time.
8/10/2019 Pert Cpm Theory
http://slidepdf.com/reader/full/pert-cpm-theory 19/62
ES Earliest Starting (time)
EF Earliest FinishingLS Latest Starting
LF Latest Finishing
Slack Difference Time
8/10/2019 Pert Cpm Theory
http://slidepdf.com/reader/full/pert-cpm-theory 20/62

8/10/2019 Pert Cpm Theory
http://slidepdf.com/reader/full/pert-cpm-theory 21/62
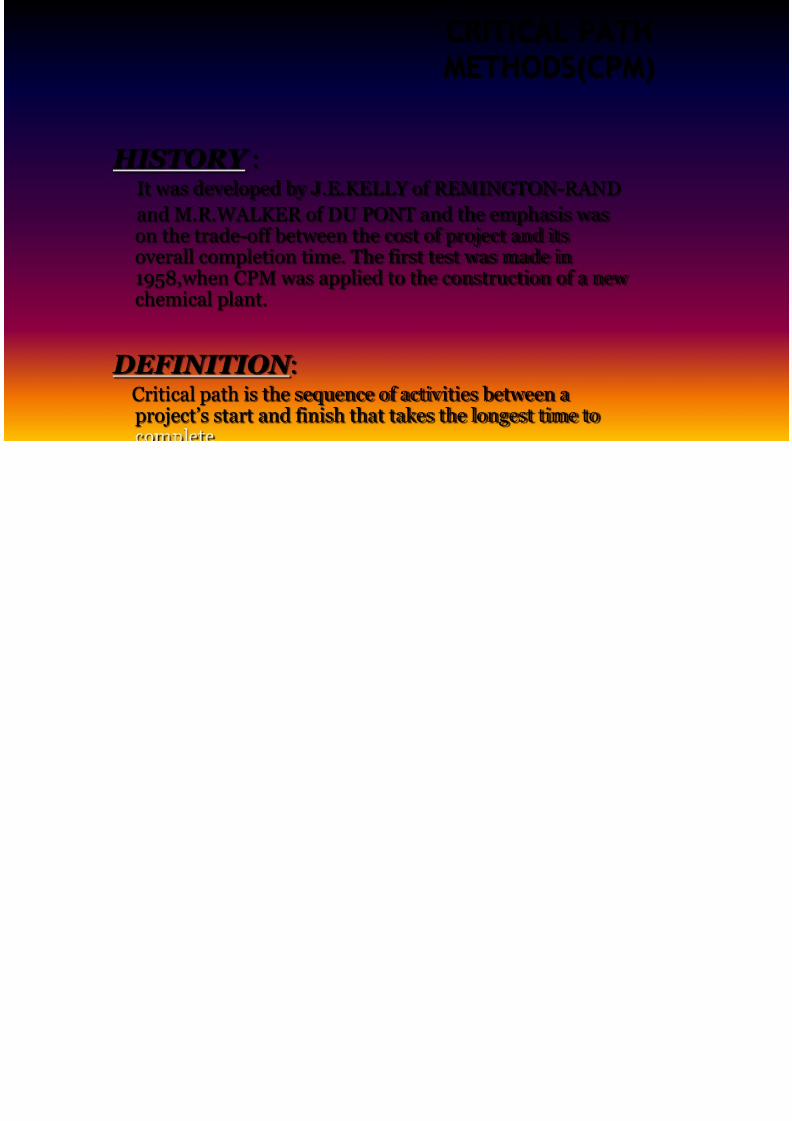
CRITICAL PATMETHODS(CPM
HISTORY :It was developed by J.E.KELLY of REMINGTON-RANDand M.R.WALKER of DU PONT and the emphasis wason the trade-off between the cost of project and itsoverall completion time. The first test was made in
1958,when CPM was applied to the construction of a newchemical plant.
DEFINITION :Critical path is the sequence of activities between a
project’s start and finish that takes the longest time to
8/10/2019 Pert Cpm Theory
http://slidepdf.com/reader/full/pert-cpm-theory 22/62
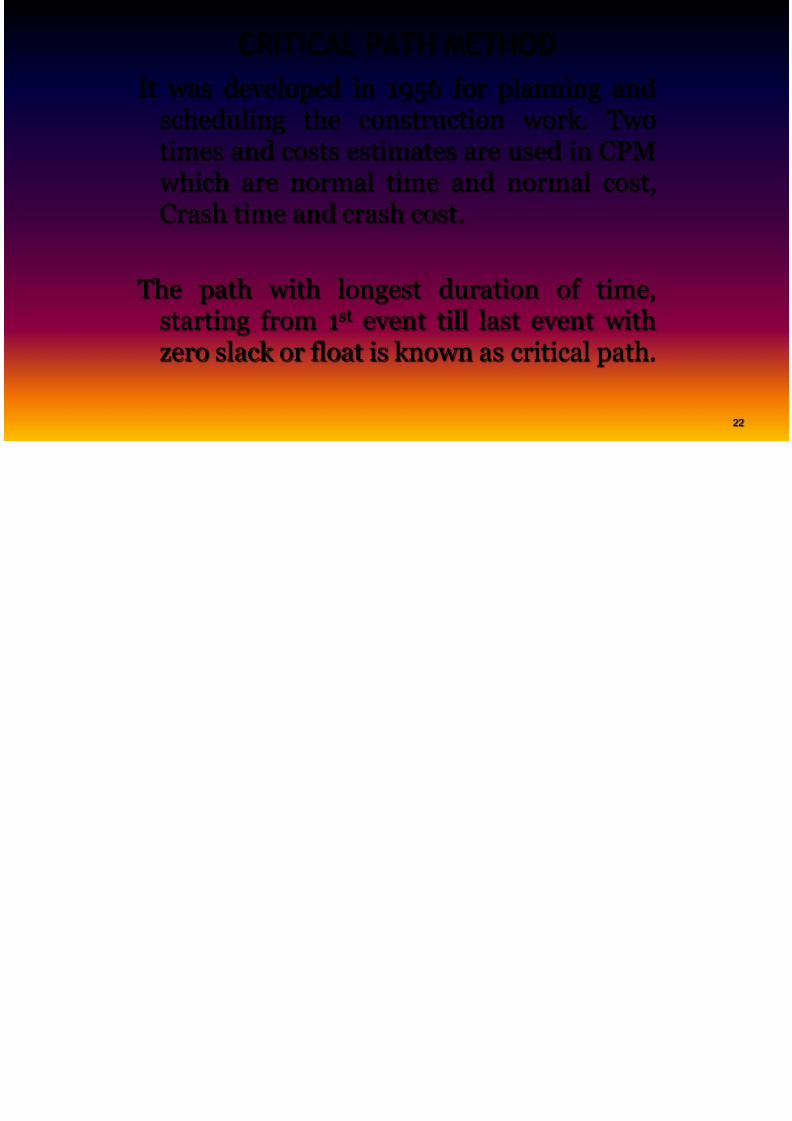
CRITICAL PATH METHODIt was developed in 1956 for planning and
scheduling the construction work. Twotimes and costs estimates are used in CPM which are normal time and normal cost,Crash time and crash cost.
The path with longest duration of time,starting from 1 st event till last event withzero slack or float is known as critical path.
8/10/2019 Pert Cpm Theory
http://slidepdf.com/reader/full/pert-cpm-theory 23/62
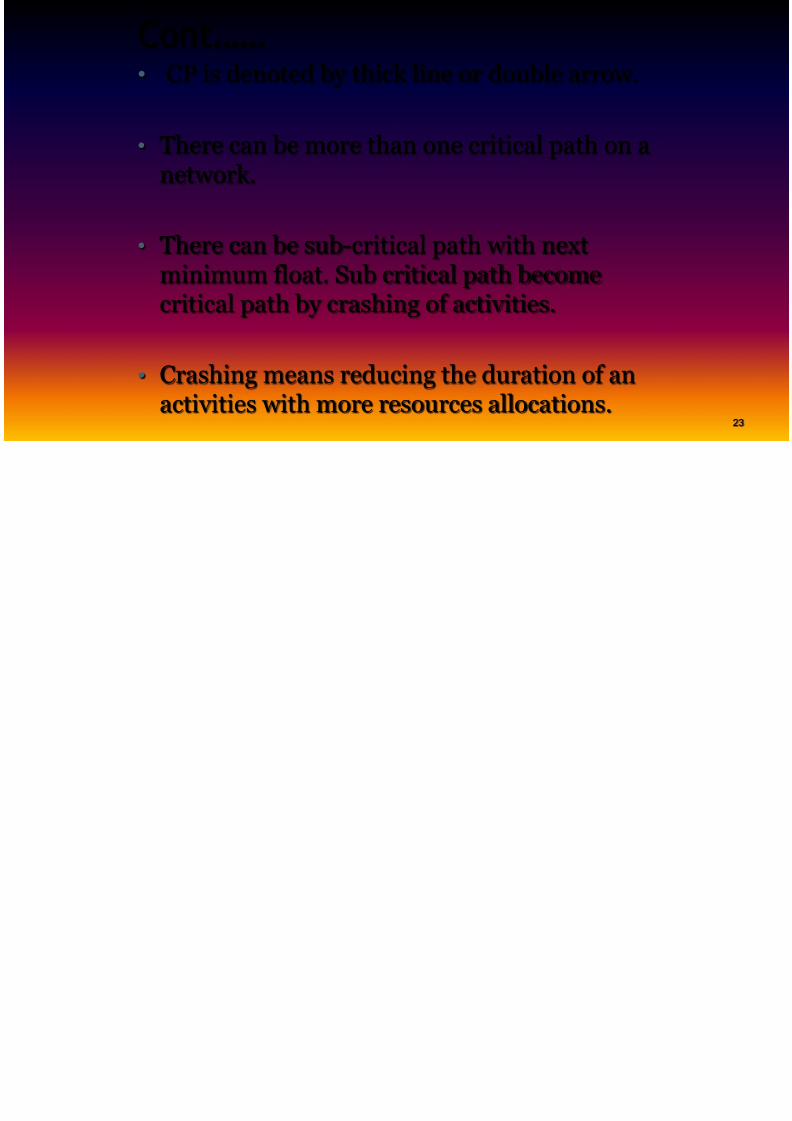
Cont…… • CP is denoted by thick line or double arrow.
• There can be more than one critical path on anetwork.
• There can be sub-critical path with next
minimum float. Sub critical path becomecritical path by crashing of activities.
• Crashing means reducing the duration of anactivities with more resources allocations.
8/10/2019 Pert Cpm Theory
http://slidepdf.com/reader/full/pert-cpm-theory 24/62
STEPS IN DETERMINCRITICAL PATH
• Specify the individual activities.
• Determine the sequence of the activities.
• Draw the network diagram.
• Estimate the activity completion time.
• Identify the critical path.
• Update the CPM diagram.
8/10/2019 Pert Cpm Theory
http://slidepdf.com/reader/full/pert-cpm-theory 25/62
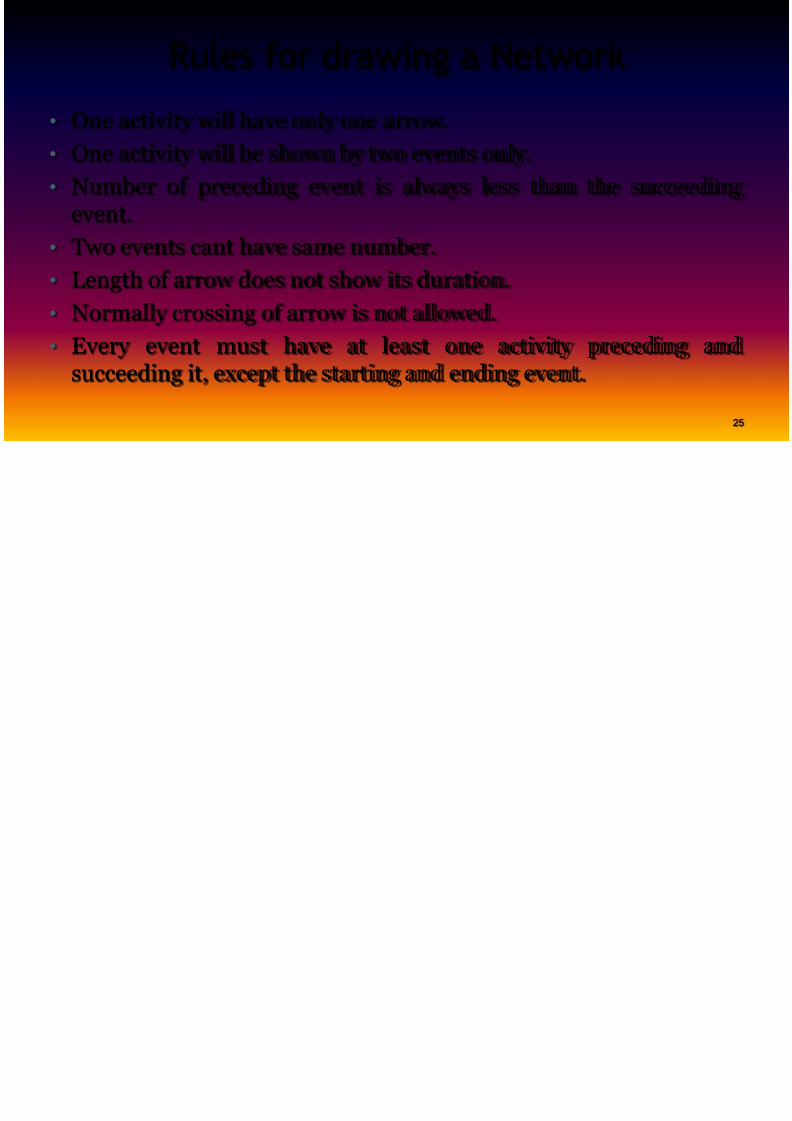
Rules for drawing a Network• One activity will have only one arrow.• One activity will be shown by two events only.• Number of preceding event is always less than the succee
event.• Two events cant have same number.•
Length of arrow does not show its duration.• Normally crossing of arrow is not allowed.• Every event must have at least one activity preceding
succeeding it, except the starting and ending event.
8/10/2019 Pert Cpm Theory
http://slidepdf.com/reader/full/pert-cpm-theory 26/62
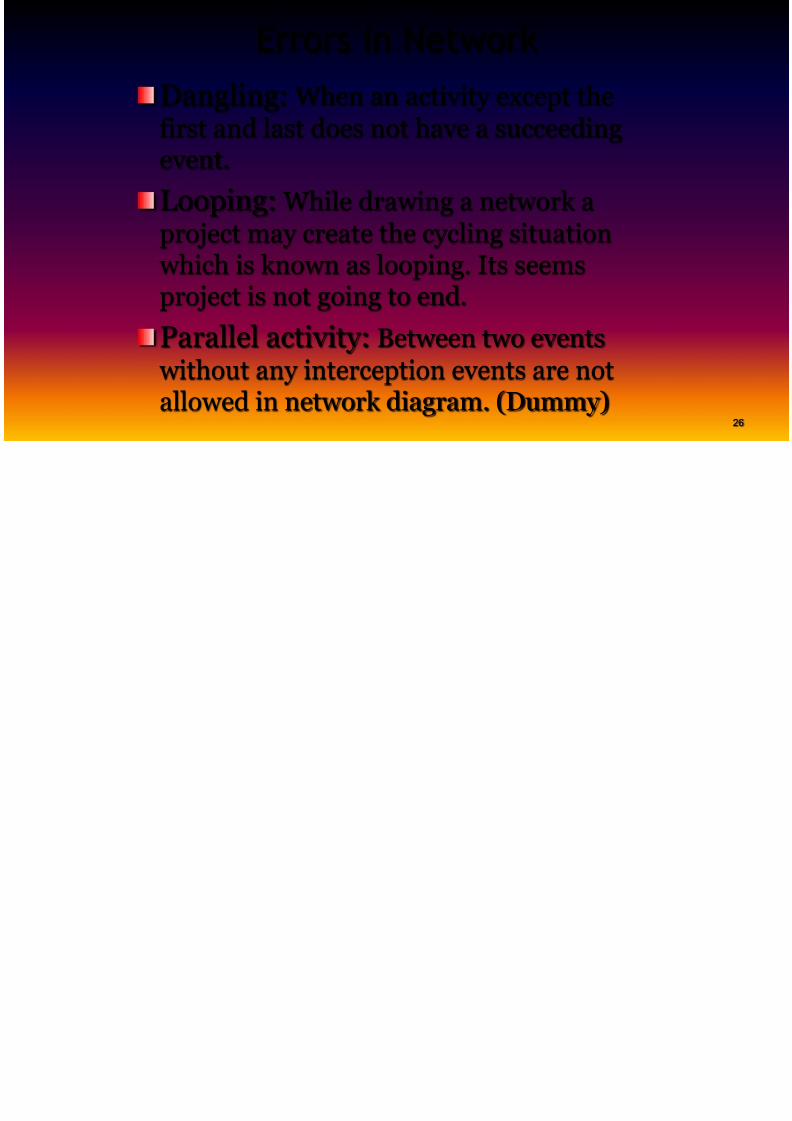
Errors in NetworkDangling: When an activity except thefirst and last does not have a succeedingevent.
Looping: While drawing a network aproject may create the cycling situation which is known as looping. Its seemsproject is not going to end.
Parallel activity: Between two events without any interception events are notallowed in network diagram. (Dummy)
8/10/2019 Pert Cpm Theory
http://slidepdf.com/reader/full/pert-cpm-theory 27/62
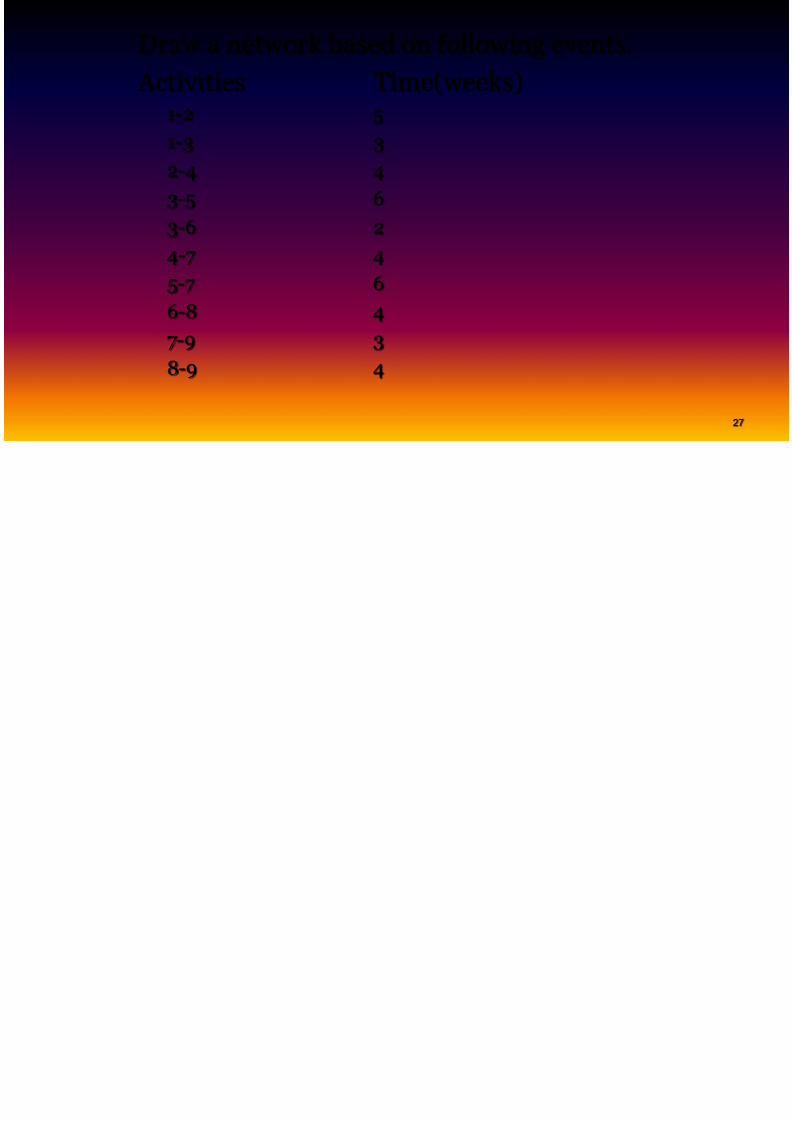
Draw a network based on following events. Activities Time(weeks)
1-2 5
1-3 32-4 43-5 63-6 24-7 4
5-7 66-8 47-9 38-9 4
8/10/2019 Pert Cpm Theory
http://slidepdf.com/reader/full/pert-cpm-theory 28/62
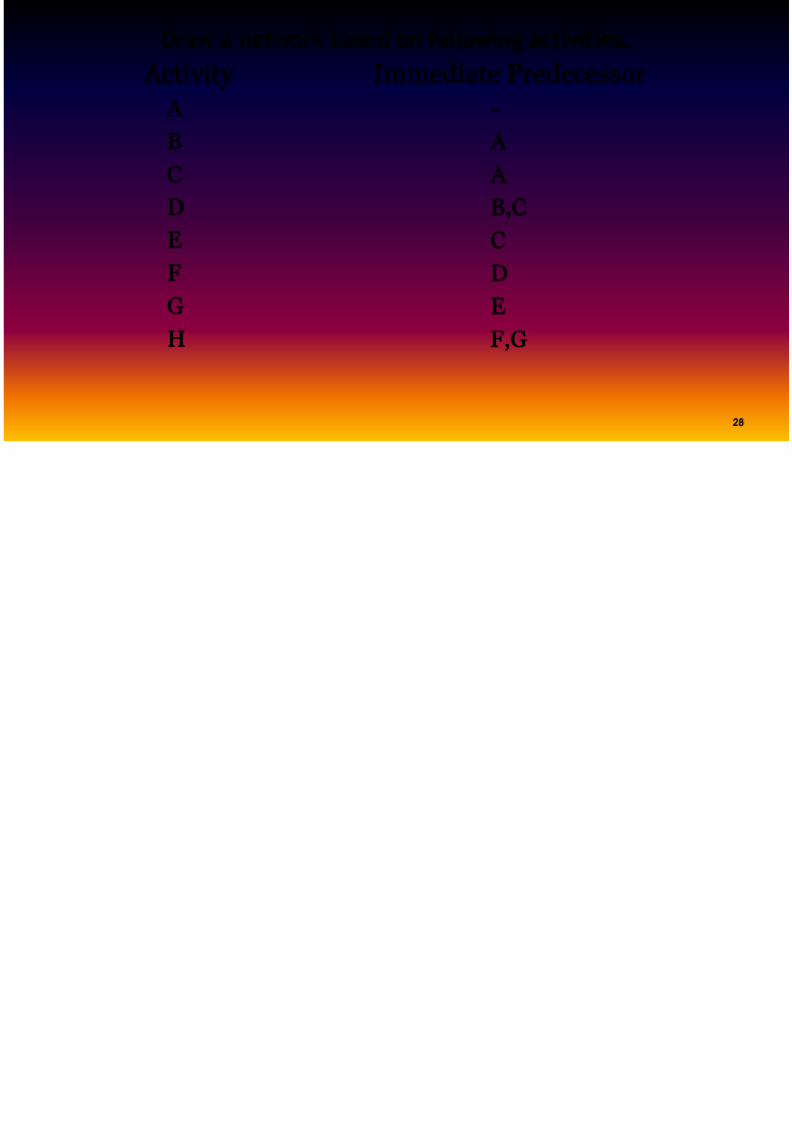
Draw a network based on following activities.
Activity Immediate Predecessor A -
B AC AD B,CE C
F DG EH F,G
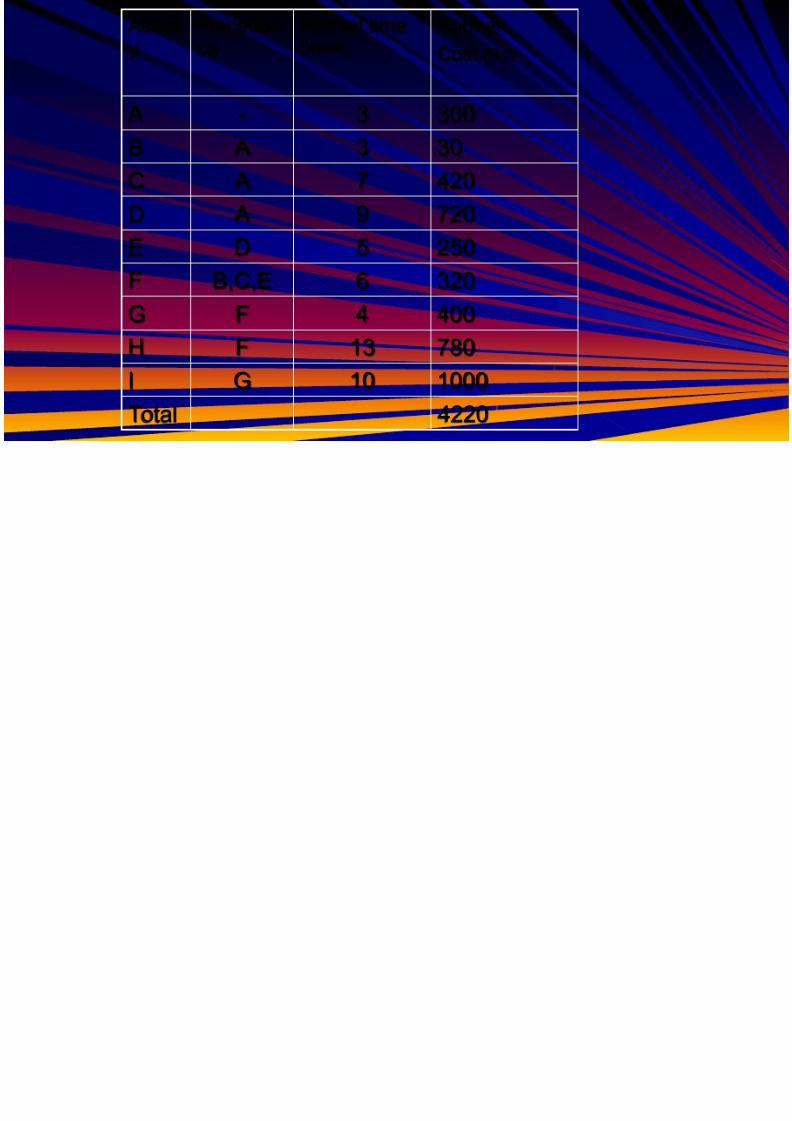
Activit Preceden Normal time Normal
8/10/2019 Pert Cpm Theory
http://slidepdf.com/reader/full/pert-cpm-theory 29/62
Activity
Precedence
Normal time(week)
NormalCost (Rs)
A - 3 300
B A 3 30C A 7 420D A 9 720E D 5 250
F B,C,E 6 320G F 4 400H F 13 780I G 10 1000
Total 4220
8/10/2019 Pert Cpm Theory
http://slidepdf.com/reader/full/pert-cpm-theory 30/62
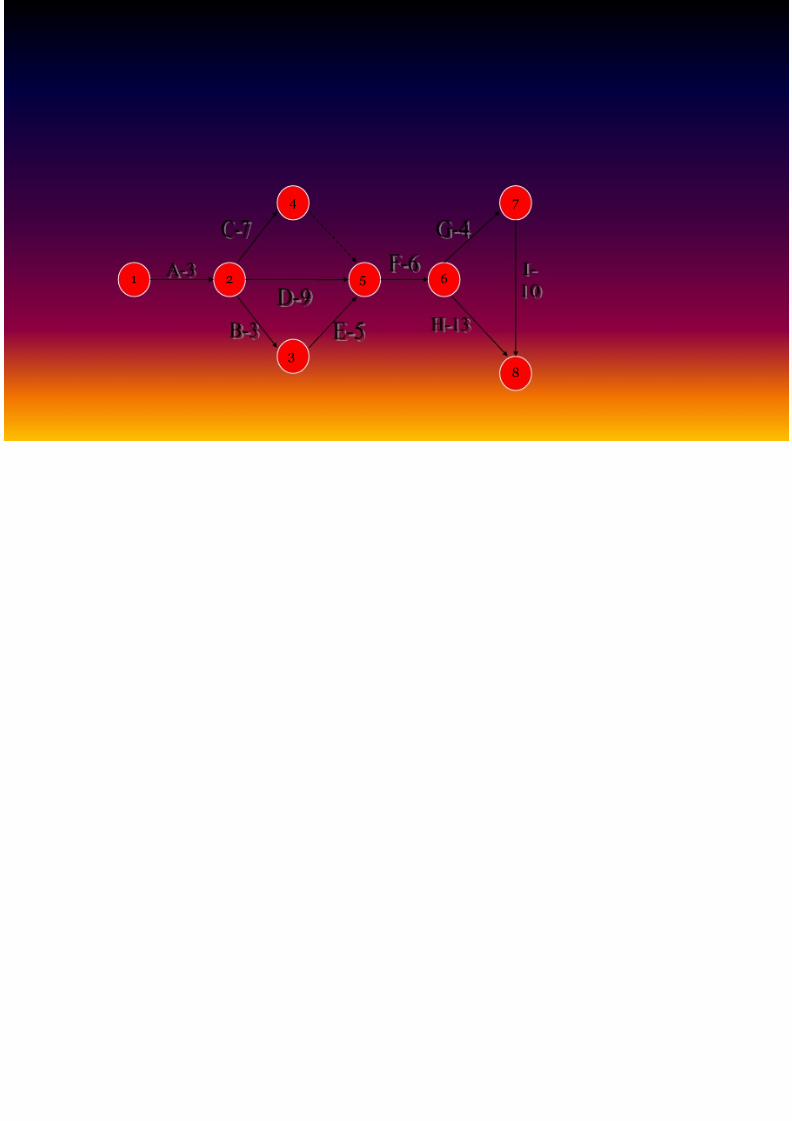
1
8
7
6
3
5
4
2
8/10/2019 Pert Cpm Theory
http://slidepdf.com/reader/full/pert-cpm-theory 31/62
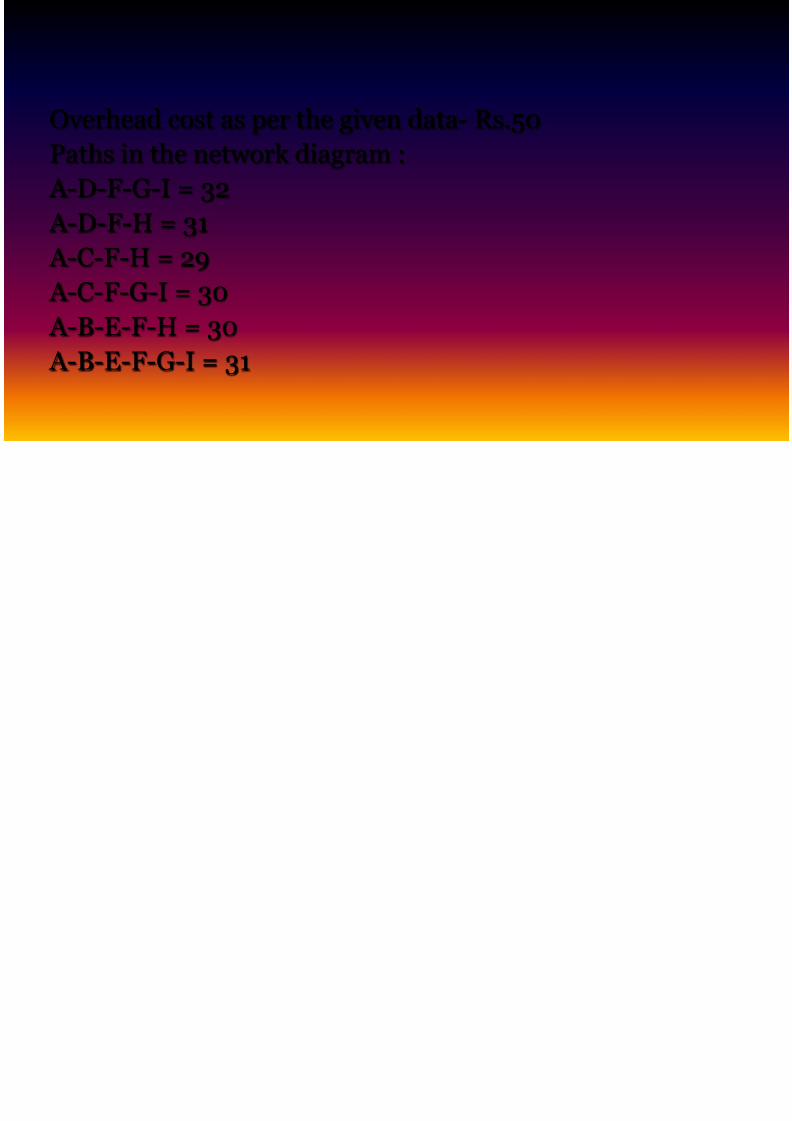
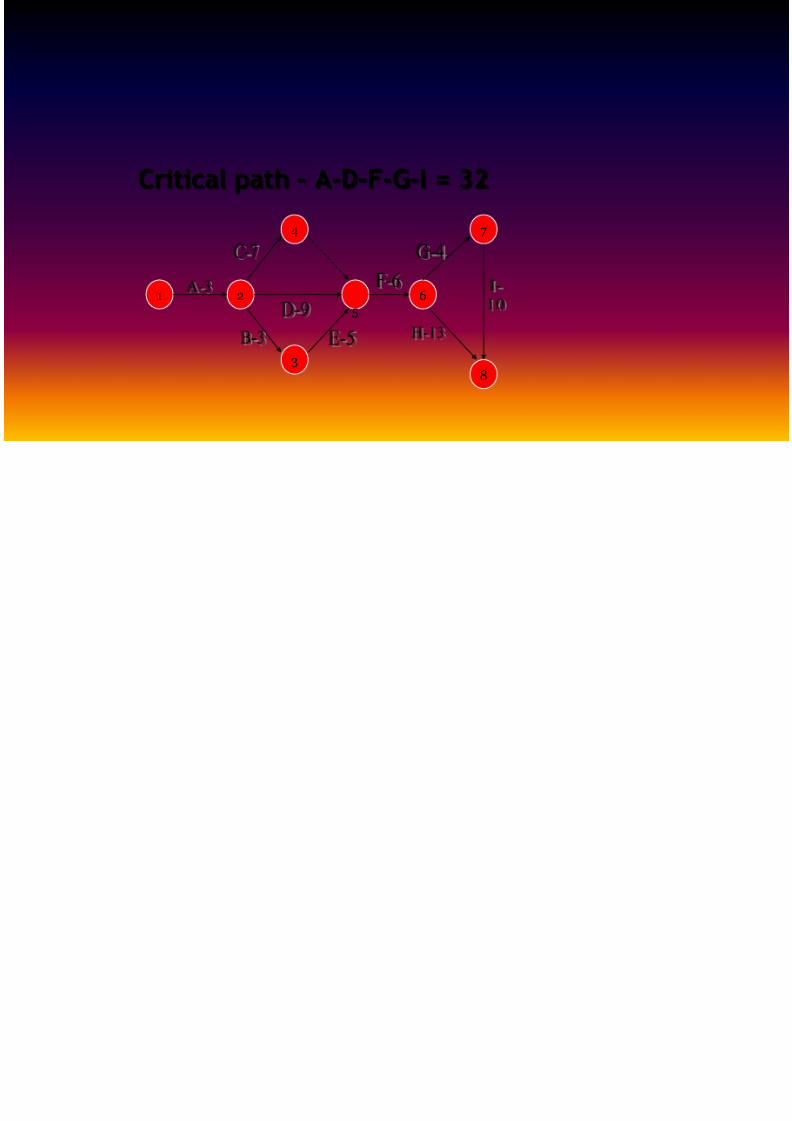
Overhead cost as per the given data- Rs.50Paths in the network diagram : A-D-F-G-I = 32 A-D-F-H = 31 A-C-F-H = 29 A-C-F-G-I = 30 A-B-E-F-H = 30 A-B-E-F-G-I = 31

8/10/2019 Pert Cpm Theory
http://slidepdf.com/reader/full/pert-cpm-theory 32/62
Critical path – A-D-F-G-I = 32
1
8
7
6
3
5
4
2

8/10/2019 Pert Cpm Theory
http://slidepdf.com/reader/full/pert-cpm-theory 33/62
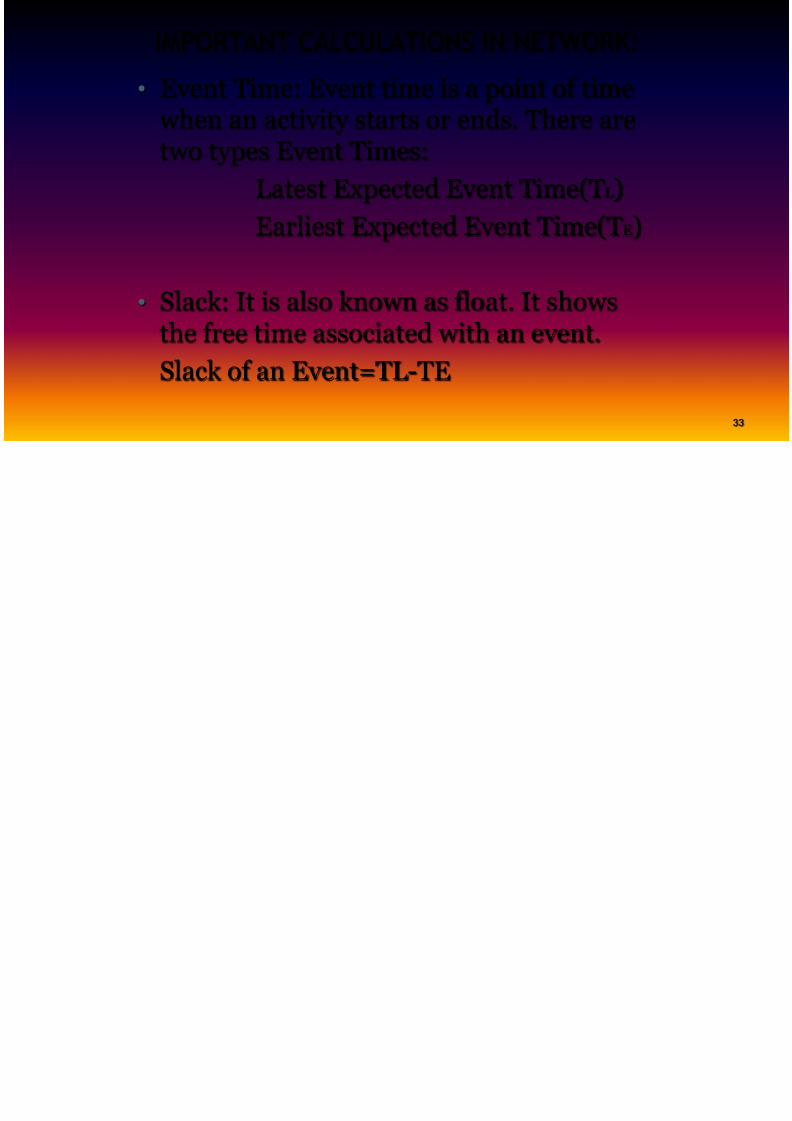
IMPORTANT CALCULATIONS IN NETWOR• Event Time: Event time is a point of time
when an activity starts or ends. There aretwo types Event Times:
Latest Expected Event Time(T L)Earliest Expected Event Time(T E
• Slack: It is also known as float. It showsthe free time associated with an event.Slack of an Event=TL-TE
4 Estimate activity completion time
8/10/2019 Pert Cpm Theory
http://slidepdf.com/reader/full/pert-cpm-theory 34/62
4. Estimate activity completion timeThe time required to complete each activity can be
estimated using past experience. CPM does nottake into account variation in the completiontime.
5. Identify the Critical PathThe critical path is the longest-duration path
through the network. The significance of thecritical path is that the activities that lie on itcannot be delayed without delaying the project.Because of its impact on the entire project,critical path analysis is an important aspect of
project planning
8/10/2019 Pert Cpm Theory
http://slidepdf.com/reader/full/pert-cpm-theory 35/62
6. Update CPM diagramAs the project progresses, the actual task completion times wknown and the network diagram can be updated to include thinformation. A new critical path may emerge, and structuralchanges may be made in the network if project requirements
change.
8/10/2019 Pert Cpm Theory
http://slidepdf.com/reader/full/pert-cpm-theory 36/62
EXAMPLE
8/10/2019 Pert Cpm Theory
http://slidepdf.com/reader/full/pert-cpm-theory 37/62
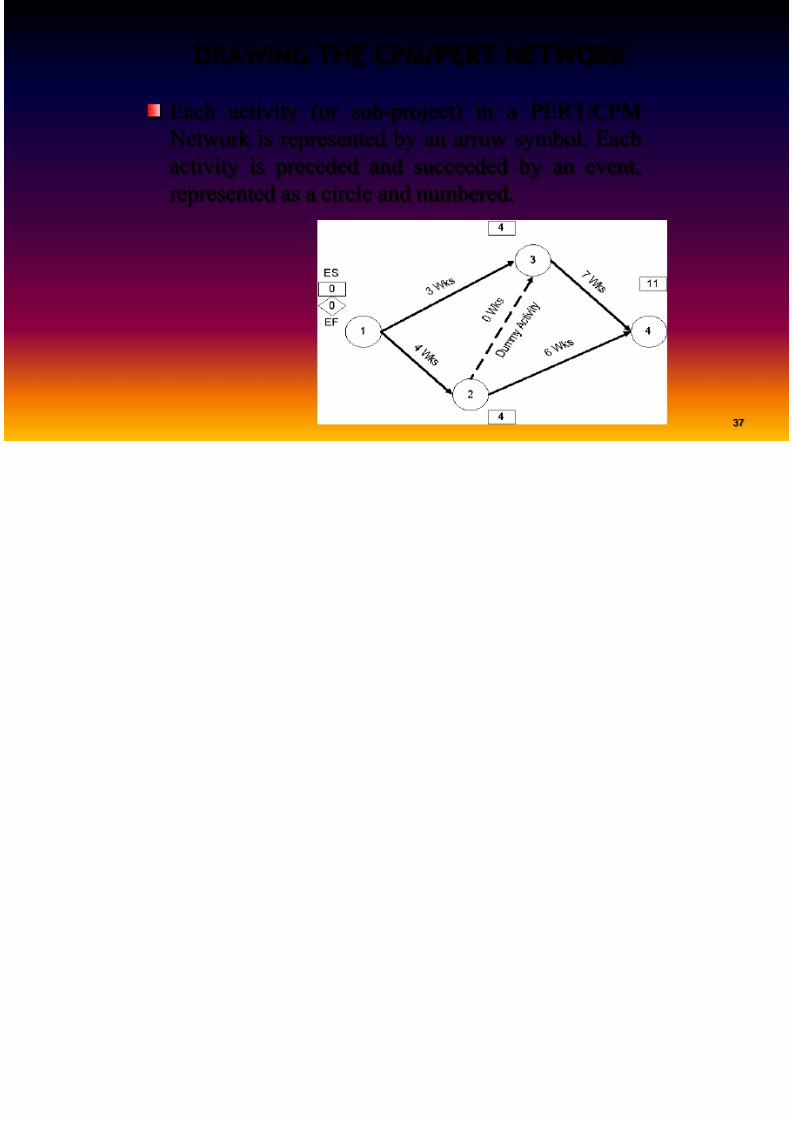
DRAWING THE CPM/PERT NETWORK
Each activity (or sub-project) in a PERT/CPM
Network is represented by an arrow symbol. Eachactivity is preceded and succeeded by an event,represented as a circle and numbered .

8/10/2019 Pert Cpm Theory
http://slidepdf.com/reader/full/pert-cpm-theory 38/62
At Event 3, we have to evaluate two predecessor activities - Activity 1-3 andActivity 2-3, both of which are predecessoractivities. Activity 1-3 gives us an EarliestStart of 3 weeks at Event 3.However, Activity 2-3 also has to becompleted before Event 3 can begin.
Along this route, the Earliest Start would be4+0=4. The rule is to take the longer (bigger)of the two Earliest Starts. So the Earliest Startat event 3 is 4.
8/10/2019 Pert Cpm Theory
http://slidepdf.com/reader/full/pert-cpm-theory 39/62
Similarly, at Event 4, we find we have toevaluate two predecessor activities - Activity2-4 and Activity 3-4. Along Activity 2-4, the
Earliest Start at Event 4 would be 10 wks, butalong Activity 3-4, the Earliest Start at Event 4would be 11 wks.Since 11 wks is larger than 10 wks, we select it
as the Earliest Start at Event 4.We have now found the longest paththrough the network. It will take 11 weeksalong activities 1-2, 2-3 and 3-4. This is theCritical Path.
8/10/2019 Pert Cpm Theory
http://slidepdf.com/reader/full/pert-cpm-theory 40/62
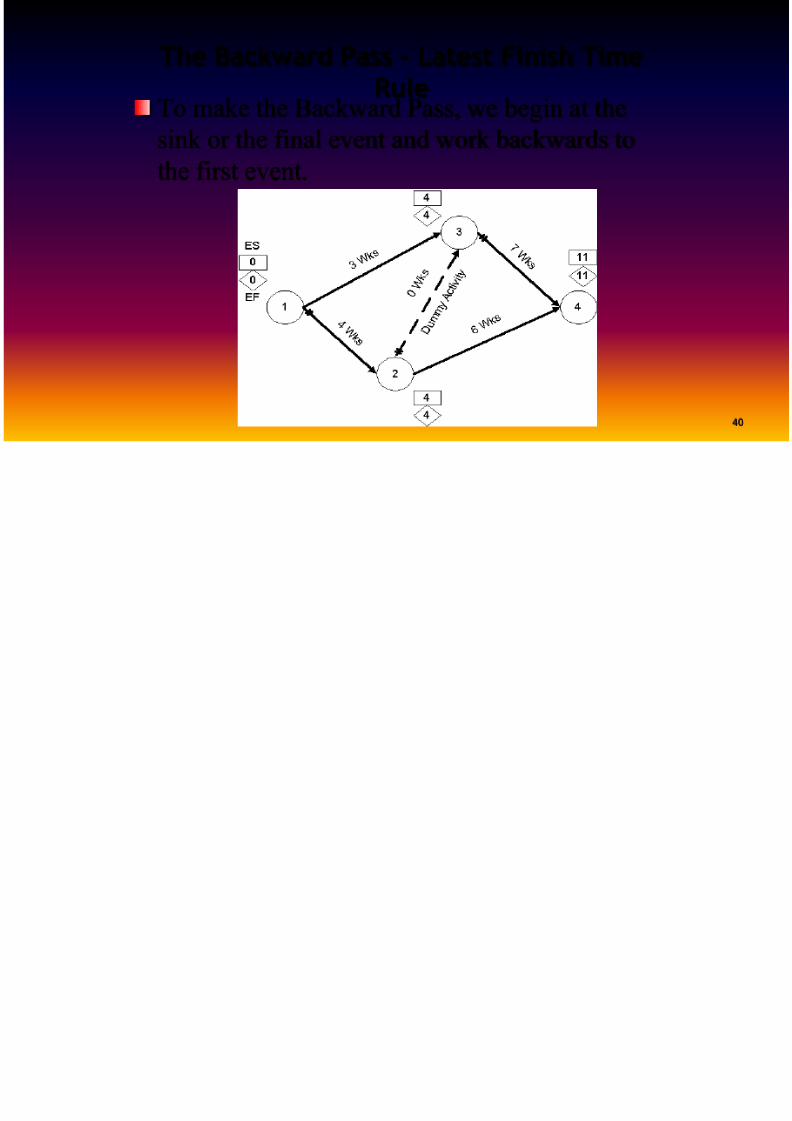
The Backward Pass - Latest Finish TimeRule
To make the Backward Pass, we begin at the
sink or the final event and work backwards tothe first event.
8/10/2019 Pert Cpm Theory
http://slidepdf.com/reader/full/pert-cpm-theory 41/62
At Event 3 there is only one activity, Activity3-4 in the backward pass, and we find that thevalue is 11-7 = 4 weeks. However at Event 2we have to evaluate 2 activities, 2-3 and 2-4.We find that the backward pass through 2-4gives us a value of 11-6 = 5 while 2-3 gives us4-0 = 4. We take the smaller value of 4 on th
backward pass.
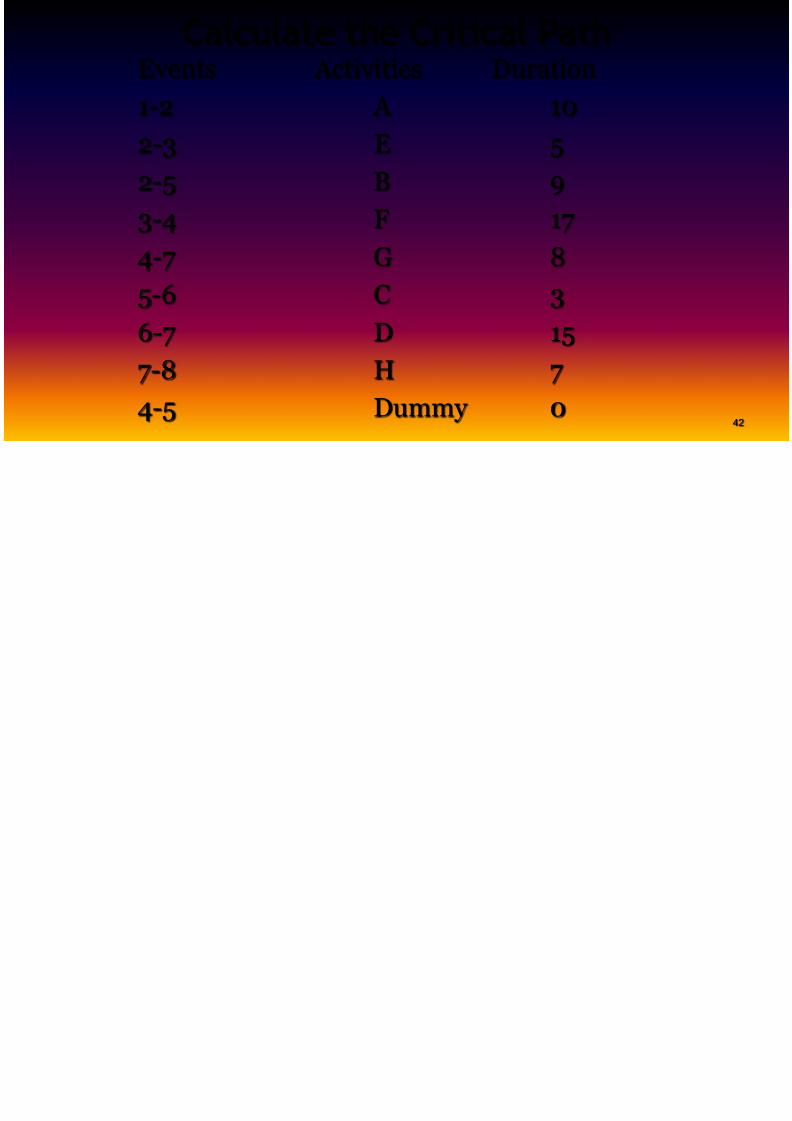
Calculate the Critical Path
8/10/2019 Pert Cpm Theory
http://slidepdf.com/reader/full/pert-cpm-theory 42/62
Calculate the Critical PathEvents Activities Duration1-2 A 10
2-3 E 52-5 B 93-4 F 174-7 G 8
5-6 C 36-7 D 157-8 H 74-5 Dummy 0
example
8/10/2019 Pert Cpm Theory
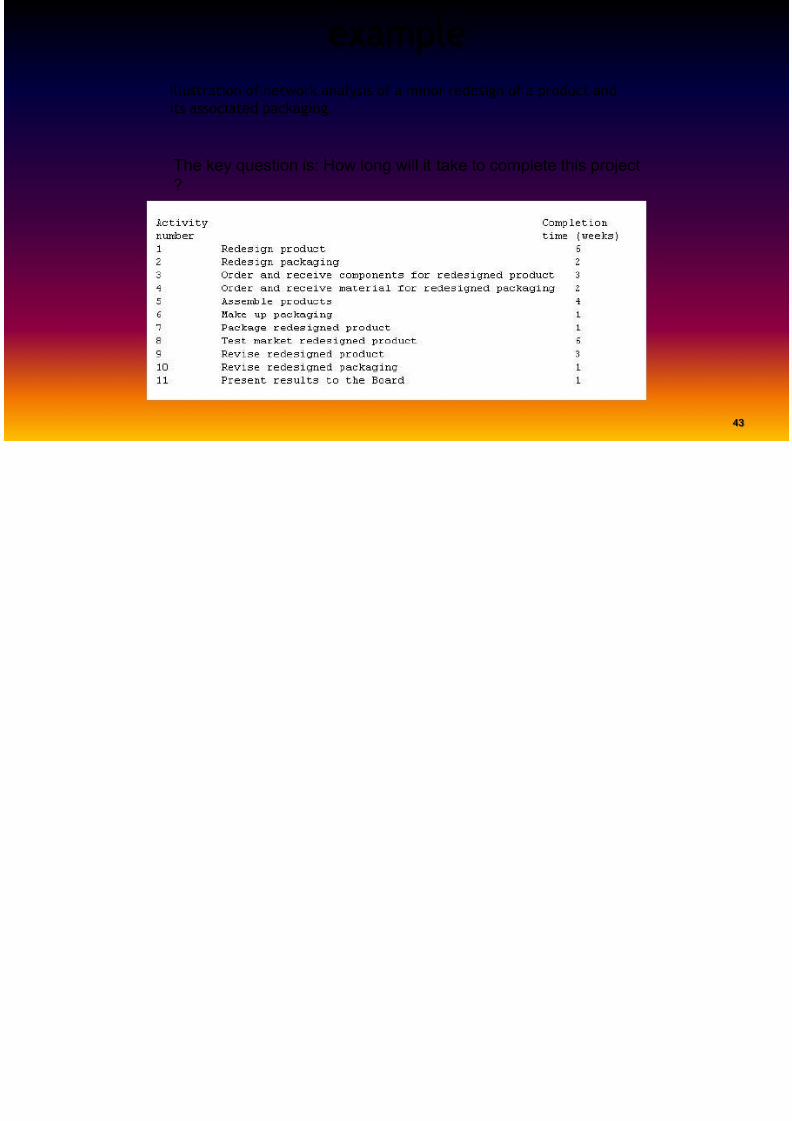
http://slidepdf.com/reader/full/pert-cpm-theory 43/62
exampleIllustration of network analysis of a minor redesign of a product andits associated packaging.
The key question is: How long will it take to complete this project?
8/10/2019 Pert Cpm Theory
http://slidepdf.com/reader/full/pert-cpm-theory 44/62
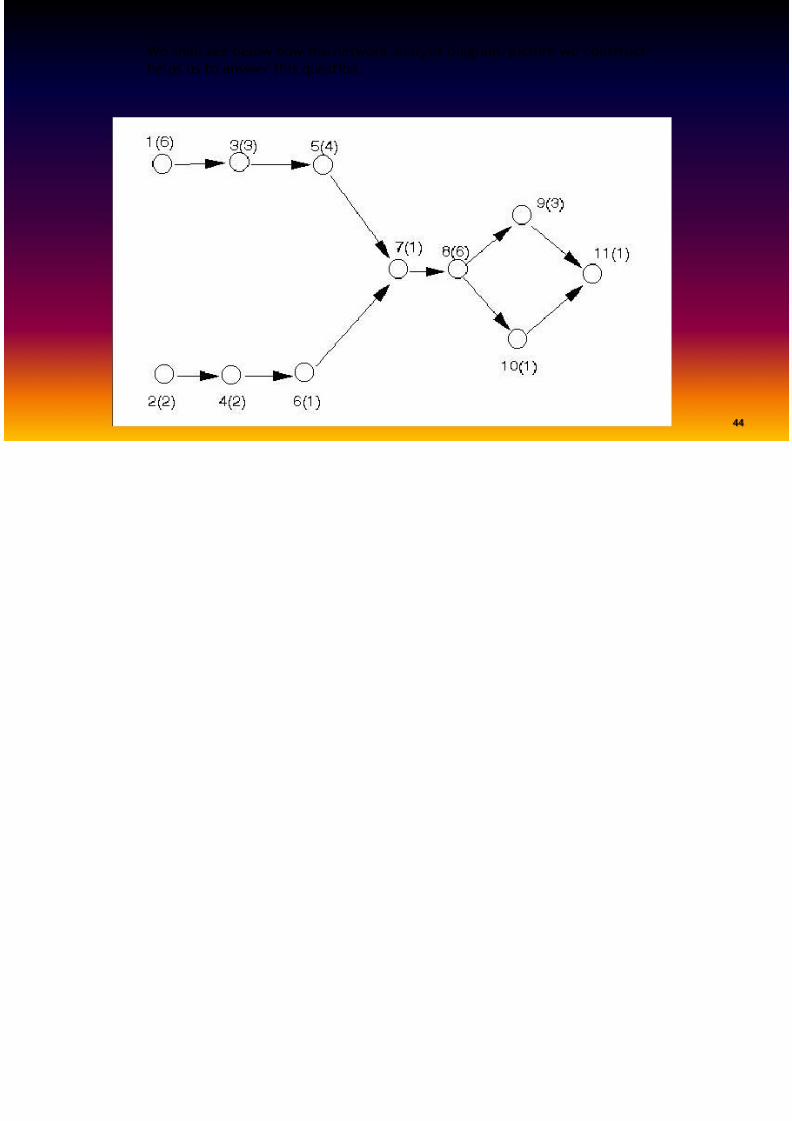
We shall see below how the network analysis diagram/picture we constructhelps us to answer this question.
8/10/2019 Pert Cpm Theory
http://slidepdf.com/reader/full/pert-cpm-theory 45/62
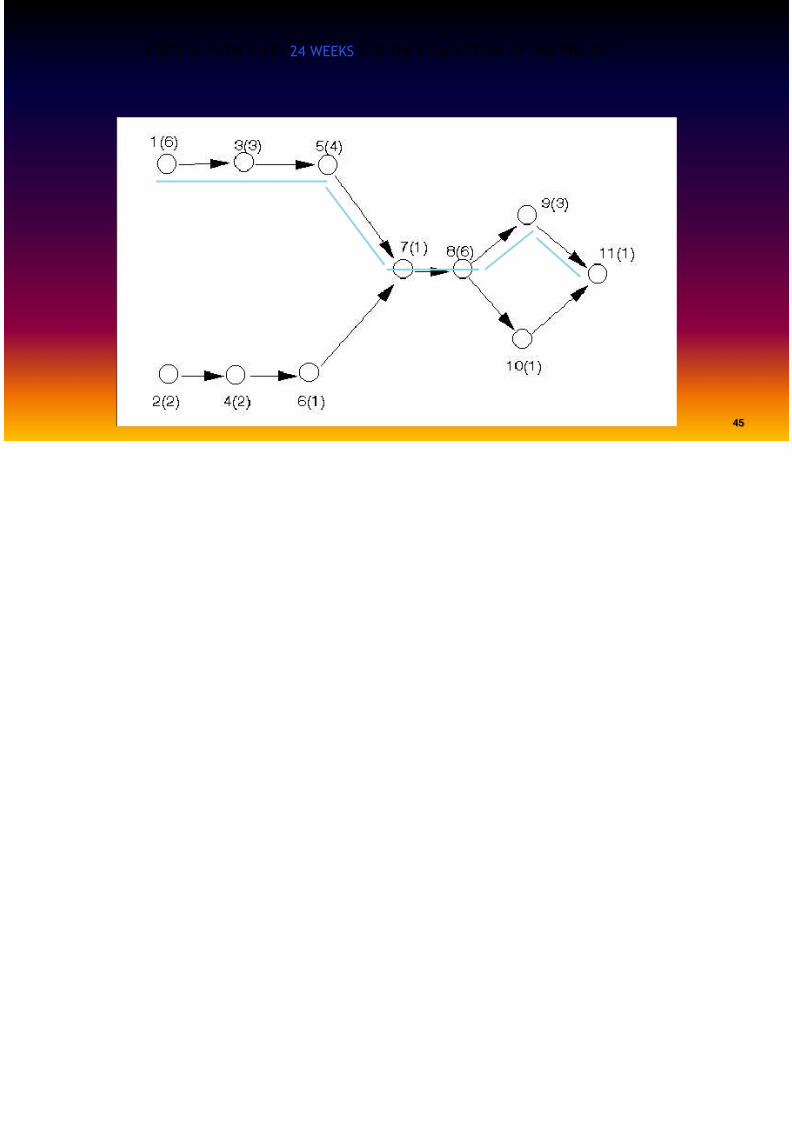
CRITICAL PATH TAKES24 WEEKS FOR THE COMPLETION OF THE PROJECT
TIME ESTIMAT
8/10/2019 Pert Cpm Theory
http://slidepdf.com/reader/full/pert-cpm-theory 46/62
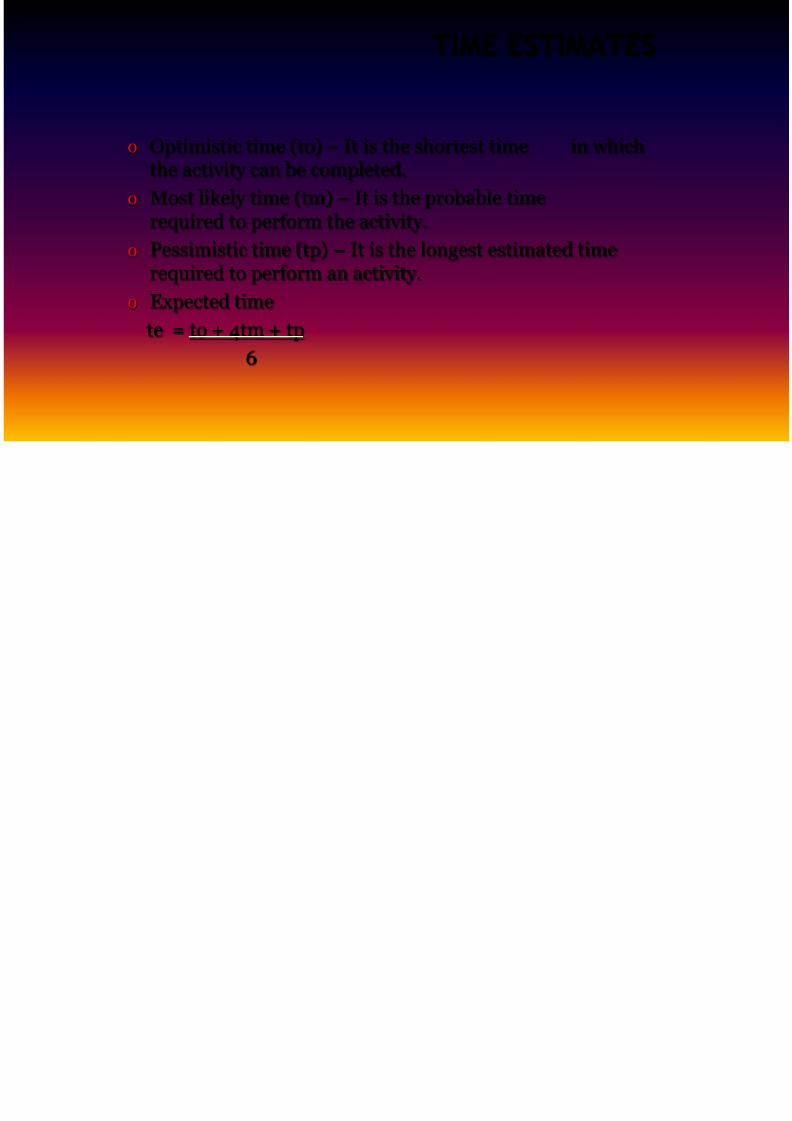
TIME ESTIMAT
o Optimistic time (to) – It is the shortest time in whichthe activity can be completed.o Most likely time (tm) – It is the probable time
required to perform the activity.o Pessimistic time (tp) – It is the longest estimated time
required to perform an activity.o Expected time
te = to + 4tm + tp6
STEPS IN PER
8/10/2019 Pert Cpm Theory
http://slidepdf.com/reader/full/pert-cpm-theory 47/62
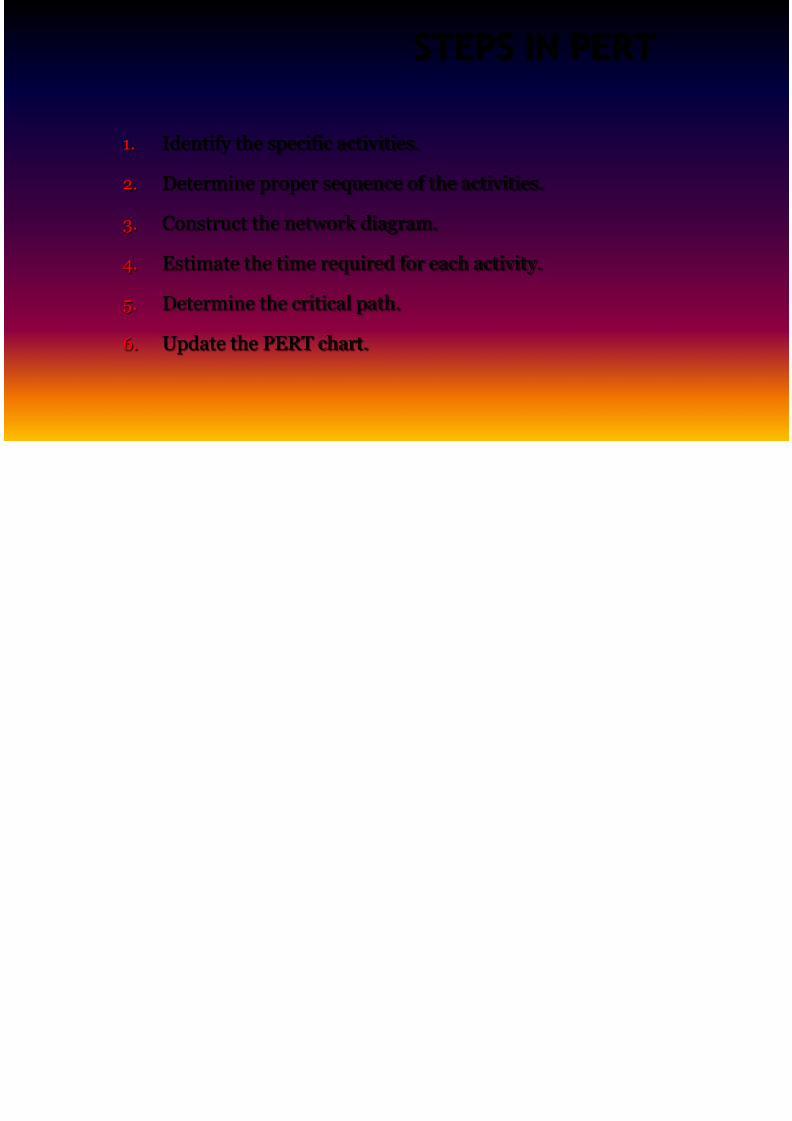
STEPS IN PER
1.Identify the specific activities.
2. Determine proper sequence of the activities.
3. Construct the network diagram.
4. Estimate the time required for each activity.
5. Determine the critical path.
6. Update the PERT chart.
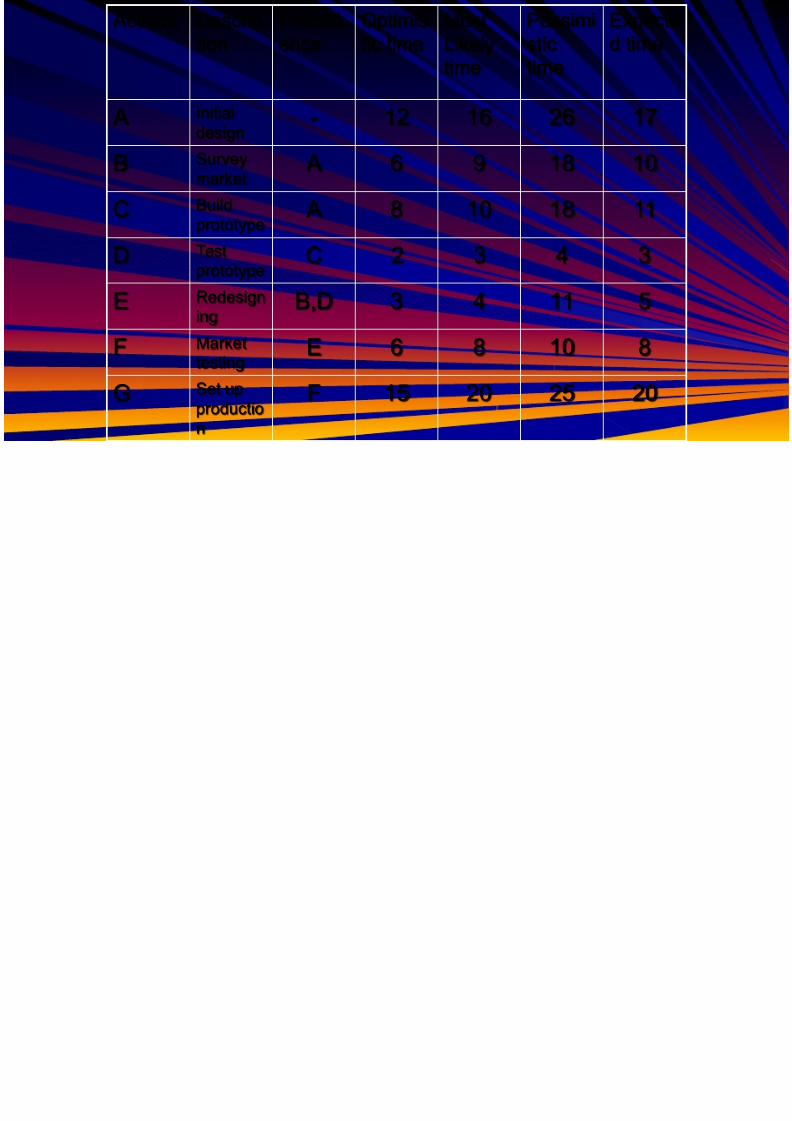
Activity Description
Precedence
Optimistic time
MostLikely
Pessimistic
Exd ti

8/10/2019 Pert Cpm Theory
http://slidepdf.com/reader/full/pert-cpm-theory 48/62
tion ence tic time Likelytime
stictime
d ti
A Initialdesign
- 12 16 26 17
B Surveymarket
A 6 9 18 1
C Buildprototype
A 8 10 18 11
D Testprototype
C 2 3 4 3
E Redesigning
B,D 3 4 11 5
F Markettesting
E 6 8 10 8
G Set upproductio
n
F 15 20 25 20
8/10/2019 Pert Cpm Theory
http://slidepdf.com/reader/full/pert-cpm-theory 49/62
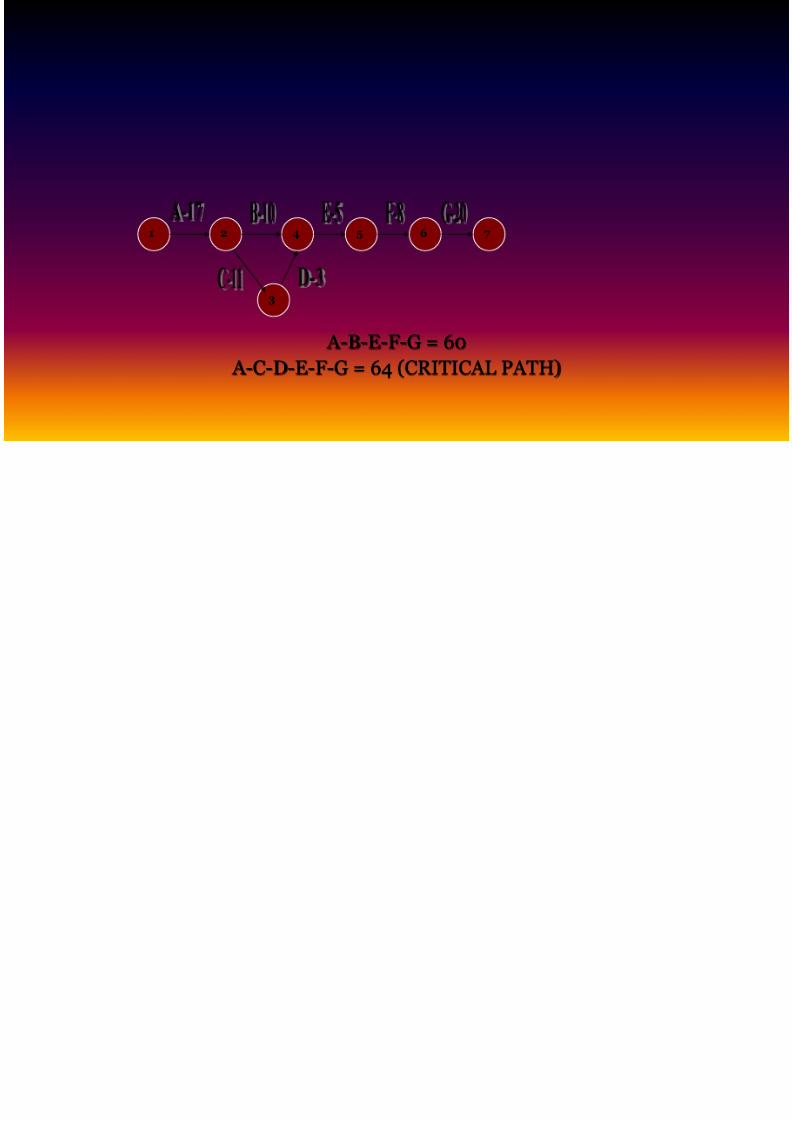
1 7652
3
4
A-B-E-F-G = 60 A-C-D-E-F-G = 64 (CRITICAL PATH)
Time Estimates in PERT
8/10/2019 Pert Cpm Theory
http://slidepdf.com/reader/full/pert-cpm-theory 50/62
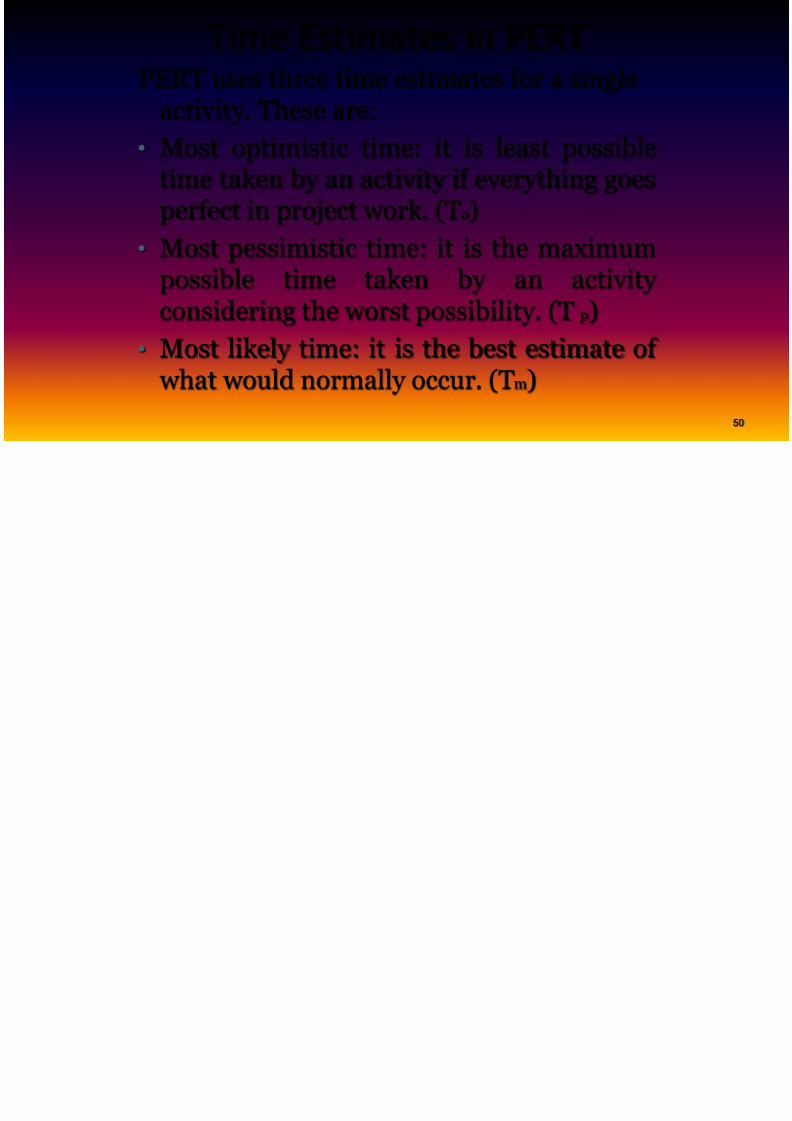
PERT uses three time estimates for a singleactivity. These are:
•
Most optimistic time: it is least possibletime taken by an activity if everything goesperfect in project work. (T o)
• Most pessimistic time: it is the maximum
possible time taken by an activityconsidering the worst possibility. (T p)• Most likely time: it is the best estimate of
what would normally occur. (T m)
Expected project completion time/ Expected
8/10/2019 Pert Cpm Theory
http://slidepdf.com/reader/full/pert-cpm-theory 51/62
Expected project completion time/ Expectedduration of activities is calculated byfollowing formula:
Te= T o+T p+4T m
6
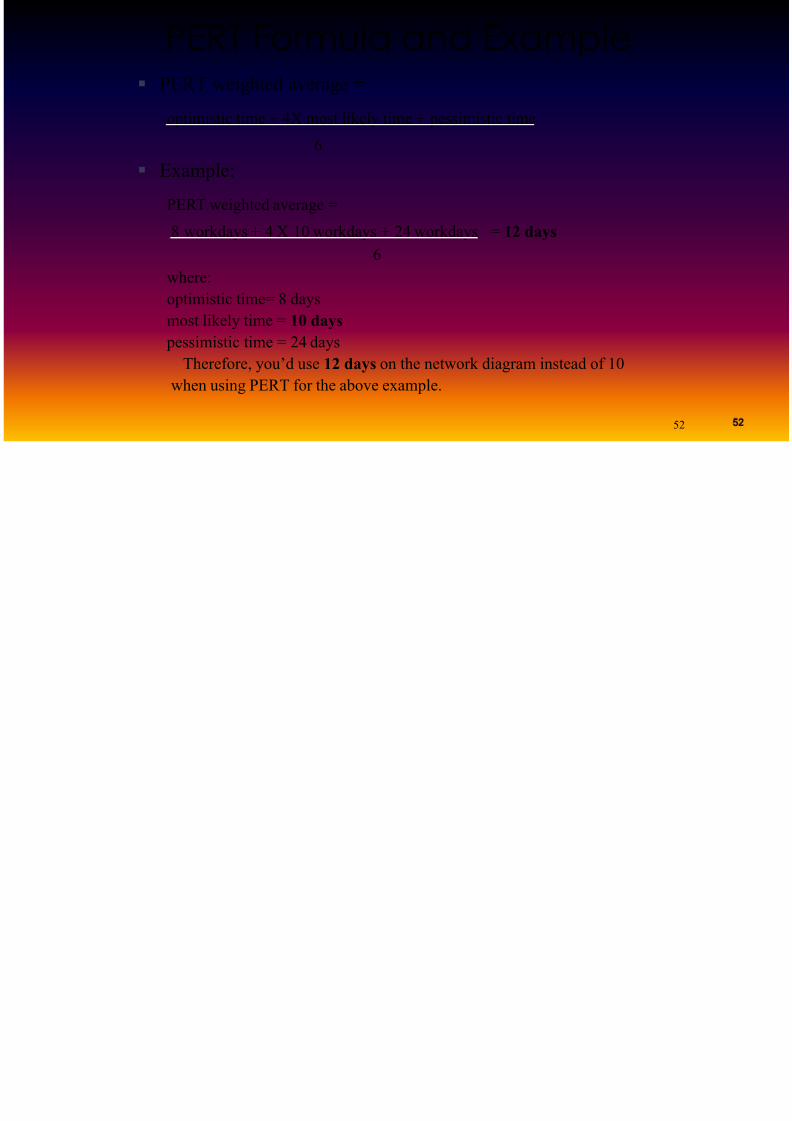
PERT Formula and Example

8/10/2019 Pert Cpm Theory
http://slidepdf.com/reader/full/pert-cpm-theory 52/62
pPERT weighted average =
optimistic time + 4X most likely time + pessimistic time
6
Example:
PERT weighted average =
8 workdays + 4 X 10 workdays + 24 workdays = 12 days 6
where:optimistic time= 8 daysmost likely time = 10 days
pessimistic time = 24 daysTherefore, you’d use 12 days on the network diagram instead of 10
when using PERT for the above example.
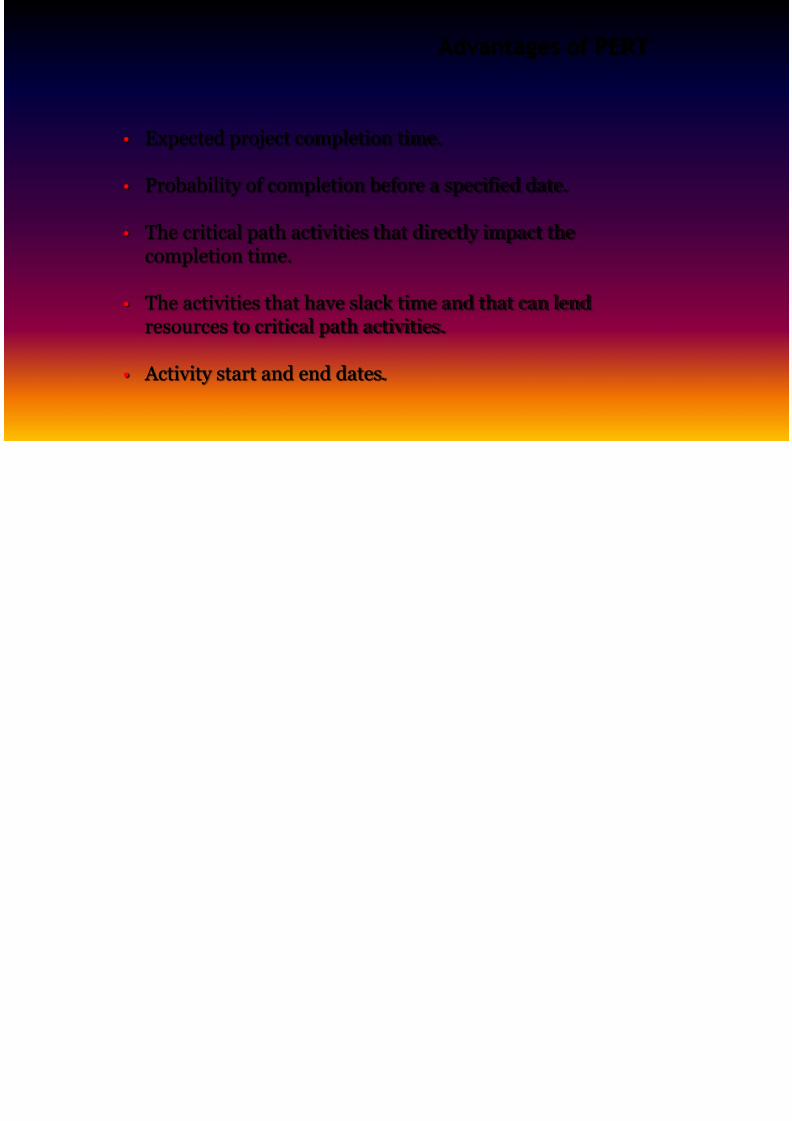
Advantages of PERT
8/10/2019 Pert Cpm Theory
http://slidepdf.com/reader/full/pert-cpm-theory 53/62
g
• Expected project completion time.
• Probability of completion before a specified date.
• The critical path activities that directly impact thecompletion time.
• The activities that have slack time and that can lendresources to critical path activities.
• Activity start and end dates.
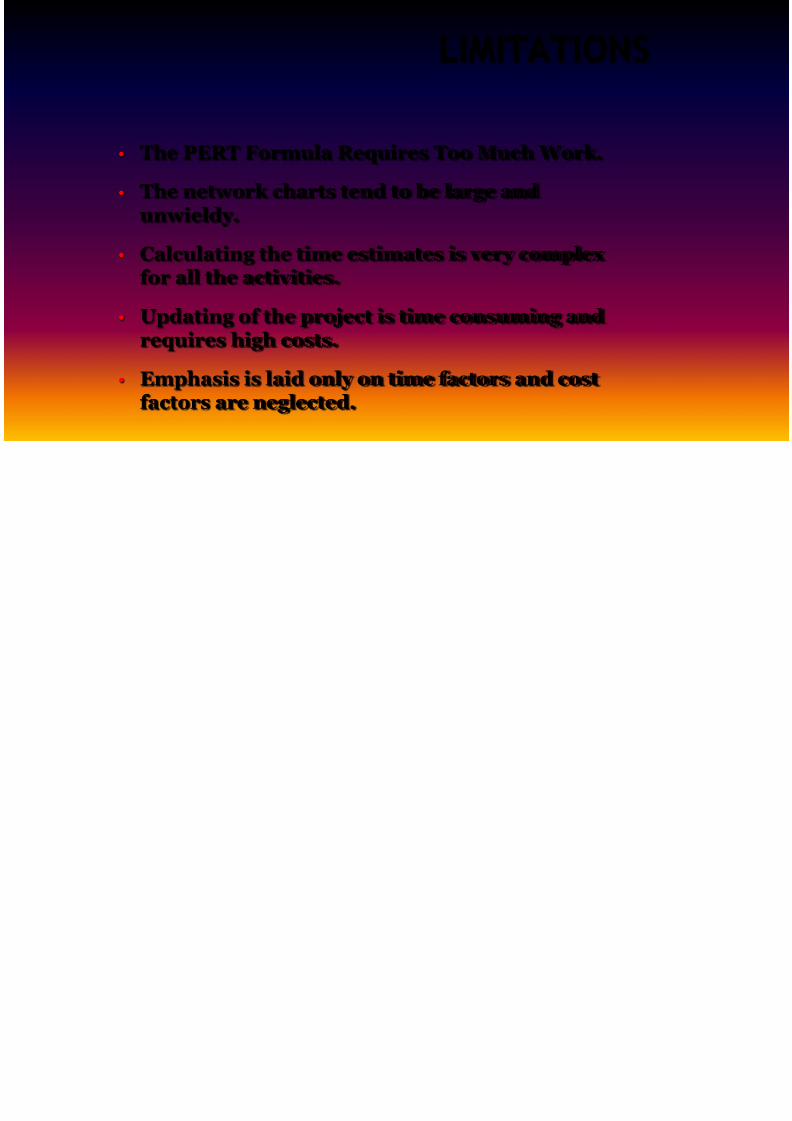
LIMITATION

8/10/2019 Pert Cpm Theory
http://slidepdf.com/reader/full/pert-cpm-theory 54/62
LIMITATION
• The PERT Formula Requires Too Much Work.• The network charts tend to be large and
unwieldy.
• Calculating the time estimates is very complexfor all the activities.
• Updating of the project is time consuming andrequires high costs.
• Emphasis is laid only on time factors and costfactors are neglected.
Difference betweenCPM & PERT

8/10/2019 Pert Cpm Theory
http://slidepdf.com/reader/full/pert-cpm-theory 55/62
CPM & PERT
CPM PERT
• CPM works with fixeddeterministic time
• PERT works with probabilistime
• CPM is useful for repetitiveand non complex projects witha certain degree of timeestimates.
• PERT is useful for nonrepetitive and complex projec with uncertain time estimates
• CPM includes time-cost tradeoff.
• PERT is restricted to time variable.
• CPM- for construction
projects
• PERT- used for R&D
programs
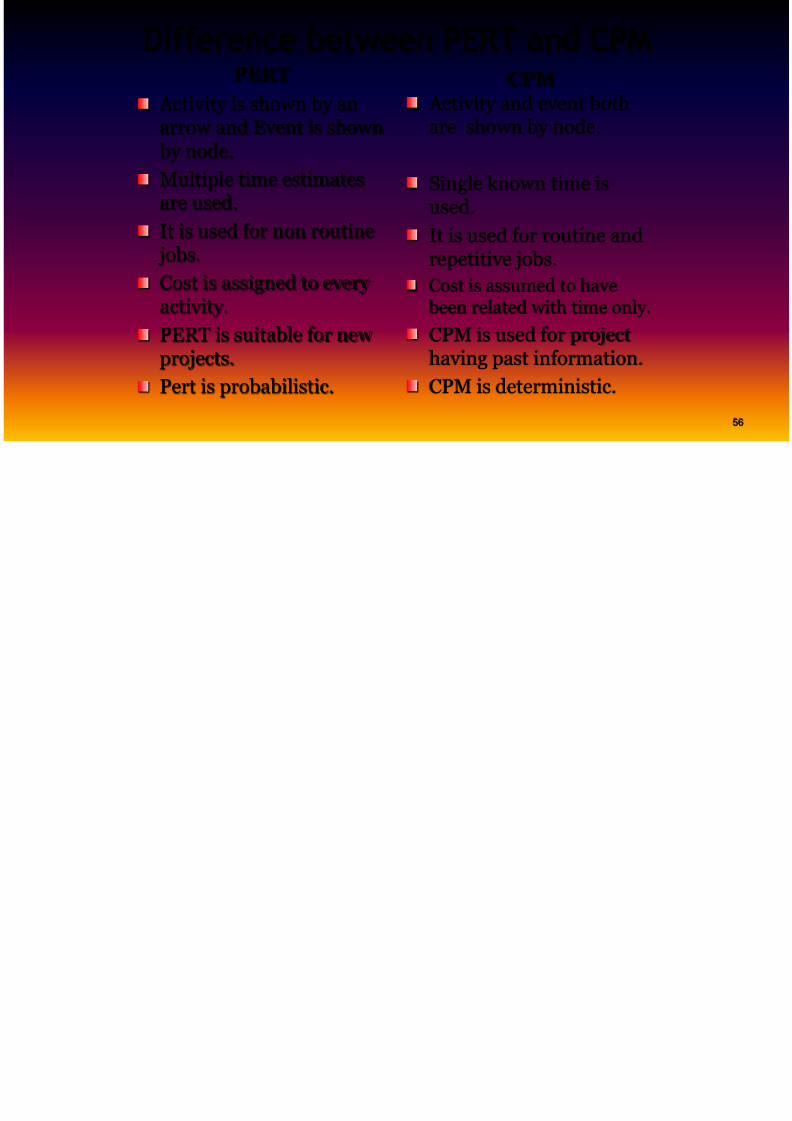
Difference between PERT and CPM

8/10/2019 Pert Cpm Theory
http://slidepdf.com/reader/full/pert-cpm-theory 56/62
PERT Activity is shown by anarrow and Event is shown
by node.Multiple time estimatesare used.It is used for non routine jobs.Cost is assigned to everyactivity.PERT is suitable for newprojects.Pert is probabilistic.
CPM Activity and event bothare shown by node.
Single known time isused.It is used for routine andrepetitive jobs.
Cost is assumed to have been related with time only.CPM is used for projecthaving past information.CPM is deterministic.
Floats and their calculations
8/10/2019 Pert Cpm Theory
http://slidepdf.com/reader/full/pert-cpm-theory 57/62
Floats and their calculations
Total floats: It is the time by which the finishing time of a
activity can be delayed without affecting the total projeTF= Est-Lst or Eft-Lft
.

8/10/2019 Pert Cpm Theory
http://slidepdf.com/reader/full/pert-cpm-theory 58/62
Free Floats: It is the time by which the an activity can b
delayed without affecting the times of succeeding the nactivities
FF=Est of the succeeding activity-Eft of the activity fo
which we calculating the Free float.
Crashing
8/10/2019 Pert Cpm Theory
http://slidepdf.com/reader/full/pert-cpm-theory 59/62
Crashing
Two concepts are associated with all types of project.
These are time and cost.Suppose we want to complete the project before desiredates it will increase the cost.
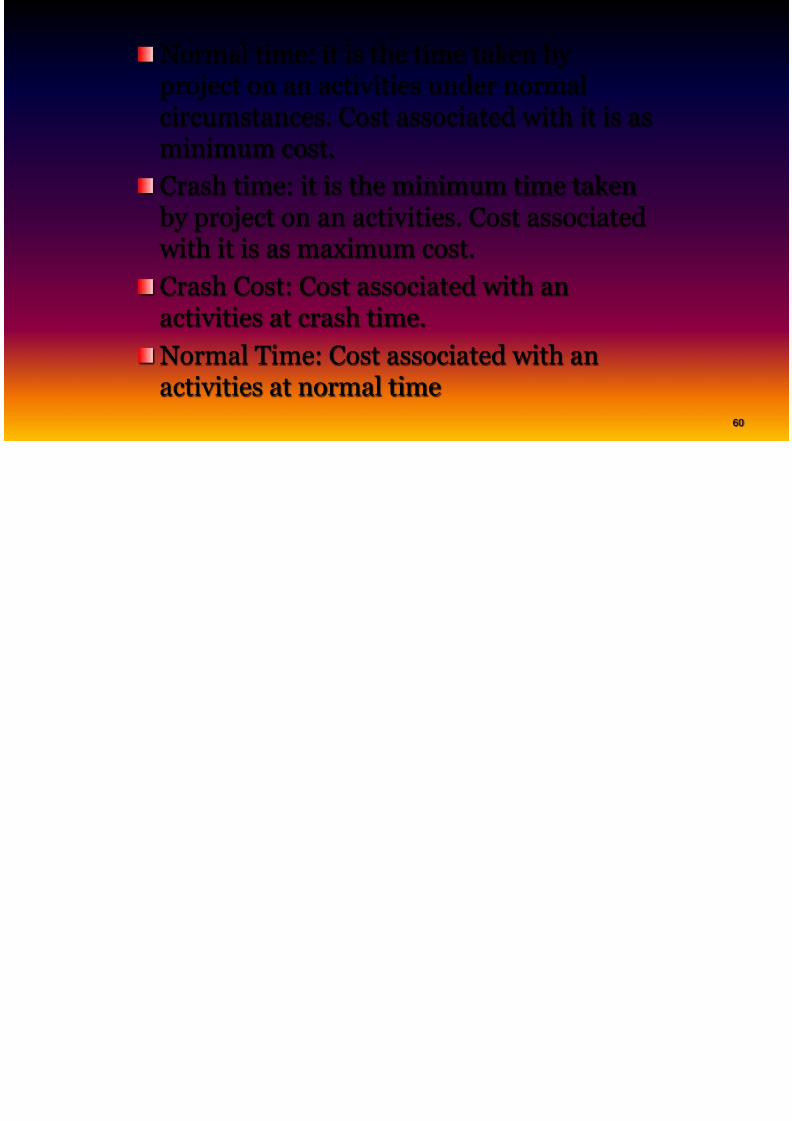
What is Crashing:……………….
Normal time: it is the time taken by

8/10/2019 Pert Cpm Theory
http://slidepdf.com/reader/full/pert-cpm-theory 60/62
yproject on an activities under normalcircumstances. Cost associated with it is as
minimum cost.Crash time: it is the minimum time taken by project on an activities. Cost associated with it is as maximum cost.
Crash Cost: Cost associated with anactivities at crash time.Normal Time: Cost associated with anactivities at normal time

8/10/2019 Pert Cpm Theory
http://slidepdf.com/reader/full/pert-cpm-theory 61/62
Cost slope: it is known as crashing cost per unit of time
Cost slope= (Crash cost-Normal cost)(Normal time- Crash time)
Critically activities to be crashed first chosen with its hel
Drawing a Network

8/10/2019 Pert Cpm Theory
http://slidepdf.com/reader/full/pert-cpm-theory 62/62
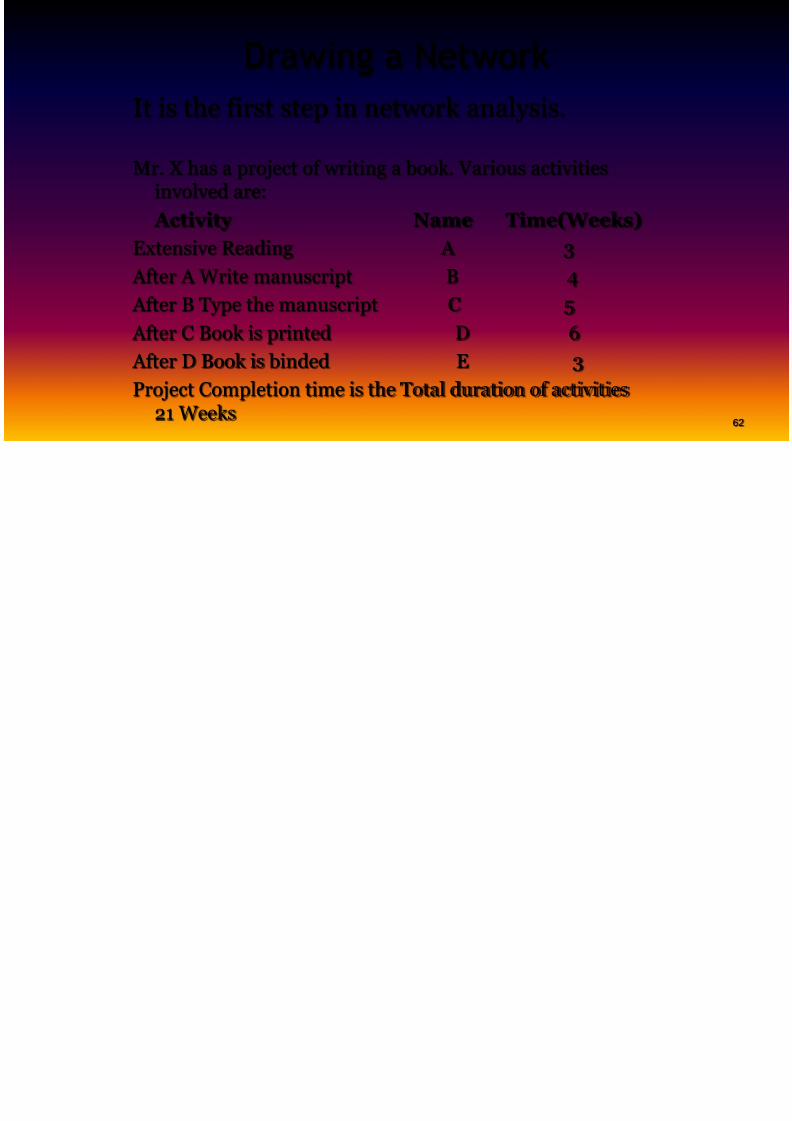
Drawing a NetworkIt is the first step in network analysis.
Mr. X has a project of writing a book. Various activitiesinvolved are:
Activity Name Time(Weeks)Extensive Reading A 3 After A Write manuscript B 4 After B Type the manuscript C 5 After C Book is printed D 6 After D Book is binded E 3Project Completion time is the Total duration of activities
21 Weeks