
PERSPECTIVES - Arbuthnot Latham
12
1 Classification: Confidential The economy is recovering strongly according to the latest indicators 7 th June 2021 Introduction All the indicators released last week, not least of all the latest Markit surveys, suggested that the economy is recovering strongly. Under these circumstances, it is relevant to consider the appropriateness of current monetary policy, which is very accommodative. At the May MPC meeting 8/9 MPC members voted to continue the Bank’s existing programme of UK government bond purchases (QE), which has the target of £875bn purchases. 1-2 The existing £150bn programme started in January 2021 and, in May, the MPC continued to expect it to be completed by around the end of 2021. Reportedly, the halfway mark for the purchase of the £150bn has recently been crossed. 3 Chief Economist Andy Haldane voted (alone) to cut the £875bn target in May, voting to lower the existing programme of bond purchases from £150bn to £100bn and therefore reducing the target to £825bn, on the grounds that the economy could overheat, triggering inflationary pressures. 4-5 Even though it should be emphasised that the increase in April’s CPI inflation rate largely reflected base effects, 6 Mr Haldane’s concerns look eminently reasonable. Given the strength of the “bounce-back”, the MPC would seem perfectly justified in cutting back the current bond purchasing programme to £100bn, as supported by Mr Haldane. The announcement of the outcome of the next MPC meeting is on 24 June 2021, and the minutes will be scanned for indications of a possible change in the policy. Markit surveys suggest sharp recovery Markit surveys for May did indeed suggest a sharp recovery in all three sectors (chart 1). Moreover, they were accompanied by higher inflationary pressures. • The Manufacturing PMI improved further to 65.6 in May, up from April’s 60.9, and above July 1994’s record high. 7 Output growth strengthened and new orders rose. Shortages of raw materials and supply- chain disruption fed through to input costs during May, leading to the sharpest rise in purchasing costs since the survey began in January 1992. This led manufacturers to increase selling prices, with the rate of inflation hitting a survey record. PERSPECTIVES By Ruth Lea, Economic Adviser to the Arbuthnot Banking Group Ruth Lea Economic Adviser Arbuthnot Banking Group [email protected] 07800 608 674
Transcript of PERSPECTIVES - Arbuthnot Latham

1
Classification: Confidential
The economy is recovering strongly according to the latest indicators
7th June 2021
Introduction
All the indicators released last week, not least of all the latest Markit surveys, suggested that the economy is recovering strongly. Under these circumstances, it is relevant to consider the appropriateness of current monetary policy, which is very accommodative. At the May MPC meeting 8/9 MPC members voted to continue the Bank’s existing programme of UK government bond purchases (QE), which has the target of £875bn purchases.1-2 The existing £150bn programme started in January 2021 and, in May, the MPC continued to expect it to be completed by around the end of 2021. Reportedly, the halfway mark for the purchase of the £150bn has recently been crossed.3 Chief Economist Andy Haldane voted (alone) to cut the £875bn target in May, voting to lower the existing programme of bond purchases from £150bn to £100bn and therefore reducing the target to £825bn, on the grounds that the economy could overheat, triggering inflationary pressures.4-5 Even though it should be emphasised that the increase in April’s CPI inflation rate largely reflected base effects,6 Mr Haldane’s concerns look eminently reasonable. Given the strength of the “bounce-back”, the MPC would seem perfectly justified in cutting back the current bond purchasing programme to £100bn, as supported by Mr Haldane. The announcement of the outcome of the next MPC meeting is on 24 June 2021, and the minutes will be scanned for indications of a possible change in the policy.
Markit surveys suggest sharp recovery
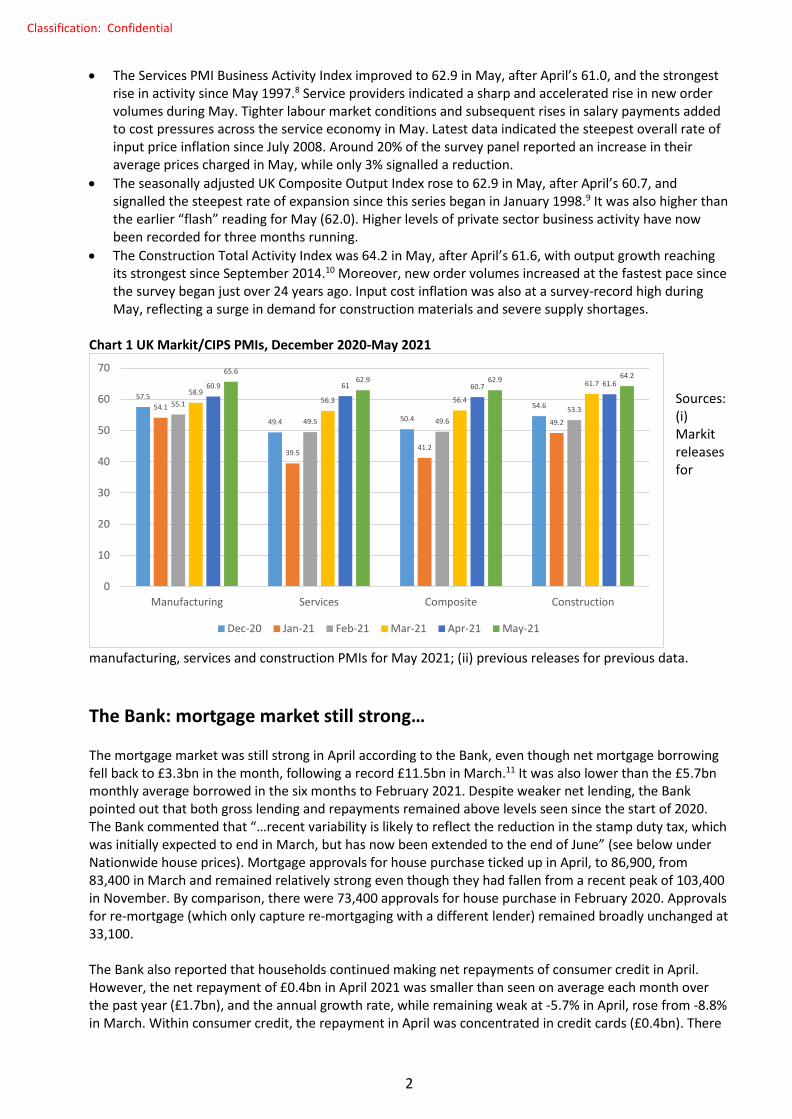
Markit surveys for May did indeed suggest a sharp recovery in all three sectors (chart 1). Moreover, they were accompanied by higher inflationary pressures. • The Manufacturing PMI improved further to 65.6 in May, up from April’s 60.9, and above July 1994’s
record high.7 Output growth strengthened and new orders rose. Shortages of raw materials and supply-chain disruption fed through to input costs during May, leading to the sharpest rise in purchasing costs since the survey began in January 1992. This led manufacturers to increase selling prices, with the rate of inflation hitting a survey record.
PERSPECTIVES
By Ruth Lea, Economic Adviser to the Arbuthnot Banking Group
Ruth Lea Economic Adviser Arbuthnot Banking Group [email protected] 07800 608 674
2
Classification: Confidential
• The Services PMI Business Activity Index improved to 62.9 in May, after April’s 61.0, and the strongest rise in activity since May 1997.8 Service providers indicated a sharp and accelerated rise in new order volumes during May. Tighter labour market conditions and subsequent rises in salary payments added to cost pressures across the service economy in May. Latest data indicated the steepest overall rate of input price inflation since July 2008. Around 20% of the survey panel reported an increase in their average prices charged in May, while only 3% signalled a reduction.
• The seasonally adjusted UK Composite Output Index rose to 62.9 in May, after April’s 60.7, and signalled the steepest rate of expansion since this series began in January 1998.9 It was also higher than the earlier “flash” reading for May (62.0). Higher levels of private sector business activity have now been recorded for three months running.
• The Construction Total Activity Index was 64.2 in May, after April’s 61.6, with output growth reaching its strongest since September 2014.10 Moreover, new order volumes increased at the fastest pace since the survey began just over 24 years ago. Input cost inflation was also at a survey-record high during May, reflecting a surge in demand for construction materials and severe supply shortages.
Chart 1 UK Markit/CIPS PMIs, December 2020-May 2021
Sources: (i) Markit releases for
manufacturing, services and construction PMIs for May 2021; (ii) previous releases for previous data.
The Bank: mortgage market still strong…
The mortgage market was still strong in April according to the Bank, even though net mortgage borrowing fell back to £3.3bn in the month, following a record £11.5bn in March.11 It was also lower than the £5.7bn monthly average borrowed in the six months to February 2021. Despite weaker net lending, the Bank pointed out that both gross lending and repayments remained above levels seen since the start of 2020. The Bank commented that “…recent variability is likely to reflect the reduction in the stamp duty tax, which was initially expected to end in March, but has now been extended to the end of June” (see below under Nationwide house prices). Mortgage approvals for house purchase ticked up in April, to 86,900, from 83,400 in March and remained relatively strong even though they had fallen from a recent peak of 103,400 in November. By comparison, there were 73,400 approvals for house purchase in February 2020. Approvals for re-mortgage (which only capture re-mortgaging with a different lender) remained broadly unchanged at 33,100. The Bank also reported that households continued making net repayments of consumer credit in April. However, the net repayment of £0.4bn in April 2021 was smaller than seen on average each month over the past year (£1.7bn), and the annual growth rate, while remaining weak at -5.7% in April, rose from -8.8% in March. Within consumer credit, the repayment in April was concentrated in credit cards (£0.4bn). There
57.5
49.4 50.4
54.654.1
39.541.2
49.2
55.1
49.5 49.653.3
58.956.3 56.4
61.760.9 61 60.7 61.665.6
62.9 62.9 64.2
0
10
20
30
40
50
60
70
Manufacturing Services Composite Construction
Dec-20 Jan-21 Feb-21 Mar-21 Apr-21 May-21

3
Classification: Confidential
was no additional borrowing in other forms of consumer credit. The annual growth rates of both components have risen from series lows in February, but remained weak at -12.9% and -2.7%, respectively.
…and the money supply continues to expand rapidly
M4ex is the Bank’s favoured measure of the money supply (defined as broad money, excluding intermediate other financial corporations (IOFCs)). It comprises the money holdings of households, private non-financial corporations (PNFCs) and non-intermediate other financial corporations (NIOFCs). Money holdings include notes and coin and deposits with monetary financial institutions (MFIs, including the Bank and the commercial banks). The growth of M4ex and its three constituent component sectors are shown in chart 2. Even though the annual growth of M4ex has slowed quite significantly in the most recent months, it continued to expand rapidly in April by any standards. It grew by 10.9% (YOY), after March’s 12.3% (YOY). In terms of amounts outstanding, M4ex increased by £11.6bn in April, after March’s £12.4bn. Households continued depositing significant amounts, with an additional £10.7bn placed in April, though the rate of accumulation is slowing. Private non-financial companies (PNFCs) placed £2.3bn, whilst non-intermediate OFCs decreased their holdings by £1.4bn. Chart 2 M4ex and component sectors, January 2018-April 2021, YOY growth (%)
Source: (i) Bank of England, “Money and credit: April 2021”, 2 June 2021; (ii) Bank’s website for time series. Data revisions from January 2021. Chart 2 clearly shows the rapid growth of money holdings since February 2020 (pre-pandemic) of the household sector and PNFCs, both of which have been large contributors to the growth of M4ex. As seen in table 1 (below), the stock of M4ex increased by over £360bn between February 2020 and April 2021, of which the household sector and PNFCs contributed the lion’s share. The household sector’s money holdings increased by nearly £210bn, whilst PNFCs increased their money holdings by nearly £130bn, reflecting the effects of QE as well as the large increase in bank lending. The net contribution of NIOFCs has been modest by comparison.
M4ex
Household sector
PNFCs
NIOFCs
-10
-5
0
5
10
15
20
25
30
35
M4ex Household sector PNFCs NIOFCs

4
Classification: Confidential
Table 1 M4ex and money holdings by sectors, amounts outstanding (£bn) Feb 2020 Feb
2021 Mar 2021 Apr 2021 Change
Apr 2021-Feb 2020 (sic)
Apr 2021-Mar 2021 (MOM)
M4ex, of which: 2,256.9 2,593.0 2,606.3 2,618.2 361.3 11.6 (rounding) • Household
sector 1,488.1 1,669.2 1,685.5 1,696.2 208.1 10.7
• PNFCs 431.7 557.2 558.5 560.9 129.2 2.3 (rounding) • NIOFCs 337.1 367.5 362.3 361.1 24.0 -1.4 (rounding)
Sources: (i) Bank of England, “Money and Credit: April 2021”, 2 June 2021; (ii) Bank of England website. Data revisions from January 2021.
Buoyant house prices…
The Nationwide’s latest house price data showed prices firmed further in May, rising 1.8% (MOM) after April’s MOM rebound of 2.3%.12 The annual increase, bolstered by base effects, rose to 10.9% in May, the highest level recorded since August 2014, after 7.1% in April. Nationwide commented “…the market has seen a complete turnaround over the past twelve months. A year ago, activity collapsed in the wake of the first lockdown with housing transactions falling to a record low of 42,000 in April 2020. But activity surged towards the end of last year and into 2021, reaching a record high of 183,000 in March”. They added that “…amongst homeowners surveyed at the end of April that were either moving home or considering a move, 68% said this would have been the case even if the stamp duty holiday had not been extended. It is shifting housing preferences which is continuing to drive activity, with people reassessing their needs in the wake of the pandemic”. Government policy on Stamp Duty land Tax (STLD) has clearly had a stimulatory effect on the housing market. Changes to Stamp Duty were last made in the March 2021 Budget. In England and Northern Ireland, the tax holiday was extended until 30 June 2021 after which the threshold will decrease to £250,000 until 30 September 2021. From 1 October 2021, the thresholds will revert back to what they were before 8 July 2020. The tax holiday for Scotland ended on 31 March 2021, whilst the tax holiday has been extended until 30 June 2021 in Wales. The tax thresholds are/have been £500,000 for England and Northern Ireland and £250,000 for Scotland and Wales.
…and some better data on car registrations
The SMMT reported that May’s new car registrations were significantly higher than in May 2020 when retailers’ doors were shut during the pandemic.13 Indeed they were up 8-fold YOY but the data need to be treated with caution. They were still a very considerable 13.2% lower than the 10-year average for May. The SMMT commented “…with dealerships back open and a brighter, sunnier, economic outlook, May’s registrations are as good as could reasonably be expected. Increased business confidence is driving the recovery, something that needs to be maintained and translated in private consumer demand as the economy emerges from pandemic support measures.”

5
Classification: Confidential
The number on furlough has fallen further
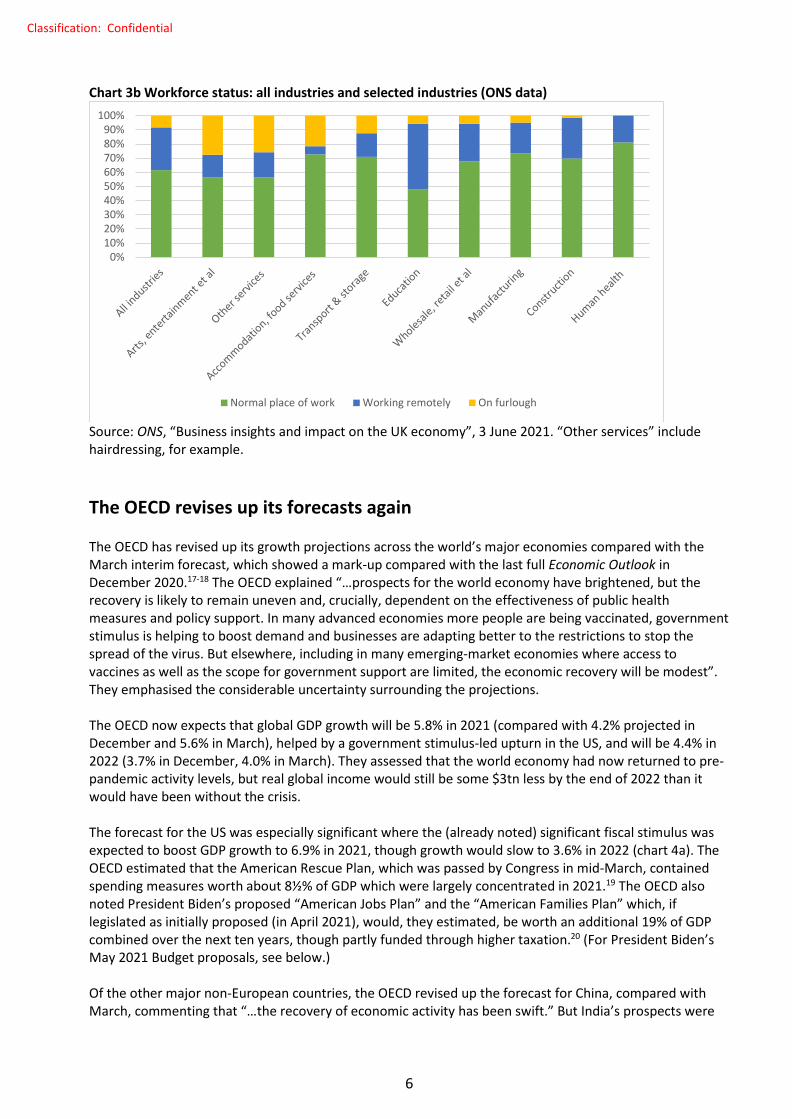
According to HMRC data, the number of employments on furlough was around 3.4mn on 30 April 2021, down 900,000 from 4.3mn on 31 March 2021.14 Numbers on the Coronavirus Job Retention Scheme (CJRS) last peaked at 5.1mn in mid-January 2021 and have fallen since then. Before this, the number of employments on furlough peaked at 8.9mn on 8 May 2020 and then fell sharply to 2.4mn by 31 October 2020 but then increased as lockdown restrictions were intensified in November 2020 (chart 3a). The ONS has released some more up-to-date information on furlough. They reported that the proportion of businesses’ workforce on furlough leave has fallen from 19.9% in late January 2021 to 8.1% in mid-May 2021 (3-16 May), as a result of coronavirus restrictions continuing to be relaxed across the UK.15 This was the lowest proportion of businesses’ workforce on furlough leave since the UK commenced the third nationwide lockdown in January 2021 and was fairly comparable with the lowest level recorded in October 2020 (7.7%) since the furlough scheme began at the beginning of March 2020. The ONS estimated that 8.1% on furlough leave equated to approximately 2.1mn people.16 This figure is clearly well down on the HMRC’s estimate of 3.4mn for end-April. Suffice to say, consumer-facing industries still have the greatest proportions of their workforces on furlough (partial or complete), as shown in chart 3b, which also covers “working at the normal place of work” and “working remotely” (3-16 May). Note that the data are from the ONS’s Business Insights and Conditions Survey (BICS) and only cover businesses that have not permanently stopped trading. Chart 3a Number of furlough (millions), HMRC data, last day of month, to end-April 2021
Source: HM Government, “Coronavirus Job Retention Scheme (CJRS) statistics”, 3 June 2021, HMRC data, data tables, based on claims made by 14 May.
0123456789
10
Number on furlough
6
Classification: Confidential
Chart 3b Workforce status: all industries and selected industries (ONS data)
Source: ONS, “Business insights and impact on the UK economy”, 3 June 2021. “Other services” include hairdressing, for example.
The OECD revises up its forecasts again
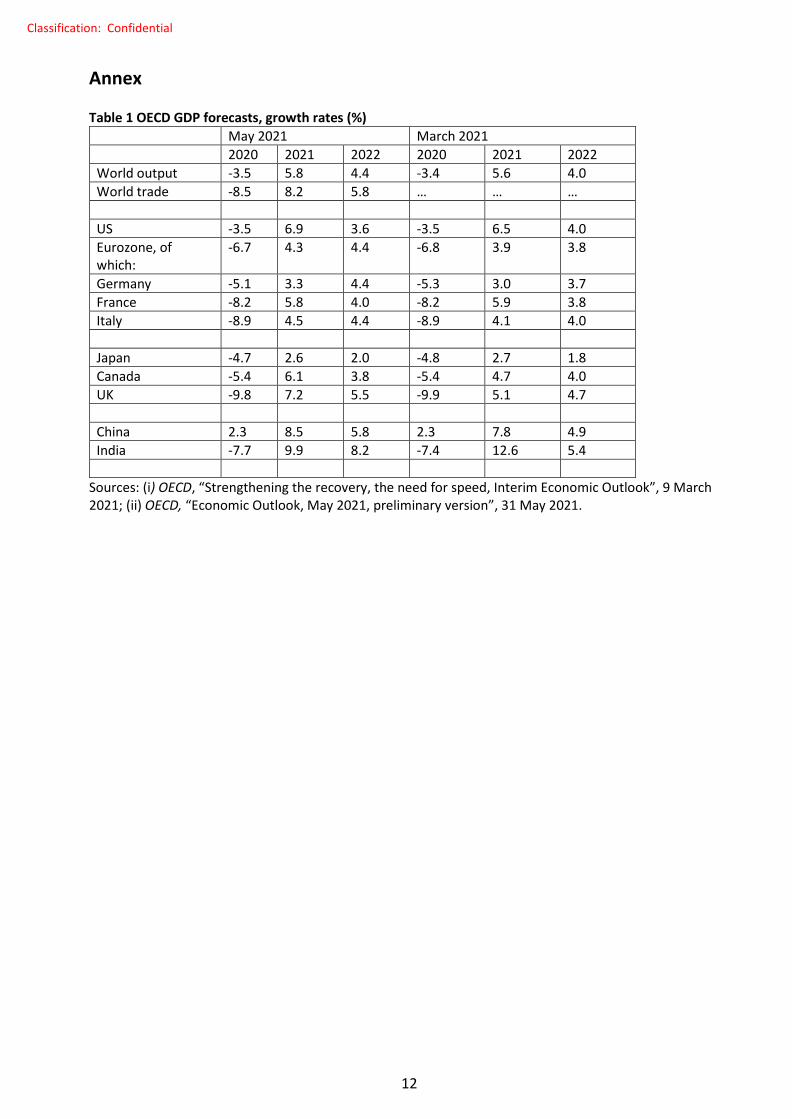
The OECD has revised up its growth projections across the world’s major economies compared with the March interim forecast, which showed a mark-up compared with the last full Economic Outlook in December 2020.17-18 The OECD explained “…prospects for the world economy have brightened, but the recovery is likely to remain uneven and, crucially, dependent on the effectiveness of public health measures and policy support. In many advanced economies more people are being vaccinated, government stimulus is helping to boost demand and businesses are adapting better to the restrictions to stop the spread of the virus. But elsewhere, including in many emerging-market economies where access to vaccines as well as the scope for government support are limited, the economic recovery will be modest”. They emphasised the considerable uncertainty surrounding the projections. The OECD now expects that global GDP growth will be 5.8% in 2021 (compared with 4.2% projected in December and 5.6% in March), helped by a government stimulus-led upturn in the US, and will be 4.4% in 2022 (3.7% in December, 4.0% in March). They assessed that the world economy had now returned to pre-pandemic activity levels, but real global income would still be some $3tn less by the end of 2022 than it would have been without the crisis. The forecast for the US was especially significant where the (already noted) significant fiscal stimulus was expected to boost GDP growth to 6.9% in 2021, though growth would slow to 3.6% in 2022 (chart 4a). The OECD estimated that the American Rescue Plan, which was passed by Congress in mid-March, contained spending measures worth about 8½% of GDP which were largely concentrated in 2021.19 The OECD also noted President Biden’s proposed “American Jobs Plan” and the “American Families Plan” which, if legislated as initially proposed (in April 2021), would, they estimated, be worth an additional 19% of GDP combined over the next ten years, though partly funded through higher taxation.20 (For President Biden’s May 2021 Budget proposals, see below.) Of the other major non-European countries, the OECD revised up the forecast for China, compared with March, commenting that “…the recovery of economic activity has been swift.” But India’s prospects were
0%10%20%30%40%50%60%70%80%90%
100%
Normal place of work Working remotely On furlough

7
Classification: Confidential
revised down for 2021 as “…the dramatic infections upsurge since February has weakened the nascent recovery and may compound the financial woes of corporates and banks”. Turning to Eurozone economies (chart 4b), the OECD forecast economic growth to rebound strongly in 2021H2, “as confinement measures were lifted”. GDP should rise by 4.3% in 2021 and 4.4% in 2022, boosted by private consumption, considerable fiscal support and vigorous external demand, notably from the US. They noted that the swift and effective implementation of the EU recovery plan would further “bolster the recovery” and, with inflation set to remain below the ECB objective by end-2022, monetary policy should remain accommodative. The projections for the UK were revised up again to 7.2% in 2021 (4.2% in December, 5.1% in March) and to 5.5% in 2022 (4.1% in December, 4.7% in March), supported by the successful vaccination programme and the US stimulus. GDP was expected to return to its pre-pandemic level in early 2022. Growth will be driven by a rebound of consumption, notably of services. However, increased border costs following the exit from the EU Single Market would, they claimed, continue to weigh on foreign trade. The GDP fall for 2020 is now estimated to be 9.8% (outturn) and, as we have discussed before, the UK’s relatively large decline in GDP for 2020 partly reflects different methodologies for estimating education and health.21-22 Chart 4a OECD GDP forecasts for 2021 & 2022, March 2021 & May 2021 forecasts: world & selected non-European economies
Chart 4b OECD GDP forecasts for 2021 & 2022, March 2021 & May 2021 forecasts: Eurozone and the UK
Sources: (i) OECD, “Strengthening the recovery, the need for speed, Interim Economic Outlook”, 9 March 2021; (ii) OECD, “Economic Outlook, May 2021, preliminary version”, 31 May 2021. See also annex table 1.
5.66.5
2.7
7.8
12.6
4 4
1.8
4.9 5.45.86.9
2.6
8.59.9
4.43.6
2
5.8
8.2
0
2
4
6
8
10
12
14
World US Japan China India
2021 (Mar) 2022 (Mar) 2021 (May) 2022 (May)
3.9
3
5.9
4.1
5.1
3.8 3.7 3.8 44.7
4.3
3.3
5.8
4.5
7.2
4.4 4.44
4.4
5.5
0
1
2
3
4
5
6
7
8
Eurozone Germany France Italy UK
2021 (Mar) 2022 (Mar) 2021 (May) 2022 (May)

8
Classification: Confidential
…and President Biden’s Budget proposals
The US government released its Budget plans for fiscal year 2022 (October 2021-September 2022) on 27 May 2021. As the Budget report explained:23 • The Budget “…includes the two historic plans the President has already put forward, the American Jobs
Plan and the American Families Plan, and outlines a package of discretionary proposals to help restore core functions of Government and reinvest in the foundations of the Nation’s strength”.24
• The American Jobs Plan is “an investment in America that would create millions of good jobs, rebuild the Nation’s infrastructure, and position the US to out-compete China”. The Plan will “…boost investment in public transport, high-speed broadband, and roads and bridges and be guided by the fight against climate change”.
• The American Families Plan is “an historic investment to help families cover the basic expenses that so many struggle with now; lower health insurance premiums; and continue the historic reductions in child poverty in the American Rescue Plan Act of 2021 (American Rescue Plan)”.
The Budget plans (which run up to fiscal year 2031) are shown in table 2 (which covers 2020-2026 and 2031, selectively). Spending is planned to total about $6tn in 2022 and 2023, rising to $8.2tn by 2031, whilst the budget deficit is projected to be around $1.4bn per year for much of the forecast period.25-26 The President plans to part-finance his agenda by raising taxes on corporations and high earners. The debt/GDP ratio rises over the forecast period, touching 117.0% in fiscal year 2031. Table 2 US Budget: Budget totals, 2020-2026, 2031
2020 2021 2022 2023 2024 2025 2026 2031 Budget totals ($tn):
Receipts 3.4 3.6 4.2 4.6 4.8 5.0 5.3 6.6 Outlays 6.6 7.2 6.0 6.0 6.2 6.5 6.7 8.2 Deficit 3.1 3.7 1.8 1.4 1.4 1.5 1.4 1.6 Budget totals (% of GDP):
Receipts 16.3% 16.3% 17.8% 18.9% 18.9% 19.0% 19.4% 19.9% Outlays 31.2% 32.9% 25.6% 24.5% 24.2% 24.5% 24.5% 24.6% Deficit 14.9% 16.7% 7.8% 5.6% 5.3% 5.5% 5.1% 4.7% Memorandum: GDP ($tn) 21.0 22.0 23.5 24.6 25.5 26.5 27.5 33.4 Debt held by the public ($tn)
21.0 24.2 26.3 27.7 29.1 30.6 32.0 39.1
Debt held by the public (%, GDP)
100.1% 109.7% 111.8% 112.7% 113.8% 115.2% 116.1% 117.0%
Source: Office of Management and Budget, “Budget of the US government, fiscal year 2022”, 27 May 2021, table S-1 (which goes up to 2031). There are rounding errors.
Next week’s ECB meeting…
There is a policy-setting meeting of the ECB next week (announcement on 10 June). Monetary policy is expected to remain accommodative, despite a recent pick-up in the Eurozone CPI inflation rate. The ECB’s inflation target is “below, but close to” 2%.

9
Classification: Confidential
CPI inflation rose to 2.0% (YOY) in May, compared with 1.6% in April, but the increase was partly driven by a 13.1% increase in energy prices and distorted by base effects.23 The core rate (excluding energy, food, alcohol and tobacco) rose to a much more modest 0.9% in May (from April’s 0.7%) and it can be expected that the increase in inflation will be mainly regarded by the ECB as a temporary phenomenon. Within the Eurozone, Germany’s rate rose to 2.4% in May.
…and oil prices are up again
At their 1 June OPEC meeting, oil producers noted “…the ongoing strengthening of market fundamentals, with oil demand showing clear signs of improvement and OECD stocks falling as the economic recovery continued in most parts of the world as vaccination programmes accelerated”.24 Crucially, OPEC and its non-OPEC partners agreed to gradually ease production cuts and opted to stick to the plan agreed upon in April 2021, whereby 2.1 million barrels per day (mbd) of supply would be brought back to the market between May to July.25-26 Production policy beyond July was not decided on, and the group will meet again on 1 July 2021. Despite the OPEC decision to ease cuts, oil prices firmed on 1 June, touching $71pb, and closing at $70.25pb (chart 5). By 4 June, Brent Crude had firmed further to $71.8pb. Oil prices are now well above pre-pandemic levels. Chart 5 Brent oil futures, $ per barrel ($pb), monthly prices (1st of month, or nearest), 1 June 2014-1 June 2021
Sources: Brent crude historical prices, www.uk.investing.com; BBC website 1 January-1 June 2021.
0
20
40
60
80
100
120
01/0
6/20
14
01/0
9/20
14
01/1
2/20
14
01/0
3/20
15
01/0
6/20
15
01/0
9/20
15
01/1
2/20
15
01/0
3/20
16
01/0
6/20
16
01/0
9/20
16
01/1
2/20
16
01/0
3/20
17
01/0
6/20
17
01/0
9/20
17
01/1
2/20
17
01/0
3/20
18
01/0
6/20
18
01/0
9/20
18
01/1
2/20
18
01/0
3/20
19
01/0
6/20
19
01/0
9/20
19
01/1
2/20
19
01/0
3/20
20
01/0
6/20
20
01/0
9/20
20
01/1
2/20
20
01/0
3/20
21
01/0
6/20
21
Brent futures ($pb)

10
Classification: Confidential
References
1. Bank of England, “Monetary policy summary and minutes of the MPC meeting ending 5 May 2021”, 6 May 2021.
2. Ruth Lea, “Economic prospects: an upbeat assessment from the Bank”, Arbuthnot Banking Group, 10 May 2021.
3. Kallum Pickering, “Sooner the Bank calls time on QE the better”, Daily Telegraph, 1 June 2021. 4. Guardian, “Senior Bank of England policymaker warns of inflation risk”, 13 May 2021, reported that
Haldane had said the economic recovery would resemble a bouncing tennis ball and outpace US this year.
5. Daily Telegraph, “Inflation threatens to derail recovery, warns Bank of England chief economist”, 24 May 2021.
6. Ruth Lea, “The labour market: some tentative signs of recovery, Arbuthnot Banking Group, 24 May 2021.
7. Markit, UK manufacturing PMI, “UK manufacturing PMI surges to record high in May”, 1 June 2021. The manufacturing PMI is a weighted average of new orders, output, employment, suppliers’ delivery times, and stocks of purchases.
8. Markit, UK services PMI, “Fastest rate of service sector output growth for 24 years, but prices charged inflation hits record high”, 3 June 2021.
9. Markit, UK services PMI, “Fastest rate of service sector output growth for 24 years, but prices charged inflation hits record high”, 3 June 2021. The Composite Output Index is a weighted average of the UK Manufacturing Output Index (not the PMI) and the UK Services Business Activity Index (PMI).)
10. Markit, UN construction PMI, “New orders increase at the fastest rate since the survey began in April 1997”, 4 June 2021.
11. Bank of England, “Money and Credit: April 2021”, 2 June 2021. 12. Nationwide, “Annual house price growth hits double digits in May”, 1 June 2021. 13. SMMT, “Business confidence drives cautious recovery in new car registrations”, 4 June 2021. 14. HM Government, “Coronavirus Job Retention Scheme (CJRS) statistics”, 3 June 2021 15. ONS, “Business insights and impact on the UK economy”, 3 June 2021. 16. The 2.1mn number was based on multiplying the Business Insights and Conditions Survey (BICS)
weighted furlough proportions by HM Revenue and Customs’ (HMRC’s) Coronavirus Job Retention Scheme (CJRS) official statistics of eligible employments. It was only for those industries covered by the BICS sample.
17. OECD, “Economic Outlook, May 2021, preliminary version”, 31 May 2021. 18. OECD, “OECD sees brighter economic prospects but an uneven recovery”, press release, 31 May 2021. 19. Ruth Lea, “Eurozone back in recession in 2021Q1 as Covid restrictions curb activity”, Arbuthnot Banking
Group, 3 May 2021, discussed President Biden’s April’s plans. In a speech to Congress on 28 April President Biden set out his plans for $2.3tn of investment spending (the “American Jobs Plan”) and $1.8tn of spending for the “American Families Plan”. These plans were in addition to the $1.9tn “American Rescue Plan”, agreed in March. President Biden proposed (part) funding the plans by tax increases on the “wealthy” and corporations.
20. Ruth Lea, “The economic background to next week’s MPC meeting: fall in January’s GDP less-than-expected”, Arbuthnot Banking Group, 15 March 2021, discussed the March 2021 package.
21. Ruth Lea, “The Bank’s central case: vaccination programme should lead to easing of restrictions and rapid recovery”, Arbuthnot Banking Group, 8 February 2021.
22. ONS, “International comparisons of GDP during the coronavirus (COVID-19) pandemic”, 1 February 2021.
23. Office of Management and Budget, “Budget of the US government, fiscal year 2022”, 27 May 2021. 24. Ruth Lea, “Eurozone back in recession in 2021Q1 as Covid restrictions curb activity”, Arbuthnot Banking
Group, 3 May 2021, discussed President Biden’s April’s plans. In a speech to Congress on 28 April President Biden set out his plans for $2.3tn of investment spending (the “American Jobs Plan”) and $1.8tn of spending for the “American Families Plan”. These plans were in addition to the $1.9tn “American Rescue Plan”, agreed in March. President Biden proposed (part) funding the plans by tax increases on the “wealthy” and corporations.

11
Classification: Confidential
25. New York Times, “Biden to propose $6tn Budget to make US more competitive”, 27 May 2021. 26. BBC, “President Biden releases $6tn spending plan”, 28 May 2021. 27. Eurostat, “Flash estimate - May 2021 Euro area annual inflation up to 2.0%”, 1 June 2021. 28. OPEC, “17th OPEC and non-OPEC ministerial meeting concludes”, 1 June 2021. 29. CNBC, “Oil jumps to 2-year high as OPEC and allies reconfirm gradual production increase”, 1 June
2021. 30. Daily Telegraph, “Oil prices top $71 despite OPEC pledge to unwind cuts”, 2 June 2021.
12
Classification: Confidential
Annex
Table 1 OECD GDP forecasts, growth rates (%) May 2021 March 2021 2020 2021 2022 2020 2021 2022 World output -3.5 5.8 4.4 -3.4 5.6 4.0 World trade -8.5 8.2 5.8 … … … US -3.5 6.9 3.6 -3.5 6.5 4.0 Eurozone, of which:
-6.7 4.3 4.4 -6.8 3.9 3.8
Germany -5.1 3.3 4.4 -5.3 3.0 3.7 France -8.2 5.8 4.0 -8.2 5.9 3.8 Italy -8.9 4.5 4.4 -8.9 4.1 4.0 Japan -4.7 2.6 2.0 -4.8 2.7 1.8 Canada -5.4 6.1 3.8 -5.4 4.7 4.0 UK -9.8 7.2 5.5 -9.9 5.1 4.7 China 2.3 8.5 5.8 2.3 7.8 4.9 India -7.7 9.9 8.2 -7.4 12.6 5.4
Sources: (i) OECD, “Strengthening the recovery, the need for speed, Interim Economic Outlook”, 9 March 2021; (ii) OECD, “Economic Outlook, May 2021, preliminary version”, 31 May 2021.