Personal remarks from the CEO 5 - orstedcdn.azureedge.net
42
Transcript of Personal remarks from the CEO 5 - orstedcdn.azureedge.net


– interim financial report – H1 2020
Management’s review
CEO’s review 3
At a glance 6
Outlook 7
Results Q2 8
Business units’ results 12
Performance highlights 17
Quarterly overview 18
Financial statements
Consolidated interim financial statement 20
Notes 27
Management statement
Management statement 41
Forward-looking statements 42
Results H1 9
Personal remarks from the CEO 5
Contents EARNINGS CALL
In connection with the presentation of the interim financial
report an earnings call for investors and analysts will be held
on Wednesday 12 August 2020 at 14:00 CEST:
Denmark: +45 78 15 01 10
International: +44 333 300 9035
USA: +1 844 625 1570
The earnings call can be followed live at:
https://edge.media-server.com/mmc/p/fm7kbt6i
Presentation slides will be available prior to the earnings call
at:
www.orsted.com/en/investors/ir-material/financial-reports-
and-presentations#0
The interim financial report can be downloaded at:
www.orsted.com/en/investors/ir-material/financial-reports-
and-presentations#0
FURTHER INFORMATION
Media Relations Investor Relations
Martin Barlebo Allan Bødskov Andersen
+45 9955 9552 +45 9955 7996
www.orsted.com
Ørsted A/S
CVR no. 36213728
Kraftværksvej 53
7000 Fredericia
Tel. +45 9955 1111

3 Management’s review – interim financial report – H1 2020
CEO’s review — first half year 2020
increased risk of delays; especially at Hornsea 2. In general, we continue to see an increased risk of moderate delays across our portfolio, but we expect any such delays to have a limited over-all impact on project economics. Offshore
On 11 June, we reached a significant milestone with the installation of Ørsted’s offshore wind turbine number 1,500, which was the 25th of Borssele 1 & 2's 8MW wind turbines. We are set to more than double our offshore wind capacity in the coming five years using ever larger tur-bines. At our Dutch Borssele 1 & 2 site, the offshore construction work is progressing well and in August we installed the 78th wind turbine out of 94. We still expect the 752MW wind farm to be completed during Q4 2020. In 2022, we expect to complete Hornsea 2 (1,386MW) in the UK and Greater Changhua 1 & 2a (900MW) in Taiwan. In July, the Holland Coast North offshore wind project was awarded to a local Dutch consorti-um. When we join a tender we obviously want to win and as such the outcome was disappoint-ing. We will extract any learning available and leverage the insight for future tenders in Conti-nental Europe. With that said, it should also be reiterated that we cannot and should not win all the auctions and tenders we join. The im-portant thing is that we stay disciplined in our
especially the UK power market due to lower demand for electricity. This has led to higher balancing tariffs (BSUoS) from National Grid, some periods with negative prices and lower expected ROC recycle prices. Return on capital employed (ROCE) for the last 12 months amounted to 11% after H1 2020. We re-iterate our EBITDA guidance of DKK 16-17 billion but lower our expectation to gross invest-ments by DKK 2 billion to DKK 28-30 billion in 2020. COVID-19 Our Corporate Crisis Management Organisation has met regularly throughout the second quar-ter, focusing on business continuity and the partial re-opening of our locations in Continen-tal Europe and Taiwan. During Q2 2020, our asset base has continued to be fully operational and we have maintained normal availability rates on our offshore and onshore wind farms. However, as described above, we have seen negative effects on Euro-pean power markets, especially in the UK, driven by lower demand for electricity. Our construction projects have largely pro-gressed according to plans, both in Europe, Asia and the US. The most affected part of our portfolio is the construction of topsides for the offshore substations at Hornsea 2 and Greater Changhua 1 & 2a. These topsides are being constructed at two shipyards in Singapore, which were closed down for two months due to COVID-19. However, the shipyards began to slowly ramp-up in June. Although we still expect to be able to complete both projects within our current budget and time schedule, we see an
Strong first half
– Operating profit (EBITDA) increased by 11% to DKK 9.8 billion.
– EBITDA from offshore and onshore wind farms in operation increased by 17% to DKK 8.2 billion.
– Operations have remained stable through-out the COVID-19 crisis.
– 2020 EBITDA guidance re-iterated despite COVID-19.
– Green share of heat and power generation increased from 82% to 88%.
– 78 turbines installed at Borssele 1 & 2.
– Signed largest-ever renewable corporate PPA for our Greater Changhua 2b & 4 off-shore wind project in Taiwan.
– Ørsted co-founded the ‘Green fuels for Denmark’ partnership.
– WESTKÜSTE 100 received funding from the German government.
– Plum Creek Onshore Wind Farm commis-sioned ahead of schedule and on budget.
Financial results
Our operating profit (EBITDA) for the first half of the year amounted to DKK 9.8 billion, an 11% increase compared to the same period last year. Earnings from our offshore and onshore wind farms in operation increased by 17%, driven by ramp-up of power generation from Hornsea 1, Lockett and Sage Draw together with high wind speeds and as H1 2019 was impacted by a higher number of outages and curtailments across the portfolio than normal. This was partly offset by lower earnings from trading related to hedging of our power exposures and power portfolio optimisation activities, which had very high earnings in H1 2019. In addition, we saw adverse COVID-19 related impacts on
bidding to make sure we build a healthy, sus-tainable business, and over time secure enough wins to fulfil our long-term ambitions. We remain confident that Ørsted will reach its target of 15GW of installed offshore wind capacity by 2025 and more than 30GW of renewable capacity by 2030. In the US, the Bureau of Ocean Energy Manage-ment (BOEM) released a draft of their Supple-mental Environmental Impact Statement (SEIS) in June. The SEIS provides an evaluation of the foreseeable cumulative impacts of offshore wind projects from North Carolina to Maine and provides a framework for future development of the industry on the US East Coast. Based on our assessment we do not believe that BOEM identifies any significant impact that cannot be mitigated by the offshore wind developers. The framework confirms the con-sensus developer layout in the Northeast clus-ter, a uniform one nautical mile by one nautical mile turbine layout, as the most viable configu-ration. An approach which has been supported by a recent US Coast Guard study. We expect that BOEM could decide on the preferred layout as early as this month. Given commentary in the SEIS, we remain optimistic that the 1 by 1 nauti-cal mile layout will be the preferred alternative. A different alternative layout considered in the SEIS includes wide transit lanes going through the offshore development areas. As implement-
On 11 June, we reached a significant milestone with the installa-
tion of Ørsted’s offshore wind turbine number 1,500, which was
the 25th of Borssele 1 & 2's 8MW wind turbines
”

4 Management’s review – interim financial report – H1 2020
CEO’s review — first half year 2020 continued 447m (100%). Walney Extension is located in the UK with a capacity of 659MW. Together with Copenhagen Airport, A.P. Moller - Maersk, DSV Panalpina and SAS, we have founded the partnership - ‘Green fuels for Den-mark’ - to develop an industrial-scale facility to produce sustainable fuels for road, maritime and air transport in the Copenhagen area. The partnership brings together the demand and supply side of sustainable fuels with a vision to realise what could become one of the world's largest electrolyser and sustainable fuel pro-duction facilities. In August, the German Federal Ministry for Economic Affairs and Energy confirmed funding for the WESTKÜSTE 100 project in which we partner with nine other organisations to devel-op the first large-scale hydrogen project in Germany under the Reallabor funding program. WESTKÜSTE 100 is our third hydrogen project to receive public funding and a significant step forward in our exploration of industrial-scale production of green hydrogen. The project includes a 30MW electrolyser plant which can support heavy industries and heavy transport with renewable alternatives and a vision to scale-up at a later stage. Onshore In June, we commissioned the onshore wind farm Plum Creek in Nebraska ahead of schedule and on budget and we received tax equity funding from our partners. The 230MW wind farm has performed as expected since commis-sioning and will generate enough energy to power up to 100,000 US households. In July, we acquired the 227MWac solar PV project Muscle Shoals, located in Alabama.
ing such transit lanes would be detrimental to the offshore wind industry in the US, and as noted in the SEIS, it would reduce the technical capacity of North-East development areas to less than the demand from the states, we consider it unlikely that this alternative lay-out will be chosen. We also note that the 1 by 1 nautical mile turbine spacing is materially wider than any other offshore wind project worldwide to accommodate for the navigation of other ocean users. We are still awaiting the ‘Notices of Intent’ for most of our US projects, outlining the timeline for ‘Construction and Operations Plan’ (COP) approval. We expect to have more clarity during the second half of the year. At the 12MW Coastal Virginia demonstration project in the US, which we are constructing for Dominion Energy as an EPC contractor, we successfully installed both monopile founda-tions and turbines in June. The wind farm is the first ever to be federally permitted and installed in US federal waters. In July, we signed a corporate power purchase agreement (CPPA) with Taiwan-based TSMC, the world’s largest semiconductor foundry. TSMC will offtake the full generation from our 920MW Greater Changhua 2b & 4 offshore wind farm, making it the largest ever renewable energy CPPA. The 20-year fixed-price contract period will start once Greater Changhua 2b & 4 reaches commercial operations expectedly in 2025/2026, subject to grid availability and Ørsted’s final investment decision. In June, we divested the offshore transmission assets at Walney Extension to Diamond Trans-mission Partners at a total asset value of GBP
When completed, expectedly in Q3 2021, it will be the largest solar energy asset in the south-eastern US. The project is eligible for 30% ITC and has a fully contracted 20-year utility PPA. In addition, we are currently constructing the onshore wind farm Willow Creek (103MW) in South Dakota and the combined solar (420MWac) and storage (40MWac) project Permi-an Energy Center in Texas. We expect Willow Creek to be commissioned in Q4 2020 whereas Permian Energy Center is expected to be com-missioned by mid-2021. We are eligible for 100% PTC for Willow Creek and 30% ITC for Permian. Markets & Bioenergy In June, the Danish competition authorities and the Danish Energy Agency approved the divest-ment of our Danish power distribution (Radius), residential customer and city light businesses to SEAS-NVE. As part of the competition approval, SEAS-NVE has agreed to sell the residential gas customers to OK, a Danish energy group. With the approval by the authorities, the transaction is expected to close by the end of August 2020. In 2019, we signed an agreement to divest our LNG activities to Glencore. We expect to close the transaction by late Q3 2020. Following upgrades to our Renescience facility in the UK late 2019 and a shut-down throughout
spring due to COVID-19, the plant has processed waste again since June. We expect the plant to be commissioned later this year. Concluding remarks The world continues to navigate a health crisis which has a severe impact on the lives and livelihoods of people across the globe as well as on global and local economies. In this challeng-ing situation, Ørsted continues to focus on the health and well-being of its employees and their families while supporting a stable power supply in the markets where we operate. Our business model and organisation have proven very resilient and we remain confident about the company’s ability to deliver on both its short-term and long-term performance targets. We continue to see strong political and public support for an accelerated transition to green energy and Ørsted’s long-term growth pro-spects are as strong as ever.
In July, we signed a corporate power purchase agreement (CPPA)
with Taiwan-based TSMC, who will offtake the full generation
from our 920MW Greater Changhua 2b & 4 offshore wind farm,
making it the largest ever renewable energy CPPA
”
Henrik Poulsen
CEO and President

5 Management’s review – interim financial report – H1 2020
Personal remarks from the CEO On 15 June, I announced my resignation as CEO of Ørsted after eight years with the company. It has been an incredible ride, and I have a tremendous amount of affection for Ørsted, its vision, and not least its people. Together, we have transformed a Danish utility company predominantly based on fossil fuels into a global leader in green energy, now ranked as the world’s most sustainable company. We are now at a point where the transformation is completed, and we have built a strong platform for global growth. I have concluded that it is the right time for me to step down to pursue other challenges. I owe a lot of gratitude to Ørsted’s shareholders, the Board of Directors, and Group Executive Management for their confidence and support – and to all Ørsted team members for what we have achieved as a company during my tenure. I will continue as CEO of Ørsted until 31 January 2021 at the latest and will remain fully commit-ted during that time. The Board of Directors has offered to nominate me for the Ørsted Board at the annual general meeting in March next year and I have happily accepted the nomination. This will allow me to remain part of the Ørsted team and support the continued strategic development of the company. The Board of Directors is in the process of finding my successor. The process is progressing as planned and Ørsted will make an announce-ment when completed, expectedly later this year.
Henrik Poulsen
CEO and President
Together, we have transformed a Danish utility company pre-
dominantly based on fossil fuels into a global leader in green en-
ergy, now ranked as the world’s most sustainable company
”

2019 2020 2019 2020

7 Management’s review – interim financial report – H1 2020
Outlook 2020 EBITDA
Our EBITDA guidance is unchanged relative to the guidance in our interim financial report for Q1 2020. EBITDA (business performance), ex-cluding new partnership agreements, is ex-pected to amount to DKK 16-17 billion. The directional EBITDA guidance for Offshore and Onshore is unchanged relative to the guid-ance in our Q1 2020 report. However, for Off-shore, we now expect higher earnings from ex-isting partnerships compared to our previous expectations, whereas we expect lower growth from operating wind farms due to adverse COVID-19 impacts. The directional guidance for Markets & Bioener-gy has changed from ‘lower’ to ‘in line’. The in-crease in expected earnings compared to our directional guidance in the Q1 2020 report, is mainly due to inclusion of earnings from power distribution, residential customer, and city light businesses for eight months of 2020 instead of the previously expected six months and due to higher sale of ancillary services at our CHP plants.
Gross investments
Gross investments are expected to amount to DKK 28-30 billion, down by DKK 2 billion rela-tive to the guidance in our annual report for 2019. The adjustment is due to changed timing of payments.
Our EBITDA guidance for the Group is the prevailing guidance, whereas the directional earnings development per business unit serves as a means to support this. Higher/lower indicates the direction of the business unit's earnings relative to the results for 2019.
Outlook for 2020, DKK billion
Guidance 12 Aug 2020
Guidance 4 Mar 2020
Guidance 30 Jan 2020
2019 realised
EBITDA (without new partnerships) 16-17 16-17 15-16 17.5
Offshore (without new partnerships) Lower Lower Lower 15.2
Onshore Higher Higher Higher 0.8
Markets & Bioenergy In line Lower Lower 1.5
Gross investments 28-30 30-32 30-32 23.3
Guidance 29 Apr 2020
16-17
Lower
Higher
Lower
30-32

8 Management’s review – interim financial report – H1 2020
Results Q2 EBITDA
Operating profit (EBITDA) totalled DKK 3.0 bil-lion compared with DKK 3.6 billion in Q2 2019. The decrease of DKK 0.7 billion was expected and was mainly due to high construction activi-ty at Hornsea 1 in Q2 2019. EBITDA excluding construction agreements increased with DKK 0.6 billion (29%). Earnings from offshore and onshore wind farms in operation amounted to DKK 2.9 billion in Q2 2020, an increase of 7% compared to the same period last year. The increase was due to ramp-up of Hornsea 1, Lockett and Sage Draw, and a higher number of outages and curtailments across the portfolio in Q2 2019. This was partly offset by lower earnings from trading related to hedging of our power exposures and power portfolio optimisation activities, which had very high earnings in Q2 2019. In addition, we have seen adverse COVID-19 related impacts on es-pecially the UK power market due to lower demand for electricity. This has led to higher balancing tariffs (BSUoS) from National Grid, some periods with negative prices and lower expected ROC recycle prices in Q2 2020. Earnings from construction agreements for part-ners decreased by DKK 1.2 billion compared with Q2 2019 and amounted to DKK 0.4 billion in Q2 2020. The construction agreements in Q2 2020 primarily concerned the construction of Virginia Coastal Wind as well as minor updates regarding completed construction projects. Q2 2019 primarily concerned construction activity at Hornsea 1. EBITDA from CHP plants increased by DKK 0.3 billion and amounted to DKK 0.2 billion, mainly due to increased sale of ancillary services and timing of fixed costs.
Earnings from our gas activities were DKK -0.2 billion, in line with Q2 2019. A less negative effect from revaluation of our gas at storage and storage hedges (gas prices had a steeper decline during Q2 2019 than in Q2 2020) was offset by lower earnings due to shut-down of the Tyra gas field from late 2019 until 2022. Profit for the period
Profit for the period from continuing opera-tions totalled DKK -0.8 billion, DKK 1.9 billion lower than Q2 2019. The decrease was due to the lower EBITDA, higher depreciation and higher net financial expenses due to a loss on interest rate swaps in June in connection with termination of local project financing and re-lated swaps in the US (DKK -0.4 billion). Furthermore, tax on profit for the period was higher in Q2 2020 due to the initial recognition of deferred taxes of DKK 0.9 billion related to tax equity at Sage Draw and Plum Creek. Adjusted for these one-off effects, net profit amounted to DKK 0.4 billion.
Cash flows from operating activities
Cash flows from operating activities totalled DKK 8.2 billion in Q2 2020. The increase of DKK 0.7 billion compared to the same period last year was mainly due to tax equity contri-butions from our partners at the Sage Draw and Plum Creek wind farms, lower trade re-ceivables due to lower revenue as well as the divestment of the offshore transmission asset at Walney Extension in Q2 2020. This was partly offset by received milestone payments related to the construction of Hornsea 1 in Q2 2019.
Financial results, DKKm Q2 2020 Q2 2019 %
Revenue 11,625 16,443 (29%)
EBITDA 2,956 3,625 (18%)
Depreciation (1,827) (1,689) 8%
EBIT 1,129 1,936 (42%)
Gain (loss) on divestment of enterprises (3) (18) (83%)
Profit (loss) from associates and joint ventures 3 3 0%
Financial items, net (1,010) (545) 85%
Profit before tax 119 1,376 (91%)
Tax on profit (loss) for the period (928) (283) 228%
Tax rate 780% 21% n.a.
Profit (loss) for the period, continuing operations (809) 1,093 n.a.
Profit (loss) for the period, discontinued operations (16) (18) (11%)
Profit (loss) for the period (825) 1,075 n.a.
Cash flow and net debt, DKKm Q2 2020 Q2 2019 %
Cash flows from operating activities 8,197 7,510 9%
EBITDA 2,956 3,625 (18%)
Change in derivatives, other adjustments 680 (358) n.a.
Change in provisions (349) 39 n.a.
Reversal of gain (loss) on divestments of assets (71) (190) (63%)
Other items (43) 85 n.a.
Interest expense, net (634) (683) (7%)
Paid tax (86) (30) 187%
Change in work in progress (177) 4,271 n.a.
Change in tax equity partner liabilities 3,017 (138) n.a.
Change in other working capital 2,904 889 227%
Gross investments (3,757) (3,368) 12%
Divestments 45 (11) n.a.
Free cash flow 4,485 4,131 9%
Net debt, beginning of period 27,084 9,111 197%
Free cash flow from continuing operations (4,485) (4,131) 9%
Free cash flow from discontinued operations (102) 3 n.a.
Dividends and hybrid coupon paid 378 378 0%
Addition of lease obligations 138 63 119%
Interest bearing receivable re. O&G divestment 16 16 0%
Exchange rate adjustments, etc. (757) (460) 65%
Net debt, end of period 22,272 4,980 347%

9 Management’s review – interim financial report – H1 2020
Results H1 Financial results Revenue
Power generation from offshore and onshore wind increased by 42% and totalled 9.8TWh in H1 2020, mainly due to ramp-up of generation from Hornsea 1, Lockett and Sage Draw and to some extent Borssele 1 & 2, as well as higher wind speeds throughout H1 2020. Furthermore, H1 2019 saw a higher number of outages and curtailments across the offshore portfolio than normal. This was partly offset by a cable re-placement campaign at Hornsea 1 at the begin-ning of this year as well as some periods with negative prices due to lower demand for elec-tricity driven by COVID-19. Our production-based availability in Offshore amounted to 93%, up one percentage point compared to the same period last year. Thermal power generation amounted to 2.5TWh and heat generation amounted to 4.1TWh, down 6% and 15%, respectively, com-pared to the same period last year. The de-creases were driven by windy and wet weather and a warm first quarter of 2020. The underly-
ing decline in power generation was even high-er, but was partly offset by generation associat-ed with higher delivery of ancillary services. Offshore and onshore wind accounted for 80% of our total power generation, while the renew-able energy share of our total heat and power generation accounted for 88% in H1 2020 com-pared with 82% in H1 2019.
Revenue amounted to DKK 27.0 billion. The decrease of 20% relative to H1 2019 was primar-ily due to significantly lower gas and power prices, lower sale of gas, limited construction work on wind farms for partners and lower ther-mal heat and power generation, partly offset by the increase in wind based power generation. EBITDA Operating profit (EBITDA) totalled DKK 9.8 bil-lion compared with DKK 8.8 billion in H1 2019. The increase was mainly driven by a 17% in-crease in earnings from offshore and onshore wind farms in operation, which was due to ramp-up of Hornsea 1, Lockett and Sage Draw to-gether with high wind speeds, partly offset by
Business performance vs IFRS
We use business performance as an alternative
to the results prepared in accordance with IFRS.
Business performance represents the underlying
financial performance of the Group in the report-
ing period as results are adjusted for temporary
fluctuations in the market value of contracts
(including hedging transactions) relating to other
periods. The difference between the two princi-
ples will be eliminated as the contracts expire.
Apart from this, there is no difference between
business performance and the IFRS results.
EBITDA in accordance with IFRS amounted to
DKK 11.0 billion in H1 2020 against DKK 10.4
billion in the same period in 2019. In accordance
with the business performance principle, EBITDA
was DKK 9.8 billion and DKK 8.8 billion, respec-
tively. The difference between the two principles
was thus DKK 1.3 billion in H1 2020 against DKK
1.7 billion in H1 2019.
In the presentation of the results according to
IFRS, we have elected not to apply the provisions
on hedge accounting of commodities and related
currency exposures. The market value adjust-
ments of these are continuously recognised in
the income statement, which means that the
IFRS results for the individual years are not com-
parable. IFRS results do not reflect the commer-
cial risk hedging, according to which the business
units and the Group are managed and evaluated.
In the management's review, comments are
made on business performance only.
lower earnings from trading related to hedging of our power exposures and power portfolio optimisation activities, which achieved very high results in H1 2019. Earnings from construction agreements for part-ners totalled DKK 1.5 billion compared with DKK 2.5 billion in H1 2019. The construction agreements in H1 2020 primarily concerned the updated assumptions regarding the divestment of the transmission asset for Hornsea 1, the con-struction of Virginia Coastal Wind as well as minor updates regarding completed construc-tion projects. H1 2019 included earnings from construction activity at Hornsea 1 and Borkum Riffgrund 2. EBITDA from CHP plants increased by DKK 0.2 billion relative to the same period last year and totalled DKK 0.7 billion in H1 2020. The increase was primarily driven by higher sale of ancillary
Business performance vs IFRS H1 2020 H1 2019
EBITDA - Business performance 9,761 8,755
Adjustments 1,280 1,677
EBITDA - IFRS 11,041 10,432
Financial results, DKKm H1 2020 H1 2019 %
Revenue 27,001 33,682 (20%) EBITDA 9,761 8,755 11%
Depreciation (3,581) (3,307) 8%
EBIT 6,180 5,448 13%
Gain (loss) on divestment of enterprises (17) (35) (51%)
Profit (loss) from associates and joint ventures 6 4 50%
Financial items, net (1,786) (444) 302%
Profit before tax 4,383 4,973 (12%)
Tax on profit (loss) for the period (1,846) (1,241) 49%
Tax rate 42% 25% 17%p
Profit (loss) for the period, continuing operations 2,537 3,732 (32%)
Profit (loss) for the period, discontinued operations (44) (61) (28%)
Profit (loss) for the period 2,493 3,671 (32%)
EBITDA, DKK billion
DKK 9.8bn
Offshore Onshore
Markets & Bioenergy
12%
5%
83%

10 Management’s review – interim financial report – H1 2020
Results H1 continued
services. EBITDA from Gas Markets & Infrastructure in-creased by DKK 0.1 billion and amounted to DKK -0.2 billion. The increase was mainly due to a less negative effect from revaluating our gas at storage (gas prices had a steeper decline during H1 2019 than in H1 2020) and a positive impact from storage hedges. This was partly offset by lower earnings due to shut-down of the Tyra gas field from late 2019 until 2022 as well as a provision for bad debt in our B2B busi-ness to cover the extraordinary COVID-19 relat-ed default risk among our customers. EBIT EBIT increased by DKK 0.7 billion to DKK 6.2 billion in H1 2020, primarily as a result of the higher EBITDA partly offset by higher deprecia-tion driven by more wind farms in operation. Financial income and expenses Net financial income and expenses amounted to an expense of DKK 1.8 billion compared with DKK 0.4 billion in the same period last year. The increase was mainly due to higher net interest expenses, a loss on interest rate swaps in June in connection with early termination of local pro-ject financing and swaps in the US, less positive effects from exchange rate adjustments due to a weakening of GBP and capital losses on the bond portfolio due to the increasing interest rates. Tax and tax rate
Tax on profit for the period amounted to DKK 1.8 billion, DKK 0.6 billion higher than the same period last year. The increase was mainly due to initial recognition of deferred taxes of DKK 0.9 billion related to tax equity at Sage Draw in
April and Plum Creek in June. The effective tax rate was 42%. Profit for the period Profit for the period from continuing operations totalled DKK 2.5 billion, DKK 1.2 billion lower than H1 2019. The decrease was primarily due to the higher net financial expenses, higher taxes and higher depreciation, only partly offset by the higher EBITDA.
Cash flows and net debt Cash flows from operating activities
Cash flows from operating activities totalled DKK 7.8 billion in H1 2020 compared with DKK 7.4 billion in H1 2019. The increase of DKK 0.4 billion was mainly due to lower paid taxes in Denmark, tax equity contributions from our partners at the Sage Draw and Plum Creek wind farms, lower trade receivables due to lower revenue as well as the divestment of the off-shore transmission asset at Walney Extension. This was partly offset by H1 2019 being positive-ly affected by received milestone payments related to the construction of Hornsea 1. In H1 2020, we had a net cash outflow from work in progress of DKK 2.0 billion. This was mainly due to supplier payments related to the construction of Hornsea 1 for partners, the con-struction of Virginia Coastal Wind and construc-tion of the offshore transmission asset at Hornsea 2, only partly offset by the divestment of the offshore transmission asset at Walney Extension. Investments and divestments
Gross investments amounted to DKK 9.1 billion against DKK 7.3 billion in H1 2019. The main in-
Cash flow and net debt, DKKm H1 2020 H1 2019 %
Cash flows from operating activities 7,769 7,392 5%
EBITDA 9,761 8,755 11%
Change in derivatives, other adjustments (514) (224) 129%
Change in provisions (365) 33 n.a.
Reversal of gain (loss) on divestments of assets (1,288) (308) 318%
Other items (7) 83 n.a.
Interest expense, net (1,163) (774) 50%
Paid tax (1,353) (4,857) (72%)
Change in work in progress (2,015) 5,272 n.a.
Change in tax equity partner liabilities 2,892 (219) n.a.
Change in other working capital 1,821 (369) n.a.
Gross investments (9,065) (7,267) 25%
Divestments 52 2,667 (98%)
Free cash flow (1,244) 2,792 n.a.
Net debt, beginning of period 17,230 (2,219) n.a.
Free cash flow from continuing operations 1,244 (2,792) n.a.
Free cash flow from discontinued operations 44 1 n.a.
Dividends and hybrid coupon paid 4,921 4,615 7%
Addition of lease obligations 147 5,285 (97%)
Interest bearing receivable re. O&G divestment 8 8 0%
Exchange rate adjustments, etc. (1,322) 82 n.a.
Net debt, end of period 22,272 4,980 347%
vestments in H1 2020 were: – offshore wind farms (DKK 7.1 billion), includ-
ing Borssele 1 & 2 in the Netherlands, Hornsea 2 in the UK, Greater Changhua 1 & 2a in Taiwan and Ocean Wind in the US.
– onshore wind and solar farms (DKK 1.5 bil-
lion), including Sage Draw, Plum Creek and Permian Energy Center, all three in the US.
– Markets & Bioenergy (DKK 0.4 billion),
mainly related to maintenance of the pow-er distribution grid.
Cash flow from divestments in H1 2020 relat-ed to the divestment of our 10MWac Oak Solar farm in New Jersey and Inbicon production facilities partly offset by compensations paid under our partnership agreements. Cash flow from divestments in H1 2019 related to the receipt of deferred proceeds from the farm-down of 50% of Hornsea 1 in 2018 (DKK 1.7 billion) and to the strengthening of our strate-gic partnership with Eversource as they be-came a 50% partner in our activities in the New England area in February 2019 (DKK 1.0 billion).

11 Management’s review – interim financial report – H1 2020
Results H1 continued
and is expected to be around the target level of 30% at the end of the year.
Non-financial results
Green share of heat and power generation
The green share of heat and power generation amounted to 88% in H1 2020, up six percentage points relative to the same period last year. The increase came from higher generation from offshore and onshore wind farms due to addi-tional capacity and higher wind speeds. Further-more, the green share increased from lower fossil fuel-based heat and power generation due to the more wet and windy weather in H1 2020, which led to reduced heat and power demand from the CHP plants. This was partly offset by power generation associated with the delivery of ancillary services.
Greenhouse gas emissions
Greenhouse gas intensity from our heat and power generation and other operating activities (scope 1 and 2), decreased to 64g CO2e/kWh in H1 2020 against 80g CO2e/kWh in H1 2019. The emissions per kWh decreased for the same rea-sons as mentioned above. Greenhouse gas emissions from our supply chain and sales activities (scope 3) decreased by 16% to 13.1 million tonnes in H1 2020 driven by a 19% decrease in gas sales.
Safety
In H1 2020, we have had 39 total recordable injuries (TRIs), of which 29 injuries were related to contractors’ employees. This was a decrease of three injuries compared to H1 2019 or a 7% reduction. The number of hours worked was 10.5
Interest-bearing net debt
Interest-bearing net debt totalled DKK 22.3 billion at the end of June 2020 against DKK 17.2 billion at the end of 2019. The DKK 5.0 billion increase was mainly due to negative free cash flow of DKK 1.2 billion and dividend and hybrid coupon payments of DKK 4.9 billion.
Equity Equity was DKK 85.9 billion at the end of June 2020 against DKK 89.6 billion at the end of 2019.
Capital employed Capital employed was DKK 108.2 billion at 30 June 2020 against DKK 106.8 billion at the end of 2019. The increase was mainly due to invest-ments. Capital employed in Markets & Bioener-gy amounted to DKK 13.7 billion of which DKK 8.2 billion relates to assets and liabilities to be divested.
Financial ratios Return on capital employed (ROCE)
Return on capital employed (ROCE, last 12 months) was 11% at the end of H1 2020. The decrease compared to the same period last year was attributable to the lower EBIT over the 12-month period, which in H1 2019 was signif-icantly impacted by the farm-down of Hornsea 1 in Q4 2018.
Credit metric (FFO/adjusted net debt)
The funds from operations (FFO)/adjusted net debt credit metric was 23% at the end of June 2020 against 58% in the same period last year. The low ratio by H1 2020 is adversely impacted by current tax related to both 2019 and 2020,
Key ratios, DKKm, % H1 2020 H1 2019 %
ROCE1 10.8 29.3 -19%p
Adjusted net debt 36,106 17,755 103%
FFO/adjusted net debt1 23.1 57.5 -34%p 1) See page 79 in the annual report for 2019 for definitions.
Capital employed, %
Offshore Onshore
Markets & Bioenergy
DKK 108.2bn
13%
8%
million hours, in line with H1 2019. Consequent-ly, the total recordable injury rate (TRIR) over the last 6 months decreased from 4.0 in H1 2019 to 3.7 in H1 2020.
79%

12 Management’s review – interim financial report – H1 2020
Offshore Highlights Q2 2020
– 78 turbines installed at Borssele 1 & 2.
– We signed the largest-ever renewable cor-porate PPA for our Greater Changhua 2b & 4 offshore wind project in Taiwan.
– We divested the offshore transmission asset at Walney Extension.
– We co-founded the ‘Green fuels for Den-mark’ partnership.
– WESTKÜSTE 100 received funding from the German government.
Financial results Q2 2020
Power generation increased by 20% relative to Q2 2019, primarily due to ramp-up of generation from Hornsea 1 and to some extent Borssele 1 & 2. Furthermore, Q2 2019 saw a higher number of outages and curtailments across the portfolio. In Q2 2020 we have seen adverse COVID-19 impacts on especially the UK power market due to lower demand for electricity. This led to high-er balancing tariffs (BSUoS) from National Grid, some periods with negative prices and lower expected ROC recycle prices in Q2 2020. Most wind farms in the UK under the CfD regime do not receive subsidies in periods where the day-ahead prices are negative for more than six consecutive hours. Consequently, we shut down part of our UK capacity in such periods. In Ger-many, we also experienced more hours with negative prices than in the same period last year. Wind speeds were in line with Q2 2019 and amounted to a portfolio average of 8.0m/s. This was below a normal wind year (8.2m/s). Howev-er, availability reached 95%, which was signifi-cantly higher than Q2 2019 due to the various outages and curtailments last year.
Revenue decreased by 16% to DKK 9.4 billion. Revenue from offshore wind farms in operation increased 18% to DKK 3.6 billion primarily due to the ramp-up of Hornsea 1 partly offset by more periods with negative prices. Revenue from power sales decreased by DKK 0.5 billion due to lower power prices. Revenue from construction agreements de-creased by DKK 1.7 billion due to high activity in Q2 2019 related to the construction of the Hornsea 1 offshore wind farm for partners. In Q2 2020, revenue from construction agreements was primarily related to the divestment of the offshore transmission assets at Walney Exten-sion, the construction of Virginia Coastal Wind and the completion of Hornsea 1. EBITDA decreased DKK 1.2 billion relative to Q2 2019 and amounted to DKK 2.4 billion. EBITDA from Sites, O&M and PPAs amounted to DKK 2.6 billion in Q2 2020. The 1% increase was due to Hornsea 1 ramp-up partly offset by the above-mentioned adverse COVID-19 impacts (approx. DKK 150 million) and by lower earnings from trading related to hedging of our power exposures and power portfolio optimisation activities, which achieved very high results in Q2 2019 (DKK 0.3 billion). EBITDA from partnerships decreased by DKK 1.2 billion and amounted to DKK 0.4 billion. In Q2 2020, earnings from construction agreements were primarily related to the construction of Virginia Coastal Wind, the completion of Hornsea 1 and minor updates regarding finalised construction projects. In Q2 2019, earnings from construction agreements primarily concerned Hornsea 1.
Financial results Q2 2020 Q2 2019 % H1 2020 H12019 %
Business drivers
Decided (FID'ed) and installed capacity, offshore wind GW 9.9 9.9 0% 9.9 9.9 0%
Installed capacity, offshore wind GW 6.8 5.6 22% 6.8 5.6 22%
Generation capacity, offshore wind GW 3.8 3.3 13% 3.8 3.3 13%
Wind speed m/s 8.0 8.0 0% 10.1 9.2 9%
Load factor % 32 31 1%p 46 41 5%p
Availability % 95 87 8%p 93 92 1%p
Power generation TWh 2.6 2.2 20% 7.2 5.3 36%
Denmark 0.4 0.5 (12%) 1.1 1.1 6%
United Kingdom 1.7 1.2 35% 4.7 3.1 53%
Germany 0.4 0.4 (4%) 1.2 1.0 14%
Other 0.1 0.1 0% 0.1 0.1 0% Power sales (net of internally sourced generation) TWh 5.5 5.7 (3%) 14.3 12.9 11%
Power price, LEBA UK GBP/MWh 25.4 41.4 (39%) 29.5 47.0 (37%)
British pound DKK/GBP 8.4 8.5 (1%) 8.5 8.5 0%
Financial performance Revenue DKKm 9,364 11,107 (16%) 17,339 19,474 (11%)
Sites, O&M and PPAs 3,625 3,078 18% 9,350 7,518 24%
Power sales 3,208 3,660 (12%) 4,872 5,689 (14%)
Construction agreements 2,486 4,200 (41%) 3,049 6,190 (51%)
Other 46 169 (73%) 68 77 (12%)
EBITDA DKKm 2,361 3,572 (34%) 7,993 7,890 1%
Sites, O&M and PPAs 2,578 2,552 1% 7,514 6,512 15%
Construction agreements and divestment gains 396 1,638 (76%) 1,495 2,526 (41%)
Other incl. project development (613) (618) (1%) (1,016) (1,148) (11%)
Depreciation DKKm (1,452) (1,355) 7% (2,860) (2,653) 8%
EBIT DKKm 909 2,217 (59%) 5,133 5,237 (2%)
Cash flow from operating activities DKKm 4,338 8,036 (46%) 2,785 6,073 (54%)
Gross investments DKKm (2,802) (1,563) 79% (7,094) (4,442) 60%
Divestments DKKm (150) (45) 233% (141) 2,648 n.a.
Free cash flow DKKm 1,386 6,428 (78%) (4,450) 4,279 n.a.
Capital employed DKKm 84,311 67,345 25% 84,311 67,345 25%
O&M: Operation and maintenance agreements PPAs: Power purchase agreements

13 Management’s review – interim financial report – H1 2020
Offshore continued
EBITDA from other activities, including project development amounted to DKK -0.6 billion and was in line with Q2 2019. Depreciation increased by 7% and amounted to DKK 1.5 billion. The increase was mainly due to the commissioning of Hornsea 1. Cash flow from operating activities amounted to DKK 4.3 billion, which was DKK 3.7 billion lower than in Q2 2019. This was primarily due to the lower EBITDA and higher net cash inflow from work in progress in Q2 2019 due to re-ceived milestone payments related to the con-struction of Hornsea 1. In Q2 2020, we had a net cash outflow from work in progress of DKK 0.2 billion, mainly from the construction of Virginia Coastal Wind and construction of the offshore transmission asset at Hornsea 2, partly offset by the divestment of the offshore transmission asset at Walney Ex-tension. Gross investments amounted to DKK 2.8 billion and mainly related to Borssele 1 & 2, Hornsea 2, Greater Changhua 1 & 2a and Ocean Wind.
Financial results H1 2020
Power generation increased by 36% relative to H1 2019, primarily due to ramp-up of generation from Hornsea 1 and to some extent Borssele 1 & 2 as well as higher wind speeds throughout H1 2020. Furthermore, H1 2019 saw a higher num-ber of outages and curtailments across the portfolio than normal. This was partly offset by a cable replacement campaign at Hornsea 1 at the beginning of this year as well as some peri-ods with negative prices due to lower demand for electricity driven by COVID-19.
Wind speeds amounted to 10.1m/s for the port-folio, which was above a normal wind year with very strong wind in January and February. Availability reached 93%, which was above H1 2019 due to the various campaigns and curtail-ments and outages across the portfolio last year. Revenue decreased by 11% to DKK 17.3 billion. Revenue from offshore wind farms in opera-tion increased 24% to DKK 9.4 billion due to the above-mentioned ramp-up from Hornsea 1 and higher wind speeds partly offset by more periods with negative prices. Despite of higher volumes sold, revenue from power sales de-creased by DKK 0.8 billion due to lower power prices. Revenue from construction agreements de-creased by DKK 3.2 billion primarily due to high activity in H1 2019 related to the con-struction of the Hornsea 1 offshore wind farm for partners. In H1 2020, revenue from con-struction agreements primarily related to the divestment of the offshore transmission assets at Walney Extension, construction of Virginia Coastal Wind and the finalisation of Hornsea 1. EBITDA increased by 1% relative to H1 2019 and amounted to DKK 8.0 billion. EBITDA from Sites, O&M and PPAs amounted to DKK 7.5 billion in H1 2020. The 15% increase was due to Hornsea 1 ramp-up and higher wind speeds partly offset by the above-mentioned adverse COVID-19 impacts and by lower earn-ings from trading related to hedging of our power exposures and power portfolio optimi-sation activities, which achieved very high
results in H1 2019. EBITDA from partnerships decreased by DKK 1.0 billion and amounted to DKK 1.5 billion. In H1 2020, our earnings from construction agreements mainly related to the lowered assumptions regarding the preferred bidder’s expected return requirement on the Hornsea 1 transmission asset, the construction of Virginia Coastal Wind and minor updates regarding completed construction projects which posi-tively impacted EBITDA. In H1 2019, earnings from construction agreements primarily con-cerned Hornsea 1 and Borkum Riffgrund 2. EBITDA from other activities, including project development amounted to DKK -1.0 billion. The decreased spend relative to H1 2019 was mainly due to higher expensed project devel-opment activities in the US and Taiwan in H1 2019. Depreciation increased by 8% and amounted to DKK 2.9 billion. The increase was mainly due to commissioning of Hornsea 1. Cash flow from operating activities amounted to DKK 2.8 billion, which was DKK 3.3 billion
Wind speed, (m/s) for our offshore wind farms
The wind speed indicates how many metres per second the wind has blown in the areas where we have offshore wind farms. The weighting is based on our generation capacity.
* Indicates m/s for full year 2020 (if Q3 and Q4 follows the normal wind year)
below H1 2019. This was mainly due to funds tied up in work in progress in H1 2020 versus a release in H1 2019, partly offset by less paid tax in H1 2020. In H1 2020, we had a net cash outflow from work in progress of DKK 2.0 bil-lion. This was mainly due to supplier payments related to the construction of Hornsea 1 for partners, the construction of Virginia Coastal Wind and construction of the offshore trans-mission asset at Hornsea 2, partly offset by the divestment of the offshore transmission asset at Walney Extension. Gross investments amounted to DKK 7.1 billion and mainly related to Borssele 1 & 2, Hornsea 2, Greater Changhua 1 & 2a and Ocean Wind. Cash flow from divestments in H1 2020 relat-ed to compensations paid under the partner-ship agreements for Walney Extension. In H1 2019, cash flow from divestments related to the receipt of deferred proceeds from the farm-down of 50% of Hornsea 1 in 2018 (DKK 1.7 billion) and to the strengthening of our strate-gic partnership with Eversource as they be-came a 50% partner in our activities in the New England area in February (DKK 1.0 billion).

14 Management’s review – interim financial report – H1 2020
Onshore
Highlights Q2 2020
– Plum Creek Onshore Wind Farm (230MW)
commissioned ahead of schedule and on
budget.
– We acquired the 227MWac solar PV project
Muscle Shoals, located in Alabama.
– We divested our 10MW Oak Solar farm in
New Jersey.
Financial results Q2 2020
Power generation increased by 83% relative to Q2 2019. The increase was due to new wind farms in operation (Sage Draw, Lockett and Plum Creek). Wind speeds amounted to a port-folio average of 8.0m/s, which was higher than same period last year, but slightly lower than a normal wind year (8.1m/s). Revenue from wind farms in operation increased by 19% due to the higher generation partly off-set by lower prices for the part of the portfolio not covered by PPAs. EBITDA almost doubled and amounted to DKK 0.3 billion. The increase was primarily due to the above-mentioned factors. Cash flow from operating activities amounted to DKK 3.2 billion which primarily comprised tax equity contributions from our partners at the Sage Draw and Plum Creek wind farms, in April and June, respectively. Gross investments amounted to DKK 0.7 billion in Q2 2020 and related to the construction of Permian Energy Center, Sage Draw and Plum Creek. Cash flow from divestments in Q2 2020 related
the divestment of our 10MW Oak Solar farm in New Jersey. Financial results H1 2020 Power generation increased by 61% relative to H1 2019. The increase was due to new wind farms in operation (Sage Draw, Lockett and Plum Creek). Wind speeds amounted to a port-folio average of 7.8m/s, slightly below a normal wind year (7.9m/s), however, above the average wind speed in H1 2019. Revenue from wind farms in operation increased by 20% due to the higher generation partly offset by lower prices. EBITDA increased by 59% and amounted to DKK 0.5 billion. The increase was primarily due to the above-mentioned factors. Cash flow from operating activities amounted to DKK 3.2 billion which primarily comprised tax equity contribution from our partners for the Sage Draw and Plum Creek wind farms. Gross investments amounted to DKK 1.5 billion in H1 2020 and related to the construction of Permian Energy Center, Sage Draw and Plum Creek.
Financial results Q2 2020 Q2 2019 % H1 2020 H1 2019 %
Business drivers
Decided (FID'ed) and installed capacity MW 2,088 1,438 45% 2,088 1,438 45%
Installed capacity MW 1,565 813 92% 1,565 813 92%
Wind speed m/s 8.0 7.7 4% 7.8 7.7 1%
Load factor % 49 47 2%p 47 47 0%p
Availability % 96 97 (1%p) 96 97 (1%p) Power generation TWh 1.6 0.8 95% 2.7 1.7 61%
Net realised price USD/MWh 11.3 16.3 (31%) 12.1 16.9 (28%)
US dollar DKK/USD 6.8 6.6 2% 6.8 6.6 3%
Financial performance
Revenue DKKm 160 134 19% 297 248 20%
EBITDA DKKm 312 162 93% 499 313 59%
Sites 103 75 37% 176 159 11%
Production tax credits and tax attributes 268 140 91% 477 282 69%
Other incl. project development (59) (53) 11% (154) (128) 20%
Depreciation DKKm (109) (78) 40% (207) (158) 31%
EBIT DKKm 203 84 142% 292 155 88%
Cash flow from operating activities DKKm 3,209 78 n.a. 3,162 (16) n.a.
Gross investments DKKm (733) (1,258) (42%) (1,481) (1,798) (18%)
Divestments DKKm 114 - n.a. 114 - n.a.
Free cash flow DKKm 2,590 (1,180) n.a. 1,795 (1,814) n.a.
Capital employed DKKm 8,608 8,033 7% 8,608 8,033 7%
The wind speed indicates how many metres per second the wind has blown in the areas where we have onshore wind farms. The weighting is based on our generation capacity.
* Indicates m/s for full year 2020 (if Q3 and Q4 follows the nor-mal wind year)
Wind speed, (m/s) for our onshore wind farms

15 Management’s review – interim financial report – H1 2020
Markets & Bioenergy
Highlights Q2 2020
– Divestment of our Danish power distribution
(Radius), residential customer and city light
business to SEAS-NVE approved by the Dan-
ish competition authorities.
– We divested the Inbicon production facilities.
– Our Renescience facility in the UK has pro-
cessed waste again since June.
Financial results Q2 2020
Revenue decreased by 47% compared to Q2 2019 and amounted to DKK 3.9 billion. The de-crease was mainly driven by a significant de-crease in average gas and power prices relative to the same period last year as well as lower gas and power volumes sold. Power generation was 0.2TWh higher than in Q2 2019, driven by generation associated with delivery of ancillary services (see box on follow-ing page). Heat generation decreased by 0.1TWh despite of colder weather. EBITDA amounted to DKK 0.2 billion compared to DKK -0.1 billion in Q2 2019. EBITDA from CHP plants increased by DKK 0.3 billion and amounted to DKK 0.2 billion. The increase was mainly due to higher sale of ancil-lary services, lower fixed costs due to timing and a positive one-off gain from divestment of the closed Inbicon production facilities in April. EBITDA from Gas Markets & Infrastructure was in line with the same period last year and amounted to DKK -0.2 billion. A less net nega-tive effect from revaluating our gas at storage (gas prices had a steeper decline during Q2 2019 than in Q2 2020) was partly offset by lower earnings due to the shut-down of the Tyra gas
field from late 2019, and lasting until 2022. EBITDA from LNG amounted to DKK 0 billion. Following the agreement to divest our LNG activities we have made provisions to offset the negative earnings. EBITDA from Distribution, B2C and city light was in line with the same period last year and amounted to DKK 0.3 billion. Cash flow from operating activities amounted to DKK 0.8 billion in Q2 2020. The increase of DKK 1.4 billion was mainly due to lower trade receivables due to the lower revenue, partly offset by lower trade payables.
Financial results H1 2020
Revenue decreased by 32% compared to H1 2019 and amounted to DKK 11.4 billion. The de-crease was mainly driven by a significant de-crease in average gas and power prices relative to the same period last year as well as lower gas and power volumes sold. Power generation was 6% lower than in H1 2019, driven by more windy and wet weather and a warm first quarter 2020. Heat generation decreased by 15% in H1 2020 mainly due to warmer weather in Q1 2020. In contrast, de-mand for ancillary services increased. EBITDA amounted to DKK 1.1 billion compared to DKK 0.6 billion in H1 2019. EBITDA from CHP plants increased by DKK 0.2 billion relative to the same period last year and totalled DKK 0.7 billion in H1 2020. Higher sale of ancillary services was partly offset by the decrease in power and heat generation and the negative spread development.
Financial results Q2 2020 Q2 2019 % H1 2020 H1 2019 %
Business drivers Degree days Number 436 269 62% 1,501 1,409 7%
Heat generation TWh 1.0 1.1 (13%) 4.1 4.8 (15%)
Power generation TWh 0.9 0.7 37% 2.5 2.6 (6%)
Gas sales TWh 20.1 31.8 (37%) 46.7 57.5 (19%)
Power sales TWh 3.0 3.3 (8%) 6.6 7.3 (9%)
Gas price, TTF EUR/MWh 5.3 13.0 (59%) 7.5 15.7 (52%)
Power price, DK EUR/MWh 20.5 36.8 (44%) 20.8 39.9 (48%)
Financial performance
Revenue DKKm 3,895 7,411 (47%) 11,404 16,821 (32%)
EBITDA DKKm 185 (115) n.a. 1,118 569 96%
CHP plants 152 (126) n.a. 672 428 57%
Gas Markets & Infrastructure (190) (163) 17% (179) (280) (36%)
Distribution, B2C and city light 305 261 17% 781 671 16%
Other, incl. project development (82) (46) 78% (156) (139) 12%
Depreciation DKKm (208) (203) 2% (400) (388) 3%
EBIT DKKm (23) (318) (93%) 718 181 297%
Cash flow from operating activities DKKm 817 (641) n.a. 2,374 1,346 76%
Gross investments DKKm (179) (495) (64%) (423) (962) (56%)
Divestments DKKm 81 35 131% 80 20 300%
Free cash flow DKKm 719 (1,101) n.a. 2,031 404 403%
Capital employed DKKm 13,670 14,238 (4%) 13,670 14,238 (4%)
Power price, LEBA UK GBP/MWh 25.4 41.4 (39%) 29.5 47.0 (37%)
Green dark spread, DK EUR/MWh (12.2) (3.4) 261% (13.7) (2.0) 569%
Green spark spread, DK EUR/MWh 1.2 0.1 851% (3.2) (1.6) 98%
LNG - (41) n.a. - (111) n.a.
Reporting
We run our business on an end-to-end value chain thinking. All activities and earnings that relate to Offshore and Onshore are reported in these segments, even if the daily activities are per-formed on behalf of the group in Markets & Bioenergy. Therefore, earnings from trading related to hedging of our power exposures and power portfolio optimisation activities in relation to Off-shore and Onshore are presented in these business units.
In H1 2020, EBITDA of DKK 151 million and DKK -6 million were transferred to Offshore and On-shore, respectively (DKK 590 million and DKK -6 million respectively in H1 2019). In Q2 2020, EBITDA of DKK -46m and DKK 4 million were transferred to Offshore and Onshore, respectively (DKK 271 million and DKK -6 million respectively in Q2 2019).

16 Management’s review – interim financial report – H1 2020
Markets & Bioenergy continued EBITDA from Gas Markets & Infrastructure in-creased by DKK 0.1 billion and amounted to DKK -0.2 billion. The increase was mainly due to a positive impact from storage hedges and a less negative effect from revaluating our gas at storage (gas prices had a steeper decline during H1 2019 than in H1 2020). This was partly offset by lower earnings due to the shut-down from late 2019 of the Tyra gas field as well as a provi-sion for bad debt of DKK 0.1 billion in our B2B business to cover the extraordinary COVID-19 related default risk among our customers. EBITDA from LNG amounted to DKK 0 billion. Following the agreement to divest our LNG activities we have made provisions to offset the negative earnings. EBITDA from Distribution, B2C and city light increased by DKK 0.1 billion to DKK 0.8 billion. The increase was mainly due to lower costs. Cash flow from operating activities amounted to DKK 2.4 billion in H1 2020. The increase of DKK 1.0 billion was mainly due to lower paid taxes (receipt of on account taxes in H1 2020 versus payment of taxes on account in H1 2019) and lower trade receivables due to lower reve-nue. This was partly offset by changes in the value of derivatives and more gas at storage. Gross investments amounted to DKK 0.4 billion in H1 2020 and were mainly related to mainte-nance of the power distribution grid and con-cluding work related to the bioconversion of Asnæs Power Station.
Ancillary services
Ancillary services are different types of services where power market participants provide flexi-ble capacity (generation or consumption) to balance the power system and to support security of supply.
From early 2020, one of these services (automatic Frequency Restoration Reserves, aFRR) has been offered through tenders in western Denmark after having been supplied via a contract with the TSO in Norway for the last five years. The services are offered for one month at a time and require the market participants to be able to increase or decrease its generation/consumption with the awarded amount (up to 100MW) for up to 15 minutes.
As a large thermal generator in Denmark, Ørsted is obliged to offer its available power genera-tion capacity to the market at marginal costs, including for delivery of ancillary services. This implies, that we are not allowed to prioritise delivery of ancillary services from green energy sources to support our green strategy and targets.
In H1 2020, we were awarded a substantial share of the aFRR being tendered by Energinet, and we have consequently supplied up to 100MW additional power generation from Esbjerg and Studstrup power stations, which we would otherwise not have supplied. This led to an increase in the carbon emissions from these power stations.

17 Management’s review – interim financial report – H1 2020
Income statement (Business performance), DKKm H1 2020 H1 2019 Q2 2020 Revenue 27,001 33,682 11,625 EBITDA 9,761 8,755 2,956
Offshore 7,993 7,890 2,361 - Sites, O&M and PPAs 7,514 6,512 2,578 - Construction agreements and other 479 1,378 (217) Onshore 499 313 312 Markets & Bioenergy 1,118 569 185 Other activities 151 (17) 98
Depreciation and amortisation (3,581) (3,307) (1,827) Impairment losses - - - Operating profit (loss) (EBIT) 6,180 5,448 1,129 Gain (loss) on divestment of enterprises (17) (35) (3) Net financial income and expenses (1,786) (444) (1,010) Profit (loss) before tax 4,383 4,973 119 Tax (1,846) (1,241) (928) Profit (loss) for the period from continuing operations 2,537 3,732 (809) Profit (loss) for the period 2,493 3,671 (825) Balance sheet Assets 193,124 185,949 193,124 Equity 85,930 86,446 85,930
Shareholders in Ørsted A/S 69,789 69,960 69,789 Non-controlling interests 2,909 3,247 2,909 Hybrid capital 13,232 13,239 13,232
Interest-bearing net debt 22,272 4,980 22,272 Capital employed 108,203 91,426 108,203 Additions to property, plant, and equipment 14,844 7,431 10,011
Cash flow
Cash flow from operating activities 7,769 7,392 8,197 Gross investments (9,065) (7,267) (3,757) Divestments 52 2,667 45 Free cash flow (1,244) 2,792 4,485
Financial ratios
Return on capital employed (ROCE)1,4, % 10.8 29.3 10.8 FFO/adjusted net debt2,4, % 23.1 57.5 23.1 Number of outstanding shares, end of period, '000 419,985 419,985 419,985 Share price, end of period, DKK 765 533 765 Market capitalisation, end of period, DKK billion 321 224 321 Earnings per share (EPS) (BP), DKK 5.2 7.9 (2.7) Dividend yield, % Income statement (IFRS) Revenue 28,194 36,040 9,962 EBITDA 11,041 10,432 1,592 Profit (loss) for the period from continuing operations 3,537 5,040 (1,870)
Q2 2019 16,443
3,625 3,572 2,552 1,020
162 (115)
6 (1,689)
- 1,936
(18) (545) 1,376 (283) 1,093 1,075
185,949 86,446 69,960
3,247 13,239 4,980
91,426 3,755
7,510 (3,368)
(11) 4,131
29.3 57.5
419,985 504 212 1.9
17,277 4,425
1,718
2019 67,842 17,484
15,161 13,750
1,411 786
1,495 42
(6,864) (568)
10,052 (63)
(1,135) 8,856
(2,756) 6,100 6,044
192,860 89,562 73,082
3,248 13,232 17,230
106,792 22,440
13,079 (23,305)
3,329 (6,897)
10.6 31.0
419,985 689 290 12.7
1.5
70,398 19,020
7,291
Business drivers H1 2020 H1 2019 Q2 2020 Offshore
Decided (FID'ed) and installed capacity3, offshore wind, GW 9.9 9.9 9.9 Installed capacity, offshore wind, GW 6.8 5.6 6.8
Generation capacity, offshore wind, GW 3.8 3.3 3.8
Wind speed3, m/s 10.1 9.2 8.0 Load factor3, % 46 41 32
Availability3, % 93 92 95
Power generation, TWh 7.2 5.3 2.6
Power sales, TWh 14.3 12.9 5.5
Onshore
Decided (FID'ed) and installed capacity3, GW 2.1 1.4 2.1
Installed capacity3, GW 1.6 0.8 1.6
Wind speed3, m/s 7.8 7.7 8.0
Load factor3, % 47 47 49
Availability3, % 96 97 96
Power generation3, TWh 2.7 1.7 1.6
Markets & Bioenergy
Degree days3, number 1,501 1,409 436
Heat generation, TWh 4.1 4.8 1.0
Power generation, TWh 2.5 2.6 0.9
Power sales, TWh 6.6 7.3 3.0
Gas sales, TWh 46.7 57.5 20.1
People and environment
Employees (FTE), end of period number 6,731 6,312 6,731
Total recordable injury rate (TRIR)4 4.7 4.1 12.9 Fatalities, number 0 1 0
Green share of heat and power generation, % 88 82 86
Greenhouse gas intensity, g CO2e/kWh 64 80 84
Q2 2019
9.9 5.6
3.3
8.0 31
87
2.2
5.7
1.4
0.8
7.7
47
97
0.8
269
1.1
0.7
3.3
31.8
6,312
4.1 1
85
71
2019
9.9 6.8
3.6
9.2 42
93
12.0
27.6
2.1
1.0
7.3
45
98
3.5
2,399
8.3
4.6
14.7
125.0
6,526
4.9 1
86
65
Performance highlights
1) EBIT (last 12 months)/average capital employed. 2) Net debt including 50% of hybrid capital, cash and secu-rities not available for use (with the exception of repo transactions), and decommissioning obligations less de-ferred tax. 3) See definition on page 164 and ’ESG statements’ in the annual report for 2019. 4) Last 12 months.
Business performance vs. IFRS
Business performance represents the underlying financial performance of the Group in the reporting period as re-sults are adjusted for temporary fluctuations in the mar-ket value of contracts (including hedging transactions) relating to other periods. Apart from this, there is no differ-ence between business performance and IFRS results. Read more in note 2.

18 Management’s review – interim financial report – H1 2020
Income statement (Business performance), DKKm
Q2 2020
Q1 2020
Q4 2019
Q3 2019
Q2 2019
Q1 2019
Q4 2018
Q3 2018
Revenue 11,625 15,376 18,679 15,481 16,443 17,239 23,527 15,018 EBITDA 2,956 6,805 4,613 4,116 3,625 5,130 19,206 2,225
Offshore 2,361 5,632 4,048 3,223 3,572 4,318 18,847 1,987 - Sites, O&M and PPAs 2,578 4,936 4,626 2,612 2,552 3,960 4,109 2,004 - Construction agreements and other (217) 696 (578) 611 1,020 358 14,738 (17) Onshore 312 187 165 308 162 151 44 - Markets & Bioenergy 185 933 490 436 (115) 684 303 259 Other activities 98 53 (90) 149 6 (23) 12 (21)
Depreciation and amortisation (1,827) (1,754) (1,876) (1,681) (1,689) (1,618) (1,697) (1,437) Impairment losses - - (568) - - - 603 - Operating profit (loss) (EBIT) 1,129 5,051 2,169 2,435 1,936 3,512 18,112 788 Gain (loss) on divestment of enterprises (3) (14) (13) (15) (18) (17) (28) 181 Net financial income and expenses (1,010) (776) (644) (47) (545) 101 (43) (436) Profit (loss) before tax 119 4,264 1,515 2,368 1,376 3,597 18,038 535 Tax (928) (918) (590) (925) (283) (958) (2,878) (117) Profit (loss) for the period from continuing operations (809) 3,346 925 1,443 1,093 2,639 15,160 418 Profit (loss) for the period (825) 3,318 896 1,477 1,075 2,596 15,194 405
Balance sheet Assets 193,124 193,636 192,860 194,521 185,949 182,783 174,575 150,909 Equity 85,930 89,015 89,562 87,369 86,446 85,843 85,115 68,701
Shareholders in Ørsted A/S 69,789 72,728 73,082 70,977 69,960 69,193 68,488 52,029 Non-controlling interests 2,909 3,055 3,248 3,153 3,247 3,411 3,388 3,433 Hybrid capital 13,232 13,232 13,232 13,239 13,239 13,239 13,239 13,239
Interest-bearing net debt 22,272 27,084 17,230 12,082 4,980 9,111 (2,219) 8,957 Capital employed 108,203 116,098 106,792 99,451 91,426 94,954 82,896 77,658 Additions to property, plant, equipment 10,011 4,833 6,560 8,449 3,755 3,676 4,575 2,942
Cash flow Cash flow from operating activities 8,197 (428) 4,816 871 7,510 (118) 7,565 (117) Gross investments (3,757) (5,308) (8,816) (7,222) (3,368) (3,899) (14,916) (4,385) Divestments 45 7 402 260 (11) 2,678 18,749 380 Free cash flow 4,485 (5,729) (3,598) (6,091) 4,131 (1,339) 11,398 (4,122)
Financial ratios Return on capital employed (ROCE)1,4, % 10.8 11.0 10.6 29.3 29.3 28.2 32.1 23.0 FFO/adjusted net debt2,4, % 23.1 21.3 31.0 47.4 57.5 46.2 69.0 41.7 Number of outstanding shares, end of period, '000 419,985 419,985 419,985 419,985 419,985 420,045 420,045 420,155 Share price, end of period, DKK 765 666 689 637 533 504 436 436 Market capitalisation, end of period, DKK billion 321 280 290 267 224 212 183 183 Earnings per share (EPS) (BP), DKK (2.7) 8.0 1.1 3.5 1.9 6.2 35.6 1.1
Income statement (IFRS)
Revenue 9,962 18,232 19,815 14,543 17,277 18,763 26,165 12,798 EBITDA 1,592 9,449 5,260 3,328 4,425 6,007 20,914 567 Profit (loss) for the period from continuing operations (1,870) 5,407 1,429 822 1,718 3,322 16,472 (875)
Business drivers
Q2 2020
Q1 2020
Q4 2019
Q3 2019
Q2 2019
Q1 2019
Q4 2018
Q3 2018
Offshore Decided (FID'ed) and installed capacity3, offshore wind, GW 9.9 9.9 9.9 9.9 9.9 9.0 9.0 8.9 Installed capacity, offshore wind, GW 6.8 6.8 6.8 5.6 5.6 5.6 5.6 5.1 Generation capacity, offshore wind, GW 3.8 3.6 3.6 3.6 3.3 3.0 3.0 2.9 Wind speed, m/s 8.0 12.1 10.0 8.5 8.0 10.4 10.3 7.7 Load factor3, % 32 60 50 37 31 51 53 32 Availability3, % 95 93 93 93 87 96 93 92 Power generation, TWh 2.6 4.6 3.9 2.8 2.2 3.1 3.3 1.9 Power sales, TWh 5.5 8.8 7.7 7.0 5.7 7.2 7.7 5.0 Onshore Decided (FID'ed) and installed capacity3, GW 2.1 2.1 2.1 1.7 1.4 1.0 1.0 - Installed capacity3, GW 1.6 1.3 1.0 1.0 0.8 0.8 0.8 - Wind speed3, m/s 8.0 7.5 7.3 6.6 7.7 7.8 7.3 - Load factor3, % 49 44 46 39 47 47 41.0 - Availability3, % 96 95 98 98 97 97 98.0 - Power generation, TWh 1.6 1.1 1.0 0.9 0.8 0.8 0.6 -
Markets & Bioenergy Degree days3, number 436 1,065 882 108 269 1,140 884 76 Heat generation, TWh 1.0 3.1 3.0 0.5 1.1 3.7 2.8 0.3 Power generation, TWh 0.9 1.6 1.6 0.4 0.7 1.9 1.8 0.7 Power sales, TWh 3.0 3.6 4.1 3.3 3.3 4.0 4.2 3.5 Gas sales, TWh 20.1 26.7 36.6 30.8 31.8 25.8 25.5 31.3
People and environment Employees (FTE) end of period, number 6,731 6,608 6,526 6,454 6,312 6,176 6,080 5,882 Total recordable injury rate (TRIR)4 4.7 4.7 4.9 4.5 4.1 4.3 4.7 5.0 Fatalities, number 0 0 0 0 1 0 0 0 Green share of heat and power generation, % 86 90 90 87 85 80 83 71 Greenhouse gas intensity, g CO2e/kWh 84 53 44 62 71 85 87 212
Quarterly overview
Business performance vs. IFRS
Business performance represents the underlying finan-cial performance of the Group in the reporting period as results are adjusted for temporary fluctuations in the market value of contracts (including hedging transac-tions) relating to other periods. Apart from this, there is no difference between business performance and IFRS results. Read more in note 2.
1) EBIT (last 12 months)/average capital employed. 2) Net debt including 50% of hybrid capital, cash and securities not available for use (with the exception of repo transactions), present value of lease obligations (in 2018), and decommissioning obligations less deferred tax. 3) See definition on page 164 and ’ESG statement’ in the annual report for 2019. 4) Last 12 months.

19— Interim financial report — H1 2020 Consolidated financial statements
ContentsNotes1. Basis of reporting 272. Business performance 283. Segment information 294. Revenue 325. Other operating income and expenses 346. Gross and net investments 347. Assets classified as held for sale 358. Discontinued operations 359. Financial income and expenses 36
11. Reserves 3812. Market risks 3813. Fair value measurement 3914. Interest-bearing debt and FFO 40
10. Tax on profit (loss) for the year 37
Consolidated financial statementsIncome statement H1 20Statement of comprehensive income H1 21
Balance sheet 24Statement of changes in equity 25Statement of cash flows 26
Income statement Q2 22Statement of comprehensive income Q2 23
Statement by the Executive Board and theBoard of Directors 41Forward-looking statements 42
Management statement

20— Interim financial report — H1 2020 Consolidated financial statements
Income statement1 January - 30 June
Profit (loss) per share Diluted profit (loss) per share corresponds to profit (loss) per share, as the dilutive effect of the share incentive programme is less than 0.1% of the share capital.
Accounting policies
Business performanceThe business performance principle is ouralternative performance measure. Under business performance, the market value adjustment of our energy hedges, where we do not apply IFRS hedge accounting, are deferred and recognised in the profit (loss) in the period in which the hedgedexposure materialises. Energy hedges comprise hedging of energy and associated currency risks as well as fixed-price physical gas and powercontracts. According to IFRS, the market value of energy hedges, where we do not apply IFRS hedge accounting, are recognised on an ongoing basis in the profit (loss) for the period. The differencebetween IFRS and business performance is specified in the ’Adjustments’ column. Read more about the business performance principle in note 2 ’Businessperformance’ as well as note 1.5 ’Businessperformance’ in the annual report 2019.
H1 2020 H1 2019
Note Income statement, DKKmBusiness
performance Adjustments IFRSBusiness
performance Adjustments IFRS4 Revenue 27,001 1,193 28,194 33,682 2,358 36,040
Cost of sales (14,623) 87 (14,536) (21,066) (681) (21,747)
Other external expenses (2,467) - (2,467) (2,954) - (2,954)
Employee costs (2,115) - (2,115) (1,873) - (1,873)
Share of profit (loss) in associates and joint ventures 11 - 11 (13) - (13)
5 Other operating income 2,101 - 2,101 1,138 - 1,138
5 Other operating expenses (147) - (147) (159) - (159)Operating profit (loss) before depreciation,amortisation and impairment losses (EBITDA) 9,761 1,280 11,041 8,755 1,677 10,432
Amortisation, depreciation and impairment losses onintangible assets and property, plant and equipment (3,581) - (3,581) (3,307) - (3,307)Operating profit (loss) (EBIT) 6,180 1,280 7,460 5,448 1,677 7,125Gain (loss) on divestment of enterprises (17) - (17) (35) - (35)
Share of profit (loss) in associates and joint ventures 6 - 6 4 - 4
9 Financial income 1,357 - 1,357 2,598 - 2,598
9 Financial expenses (3,143) - (3,143) (3,042) - (3,042)
Profit (loss) before tax 4,383 1,280 5,663 4,973 1,677 6,65010 Tax on profit (loss) for the period (1,846) (280) (2,126) (1,241) (369) (1,610)
Profit (loss) for the period from continuing operations 2,537 1,000 3,537 3,732 1,308 5,0408 Profit (loss) for the period from discontinued operations (44) - (44) (61) - (61)
Profit (loss) for the period 2,493 1,000 3,493 3,671 1,308 4,979Profit (loss) for the period is attributable to:
Shareholders in Ørsted A/S 2,178 1,000 3,178 3,374 1,308 4,682
Interests and costs, hybrid capital owners of Ørsted A/S 326 326 256 256
Non-controlling interests (11) (11) 41 41
Profit (loss) per share, DKK:From continuing operations 5.3 7.7 8.2 11.3
From discontinued operations (0.1) (0.1) (0.1) (0.1)
Total profit (loss) per share 5.2 7.6 8.1 11.2

21— Interim financial report — H1 2020 Consolidated financial statements
Statement of comprehensive incomeAll items in ’Othercomprehensive income’ may be recycled to theincome statement.
Statement of comprehensive income1 January - 30 June
H1 2020 H1 2019
Statement of comprehensive income, DKKmBusiness
performance Adjustments IFRSBusiness
performance Adjustments IFRSProfit (loss) for the period 2,493 1,000 3,493 3,671 1,308 4,979
Other comprehensive income:
Cash flow hedging:
Value adjustments for the period 844 (1,925) (1,081) 2,491 (1,249) 1,242
Value adjustments transferred to income statement (131) 645 514 552 (428) 124
Exchange rate adjustments:Exchange rate adjustments relating to net investment inforeign enterprises (4,260) - (4,260) (585)
- (585)
Value adjustment of net investment hedges 2,111 - 2,111 293 - 293
Tax:
Tax on hedging instruments (183) 280 97 (566) 369 (197)
Tax on exchange rate adjustments 476 - 476 85 - 85
Other:Share of other comprehensive income of associated companies,after tax (7) - (7)
(8) - (8)
Other comprehensive income (1,150) (1,000) (2,150) 2,262 (1,308) 954
Total comprehensive income 1,343 - 1,343 5,933 - 5,933
Comprehensive income for the period is attributable to:
Shareholders in Ørsted A/S 1,173 5,620
Interest payments and costs, hybrid capital owners of Ørsted A/S 326 256
Non-controlling interests (156) 57
Total comprehensive income 1,343 5,933

22— Interim financial report — H1 2020 Consolidated financial statements
Income statement1 April - 30 June
Profit (loss) per share Diluted profit (loss) per share corresponds to profit (loss) per share, as the dilutive effect of the share incentive programme is less than 0.1% of the share capital.
Accounting policies
Business performanceThe business performance principle is ouralternative performance measure. Under business performance, the market value adjustment of our energy hedges, where we do not apply IFRS hedge accounting, are deferred and recognised in the profit (loss) in the period in which the hedgedexposure materialises. Energy hedges comprise hedging of energy and associated currency risks as well as fixed-price physical gas and powercontracts. According to IFRS, the market value of energy hedges, where we do not apply IFRS hedge accounting, are recognised on an ongoing basis in the profit (loss) for the period. The differencebetween IFRS and business performance is specified in the ’Adjustments’ column. Read more about the business performance principle in note 2 ’Businessperformance’ as well as note 1.5 ’Businessperformance’ in the annual report 2019.
Q2 2020 Q2 2019
Note Income statement, DKKmBusiness
performance Adjustments IFRSBusiness
performance Adjustments IFRS4 Revenue 11,625 (1,663) 9,962 16,443 834 17,277
Cost of sales (6,816) 299 (6,517) (10,703) (34) (10,737)
Other external expenses (1,208) - (1,208) (1,554) - (1,554)
Employee costs (1,092) - (1,092) (951) - (951)
Share of profit (loss) in associates and joint ventures 7 - 7 (11) - (11)
5 Other operating income 514 - 514 465 - 465
5 Other operating expenses (74) - (74) (64) - (64)Operating profit (loss) before depreciation,amortisation and impairment losses (EBITDA) 2,956 (1,364) 1,592 3,625 800 4,425Amortisation, depreciation and impairment losses onintangible assets and property, plant and equipment (1,827) - (1,827) (1,689) - (1,689)Operating profit (loss) (EBIT) 1,129 (1,364) (235) 1,936 800 2,736
Gain (loss) on divestment of enterprises (3) - (3) (18) - (18)
Share of profit (loss) in associates and joint ventures 3 - 3 3 - 3
9 Financial income 552 - 552 938 - 938
9 Financial expenses (1,562) - (1,562) (1,483) - (1,483)
Profit (loss) before tax 119 (1,364) (1,245) 1,376 800 2,176
10 Tax on profit (loss) for the period (928) 303 (625) (283) (175) (458)
Profit (loss) for the period from continuing operations (809) (1,061) (1,870) 1,093 625 1,718
8 Profit (loss) for the period from discontinued operations (16) - (16) (18) - (18)
Profit (loss) for the period (825) (1,061) (1,886) 1,075 625 1,700
Profit (loss) for the period is attributable to:
Shareholders in Ørsted A/S (1,140) (1,061) (2,201) 764 625 1,389
Interests and costs, hybrid capital owners of Ørsted A/S 326 326 291 291
Non-controlling interests (11.0) (11.0) 20 20
Profit (loss) per share, DKK:From continuing operations (2.7) (5.2) 1.9 3.4
From discontinued operations 0.0 0.0 0.0 0.0
Total profit (loss) per share (2.7) (5.2) 1.9 3.4

23— Interim financial report — H1 2020 Consolidated financial statements
Statement of comprehensive incomeAll items in ’Othercomprehensive income’ may be recycled to theincome statement.
Statement of comprehensive income1 April - 30 June
Q2 2020 Q2 2019
Statement of comprehensive income, DKKmBusiness
performance Adjustments IFRSBusiness
performance Adjustments IFRSProfit (loss) for the period (825) (1,061) (1,886) 1,075 625 1,700
Other comprehensive income:
Cash-flow hedging:
Value adjustments for the period (1,740) 1,269 (471) 1,120 (676) 444
Value adjustments transferred to income statement 353 95 448 164 (124) 40
Exchange rate adjustments:Exchange rate adjustments relating to net investment inforeign enterprises (1,991) - (1,991) (2,558) - (2,558)Value adjustment of net investment hedges 963 - 963 1,367 - 1,367
Tax:
Tax on hedging instruments 388 (303) 85 (265) 175 (90)
Tax on exchange rate adjustments 203 - 203 112 - 112
Other:Share of other comprehensive income of associated companies,after tax 3 - 3 (7) - (7)Other comprehensive income (1,821) 1,061 (760) (67) (625) (692)
Total comprehensive income (2,646) - (2,646) 1,008 - 1,008
Comprehensive income for the period is attributable to:
Shareholders in Ørsted A/S (2,877) 824
Interest payments and costs after tax, hybrid capital owners ofØrsted A/S 326 291Non-controlling interests (95) (107)Total comprehensive income (2,646) 1,008

24— Interim financial report — H1 2020 Consolidated financial statements
Balance sheet
Assets and liabilities classified as held for saleAssets classified as held for sale at 30 June 2020
comprised our Danish power distribution,residential customer, and city light businesses, our
oil pipe system in Denmark as well as our LNG business.
Note Assets, DKKm30 June
202031 December
201930 June
2019Intangible assets 504 672 564
Land and buildings 5,073 5,177 4,897
Production assets 80,463 76,682 70,096
Fixtures and fittings, tools and equipment 588 652 711
Property, plant and equipment under construction 27,868 23,502 16,096
Property, plant and equipment 113,992 106,013 91,800
Investments in associates and joint ventures 542 497 527
Other securities and equity investments 227 217 213
Deferred tax 8,441 6,847 5,753
Other receivables 3,019 1,713 2,144
Other non-current assets 12,229 9,274 8,637
Non-current assets 126,725 115,959 101,001
Inventories 11,417 14,031 13,087
13 Derivatives 7,841 7,740 6,303
Contract assets 1,216 739 -
Trade receivables 4,723 8,140 7,303
Other receivables 4,294 5,253 3,609
Income tax 1,176 346 6,308
13 Securities 12,327 16,552 25,485
Cash 6,754 7,148 6,968
Current assets 49,748 59,949 69,063
8 Assets classified as held for sale 16,651 16,952 15,885
Assets 193,124 192,860 185,949
Note Equity and liabilities, DKKm30 June
202031 December
201930 June
2019Share capital 4,204 4,204 4,204
11 Reserves (1,585) 413 (881)
Retained earnings 67,170 64,051 66,637
Proposed dividends - 4,414 -
Equity attributable to shareholders in Ørsted A/S 69,789 73,082 69,960
Hybrid capital 13,232 13,232 13,239
Non-controlling interests 2,909 3,248 3,247
Equity 85,930 89,562 86,446
Deferred tax 3,903 3,371 4,695
Provisions 12,203 12,063 12,860
Lease liabilities 4,444 4,728 4,479
14 Bond and bank debt 32,975 36,039 32,400
Contract liabilities 3,703 3,762 3,720
Tax equity liabilities 7,595 4,563 3,654
Other payables 463 469 242
Non-current liabilities 65,286 64,995 62,050
Provisions 455 538 597
Lease liabilities 653 604 595
14 Bond and bank debt 2,052 801 235
13 Derivatives 5,387 6,958 5,647
Contract liabilities 435 784 3,009
Trade payables 12,933 10,832 12,291
Tax equity liabilities 630 632 446
Other payables 4,846 4,247 3,915
Income tax 6,048 4,075 5,931
Current liabilities 33,439 29,471 32,666
Liabilities 98,725 94,466 94,716
8Liabilities relating to assets classifiedas held for sale 8,469 8,832 4,787Equity and liabilities 193,124 192,860 185,949

25— Interim financial report — H1 2020 Consolidated financial statements
Statement of changes in equity1 January - 30 June
* See note 11 ‘Reserves’ for more information about reserves.
2020 2019
DKKmShare
capital Reserves*Retainedearnings
Proposeddividends
Share- holders in
Ørsted A/SHybridcapital
Non-con- trolling
interestsTotal
GroupShare
capital Reserves*Retainedearnings
Proposeddividends
Share- holders in
Ørsted A/SHybridcapital
Non-con- trolling
interestsTotal
GroupEquity at 1 January 4,204 413 64,051 4,414 73,082 13,232 3,248 89,562 4,204 (1,827) 62,012 4,099 68,488 13,239 3,388 85,115Comprehensive incomefor the period:Profit (loss) for the period - - 3,178 - 3,178 326 (11) 3,493 - - 4,682 - 4,682 256 41 4,979
Other comprehensiveincome:Cash-flow hedging - (567) - - (567) - - (567) - 1,366 - - 1,366 - - 1,366
Exchange rate adjustments - (2,004) - - (2,004) - (145) (2,149) - (308) - - (308) - 16 (292)
Tax on other comprehensiveincome - 573 - - 573 - - 573 - (112) - - (112) - - (112)Share of other comprehensiveincome of associatedcompanies, after tax - - (7) - (7) - - (7) - - (8) - (8) - - (8)Total comprehensiveincome - (1,998) 3,171 - 1,173 326 (156) 1,343 - 946 4,674 - 5,620 256 57 5,933Transactions with owners:Coupon payments, hybridcapital - - - - - (326) - (326) - - - - - (327) - (327)Tax, hybrid capital - - - - - - - - - - - - - 71 - 71
Dividends paid - - 4 (4,414) (4,410) - (185) (4,595) - - 3 (4,099) (4,096) - (198) (4,294)
Purchases of treasury shares - - (58) - (58) - - (58) - - (99) - (99) - - (99)
Other changes - - 2 - 2 - 2 4 - - 47 - 47 - - 47Total transactions withowners - - (52) (4,414) (4,466) (326) (183) (4,975) - - (49) (4,099) (4,148) (256) (198) (4,602)Equity at 30 June 4,204 (1,585) 67,170 - 69,789 13,232 2,909 85,930 4,204 (881) 66,637 - 69,960 13,239 3,247 86,446

26— Interim financial report — H1 2020 Consolidated financial statements
Statement of cash flows
Change in work in progress‘Change in work in progress’ consists of elements in contract assets, contract liabilities, and construction management agreements related to construction of offshore wind farms and construction of offshore transmission assets as well as the related trade payables.
Statement of cash flowsOur supplementary statement of gross and net investments
appears from note 6 ’Gross and net investments’ and free cash flows (FCF) from note 3 ’Segment information’.
’Cash’ according to the balance sheet includes ’Cash, notavailable for use’, amounting to DKK 876 million as at
30 June 2020.
Note Statement of cash flows, DKKm H1 2020 H1 2019 Q2 2020 Q2 2019
Operating profit (loss) beforedepreciation, amortisation andimpairment losses (EBITDA), IFRS 11,041 10,432 1,592 4,425
2Change in derivatives, businessperformance adjustments (1,280) (1,677) 1,364 (800)Change in derivatives, otheradjustments (514) (224) 680 (358)Change in provisions (365) 33 (349) 39Reversal of gain (loss) ondivestment of assets (1,288) (308) (71) (190)Other items (7) 83 (43) 85Change in work in progress (2,015) 5,272 (177) 4,271
Change in tax equity partnerliabilities 2,892 (219) 3,017 (138)Change in other working capital 1,821 (369) 2,904 889Interest received and similar items 2,326 2,141 694 1,402Interest paid and similar items (3,489) (2,915) (1,328) (2,085)Income tax paid (1,353) (4,857) (86) (30)Cash flows from operating activities 7,769 7,392 8,197 7,510Purchase of intangible assets andproperty, plant and equipment (9,008) (6,882) (3,770) (3,100)Sale of intangible assets andproperty, plant and equipment 80 2,683 57 8Acquisition of enterprises 1 (271) (3) (149)Divestment of enterprises (22) (40) (5) (19)Purchase of other equityinvestments (11) (2) (2) (8)Purchase of securities (4,133) (12,782) (593) (10,175)Sale/maturation of securities 8,250 12,918 1,373 6,289Change in other non-current assets - (2) - (1)Transactions with associates andjoint ventures (47) (110) 18 (110)Dividends received and capitalreduction - 6 - 6
Cash flows from investing activities (4,890) (4,482) (2,925) (7,259)
Note Statement of cash flows, DKKm H1 2020 H1 2019 Q2 2020 Q2 2019Proceeds from raising of loans 328 7,839 (3,311) 3,550Instalments on loans (977) (2,202) (407) (2,202)Instalments on leases (226) (197) (112) (102)Coupon payments on hybrid capital (326) (327) (326) (327)Dividends paid to shareholders inØrsted A/S (4,410) (4,096) - - Purchase of own shares (58) (99) (58) (99)
Transactions with non-controllinginterests (228) (204) (89) (61)Net proceeds from tax equitypartners 3 (9) 23 (8)Collateral related to derivaties 2,376 41 586 2,266Cash flows from financing activities (3,518) 746 (3,694) 3,017Cash flows from continuingoperations (639) 3,656 1,578 3,268Cash flows from discontinuedoperations (44) - 102 (2)Total net change in cash andcash equivalents for the period (683) 3,656 1,680 3,266Cash and cash equivalents at thebeginning of the period 6,459 2,663 4,223 3,120Total net change in cash and cashequivalents (683) 3,656 1,680 3,266Other change in cash and cashequivalents 80 (7) 1 (7)Exchange rate adjustments of cashand cash equivalents 23 (1) (25) (68)Cash and cash equivalentsat 30 June 5,879 6,311 5,879 6,311

27— Interim financial report — H1 2020 Consolidated financial statements
pared in accordance with the International Financial Reporting Standards (IFRS) and IAS 34 as adopted by the EU and furtherrequirements in the Danish Financial State-ments Act for the presentation of quarterly interim reports by listed companies.
The interim financial report for the first half-year of 2020 follows the same accounting policies as the annual report for 2019, except for any new, amended, or revised accounting standards and interpretations (IFRSs) endorsed by the EU, effective for theaccounting period beginning on 1 January 2020.
This section provides an overall description of our accounting policies as well as an over-view of our implementation of new andamended accounting standards andinterpretations.
Accounting policies
Ørsted is a listed public company, headquar-tered in Denmark. This interim financial report for the first half-year of 2020 comprises the interim financial statements of Ørsted A/S (the parent compa-ny) and subsidiaries controlled by Ørsted A/S.
The interim financial report has been pre-
In the sections below, the most relevant new or amended standards and interpretations are presented.
Definitions of alternative performance measures can be found on page 79 of the annual report for 2019.
This interim financial report contains selected accounting policies and should therefore be read in conjunction with the annual report for 2019.
Implementation of new or changedaccounting standards and interpretations
Effective from 1 January 2020, we have
implemented the following new or changed accounting standards (IAS and IFRS) andinterpretations: Amendments to IFRS 3: Business Combina-
tions. Amendments to IFRS 9 and IFRS 7: Interest
Rate Benchmark Reform.
The adoption of the new and changedaccounting standards has not impacted our interim financial report and is not expected to impact the consolidated financial statements for 2020.
1. Basis of reporting

28— Interim financial report — H1 2020 Consolidated financial statements
Financial impact of hedging
Our hedging of market risks is based on a number of different accounting principles, depending on the type of exposure being hedged.
In the business performance result, the value of hedging contracts concerning energy and related currencies is deferred for recognition in the period in which the hedged exposure
The figure shows the timeof the transfer of the market value of hedging contractsin business performanceEBITDA for both businessperformance and IFRShedges.
Expected value for recognition in business performance EBITDA, DKKbn
2. Business performance
materialises.
Exposures from the proceeds from partial sales of new offshore wind farms and power purchase agreements in Onshore, among other things, are hedged as cash flowhedging in accordance with the IFRSprinciples and are transferred to both IFRS and business performance EBITDA in the period in which the hedged exposuresmaterialise.
The table shows thedifference between the income statement according to business performance and according to IFRS, which is shown in the adjustments column in the incomestatement.
The difference between business performance and IFRS EBITDA in 2020 is mainly due to gains on currency hedges partly countered by the reversal of gains on gas hedges recognised in IFRS in prior years.
Specification of the difference between EBITDA accordingto business performance and according to IFRS, DKKm H1 2020 H1 2019 Q2 2020 Q2 2019EBITDA - business performance 9,761 8,755 2,956 3,625Business performance adjustments in respect of revenue forthe period 1,193 2,358 (1,663) 834Business performance adjustments in respect of cost of salesfor the period 87 (681) 299 (34)
EBITDA - IFRS 11,041 10,432 1,592 4,425
Total business performance adjustments for the period comprise:Market value adjustments for the period of financial and physicalhedging contracts relating to a future period 1,925 1,249 (1,269) 676Reversal of deferred gains (losses) relating to hedging contractsfrom previous periods where the hedged production or trade isrecognised in business performance EBITDA in this period (645) 428 (95) 124
Total adjustments 1,280 1,677 (1,364) 800

29— Interim financial report — H1 2020 Consolidated financial statements
Profit (loss) and cash flows are shown only for continuing operations.
The column ’Otheractivities/eliminations’ primarily covers theelimination of inter-segment transactions. It also includes income and costs, assets and liabilities, investment activity, taxes, etc., handled at Group level.
1 Including theelimination of other activities, the totalelimination ofintra-group revenue amounts toDKK 3,440 million, which primarily relates to our Shared Functions services as well as our B2B, B2C, and power distribution businesses.
3. Segment information
H1 2020Income statement, DKKm Offshore Onshore
Markets &Bioenergy
Reportable segments
Otheractivities/
eliminationsBusiness
performance Adjustments IFRSExternal revenue 15,066 302 11,627 26,995 6 27,001 1,193 28,194
Intra-group revenue 2,273 (5) (223) 2,045 (2,045)1 - - -
Revenue 17,339 297 11,404 29,040 (2,039) 27,001 1,193 28,194
Cost of sales (7,853) 5 (8,706) (16,554) 1,931 (14,623) 87 (14,536)
Employee costs and other external expenses (2,892) (315) (1,635) (4,842) 260 (4,582) - (4,582)
Gain (loss) on disposal of non-current assets 1,217 34 37 1,288 - 1,288 - 1,288
Additional other operating income and expenses 171 478 18 667 (1) 666 - 666
Share of profit (loss) in associates and joint ventures 11 - - 11 - 11 - 11
EBITDA 7,993 499 1,118 9,610 151 9,761 1,280 11,041
Depreciation and amortisation (2,860) (207) (400) (3,467) (114) (3,581) - (3,581)
Impairment losses - - - - - - - -
Operating profit (loss) (EBIT) 5,133 292 718 6,143 37 6,180 1,280 7,460
Key ratios
Intangible assets, property, plant and equipment 85,620 18,819 8,306 112,745 1,751 114,496 - 114,496
Equity investments and non-current receivables 1,849 - 239 2,088 153 2,241 - 2,241
Net working capital, work in progress 10,029 - 1 10,030 - 10,030 - 10,030
Net working capital, tax equity - (7,588) - (7,588) - (7,588) - (7,588)
Net working capital, capital expenditures (9,006) (89) (26) (9,121) - (9,121) - (9,121)
Net working capital, other items 3,777 80 (2,964) 893 199 1,092 - 1,092
Derivatives, net 552 (241) 2,007 2,318 136 2,454 - 2,454
Assets classified as held for sale, net - - 8,182 8,182 - 8,182 - 8,182
Decommissioning obligations (4,797) (383) (1,310) (6,490) - (6,490) - (6,490)
Other provisions (3,797) - (1,639) (5,436) (732) (6,168) - (6,168)
Tax, net 717 (1,990) 856 (417) 83 (334) - (334)
Other receivables and other payables, net (633) - 18 (615) 24 (591) - (591)
Capital employed at 30 June 84,311 8,608 13,670 106,589 1,614 108,203 - 108,203
Of which, capital employed for discontinued operations (34) - (34)
Of which, capital employed for continuing operations 108,237 - 108,237
Return on capital employed (ROCE) % - - - - - 10.8 - -
Cash flow from operating activities 2,785 3,162 2,374 8,321 (552) 7,769 - 7,769
Gross investments (7,094) (1,481) (423) (8,998) (67) (9,065) - (9,065)
Divestments (141) 114 80 53 (1) 52 - 52
Free cash flow (FCF) (4,450) 1,795 2,031 (624) (620) (1,244) - (1,244)

30— Interim financial report — H1 2020 Consolidated financial statements
Profit (loss) and cash flows are shown only for continuing operations.
The column ‘Other activities/eliminations’ primarily covers the elimination of inter-segment transactions.It also includes income and costs, assets and liabilities, investment activity, taxes, etc., handled at Group level.
1 Including theelimination of other activities, the totalelimination ofintra-group revenue amounts toDKK 4,063 million, which primarily relates to our Shared Functions services as well as our B2B, B2C, and power distribution businesses.
3. Segment information (continued)
H1 2019Income statement, DKKm Offshore Onshore
Markets &Bioenergy
Reportable segments
Otheractivities/
eliminationsBusiness
performance Adjustments IFRSExternal revenue 16,446 248 17,055 33,749 (67) 33,682 2,358 36,040
Intra-group revenue 3,028 - (234) 2,794 (2,794)1 - - -
Revenue 19,474 248 16,821 36,543 (2,861) 33,682 2,358 36,040
Cost of sales (9,122) (2) (14,665) (23,789) 2,723 (21,066) (681) (21,747)
Employee costs and other external expenses (3,048) (215) (1,695) (4,958) 131 (4,827) - (4,827)
Gain (loss) on disposal of non-current assets 312 - (4) 308 - 308 - 308
Additional other operating income and expenses 285 282 114 681 (10) 671 - 671
Share of profit (loss) in associates and joint ventures (11) - (2) (13) - (13) - (13)
EBITDA 7,890 313 569 8,772 (17) 8,755 1,677 10,432
Depreciation and amortisation (2,653) (158) (388) (3,199) (108) (3,307) - (3,307)
Impairment losses - - - - - - - -
Operating profit (loss) (EBIT) 5,237 155 181 5,573 (125) 5,448 1,677 7,125
Key ratios
Intangible assets, property, plant and equipment 68,468 12,757 9,128 90,353 2,011 92,364 - 92,364
Equity investments and non-current receivables 373 - 291 664 746 1,410 - 1,410
Net working capital, work in progress 4,551 - - 4,551 - 4,551 - 4,551
Net working capital, tax equity - (3,528) - (3,528) - (3,528) - (3,528)
Net working capital, capital expenditures (3,852) (23) (82) (3,957) - (3,957) - (3,957)
Net working capital, other items 4,421 (34) (3,368) 1,019 307 1,326 - 1,326
Derivatives, net (1,043) 525 1,041 523 133 656 - 656
Assets classified as held for sale, net - - 11,098 11,098 - 11,098 - 11,098
Decommissioning obligations (4,239) (275) (1,267) (5,781) - (5,781) - (5,781)
Other provisions (3,221) - (3,596) (6,817) (860) (7,677) - (7,677)
Tax, net 1,882 (1,242) 907 1,547 (113) 1,434 - 1,434
Other receivables and other payables, net 5 (147) 86 (56) (414) (470) - (470)
Capital employed at 30 June 67,345 8,033 14,238 89,616 1,810 91,426 - 91,426
Of which, capital employed for discontinued operations (186) - (186)
Of which, capital employed for continuing operations 91,612 - 91,612
Return on capital employed (ROCE) % - - - - - 29.3 - -
Cash flow from operating activities 6,073 (16) 1,346 7,403 (11) 7,392 - 7,392
Gross investments (4,442) (1,798) (962) (7,202) (65) (7,267) - (7,267)
Divestments 2,648 - 20 2,668 (1) 2,667 - 2,667
Free cash flow (FCF) 4,279 (1,814) 404 2,869 (77) 2,792 - 2,792

31— Interim financial report — H1 2020 Consolidated financial statements
Profit (loss) and cash flows are shown only for continuing operations.
The column ‘Other activities/eliminations’ primarily covers the elimination of inter-segment transactions.It also includes income and costs, assets and liabilities, investment activity, taxes, etc., handled at Group level.
1 Including theelimination of other activities, the totalelimination ofintra-group revenue amounts toDKK 1,560 million (Q2 2019: DKK 1,844 million), which primarily relates to our Shared Functions services as well as our B2B, B2C, and power distribution businesses.
3. Segment information (continued)
Q2 2019, Income statement and FCF, DKKmExternal revenue 9,798 134 7,525 17,457 (1,014) 16,443 834 17,277
Intra-group revenue 1,309 - (114) 1,195 (1,195)1 - - -
Revenue 11,107 134 7,411 18,652 (2,209) 16,443 834 17,277
Cost of sales (6,152) (2) (6,681) (12,835) 2,132 (10,703) (34) (10,737)
Employee costs and other external expenses (1,616) (110) (860) (2,586) 81 (2,505) - (2,505)
Gain (loss) on disposal of non-current assets 178 - 12 190 - 190 - 190
Additional other operating income andexpenses 65 140 4 209 2 211 - 211Share of profit (loss) in associates and jointventures (10) - (1) (11) - (11) - (11)EBITDA 3,572 162 (115) 3,619 6 3,625 800 4,425
Depreciation and amortisation (1,355) (78) (203) (1,636) (53) (1,689) - (1,689)
Impairment losses - - - - - - - -
Operating profit (loss) (EBIT) 2,217 84 (318) 1,983 (47) 1,936 800 2,736
Cash flow from operating activities 8,036 78 (641) 7,473 37 7,510 - 7,510
Gross investments (1,563) (1,258) (495) (3,316) (52) (3,368) - (3,368)
Divestments (45) - 35 (10) (1) (11) - (11)
Free cash flow (FCF) 6,428 (1,180) (1,101) 4,147 (16) 4,131 - 4,131
Q2 2020, Income statement and FCF, DKKm Offshore OnshoreMarkets &Bioenergy
Reportingsegments
Otheractivities/
eliminationsBusiness
performance Adjustments IFRSExternal revenue 8,377 165 4,003 12,545 (920) 11,625 (1,663) 9,962
Intra-group revenue 987 (5) (108) 874 (874)1 - - -
Revenue 9,364 160 3,895 13,419 (1,794) 11,625 (1,663) 9,962
Cost of sales (5,594) 5 (2,985) (8,574) 1,758 (6,816) 299 (6,517)
Employee costs and other external expenses (1,512) (157) (767) (2,436) 136 (2,300) - (2,300)
Gain (loss) on disposal of non-current assets - 34 37 71 - 71 - 71
Additional other operating income andexpenses 95 270 6 371 (2) 369 - 369Share of profit (loss) in associates and jointventures 8 - (1) 7 - 7 - 7EBITDA 2,361 312 185 2,858 98 2,956 (1,364) 1,592
Depreciation and amortisation (1,452) (109) (208) (1,769) (58) (1,827) - (1,827)
Impairment losses - - - - - - - -
Operating profit (loss) (EBIT) 909 203 (23) 1,089 40 1,129 (1,364) (235)
Cash flow from operating activities 4,338 3,209 817 8,364 (167) 8,197 - 8,197
Gross investments (2,802) (733) (179) (3,714) (43) (3,757) - (3,757)
Divestments (150) 114 81 45 - 45 - 45
Free cash flow (FCF) 1,386 2,590 719 4,695 (210) 4,485 - 4,485
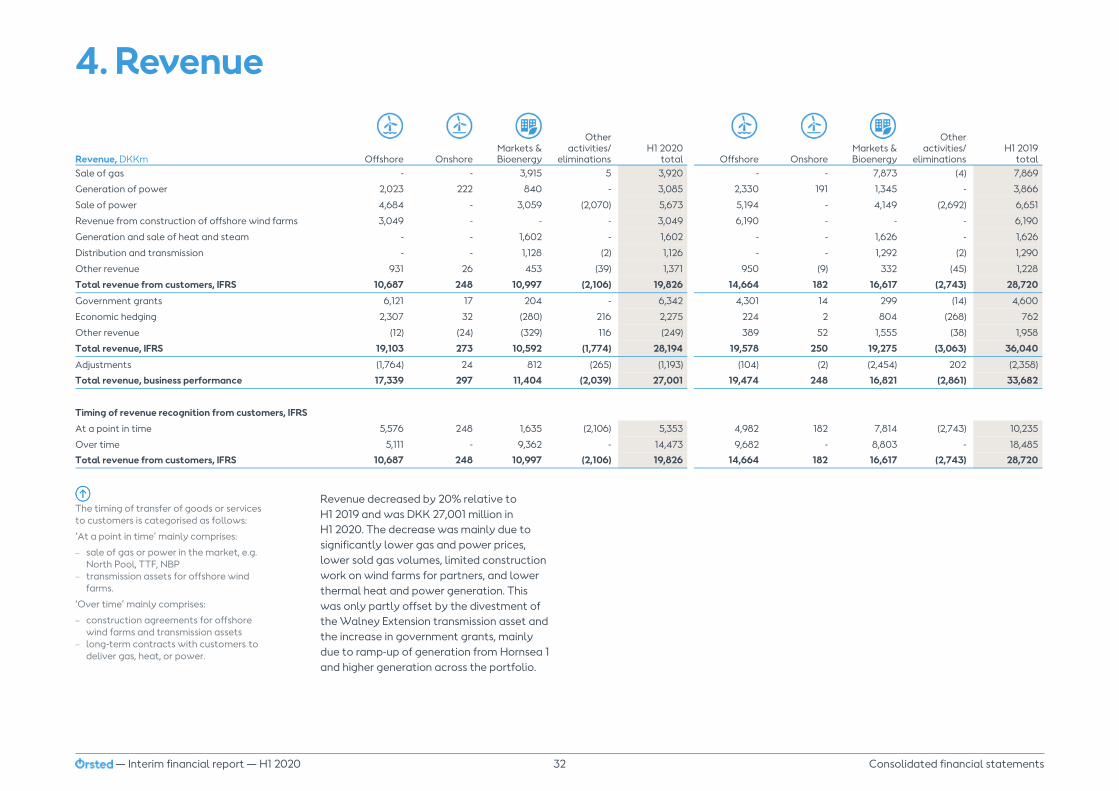
32— Interim financial report — H1 2020 Consolidated financial statements
Revenue decreased by 20% relative toH1 2019 and was DKK 27,001 million inH1 2020. The decrease was mainly due to significantly lower gas and power prices, lower sold gas volumes, limited construction work on wind farms for partners, and lower thermal heat and power generation. This was only partly offset by the divestment of the Walney Extension transmission asset and the increase in government grants, mainly due to ramp-up of generation from Hornsea 1 and higher generation across the portfolio.
4. Revenue
The timing of transfer of goods or services to customers is categorised as follows:
‘At a point in time’ mainly comprises:
sale of gas or power in the market, e.g. North Pool, TTF, NBP
transmission assets for offshore wind farms.
‘Over time’ mainly comprises:
construction agreements for offshore wind farms and transmission assets
long-term contracts with customers to deliver gas, heat, or power.
Revenue, DKKm Offshore OnshoreMarkets &Bioenergy
Otheractivities/
eliminationsH1 2020
total Offshore OnshoreMarkets &Bioenergy
Otheractivities/
eliminationsH1 2019
totalSale of gas - - 3,915 5 3,920 - - 7,873 (4) 7,869
Generation of power 2,023 222 840 - 3,085 2,330 191 1,345 - 3,866
Sale of power 4,684 - 3,059 (2,070) 5,673 5,194 - 4,149 (2,692) 6,651
Revenue from construction of offshore wind farms 3,049 - - - 3,049 6,190 - - - 6,190
Generation and sale of heat and steam - - 1,602 - 1,602 - - 1,626 - 1,626
Distribution and transmission - - 1,128 (2) 1,126 - - 1,292 (2) 1,290
Other revenue 931 26 453 (39) 1,371 950 (9) 332 (45) 1,228
Total revenue from customers, IFRS 10,687 248 10,997 (2,106) 19,826 14,664 182 16,617 (2,743) 28,720
Government grants 6,121 17 204 - 6,342 4,301 14 299 (14) 4,600
Economic hedging 2,307 32 (280) 216 2,275 224 2 804 (268) 762
Other revenue (12) (24) (329) 116 (249) 389 52 1,555 (38) 1,958
Total revenue, IFRS 19,103 273 10,592 (1,774) 28,194 19,578 250 19,275 (3,063) 36,040
Adjustments (1,764) 24 812 (265) (1,193) (104) (2) (2,454) 202 (2,358)
Total revenue, business performance 17,339 297 11,404 (2,039) 27,001 19,474 248 16,821 (2,861) 33,682
Timing of revenue recognition from customers, IFRS
At a point in time 5,576 248 1,635 (2,106) 5,353 4,982 182 7,814 (2,743) 10,235
Over time 5,111 - 9,362 - 14,473 9,682 - 8,803 - 18,485
Total revenue from customers, IFRS 10,687 248 10,997 (2,106) 19,826 14,664 182 16,617 (2,743) 28,720

33— Interim financial report — H1 2020 Consolidated financial statements
4. Revenue (continued)
Revenue, DKKm Offshore OnshoreMarkets &Bioenergy
Otheractivities/
eliminationsQ2 2020
total Offshore OnshoreMarkets &Bioenergy
Otheractivities/
eliminationsQ2 2019
totalSale of gas - - 1,245 (2) 1,243 - - 3,594 201 3,795
Generation of power 687 123 323 - 1,133 931 103 372 - 1,406Sale of power 3,146 - 1,365 (1,848) 2,663 3,431 - 1,930 (2,123)1 3,238Revenue from construction of offshore wind farms 2,486 - - - 2,486 4,200 - - - 4,200Generation and sale of heat and steam - - 454 - 454 - - 505 - 505Distribution and transmission - - 468 (1) 467 - - 589 (1) 588Other revenue 511 13 164 (31) 657 466 (6) 167 (33) 594
Total revenue from customers, IFRS 6,830 136 4,019 (1,882) 9,103 9,028 97 7,157 (1,956) 14,326
Government grants 2,296 6 40 - 2,342 1,818 3 88 - 1,909
Economic hedging (636) 8 (329) 489 (468) 791 5 172 59 1,027
Other revenue (19) (16) (1,068) 88 (1,015) 174 34 38 (231) 15
Total revenue, IFRS 8,471 134 2,662 (1,305) 9,962 11,811 139 7,455 (2,128) 17,277
Adjustments 893 26 1,233 (489) 1,663 (704) (5) (44) (81) (834)
Total revenue, business performance 9,364 160 3,895 (1,794) 11,625 11,107 134 7,411 (2,209) 16,443
Timing of revenue recognition from customers, IFRS
At a point in time 2,696 136 (529) (1,882) 421 1,788 97 3,589 (1,956) 3,518
Over time 4,134 - 4,548 - 8,682 7,240 - 3,568 - 10,808
Total revenue from customers, IFRS 6,830 136 4,019 (1,882) 9,103 9,028 97 7,157 (1,956) 14,326

34— Interim financial report — H1 2020 Consolidated financial statements
5. Other operating income and expenses
6. Gross and net investments
Gain on divestment of assets is mainlyrelated to the Hornsea 1 offshore transmis-sion asset where we lowered our assumption regarding the preferred bidder’s expected return requirement in Q1 2020.
Other compensation is primarily related to compensations regarding outages and
curtailments, mainly from the German grid operator TenneT.
US tax credits and tax equity income origi-nate from our US onshore wind farms in oper-ation and correspond to the tax credits and other tax attributes provided to Ørsted and tax equity partners for generated power.
The table shows gross and net investments based on cash flows from investing activities.
Other operating income, DKKm H1 2020 H1 2019 Q2 2020 Q2 2019Gain on divestment of assets 1,332 362 99 226
Other compensation 127 345 10 53
US tax credits and tax equity income 477 282 269 140
Miscellaneous operating income 165 149 136 46
Total other operating income 2,101 1,138 514 465
Other operating expenses, DKKm H1 2020 H1 2019 Q2 2020 Q2 2019Loss on divestment of assets 44 54 28 36
Miscellaneous operating expenses 103 105 46 28
Total other operating expenses 147 159 74 64
Gross and net investments, DKKm H1 2020 H1 2019 Q2 2020 Q2 2019Cash flow from investing activities (4,890) (4,482) (2,925) (7,259)Dividends received and capital reductionsreversed - (6) - (6)Purchase and sale of securities, reversed (4,117) (136) (780) 3,886
Sale of non-current assets, reversed (58) (2,643) (52) 11
Total gross investments (9,065) (7,267) (3,757) (3,368)Transactions with non-controlling interests inconnection with divestments (6) 24 (7) - Sale of non-current assets 58 2,643 52 (11)
Total cash flows from divestments 52 2,667 45 (11)
Total net investments (9,013) (4,600) (3,712) (3,379)

35— Interim financial report — H1 2020 Consolidated financial statements
7. Assets classified as held for sale
8. Discontinued operations
The table shows assets and liabilities which have been put up for sale and, therefore, are notexpected to contribute to our future earnings.
businesses to SEAS-NVE. Following theauthorities’ approval, we expect to close the transaction end of August 2020.
In 2019, we signed an agreement to divest our LNG activities to Glencore. We expect to close the transaction by late Q3 2020.
At 30 June 2019, assets and relatedliabilities held for sale comprised our Danish power distribution, residential customer, and city light businesses as well as our oil pipe system in Denmark.
Discontinued operations
Discontinued operations comprise assets and liabilities related to our divested Oil & Gas business, which was sold to INEOS on29 September 2017.
Financial results
Loss for the period amounted to DKK -43 million and primarily concernedadjustments related to currency.
Cash flows for the period concerned a pay-ment related to the Fredericia stabilisation plant.
Capital employed
Our capital employed in discontinuedoperations mainly consisted of provisions relating to the divestment of the Oil & Gas business (tax indemnifications and payments related to the Fredericia stabilisation plant) as well as a receivable selling price which does not carry any interest. We expect to receive the outstanding selling price in 2020.
In addition, we have an interest-bearingreceivable of DKK 335 million (not part of capital employed), which we also expect toreceive in 2020.
Assets classified as held for sale, DKKm30 June
202031 December
201930 June
2019Intangible assets 245 226 219
Property, plant and equipment 13,475 13,243 14,561
Deferred tax 320 589 -
Inventories 58 43 16
Trade receivables 657 736 647
Other receivables 1,862 2,113 380
Income tax 34 2 62
Total assets classified as held for sale 16,651 16,952 15,885
Deferred tax 1,126 1,315 870
Provisions 2,385 2,662 378
Contract liabilities 3,070 3,107 2,747
Trade payables 351 333 105
Other payables 968 970 590
Income tax 569 445 97
Total liabilities relating to assets classified as held for sale 8,469 8,832 4,787
Net assets classified as held for sale 8,182 8,120 11,098 Performance highlights, DKKm H1 2020 H1 2019 Q2 2020 Q2 2019EBIT - (7) - (7)
Profit (loss) from discontinued operations (44) (61) (16) (18)
Cash flows from discontinued operations (44) - 102 (2)
Capital employed, discontinued operationsDKKm
30 June2020
30 June2019
Non-current receivables - 643
Derivatives, net (42) (55)
Other provisions (679) (807)
Tax, net 14 33
Other receivables and other payables, net 673 -
Total net assets (34) (186)
At 30 June 2020 and 31 December 2019,assets and related labilities held for sale comprised our Danish power distribution, residential customer, and city lightbusinesses, our oil pipe system in Denmark, and our LNG business. All activities are part of Markets & Bioenergy.
In June, the Danish competition authorities and the Danish Energy Agency approved the divestment of our Danish power distribution (Radius), residential customer, and city light

36— Interim financial report — H1 2020 Consolidated financial statements
The increase in net financial income andexpenses in 2020 compared with 2019 ismainly due to:
higher net interest expenses, mainly related to interest regarding tax
capital losses on early repayment of loans and interest rate swaps
a lower gain on exchange rate adjustments in 2020
a loss on value adjustment of securities in 2020 due to an increase in interest rates.
The table shows net financial income and expenses corresponding to our internal control.
Exchange rate adjustments and hedging contracts entered into to hedge currency risks are presented net under the item ’Exchange rate adjustments, net’.
9. Financial income and expensesNet financial income and expenses, DKKm H1 2020 H1 2019 Q2 2020 Q2 2019Interest expenses, net (886) (528) (508) (276)
Interest expenses, leasing (97) (76) (53) (40)
Interest element of provisions, etc. (221) (212) (108) (106)
Tax equity partner's contractual return (209) (139) (118) (70)
Capital losses on early repayment of loansand interest rate swaps (369) - (369) - Value adjustments of derivatives, net (72) (190) (30) (92)
Exchange rate adjustments, net 195 536 (3) (42)
Value adjustments of securities, net (131) 222 191 78
Other financial income and expenses 4 (57) (12) 3
Net financial income and expenses (1,786) (444) (1,010) (545)

37— Interim financial report — H1 2020 Consolidated financial statements
Tax on business performance profit (loss) was DKK 1,846 million in the first half year of 2020 compared to DKK 1,241 in the first half year of 2019. The effective tax rate for the first half year of 2020 was 42%. The effective tax rate was affected by recognition of a tax
10. Tax on profit (loss) for the year
Effective tax rateThe estimated average annual tax rate for ordinary business activities is 22% compared to 30% for the full-year of 2019.
The effective tax for the period is calculated on the basis of the profit (loss) before tax from continuing operations.
Accounting policies
Effective tax rateThe estimated average annual tax rate isseparated based on regions and into two different categories: a) ordinary business activities andb) gain (loss) on divestments and impacts from tax equity contributions.
liability in connection with the tax equity partnerships related to the Sage Draw and Plum Creek onshore wind farms. Wereceived tax equity contributions from our tax equity partners in April and June,respectively.
Business performance
H1 2020 H1 2019
Tax for the period, DKKProfit (loss)before tax Tax Tax in %
Profit (loss)before tax Tax Tax in %
Deferred tax liability, new tax equity contributions - (885) n.a. - n.a. n.a.
Other items, including prior year adjustments - (50) n.a. - (147) n.a.
Ordinary business activities 4,383 (911) 21% 4,973 (1,094) 22%
Effective tax for the year 4,383 (1,846) 42% 4,973 (1,241) 25%

38— Interim financial report — H1 2020 Consolidated financial statements
Market risks
We manage market risks to protect Ørsted against market price volatility and ensure stable and robust financial ratios thatsupport our growth strategy as well asprotect the value of our assets.
In general, we hedge price exposures for up to five years to reduce cash flow fluctua-
tions. Prices are not hedged in the long term, and therefore our long-term market risks are determined by our strategic decisions oninvestments in new assets, the conclusionof long-term contracts as well as anydivestment of assets.Our energy and currency exposures for the near term is shown below.
For USD, we manage our risk as a natural time spread between front-end capitalexpenditures and long-end revenue between1 July 2020 - 31 Decem-ber 2036.
NTD is not a material risk for the coming five years.
We do not deem EUR to constitute a risk, as we expect Denmark to maintain its fixedexchange-rate policy.
The graph shows our energy exposure for the next five years.
Our energy exposures are significantly reduced due to hedging.
Energy exposure 1 July 2020 - 30 June 2025, DKKbn
Currency exposure, GBP 1 July 2020 - 30 June 2025, USD 1 July 2020 - 31 December 2036, DKKbn
12. Market risks11. Reserves
Reserves 2020, DKKm
Foreigncurrency
translationreserve
Hedgingreserve
Totalreserves
Reserves at 1 January 2020 168 245 413
Exchange rate adjustments (4,115) - (4,115)
Value adjustments of hedging - 1,030 1,030
Value adjustments transferred to:
Revenue - 53 53
Financial income and expenses - 461 461
Tax:
Tax on hedging and currency adjustments 940 (367) 573
Movement in comprehensive income for the period (3,175) 1,177 (1,998)
Total reserves at 30 June (3,007) 1,422 (1,585)
Reserves 2019, DKKm
Foreigncurrency
translationreserve
Hedgingreserve
Totalreserves
Reserves at 1 January 2019 (1,906) 79 (1,827)
Exchange rate adjustments (601) - (601)
Value adjustments of hedging - 1,535 1,535
Value adjustments transferred to:
Revenue - 71 71
Financial income and expenses - 53 53
Tax:
Tax on hedging and currency adjustments 148 (260) (112)
Movement in comprehensive income for the period (453) 1,399 946
Total reserves at 30 June (2,359) 1,478 (881)

39— Interim financial report — H1 2020 Consolidated financial statements
Accounting policy
Quoted prices comprise gas and derivatives that are traded in active markets. Where derivatives are traded in an active market, we generally have daily settlements, for which reason the market value is zero.Observable input comprises securities and deriva-tives, for which valuation models with observable inputs are used to measure fair value. The majority of our securities are quoted Danish mortgage or government bonds. Since these are not alwaystraded on a daily basis, we are valuing these based on market interest rates for similar bonds. Non-observable input derivatives comprise primarily long-term contracts on the purchase or sale ofpower and gas. The fair values are based onassumptions concerning the long-term prices of, power and gas as well as risk premiums in respect of liquidity and market risks. Since there are no active markets for long-term prices, the fair value has been determined through an estimate of the future prices.
Valuation principles and key assumptions
In order to minimise the use of subjectiveestimates or modifications of parametersand calculation models, it is our policy todetermine fair values based on the external information that most accurately reflects the market values. We use pricing services and benchmark services to increase the dataquality.
Market values are determined by theTreasury & Risk Management function which reports to the CFO. The developments inmarket values is monitored on a continuous basis and are reported to Group Executive Management.
The table shows the movements during the year in the total market value (assets andliabilities) of derivatives valued on the basis of non-observable inputs.
13. Fair value measurement
The table shows assets and liabilities measured at fair value, split between inputs.
Normally, the energy price can be observed for a maximum of five years in the power market, after which an active market no longer exists. Beyond the five-year horizon, the energy price is thus projected on the basis of the observable forward price for year one to five.All assets and liabilities measured at fair value are measured on a recurring basis.
After a change in the valuation methodology as of 31 December 2019, US power prices are no longer valued based on significant non-observable inputs.
Assets LiabilitiesFair value hierarchyDKKm Inventories Securities Derivatives Derivatives
Otherpayables
2020
Quoted prices 285 - 8 30 -
Observable input - 12,327 7,476 5,298 -
Non-observable input - - 357 59 -
Total 30 June 2020 285 12,327 7,841 5,387 -
2019
Quoted prices 375 - 7 11 -
Observable input - 25,485 5,058 5,166 -
Non-observable input - - 1,238 470 545
Total 30 June 2019 375 25,485 6,303 5,647 545
Derivatives valued on the basis ofnon-observable input, DKKm 2020 2019Market value at 1 January 236 (2,458)
Value adjustments through profit or loss 240 344
Value adjustments through othercomprehensive income - 1,192Sales/redemptions (205) (136)
Purchase/issues 27 7Market value at 30 June before deferredgain/loss 298 (1,051)Deferred loss at initial recognition on 1 January - 1,819
Market value at 30 June 298 768
Non-observable inputs per commodityprice input, DKKm 2020 2019US power prices - 525
Other power prices 63 48
Gas prices 235 195
Total 298 768

40— Interim financial report — H1 2020 Consolidated financial statements
The table shows which items are included in funds from operations (FFO).FFO is calculated for the continuing operations.
Market value of bond and bank debt
The market values of bond and bank debts amounted to DKK 38.4 billion andDKK 3.7 billion, respectively, at 30 June 2020.
14. Interest-bearing debt and FFO
Interest-bearing net debt totalled DKK 22,272 mil-lion as of 30 June 2020, which was an increase of DKK 5,042 million relative to 31 December 2019. The increase was driven by a decrease in interest-bearing assets of DKK 6,018 million. In addition, interest-bearing debt decreased by DKK 976 mil-lion, which mainly related to the repayment of short-term repo debt and a decrease in bond debt due to the drop in GBP/DKK exchange rates, reduc-ing the amount to be repaid in DKK.
The table shows which items are included in the adjusted interest-bearing debt as well as FFOrelative toadjusted interest-bearing debt.
Adjusted interest-bearing net debtDKKm
30 June2020
31 December2019
30 June2019
Total interest-bearing net debt 22,272 17,230 4,980
50% of hybrid capital 6,616 6,616 6,619Cash and securities not available fordistribution, excluding repo loans 1,628 1,437 1,094Decommissioning obligations 6,490 6,158 5,781
Deferred tax on decommissioningobligations (900) (866) (719)Total adjusted interest-bearingnet debt 36,106 30,575 17,755
Funds from operations (FFO)/adjusted interest-bearing net debt
30 June2020
31 December2019
30 June2019
Funds from operations (FFO)/adjusted interest-bearing net debt 23.1% 31.0% 57.5%
Interest-bearing debt and interest-bearing assetsDKKm
30 June2020
31 December2019
30 June2019
Interest-bearing debt:
Bank debt 3,520 3,466 3,519
Bond debt 31,507 33,373 29,116
Total bond and bank debt 35,027 36,839 32,635
Tax equity liability 638 608 572
Lease liability 5,097 5,332 5,074
Other interest-bearing debt 1,690 649 664
Total interest-bearing debt 42,452 43,428 38,945
Interest-bearing assets:
Securities 12,327 16,552 25,485
Cash 6,754 7,148 6,968
Other receivables 1,099 1,781 823
Receivables in connection with divestments - 717 689
Total interest-bearing assets 20,180 26,198 33,965
Total interest-bearing net debt 22,272 17,230 4,980
Funds from operations (FFO) LTM1
DKKm30 June
202031 December
201930 June
2019EBITDA - business performance 18,489 17,484 30,186
Interest expenses, net (1,849) (1,312) (889)
Interest expenses, leasing (97) (171) (76)
Reversal of interest expensestransferred to assets (377) (344) (428)Interest element ofdecommissioning obligations (220) (212) (209)50% of coupon payments onhybrid capital (278) (279) (273)Calculated interest paid onoperating lease obligations - - 76Adjusted interest expenses, net (2,821) (2,318) (1,799)Reversal of gain (loss) on divestmentof assets (878) 101 (15,367)Reversal of recognised operatinglease payment in profit (loss)for the year - - 376Total current tax (6,437) (5,799) (3,186)
Funds from operations (FFO) 8,353 9,468 10,2101 Last 12 months

41— Interim financial report — H1 2020 Consolidated financial statements
additional requirements in the DanishFinancial Statements Act. The accounting policies remain unchanged from the annual report for 2019.
In our opinion, the interim financial report gives a true and fair view of the Group'sassets, liabilities, and financial position at30 June 2020 and of the results of the Group's operations and cash flows for the period
The Board of Directors and the Executive Board have today considered and approved the interim financial report of Ørsted A/S for the period 1 January - 30 June 2020.
The interim financial report, which has not been audited or reviewed by the company’sindependent auditors, has been prepared in accordance with IAS 34 'Interim Financial Reporting' as adopted by the EU and
1 January - 30 June 2020.
Furthermore, in our opinion, the manage-ment's review gives a fair presentation of thedevelopment in the Group's operations and financial circumstances, of the results for the period, and of the overall financial position of the Group as well as a description of the most significant risks and elements of uncertainty facing the Group.
Over and above the disclosures in the interim financial report, no changes in the Group's most significant risks and uncertainties have occurred relative to the disclosures in the annual report for 2019.
Skærbæk, 12 August 2020
Henrik Poulsen
President and CEO
Marianne Wiinholt
CFO
Thomas Thune Andersen
Chairman
Jørgen Kildahl
Hanne Sten Andersen*
Lene Skole
Deputy Chairman
Peter Korsholm
Poul Dreyer*
Lynda Armstrong
Dieter Wemmer
Benny Gøbel* *Employee representative
Executive Board
Board of Directors
Statement by the Executive Board and theBoard of Directors

42— Interim financial report — H1 2020 Consolidated financial statements
Forward-looking statements
Forward-looking statements
This report contains certain forward-looking statements, including but not limited to, the state-ments and expectations contained in the ‘Outlook’ section of this report (p. 7). Statements herein, other than statements of historical facts, regarding our future results related to operations, financial condition, cash flows, business strategy, plans and future objectives are forward-looking statements. Words such as ‘targets’, ‘believe’, ‘expect’, ‘aim’, ‘intend’, ‘plan’, ‘seek’, ‘will’, ‘may’, ‘should’ ‘anticipate’, ‘continue’, ‘predict’ or variations of these words as well as other statements regarding matters that are not historical facts or regarding future events or prospects,constitute forward-looking statements.
We have based these forward-looking statements on our current views with respect to future events and financial performance. These views involve a number of risks and uncertainties which could cause actual results to differ materially from those predicted in the forward-looking state-ments and from our past performance. Although, we believe that the estimates and projections reflected in the forward-looking statements are reasonable, they may prove materially incorrect, and actual results may materially differ due to a variety of factors. These factors include, but are not limited to, market risks, development and construction of assets, changes in temperature, wind conditions, wake and blockage effects, precipitation levels, the development in power, coal, carbon, gas, oil, currency, and interest rate markets, changes in legislation, regulations
or standards, the renegotiation of contracts, changes in the competitive environment in ourmarkets, security of supply, cable break-downs, or other disruptions. Read more about the risks in the chapter ‘Risk and risk management’ and in note 7 of the annual report 2019 available at www.orsted.com.
Unless required by law, we are under no duty and undertake no obligation to update or revise any forward-looking statement after the distribution of this report, whether as a result of new information, future events, or otherwise.