Personal Money Management
104
-
Upload
balajirangach209 -
Category
Documents
-
view
8 -
download
1
description
Personal Money Management
Transcript of Personal Money Management


This e‐book is a (nearly) unabridged collection of posts written at freefincal.com
All rights reserved. Feel free to redistribute ‘as is’. Do not reproduce in part or whole without seeking permission from [email protected]

Contents
1. Getting started
2. Personal Finance Self Evaluation Checklist
3. How to fortify your financial castle
4. How to Buy a Term Life Insurance Policy
5. How to Buy a Health Insurance Policy
6. Say NO to Packaged Financial Products
7. Retirement Planning – A Slide Show
8. Understanding How Retirement Calculators Work
9. Generating an inflation‐protected income with a lump sum
10. A Step‐By‐Step Guide to Long Term Goal‐Based Investing – 1
11. Long Term Goal‐Based Investing – Part II
12. How to select mutual fund categories suitable for your financial goals?
13. How to select an equity mutual fund ‐preamble
14. How to select an equity mutual fund – Creating a shortlist
15. How to select an equity mutual fund – Making a Choice!
16. How to Select Debt Mutual Funds Suitable For Your Financial Goals?
17. How to Conduct a Personal Financial Audit
18. How to review your mutual fund portfolio
19. Review Your Retirement Portfolio in Seven Easy Steps
20. Asset allocation for long‐term goals

1. Getting Started
1. Introduction
How would you like to change the way your family has always looked at money? That is the central theme of this e‐book. This chapter is a synopsis of a talk I gave to a group of young research students.
2. Fortifications: Building barriers
If a change has to make its mark, it has to permanent. Thus just like any construction, one has to begin with fortifications.
Life Insurance
A research student died while on a trek recently. Their parents were entirely dependent on him. They knew this. So no effort was needed to convince them about the need for a term life insurance policy.
Related Post: How to Buy a Term Life Insurance Policy
Health insurance
Same here. These were not school kids. They were postgraduates. So they knew the value of health insurance.
Subra suggested that I talk to them about the importance of getting their parents health cover. Done.
Related post: How to Buy a Health Insurance Policy
Accident insurance
This was suggested by Mr. R. Balakrishnan when I posted about this talk in the facebook group, asan ideas for wealth.
Emergency fund
See below
Related post: How Long Should I Maintain an Emergency Fund?

Will
Urged them to get their parents to write a will. Again a suggestion by Subra.
3. Analysing Cash Flow
I suggested that the students do the following with their monthly scholarship
For at least 1 year
i) 30% fees + food + needs
ii) 30% family or to the bank (say a flexi‐deposit) – partly to build an emergency fund
iii) 30% for long‐term investment (money you will not touch for many, many years) – see below
iv) 10% buffer for wants … from time to time
After about a year or when emergency fund is close to 1 lakh:
i) 30% fees + food + needs
ii) 30% family or partly towards long‐term investment
iii) increase long‐term investment (money you will not touch for many, many years) – see below
iv) 10% buffer for wants … from time to time
There was unanimous agreement that this was possible.
4. Frugal Living
Do not connect money and happiness.
Do not take your degree and future positions too seriously and buy stuff because of some ‘status’ nonsense or because of peer pressure
5. Never take a loan
Except a home loan and that too only if necessary.

6. Say no to credit cards
If you have a credit card, you need to pay it in full each month, anyway. Meaning you need to have the money ready. So why have one at all?
Ignore all the perks associated with credit cards. They do not account for much.
You do not need a credit card to keep track of your expenses
7. Say no to any kind of insurance products
Except pure term life insurance. Enough said
8. Do not talk to an insurance agent or bank relationship
manager
If you need something from them, tell them what you want. Never ever ask an intermediary, what to
do
9. Do not buy land as investment
It is not liquid, not well regulated, demand is artificial etc. etc.
10. Do not buy gold as investment
Since I was talking to physicists I could afford to say the following.
Gold glitters simply because gold is a metal. An electric field cannot exist inside a metal. Otherwise, the electrons inside would flow!
When light (which contains a fluctuating electric field) shines on a piece of gold, or for that matter any piece of metal, the nimble electrons move around like a gooey fluid and reflects most of the light. Some of it gets absorbed. So the resulting colour is golden‐yellow. No big deal!
If our eyes could sense ultraviolet light instead of the visible light (VIBGYOR), gold would appear like a slab of glass because metals are transparent to ultraviolet light.

11. Give money to charity
Help others in need. When you are in need, someone would turn up to help you. That is my strongest religious belief.
12. Understanding long‐term investments – the chai shop analogy
Only one persons parent ( out of nearly 100) invested in stocks. No surprises here I guess.
To introduce them to the idea of stocks and bonds, I used the following analogy.
Imagine a tea stall outside the hostel gate. You frequent it each day, you like the owner and you like the tea even more. One day he says he has to shut shop because he has huge debt.
You want to bail him out.
You have the following choices.
1) Lend him say 50K and ask for 8% interest each year for 1o years. This is called a bond. Since he is in your debt, this is called a debt instrument. If the person is trustworthy there is no credit risk involved.
Whether he gets a profit or not, he has to give you the 8% interest. So there is no ‘risk’ for your investment in the sense that payments will be regular.
You reinvest the payments in the same shop and get the same interest or say, put it in a bank FD
2) You give him 50K but tell him that you want a share of the profits. That is you own the company. This is called equity. If there is a loss, you get a loss. If there is a gain, you get a gain.
There maybe intermittent losses but over a long period of time, you expect the annual gains to outnumber the annual losses. You expect this because:
● students need a place to hangout outside the campus. So they would frequent tea shops. ● If the tea is good (and it is in this case) then more students would come and more often. ● Thus, there is a chance for consistent profit.

After several years, the equity and bond investors net worth would look something like this (drew this on the board).
If I apply 30% tax to both equity and debt, the value will reduce.
Now I must take into account the effect of inflation.
I asked for the price of chai when they had it for the first time ever in their lives.
Rs. 1, Rs. 2.50 were some answers ( not all are from metros!)
This was 10 years ago.
Now the price is about Rs. 7
So this is about 11% inflation with the starting price as Rs. 2.50
So after having devalued the corpus due to tax, we must devalue it due to inflation.
Now who do you think got the better deal? The fellow who had the courage to stomach annual fluctuations or the fellow who wanted ‘steady’ growth with practically no volatility
Which investor is likely to change the way their family handles money?
Knowing which chai shop to back may be tough as there are too many of them around the campus. Also, why only back chai shops? There are several Xerox shops, supplies shops etc.

What about our campus bank (SBI)? It makes a lot of money by offering attractive fixed deposit rates. It then offers different kinds of loans (car, personal, house, for companies etc.) at much higher rates and bags a neat profit.
Why not buy the banks stock? Why not observe the spending habits of the undergraduates and find out which brands they prefer? Those brands could then form a shortlist for further investigation.
Yes, knowing where to invest (either equity or bond) is tough. It requires confidence, discipline and the time to analyze and track.
There is a much simpler alternative: mutual funds. You pay a sum to a fund manager who pools in all contributions and invests in a diversified folio of stocks, bonds or both.
I urged them to build fortifications asap, learn the basics of equity and mutual funds and begin investing.
There were some intelligent questions like:
● Why do you expect stocks to increase all the time? ● Why is a home loan the only loan that one should get? ● Which term policy should I choose? ● Can I buy real estate if I want to farm in it? ● If one gets rich, does it mean someone else gets poor? (Tough one!)

2. Personal Finance Self Evaluation Checklist
Act I: Preparation
1. Is my life insured adequately? That is, will my family be able to handle their immediate,
short‐term and long‐term goals in my absence? Some people dismiss this as over analysis and take a 1 Crore term policy! Trust me this analysis will take only 15 minutes. The paralysis occurs while choosing an insurer not while deciding the amount!
2. Have I discussed with my spouse or nominee how the term insurance amount should
be utilized in my absence? You can write a detailed note about this if your spouse finds it too morbid to discuss this. Just be sure to include the detailed note along with the policy papers. You can also include the contact details of a fee‐only financial planner for guidance.
3. Are me and my family members insured adequately wrt medical expenses independent of
my employment? This seems like a no brainer but I am appalled to see that people consider mediclaim expenses as a waste of money if they don’t claim and take employee benefits and their own health for granted.
4. How ready am I to handle emergency expenses? You need more than 6 months or 12 months expenses. Remember that cashless hospitalization does not mean cash‐free hospitalization. You still need to pay for ‘non‐medical expenses’.
5. How capable am I of replenishing my emergency fund if it gets depleted?! Don’t lock all your monthly inflows into EMIs and SIPs. You need a small buffer to replenish the emergency fund.
6. Do I know what my net worth is? The only reason you need to do this is forces you to list all your investments and update their values.
7. Have I listed all my goals: recurring, short‐term (less than 5 years away), intermediate term
(5‐10Y away) and long‐term (10Y+ away)? 8. Do I know the approximate but realistic current cost associated with my goals? 9. Have I decided the asset allocation for my intermediate and long‐term goals? Short term is
100% debt! The asset allocation give you a net portfolio return you are aiming for. For example if you expect 12% from equity and 7% (post‐tax) from debt and would like to have 60% equity exposure, the net portfolio return is (approximately): (12% x 60%)+( 7%x40%)
10. Do I know how much I need to save or invest for each of them? You need to use a goal planner with the net portfolio return and a reasonable inflation estimate. For retirement, you need to assume an interest rate post‐retirement. Use something like 7% or so, for now.
11. Do I know how much I can invest per month? Analyse your cash inflow and outflow. Construct a pie chart and stare at it.
12. If there is a shortfall how am I going to manage it? Some options: postpone goals, reduce targets, increase investments down the line. Don’t make the mistake of increasing exposure

to volatile instruments in the hope of compensating lower investments with higher returns. It could backfire terribly.
13. Have I discussed all this with my spouse or partner? Have I written down an investment plan? A written investment plan helps everybody, especially those who cannot discuss financial matters with their spouse.
Act II: Action
1. Do I know what category of instruments (eg. what kind of mutual fund) am I going to choose
for my goals? 2. Is my proposed portfolio diversified within each asset class? 3. Have I begun investments as per the asset allocation decided? Not all goals can be handled at
the same time by everyone. Retirement is priority number one. 4. Am I tracking my investments? Am I investing enough and as per the schedule assumed in the
goal planners? 5. Have I written a will?
Act III: Review
1. Do I know the net return (XIRR) of my debt investments and equity investment? Do I know the net XIRR of the portfolio? Is this above or below the expected portfolio return used in the goal planners?
2. Do I know what is the current actual value of goal portfolios? Do I know how much are they actually worth? If I don’t invest anymore for these goals, how much would the current value grow to when I need the money?
3. Do I know for how many years I can survive on an inflation‐indexed monthly income with my
retirement corpus, If I retire today? Let us call this X years. 4. Am I increasing this X years by at least one year for each year that I work? This is the true
measure of a retirement portfolio.
~~~~~~~~~~~~~
End note: At the end of the day how successful we are with our finances is decided by how much money we have when the need arises – at which point XIRR or CAGR or IRR or whatever we wish to call it matters little. All we can do is make reasonable assumptions, invest in productive assets which is part of a diversified portfolio and hope for the best!

3. How to fortify your financial castle
Life insurance, health insurance, accident insurance and critical illness insurance are tailor‐made fortification products that help a family tackle unpleasant and unexpected developments. Be it expenses due to hospitalization, or loss or decrease in income due to death, accident or a critical illness. I refer to them as fortification products because they protect the families long‐term goals like retirement, children’s education, marriage etc. They protect by minimizing the chance of redeeming the corpus meant for these goals. They protect by minimizing the chances of interrupting the compounding of the corpus.
Here are some thoughts on the fortification process.
Emergency Fund
A emergency fund is also a crucial fortification step but we do not have a tailor‐made product for this and nor is it necessary. As long as we can find a way to replenish the emergency fund when it is used, where we put the fund is pretty much irrelevant. Of course the chosen instrument must be liquid.
The problem is the amount! (see below)
Pure Term Life Insurance
Those who realize a term plan is crucial either choose to seek a one Crore policy or worry about the how much insurance cover is required.
Unfortunately both approaches do not count for much because the insurer has an upper limit typically based on an individual's income and risk profile.
Therefore, I think it would be best to identify 2/3 insurers one is comfortable with, write to them with basic profile details and determine the maximum cover they are willing to offer.
Then write an action plan: How much should I allocate for
1. squaring off liabilities 2. inflation protected income and for how many years (perhaps until the kids are old enough to
work 3. generating an inflation‐protected sum for school fees (including training and coaching
classes) 4. college fees

5. marriage expenses (if possible)
Use the Comprehensive Child planner to work this out: How to plan for your child’s education and
marriage
Remember: having a term plan is good but what if your nominee buys wrong products? So prepare an action plan and discuss it with your nominee
Understand how best the maximum eligible sum insured should be distributed among these buckets, write it down and discuss and give copies to your nominee and someone else you can trust. Be sure to include the name of a fee‐only planner (see link on the top right).
Ask your nominee to contact the fee‐only planner, if needed, as soon as you are ready to submit the claim. They should be able to guide through the claim‐settlement process (for a fee of course) and allocate the sum into different buckets as per your plan.
Also see: Things to do AFTER you take a term insurance policy!
Health Insurance
Having a health cover is indispensable. However it is important to recognize that cashless claim is more of a privilege than a right. Reimbursement is a right. So do not be sure cashless will be approved. Meaning you need money – much more than 12 times monthly expenses!
Emergency fund is a long‐term goal. It is an insatiable monster which needs to be fed constantly.
Read more: How Long Should I Maintain an Emergency Fund?
Print the necessary steps to be completed before and after hospitalization and store it along with the insurance policy and card. It would be better if the spouse and other members read it.
Accident Insurance
This is a must‐have for professionals and those in the cut‐throat corporate world.
The product is rather complex. The claim will be paid in full only for certain types of accident. All others would only get some percentage of the sum insured.
Also one does not need to suffer an accident to lose income. There are many other ailments which would render a person disabled.

How much accident insurance should I have? If I die, family expenses might decrease as I am no longer around.
If I am rendered disable, my family expenses are likely to increase and sharply. So an accident cover should be higher than a term cover.
Unfortunately this is rarely the case.
Getting an accident insurance policy for 10,20,30L is inadequate.
Not everyone will get high cover. It depends on the income and the kind of job
The bigger problem is that many insurers offer quite low cover. The max cover I have seen is 1 Crore from Tata AIG.
The only upside is that the price of sum insured of tens of lakhs is quite inexpensive.
Stay away from any group insurance policy offered by Banks.
Critical Illness Insurance
Again a complex product. You need to get critically ill (and not die within a month) in a certain way.
See more: Critical Illness Insurance Policies: Do You Really Need One?
Again the sum insured in most CI products is not as large as a term plan. But the policy is much more expensive than a term plan.
I would prefer to buy a CI cover if there is some history if CI in my family. But then again, do you stop with first cousins or second cousins? Search hard enough and every family will have CI case!
If all our investible surplus goes to insurance policies (that do not offer bonuses!) where will we have money to invest for our financial goals!
So we either buy all types of policies for low cover or avoid certain types of policies (CI or accident that is. Rest are mandatory).
Alas either way it is not an easy decision.
Perhaps one could buy about 30L of accident cover, 30L of CI cover and get as high a term cover and mediclaim as possible, but the total premium would be close to 1L for a 30‐something.

If we are lucky, don’t get to use the CI and accident policies and the health cover rarely, we can focus on investing.
If we invest to the best of our ability in productive assets, hopefully we would have more than enough to handle unexpected big ticket expenses a couple of decades later. Building a rock‐solid fortification takes time and luck. Lots of both

4. How to Buy a Term Life Insurance Policy
Buying a term life insurance policy based on an insurers claim settlement ratio (CSR) is a meaningless exercise. All it does is offer psychological comfort to the buyer who refuses to understand that each death, and therefore each claim settlement is unique. When a nominee applies for a claim, the insurers CSR is irrelevant.
That said, when a young earner wants to know, ‘which policy should I buy?”, or ‘how to choose a term policy?’, we typically say, ‘choose an insurer you are comfortable with, just be honest while applying’.
Unfortunately, I find that this is not of much use, as the person still needs a simple way to define a comfort zone and short‐list insurers inside the zone. The honesty part is of course always relevant!
Therefore, in this post, much as I do not like it, I would like to propose a simple way, based on the CSR, to short‐list insurers for purchasing a term plan.
The whole process should take you no more than 15‐30 minutes.
One good thing that has come out of the CSR hype is that the insurers (incl LIC) have also fallen for it! Some make it a point to flaunt their CSR. This might be a good development from the (future) customers point of view. If the CSR drops, insurers have begun to realise that it could impact image and therefore sales.
Deconstructing IRDA’s Death Claim Settlement Table First, let us touch upon aspects from IRDA’s death claim settlement table, obscured by the claim settlement ratio.
Let me start with an analogy between an insurer and a teacher evaluating answer scripts. As the teacher starts evaluating scripts, he/she gets a sense of what the average mark of the class would be. When a student scores little or no marks in the first few questions, the teacher realizes that the total mark would be much lower the class average. Therefore, the tendency would be to be a bit generous in the next few questions so that the total is bolstered a bit.
On the other hand, if the first few questions are well written, the tendency would be to scrutinize, the whole paper(!) a bit closer. This is normal human tendency and even a teacher with no pressure from the administration is likely to do this.
Why won’t an insurer who receives a big‐ticket claim scrutinize it tougher? After all, there is much more at stake.
The point is, LIC or private players, no one is likely to offer term cover claim settlement on a platter. Of course, there is a due process clearly mandated by IRDA.
The following is a screenshot from the IRDA annual report 2010‐11 (click to enlarge).

Trouble is, what a claimant considers a delay and what is legally allowed, are two different durations!
There is a crude way to point out that higher the claim amount, higher the scrutiny, resulting possibly in a repudiation or delay.
The claim settlement table published by IRDA has the total benefit amount along with the number of claims intimated, pending and repudiated.
This is a screenshot from the individual death claims table of the 2012‐13 annual report. The entries have been merged with the column headings to aid reading.
The benefit amount per claim when compared over time can shed some light on the ‘average’ claim amount handled by the insurer. Of course, this ratio is not a sound way to make any solid inferences. Let us however run with it and see where it takes us. Before you pan me in the comments section, remember that I acknowledged this!

The claim amount (Lakhs) intimated per policy was 0.73 was LIC in 2006‐07 and 1.58 for privates.
In 2012‐13, this increased by 36% for LIC and nearly 33% for privates. It must be kept in mind that the number of private players increased by about 50% in this period.
Thus, there is a significant increase in the claim amount per policy handled by LIC.
Even more striking is the 78% increase in the benefit amount per repudiated claim (1.08 to 1.92) . How would you interpret that?
For the privates, the benefit amount per repudiated claim has increased by a whopping 95% (2.08 to 4.05) .
For LIC, the claim amount repudiated per claim can only increase from now (their e‐term policy is only one reason). For the privates, I think it should come down in the future or at least not increase so dramatically.
One could argue that the new insurers would have processed early claims and hence would have scrutinized stringently. However, let us read too much into this.
Simply because it is clear enough (even without this data) that the privates are likely to scrutinize claims tougher than LIC.
This can also be seen by

1) comparing benefit amount per claim paid with benefit amount per claim intimated. These are comparable for LIC. For the privates, the benefit amount per claim paid is always lower than the benefit amount per claim intimated.
2) Privates have more claims pending at the end of the year than the start of the year (not shown). The converse is observed for LIC.
The number of pending claims at the start of the year decreased from 9574 in 2006‐07 claims to 8856 claims in 2012‐13 for LIC. While it nearly doubled for the privates, primarily because the number of such life insurers have increased.
Notice that the amount per claim pending at the start of the year has doubled for privates, from 2006‐07 to 2012‐13, even though the denominator (number of claims) has nearly doubled (from 1894 to 3467 in 2012‐13).
When the denominator doubles, the ratio can double only if the numerator (benefit amount) quadruples!
This implies that the privates are handling much higher claim amounts than LIC (not much of a finding!). One could argue that this is the reason, their CSR is lower.
Even if you don’t wish to make much of these ratios, I hope that you agree with my contention that if the claim amount is big (as in a term insurance policy), LIC too would scrutinise it carefully. Simply because such an amount would be higher the average claim amounts they process.
Claim settlement ratio Claim settlement ratio ignores the
1) nature of the policy. LIC typically has a higher number of small ticket claims. 2) the time it takes to settle. It can take up to six months or even more to settle a claim. As long as a claim is settled within the FY, it will be counted for computing CSR. From a nominees point of view, that is a ‘delay’.
Consider this: In 2012‐13 LIC settled 7.33 lakh claims out of 7.51 lakh claims. A claim settlement ratio of 97.7% The privates settled 1.13 lakh claims out of 1.27 lakh claims. A claim settlement ratio of 88.6% (incidentally a significant improvement from 72.7% in 2006‐07despite a 50% increase in number of private pl.ayers)
Now, if the privates had a CSR equal to that of LIC, they should have settled 1.24 Lakh claims (instead of the actual 1.13 Lakh claims). This is less than 10% off. This is approximately the difference between the CSR’s, but when you look at it this way, I think it does not appear so bad!
If you are worried about this, then you should have enough money (including possible loading if any) to afford an LIC policy (offline or online).
If you don’t, why bother?!
I suggest you pick a private life insurer who has been around for at least 10 years (with no plans to leave – check recent news reports) with a CSR close to, or above the total private average.
Even better, if the insurer has a CSR history consistently higher than thecurrent private average.

It will take you less than 30 minutes to access the IRDA reports, locate the “Individual death claims” table and scan the necessary numbers.
Once you can short‐list 2‐3 insurers, compare the price for a policy (without loading, but inclusive of service tax) using the premium calculator available at their websites.
Choose the cheaper among the two.
Apply immediately. Do not ask anyone else for an opinion.

5. How to Buy a Health Insurance Policy
It is frustrating to see individuals having difficulty in choosing insurance policies – be it life, health or accident insurance. Their minds are cluttered with so many product features (some necessary and others not so) that they keep delaying the purchase.
Here is a step‐by‐step guide to purchasing a health insurance policy. I am no expert on the subject. I am writing this partly from experience (3 claims + handling multiple hospitalizations) and partly from online information accrued over the last few years.
I wrote a version of this post some months back, but did not feel enthused to post. After Jignesh Acharya suggested I write about this in, facebook Asan Ideas for Wealth (AIFW), I would like to give it another shot.
First let us decide on the type of product.
Floater or individual plans?
Choose individual plans for all members if you can afford it. Each persons risk profile is different and there could be multiple hospitalizations in a year. Most insurers fix the premium based on the oldest person in the group. Steer clear of this and get individual plans.
For senior citizens individual plan is mandatory. Get the same for younger members if you can afford it, after all there are tax benefits!
Now let us ask,
What are the essential features of an ideal health insurance policy?
1) No sub‐limits on room rent and ICU.
Sub‐limits can be a pain if the room rent is quite steep (typically in North India and not in South India as learnt at AIFW). If the room rent even for a non‐AC single room is quite high (a relative notion), having no sub‐limits is crucial.
Everything in life is a trade‐off. No sub‐limits implies a higher premium.

If the room‐rents are nominal (several hospitals in Chennai), I would recommend a policy with sub‐limits, typically sold by PSU companies – United India, New India and Oriental Insurance Cos.
Get a policy for a sum insured as high as possible initially, and be sure to increase the sum insured as much as possible each year upon renewal. I have been doing this for the past 9 years. I have individual cover for self, wife, son and mother from United India.
2) No increase in premium if a claim is made (aka loading).
Thankfully IRDA has mandated that there should be no claim‐based loading. See page 83 (last line) here (Nikhil Verma shared this at AIFW)
“The loading on renewals shall be in terms of increase or decrease of premiums offered for the entire portfolio and shall not be based on any individual claim experience”.
According to Nikhil, portfolio here refers to the entire client base. Two individuals of the same age cannot have different premiums based on their claim experience.
Trade off: Higher premium from the start!
Please cite the IRDA ruling and confirm with the insurer, NOT the agent.
Nikhil Verma shared the following policy wordings of L&T insurance
“Based on the experience of the Product, Premium, Terms and Conditions may be revised subject to
prior approval of Insurance Regulatory and Development Authority. Such revision shall be intimated to
you 3 months in advance with an option of renewal under any similar Policy being issued by us.
However, benefits payable shall be subject to the terms contained in such other
Policy. Individual Claims experience loading is not applicable under the Policy.”
ICICI Lombard also has a similar policy as confirmed by Nikhil.
3) No Co‐payment
The insurer should not shift part of the claim expenses to the policy holder by pre‐arrangement. Since no co‐payment implies higher premium, it might be okay to accept co‐payment in the case of very senior citizens.
4) Minimum exclusion period for pre‐existing diseases

The minimum tenure that I have heard of is 2 years. The maximum is 4 years.
This is important for everyone, even those who do not have any diseases at the start of the policy. If a disease is diagnosed say, after 6 policy years, the additional sum insured (if any) will be eligible only after the exclusion period.
Trade off: again price!
5) Lifelong renewability
IRDA has mandated that all insurers should provide lifelong renewability (see pages 78 bottom para and page 79 first para in the above attachment)
So this is not an issue. Best to confirm with the insurer though.
6) Minimal Exclusions
Again obvious but difficult to compare one insurer with another. Read the exclusions list after making a short‐list and check if any hereditary or existing condition is excluded.
Trade off: probably again price.
~~~~~~~~~~~~~~~~~
In my opinion, if a policy is satisfactory in the above six areas, it will make my short‐list.
Now that we have covered the core of the policy, let us look at the window dressing.
Window Dressing
Insurers reward policy holders if no claim arises by either offering a discount on the premium or by increasing the sum insured.
No‐claim bonus:
If the sum insured increases each year by 5% for every claim free year, it will also decrease by the same amount when a claim is made. See page 80 of above attachment. Please confirm with the the insurer.
The premium will typically increase up to 50% of the sum insured and no further.

No‐claim discount:
For each claim‐free year, there is a discount in the premium when the policy is renewed.
Which is better?
I prefer the no‐claim discount. It is simpler. I have seen many people who do not increase the sum insured each year and rely only on the bonus from claim‐free years.
It does not matter which you choose as long as you increase the sum insured by as much as possible each year.
Restore Benefit
What about the restore benefit that an insurer offers?
Read the fine print and write down a typical situation in which the restore benefit will be useful. If you think it is useful, shell out the extra premium. I don’t think much of it though.
Maternity Benefit
Never buy a policy because pregnancy is covered. Dumb! Pay for happy (God willing) non‐recurring visits to the hospital. Remember the tradeoff mentioned above.
Out‐patient Cover, Dental Cover, Spectacles and other goodies
Read the fine print. Are you willing to change doctors that you knew for ages just to get this benefit?
So now how do we shortlist policies?
1. Check out hospitals near your neighbourhood for room rent rates and if they accept cashless. This will help you decide whether you need a policy with no sub‐limits or not. Whether they accept cashless or not, start mobilizing funds for a medical emergency corpus. Never forget that cashless is a privilege that need not be granted.
2. Decide on your budget and on whether you are going to choose a floater policy or individual policy. You can use the premium calculator of any insurer to get an idea.
3. Sub‐limits and budget should help filter out many policies.

4. Choose your poison. I prefer PSUs. No logic behind that. Just a deep‐rooted mis‐trust of privates, regulator or no regulator.
If you like privates, find out who owns the company and how old they are. I suggest choosing a player who is at least 10 years old.
5. A few years back policy comparison portals were user‐friendly. Nowadays they are annoying to use and some do not list certain policies. Better to stay away.
6. How about buying via an intermediary like medimanage? If I want to buy fruit, I would like to pick and choose the fruits I need. I will not leave the choice to the fruit‐seller.
What about their help during claim processing?
Overrated. Rules are simple and laid out clearly. If I don’t or won’t read rules, I don’t deserve insurance.
7. Once you single out 2‐3 insurers, read their policy documents and compare features to single out your future insurer.
8. Now you will need to take a call. Insurance buying is all about taking a risk. It is however a much lower risk than not having any insurance. You need confidence to choose an insurer.
9. Never ask others about their claim experience or ask which is the best policy to buy. That is a one‐way ticket to despair.
All this should be done over one weekend, within about 2‐3 hours. The longer it takes, the more confusing it becomes.

6. Say NO to Packaged Financial Products
We all like solved problems. Right from school, when faced with a question, many of tend to search for an ‘example problem’, so that we know how to proceed. When it comes to personal finance, solved problems or ready‐made financial products packaged for a specific need can be disastrous.
Some examples are the pension plan and child plan offered by insurers and mutual fund houses. Now Cafemutual reports that many more retirement linked mutual funds are on the anvil. During the PPFAS unitholders meet, Rajeev Thakkar mentioned that such plans might replace ELSSS mutual funds.
If that happens, use such plans only until you need tax breaks (I am assuming that returns from such funds would beat PPF after tax). Choose one with the lowest expense ratio since some of these funds could have an insurance component linked to them. So best to choose one without add‐ons.
Want to hear a dumb quote? (from above Cafemutual link)
Sharing the rationale behind offering an insurance cover with the retirement plan, (Dinesh) Khara (CEO
SBI mutual) told Cafemutual that it will help investors to save for retirement along with protecting their
life. “We want to provide one stop solution through our retirement plan. We have observed that many
investors want to save for retirement but due to other preferences like life insurance they delay
investing for the retirement.”
Duh! Most people don’t delay investing for retirement. They just take the easy route and buy dud pension plans offered by insurers (incl SBI life!).
But why? Why should one say no to packaged financial products?
The first step required is a change in mindset
● To quote Subra, “from saving for retirement, people should start investing for retirement” ● Inflation should be recognised as the enemy but also the benchmark for all long‐term goals
and not just retirement. ● The concept of a pension or an annuity should be eradicated from the mindsets of young
investors far away from retirement. Since inflation is the enemy, a constant income in retirement is the very last thing you need in retirement
Next ask the following question:
What is the post‐tax return I am likely to get from these pension plans? For the amount that I can invest each month for retirement, is that return enough to get me a large enough corpus. Large

enough corpus here means, large enough to generate an income that can be increased at a rate equal to the prevailing inflation.
None of the pension plans offered by insurers can do this. Don’t expect the mutual fund plans to be very different.
In any case, you cannot create wealth (have enough for retirement plus a little extra) with any pension plan. SEBI will most likely limit the exposure in these funds and my guess is that they would resemble debt‐oriented balanced funds. Don’t think the gains would be tax free like the insurance product. I think they should be taxed like debt funds (good news for me as my mandatory NPS could also be treated similarly).
A package product sold as a tailor‐made solution is likely to have a lock‐in and exit‐load.
The question to ask is, why buy something off the shelf when you make a better product on your own. Subra has a wonderful name for it: the retirement basket.
Put together an aggressive basket that is filled with a productive and liquid asset: equity. You can use the corpus when you want (early retirement or a dire need), and how you want: generate an inflation‐proof income with part of it, while the rest grows at a decent pace.
The same arguments – liquidity and flexibility – work for long‐term goals like our childrens education. Some people invest in plans in which the money is locked in until the child is 18, forgetting that their child might graduate from school at age 17!
This Buy Nothing Day*, resolve to stay away from all packaged financial products forever.

7. Retirement Planning – A Slide Show
1. Imagine how your monthly income will evolve in the future
The abrupt stoppage in income represents retirement.
2. Now imagine how your monthly expenses will evolve in the future

Obviously expenses do not stop when income stops. So those who do not have the means to account for expenses when income stops, better hope they are dead on or before retirement!
The expenses in the above graph seem to head for the roof. Let us rescale it over our expected lifetime.
In about 15 years after retirement, the monthly expenses, thanks to inflation is higher the last drawn pay!

Meaning, if I had an (imaginary) monthly pension that equals my last drawn pay, I will only be financially independent for about 15 years after retirement. So we need to do a lot better!
The sad truth is actual pensions (be it from a pension plan or employer‐provided annuity) are much, much lower than the last drawn pay. Something like this.
Therefore, for your own sake, eradicate the concept of a ‘pension’ from your minds.
Instead, think: Inflation‐protected income (blue dot within the red circles, below)

To generate this inflation‐protected income, you need a corpus that is about 300 times your current annual expense or about 35‐38 times your annual expenses at the time of retirement (the earliest green dot). As you withdraw more and more from the corpus, it decreases and drops to zero hopefully when you die, and only when you die. Ensuring this, is the third stage in retirement planning.
The second stage is to ensure our investments grow and hits the first green dot, when we retire.

We need to do two things to grow the corpus. 1. Choose a productive, but diversified portfolio; 2. Invest
One cannot choose to invest a constant sum because, the monthly investment to be made immediately will be much larger than monthly expenses. The above graph has a logarithmic y‐axis and hence the lines appear linear.

To ease our burden, we can instead choose to increase out investment each year from now until retirement.
This would imply we must strive to invest as much as spend.

This is easier said than done. Let us have a look at the second graph again
In this picture, the gap between the monthly salary and monthly expenses increases as we approach retirement. If this is how our lives pan out, then we can mange to invest as much as we spend with a little effort and discipline.
Unfortunately,
Our expenses tend to grow in steps as shown in green above. Call it lifestyle creep if you like. If we embrace every new technology that arrives, if we cannot distinguish between our needs and wants, if we succumb to peer pressure and buy what others buy, we will never be able to invest enough.

Meaning, we are sowing the seeds for our future financial doom today.
Lifestyle creep, the desire to spends for today and enjoy when young, resides in all of us. What is needed is a definite boundary: We can spend the way, we wish as long as we can manage to invest as much as we can spend.
Safeguarding that boundary is the first and foremost step of retirement planning.

8. Understanding How Retirement Calculators Work The first brush with a retirement calculator is typically memorable, if not unforgettable(!) for pretty much all investors – including ones who do not take them seriously.
The typical responses would be,
● ‘Why do I need such a huge corpus for retirement?’ ● ‘How do you expect me to invest this high an amount each month?’
Here is how retirement calculators go about calculating the corpus and monthly investment required.
For ease of understanding, I will consider the case of a 55 year old man, 5 years away from retirement. You can input desired values in the attached Excel sheet.
So here goes,
Name: Captain Haddock
Age: 55
Years to retirement: 5 (age 60)
Year in retirement: 5 (He does not expect to see his 65th birthday, thanks to a livelong association with the bottle!)
Current annual expenses: Rs. 5,00,000
Inflation: 10%
Net post‐tax rate of return from the Captains portfolio (equity + debt): 10%
Annual increase in monthly investment: 10%

Expenses in the 1st year of retirement:
Age 60
Expenses: E1 = Rs. 8,05,255
Let us treat this as an independent goal.
Captain Haddock must invest an amount X1 so as to have Rs. 8,05,255 after 5 years with a return of 10% and monthly investments increasing each year by 10%.
X1 = Rs. 8,333 (see image; ignore right most column)
Expenses in the 2nd year of retirement:
Age 61
Expenses: E2 = Rs. 8,85,781
Treating this again as an independent goal, we determine the amount of investment required, X2 (10% return, monthly investment increasing each year by 10%)7
X2 = Rs. 9,167 (see image; ignore right most column)
Similarly,
E3 = 9,74, 359 and X3 = 10,083 (expenses for 3rd year in retirement)
E4 = 10,71,794 and X4 = 11,092 (expenses for 4th year in retirement)

E5 = 11,78,974 and X5 = 12,201 (expenses for 5th year in retirement)
The total initial monthly investment required is,
X1 + X2 + X3 + X4 + X5 = 50, 876 (see image; two red rectangles)
This investment is assumed to increase each year by 10%.
The total corpus requires is,
E1 + E2 + E3 + E4 + E5 = 49, 16,162 (see image; two blue rectangle)
This is the corpus required if is not invested anywhere.
Thus in the above scenario, each year in retirement is treated as an independent goal.
Obviously, we can do better than this.
The corpus is invested so that it earns a net post‐tax return of 10% (for the sake of illustration!), and at the start of each year in retirement, a sum equal to the expected monthly expenses is redeemed. The rest of the corpus is allowed to grow.
For example, at the start of the first year, a sum, E1 = Rs. 8,05,255 is redeemed. At the start of the second year, a sum, E2 = Rs. 8,85,781 is redeemed and so on.
At the end of the 5th year in retirement (the duration assumed in the example), the corpus is reduced to zero (black rectangle in the image).
Using these assumptions, the corpus required is back‐calculated to be Rs. 40,26,275 (orange rectangle in the image).
Notice that the corpus
Has reduced from 49, 16,162 to 40,26,275. Obviously because Captain Haddock now choose to invest the corpus!

9. Generating an inflation‐protected income with a
lump sum
Given a lump sum, how do we invest it in order to create a reliable income stream that is risk‐free and has the ability to keep pace with inflation?
This is the most crucial question that concerns every person who is retired, nearing retirement, or planning for someone else’s retirement (a client or a parent perhaps). Well, at least it ought to be!
The answer concerns everyone since we all have to answer this question at some point in our life.
This post is an offshoot of a discussion with Vignesh Bhaskar in Asan Ideas for Wealth, FB group. Not much information is available on inflation proof post‐retirement investment strategies for the Indian scenario. Let us try and discuss this here from time to time.
Most questions have more than one solution. This is no different. There are many ways of creating a reliable inflation‐protected income stream. In this post, I will discuss only one such way.
The best way to do this is via an illustration.
Let us say that I am a retiree, aged 60, with Rs. 30,000 monthly expenses (involving only the retiree and dependents) or Rs. 3,60,000 per year. Perhaps a touch on the lower side.
I make the following assumptions
● Inflation throughout the retiree lifetime: 8% ● Inflation‐protected income required for: 25 years That is up to 85 years. Perhaps 30 years
would have been better, but let us work with 25. ● Mediclaim: Available. Premium expenses included in the annual expenses. ● Emergency fund: Available. A sum equal to 1 year’s expenses. This is not part of the
retirement corpus.
Now we will need to calculate the corpus required
I have assumed that I pay a flat 10% tax on all investments throughout my lifetime. This is indeed an oversimplification. Unfortunately, we will need to use this, as it will be confusing to consider other possibilities.

A post‐tax return of 8% may seem a bit unrealistic. However, if a retiree in the 10% tax slab opts for fixed deposits offering 9% for senior citizens (current rates), the post‐tax return is about 8%.
Using the annuity calculator, we determine the corpus required
Inputs
Payout required in the first year of retirement: Rs. 3, 60,000
Inflation: 8%
Post‐tax return: 8%
Duration: 25 years
Output
Corpus required: Rs. 90,00000 or Rs. 90 Lakhs
If I have an amount close to this or higher than this, I can relax.
What if I have a corpus less than 90 Lakhs? What should I do?
In order to answer this and the question posed in the opening sentence, let us first try to understand why I need Rs. 90 Lakhs given the other inputs.
If I divide this 90 Lakhs into 25 parts, each part is equal to 3.6 Lakhs. This is just the amount I need for meeting my expenses in the first year of retirement.
● I keep aside one part for meeting the first years expenses. ● I then open 24 fixed deposits. Each maturing one year after the other. That is the first FD will
mature after one year, the second FD after two years … the last FD after 24 years. ● When the 1st FD (investment = 3.6 L) matures, I will get 3.88L enough to meet expenses in the
2nd year of retirement (here expenses have been inflated by 8%) ● When the 2nd FD (investment = 3.6 L) matures, I will get 4.19L enough to meet expenses in
the 3rd year of retirement (here expenses have been inflated by 8%) ● ….. ● ….. ● When the 24th FD (investment = 3.6 L) matures, I will get 22.8 L enough to meet expenses in
the 25th year of retirement (here expenses have been inflated by 8%)

Here is an illustration which explains why I need 90L
Suppose I do not have 90 L. Can I work with a lower corpus and yet mange to generate inflation
protected income?
To a certain extent, it is possible. Of course, as must be obvious, one will need to generate a higher rate of return. This implies taking on some risk … with a part of the corpus.

In order to understand this, we will need to discuss about the so‐called bucket strategy
The best way to do that is to use the above numbers.
Instead of opening 24 FDs, I can achieve the same result in a different.
● I keep away 3.6L for the 1st year. ● I open 4 FD for 3.6L maturing one year after another as mentioned above. ● This will give me inflation‐protected income for the first 5 years in retirement. ● This is called income laddering (also one form of FD laddering)
I invest 18L in an FD that matures in 5 years. Let us call this bucket I
I invest 18L in an FD that matures in 10 years. Let us call this bucket II
I invest 18L in an FD that matures in 15 years. Let us call this bucket III
I invest 18L in an FD that matures in 20 years. Let us call this bucket IV
● Bucket I will mature to 26.44 L. I then split this up into 5 parts, keep one for managing expenses in the 6th year of retirement and use the remaining parts for managing expenses in years 7 to 10 by income laddering.
● Similarly, bucket II will mature to 38.86 L. I then split this up into 5 parts, keep one for managing expenses in the 11th year of retirement and use the remaining parts for managing expenses in years 12 to 15 by income laddering.
● … and so on.
Here is an illustration
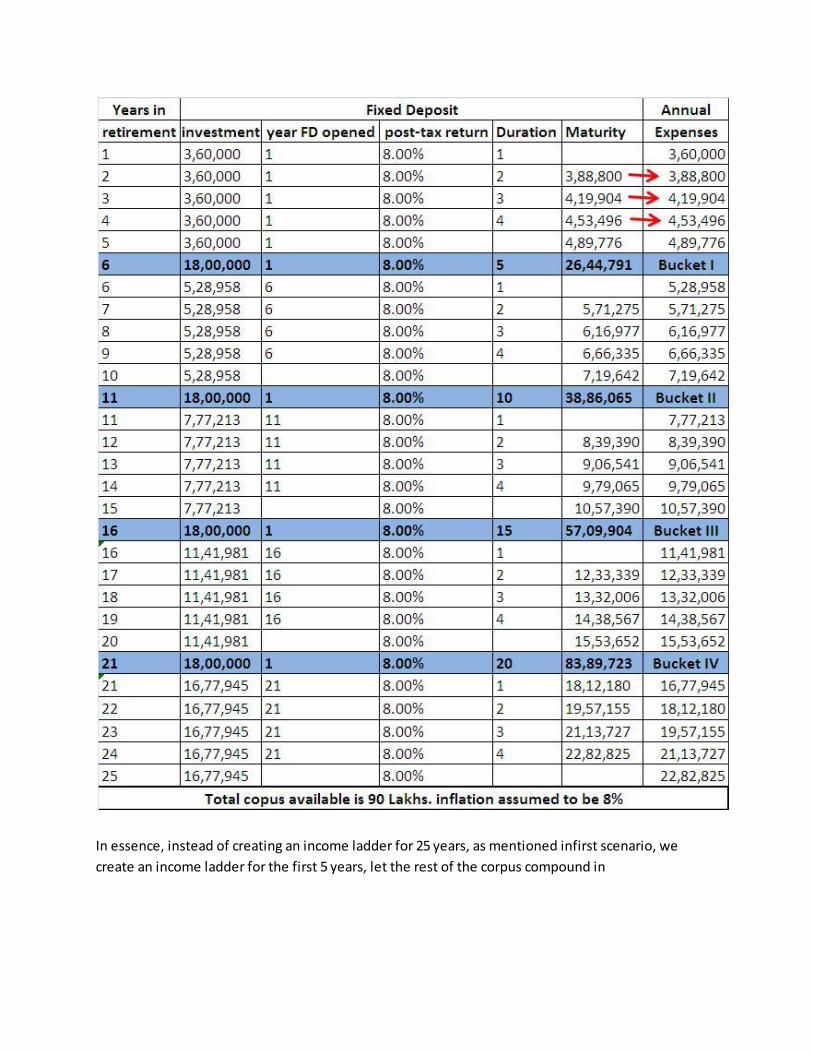
In essence, instead of creating an income ladder for 25 years, as mentioned infirst scenario, we create an income ladder for the first 5 years, let the rest of the corpus compound in four buckets, and create new income ladder every five years.

I have assumed that all the buckets compound with the rate of return (8%). So there is no difference between the first and second scenarios. In effect the totalcorpus needed is the same.
What if, some of the buckets compounded with a higher rate of return?
Can I then not reduce the total corpus required?
Yes, this is indeed possible. Here is a list of different return scenarios. Thanks to Captain Ashok Kumar Anand for pointing out an error in this table. It has now been corrected.
Notice that the returns associated with different buckets have been varied. The first scenario, of course corresponds to the one detailed above.
Notice that as you increase the return in different buckets, preferably the ones which you will need 10, 15 and 20 years later, the corpus required comes down quite sharply from 90 L to 67.5 L

How can I go about achieving this?
Here are some examples
Low risk
Bucket 1 (5Y duration): FDs
Bucket 2 (10Y): Debt ‘income’ funds
Bucket 3 (15Y): Balanced funds (25% equity)
Bucket 4 (20Y): Balanced funds (65% equity)
Medium risk
Bucket 1 (5Y duration): FDs
Bucket 2 (10Y): FDs
Bucket 3 (15Y): Balanced funds (65% equity)
Bucket 4 (20Y): Diversified equity
High risk
Bucket 1 (5Y duration): FDs
Bucket 2 (10Y): Debt ‘income’ funds
Bucket 3 (15Y): Diversified equity
Bucket 4 (20Y): Diversified equity
How to decide what to do?
This is a tough question!
● If I have 90L+ I can afford to choose the no‐risk option (all buckets in FDs) ● If I have ~ 80L I will need to take some risk and invest buckets 3 and 4 in high return,
tax‐efficient instruments

● If I have ~ 70‐75L I will need to take much more risk and invest buckets 2, 3 and 4 in high return, tax‐efficient instruments. Do I have the stomach for this? If I don’t, I will have to
choose a constant annuity from an insurer and my income will have little or no
inflation‐protection ● If have less than 70L, it is too risky to use buckets. I will have to resign myself to the fate of
receiving constant annuity ● Note: This is a ‘all‐in’ strategy. That is once you choose the bucket approach, seeking annuity
later in life may not (or may!) give you a decent pension. So you will to consider your health into the equation (thanks to Subra for pointing this out). Are you fit enough to manage your own corpus?

10. A Step‐By‐Step Guide to Long Term Goal‐Based
Investing – Part I
Here is a step‐by‐step to guide, plus calculator, to begin and track long term goal based‐investing. The calculator will perform the steps detailed below. These steps are applicable for all goals except retirement.
1. Identify the goal, its time‐frame and find out as accurately as possible how much it will cost today (i.e. when you start investing).
● Ball‐park estimates can be dreadfully wrong. If you are saving for your child’s education, seek out a parent whose child is studying a decent degree (UG +PG) in a decent college and get the entire fee detail.
2. Assume a reasonable inflation rate (not the historical average). The higher the safer. 3. Using 1 and 2, determine how much the goal would cost at the time of need. 4. Determine how much you can invest after taking into account: expenses, loans, investment
towards retirement (always the no. 1 goal). 5. Estimate how much this investment amount will increase (or decrease!) in future. If after a
loan payout, you can invest more, take this into account. 6. You can now determine the average rate of return required. Average here refers to the
weighted average of returns from equity and debt instruments. The equity and debt returns themselves represent the expected compounded annualized growth rate (CAGR: a geometric average)
7. Depending on the time frame decide the debt instrument. If your goals if 15 financial years or more away then PPF is a good tax‐free investment. You could also choose a debt fund like an ‘income’ fund. Estimate the post‐tax return (say approx. 8% for PPF and 6% for a debt fund).
8. Decide on appropriate equity exposure. This is how I would do it. o For goals 15 or more years away: 50‐70% o For goals 10 or more: about 40‐50% o For goals 7 years away 20‐30%
This is not just based on my risk appetite. It is based on history.
9. From 6, 7 and 8 the returned from equity needed can be estimated. o Anything more than 12% irrespective of time period is risky. Unless you have a good
understanding of the market such returns it is best not to assume such high returns. o 12% only for time periods well above 10 years. o Anything less than 10 years expect something like 9‐10%
10. If the equity return is too small and if the inflation rate assumed is reasonable you can afford to decrease the monthly investment. If equity return is anything more than 12%, it is best to

lower it, irrespective of duration and perhaps expertise. In this case the investment has to be increased as much as possible.
o Initial monthly investment could be increased and/or o % by which investment will increase annually (from year 2) can be increased and/or o Additional investment a few years down the line can be considered.
11. If you have increased the monthly investment as much as you can and still find the equity returns still unreasonably high, then
o Consider postponing the goal if possible o If postponement is not possible then the goal can only be met partially
12. If goal can only be partially met estimate, with a reasonable equity return, the corpus that can be obtained. The shortfall will have to be met with external funding.
13. Finally you are ready to start investing! Spend no more than a week’s time to get going. Anything more will impact compounding. If you are someone who cannot use commonsense unaided then do consider joining a tutorial (like the 100moneyactions by Jagoinvestor!)
14. So you are on your way. Pat yourself on the back and ensure the investing process is automated if you are indisciplined (that is start a SIP).
15. You can afford to relax for about a year. At the end of each year the returns have to monitored, the portfolio rebalanced (if necessary) and most crucially steps 1‐12 have to be
repeated (including the pat on the back!). o What is rebalancing? Why do it? What are the different ways of doing it? Which is
preferred when? This is a post in itself (much more). Will write about this in part 2. o Assume reasonable rates of return for equity and debt. The sooner you start
the lower your return expectation from equity. The more you can invest the lower your return expectation from equity.
o Statutory warning: Garbage in, garbage out!

11. Long Term Goal‐Based Investing – Part II
This is a sequel to the ‘step‐by‐step guide to long‐term goal‐based investing’ and is meant for those who have started investing for their long‐term goals after,
1. understanding how much to invest 2. understanding how much to expect from each asset class used 3. deciding on an asset allocation (how much in equity, how much in debt etc.)
If you are not clear about the above, I suggest you start with Part I first, make necessary changes with the attached calculator and then read this:
Long‐term goals can be divided into two categories:
● Retirement – where (ideally) it should take the rest of one’s lifetime (could be decades) to spend the corpus while generating an inflation‐protected income
● all other goals! – where the accumulated corpus gets spent from anywhere between an instant(!) to the course of (not more than) a few years. We will call this category B, just for reference.
This distinction is crucial because, for someone who has started investing early for retirement (and typically only for such people), there is no need to significantly reduce equity allocation as retirement approaches (see‘bucket strategy‘ to learn more)
For example, someone who uses an equity (60):debt (40) allocation can continue to use the same allocation all through their life (managed either by themselves or by a trusted professional).
The same is not true for all other long‐term goals. As the goal approaches, the equity allocation must be reduced to zero.
Unfortunately, there is no set formula to do this. You can find answers like, wait 3 years before you need the money and pull out completely or set up an STP to a debt fund among other variations.
I think such set methods can be dangerous. What if the market tanks 5 years before you need the money and you are in 60‐70% equity? What if it tanks tomorrow?
I think all category B goals need active management wrt asset allocation. Here I am not referring to tactical asset allocation, where one changes equity allocation significantly depending on market conditions.

While I am interested in tactical asset allocation strategies (hence the market valuation calculators!), I would think twice before employing it for category B long‐term goals.
I think this is a grey area and the investor must first identify some benchmarks and develop a technique that would suit them. Like many problems in life and in personal finance, there are many solutions to the problem.
So I would like to share with you what I am doing, and what I intend to do for my sons education goal in the hope that it would serve as some food for thought for you. Kindly do not confuse my conviction with expertise.
My son is nearly 5 years old. I started investing for his education goal about 2‐3 months before he was born. I use PPF (in his name) (40%) + mutual funds (in my name) for the goal (60%). If you are interested in knowing more about planning for this goal, see: How to plan for your child’s education
and marriage
When he joined school, I realised that he would turn 18 about 3 months before his 12th standard board exam.
So when I started I had about 17‐18 years for the goal – a long‐term goal by any yardstick.
I had never rebalanced the asset allocation and simply let it grow up until the elections this year.
When India VIX: the stock market volatility index rose sharply just before the elections, I realised how skewed my asset allocation had become (80% equity). So I shifted a big chunk into PPF. Thankfully the PPF limit was enhanced soon so that did not affect my investment allocation too much.
Regret is the number one enemy for goal‐based investing. So there is pointing thinking about, what
if I had not rebalanced? I would have had a bigger corpus today.
Thankfully, I am not worried about that at all. I safeguarded my son’s education corpus and therefore my retirement corpus.
Even after rebalancing, I still have enough to afford a BE/B Tech in a third tier engineering college (lower the tier, higher the fee!!) today. My benchmark for this goal is, what degree can I afford
today?
CAGR is tertiary.

Today the goal is only about 13 years away. That is, long‐term goals do not remain long‐term goals forever. Soon it would be 8 years old and so on.
The risk profile of a 17‐year goal is different from a 13‐year goal, which is different from a 8‐year goal.
Meaning I intend to get conservative wrt my equity holding with time.
Once the goal becomes less than 10 years away, I intend to reduce equity exposure from 60% to 50% and then to 40%. Since the next Lok Sabha election would nearly coincide with this, how the markets behave in the build up to the election will decide the equity allocation.
This means I will have to add a debt mutual fund to the portfolio. I prefer ones with low average portfolio maturity period and low modified duration. Learn more about this: How to Select Debt
Mutual Funds Suitable For Your Financial Goals?
Once the goal becomes 5 years or less away, I hope to reduce equity allocation to about 20‐25% or so. I hope by this time, the total debt corpus should be enough to pay for initial college‐related expenses and perhaps even the entire UG degree.
The corpus for child’s education goal does not get spent in an instant (unlike their marriage goal!). It takes about 3‐4 years to get a UG degree and a couple of more to get a PG degree. In fact some readers prefer to use a staggered goal calculator to explicitly take this into account.
So it is okay to have a small equity exposure even by the time the child enters college!
What matters most to me is how much I invest for this goal and how much I increase investments each
year for this goal – I track both with this monthly tracker.
Where I invest will change as a function of time as mentioned above.
As I write this, I notice that the asset allocation is skewed once again, thanks to the continuation of the rally after the elections. Now I am in two minds. One part of me says, rebalance now, and another part says, wait for the rate cut, that way you can invest another big chunk in PPF, perhaps in April.
Such conflicts are part and parcel of the goal‐planning process and is quite healthy. The answer lies in introspection.
Should I post in Facebook group Asan Ideas for Wealth to get an answer to this dilemma? Hell no! I simply cannot convey the ‘situation and logistics’ involved, both of which are extremely personal. I will end up 10‐15 different possibilities and more confused than I started with. I am better off thinking this one out, take a call and not look back either in relief or regret.

What about professional help? Hell no! I am a control freak. I would like things done in a certain way and will drive the financial planner crazy!
Well, what do you know! As I wrote this, I have decided:
Are you asking an either/or question about personal finance? Try changing it into an ‘and’ question. The solution will present itself. It has, to me. I will rebalance a bit now and bit in April. Peace reigns in the Gaulish village …. for now.
At FB group Asan Ideas of Wealth there is a saying: My Dull and Boring Sips will continue*. Hopefully this post clarifies what the * stands for!

12. How to select mutual fund categories suitable
for your financial goals?
You might be wondering why the title refers to mutual fund ‘categories’. Would it not be more enticing and perhaps more useful had it read, ‘how to select mutual funds suitable for your financial goals’?
Perhaps so. However, I choose to focus on how to select mutual fund categories first, for two reasons
● I am pained to see investors select mutual funds utterly unsuitable for their goals. For example,
o selecting diversified equity mutual funds or ‘balanced’ funds with significant equity component for goals just a few years away.
o investing in volatile debt funds without understanding the risks involved. ● I strongly believe that if an investor knows how to pick the fund category suitable for her
needs, the task of selecting a suitable mutual fund from that category becomes utterly simple, if not obvious.
Mutual fund returns, and associated volatility (fluctuating returns) can be evaluated in a number of ways. Trouble is very few among us take the trouble to understand these although they could be understood quite easily.
When I made a step‐by‐step to select a mutual fund, I used 5 of these risk‐return parameters. I am delighted to note that many investors, with a near‐zero experience in mutual fund investing, have started using these parameters in choosing mutual funds.
In this post, let us discuss how to select a suitable mutual fund category using just one parameter: the standard deviation.
In order to understand what standard deviation is, I will borrow this wonderful analogy by Subra.
You are give two sets of numbers:
● Runs scored by Virendra Shewag in his last 25 tests. ● A similar set for Rahul Dravid
We all know how to determine the average: add up all the scores and divide by the number of such scores.

Once we get the average, we immediately recognise that some scores are higher than the average and some lower than the average.
Now if we wish to know, between Dravid and Shewag, whose scores deviate morefrom the average, we will need to calculate the deviation of each score wrt the average and take the average of the deviations.
This is the standard deviation. It is defined such that it is always positive so that we are not confused (assuming we are not thus far!)
Even without any data, we will recognise that Shewag is just about is capable of scoring anything from a duck to a triple hundred. Dravid on the other hand is a lot more sedate, and we can typically expect at least 30‐40 runs irrespective of the conditions.
Therefore, Dravid’s scores are expected to deviate very little from the average while Shewag’s scores are expected to deviate substantially.
So we say, Dravid’s batting average has lower standard deviation than Shewag’s.
Such is the power of this analogy that it drives home the point without using any data!
Before we use the standard deviation to select a suitable fund category, let us recognise that mutual funds can be grouped together in several ways. There is no right or wrong way and each fund portal (Value Research, Morning Star, Money Control etc.) have their own categorisation scheme.
In this post, I will use the scheme categorization of VR online.
The category standard deviation, along with the typical asset allocation and maturity of debt paper (for debt funds) is listed below for some of the categories define by VR online.
Category standard deviation refers to the average standard deviation in a particular category.
Notice that returns are missing from this table.

● As you go down the table, the equity component increases. Obviously, if a fund has more equity allocation, higher would be the fluctuations in return and therefore higher the category standard deviation.
● The debt income category has different kind of debt funds (dynamic bond funds, diversified debt funds, that is funds that invest in paper that matures over different periods etc.). So it is not an exclusive group. This is why there is a huge variation in standard deviation and average maturity.
● The red arrows point to the evolution in standard deviation. The average standard deviation of one category is close to the minimum standard deviation of the next category. For the above‐mentioned reason, this does not apply to income funds.
● I have not included gilt funds as they are specialised funds that resemble equity sector funds – not for everybody.
● Let us consider the first four entries that have no equity. Obviously, these are pure debt funds.
● Notice the average age at which the category debt holdings mature. A debt paper is a simple agreement between two parties: ‘I will pay an amount Y. You hold it for n days and pay me an
interest r’. Of course, this is an over‐simplification but should suffice for our purpose. ● Liquid debt funds invest in short‐term debt paper ranging over a couple of months
while income debt funds invest in debt paper that can have an age of several years. ● It is clear that, higher the age of the maturity, higher is the standard deviation and therefore
higher the fluctuations in returns. Of course, this also means higher returns …. typically!
Let us get to the business at hand, with a few examples.
● I have a lump sum that I wish to invest for a few months. Which fund should I choose?
I understand that equity will be too risky for just a few months. So let me eliminate all fund categories with equity.

This leaves me with the top four categories in the table.
If I choose a debt income fund that matches with the category average standard deviation of 3.71%,
My returns will typically (68% probability!!) range from
X ‐3.71% to X+3.71% before taxes!
Can I afford such a swing in returns?
If the answer is no, we can move on and choose something with lower standard deviation. What if the answer is yes?!
What if I say, I don’t mind this fluctuation?
Then you will have to worry about what X is, or what it can be.
Let us now introduce a simple but reliable rule of thumb.
● If the return(X) is greater than the corresponding standard deviation (3.70%), there is little or no chance of losing the capital invested.
● If the return is lesser than the corresponding standard deviation, chances of losing the capital invested are high.
If we adopt this thumb rule, the next question is, what is the kind of returns (X) one can expect from a debt income fund over a few months?
Well, for an income fund X should, under normal circumstances, be higher than the standard deviation.
However, as most of us realised in July this year, debts market can crash too (has happened many a time before). That is the NAV of a debt fund can sharply decrease in a day or over the course of a few weeks.
If this occurs, all debts funds are likely to be affected. Some will bounce back after a few days, some after a few weeks, and some after a few months.
If I want to invest for only a few months in a debt income fund, and if bonds crash in the period, will my fund recover?
Chances are, it will not.

I would like to use the following rule of thumb when it comes to loss of capital risk associated with debt funds.
● Longer the average maturity period, higher the corresponding standard deviation and therefore longer the time it would take for the debt fund to recover.
● If Dravid and Shewag lose form at the same time, who is likely to spring back faster? The batsman who can scratch around at the crease, or someone whose instinct is to whack every ball?
● Higher the standard deviation, bigger would be fall in the event of a crash and therefore longer it would take the debt fund to recover.
Funds with typical maturity period of more than 1 year are likely to take about 6 months to recover from a crash. I have kept track of some income funds and many are yet to recover. Unfortunately,
this includes my NPS subscriptions as well
● Debt income funds are well suited only for long term goals (more than 5 years at
least). Longer the period, greater is the tax advantage.
What about the other categories? How soon would they recover?
Liquid funds over a few days. Short term funds over a couple of months and ulta‐short term funds a little earlier that that.
● Therefore, for investment durations of just 1‐2 years stick with
Short‐term/Ultra‐short‐term/liquid funds. Fixed maturity plans (FMP) are also a good option
for such durations.
What about an investment duration of 5 years?
I will choose debt funds with maturity of 1 year or less.
Why? For durations less than or equal to 5 years, the power of compounding is not that important. Therefore inflation is not that important. So I will prefer to safeguard the capital, choose debt funds of low risk.
Why not RDs or Bank FDs? If the goal is crucial and I know exactly how much I need, I will use these even if I fall in the 30% slab. If the goal is less important, then low‐risk debts offer a tax advantage.

Invest durations between 5‐10 years
Debt income funds that invest in debt paper of short duration with low standard deviation.
Debt‐oriented Hybrid‐funds with about 20‐30% equity . Debt portfolio should have low maturity duration. Equity folio should have a good amount of large cap stocks. Again, both factors lead to low standard deviation (relatively!).
Invest durations above 10 years
Asset allocation should be done considering the risk profile of the goal, as beating inflation is major goal.
Now standard deviation must be high! High volatility is important for beating inflation.
Tough to choose just one fund. Perhaps if someone monitors the fund regularly, they can pull it off with a fund like HDFC Balanced. However, even for 10‐year duration I would be wary of using a balanced fund like HDFC Prudence that has a high standard deviation – comparable to many large‐cap equity funds!
The point of this post is to share with you how I use standard deviation to select fund categories for my financial goals.
Am I being too conservative? Am I being too risk‐averse and missing out on returns?
The way I see it, for short term goals, inflation is not a major issue. So I will not risk losing capital by investing in a fund with large standard deviation.
If the asset class crashes, there will not be enough time to recover back.
For a long term goal, inflation IS the issue. So one must embrace high standard deviation, bear with short‐term loss of capital and invest in mutual funds with high standard deviation. That is, those that has a good amount of equity.
I say, standard deviation is key to select mutual fund categories suitable for financial goals.
Would you agree?

13. How to select an equity mutual fund
‐preamble
Over the next few days, I would like to do a series on “How to select an equity mutual fund”. This is the long overdue update to the step by step guide to mutual fund selection.
I write this primarily because my understanding about mutual funds has grown significantly since I wrote the pdf guide. I have already shared this with you in the form of analysis and calculators. Would like to consolidate it in terms of specific steps.
In this post, I would like to start with a preamble which will define the objectives and the framework of what will follow.
The central objective is quite simple: To enable anyone to select a mutual fund in about 20‐30 minutes. This time will reduce significantly once the investor gets a better grip on the method.
There are however a few necessary prerequisites to make the selection process easier.
The following and ensuing posts are valid only for long‐term goals that is 10 years or more away.
1) A financial goal is mandatory. Questions like, “why am I investing?” and “when do I need the money?” should be answered.
2) What is the proposed asset allocation? For a given goal and duration, how much will the exposure in the equity fund that you would like to select be? This is crucial because many people make the mistake of investing in 100% equity for long‐term goals. The equity:debt (fixed income) allocation is mandatory.
3) What is the expected return from the equity mutual fund for the investment duration? Personally I will use 10% for calculating the investment amount and expect about 12%. Do not expect more than 15%.
4) Expected return from total portfolio = (expected return from equity) x (equity allocation) + (expected post‐tax return from debt) x(debt allocation)
5) Use the expected portfolio return in a standard goal planner with about 10% inflation for all goals expected retirement. For retirement use a minimum of 8% inflation. With other inputs found in the goal planner, you should be able to determine the necessary monthly investment. Even if you are
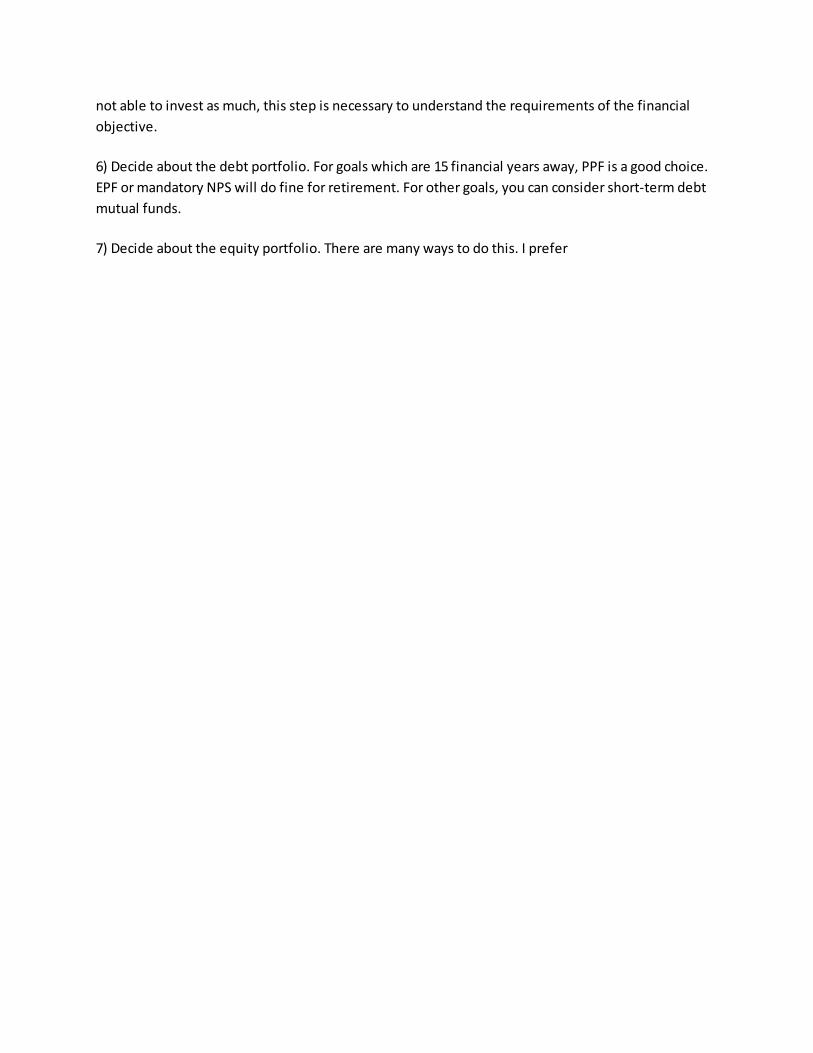
not able to invest as much, this step is necessary to understand the requirements of the financial objective.
6) Decide about the debt portfolio. For goals which are 15 financial years away, PPF is a good choice. EPF or mandatory NPS will do fine for retirement. For other goals, you can consider short‐term debt mutual funds.
7) Decide about the equity portfolio. There are many ways to do this. I prefer minimalist portfolios
I prefer 60% in large cap and 40% in mid and small caps. So one large cap fund and one mid and small cap fund is all that you need. You can also opt for a single large and mid‐cap fund.
A single equity‐oriented balanced fund will also work fine. In which case you need to take care of overall equity:debt asset allocation.
Once you have decided how you are going to construct your portfolio and what mutual fund categories you are going to choose, you are all set to pick a fund to invest in.
Those who have already started investing but have not performed any of the above steps, can do so now. Better late than never.
There are many ways to select a mutual fund. I would like to present three ways to do it. I do not qualitatively analyze a fund too much. If the fund is good, I believe it should show up in the NAV movement. So for the most part I treat a fund as a black box. However, I ensure that is label on the box is the one I want.
Here are the methods to be discussed. Regular readers will understand where I am going with this.
Method 1: This is identical to mutual fund guide published earlier. Short‐list funds based on consistent performance and then consider risk‐return metrics for last 3 years.
Method 2: Short‐list funds based on consistent performance and then consider risk‐return metrics for longer durations either based on investment duration or for each year.
Method 3: Short‐list funds based on consistent performance and then consider downside protection and or consistent long‐term rolling returns.
You can save this post as a pdf document with the button below. To be continued …..

14. How to select an equity mutual fund – Creating
a shortlist
Any selection process should have three components: (a) an objective; (b) a method to create a shortlist and (c) a method to finalize with the shortlist.
Yesterday we discussed the objective. Today we shall consider how to create a shortlist from which an equity mutual fund can be selected.
If you have not read yesterday’s post, I strongly urge you to do so before reading this any further:
How to select an equity mutual fund ‐preamble
Creating a shortlist
Note: The description of the shortlist may appear long. In practice, you should be able to create one in under 150 minutes on your first attempt and in under 10 minutes later. So please hang on.
Creating a shortlist is as important as it is difficult. The criterion used to create one is arbitrarily chosen and is based on personal comfort. It can neither be too broad (meaning too many funds to analyze deeper), nor too narrow (if only a few funds satisfy us, then they are likely to fall out of favor soon). F0r example, the rating of a five‐star fund can only go down!
We need to cast a reasonably broad net to create the shortlist. Peer comparison is a necessary evil to create the shortlist. I prefer to abandon all peer comparison once the shortlist is prepared.
The primary reason for that is simple: before selecting a fund, we are analysts. After selection, we are investors. Analyst and investors will have very different numbers (returns/risk metrics) to stare at when the asset class is volatile.
Once I invest, I take decisions based on the health of my portfolio tagged to a specific goal. Many make the mistake of worrying about peer comparison, view their holdings like analysts instead of viewing it as investors.
I will discuss two methods of creating this shortlist: with value research online and with Morning Star. It is easy to extend this method to other portals.
Shortlisting with Value Research Online

This is the method discussed in the previous version: Step‐by‐Step Guide to Selecting a Mutual Fund
Since the time it was written, VR online made a crucial change: It removed the “last seven years trailing return” entry from the category listing.
Trailing return simply refers to the CAGR for the last 1/3/5/7/10 (etc.) years at any given point in time. If I am not wrong, VR updates this each month.
Removal of the 7Y return has made the shortlist a bit longer.
Let us know go through this process, step by step. Click on the images to enlarge them if you wish.
1) Go to https://www.valueresearchonline.com/
Skip the annoying ad, go to the main page and scroll down until you see ‘research tools‘.
We will be working with the ‘Fund selector’
2) Leave the fund house entry alone.
In the fund category entry (left image bel0w), uncheck whatever is checked and check “Equity: large cap” (we assume that is the category we are looking to invest in. The process for other equity categories is the same).
In the exclude entry (right image below),
a) check plans suspended for sales

b) check direct plans (adding them will only clutter the process. The folios and relative performance for regular and direct funds is the same).
c) check closed‐ended
Scroll down and uncheck 3 star, 2 star, 1 star and unrated (optional).
When ready, click “Get Data”.
3) You will be taken to this sheet. Click on returns.

4) You will then be taken here.
We will now discuss two methods of shortlisting consistent performers.
A) Anchor the search with 5‐year returns. Click on 5‐years returns (red box above) once or twice until the fund are arranged in ascending order. Then you need to decide the cut‐off rank. Suppose we select funds which were ranked in the top 25 over last 3 years, 5 years and 10 years, we will get something like this (partial list).

Invariably we have shortlisted many (not all) 5‐star or 4‐star funds which are less than 10 years old. If you are fine with this, then you can proceed.
By removing the 7‐year entry, VR forces us to rely on its star rating more. Who are they to tell us (at least me) that it is enough to review only 5‐year and 3‐year histories?
I prefer a fund which has consistently been in the top 25 for 3, 5 and 10‐year periods. So I would like to click on the 10‐year returns until they are arranged in ascending order and then create the short list.
Top 25 might sound too broad. Narrower the net, higher the expectation and sooner the fund is likely to disappoint.
As far as I am concerned, I will not repeat this exercise unless the selected fund is a laggard in my folio after giving it at least 3 years to perform. Laggards are not identified by peer comparison (drop in star rating etc.) but with respect to net XIRR of the equity portfolio. See more here: How to review
a mutual fund portfolio
B) Anchor the search with 10‐year returns. Click on 10‐years returns once or twice until the fund are arranged in ascending order. Then you need to decide the cut‐off rank. Suppose we select funds which were ranked in the top 25 over last 3 years, 5 years and 10 years, we will get something like this (partial list). Funds marked in red have done well in the past but not in the recent future relatively.
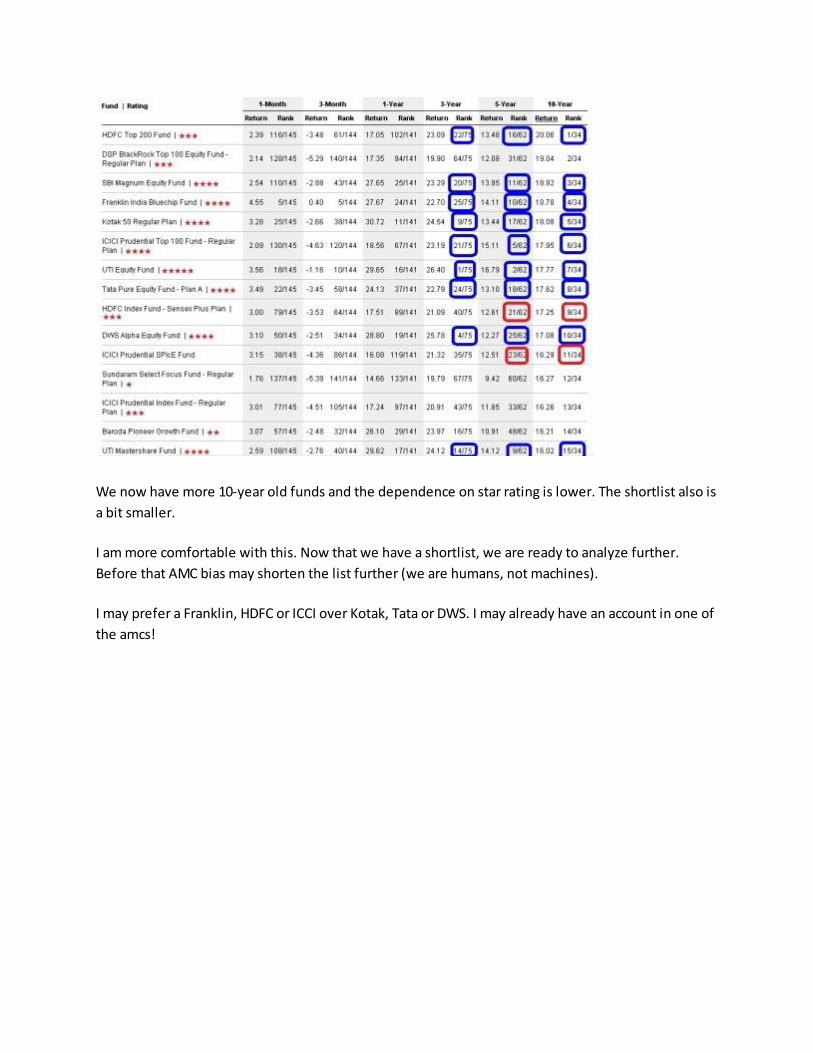
We now have more 10‐year old funds and the dependence on star rating is lower. The shortlist also is a bit smaller.
I am more comfortable with this. Now that we have a shortlist, we are ready to analyze further. Before that AMC bias may shorten the list further (we are humans, not machines).
I may prefer a Franklin, HDFC or ICCI over Kotak, Tata or DWS. I may already have an account in one of the amcs!
Had we shortlisted only 4 and 5‐star funds, we will end up with 19 funds. This way (with 5‐year or
10‐year anchoring) we only have 9‐10 to choose from.
We will take up further analysis in the next post on this series. I would now like to discuss a faster way to shortlist with Morning Star.
Shortlisting with Morning Star Screener
Morning Star India has a nice screener which can automate the above shortlisting and reduce it down to minutes.

However, it has only large cap and mid/small cap categories. Unlike Value Research which distinguishes among large cap, large and mid‐cap, mid and small‐cap and multi‐cap.
This can present a considerable problem unless we look at the folio carefully. When I tried out a large cap short‐list I end up with many large and mid‐cap funds. If you can handle this, this is a smart way to create a shortlist.
1) Go to
http://www.morningstar.in/tools/mutual‐fund‐screener.aspx
First make the following choices. The total results will vary according to the choices. If it is zero, it means you will have to change the choices.
Inc stands for dividend option and Acc stands for growth.
Scroll down to further make the following choices

First choose 3‐year, 5‐year and 10‐year returns above the category average.
As you set the option for each year, have an eye on the total results at the top. It should not become zero. If it does, you will have to change or relax your options.
With the above choices, 15 funds to choose from.
Play around with the morning star risk rating ( low, below average, average, above average, high) and
3‐year standard deviation to see if you can reduce the shortlist.
Low –> 0 results
● Avg (below average) –> 3 results
Avg –> 6 results
‐Avg and Avg –9 results (I like this)
You can choose what you like.
Further modifications can be done with the so‐called Morning Star Syle Box.

For large cap funds choose:
Large and Growth (stocks with substantial earning, high PE, high PB)
A good 14 out of the 15 shortlisted funds belong to this category. One to large and a blend of value (underpriced stocks with low PE and low PB) and growth.
If you don’t understand this, you can ignore the style box for a start or read more about the difference between growth and value stocks or about the morning star style box.
Don’t worry about AUM of a large cap fund. For a mid and small cap fund, it is not a terrible idea to choose the fund with smallest AUM after further analysis.
Mid and small cap funds with large AUM (say more than 5000 Crores) tend to have more large cap stocks for liquidity.
Reducing the expense ratio even by one step makes the total results count go to zero!
Finally, hit search to get this shortlist.

Do not jump to conclusions that the shortlist has only 4/5‐star funds and that could have been the lone criterion.
If you tried that you will have 43 funds to contend with instead of just 14.
Out of this 14, you will need to weed out the large and mid‐cap funds in consultation with Value Research if you are not looking for one!
We are now ready to analyze further. This is equally simple. I will take that up in a different post.
Was this not easy? Anybody with a little common sense can do this.
DIY and go direct. Do not trust anyone who says that mutual fund selection is hard. They say so because they have a business to run.
DIY implies doing everything yourself. Not making a short listing and asking others. If you don’t have confidence (time is not the issue), get yourself a fee‐only financial planner who will suggest direct mutual fund plans.

15. How to select an equity mutual fund – Making
a Choice!
In this third and final part on “how to select an equity mutual fund”, we will consider different ways in which one ‘make a choice’ from a shortlist.
Yes, there are several ways to choose from a shortlist, just like there are several ways to make a shortlist. You will have to take your pick. It is easy to do so. All you need to do is to try and sell your pick to your rational side. That is you must be able to justify your method to yourself. Forget about what others think.
Before we proceed, a suggestion to read the first two stages in the selection process, if you have not done so:
(1) The objective or the preamble for fund selection
(2) How to create a shortlist
Note: The title of this post is ‘making a choice’ and not finding the best fund from the shortlist. This means that no matter how hard you try to shorten your shortlist, you will not be able to do so (if you objectively go about it).
So from a 10‐15 fund shortlist, you will end with maybe a 2‐5 fund shortlist. You will have to pick one from this. There is no other way of doing this.
This is a long post. A total of 7 methods are listed. Not all methods are (or can be) discussed in detail. Please consult the links provided for more information.
Method 1: Just pick one from the shortlist!
Method 2: Using short‐term risk‐return metrics
Method 3: Using long‐term risk‐return metrics
A. With Morningstar India
B. With the freefincal risk‐return analyzer
Method 4: Using downside capture ratios

A. With Morningstar India
B. With the freefincal risk‐return analyzer
Method 5: With rolling returns
Method 6: With information ratio
Method 7: With Ulcer index
I urge you read/consider all the methods, and develop your own. A combination of methods can also be considered.
Method 1: Just pick one from the shortlist!
By the time you are finished with this post, chances are that you might agree that doing an “Eeny, meeny, miny, moe” from the shortlist is a pretty good method. Why not?
Think about it, you have made a shortlist based on consistent performers based on 3, 5 and 10‐year returns. So why not pick one from this list? The risk associated with the returns obtained will be neglected, but this method is any day better than what many people do: ask for best fund names or ask other people to pick from their shortlist.
If the following appears a bit complicated to you, adopt method 1, but do not fail to learn “how to
review your mutual fund portfolio“.
If so, why can’t I use star ratings as a guide? From my experience, people who start using star ratings do not know when to stop. They would compare peers without checking the actual performance of their portfolio. I can never feel comfortable with such a strategy. Personal finance is an individual race.
Not convinced? Ty this: The Trouble With Mutual Fund Star Ratings

Method 2: Using short‐term risk‐return metrics
This is the method outlined in the step‐by‐step fund selection guide
There are two issues that I did not realize/know when I wrote the above.
A. The risk‐return metrics listed at Value research are over only 3 or 5 years only. They have not bothered to state this, nor replied to my question reg. this. My guess after hours of staring at their listing pages is that the metrics are over the last 3 years.
B. See below (perhaps not immediately!)
When we make a shortlist considering 3, 5 and 10‐year returns, should we only consider 3 years risk‐return metrics?
Perhaps not. It is not a terrible choice, but I think we can do better.
For the record, let us get through with it. It is anyway a good starting point for getting comfortable about these metrics. To be frank, I am delighted that many readers have done exactly that.
Let us look at some definitions first:
Alpha It is a measure how much it has outperformed its benchmark index. Higher (positive!) the alpha the better. Beta Measure of volatility. Beta of 1.3 means fund is 30% more volatile than the market as a whole. So low beta is important for

Beta Measure of volatility. Beta of 1.3 means fund is 30% more volatile than the market as a whole. So low beta is important for risk‐averse investors
Standard Deviation: Higher the std. dev. higher the fluctuations in returns.
Sharpe Ratio: Measure of return wrt to risk. A good fund gets returns without too much risk and will have higher Sharpe ratio A risk‐averse investor will look for reasonable returns and with low fluctuations in return. So they will look for reasonably high alpha, low beta, low R‐squared, low std.
Sortino ratio: The Sharpe ratio considers both positive and negative excess returns (wrt risk‐free rate). The Sortino ratio considers only the negative excess returns while calculating the standard deviation. Higher the better.
If you are looking for an easy‐to‐understand visual aid for understanding these metrics, try this: Visualizing Mutual Fund Volatility Measures
What now?
Look for funds with reasonably high alpha, low beta, low std‐ dev, high Sharpe ratio and high
Sortino ratio.
Hang on.
Higher the beta, higher the standard deviation (typically!)
Higher the alpha, higher the Sharpe ratio (typically!!)
Higher the Sharpe ratio, higher the Sortino ratio (typically!!!)
So all we need to do is to look for fund wth reasonably
high alpha, and low beta
I would prefer to state this the other way:
1) Look for low beta
2) choose funds with highest alpha among the low‐beta group.
Pick one of those funds. You done.

I have removed a measure called R‐squared (tells you how closely performance is related to the index. Higher the value closer will the performance. All large cap funds will have high R‐square). I feel that this is too useful.
So let us now return to the shortlist.
Recall the procedure for getting the above return screen at Value Research. You will find the steps here
No need to do that right now. Follow this link in another browser tab to get this screen.
https://www.valueresearchonline.com/funds/fundSelector/default.asp?cat=8&exc=susp%2Cdir%2Cclose%2CnotRated

You have already made the shortlist (funds corresponding to blue rectangles)
Now click on Risk‐stats
You would need to prepare this kind of table. You can do so manually. Over the years, many readers have sent me their excel files in which they have made this process simpler.
You can download the excel file from VR and extract data for the funds in your shortlist.
If you know a bit of excel, you can select the tabulated shortlist, go to data and click on filiter. That will produce the encircled sorting menu as shown above. If you don’t know how to do this or use Excel, do it with pen and paper. No big deal!
You can then sort the beta column from smallest to largest. What has been described above will take only 10 mins.

Now notice the yellow selection. Low beta with reasonably high alpha.
We have our winners! Pick one fund you are comfortable with. Done!
Wait a minute! What about Franklin Blue Chip and HDFC Top 200! Why did they not make the cut?
Simply because they have not done well in the last three years and we are only looking at last three‐year metrics!
Method 3: Using long‐term risk‐return metrics
What if you wanted to consider risk‐return metrics over longer durations? After all, we considered long‐term returns to make the short‐list.
Makes sense. There are two ways to accomplish.
A. With Morningstar India
There are two issues here. (1) there is no risk‐return listing for all funds like VRonline and (2) all ratios are calculated with BSE 100. Not a bid
(1) there is no risk‐return listing for all funds like VRonline. So you need to go to each fund page.
(2) all ratios are calculated with BSE 100. Perhaps not a problem for pure large cap funds. Will not use for other categories.
See here for a sample. This is not a screenshot. I have only included stuff that I need!
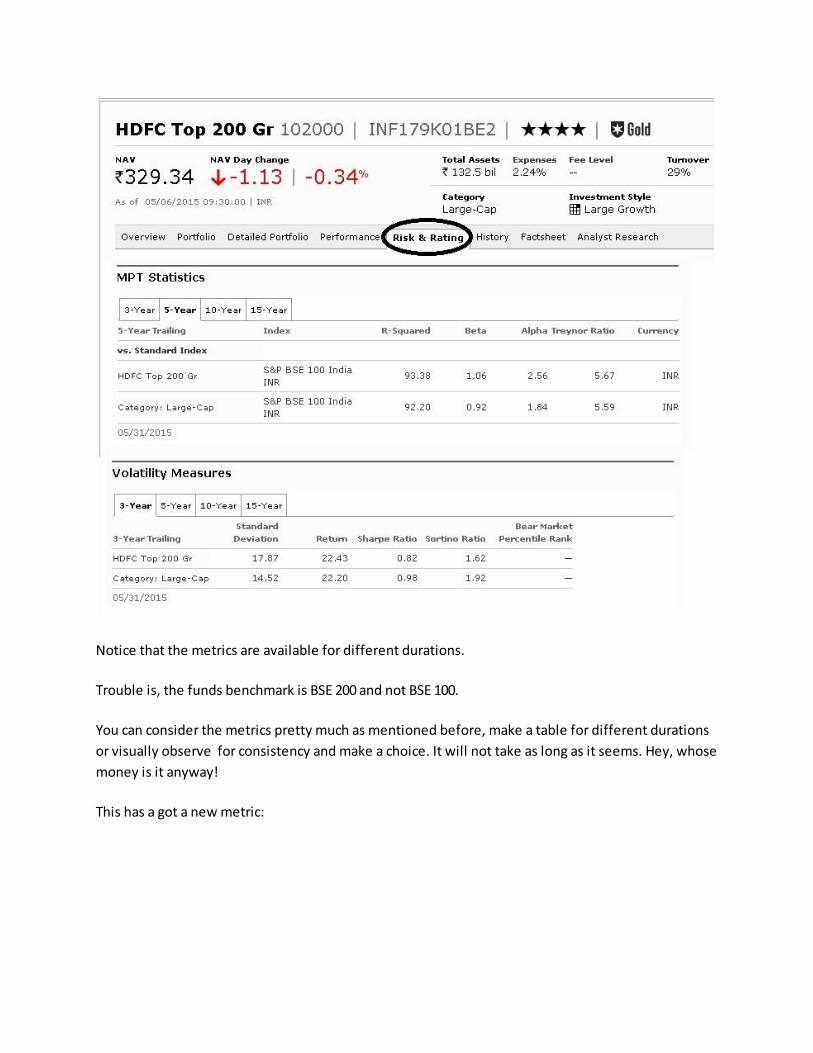
Notice that the metrics are available for different durations.
Trouble is, the funds benchmark is BSE 200 and not BSE 100.
You can consider the metrics pretty much as mentioned before, make a table for different durations or visually observe for consistency and make a choice. It will not take as long as it seems. Hey, whose money is it anyway!
This has a got a new metric:
Treynor Ratio is known as the reward to volatility ratio. While the Sharpe ratio is the excess return (wrt risk free rate) divided by standard deviation, Treynor ratio is the excess return divided by beta. This is calculated for both the fund and the benchmark for which beta is assumed to be 1.

Higher the Treynor ratio, better is the performance (higher returns + low volatility wrt benchmark)
B. With the freefincal risk‐return analyzer
If you do not like the fact that morningstar uses the same benchmark for all funds, you can consider my risk‐return analyzer
You can then choose from Nifty, CNX 100, CNX Mid Cap, CNX 500, Sensex, BSE Small Cap, Mid Cap, BSE 100,200, 50.
Consider 1 to 9‐year durations. Calculate lump sum and SIP returns for each duration
Evaluate the risk‐return score with 13 metrics.
You can also consider the Year on Year Mutual Fund Risk Return Analyzer for reviewing yearly performance.
Method 4: Using downside capture ratios
This is the method I advocate in the investor workshops.
The main advantage of this model is that it does not depend on modern portfolio theory (MPT) ratios which are applicable only for normal or Gaussian distributions. It is quite possible (in fact easy to pve)that they may not work with mutual funds and stocks! This means all star ratings are on shaky ground!!
People use MPT metrics because alternatives are tough to evaluate (more on this soon).
Upside capture.
For a given period, how much of the benchmarks gains has the fund captured? Higher the better.
Downside capture.
For a given period, how much of the benchmarks losses has the fund captured? Lower the better.
From what I have seen, consistent downside protection is the source of alpha.
I have written about this in detail earlier:

Understanding Upside and Downside Capture ratios
Simplify Mutual Fund Analysis with Upside/Downside Capture Ratios
Again two methods
A. With Morningstar India
Morningstar again uses only BSE 100 for calculation. However, this is easy to use and is perfect for large cap funds and maybe a bit too strict for mid and small‐cap funds.
B. With the freefincal risk‐return analyzer
Again trouble with morningstar is it uses the same benchmark for all funds. You can use my risk‐return analyzer which has a separate upside downside page. The evaluation strategy is different from what morning star uses but the essence is the same.
I will post an exclusive tool to calculate this better. See some screenshots of this are available here

Method 5: With freefincal rolling returns calculator
Ro0lling returns offer a smart and easy to understand way to evaluate consistency in performance.
Suppose you want to evaluate fund performance from Jan 1st 2000 onwards.
You calculate 3‐year CAGR* from 1s Jan 200 to Dec. 31st 2002. Then you shift the period by a day (roll over) and calculate 3‐year CAGR* from 2ns Jan 200 to 1st Jan. 2003 and so on. Plot them together and stare at it.
● for both fund and its benchmark
This idea is to look for consistent long‐term outperformance.
See this post for more details:
Mutual Fund Rolling Returns Analysis: Franklin India Blue Chip Fund
and use this automated sheet for calculations:
Mutual Fund Rolling Returns Calculator
Method 6: With information ratio
Information is defined as the average excess return of the fund wrt benchmark for a given period, divided by the standard deviation of the excess return.
Consistently high information ratio is a good indicator of performance. Dr. Uma Shashikant says,
“Information ratio is my key quantitative indicator”.
See this post for more details (calculator in the same post):
Mutual Fund Analysis with the Information Ratio
Method 7: With Ulcer index
Ulcer index is another downside protection indicator. It penalizes funds more for lapses in downside protection than other metrics. This is my personal favourite (thanks To Ramesh Mangal)

See this post for more details:
Mutual Fund Analysis With the Ulcer Index
and use this for calculations:
risk‐return analyzer which has a separate ulcer index page.
Was I not right? Doesn’t “Eeny, meeny, miny, moe” from the shortlist seem like a pretty good method now!!
Would you like a suggestion?
For large‐cap funds:
Use: Method 4 A : Using downside capture ratios with morning star data
For mid and small‐cap funds
Use: Method 4 B : Using the new downside capture ratio calculator(releasing in a couple of days)
Alternatively
Use: Method 7: With Ulcer index
or a combination of
Method 5: With freefincal rolling returns calculator and
Method 7: With Ulcer index

16. How to Select Debt Mutual Funds Suitable For
Your Financial Goals?
Since the time my step‐by‐step guide to selecting (Equity) mutual funds become popular, I have been receiving requests to publish a similar guide for debt mutual funds.
Well begun is half‐done. If an investor can confidently select categories suitable for their financial goals, short‐listing a set of funds from that category is that much easier. This is especially true for debt funds, since choosing one is typically tougher than equity funds.
Although I intended this post to be a companion piece to the more general, How to select mutual
fund categories suitable for your financial goals, as I wrote it, enough aspects have been included to consider this as a step‐by‐step selection guide for debt funds.
Interest rates and bond prices have a fascinating relationship. Therefore, besides the usual risk‐return parameters of alpha, beta, standard deviation, Sharpe ratio, Sortino ratio etc used for equity mutual funds, quantities like yield, yield to maturity, average portfolio duration, modified duration etc. are involved in debt fund selection/evaluation.
This makes the selection process appear complicated. However, this can be simplified by focussing on 1/2 parameters to first narrow down the debt fund category and then short‐list funds from that category.
Thanks to the recent crash in bond prices, a visual analysis is possible.
On July 16th 2013, the 10‐year G‐sec rate increased by 6.69% while the 1‐year G‐sec rate increased by a whopping 14.8%. Source: www.investing.com
While the steps taken by RBI to curb rupee‐depreciation was the main reason for this, other events played a part too. See here for a decent report.
The value of a bond has an inverse relationship with interest rate. If interest rates increase, the value of a bond has to fall in order to match current yields. Therefore, the NAV of a bond fund holding such bonds will decrease.
Since both the 1Y and 10Y rate jumped up sharply, pretty much bonds of all durations were affected, resulting in a fall in NAV of almost all types of funds.

Even liquid and ultra –short term funds, with maturity durations much less than a year, were affected, because banks pulled out huge amounts of money stashed in such funds.
Since this event occurred less than a year ago, the default option (1Y) in the performance tab of each debt fund page at Value Research Online shows how funds behaved during this period.
This offers a simple way to understand how different types of debt funds react to interest rate movements, aka interest rate risk – one type of risk that debt funds are subject to.
First, let me quote two definitions:
Modified Duration : Measured in years, modified duration is a measurement of a bond’s sensitivity to
movements in interest rates. For example, a bond with a modified duration of 5.2 years can be
expected to undergo a 5.2% movement in price for each 1% movement in interest rates. The longer the
modified duration (in years), the more sensitive a bond’s price to changes in interest
rates.Source: Invesco Perpetual
Average Maturity: The average maturity of the portfolio determines the time involved in maturing of
all the debt assets in the portfolio of the debt mutual fund. Higher the average maturity of the
portfolio greater would be the interest rate risk on the portfolio of the debt mutual
fund. Source: MoneyControl
Both the modified duration and the average maturity represent the sensitivity of the debt fund portfolio to interest rate movements.
While average maturity is a crude measure of interest rate sensitivity, the modified duration is a more sensitive measure.
Just by noting the values of these two parameters, one can understand how interest rate risk affects different debt fund categories.
Here is a compilation of average maturity and modified duration for different fund classes. I have deliberately avoided defining each fund category in the post. Those who are familiar with them should not worry too much. If you are new to debt funds, then I suggest you come up with your own definition of fund categories by observing the maximum values of the average maturity and modified duration.

Source: Value Research Online. In some cases, the average maturity and modified duration are not for the same fund. The typical
order of the values is however correct.
Performance in the past year
Debt: Liquid. Let us look at the fund with highest average maturity (AM) (0.2 years) and highest modified duration (MD) (0.18 years).

Notice the little bump in the NSE Treasury Bill a little after the bond crash. The fund however was practically unharmed. If you peer a little you will notice a small dip on July 16th. Notice how fast the fund bounced back – in a few days.
Debt: Income Let us look at two funds.
The fund with lowest category AM = 0.44 years , MD =0.37 years

Notice how the fund suffered a dip on July 16th but recovered in a couple of months.
Now let us look at the fund with the highest category AM = 13.62 years; MD = 6.95 years.

The fund is yet to reach its July 16th NAV.
Similar plots can be made for the short term gilt funds. Imagine the fate of the Debt: long term funds!
Therefore, in general, higher the average maturity of the portfolio, higher the interest rate risk.
Higher the average maturity, higher the modified duration.
Higher the modified duration, higher the interest rate risk. The value of the modified duration gives you a more exact estimate of how much the NAV will be affected for 1% change in interest rates.

Typically funds with low AM and MD will follow an accrual strategy. That is they will buy and hold debt paper until maturity. So interest rate risk is lowered. However, credit risk comes into play. Lower the quality of the debt paper, higher the credit risk and higher the interest rate!
SEBI allows fund houses to buy credit protection (sort of an insurance) to hedge credit risk on corporate bonds. So that offers some comfort to the investors.
How do we use this information to select mutual funds?
When it comes to debt fund investors, I can think of three types
1) Those who are always chasing interest rates, double indexation etc.
2) Those who are looking to invest for short term goals, less than 5 years away
3) Those who are looking to invest for long term goals, as part of diversified folio.
We will leave type (1) alone. Obviously they know what they are doing. We will leave the high AM, high MD funds to these guys.
Where kind of funds should type (2) investors choose?
They should choose a fund with average maturity well below the tenure of the financial goal.
For a 5 year goal, I would choose a modified duration and average maturity of no more than 1 year.
Which kind of fund to invest in? Now we will need to look into the natureof the debt holdings. Is it corporate debt? It is Bank paper? It is govt debt (gilt)? What is the rating of the debt paper?
For important goals, best to stick to high quality debt issued by banks and PSU
Short term gilt funds with lower MD can also be used, but the returns would be on the lower side.
For less‐important goals, you can be a little more adventurous and include some corporate debt. Here again stick to funds that have predominantly ‘AAA’ securities in their folio.
So investors should first look at low interest rate. The risk (AM & MD) , shortlist couple of fund categories and then choose funds with low credit risk (quality of debt).
Here is a screenshot from the ValueResearch portfolio page showing the AM, MD and the fund style box. We should funds with high credit quality and low interest rate sensitivity for short term goals.

Most investors with a goal in mind, should stay within the red circle.
Once the fund category is chosen, you can short list funds using the risk‐return parameters (alpha, beta, standard deviation, R‐squared, Sharpe ratio) using the same strategy as outlined in the step‐by‐step mutual fund selection guide. If you would like to understand risk‐return parameters in a simple non‐mathematical way, click here
This would enable you to short‐list low‐risk, reasonable‐return funds from the category of your choice.
The next step would be to look at the fund objective and investment strategy. Some fund houses like Franklin Templeton mention this clearly on each fund page. If the information is not clear, read the scheme document. Do not ask anyone else!
The objective and investment strategy must give you the impression that the current AM and MD will more or less be the same for the investment tenure you have in mind.
If yes, go ahead and invest!

NEVER invest in a debt fund without reading the investment objective and investment strategy.
Where kind of funds should type (3) investors choose?
First let us understand what we need debt funds for long term goals which would typically have significant equity.
● Why not PPF? PPF is not suitable for goals less than 15 financial years away ● PPF is good but it does not allow rebalancing. You can book profits into PPF but not vice versa
when you want to. ● With a debt fund there is a chance for high returns which could be transferred to equity
when the markets fall. So debt funds allow for rebalancing which if done cleverly can contain portfolio volatility significantly.
Just like a diversified equity fund, a well diversified debt fund like a dynamic bond fund with modified duration and average maturity of no more than 2‐3 years will do the work. The NAV will fluctuate and that is fine, since we need fluctuations for rebalancing! You can learn more about rebalancing here. Be sure to play with the simulator tool.
Just as the concept of standard deviation can help a newbie mf investor understand different fund
categories, the concepts of average maturity, and modified duration can help the newbie debt fund investor to pick a category suitable for their needs.
Debt funds selection can typically be more complicated than equity fund selection. It is up to the investor to simplify this process by being clear on what they want. They should learn not to chase after returns and keep expectations low.

17. How to Conduct a Personal Financial Audit
I love December. The Chennai Summer is busy recharging its batteries and therefore not in full force. The Carnatic music season seems to begin earlier each year, thanks to some prudent marketing. The semester is over, and for me, goal‐based investing month starts!
Most of what little I know about personal finance and investing comes from time spent staring at Excel sheets in December. All my retirement and goal‐based investing calculators were done in December as I evaluated my goals and future cash flow.
In December, I do a personal finance audit. Details of last year audit can be found here (be sure to read comments) . Will post this years audit soon.
The most important part of the audit is to find out if I am on track with respect to my long‐term financial goals. Much of this audit process has been completely automated with these tools (and can be done any day of the year):
1. I keep track of investments with this monthly tracker 2. Track fund holdings, portfolio health and goal progress with Automated Mutual Fund and
Goal‐based Investment Tracker 3. PPF Tracker 4. Get a perspective of future cash flow with the integrated financial planner
If you have not done this exercise, do try it. It will change the way you think about money. You could feel more secure and hopefully in control. It would definitely tell you where you stand and where
you need to be (if you are not there already).
At the cost of sounding presumptuous, may I suggest that you treat this post as acall to action and try out the above tools?
If you are interested, here is what you will need:
● 60 minutes of peace and quiet. ● A notebook and pen and of course a computer hooked up to the internet.
And this is what you will need to do:
1. In the notebook, date a page and list all possible short‐term and long‐term goals. 2. Enter the approximate current cost of each goal. If you don’t know it off‐hand, source it later.

3. With this information, play with the Visual Goal‐planner Hopefully it would help you understand the importance of inflation and how to beat: either by investing enough or by earning large enough returns.
4. Collection all relevant information regarding your investments and savings: SB accounts, FDs, RDs, PPF, EPF, Gold, Stocks, mutual fund holdings, bonds, insurance policies etc.
5. You are now ready to use the integrated financial planner. As you explore the entries, if you need help with planning long‐term goals, you can consult: A Step‐By‐Step Guide to Long
Term Goal‐Based Investing 6. Take a few days to study and understand the results of the integrated financial planner. That
will tell you how much you need to invest and how much you can invest …. this year and in all future years up to retirement.
7. This should give you some idea of achievable your financial goals are. You don’t need to take the results of the planner as Gospel. As long as you strive to invest as much as you can and keep expenses at check, you would be fine.
8. The next step is to tag your existing and future investments or savings with long‐term or short‐term goals and enter that in the monthly tracker
9. You can use the above‐mentioned PPF and mutual fund trackers if you wish. 10. Write down important conclusions in the notebook. 11. Repeat steps 1‐10 once a year. 12. Steps like changing investments, rebalancing etc have not been discussed here. If these
steps are followed, my guess is that you would know what to do with your investments because you now set your sights on the only benchmark that counts: your financial health.
13. I will provide some more details on this when I post my personal finance audit.
If you need help with any of the above steps, you can contact me and I will be happy to provide generic help.
Happy Auditing!

18. How to review your mutual fund portfolio?
I discuss simple ways in which a mutual fund portfolio associated with a long‐term goal can be reviewed. This is a grey area in personal finance and there is no optimal way to do this. Each individual must necessarily develop their own style of review. So multiple solutions are the norm here.
What is presented below are my thoughts on the subject and is a combination of ‘how I do it‘ and ‘how I would do it‘. Let us start with assumptions.
1. The goal is several years away (short‐term goal management is a different ball game. It the folio has debt, then there is not much to do. If it has a lot of equity, one should pray a lot!)
2. We have a clear expected return from our total equity folio (this review is for the equity portion of the folio. We will assume the debt part has minimal volatility and does not need frequent reviews)
3. We will monitor the folio, say each month but will only take action once a year. 4. Action here refers to fund changes only. Other actions like rebalancing or tactical asset
allocation depend on equity:debt allocation or economic indicators and are not considered. 5. The folio should at least be 5Y old. There is no hurry for new investors with folios younger
than 5Y to take any action and I strongly suggest they monitor their investment patterns and not the folio performance.
6. There are several types of folios (minimalist, mildly cluttered, severely cluttered). So course of action will differ. We will consider a cluttered folio. It is easy to extrapolate the gist of the argument to any folio. If you have any questions, feel free to ask.
Pretty much every action in personal finance needs a benchmark. The more personal they are, the easier it is to decide.
So the first benchmark is to have a return expectation. This expectation should be reasonable and must keep in mind associated volatility.
The second benchmark is the net return from the portfolio at any given time. This is calculated using what is know as the XIRR (read more about this here)
The XIRR is, by definition a personal benchmark. ‘How has the fund performed?‘ is now quantified by, ‘What is my XIRR from the fund?‘
It is a personal benchmark because no two people’s XIRR will be the same, unless they invest on exactly the same dates.

This is why star ratings are irrelevant once I invest in a fund (they are irrelevant even before that because, imo they do not reward/penalize long‐term consistency/inconsistency. An investor is better off doing their own analysis).
Once I invest in a fund, all that matter to me is its impact on my folio and not how it compares with its peers (star rating).
So, once I have an expectation from equity, the next task is to find out the net XIRR (this is the rate at which all your investments have compounded on an average. This is the equivalent of the CAGR when multiple investments are made).
You can do this by entering ALL your transactions in a portal like Value Research or my mutual fund tracker or Mprofit. Not sure if Perfios gives this.
You should now have a table of the current value of all your funds, their individual XIRRs and the net XIRR.
Something like this (click to enlarge). This is a fabrication.
No prizes for guessing that the first fund is PPFAS!!
If my return expectation is 10% (lower the better), I can afford to do nothing if my net XIRR and individual XIRRs are all above 10%. There is absolutely nothing wrong with this strategy.
I like a large XIRR as much as any other person. So a second approach is to try (and hope) to keep the net XIRR well above the return expectation and make gradual changes to increase the distance between the two benchmarks as much as possible.
The above picture is an example of a cluttered folio. It has 3 large caps, one large mid‐cap and two mid‐small cap funds. I am not terribly bright when it comes to giving good examples. I am fairly sure that many real life folios are worse than this!

Here we go,
Among the three large cap funds, two are 5Y old in the folio and one 2Y old.
Is the 2Y old investment necessary? It is unlikely to diversify the folio as there are already two large caps and its return, 14.75% is significantly lower than the Net XIRR of 26%. Also, it constitutes only 1.23% of the entire folio.
So I think this (large cap 1) can be gotten rid of.
Large Cap 2 is nearly twice in value compared to large cap 1 but its return is much lower.
If large cap 2 has consistently performed then it can be retained even its portfolio has significant overlap with large cap 3.
Same reasoning for large 3. If it has been consistent, leave it alone. If it has suddenly improved in the last few months, we will have to wait and watch.
In the name of consolidation, one should not hastily shift large cap 2 holdings to large cap 3. One can increase investments in large cap 3 and decrease investment in large cap 2 and see how that goes.
If large cap 3 does indeed continue to do well (return well above net return) and large cap 2 has not picked up its act, one can then gradually shift units from large cap 2 to 3.
The aim here is to slowly but steadily increase the net XIRR (well above the expected return, if at all possible). One cannot accomplish this with knee‐jerk changes. The idea is to do it with a method and to do it gradually.
One can also try to reduce the volatility in the net XIRR. This may need tactical calls though.
Thus is is important to track performance. Otherwise, such decisions cannot be made.
The large mid‐cap fund can be left alone even if it holds the same large cap stocks as the large cap funds 2 and 3. Its return is well above the net return. When it ain’t broke don’t fix it.
There are two small‐mid cap funds. One of them is quite recent. So leave it be. The other has a decent enough return. So leave that be as well.
Again, if the mid‐cap +international equity fund continues to do well, investments can be increased here.

I think not having a SIP is helpful in making these switches. I think a SIP is best done in the first 5Y of a long‐term goal. After that, I think active management will help.
All this is written without any kind of qualitative analysis as to why certain funds did not do well. Digging a little deeper may or may not help.
It is best to not get emotionally attached to a fund and to be ruthless, but objective. This is something I am not very good at but have changed in the past couple of years. Ruthless does not mean immediate. Change can take a few months to happen. After all, exit loads and taxation are also important.
Changes can hurt. The fund we exited can go on to do quite well and the new fund plumb new depths. Which is why it is important to not make any sudden changes.
One should chase after returns like the turtle trying to beat the hare: slow and steady does the trick.
Quantum Long‐term equity may be a three‐star fund today (according to VR) but in my folio it is a five star fund. Chasing after five‐star funds every year or taking blog posts which are titled, “Top Best XX funds in 2015₺ (XX = number) seriously can be injurious to your fiscal health. Bloggers write such crap to get traffic and more Google adsense money.
Understanding how the small caps and mid caps have fared against large caps help in understanding the recent returns of the fund in our portfolios.
This is just one way of doing things. There could be simpler methods. Personally, I prefer benchmarking XIRR of each fund with the folios net XIRR.
Once I am unit holder in a fund, its performance against a benchmark is not all that relevant to me. AMCs choose benchmarks that can be easily beat (if you ran a business, would you set yourself tough targets?). A fund that has consistently beat its benchmark can still not even meet my return expectation, or can be much lower than the net XIRR.
At such times, it makes sense to find out if there are better‐performing peers taking into account consistency in downside protection (see how to do this here). Again star ratings don’t mean much to me.
This might work, provided the age of the investment and the weight of the investment are considered. The idea is to identify funds that pull up or pull down the net XIRR.
Such funds need not always be eliminated, but it does not hurt to review such funds a bit deeper and act accordingly.

All said and done, history tells us most funds (from ‘decent’ fund houses) tend to do well if held on for long enough. So a simple buy and hold strategy will definitely work.
What is proposed above is only one of a zillion possibilities. The idea of this post to highlight the importance of personal benchmarks. There are many solutions to this problem. Feel free to critique and propose alternative strategies.

19. Review Your Retirement Portfolio in Seven
Easy Steps
All long‐term financial goals require periodic review to ensure that they are on track and in line with expectations and assumptions made while planning for the goal.
Retirement is a unique financial goal. Most often one has a large corpus to utilize over a period of several years. Here are seven easy steps by which a retirement portfolio can be reviewed.
You can use the goals analysis sheet of the automated mutual fund and financial goal tracker to automate this review process.
1. Calculate the current value of the retirement corpus. Determine current values of mutual fund/stock holdings, PPF, EPF/NPS, FDs etc. and add them all up.
2. What is the retirement corpus worth today? If you were to retire today, what number of years can you be financially independent? If this number is equal to the number of years you expect to be alive from today, you are financially independent!
For example, I can be financially independent without working for just about a year or so, if I retire today! In order to never work again I would need a sum that would support me, that is provided me an inflation‐protected income stream for at least 40‐45 years!
3. What is the projected worth of the retirement corpus? If the present corpus was allowed to grow from now until the expected age of retirement at a reasonable rate (= return on investment), what number of years can you financially independent? If this number is equal to the number of years you expect to live after retirement, you can safely reduce further investments if not stop them altogether.
For example, If I do not investment for retirement anymore and retire as per my plans at 65, I will have a corpus that will support for about 5 years. Whereas I would need a corpus that should support me for 20‐25 years!
4. What is the current monthly investment required? Taking into account the current corpus, what is the monthly investment required today, increasing each year at an assumed (reasonable!) rate? If the monthly investment required is lower than what you actually invest, then all is well. Else, you will need to cut down expenses until you can invest enough.
I am not doing badly on this account. Thanks to an aggressive investment strategy, I need to invest only 65% of what I currently do. That is I can afford to reduce my investments by a good 35%

‐something I do not intend to do as long as I can manage to keep unexpected recurring expenses at bay.
My Assumptions/Expectations
Equity: 12% initially, got it down to 10% (thanks to this) and now 9%
Debt: 8%
Inflation: 9%
Annual increase in monthly investment: 10%
Post‐tax returns after retirement: 7%
5. What is the growth rate of the retirement portfolio? What is the CAGR of each asset class? That is, the CAGR of equity holdings*, PPF, EPF,NPS, gold, FD, real estate etc. If the CAGR of the volatile asset classes is more or less close to your expectations, not much need be done. If it much higher than expectations, it might be time to rebalance. If it is much lower, you will need to look at the source of underperformance and take a call on it.
The current monthly investment required is also a sign of the portfolio growth rate. If it not too much higher the initial monthly investment planned, things are reasonably fine.
My net Equity CAGR: 9.89% (as on Mar. 24th 2014)
NPS: 7.57% (as on 14th Mar 2014)
PPF: Same as yours! I contribute Rs. 500 each month to my wife’s account and mine.
Gold: Not applicable
Real Estate: Not applicable
* take all the transactions (purchases, dividends, redemptions, switches,reinvestments etc.) made for a financial goal, feed them into a XIRR calculator and compute the CAGR (the goal tracker sheet of the automated mutual fund and financial goal tracker does this at click of a button).
6. Is your retirement in auto‐pilot mode? For the salaried class, some investments like EPF are mandatory. If the current monthly investment required is lesser than the monthly EPF contribution, your retirement is in auto‐pilot mode, provided there is not significant break or reduction in contributions due to lay offs or lesser paying jobs.

Mine has been in auto‐pilot mode for quite a while now. Since I plan to retire early, it does not matter much for me.
7. Are you planning to retire early? If so, the first requirement is to invest as much as possible and as early as possible. If you are doing this consistently for at least a couple of years, use the financial freedom calculator to find out how soon you can retire.
In my case, financial freedom is a good 18‐20 years away (longer than I originally thought
). However since my expected retirement is longer than this, I am reasonably happy with it.
Do be careful while interpreting these numbers and be sure to avoid these common retirement
planning mistakes.
If you could go through these seven steps once a year, you can ensure that your retirement plans are on track.
The goals analysis sheet of the automated mutual fund and financial goal tracker automates this review process. Just remember to view it occasionally and not everyday!

20. Asset allocation for long‐term goals
Asset allocation refers to the proportion of different asset classes in a portfolio. For example, percentage allocation to equity and debt. The allocation is (or rather should be) decided with an aim to balance risk and reward. The adage, “do not put all your eggs in the same basket” is usually used to explain this strategy.
Determining the ‘right’ asset allocation for long‐term goals (defined at least 10 years plus away) is a tough task if we are looking for a method to do it. It is difficult (if not impossible) to find the ‘optimum asset allocation’ either with a risk profiler or a portfolio analysis tool.
Ideally, one should choose assets which are little or even opposite correlation with each other (one does well when the other tanks). In such a case, it is easy to use a portfolio analysis tool to determine the ‘right’ asset allocation.
Equity, fixed income (debt) and gold is one standard combination which can be used for asset allocation.
Personally I am not a fan of gold and will not choose it (too high risk for the long‐term reward offered). So in this post, I will share some analysis with different equity:debt ratios.
Alok Jha has been asking me for an analysis with all three assets for a long time. So will do this in the next post.
I choose Franklin Indian Blue Chip as representative of equity and Franklin Indian Income fund as representative as debt. These are among the oldest equity and debt funds in the market.
We will consider a SIP from 6th July 1998 to 5th May 2014 (this was done a while back. Too lazy to update) in both funds.
This is how the XIRR will vary month by month

Can we now argue that since the XIRR of the equity SIP settles down after a while, we can have 100% equity exposure for long‐term goals?
I certainly would not. If there is a ‘big crash’ close to when I need the money, I would be in trouble. I need the bed‐rock of debt. How much of it do I need is unfortunately, a personal choice. Hard to provide a formula for it.
This is how the standard deviation (a measure of volatility) of the monthly XIRR looks for different equity allocations. The final XIRR is also plotted
Notice the bend in standard deviation at 10% equity allocation. It can be shown that it corresponds to the ‘optimum’ asset allocation in terms of risk vs. reward!
Hey we all want better returns, so let us take on more ‘risk’. But how much more is the question?!
Hard to give a mathematical answer.
I do not like a high double‐digit standard deviation. I personally use 60% equity for my long‐term goals and suggest no more than 70%. I think 50% equity is also a pretty decent allocation.
Recognise that we have considered a blue chip fund. Had we included mid and small caps, the volatility would have been much higher.
I think anything about 70% equity allocation will require a lot of maintenance (monitoring, tactical calls etc.)
I have better things to do. I want something that is low‐maintenance, with reasonable risk and reasonable reward.

If my net equity portfolio gives me 1o‐12% after 10Y+, I will delighted. I would have met all my financial goals with reasonably low‐stress levels.
Like Subra says, “the asset allocation that lets you sleep peacefully, is the right allocation!”
What do you think?
‐‐‐‐‐‐
All calculators referenced in the text are available for free download at
freefincal.com
Please let me know your feedback at [email protected]
Freefincal is a reader‐funded blog with open source, ad‐free content. If you find it useful, consider making a monetary contribution to support freefincal activities. Click to see how the amount will be used.