PERSONAL INCOME TAX NON-COMPLIANCE IN MALAYSIA By …
268
PERSONAL INCOME TAX NON-COMPLIANCE IN MALAYSIA By MOHANI ABDUL Submitted for the degree of Doctor of Business Administration July 2001 Department of Legal and Executive Studies Victoria University, Melbourne .^^ UNivnsirr ^ •.
Transcript of PERSONAL INCOME TAX NON-COMPLIANCE IN MALAYSIA By …

PERSONAL INCOME TAX NON-COMPLIANCE IN MALAYSIA
By
MOHANI ABDUL
Submitted for the degree of Doctor of Business Administration
July 2001
Department of Legal and Executive Studies Victoria University, Melbourne
.̂ ^ UNivnsirr ^ •.

TABLE OF CONTENTS Page
Acknowledgments vii Executive Summary ix List of Tables xx Abbreviations/acronyms ^"^
CHAPTER ONE
Introduction 1
1.1 Introduction to Malaysia ^
1.2 The Malaysian Tax System and Tax Non-Compliance 2 1.3 Previous Findings on Tax Non-Compliance in Malaysia 5
1.3.1 Findings about tax ethics and taxpayer attitudes among the Malaysians 6
1.3.2 Income tax avoidance in Malaysia 8 1.3.2.1 Discrepancy between law and compliance 8 1.3.2.2 Withholding tax requirements and PA YE 9 1.3.2.3 Detection of evasion 10 1.3.2.4 Adequacy of the penalty structure 11 1.3.2.5 Administrative procedures 11
1.4 Aims and Methods of the Current Research 12 1.4.1 General aims 12 1.4.2 Specific aims 12 1.4.3 Five components of methodology 13
1.5 Chapter Development 15
CHAPTER TWO Review of Literature on the Extent of Non-Compliance
2.1 Introduction 18
2.2 Non-Compliance 19 2.2.1 Evasion and avoidance 20
2.3 Extent of Non-Compliance 21 2.3.1 The importance of non-compliance 27
2.3.1.1 Employment 27 2.3.1.2 Growth and inflation 28 2.3.1.3 Savings and consumption 28 2.3.1.4 Productivity 28 2.3.1.5 Inequity 29
2.3.2 Measurement of income tax non-compliance 29 2.3.2.1 The gap approach 30 2.3.2.2 Expenditure-income discrepancy method 30 2.3.2.3 Elffers, Weigel and Messing (EWH) tax-evasion
measurement 32 2.3.2.3.1 Officers' classification 32 2.3.2.3.2 Self-reported tax evasion 34

2.4 Summary 36
CHAPTER THREE Review of Literature on Some Factors Influencing Income Tax Non-Compliance
3.1
3.2
3.3
3.4
3.5
3.6
3.7
Introduction
Age
Gender
Income-Level
Income Source 3.5.1 Cash transactions 3.5.2 Occupation and socio-economic considerations
Factors that May Influence Income Tax Non-Compliance 3.6.1 Financial strain 3.6.2 Complexity 3.6.3 Tax preparers Summary
38
39
41
44
48 53 53
53 54 55 58 60
CHAPTER FOUR Review of Literature on Some Strategies in Overcoming Income Tax Non-Compliance 4.1 Introduction 62
4.2 Tax Policy and Reform 62
4.3 Enforcement 64 4.3.1 Strategies to assist in changing attitudes 67 4.3.2 Positive approaches 68
4.3.2.1 Service approach 69 4.3.2.2 Public education program 70
4.3.3 Withholding of taxes and information reporting 72 4.3.4 Detection and punishment 76
4.3.4.1 Audit plan 76 4.3.4.2 Sanctions 81 4.3.4.3 Preparer penalties 84
4.3.5 Simplifying the tax system 87 4.4 Summary 90
CHAPTER FIVE
Taxation System in Australia
5.1 Introduction 94
5.2 The Australian Taxation Office 95
5.3 Individual Taxpayers in Australia 96
5.4 Some Policies Adopted by the ATO 97

5.4.1 Self-assessment and fringe benefits tax (FBT) 97 5.4.2 Prescribed payment system (PPS) and pay-as-you-earn
(PAYE) system 100 5.4.3 Tax file number (TEN) 101 5.4.4 Technology 102
5.4.4.1 The electronic lodgement service 103 5.4.4.2 Electronic record-keeping 104 5.4.4.3 Control of non-filers 104
5.4.5 The taxpayers' charter 105 5.4.6 Enforcement and punishment 105
5.4.6.1 Policies adopted to combat non-compliance 107 5.4.6.2 Audits 111 5.4.6.3 Post audit critique 112 5.4.6.4 An Eliot Ness-style strategic intelligence network 112
5.4.7 The role of marketing in the ATO 112 5.4.7.1 Market research 113 5.4.7.2 Measurement and analysis of voluntary compliance 114
5.4.8 Staff development and training 115 5.5 Administrative Reform Proposed for the ATO by the TIA 115
5.6 Summary 116
CHAPTER SIX
The Gap Approach to the Measurement of Tax Non-Compliance
6.1 Introduction 118
6.2 Description of Malaysian Information Sources 118
6.2.1 Data sources from the national accounts 119
6.2.2 Taxable income 119
6.2.3 Analysis of direct taxes in Malaysia 120 6.3 The Gap Approach to Taxation Non-Compliance: Methodology
and International Estimates 121 6.3.1 The gap methodology 121 6.3.2 The U.S. estimates for personal income taxation 122 6.3.3 Data sources for Australia 127 6.3.4 Estimates for Australia: The overall taxable income gap 128 6.3.5 Lessons of the gap approach estimates for the U.S. and
Australia 135 6.4 Estimating the Overall Taxable Income Gap for Malaysia 136
6.4.1 Calculating the taxable income gap 136 6.4.2 Comments on the gap approach used for Malaysian and
Australian data 141 6.5 Interpreting the Taxable Income Gap - Coverage or Non-
Compliance 142 6.5.1 Interpreting the taxable income gap 142 6.5.2 Coverage of personal income taxation 142 6.5.3 Coverage of company taxation 146
6.5.3.1 Incentives for manufacturing sector 146
111

6.5.3.2 Incentives for high technology companies 148 6.5.3.3 Incentives for strategic projects 148 6.5.3.4 Incentives for the agricultural sector 149
6.5.4 Coverage of the Malaysian income tax system 150 6.6 Conclusion 150
CHAPTER SEVEN Other Approaches to Assessing the Level of Tax Non-Compliance in Malaysia 7.1 Introduction 152
7.2 Description of the Personal Income Tax System in Malaysia 152
7.2.1 Income tax returns and related offence 153 7.3 Failure to Return Annual Tax Forms among Registered
Taxpayers 155 7.3.1 Failure to lodge annual returns in 1995,1996 and 1997 - all
taxpayer types 156 7.3.2 Non-compliance in 1995,1996 and 1997 for individual
taxpayers of the IRB 157 7.4 Views of Taxation Officers about Non-Compliance in Malaysia 160 7.5 The Extent of Income Tax Non-Compliance - Limitations and
Conclusions 162
CHAPTER EIGHT A Profile of Income Tax Non-Compliance in Malaysia 8.1 Introduction 163 8.2 Description of File data and Interview data 163 8.3 Types of Non-Compliance among Individual Taxpayers 165
8.3.1 Types of non-compliance obtained from file data 165 8.3.2 Views on types of non-compliance 167 8.3.3 Implications obtained from the review of types of non
compliance 169 8.4 Characteristics of Individuals Engaged in Income Tax Non-
Compliance 169 8.4.1 Age level 169
8.4.1.1 Description of gender distribution in the labour force 170 8.4.1.2 Possibility of a tax evader comes from different age
groups and gender in a tax evading population from file data 171
8.4.1.3 Age group in relation to total income omitted, total tax evaded and penalty imposed 173
8.4.2 Gender 174 8.4.2.1 Gender distribution in the labour force 11A 8.4.2.2 Gender of tax evaders obtained from file data 175 8.4.2.3 Views of income tax officers on gender of tax evaders 175 8.4.2.4 Gender in relation to total income omitted, total tax
evaded and penalty imposed 176 8.4.3 Income level 177
8.4.3.1 Description of reference data for income level- all individual taxpayers 178
IV

8.4.3.2 Income levels of tax evaders obtained from file data 178 8.4.3.3 Views of income tax officers on income levels of tax
evaders 180 8.4.3.4 Income levels in relation to total income omitted, total
tax evaded and total penalty imposed 181 8.4.4 Income source 182
8.4.4.1 Income sources in relation to file type 182 8.4.4.2 Reference data for income sources of individual
taxpayers 182 8.4.4.3 Income source obtained from file data 183 8.4.4.4 Income source in relation to total tax omitted, tax
evaded and penalty imposed 184 8.5 Factors that Might Influence Income Tax Non-Compliance 186
8.5.1 Reasons for non-compliance 186 8.5.1.1 Reasons for non-compliance extracted from file data 186 8.5.1.2 Reason of non-compliance in relation to total income
omitted, total tax evaded and total penalty imposed 188 8.5.1.3 Viewing income tax officers' opinions on reasons of
non-compliance 189 8.5.2 The use of tax agent 191
8.6 Conclusions and Limitations 193
CHAPTER NINE Enforcement Analysis and Strategy Recommendations 9.1 Introduction 196 9.2 Analysis on the Current Enforcement System 197
9.2.1 Detection activity 197 9.2.1.1 Estimating percentage of tax evaders being caught 197 9.2.1.2 Method of selection for detection 200
9.2.2 Penalty system 200 9.2.2.1 Increase reliance on penalty 200 9.2.2.2 Adequacy of the penalty structure 201
9.2.3 Loopholes in the income tax legislation 203 9.2.3.1 Discrepancy between law and compliance 203 9.2.3.2 Benefits-in-kind income 203 9.2.3.3 Withholding tax requirements 204 9.2.3.4 Opportunities to split income with others 204 9.2.3.5 Opportunities to convert potentially taxable receipts
into non-taxable receipts 205 9.2.4 Analysing weaknesses exposed in the post mortem of
Taxpayers' Service Week's survey 205 9.2.5 Weakness in the assessment procedure 206 9.2.6 Weakness highlighted by our respondents and their
suggestions 207 9.2.7 Weaknesses in the administrative procedures 208
9.3 Discussion on Strategies Recommendation 209 9.3.1 Adopting a proper enforcement and practice uniformly in
all branches of IRB 210 9.3.2 Work closely with third parties 212
9.3.3 Adopting modern facility/skilful staff and
strengthening detection activity 213 9.3.4 Introduction of new income tax procedures 215 9.3.5 Improving tax knowledge/education among the public 215 9.3.6 Introduction of new rules and regulations 217 9.3.7 Amendment of income tax law 217 9.3.8 Upgrading its research and development 218
9.4 Summary 218
NOTES 220 APPENDIX 1 222 REFERENCES 225
VI

ACKNOWLEDGEMENTS
I would like to take this opportunity to express my appreciation to all of those who
have helped me complete this dissertation successfully. A special gratitude should go
to my major supervisor, Professor Peter Sheehan for his guidance, assistance and
encouragement. His moral support and constructive suggestions meant a lot to me
throughout the entire period of this study. My appreciation also goes to my co-
supervisor. Professor Geoffrey George, my DBA coordinator Dr. Nick Billington and
all of the staff of the Faculty of Business and Law and the Centre of Strategic
Economic Studies of Victoria University of Technology, Melbourne, Australia. In
particular Professor Bhajan Grewal, Dr. Sardar Islam and Dr. Jane Dawson who
helped me with the finalisation of the proposal of this research paper. My gratitude
also goes to Margarita Kumnick who has guided me with the style and proof reading.
I am also indebted to Victoria University of Technology for sponsoring this research.
My sincere appreciation also goes to the Chief Executive/Director General of the
Inland Revenue Board of Malaysia, Puan Najirah Tassaduk Khan for giving
permission to access the non-compliance files and interview the income tax officers.
This study also would not have been possible without the help and cooperation of all
the heads of all the Assessment and Investigation branches of Kuala Lumpur, Johore
Bahru, Pulau Pinang and Kota Kinabalu. Also, I would like to convey my appreciation
to all of my respondents in volunteering to participate in this research and providing
useful information in the preparation of this study. My gratitude also goes to the heads
of Operation and Quality Divisions for providing secondary data regarding income tax
non-compliance in Malaysia. I also would like to thank En. Ismail Hj. Bakar and En.
Mohd. Yusri fi"om the Ministry of Finance Malaysia for providing unpublished data
regarding Malaysian non-taxable public enterprises income for the years 1995, 1996
and 1997.
My deepest appreciation goes to the Government of Malaysia and the management of
the Inland Revenue Board of Malaysia for giving me the opportunity to pursue my
study.
vu

Finally, I would like to express my love and appreciation to my husband, Nazeri Hj.
Kadir, my parents and my family for their encouragement and moral support
throughout my study.
viu

EXECUTIVE SUMMARY
A modem tax system was first introduced into the Federation of Malaya by the
British in 1947. This was subsequently repealed and replaced by the Income Tax
Act 1967, which came into effect on 1 January 1968. Subsequently, the Inland
Revenue Board (IRB), formerly known as the Inland Revenue Department (IRD),
was created as the government agency that has the responsibility for collecting
income taxes for Malaysia. As with other tax collecting agencies, it has to deal
with the problem of income tax non-compliance.
It is important to combat income tax non-compliance, for if it becomes
widespread it can have a major impact on the structure of prices, on the
effectiveness of macroeconomic policy and on the trust of taxpayers that the
government is concerned with distributional justice. Various strategies have been
introduced by the IRD/IRB to overcome this problem and, while there is some
literature, there has as yet been no comprehensive study of this income tax non
compliance for Malaysia. This research is being undertaken to make some
contribution to filling this gap. The study begins by reviewing the literature on the
various dimensions of tax non-compliance and examining some of the initiatives
that have been introduced by the Australian Tax Office (ATO). It then attempts to
document the extent of income tax non-compliance in Malaysia, to analyse the
main characteristics of income tax non-compliance in that country and to propose
some improved strategies for overcoming this problem.
In addition to the use of published or unpublished statistical data collected by
others, this analysis of income tax non-compliance in Malaysia makes use of two
types of data collected by the author. The first is referred to as the file data, where
details are recorded of 507 taxation files of individuals identified as non-
compliant by the IRB. The second is referred to as the interview data, which
records the results of an interview survey by the author of the views of fifteen
taxation officers in each of four branches of IRB concerning non-compliance.
IX

The Extent of Income Tax Non-Compliance in Malaysia
In exploring the extent of non-compliance in Malaysia for the years of 1995, 1996
and 1997, we adopt three different types of analysis. First, the gap approach
measures the dollar value of non-compliance in terms of income unreported. The
second type of analysis approaches non-compliance in terms of the filing of
annual tax returns by registered taxpayers. Lastly, the third assesses the views of
experienced taxation officers regarding the seriousness of this problem in
Malaysia.
The Income Tax Gap Approach
In the gap approach, the gap between a measure of taxable income derived from
the national accounts data for gross national income and total taxable income as
assessed by the IRB gives the estimated dollar value of non-compliance for the
whole system. Besides estimating the rate of non-compliance in Malaysia using
this approach, we also estimate the rate of non-compliance in Australia and
review work done by Park (2000, pp. 12-22) for the U.S. Department of
Commerce on personal income tax non-compliance in the U.S. This enables us to
compare and contrast this problem in Malaysia, Australia and the U.S.
The resulting estimates of the taxable income gap for Malaysia for the years
1995-97 range from RM75.3 billion in 1995 to RM99.1 billion in 1997; in
proportional terms they lie between 47.2 per cent and 49.4 per cent of the derived
taxable income to the IRD/IRB in the three years under study. That is, about 48
per cent of derived taxable income is not captured in reported taxable income in
Malaysia. In contrast, the estimates of the income tax gap for Australia for the
years 1994/95, 1995/96 and 1996/97 lie between A$14.1 billion and A$24.8
billion, or between 3.8 per cent and 7.1 per cent of its derived taxable income.
Thus the estimates prepared for these two countries, using a similar methodology,
suggest that the income tax gap is very much higher in Malaysia than in Australia,
in proportional terms. This conclusion that the Malaysian gap is relatively high is
reinforced by estimates fi-om the U.S. Department of Commerce, that in the U.S.
the gap in terms of personal income is 10-12 per cent of derived taxable income.
There are two potential reasons for a low ratio of actual to derived taxable
income. One is coverage: the possibility that the coverage of the taxation law is

Umited, so that a significant proportion of derived taxable income is not legally
liable for tax. The other is non-compliance: the possibility that a significant
proportion of derived taxable income, while legally liable for tax, is subject to
non-compliance and does not in fact lead to tax being paid. Based on an interim
analysis of the question of the coverage of the Malaysian income tax system, it is
evident that the coverage of that system is much lower than in Australia and other
developed countries. In part, this difference is due to the current stage of
development of the Malaysian economy, but it is also partly due to specific
features of Malaysia's economic and fiscal strategy.
The finding that only about 52 per cent of derived taxable income, estimated
primarily from national accounting sources, is captured in reported taxable
income in Malaysia compared to about 95 per cent for total income tax in
Australia, is a very striking one. Hence it can be regarded as highly likely that
both of the possible explanations - low coverage and a high level of non
compliance - are significant contributing factors to the outcome. It has not been
possible to quantify the relative contributions of low coverage and high non
compliance to the explanation of the high income tax gap. Thus this high gap,
while providing a strong indicator of a substantial level of income tax non
compliance, does not lead to a quantitative estimate of this level. Hence we
proceed to some other methods to throw light on the extent of income tax non
compliance in Malaysia.
Information from Filing of Tax Returns
The second approach measures the extent of failure to file annual tax returns
among registered taxpayers who have been issued with the annual tax return
forms. Subject to various qualifications, the gap between the annual tax return
forms issued and the completed annual tax returns provides a measure of the
failure to file annual tax returns. The results show that on the average 29.1 per
cent of total registered taxpayers failed to file their annual returns and 27.8 per
cent of individual registered taxpayers failed to file their annual tax returns in the
years of 1995, 1996 and 1997. hi 1997 over 800,000 issued forms, or 30.5 per
cent of the total, were not returned. As for individual taxpayers, over 700,000 or
30.4 per cent of issued forms in 1997 were not retuned. Among companies and
XI

other organisations the non-return rate in 1997 was 30.9 per cent. While there are
many reasons other than tax non-compliance for failure to return annual tax forms
to the IRB, the high non-return rate of issued forms constitutes powerful evidence
of persistent income tax non-compliance in Malaysia.
The Views of Tax Officers
The third approach is to seek the views of experienced income tax officers
regarding the seriousness of this problem in Malaysia. A survey of 60 tax officers
in four branches of the IRB found that 85 per cent of our respondents were of the
opinion that income tax non-compliance in Malaysia is either at a serious or very
serious stage.
Conclusions
In spite of the various limitations addressed in the text, the three indicators that
are studied in Chapters Six and Seven all point to a similar conclusion, that the
level of income tax non-compliance in Malaysia is high. About 48 per cent of
derived taxable income is not included in reported taxable income in Malaysia,
by comparison with about 5 per cent for Australia. While variations in income tax
coverage explain a significant part of this difference, much must also be due to
lower compUance levels in Malaysia. Over 800,000 issued tax forms, or 30.5 per
cent of the total issued, were not returned in the form of income tax returns in
Malaysia during 1995 - 1997. Again, while other factors explain part of this high
non-return rate, it remains powerful evidence of persistent income tax non
compliance. Finally, 85 per cent of a group of sixty experienced tax officers
interviewed were of the opinion that income tax non-compliance in Malaysia is
either serious or very serious. Thus, while this research has not been able to
provide a firm quantitative estimate of income tax non-compliance in Malaysia, it
does provide a number of strong and consistent indicators that the level of non
compliance is high.
Characteristics of Income Tax Non-Compliance
The analysis undertaken of the various characteristics of income tax non
compliance in Malaysia relies heavily on the file data (recorded information for
507 tax files, being all of the omission files for four IRB offices for the years in
question) and the interview data (interviews with 60 tax officers). These sources
Xll

have different limitations and sometimes give somewhat different emphases, but a
broadly consistent picture of the characteristics of income tax non-compliance in
Malaysia emerges fi-om them both.
Types of Non-Compliance
In terms of the type of non-compliance, in a rating of the views of the tax officers
the highest total score was received by under-declaring income, followed by
failing to declare income, inflating expenses or over-claiming deductions. Income
is under-declared from a given source when some but not all income received
from that source is declared, while there is failure to declare income when none of
the income received from that source is declared. Thus according to our
respondents, the order of importance of the different types of omission are as
follows:
1. Under-declaring income
2. Failing to declare income
3. Inflating expenses
4. Over-claiming deductions.
But the differences in rating were relatively small, and each type of omission was
seen as significant. The main differences between the results of analyses of the
file data and the views of the tax officers are two-fold. Relative to the findings
from the file data, the tax officers rate failure to declare income as less important
and inflating expenses as more important. However, based on their personal
experience (more than 80 per cent of them have worked with the IRB for more
than ten years) our respondents were of the opinion that taxpayers tend to under-
declare their income to a significant degree. But they also agree that inflation of
expenses was an important form of non-compliance.
Individual Characteristics of Persons Engaged in Non-Compliance
A strong and highly consistent picture of the dominant characteristics of those
involved in income tax non-compliance in Malaysia emerges from this analyses
of the file data and the interview data. Non-compliance is especially concentrated
in
• Older persons, those aged over 50 years,
• Men rather than women.
Xll l
• Individuals on higher incomes over RM5 0,000 per annum, and
• Individuals with income from sources other than wages and salaries.
While there is distinct evidence of non-compliance among other groups, the
concentration in individuals with these characteristics is very marked. Thus, for
example, 97.8 per cent of tax evaded in the omission sample was due to men
rather than women, 95.6 per cent was in the higher income groups and over 99 per
cent was associated with individuals with income from sources other than wages
and salaries.
Reasons for Non-Compliance
The reasons for non-compliance according to the tax officer respondents, in order
of importance, are as follows:
1. Taxpayers'intentional evasion
2. Tax preparers playing an important role in the omission of income
by taxpayers
3. Taxpayers taking advantage of the loopholes in the Income Tax
Legislation
4. Taxpayers' ignorance of the income tax law
5. Taxpayers practicing evasion because of financial strain
The income tax officers of the IRB were of the opinion that taxpayers evade their
income taxes because they have their own intention to do so. Our analysis of the
reasons for non-compliance provided by taxpayers found guilty of non
compliance was consistent with this conclusion - a very large proportion provided
either no reason or implausible excuses.
Improved Strategies for Combating Non-Compliance
When the extent of income tax non-compliance has been estimated and it is
revealed that the country is currently facing a serious problem of income tax non
compliance, and when the characteristics of those who are more likely to be
involved in such problems are known, then the final step is to enforce suitable and
effective strategies. The strategies that we would like to recommend to the IRB
are mainly focusing on its ability to improve its efficiency, to be a more effective
XIV

and adaptive organisation, and hence to increase the confidence of the community
in its capabilities. Suggestions are made in eight areas.
Adopting a proper enforcement and practice uniformly in all branches of IRB
Various piece of evidence have been presented in this thesis to suggest that
income tax non-compliance is a substantial problem. However, only a small
number of taxpayers have been found guilty of evading their taxes. Our
respondents are also of the opinion that the activities that are currently undertaken
by the IRB are still inadequate to combat income tax non-compliance in Malaysia.
Particularly attention needs to be given to the detection of tax evasion in Kuala
Lumpur.
As for failure to submit annual tax returns, the IRB should take actions such as
publicising in the mass media the consequences for failing to notify the change of
address to taxation authority. The Income Tax Law on withholding employees'
taxes will not be effective if the IRB does not act firmly on those employers who
failed to remit their employees' taxes and punish accordingly those who have
found guilty in evading their taxes. The IRB should properly implement the
current enforcement practice uniformly in all of its branches.
We also would recommend that the IRB adopt a better system of penalty and
sanction, to encourage taxpayers to settle their tax arrears quickly and to
discourage them from using legal challenges to delay payment of taxes which
have been correctly assessed. Hence the sanctions and penalties should be levied
promptly, should not be excessive but be determined on a percentage basis instead
of being a fixed amount. At the same time, the IRB also should give a good
example to taxpayers, by not delaying taxpayers' refund, and should try to
improve its administrative procedures, especially in dealing with taxpayers'
objections or appeals, which can influence taxpayers' compliance decisions. Thus,
it is recommended that the IRB should strengthen the current enforcement system,
as well as introducing new approaches in controlling this problem. The IRB also
should improve its current administrative procedures and adopt a better penalty
system.
XV

Working closely with third parties
Tax enforcement is a behavioural problem and its success depends on group
cooperation. Thus the IRB should work together with intermediaries in enforcing
voluntary compliance. The IRB administration should be effective in dealing with
this problem by strengthening its linkage with other organisations, for example by
making agreements with employers or other organisations that always deal with
pubHc.
With the introduction of Self-Assessment System, more taxpayers will be expected
to turn to tax professionals for assistance as mirrored in Australia (as discussed in
Chapter Five). As a consequence, tax practitioners are in a position to exert a
strong and direct influence on the compliance and tax administration process.
Hence it is wise for the IRB to tackle these tax professionals, work hand in hand
with them, in addition to amending Income Tax Legislation, to close some
possible loopholes that might be exploited by them. If their roles go beyond the
obligation to serve their taxpayers' interests, then introducing preparer penalties is
an option.
Adopting modern methods and skilful staff'in detection activity
Currently the IRB depends on traditional methods of information collection from
various resources, such as obtaining information through local knowledge, press
reports, assessment branches, informers, and the application of a means test.
These methods are not efficient ones, and hence the IRB should upgrade its
methods of detection.
It would be of great significance for the IRB to adopt modem tools of detecting
tax evaders, such as using computer analysis on the basis of Discriminant
Function Formulas or DIF, as adopted by the IRS in generating a probability of
recoverable tax revenue. In terms of improving the efficiency of the lodging of tax
returns, the IRB could adopt Electronic Lodgment Service. This would also be of
great help in detecting tax evaders, and is currently being used by the ATO. An
on-line operations system, linking various organisations to the IRB, would be of
great help in detecting abnormal amounts of payment made by taxpayers,
compared to their declared income in their annual tax returns. IRB also should
consider adopting the approach, used by the ATO, of Key Abnormal Tax Agent
XVI

Evaluation (KATE), for detecting tax practitioners whose clients' returns vary
significantly from the average of those of other tax practitioners in the same
region.
Modem technology requires skilful staff to operate the systems. Thus the IRB
should provide special training for its staff before adopting this modem
technology. Organisational success also depends on staff capabilities and their
skills in handling this problem effectively. Thus it is wise for the IRB to conduct
leadership program in improving its staff skills in coping with various issues
related to this problem.
In relation to cash economy tax evasion, the IRB should consider forming a Cash
Economy Task Force, as done by the ATO, to study this problem thoroughly and
to provide suitable strategies in dealing with taxpayers such as hawkers, small
traders and food stall owners. As suggested by our respondents, business
registration office also could play its role in improving income tax compliance,
whereby it should also include proof that the clients have been registered or
contacted with the IRB in approving their business licences.
Introduction of new income tax procedures for benefit-in-kind incomes
Regarding the benefit-in-kind incomes, the IRB could introduce Fringe Benefits
Tax as adopted by the ATO, which has been discussed in Chapter Five of this
research study. As seen in Chapter Six, the IRB should also assess and tax
partnership and tmst incomes separately, as done by the ATO, for the current
procedures of taxing fringe benefits, partnership and tmst incomes under
individual taxpayers have several weaknesses as discussed in that chapter.
Improving tax knowledge/education among the public
Tax education is necessary in increasing public awareness about taxation,
especially regarding taxation laws, the necessity of taxation for the development
of the country, in disseminating information such as where the collected taxes
have been channelled and so forth. It is also useful to educate taxpayers or
potential taxpayers regarding taxation and their share of responsibility to the
country. This could be in the form of dialogues, seminars or with cooperation of
Ministry of Education in introducing it as a subject in upper secondary schools or
xvu

college levels. Punishing ignorant taxpayers should not be the aim of the ERB.
Only the 'hardcore' that have the intention to evade their taxes should be
punished accordingly.
Introduction of new rules and regulations in respect of tax professionals
New regulations, such as permitting only registered tax preparers to represent
taxpayers and the introduction of new mles regarding lawyers who have been
found guilty in not complying with the IRB mles and regulations, are required.
These could involve submitting their names to the Bar Council, so that necessary
actions could be taken by this Council on its members, based on the mutual
agreement with the IRB to combat income tax non-compliance.
The IRB also should be firm with the offence committed by these practitioners if
they were found committing fraud in the process of preparing their clients'
accounts. They should be punished heavily and this should be made known to the
public, as a lesson to others. They could be black listed and their names published
in the IRB annual report.
Amendments to income tax law
Our respondents also suggest that the IRB should simplify the income tax law, so
that it could be uniformly interpreted by all income tax officers, hence leading to
uniform practice in all branches of the IRB. Amending of income tax law also
enable to close any loopholes that might provide opportunities for tax avoidance
and evasion is also required. Successful reduction of opportunities for non
compliance may permit more effective allocation of enforcement resources.
Additionally, if targeted properly, reducing opportunities for non-compliance can
also increase public support for tax compliance.
Upgrading research and development
Finally, besides expecting taxpayers to do their part, the IRB also should study its
weaknesses and try to upgrade or improve them. It could be helpful for the ERB to
measure or estimate tax evasion in Malaysia every year, so that it could compare
its performance from time to time, and this could lead to more efficient allocation
of resources. It should also study various methods of reducing the costs of
compliance and of simplifying the income tax law. Careful analysis of the
XVIU

environment in which it operates is equally important, for this is an essential part
of the development of successful business strategies.
XIX

List of Tables Page
CHAPTER TWO Table 2.1 Unexplained differences in national income measures, various countries
and years 32
CHAPTER THREE Table 3.1 Findings on the relationship between age and income tax non
compliance 39 Table 3.2 Findings on the relationship between gender and income tax non
compliance 42 Table 3.3 Findings on the relationship between income level and income tax non
compliance 45 Table 3.4 Industries and the rate of compliance in the U.S. 49 Table 3.5 Findings on the relationship between income source and income tax
non-compliance 50 Table 3.6 Findings on the relationship between financial strain and income tax
non-compliance 54 Table 3.7 Findings regarding the relationship between complexity and income tax
non-compliance 55 Table 3.8 Findings on the relationship between the use of tax preparer and income
tax non-compliance 59
CHAPTER FOUR Table 4.1 Compliance rates for different classes of income for the United States
1981 and 1987 (percentages) 73
CHAPTER FIVE Table 5.1 All levels of Australian government - taxes on income and employers'
payroll taxes (A$ millions) 99 Table 5.2 Tax collected by the Prescribed Payment System 101 Table 5.3 Consequence of failure to quote a tax file number 102
CHAPTER SIX Table 6.1 Tax components of direct taxes in 1995,1996 and 1997 120 Table 6.2 Derivation of adjusted gross income and AGI gap, U.S., 1996 and 1997
(billions of dollars) 125 Table 6.3 The BEA and IRS measures of AGI, AGI gap and relative AGI gap,
1959-97 (per cent) 126 Table 6.4 Unreported income adjustment, Australia national Accounts, 1994-95 to
1998-99 128 Table 6.5 Estimates of taxable income arising from economic activity, Australia,
1994/95, 1995/96 and 1996/97 (A $billions) 131 Table 6.6 Taxable income declared to the AusfraHan Taxation office, 1994/95,
1995/96 and 1996/97 (A Sbillions) 134 Table 6.7 fricome tax gaps, Australia, 1994/95, 1995/96 and 1996/97 (A $billions) 135 Table 6.8 Estimates of taxable income arising from economic activity, Malaysia,
1995,1996 and 1997 (RM billions) 138 Table 6.9 Taxable income declared to the IRD/IRB, 1995, 1996 and 1997 (RM
bilHons) 139
XX

Table 6.10 Tax rates for disposal of real property gains income for Malaysia 140 Table 6.11 hicome tax gap, Malaysia in 1995, 1996 and 1997 (RM billions) 140 Table 6.12 Ratio of taxable individuals for Malaysia and Australia for the three
years under study 143 Table 6.13 Selected personal income tax deductions allowable, Malaysia, 1998 144 Table 6.14 Example of tax computation for household with combined assessment
in Malaysia for year 1997 145
CHAPTER SEVEN Table 7.1 Failure to retum issued forms 156 Table 7.2 Failure to retum issued forms among individual taxpayers 158 Table 7.3 Total rate of non-retum in submitting annual tax forms among
individual taxpayers 15 9 Table 7.4 Total rate of non-retum in submitting annual tax forms among
companies and other organisations 160 Table 7.5 Response on the seriousness of income tax non-compliance in Malaysia 161
CHAPTER EIGHT Table 8.1 File data: Distribution by IRB branch and type of taxpayer 164 Table 8.2 Interview data: Distribution of officers interviewed, by IRB branch,
gender and working experience 165 Table 8.3 Nature of omission from file data 166 Table 8.4 Response on the common nature of income tax omission 168 Table 8.5 Percentage by gender of the labour force 170 Table 8.6 Distribution of age levels and gender of the file data 171 Table 8.7 Relationship between mean of total income omitted, mean tax evaded
and mean penalties imposed and age levels 173 Table 8.8 Percentage by gender of the labour force, Malaysia, 1997 174 Table 8.9 Percentage distribution of the gender of tax evaders from file data 175 Table 8.10 Results based on interview with IRB officers regarding gender of tax
evaders 176 Table 8.11 Relationship between gender and total income omitted, tax evaded and
penalty imposed 177 Table 8.12 Income levels of Malaysian taxpayers 178 Table 8.13 Results based on file data on income level from four different
branches of IRB 179 Table 8.14 Interview results with income tax officers regarding income levels of
tax evaders 180 Table 8.15 Relationship between total income omitted, tax evaded and penalty
imposed and income levels 181 Table 8.16 Distribution of total active files in the whole of IRB 183 Table 8.17 Classification of file data according to their file types 183 Table 8.18 Types of files in relation to mean income omitted, mean tax evaded
and mean penalty imposed 185 Table 8.19 Summary on reasons given for income tax non-compliance based on
file data 187 Table 8.20 Relationship between total income omitted, tax evaded and penalty
imposed and reasons of non-compliance based on file data 188 Table 8.21 Scores on interview of income tax officers regarding reasons for non
compliance 190
XXI

Table 8.22 Relationship between total income omitted, tax evaded, penalty imposed and the use of tax agent 192
CHAPTER NINE Table 9.1 Estimated percentage of tax evaders in four different branches of IRB 198 Table 9.2 Investigation and omission cases from four branches of IRB 201
XXll

Abbreviations/acronyms
ABA = American Bar Association ABS = Australian Bureau of Statistics AGI = Adjusted Gross Income ATO = Australian Taxation Office BEA = The U.S Bureau of Economic Analysis CATA = Commonwealth Association of Tax Administrators CPAs = Chartered Public Accountants CSA = Child Support Agency DIF = Discriminant Function Formulas ELS = Electronic Lodgment Service EPF = Employees' Provident Fund EU = European Union EWH tax evasion measurement = Elffers, Weigel and Hessing tax evasion measurement FBT = Fringe Benefits Tax GAO = General Accounting Office, US GDP = Gross Domestic Product GNI = Gross National Income GNP = Gross National Product GOS = Gross Operating Surplus HE = Hidden Economy INB = Individual non-business lOB = Interest on Outstanding Balance IRB = Inland Revenue Board IRC = Internal Revenue Code IRD = Inland Revenue Department IRS = Intemal Revenue Service, U.S ITA = Investment Tax Allowance KATE = Key Abnormal Tax Agent Evaluation LB&I = Large businesses and intemationals business line LFS = Labour Force Survey MIDA = Malaysian Industrial Development Authority MPPC = Taxpayer's Service Week in Malaysia NFPEs = Non-Financial Public Enterprises NPA = National Income and Product Account NNI = Net National Income OG group = Other groups or non-salary eamers PAYE = Pay As You Eam PPS = Prescribed Payment System RA = Reinvestment Allowance R&D = Research and Development
XXIU

RPS = Reportable Payments System SBI = Small business income SECA = Self-employment taxes SEE = Survey of Employment and Eamings SGATAR = Study Group on Asian Tax Administration and Research SG group = Salary eamers group STD = Schedular Tax Deduction TCMP = Taxpayer Compliance Measurement Program TFN = Tax file number TIA. = Taxation Institute of Australia UK = United Kingdom US = United States VAT = Value added tax VRPs = Voluntary Reporting Percentages
XXIV

CHAPTER ONE
Introduction
1.1 Introduction to Malaysia
Malaysia consists of peninsular Malaysia with an area of 131,573 sq. km., and
Sabah, Sarawak and Wilayah Persekutuan Labuan with an area of 198,068 sq. km.
Its population of 21.67 million (Dept. of Statistics, 1997, pp. 2, 37) is characterised
by two broad categories, bumiputera (natives) and non-bumiputera (non-natives).
The former comprises the largest percentage of the total population, more than 56
per cent. The Malay, non-Malay bumiputera or Malay-related, and aborigines Orang
Asli form the bumiputera community.
The Malays include the Javanese, Bugis, Minangkabau in West Malaysia and the
Bajau of Sabah. The non-Malay bumiputera are mainly found in Sabah and
Sarawak. They are the Iban, Bidayuh or Land Dayaks, Melanau, Kenyah, Kayan and
Bisayah, who live in Sarawak. The Kadazan or Dusun, Mumt, Kelabit, and Kedayan
are found in Sabah. Racially, these bumiputeras originate from the same roots.
However, in West Malaysia, the aborigines comprising of more than 62,000 people
that include the Negritos, Senoi and Proto-Malay are spread out in small groups
throughout its eleven states. The Chinese, Indians and others form the non-
bumiputera community. They are distributed throughout West Malaysia (also known
as Peninsular Malaysia) and East Malaysia, which consists of Sabah and Sarawak
(Hock, 1991, pp. 117, 118). Basically, the Chinese are descendants of immigrants
who had left the shores of mainland China and are the predominant group in the
non-bumiputera community. They constituted about 34 per cent and 46 per cent of
the population in West and East Malaysia respectively in 1980. The Indians, also of
immigrant ancestry, are mainly found in West Malaysia. The others, comprising the
Arabs, Sinhalese, Eurasians and Europeans, are found throughout Malaysia.
According to the Seventh Malaysia Plan (1996, pp. 109-111), the manufacturing
sector forms the highest employment sector, which registered rapid output growth.

accounted for about one quarter of total employment and generated about 49 per
cent of net employment creation during 1991-95. The sfrong demand for labour in
this sector, which was growing at 9.0 per cent per annum during this period, coupled
with industrial restmcturing towards higher value-added products and activities,
resulted in labour shortages not only at the production level but also at the skilled
and semi-skilled levels. The services sector accounted for about one-half of total
employment and about 42 per cent of total job creation during 1991-95. The major
contributors to employment in this sector were the finance subsector, and the
wholesale and retail trade, hotels and restaurants subsector and the other services
subsector, which together created 443,500 jobs. Employment in the constmction
sector grew at an average rate of 9.2 per cent per annum and accounted for about 19
per cent of total job creation. Employment in the agriculture sector declined by 3.6
per cent per annum, as a result of a slower growth of output and increasing
mechanisation in the sector. The decline in agricultural employment translates into a
reduction of an estimated 309,300 jobs during 1991-95. This sector continued to
face labour shortages as local labour moved into other economic sectors because of
better prospects and wages.
Currently, there are about 2.3 million active taxpayers registered on the Inland
Revenue Board (IRB) tax roll consisting of individual taxpayers, corporations,
partnerships, tmsts, clubs and associations, and joint ventures.
1.2 The Malaysian Tax System and Tax Non-Compliance
The basis of the current tax system was introduced by the British into the Federation
of Malaya in 1947 and is based on R.B. Heasman's report (Singh, 1997, p. 4; Asher,
Ismail and Datuk Kamal Salih, 1994, p. 83). This was in the form of the Income Tax
Ordinance 1947, which was subsequently repealed and replaced by the Income Tax
Act 1967. This latter Act came into effect on 1 January 1968. Thus the current tax
system of Malaysia has its roots in the British system. The 1967 Act consoUdated
the three laws of income taxation which were then in existence in parts of Malaysia:
the Income Tax Ordinance 1947, which was only applicable to Peninsular Malaysia;
the Sabah Income Ordinance 1956, which was only appUcable to Sabah; and the
Sarawak Inland Revenue Ordinance 1960, which was applicable to Sarawak only.
Since the formation of Malaysia in 1963, these three separate taxation laws

continued to be in existence until the introduction of the Income Tax Act 1967
(Singh, 1997, p. 4).
The administration of taxation in Malaysia is under the supervision of the Ministry
of Finance, and the Head Office is in Kuala Lumpur. However, the Inland Revenue
Board Act 1995, which came into force on 1 March 1996, established the Inland
Revenue Board (IRB), replacing the Inland Revenue Department (IRD), to act as the
Government's agent in the administration, assessment, collection and enforcement
of the payment of, inter alia, income tax and real property gains tax (Kheong, 1997,
p. 2). It is headed by a Chief Executive/Director General who is assisted by three
Deputy Directors General and a number of Heads of Sections. These officers have
most of the statutory responsibilities for the administration of the tax laws.'
The taxation assessment fiinction of the IRB has been decentralized. There are 34
assessment branches of which 25 of them were situated in the Peninsular of
Malaysia, 5 branches were found in Sabah and 4 branches were in Sarawak as at
year-end 1997. The taxation collection fiinction has been centralized. The Kuala
Lumpur branch is collecting for the whole of peninsular Malaysia, while the Kota
Kinabalu branch is collecting for the Sabah and the Kuching branch is collecting for
the state of Sarawak.
Based on the Economic Report 1996/1997, published by the Ministry of Finance,
about 81 per cent of the Federal Government's revenue for 1996 came from taxes, of
which direct taxes accounted for nearly 44 per cent of the total revenue. Direct taxes
include taxes on income, real property gains tax and stamp duty.
As in other countries, Malaysia suffers from revenue loss due to the problems of
income tax non-compliance and income tax evasion. On average, about 30 per cent
of all taxpayers fail to submit their annual retums to the Inland Revenue
Department, and more than 12,000 each year face prosecution for failing to file
complete retums (Mahfar, 1994; IRD, 1992a). This low level of tax compHance is
thought to come from a number of factors. Mahfar listed four main factors. First, the
public has traditionally maintained a reactive role in regard to taxes, because the law
was administered by the British government before Malaysia gained its
independence, and tax rates were maintained at very high levels (Commonwealth

Association of Tax Administrators [CATA], 1989). Second, Malaysia is burdened
by low levels of tax literacy (ABA, 1989; Chelvathurai, 1990, pp. 594-599).
Mikesell (1974, pp. 615-624) argues specifically that literacy estabhshes limits for
types of taxes that can be considered and Chelvathurai (1990) suggests that
complicated forms could not be used where literacy levels are low, particularly in
developing countries. Moreover, the size of the potential tax base is determined by
the nature of the economy within the taxing jurisdiction, for example, the resources,
socio-demographic pattems, and geographic stmcture (Wai, 1962, pp. 428-447).
Third, most small businesses and self-employed individuals deal in cash transactions
and do not keep proper records (Soos, 1991; ABA, 1989). This can lead them to
under-estimate their receipts and to inflate business expenses, which may include
personal expenses. Fourth, Malaysia changes its tax laws every year in response to
the constant changes in the economy, ensuring that the tax system will promote
economic growth and broaden the tax base. Thus the income tax laws are becoming
more complex and less comprehensible to the general public.
Non-compliance occurs when persons or organisations liable for tax: (a) fail to file
retums; (b) under-report income; (c) over-state deductions; and (d) fail to pay the
correct amount of tax (see Surrey, 1958; Kaldor, 1963; Allingham and Sandmo,
1972; Spicer and Lundstedt, 1976; Clotfelter, 1983; Goode, 1981; Witte and
Woodbury, 1985; Spicer, 1986; American Bar Association [ABA], 1988; Soos,
1991). Some scholars draw distinctions among different terms used to refer to tax
non-compliance, such as tax cheating, evasion, errors and misreporting, while others
seem to use these terms interchangeably. However, it is difficult to distinguish
among types of tax non-compliance: at one extreme, there are the serious criminal
tax evasion schemes; at the other, there are simple under-reporting and over-
reporting errors (Long and Swingen, 1991). It is difficult to understand the deviant
aspects of taxpayer decisions without first understanding the factors that influence
compliance. The choice between compliance and non-compliance may only be a
matter of opportunity, convenience, or even interpretation of the law (Allingham and
Sandmo, 1972; Klepper and Nagin, 1989a, 1989b).
As a developing country, it is very important for Malaysia to increase its revenue
while maintaining the tax rates at a low level to foster its economic growth.

Therefore an increase in revenues through a reduction of tax evasion and avoidance
is one of the options for achieving higher revenue while maintaining low tax rates.
In line with the Finance Minister's 1999 budget speech, the IRB would be made
more efficient and transparent through "reformation and the level of integrity of the
administration of IRB would assist in preventing tax evasion and revenue loss" (p.
25). Thus the government is concemed with tax evasion and avoidance for two
principal reasons: it harms the interests of the general public, and it harms the means
by which the state can look after the interests of the general public (Cowell, 1990,
pp. 45, 46).
The interests of the general public are broadly represented by goals for achieving
social justice and efficiency in pursuing economic policy. However, the activity of
tax evaders may fiiistrate the pursuit of each of these two objectives. In terms of
social justice, the rich may be more able to avoid tax while the poor have to pay
their share, which offends one's sense of distributional justice. Some principles of
equity are being violated. In terms of efficiency, the administrative costs of
enforcing taxes can be increased by the uncertainty caused by the game of "hide and
seek" in dealing with these tax evaders.
Tax evasion also can have a major impact on the stracture of prices and incomes,
and can distort the effectiveness of macroeconomic policy. It can erode the tax base
and, in some circumstances, make the effect of alterations in tax rates indeterminate
and unpredictable. The apparent elasticity of labour supply and public revenue with
respect to tax rates may have less to do with conventional factors such as work
disincentives, than with the inducement to conceal income and productive activity.
The observed unemployment figures may be unreliable indicators of the economy's
performance if a substantial proportion of workers are in the black economy.
1.3 Previous Findings on Tax Non-Compliance in Malaysia
Currently there are only two published research studies that have been conducted in
Malaysia regarding income tax non-compliance. The two are outlined below. One
concems tax ethics and taxpayers attitudes, whilst the other is in regard to the
analysis of aspect of the Malaysian income tax system that promote tax avoidance
amongst taxpayers.
1.3.1 Findings about tax ethics and taxpayer attitudes among the Malaysians
Sabri (1993) found in his survey sampling in the Kuala Lumpur and Petahng Jaya
areas that although respondents did not condone tax cheating, they believed that it
was fairly widely practiced.
In the 7-point Likert-type scale ranging from 1 (Strongly disagree) to 7 (Strongly
agree), it was found that the respondents generally disagreed with the following
statements: tax evasion is not a serious offence (mean score was 2.50); taxpayers
need not voluntarily give information about illegal activities (mean score was 2.71);
and using tax loopholes is acceptable (mean score was 2.96). Meanwhile
respondents agreed with the statement that tax cheaters should be reported to the
government (mean score was 5.65). Hence the respondents felt that tax cheating is a
serious offence and they have an obligation to report tax cheaters to the authority,
and using tax loopholes to avoid paying taxes is morally wrong. However, they were
quite neutral with regard to the following statements: the main thing in dealing with
the Income Tax Department is not to get caught (mean score was 3.67); one should
be fined but not jailed for tax cheating (mean score was 3.97); and, the average
taxpayer should not be expected to obey all his tax obligations because of the
loopholes favouring the rich (mean score was 3.97). It can be seen that the
respondents were neutral on the type of penalty for tax cheating. They were
probably reluctant to make a stand on the penalty issue because they may have to
face penalties if their illegal acts are discovered.
On the behavioural dimensions, Sabri (1993) adopted the Song and Yarbrough's
scale to measure aspect of tax ethics (1978, pp. 442-452). Respondents were asked
to guess the proportion of taxpayers who committed a given set of tax related
offences. They were asked to respond on a 5-point scale from 0 to 4 where: (0) don't
know, (1) very few people, (2) a few people, (3) some people and (4) most people,
commit the offence in question. The type of offences and their mean score were as
follows: (1) not reporting some income (mean score was 2.70); (2) over-claiming
business expenses (mean score was 2.64); (3) falsifying supporting documents
(mean score was 2.15); (4) not filing a tax retum (mean score was 2.15); (5) not
providing complete information (mean score was 2.15); and (6) not replying to
letters from the tax authorities (mean score was 2.20). Thus Sabri found that an

average the individuals surveyed believed that these offences were committed by
more than a few people.
Sabri found that the attitudinal dimension of tax ethics was negatively correlated to
the behavioural dimension. This means that those with strong attitudes against tax
evasion tend to believe that others comply with the law. On the other hand, those
who have low scores tend to believe that others cheat in filing their tax retums. He
also found that there were significant differences in attitudinal tax ethics among
demographic groups by sex, age, occupation, household income and educational
background. Female respondents had a slightly higher level of tax ethics than male
respondents. The highest level of tax ethic scores was found among the respondents
aged between 30 to 39, followed by aged 50 years or more and the third aged ranged
between 40 to 49. Respondents aged 29 and below had the lowest level of tax ethics.
It was also found that respondents in the public sector had the highest level of tax
ethics, compared to respondents employed in the private sector and self-employed.
In terms of monthly household income, it was found that higher income respondents
(monthly personal income above RM6000) had a higher level of tax ethics compared
to low income respondents (income below RMIOOO had the lowest). Respondents
with a higher level of education tend to have a higher level of tax ethics. However,
there were no significant differences in level of attitudinal tax ethics among the
demographic groups by race and marital status.
In terms of tax knowledge, the scale was developed by the researcher to assess the
respondents' tax knowledge and experience. They were asked in closed and open-
ended questions about tax regulations and the questionnaires were designed to assess
respondent's perception of and readiness for the self-assessment system of income
tax. The tax knowledge scores of the respondents ranged from as low as 0 to as high
as 12 against a maximum possible score of 16. In terms of age, respondents aged 30
to 39 had the highest score, followed by those aged 40 to 49. Respondents below 29
years of age had the lowest score. The mean tax knowledge score was 7.38. This
indicates that the Malaysian public is not well informed about taxation. When asked
whether they are interested in learning more about the Malaysian income tax system,
only 33.9 per cent gave a positive answer.

Regarding the administrative efficiency of the taxation office, the respondents rated
the department as fairly efficient with a mean score of 3.14, where the score lies
between 1 to 4, with 1 marking extremely inefficient and 4 marking highly efficient.
However, the respondents criticised the government bureaucracy and denounced it
for alleged inefficiency. They also expressed their dissatisfaction with the
dissemination of public information on taxation.
Since the findings reviewed above are based on convenience sampling among the
Malaysians who live in Kuala Lumpur and Petaling Jaya, they cannot be generalized
to the taxpayers of Malaysia as a whole. Further, Sabri (1993) explored the tax
ethics and attitudes of Malaysian taxpayers and not the characteristics of those who
fail to comply with the taxation office. Thus it is one of the aims of this research to
study these characteristics intensively, by extracting the non-compliance files in
different regions (Zones) of Malaysia. Further, Sabri's self-administered interviews
could affect the response obtained, especially in terms of obtaining an honest answer
to sensitive questions due to the presence of the interviewer. Thus this research is
undertaken to study the characteristics of these non-compliants by referring to their
personal income tax files instead of interviewing them. Further, some Malaysian
income tax officers were also being interviewed, to draw on their personal
experience regarding these non-compliants. Thus there will be some supporting
evidence for studying the characteristics of those who fail to comply.
1.3.2 Income tax avoidance in Malaysia
Wallschutzky and Singh (1995) explored the Malaysian Income Tax Legislation and
found some loopholes in it that might contribute to income tax avoidance in
Malaysia. Major loopholes that they discussed are as noted below.
1.3.2.1 Discrepancy between law and compliance
Wallschutzky and Singh (1995, pp. 42-71) argued that, although there is an anti-
avoidance provision (s 140) and some specific provisions like s 65, paragraphs 38,
39, 40, and 62 to Schedule 3 of the Income Tax Act 1967 to deter avoidance, there is
a gap where some people manage to squeeze through. These provisions give various
powers to the revenue authority to inspect records, have access to premises, request
information and impose penalties where incorrect information or retums have been

lodged. Section 82 of the Income Tax Act 1967 requires every taxpayer carrying on a
business to keep and retain sufficient records to enable the IRB to ascertain income
or loss from his/her business. Further, a duplicate copy of every receipt issued must
be made within 60 days of each transaction. It is also stated that the Director General
of the Inland Revenue may specify by statutory order (or by a written notice to a
taxpayer) the form of records to be kept, the manner in which they shall be kept and
retained, the form of receipts to be issued, duplicate receipts to be retained, and the
manner in which the receipts shall be issued or retained. The issue of receipts may
be dispensed with if automatic cash registers are used. However, s 82(4) states that
the Director General may waive all or any of the provisions regarding the keeping of
records and the issuing of receipts. Thus there is a gap in the income tax legislation
that might be exploited by some groups of taxpayers regarding their record keeping
and issuing receipts. The existing discrepancy between law and compliance in
adequacy of record-keeping requirements might lead to arbitrary assessment,
cormption and a general disregard of the law.
Generally, individuals carrying on businesses are not required to submit audited
accounts with their tax retums except for limited companies (which are mandatory
for all companies incorporated under the Companies Act 1965). Hence, this might
offer a loophole and be exploited by the former to their advantage.
Under the Malaysian Income Tax Act 1967, benefits-in-kind income such as
motorcars and related benefits, living accommodation, household fiimishings,
apparatus and appliances, gardeners, domestic servants and so forth are taxable.
However, some might escape paying taxes due to the failure of their employers to
declare this income provided to their employees, for they are not certain of the
valuation of such benefits. This could be due to the lack of guidelines and the lack of
effective monitoring by the taxation office, giving the impression that this income is
not important to report. As suggest by Wallschutzky and Singh (1995), a fiinge
benefit tax may need to be considered by the IRB for this type of income.
1.3.2.2 Withholding tax requirements and PAYE
The withholding tax requirements only apply to the non-residents. However, it does
apply to residents in the case of interest income that is paid or credited by various
deposit-taking institutions such as banks, finance companies and cooperative

societies (Wallschutzky and Singh, 1995, pp. 42-71). The Malaysian personal tax
deduction provisions are therefore inadequate for not only are they not based on
income as it is earned but they rely on information provided by the taxpayer.
Elsewhere PAYE (with the exception of the UK) systems generally are based on
deducting tax as it is eamed in the current year. Hence such arrangements have the
added safeguard of third party (employers) involvement in determining how much
tax is to be deducted. Under the Malaysian system, if employees make false retums
by way of overclaiming deductions, they have the added incentive of lower tax
instalments in the subsequent year. Thus failure to deduct tax at source might
increase the scope for evasion.
The PAYE system has been operating in Sabah and Sarawak since 1968. It had
never been applied to Peninsular Malaysia before 1 January 1995. Instead, deduction
directives were issued to employers, specifying the amount of tax payable per the
previous notice of assessment. However, the schedular PAYE) tax deduction scheme
applicable in Sabah and Sarawak has been modified and extended to cover
Peninsular Malaysia with effect from 1 January 1995 for taxpayers who commenced
employment anytime after or on this date. However, all others in Peninsular
Malaysia who commenced their employment before this date began operating PAYE
system in 1999. The Schedular Tax Deduction Scheme or STD is a system whereby
payment of tax is effected through a scheme of deductions from the monthly
remuneration of each person receiving employment income. It is made in
accordance with a schedule, which stipulates the relevant amounts of tax to be
deducted and remitted to the IRB each month. Thus this issue identified by
Wallschutzky and Singh has been substantially addressed.
1.3.2.3 Detection of evasion
Investigation officers from all investigation and intelligence centres throughout the
nation carry out prevention and detection activities. The selection of cases for
investigation is done manually and involves information obtained through local
knowledge, press reports, assessment branches, informers, and application of a
means test. These methods as noted by Wallschutzky and Singh (1995), were not the
most efficient ones hence it was recommended that the IRB should upgrade its
information system for selecting cases for audit.
10
Wallschutzky and Singh (1995) also found that from 1981 to 1991 the number of
cases that had been finalised by the hivestigation Branch had increased by 1.78
times whereas the tax and penalties recovered therefrom had increased by 3.44
times. This could indicate that the Inland Revenue should continue to emphasise this
activity or, on the other hand, it might indicate that, notwithstanding a greater
number of cases being finalised, taxpayer compliance (as measured by tax and
penalties recovered) is getting worse. Further, they suggest that the Inland Revenue
Board should not only continue enforcement activity but also must be seen to be
pursuing enforcement activity, so that it can increase taxpayers' perception of, and
their awareness of, the level of enforcement.
1.3.2.4 Adequacy of the penalty structure
Penalties can be imposed by the IRB under the provisions of the Income Tax Act
1967. Although the severity of the penalties varies with the nature of the offence, the
amount of the penalty is frequently based on the discretion of the Director General
(as the law only stipulates maximum penalties). Similarly, if a taxpayer has been
successfiilly prosecuted in the courts, the court has the discretion to determine the
fine to be imposed. The Director General also has the power to compound offences
before the case is due for prosecution in court. In practice, the maximum amount of
penalty is usually not imposed. This reveals some weaknesses in the Malaysian
penalty provisions, particularly the fact that the maximum penalties are in currency
of fixed amounts. Some drawbacks are as follows:
1. over time, they lose their significance as they are eroded by inflation, and
2. it might not be possible to discriminate adequately between large and small
offences.
Further, Wallschutzky and Singh (1995) recommend a better system of penalties that
would be based on the percentage of tax that was not paid or, altematively, fixed
dollar amounts could be indexed to account for inflation.
1.3.2.5 Adm inistrative procedures
Wallschutzky and Singh (1995) argued that there are unbalanced administrative
procedures whereby the department imposes strict time limits whenever a taxpayer
is required to act and no corresponding time limits are imposed on the Director
General. They also pointed out that if income tax is not paid within the stipulated
11

time limits, a penalty is imposed. On the other hand, if the department delays
refiinding any amount due to the taxpayer, no penalty (in the form of interest) is
imposed. Additionally, it has been established in a number of court decisions that,
once an assessment has been issued, the tax assessed must be paid notwithstanding
an appeal. Regarding appeals, especially to the Special Commissioners of Income
Tax (if the taxpayer is dissatisfied with the Director General's decision on his
objection), in practice it is not a speedy process and it may remain unresolved for a
considerable period of time. All of these weaknesses on the part of the department
could have an impact on taxpayers that can influence their compliance decisions.
1.4 Aims and Methods of the Current Research
1.4.1 General aims
As previously noted, Wallschutzky and Singh have explored the Malaysian Income
Tax Legislation and found several loopholes that might contribute to income tax
avoidance in Malaysia (as discussed above). However, they did not address the scale
of income tax non-compliance nor the characteristics of those who exploit these
opportunities. Thus the main aim of the research undertaken for this thesis is to fill
this gap, by assessing the extent of income tax non-compliance in Malaysia and
document the characteristics of those involved in non-compliance. Some strategies
for overcoming this problem, that are being utilised by some advanced countries in
combating income tax non-compliance and may be of some value in Malaysia, are
also suggested. Some empirical evidence is gathered from the Australian Taxation
Office (ATO) to strengthen this argument, and to suggest ways of leaming from
their experience in overcoming this problem in Australia.
1.4.2 Speciflc aims
There are three main specific aims of this study:
1. To assess the extent of income tax non-compliance in Malaysia, using analyses
based on national accounts data, detailed data on individuals who have failed to
comply (omission records) and a survey of the income tax officers (interview
data).
2. To study some characteristics of individuals who did not comply with the income
tax law and some of the factors contributing to this problem, by using the omission
records and interview data.
12

3. To suggest some improvement strategies by studying some weaknesses of the
current enforcement. Interviewing income tax officers and reviewing compliance
strategies in Australia.
L4.3 Five components of methodology
There are five components of the methodology involved in the empirical part of this
study to achieve these aims. The first three components are related to assessing the
extent of income tax non-compliance in Malaysia and the fourth approach is used to
identify some characteristics of individuals who have failed to comply with the
income tax law. The fifth component is related to examining the weaknesses of the
current enforcement of the IRB and to identifying ways to overcome this problem.
Component 1 - the gap approach
This approach relates taxable income as reported by the taxation authorities to a
measure of taxable income derived from other sources, normally the national
accounts. The difference between the two estimates of taxable income can, in
appropriate circumstances, be used to assess the total dollar value of income tax
non-compliance, using the methodology detailed in Chapter Six. The essence of the
gap methodology for assessing the level of tax non-compliance is to derive an
estimate of a measure of taxable income (either total taxable income or personal
taxable income) from national accounting sources, and to compare this estimate with
the figure for the equivalent taxable income variable as reported in the official
taxation statistics. The former measure is referred to as derived taxable income,
while the latter measure is termed reported taxable income. Given certain
conditions, the difference between these two measures can be considered as a broad
indicator of the level of tax non-compHance.
Applications of the gap method to the U.S. and Australia are also discussed in
Chapter Six, to provide some guide to the conclusions that can be drawn from the
application of this method to Malaysia. One important issue which arises in the
application of this method to Malaysia was that of the coverage of the tax system -
the extent to which potential taxable private income is in fact liable for tax under
Malaysian tax law - and this is also examined in Chapter Six.
13

Component 2 - Non-compliance among registered taxpayers
Each year the Malaysian IRB issues tax forms to individuals and organisations listed
on its master files as liable for income tax. Thus another approach to assessing the
level of income tax non-compliance that is used is an analyses of failure in
submitting annual retums in the years of 1995-1997 in Malaysia, among all
registered taxpayers and other individuals that have been issued with armual income
tax retums in these three years. In particular, the method involves collecting and
analysing data on:
1. the total number of retum forms issued by the IRB for the year of 1995, 1996
and 1997, and
2. the total number of completed retum forms received by the IRB for these
years.
The resulting analysis is reported in Chapter Seven.
Component 3 - Estimating the seriousness of income tax non-compliance through
income tax officers
As part of the data collection for this research, fifteen income tax officers from each
branch of four different branches of IRB, i.e. from Pulau Pinang (representing
northem part of Malaysia), Kuala Lumpur (representing central part of Malaysia),
Johor Bahm (representing southern part of Malaysia) and Kota Kinabalu
(representing East Malaysia), were interviewed regarding the seriousness of income
tax non-compliance in Malaysia. This was part of a broader survey of other views
and attitudes, directly particularly to the characteristics of individuals who did not
comply and the reasons for non-compliance. The views of tax officers on the extent
of non-compliance is used in Chapter Seven as a fiirther indicator.
Component 4 - Studying a profile of income tax non-compliance in Malaysia
There are two aspects of the methodology used to study the characteristics of
individuals who do not comply. The first is through studying the IRB records on
individuals found to have failed to comply (the omission records or file data) and the
second is through the interviews of income tax officers (interview data).
A sample of individual tax evaders' files that have been found guilty of evading
their income taxes in the years of 1995, 1996 and 1997 was chosen from four
different branches of the IRB of Malaysia (addressed here as file data). These four
14

different branches are chosen based on their geographical location in Malaysia and
on the fact that the total number registered taxpayers in these areas are much higher
than in other areas. They are as follows: Kuala Lumpur branch, representing central
part of Malaysia; Pulau Pinang branch, representing northem part of Malaysia;
Johore Bahm branch, representing southem part of Malaysia, and Kota Kinabalu
Branch, representing East Malaysia. The nature of omission reported in each file is
noted and analysed in Chapter Eight of this research study.
The other method used to understand the characteristics of individual who did not
comply is through interviews of income tax officers (addressed here as interview
data). Tax officers who were especially experienced in dealing with non-compliance
were chosen, in the expectation that their views would be most well informed. The
results of this analysis are presented in Chapter Eight of this research study.
Component 5 - Studying some weaknesses of the IRB in overcoming income tax non
compliance, and suggesting some strategy improvements to overcome this problem
A range of methods are employed during the empirical study to identifying the
effectiveness of the current approach of the IRB to combatting non-compliance.
These effectiveness include an examination of the success rate of audit activity and
of the adequacy of the penalty system, which are included in Chapter Nine.
In considering improvement strategies, the study draws on those emerging from a
review of the literature on measures taken to address non-compliance by other
income tax authorities, such as the ATO (Australia) and the IRS (U.S.). These are
discussed in Chapter Nine of this study. Some suggestions that have been made by
the respondents (income tax officers), and by Wallschutzky and Singh (1995),
Mahfar (1994), and Sabri (1993) are also considered. Some weaknesses of the
current taxing procedures of the IRB are also highlighted, and compared with the
current taxing practice of the ATO. However, the recommended strategy
improvements were not empirically tested for their effectiveness.
1.5 Chapter Development
A review of the literature for other countries, on the nature and extent of income tax
non-compliance and on ways of measuring it, is provided in Chapter Two. This
chapter also discusses the importance of studying income tax non-compliance for
15
policy makers and economists. Chapter Three explores the overseas literature on the
characteristics of persons who do not comply, concentrating on their age, gender,
income level and income source. It also discusses some literature on possible causes
of income tax non-compliance, such as financial strain, income tax complexity and
the direct influence of tax preparers on the compliance process.
Chapter Four reviews the Hterature on strategies used in overcoming income tax
non-compliance, such as preventive actions, strategies to change taxpayers' attitudes
and some positive approaches in some advanced countries. Some preventive actions
explored are audit plans, withholding of taxes, sanctions and preparer penalties.
There are four main strategies in changing taxpayers' attitudes which have been
discussed in the literature. They are as follows: reinforcing positive attitudes by
introducing reward systems or acknowledging those who had been audited without a
single adjustment; informing taxpayers about the use made of the revenue collected;
raising awareness of the importance of good service among tax office staff, and
publicising the benefits to existing and potential taxpayers of the increased range of
goods and services which could be made available through increased tax revenue.
Chapter Five discusses the taxation system in Australia, giving a special reference to
individual taxpayers. This chapter also explores some policies adopted by the
Australian Taxation Office (ATO) such as the introduction of the Self-assessment
System and Fringe Benefits Tax (FBT), the Prescribed Payment System (PPS) and
the Pay-As-You-Eam (PAYE) System. In terms of technology, it explores the
Electronic Lodgement Service (ELS), Key Abnormal Tax Agent Evaluation (KATE)
and control of non-filers. In improving the relationship between the community and
the tax office, the ATO launched the Taxpayers' Charter. This chapter also explores
enforcement and punishment, and the role of marketing within the ATO in
combating income tax non-compliance. It also covers action being taken by the
ATO in upgrading its staff, such as staff development and training.
Chapter Six introduces data sources from the national accounts in Malaysia and in
Australia. It also describes types of income assessed by the revenue offices in these
two different countries. Further, it analyses direct taxes in Malaysia, and discusses
the results on the extent of income tax non-compliance in Malaysia and Australia
using the gap approach based on national income accounts and taxation statistics. It
16
then compares the results between these three different countries and gives some
possible explanations on the difference found. In interpreting these results, its
necessary to explore the coverage of the income tax system in Malaysia.
Chapter Seven discusses indication of the extent of income tax non-compliance
based on Component 2 and the views the seriousness of income tax non-compliance
through income tax officers of the IRB (Component 3). The results from these two
different approaches are drawn with the findings in Chapter Six.
Chapter Eight analyses the characteristics of individuals who do not comply through
file data and interview data. It then discusses the results of the characteristics of
those involved in income tax non-compliance, derived from data gathered from four
different branches of the IRB. Age level, gender, income level and income source
are the characteristics studied. Possible reasons for non-compliance, such as
financial strain and the use of a tax preparer in filling the form, are also examined.
Some views of and potential strategies that have been suggested by, the income tax
officers are also presented in this chapter.
Chapter Nine analyses aspects of the current enforcement practices of the IRB. It
explores some of the weaknesses through analysis of the tax officer surveys, the post
mortem of a survey carried by the IRB during Taxpayers' Service Week in 1997,
past studies done by Wallschutzky and Singh (1995), and some analysis of the
nature of taxable income procedures of the IRB compared to the ATO. It also
discusses some strategies to overcome these weaknesses. These improvement
recommendations are based on respondents' suggestions and some reviews from
advanced countries' experience in tackling such problems especially from Australia
and the U.S.
17
CHAPTER TWO
Review of Literature on tlie Extent of Non-Compliance
2.1 Introduction Research into income tax non-compliance focuses on two major areas: taxpayers
and taxation authorities. Research focusing on taxpayers attempts to determine
factors that might contribute to a decision to evade the law, while research
focusing on taxation authorities attempts to formulate government strategies aimed
at increasing the amount of tax revenue collected. This research covers both areas:
the individual taxpayers of Malaysia and the income taxation authority, with the
aims of (a) determining factors which contribute to decisions to evade the law and
(b) attempting to recommend strategies to cope with this problem in Malaysia.
This chapter is divided into three sections. Section One discusses the definition of
income tax non-compliance and differentiates between intentional and
unintentional non-compliance. It fiirther elaborates on intentional non-compliance,
which is the focus of this research. Non-compliance consists of two parts: evasion
and avoidance. The difference between these two terms is that in avoidance,
taxpayers manipulate the legal loopholes (the gaps found in the Malaysian Income
Tax Legislation as explored by Wallschutzky and Singh as discussed in Chapter
One), which is within the law and implies certainty on the part of taxpayers,
whereas the opposite is tme for evasion. Evasion can be further subdivided into
evasion with fraud and evasion without fraud, depending whether fraud is
committed in the process or otherwise.
Section Two explores some of the literature related to the extent of income tax
non-compliance, the causes of income tax non-compliance and the importance of
measuring income tax non-compliance, with some examples from a number of
countries. It also discusses various measurements that have been used to assess the
extent of income tax non-compliance such as the gap approach, the expenditure-
income discrepancy method and the Elffers, Weigel and Hessing (EWH) tax-
evasion measurement. With the gap approach, the difference between an income
18
estimate derived from national accounts data and the total income reported by
taxpayers is used to estimate the dollar value of income tax non-compliance. With
the expenditure-income discrepancy method, analysis of expenditure pattems is
used to throw light on concealed or understated income. The EWH tax-evasion
measurement is a strategy which documents the occurrence of individual retums
and the self-reports of taxpayers concemed, suggesting that obtaining accurate
self-reports of sensitive information, such as evasion, is difficult, for taxpayers are
more concemed about prosecution.
Section Three summarises some related findings on the extent of income tax non
compliance in a number of countries. It also considers why this problem has
attracted attention from policy makers and economists and why some researchers
have been led to look into this problem more seriously.
2.2 Non-Compliance
Researchers have often used the term "non-compliance" to characterise the
intentional or unintentional failure of taxpayers to pay their taxes correctly, and
the term will be used in this way in this study. Unintentional non-compliance is
the failure of a taxpayer, or of an intermediary acting on behalf of the taxpayer, to
remit the proper amount of tax to the authorities, perhaps on account of the
complexity, vagaries, or even contradictions in the tax legislation or tax
administration procedures (Kesselman, 1994, pp. 62-84). It may arise from
inadequate effort by the taxpayer or intermediary to ascertain its obligations. It
may also stem from the complexity of tax provisions and the difficulty of applying
them to the more complex situations of the real world. Long and Swingen (1991,
pp. 639-683) reported that almost one in six US federal income tax retums
contained errors, with more of these errors resulting in the taxpayers paying too
much rather than too little tax. This could be due to ignorance when interpreting
tax provisions which require guidance from the taxation authority. Intentional non
compliance can be divided into two types of activity: tax evasion and tax
avoidance. These are discussed below.
19

2.2.1 Evasion and avoidance
One common characteristic of evasion and avoidance is the manipulation of a
person's affairs to reduce tax liability. However, in tax avoidance the manipulation
of personal affairs is done within the law but in evasion it is done illegally. Tax
avoidance refers to avoiding the payment of taxes through using legal loop-holes
and financial dispositions such as profiting from more favourable capital gain
taxation instead of personal income taxation (Wameryd and Walemd, 1982, pp.
187-211). Once the manner in which taxes are being avoided has been detected,
the problem may be overcome by refining the legal provisions and their
interpretation by amending the legislation (Silvani, 1994, pp. 274-305). This kind
of underpayment of taxes is sometimes engaged in by large taxpayers who have
trained professionals to advise them on the interpretation of legal provisions. Gunn
(1979, pp. 733-767) differentiates between tax evasion and avoidance as one
"evades" taxes by avoiding payment without avoiding liability, while the other
who avoids Hability "avoids" the tax. According to Cowell (1985, pp. 163-193)
"avoidance" in its strict sense implies certainty on the part of the taxpayer at the
time when decisions are made about the deployment of assets and on the report to
the tax authority. However, "evasive" activities are taken to involve a decision or
decisions made under uncertainty with respect to the taxpayer's eventual tax
liability. With respect to income taxes, evasion behaviour typically occurs because
taxpayers either under report income or exaggerate deductible expenses when
filing their retums (Loftus, 1985, pp. 35-39; Wallschutzky, 1984, pp. 371-384).
Thus avoidance in this research refers to the arrangements of a person's affairs,
correctly reported, so as to reduce tax liabilities within the letter of the law but to a
level lower than the limit of the law. Thus there is often dispute about whether or
not something is tax avoidance. On the other hand, evasion involves deliberately
misreporting the nature of one's income or undertaking other activities
inconsistent with the letter of the law to reduce tax payable.
Silvani (1994, pp. 274-305) places evasion into two categories: evasion with fraud
and evasion without fraud. A taxpayer guilty of evasion with fraud commits tax
evasion through fraudulent actions such as forging or falsifying records, which
might go beyond the scope of taxation and into the area of criminal offences.
However, evasion without fraud is engaged in by those under reporting their taxes
20

without committing fraud (like forging or falsifying records) in the process.
Silvani also suggests that the strategies used in imposing penalties for these two
types of evaders are also different. For evasion with fraud, the strategy should rely
on the imposition of very stiff penalties; some countries impose prison terms. The
penalty should be very severe and should be made public because it must serve as
a deterrent. The chief goal here is not to punish the person guilty of committing
fraud in order that he or she should not do it again, but to make an example of that
person. The process of combating tax evaders without fraud, should dissuade them
from engaging in this behaviour again. The purpose is not to punish the tax evader
in order to make an example of him or her but to prevent repeat offences, thus the
penalty is not so severe.
2.3 Extent of Non-Compliance
Researchers have extensively studied income tax non-compliance. Gaining a
better understanding of why people do not accurately report their incomes and
fiilly pay taxes due is obviously of interest to policy makers. The elements
indicated as causes of tax evasion are extremely varied including economic
factors, psychological attitudes and administrative and legal determinants.
According to Oldman and Holland (1971), measurement of tax evasion can lead to
more efficient allocation of resources. Such measurement provides information on
tax evaded and the groups of taxpayers who are more inclined to evade tax.
Hence, it is easier for income tax officers to target a particular group of taxpayers
and put extra effort into fighting evasion. Evasion measurement is also important
for the continuous evaluation of success or failure of enforcement programs.
Income tax non-compliance, its extent and characteristics, has been the subject of
numerous studies in many countries. Such studies usually attempt to estimate the
size of the irregular or underground economy whose existence is primarily
motivated by tax evasion. The underground economy is defined by Tucker (1982,
pp. 315-322) as the sum of those legal and illegal tiansactions involving cash,
cheques, or the bartering of goods or labour detected by conventional statistics. It
can operate under many disguises, from household activity and tradesman activity,
through to the more controversial areas of tax evasion; from hidden company
21

perks and bribes to the hard-core world of dmgs, prostitution, and gambling. The
growth of the underground economy can be attributed to a number of factors
operating in the legal economy. As Tanzi states: "The two main factors that create
an underground economy are taxes and restrictions, and either is sufficient alone
to bring about an underground economy" (1980, p. 34).
Based on the above quotation, it can be seen that even if there are no restrictions
on activities, taxes alone can force some activities underground so that they are
unrecorded and escape tax liability.
Among those factors associated with taxes are (Tucker, 1982, pp.315-322):
1. the growth of government regulations, prohibitions and reporting requirements which encourage firms and individuals to avoid the associated costs and problems of legal employment; 2. the imposition of taxes which encourage activities to go "underground" to avoid payments that seem disproportionately high when compared with the income eamed; 3. a high inflation rate, which has pushed individuals into higher tax brackets, and provided an incentive to seek altemative sources of income that are not detected by the taxman, and 4. the knowledge that loopholes exist in the present laws that encourage people to try to "buck the system".
The underground economy accounts for a significant proportion of current
marketplace activity and covers a wide range of people. Since the existence of
such activities is inherently concealed, indirect methods must be used for
estimation, thus resulting in highly variable figures (Kesselman, 1994, pp. 62-84).
Gutmann was the first to use monetary statistics as an indirect measure of the
underground economy in the United States. In any economic transaction, only
currency or cheques are used as the final medium of exchange. Gutmann's basic
premise is that all underground activities avoid the use of cheques and rely on
currency for transactions. Gutmann (1977, pp. 26-27) considers the ratio of
currency, C, to demand deposits, D. The argument is that an increasing C/D ratio
reflects the greater relative use of cash as the hidden economy grows. Adapting
Gutmann's approach, the Commercial Bank of Australia estimated that the
underground economy in Australia during 1978/79 was nearly $11 bilHon in
AustraUa, or 10.6 percent of gross domestic product (Tucker, 1982, pp. 315-322).
The drawbacks of this approach are that the results are sensitive to the base year
22

chosen and that there are many factors which may influence the holding of cash
relative to the total money supply. There is a need for accurate measurement of the
total volume of transactions and an assumption of a constant transactions ratio (see
Cagan 1958); Garcia 1978; Garcia and Pak 1979).
Hepbum (1992, pp. 54-62) adopted the approach used by Tanzi (1982) to develop
an econometric model to explain variation in the currency ratio, defined as the
ratio of currency, C, to total money, M2. The currency ratio (C/M2) is modelled as
being a fimction of real per capita income (Y), the nominal interest rate (R), the
percentage of household income accounted for by wages and salaries (W), a
taxation variable (T), and a lagged dependent variable [(C/M2).i]. Estimation
using ordinary least squares and annual data for the above variables over the
period 1949-50 to 1989-90 yielded the following results (t-statistics are given in
parentheses and the interest rate variable was excluded as it was found to be
insignificant in prior regressions):
(C/M2)t = -0.090453 - 0.00089217Yt + 0.19147W, + 0.0040336T, (-2.701) (-5.5159) (4.488) (4.049) + 0.86151(C/M2)t-i
(10.469)
R^ 0.929, Adj.0.920, Durbin's t-statistic-1.404, RESET 0.409, LM 17.059, No. of observations: 40.
Hepbum (1992, pp. 54-62) used the model to obtain estimates of the model's
predicted currency ratio for each year. By substituting zero for the tax variable, a
prediction of currency holdings in the absence of income taxation is obtained.
Subtracting this tax-free estimate of currency holdings from the first estimate
gives a measure of taxation-induced currency holdings. The total amount of
income or productive activity being financed by taxation-induced currency
holdings can then be estimated. The key assumption made is that the relationship
between the taxation-induced currency holdings and the cash economy is the same
as that between the legal component of M2 (the legal money supply used for
transactions) and measured GDP. The cash economy can be calculated as taxation-
induced currency holdings (TC) multiplied by the velocity of circulation (V):
Cash Economy = TC.V V = GDP/(M2 - TC)
23
The velocity of circulation of illegal money in the hidden economy is assumed to
be the same as for legal money in the observed economy. Hepbum also noted that
to the extent that illegal cash is hoarded by tax evaders, the estimated velocity may
be higher than the actual velocity of circulation in the cash economy. He found
that the cash economy, as a percentage of measured GDP in Australia in the period
from 1959-60 to 1988-89, has grown steadily, and in 1989-90 was 7.3 percent of
GDP. As noted by Pulle (1998, pp. 44-49) in the Budget Review 1998-99, the
Australian Bureau of Statistics or ABS estimated that the cash economy could
have ranged from 3.5 per cent to 13.4 per cent of GDP in Australia. In 1998-99 the
cash economy could therefore have ranged from $20.3 billion to $77.7 billion and
on the basis of revenue expectations in the 1998 Budget, the revenue lost would
have ranged from $5.1 billion to $19.4 bilHon in AustraUa in 1998-99.
The underground economy also leaves traces in the spheres of income and
expenditure. The most obvious variant of this approach is to deduce the size of the
hidden economy from the estimated amount of tax fraud. Its size can be deduced
from the difference between the GNP as estimated from the income side, which is
mainly based on tax reports and the expenditure side, which is independently
calculated by undertaking household and industrial surveys on the value of goods
and services purchased (see Macafee, 1980). For the national accountant, the word
"hidden economy" might be taken to consist of the error between his published
measure of economic activity and the "tme" figure which is the target of his
measurement. The ABS identifies the following areas as constituting the principal
sources of understatement of GDP (AGPS, 1981, pp. 158-159).
The major area of understatement on the income side is considered to be income
of unincorporated enterprises which is difficult to estimate accurately because of
understatement of income reported to the Taxation Commissioner (the major
source of data). On the expenditure side there are three major areas of known
understatement deduced from inadequate data sources, viz:
1. No estimate has been included of the expenses associated with the sale of
dwellings and other buildings and land, e.g. legal fees, real estate commission,
and stamp duty.
24

2. No estimate has been included in capital expenditure on private dwellings to
cover those alterations and additions which either do not require a local
government permit or for which the owner does not obtain the requisite permit.
3. No estimate is included in private final consumption expenditure for
expenditure on illegal goods and services, e.g. no allowance is made for the
purchase of illicit dmgs or payments relating to illegal gambling and
prostitution.
Further as noted by Carson:
....income that is not reported on tax retums does not necessarily escape GNP. This point is particularly important because it was often missed in early work on the underground economy; it was mistakenly assumed that, because income tax return information is one of the sources used to estimate GNP, unreported income on income tax retums was unmeasured income in GNP. (1984, p. 4)
Bhattacharyya (1990) estimated the hidden economy for the United Kingdom to
be 3.8 per cent of GNP in 1960, peaking at 11.1 per cent in 1976, and averaging
about 8 per cent in 1984. However, a British Inland Revenue analysis reported by
Chote (1995) suggests that the hidden economy may be 6-8 per cent of GDP. In
addition, Giles (1998, pp. 93-110) has undertaken a comprehensive study to
measure the extent of the hidden economy or HE in New Zealand, exploring some
of its determinants, its responsiveness to fiscal instmments and investigating the
size of the associated tax gap in that country. His research revealed a clear and
statistically significant link between high taxes and the size of the underground
economy. Giles and Caragata (1996) also show that successive reductions in the
effective tax rate reduces the ratio HE/GDP, though not uniformly. The hidden
economy in New Zealand has been growing over time relative to GDP, ranging
from 6.8 per cent in 1968 to 11.3 per cent in 1994, and averaging 8.8 per cent over
1978 to 1994 (Giles, 1998). Giles (1997) has shown that tax-related prosecution
can have a significant effect on the hidden economy in New Zealand, which
correlates with the finding of Cebula on the underground economy in the United
States (1997, pp. 173-185). Based on ordinary least squares estimates on data
generated for the period 1973-94, Cebula found that the maximum marginal
personal income tax rate raises the size of the underground economy. In addition,
the size of the underground economy in the U.S. during this period was found to
25
be a decreasing fiinction of both the percentages of tax retums audited and the
penalties imposed by the IRS on unpaid taxes.
Tax non-compliance is a growing national problem. The Swedish Riksskatteverk
(tax office) estimated that during the 1970s between 8 per cent and 15 per cent of
income was not declared (Hansson, 1980, pp. 395-602). For Italy, the estimates
range from 10 per cent (De Grazia, 1980) to 33 per cent as reported by Martino
(1980). Kaldor (1956, p. 104) estimates that annually a non-salary income of Rs
576 crores evades tax in India and that amount of income tax lost through tax
evasion is more of the order of Rs 200-300 crores. In Britain, estimates have
indicated that the equivalent of 7.5 per cent of Britain's GNP escapes legitimate
taxation. There is also evidence that 17 per cent of the taxable income in Belgium
remains undeclared (Lewis, 1982).
Feige (1979, pp. 5-13) used the "transactions approach" or the currency demand,
whereby changes in the size of the hidden economy can be judged from
movements in the demand for currency, i.e. notes and coins in circulation. He
found that the U.S. shadow economy lay between 13 per cent and 22 per cent of
GNP in 1976, and between 26 per cent and 33 per cent of official GNP in 1978.
Aigner, Schneider, and Ghosh (1988, pp. 297-334) reported that estimates of the
irregular economy of the United States, as a proportion of the total economy,
ranged widely from 4 per cent (Park 1979) to 33 per cent (Feige 1979) of GNP.
The IRS (1979) calculated that in 1976, between 5.9 per cent and 7.9 per cent of
income was not reported to the tax authority. Additionally, the General
Accounting Office or GAO reports that the IRS has estimated that taxpayers do
not pay voluntarily more than $100 billion annually of taxes due on income
sources.^ This income tax gap, defined by the GAO as the "difference between
income taxes owed and those voluntarily paid", indicates significant non
compliance and the extent of the challenge that the IRS faces in finding ways to
reduce the tax gap. This growing interest in tax avoidance has led to increased
fiinding for the research in this area of study. For example, it was estimated that
the tax gap was $81.5 billion for 1981, an amount that exceeded the federal deficit
for that year (IRS, 1983). The IRS also estimated that the income tax gap for
individuals reached as high as $95 billion for tax year 1992 (GAO, 1997). Thus,
26

the hitemal Revenue Service, the American Bar Association, and the public
accounting firm of Arthur Young & Co. have all committed thousands of dollars
to tax compUance research (Jackson and Milliron, 1986, pp. 125-165).
A link between tax avoidance and evasion and defective official statistics is
provided by the obvious incentives to mis-report (Trengove, 1985, pp. 85-95).
These incentives exist whenever the information sought is to be used in a way that
will affect the circumstances of the individual(s) providing it. The most concrete
example is the reporting requirements imposed by systems of taxation where
failure to report, or mis-reporting, is a means of altering tax hability.
2.3.1 The importance of non-compliance
Research on income tax non-compliance has attracted policy makers and
economists since tax non-compliance can dismpt the forecasted economic
performance of a country and thus may lead to the failure of its economic policies.
It may also have major implications for the legal economy in terms of monetary
and fiscal policy, income distribution and productivity. Many of the policies
introduced to correct perceived adverse economic trends subsequently prove to be
ineffective, at least partly because of the growth of the underground economy and
the consequent distortion in the recording of statistics relating to macroeconomic
variables such as employment, growth and inflation, savings and consumption,
and productivity (Tucker, 1982, pp. 315-322).
2.3.1.1 Employment
Employment statistics cover individuals in the labour force. However, those who
are only employed in the underground economy may be excluded from statistics,
thus resulting in understated employment levels. At the same time, unemployment
statistics can be overstated by including those people who work in the
underground economy and who have no intention of working in the legal
economy, yet register as unemployed so as to receive benefits. Hence, an element
of "disguised employment" distorts these statistics. This causes policymakers,
aiming at full employment, to plan on the basis of incorrect assumptions.
27

Official employment statistics also conceal "disguised unemployment." This refers
to: (1) people who work in a family business or other capacity at less than their
fiill potential, because they are unable to find more suitable employment; (2) those
who would like to work but are precluded from registering for unemployment
benefits because of an employed spouse; and (3) (mostly young) people who elect
to continue their education rather than register as unemployed.
Any such disguised unemployment does not neutralise, and may be more than
offset by, the disguised employment in the underground economy. In any case,
both situations distort employment statistics.
2.3.1.2 Growth and inflation
If the underground economy is growing faster than the legal economy, economic
resources shift from the latter to the former. Since the rate of economic growth is
only measured in the legal economy, actual economic performance is understated.
At the same time, inflation in the total economy may be overstated. Workers in the
underground economy do not pay tax and are, as a result, may well be prepared to
accept lower wage rates than those in the legal economy. Suppliers of other inputs
are also avoiding government-induced costs and are prepared to accept lower
prices for goods and services produced. Both the level of prices, and the rate of
price increase in the underground economy, may be therefore lower than in the
legal economy, raising the possibility that the officially recorded inflation rate
overstates the tme position.
2.3.1.3 Savings and consumption
Since part of the income from which savings and consumption is drawn is
underground income, and excluded from official calculations, economic data
concerning savings and consumption are understated.
2.3.1.4 Productivity
Additional problems are also caused by those who are employed in both the
underground and the legal economies. Their productivity is lowered because they
are tired on the job, or prone to frequent absenteeism. As a result, they are also
more prone to accidents and risking dangerous procedures.
28

2.3.1.5 Inequity
Non-compliance also may lead to inequity in the burden of taxation as explained
below.
An exchange relationship exists between the taxpayer and the government. The
taxpayer forgoes a portion of purchasing power in the private market in retum for
government benefits, including goods and services and, perhaps, some non-
material sources of satisfaction, such as a sense of belonging or affiliation.
However, if the public feels increasingly overtime that taxes are unfairly imposed,
it is increasingly likely to evade paying taxes. Using survey data collected from
1960-1980, consisting of information on tax rates and estimates of tax evasion,
Etzioni (1986, pp. 177-185) found that tax evasion increased during this period, as
did the percentage of Americans who considered taxes to be unfair, even though
tax rates remained stable. Further, he also found that Americans who were
presumed to have the least incentive to cheat were the most likely to consider
taxes unfair. As found by many researchers (e.g. Spicer, 1986, pp. 13-20;
Wahlund, 1992, pp. 657-677) the burden is heavier on the earning class and honest
taxpayers. Non-compliance may also influence income distribution depending
upon the income classes or groups that benefit most from tax evasion. People
choose occupations where tax evasion or tax avoidance may provide an easier,
better possibility of avoiding payment of taxes. Non-compliance also may
accumulate black money on a large scale, which upsets the forecasted economic
growth of a country as discussed above. Thus serious study of this problem is very
important as in the introduction of strategies to overcome the problem while
enhancing voluntary compliance among taxpayers.
29

2.3.2 Measurement of income tax non-compliance
In estimating the extent of income tax non-compHance, Herschel (1978, pp. 232-
268) in his quantitative research in Argentina, proposed a gap approach to
detecting income tax evasion. It was found that gross income according to tax
retums was only 21.5 per cent of the total according to the national accounts (60.7
billion/281.9 billion Argentinian pesos). (Like one examimer, I can't understand
this - suggest clarify or delete. PJS)
2.3.2.1 The gap approach
National accounting and other data are used to estimate, after appropriate
deductions, the total taxable income for various groups. These can then be
compared with the taxable income declared by taxpayers to the taxation authority.
When income data are available, it is possible to estimate potential, actual, and
evaded income tax liabilities by income class. The value of this approach is
limited to the extent to which the authorities compiling the national accounts data
have better sources of information than those contained in taxpayer declarations.
This may often be the case with government and business records, financial
institution records and so on.
Herschel found for Argentinians that evasion is highest in the middle-income
group when expressed as a percentage of potential tax, but on the other hand,
considering the absolute amount of tax evasion, the greater part is concentrated in
the higher income brackets (1978, pp. 232-268). This impHes that the tax
authorities should concentrate their efforts against evasion in the higher or middle
income groups. However, Allingham and Sandmo (1972, pp. 323-338) reported
that the effort to detect tax evasion has to be concenfrated on high or low reported
income, since these groups of taxpayers evade their income tax the most. Thus the
most effective policy to be followed is not certain.
2.3.2.2 Expenditure-income discrepancy method
This method can be applied to the entire economy or on a disaggregated basis on
the assumption that although incomes may be concealed or understated,
expenditures will eventually show up somewhere (Cowell, 1990, p. 19). The
discrepancy between the income data (after relevant deductions) and the
30

expenditure sides of GDP (either for the entire economy or on disaggregated
basis) give an "unexplained difference or residual" that provides some clues to the
size of the hidden economy. Although it is subject to measurement error, the
evidence of extraordinarily high expenditures relative to income, especially at
disaggregated level, can be used to identify those groups of individuals or
households that may be active in the black economy. Thus the behaviour of these
groups can be analysed and used to derive an estimate of concealed income.
There are three major weaknesses involved in estimating the aggregate income of
the national accounting level (see for instance, Macafee 1980): (i) There are errors
in both estimates of aggregate income; (ii) there are errors due to differences in the
statistical coverage; (iii) the national income estimates are not always completely
independent of the tax data based income estimates, that is, income not captured
by tax authorities may also not appear in the national income data. According to
some researchers (Albers, 1974; Feige, 1980a, 1980b; O'Higgins, 1980) the
discrepancies among the various income estimates must be regarded as the lower
boundary for unreported income.
Table 2.1 below shows the estimates in terms of national income for the size of the
underground economy based on the traces left in the form of "unexplained
residuals" for a number of countries.
31

Table 2.1 Unexplained differences countries and years
Country
United States
United Kingdom
Denmark
Sweden Federal Republic of Germany Belgium
France
Year
1948 1958 1968 1977 1970 1972 1975 1978 1964/65 1970/71 1974/75 1978 1968
1965 1966 1970 1965
in national income measures, various
Estimate of size (per cent)
9.4 6.8 5.5 4.0 1.0 1.1 1.8-2.4 2.5-2.9 12.4 10.0 6.0 4.6 8.9
18.6 19.6 18.9 23.2
Author
Park (1979)
O'Higgins (1980)
0konomiske Rad (1967, 1977)
Hansson (1980) Albers (1974)
Frank (1972, 1976)
Roze(1971) Source: Frey and Pommerehne in 'The Underground Economy in the United States and Abroad'
edited by Tanzi (1982, p. 17).
2.3.2.3 Elffers, Weigel and Hessing (EWH) tax-evasion measurement
The EWH tax-evasion measurement (1987, pp. 311-337) was the first to address
the issue of the relationship between officers' classification and self-reports of
taxpayers (Elffers, Robben and Hessing, 1992, pp. 545-567). It demonstrated a
strategy capable of documenting the occurrence of an individual's tax-evasion
behaviour as seen by the tax inspectorate from tax retums, combined with the self-
reports of the taxpayers concemed, while protecting individual anonymity.
2.3.2.3.1 Officers' classification
A procedure was developed to identify individuals who were tax evaders and non-
evaders from the 1981 and 1982 tax records in the Netherlands:
a) Evaders: to be classified as a tax evader an individual's tax retum had to fiilfil
two criteria. First, the tax retum for both 1981 and 1982 were evaluated as
requiring corrections of at least 500 guilders. Second, two different tax officials
were independently asked to judge whether or not the instances of undisclosed
income or unwanted deductions were ambiguous (e.g. may have resulted from
inadvertent errors) or were "clearly reproachable" (exhibited fraudulent intent as
evinced by third party documentation of unreported income or failure to justify
32

deductible expenses when previously confronted). Only those individuals whose
retums from both of the years under consideration were judged "clearly
reproachable" were retained in the tax evader category; and
(b) Non-evaders: This category included individuals whose retums for both 1981
and 1982 were judged to require no corrections whatsoever after both the routine
review given all tax retums and two independent audits. This two-stage criterion
set a stringent standard: less than 50 per cent of the taxpayers whose 1981 and
1982 retums had gone unchallenged by the routine reviews, retained "non-evader"
status after being subjected to the multiple audit procedures.
Using the above criteria 342 tax evaders and 342 non-evaders were identified by
the Office of the Tax Inspectorate. Once the pool of 684 potential respondents was
identified, the chief of the Office of the Tax Inspectorate sent the individuals'
names, addresses, telephone numbers, and coded information regarding the
evaluation of their tax retums to a bonded third party or a notary (a specialised
lawyer) in this case. He then sent each of the potential respondents a letter asking
for their cooperation in a scientific study of citizens' attitudes towards the Dutch
tax system and assured them that the anonymity of their responses would be
guaranteed. Those willing to participate retumed a card to the notary and a
convenient date for interview was set. The interviewer also explained that the
notary would supply the research team with coded information regarding any tax
violations by the respondent during 1981 and 1982. In this context, three issues
were stressed: (a) the Tax Inspectorate was legally constrained from using such
information to re-open individual cases or increase any respondent's chances of a
fiiture audit; (b) the procedures assured that the Tax Inspectorate could never
determine which of the potential respondents had opted to participate in the
research; and (c) neither the Tax Inspectorate, the notary, nor the research team
would ever have simultaneous access to respondents' names, tax records and self-
reports.
Following the above explanations, the interviewer asked the respondents to sign a
consent form permitting the notary to release the coded information on the past tax
corrections to the research team. When the interview was completed, the consent
form and the answer sheet were sealed in an envelope and mailed to the notary.
33

The notary checked the consent form, attached the coded tax information to the
respondents answer sheet, removed the respondent's name from both of the latter
two documents and mailed them to the researchers. When all of the interviews
were completed, the Tax Inspectorate mailed the decoding key for the tax
information directly to the researchers. Of the 684 persons who were initially
contacted by the Tax Inspectorate, 155 (23 per cent) signed the consent form and
completed the interview. Given this attrition rate, it could be argued that those
individuals agreeing to participate in the research were those whose past behaviour
had been most impeccable. Conversely, those who had something to hide opted
out. Elffers et al. (1987, pp. 311-337) gave three reasons, however, for arguing
that the 155 respondents included in this study faithfiilly represented those in the
initially designated subject pool. First, nearly all the attrition resulted from failing
to retum the card that indicated a willingness to be interviewed. Only two
respondents dropped out: one emigrated before he could be interviewed and the
other refiised to sign the consent form. Among the 529 non-participants, there was
only one refiisal when he was informed of the parameters of the study. Second,
those individuals ultimately designated as tax evaders were as likely to agree to
participate as the non-evaders: 46 per cent of the 155 respondents were identified
as having evaded taxes according to the criteria previously described. Third,
participating and non-participating tax evaders were quite similar with respect to
the amount of corrections assessed against their 1981 and 1982 tax retums.
2.3.2.3.2 Self-reported tax evasion
At the end of the interview respondents were asked whether he or she had under
reported his/her income or any unwarranted deductions in his/her 1981 and 1982
tax retums. A score of '0 ' indicated that the respondent denied evading taxes by
under reporting income or unjustifiable deductions in both years, a score of ' 1 '
indicated acknowledgment of tax evasion for one of the two years, and a score of
'2 ' indicated acknowledgment tax evasion in both years.
Despite the safeguarding of respondents' anonymity (which should have
minimised the effect of impression management) the results showed that the
documented and self-reported tax evasion did not correspond at all. The
correlation between self-reported evasion and documented evasion was 0.06, and
34

-0.03 for the relation between self-reporting and the amount of taxes paid back.
There were inconsistencies between the self-report and official data in 45 per cent
of cases and as predicted there was less inconsistency in the non-evader group,
where 25 per cent reported some misrepresentation of income or deductions, than
in the evader group, where 69 per cent denied evading taxes in either year.
Evasion was usually denied even by the most flagrant evaders defined as those
whose audits resulted in corrections of more than a thousand guilders in both 1981
and 1982 and of whom more than 70 per cent denied misrepresenting income or
deductions in either year. EWH believed that various measures were targeted at
one common core concept of tax evasion, but such factors as differences in
knowledge levels, perspectives and purposes between tax officers and taxpayers
have no perfect correlation. The possibilities in respect to the divergence of these
two measures might be due to the contrast group design used, where more tmst
should be placed in the officially documented behaviour.
Partial replications of these results were also obtained by Kinsey (1988) who
carried out a secondary analysis of an IRS-sponsored survey in the U.S. She found
that although no match was identified between the measures of attitudes,
subjective norms, and personality variables as in EWH measurement, she was able
to constmct scales that corresponded well using the self-reported audit outcome.
The respondents who reported having paid more taxes as a result of a tax
examination were treated as 'officially defined' tax evaders, while those who
admitted non-compliance in the previous five years were tieated as self-reported
evaders. The results obtained were comparable to EWH. The attitude and
subjective norm measures correlated with self-reported evasion and not with self-
reported audit outcome, while the tolerance of illegal behaviour was correlated
with self-reported audit outcome and not with self-reported evasion. Kinsey
concludes that the findings of EWH are robust, and documented tax evasion
should not be the benchmark by which other forms of measurement should be
assessed.
The above findings suggest that obtaining accurate self-reports about personally
sensitive information such as evasion is difficult, especially from the evaders who
are more concemed about prosecution. As argued by Webley, Robben, Elffers and
35

Hessing (1991), although non-compliance is a social constmction, it is not just
that; taxpayers are, after all, making decisions and acting upon them.
2.4 Summary
Income tax non-compliance consists of intentional and unintentional non
compliance. Unintentional non-compliance may arise due to the complexity of tax
provisions, which might lead to the failure of the taxpayer to remit the proper
amount of tax, or from other factors. Intentional non-compliance can be divided
into tax evasion and tax avoidance. Tax evasion occurs when taxpayers either
under report income or exaggerate deductible expenses when filing their retums.
On the other hand tax avoidance refers to avoiding the payment of taxes through
using loopholes in the Income Tax Legislation.
Income tax non-compliance is a growing national problem. In the United States
for example, the IRS reported that voluntary compliance had declined in the 1970s
and 1980s and billions of dollars were lost due to tax evasion. The cash economy
as a percentage of GDP declined in the 1950's, but it increased steadily in the
1960's and registered up to 7.8 per cent at the end of 1980's in Australia. Sweden,
Italy, India, France, Britain and Belgium also suffered from this problem in the
1950's to 1980's.
Income tax non-compliance has attracted several researchers interested in
determining the size of the irregular or underground economy caused primarily by
tax evasion. Research into income tax evasion has also attracted policy makers and
economists, for its existence can dismpt the forecasting of a country's economic
performance that may lead to a failure of its economic policies and dismption of
income distribution and productivity. Non-compliance may distort the recording
of statistics relating to macroeconomic variables such as employment, growth and
inflation, savings and consumption. It may also results in inequity in the burden of
taxation whereby the burden is heavier on salaried classes and honest taxpayers.
Productivity is lowered, especially for those moonlighting. Thus it is important for
the taxation authority to estimate the extent of income tax non-compliance in the
country. It should target the group of taxpayers that are more inclined to evade
paying taxes so that it can measure its performance from time to time and channel
36
its efforts to this particular group of taxpayers and hence achieve a more efficient
allocation of resources. It should also take various precautions and undertake
strategies to combat this activity.
Various methods have been applied in estimating the extent of income tax non
compliance. Among them are the gap approach, the expenditure-income
discrepancy method and the EWH tax-evasion measurement. Both the gap
approach and the expenditure-income discrepancy methods make use of the
national accounts data. The difference is that in the gap approach, the income side
of the national account data is compared with the total amount of income that has
been reported to the taxation office after relevant deductions have been
considered. While in the expenditure-income discrepancy method, the expenditure
side of GDP is used instead. As for the EWH tax-evasion measurement, this
demonstrates the individual's tax evasion behaviour as seen by the tax inspectorate
from tax retums, combining this with the self-reports of the taxpayers concemed,
while protecting individual anonymity. There are some weaknesses in adopting the
above mentioned approaches. In the first two approaches, i.e. the gap approach
and the expenditure-income discrepancy method, because they make use of the
national accounts data in obtaining the "gap" and the "unexplained difference or
residual" that might estimate the size of non-compliance. There are errors
involved in estimating the aggregate income of the national accounts data, and its
statistical coverage is not always completely independent of the income tax data.
As for the EWH tax-evasion measurement, it is very difficult to obtain tmthfiil
self-reports on evasion especially from tax evaders who are more concemed about
prosecution, thus more tmst should be placed in officially documented behaviour.
37

CHAPTER THREE
Review of Literature on Some Factors Influencing Income Tax Non-Compliance
3.1 Introduction One of the most common theoretical accounts of tax evasion/non-compliance is
the rational maximising model. In this model, the human being is seen as a
rational calculator, concemed with maximising his or her own utility (Allingham
and Sandmo, 1972; Lewis, 1982). Thus most attention is placed on the individual
person (see Chang, Nichols and Schultz, 1987). The economic approach to the
whole issue of income tax non-compliance is founded on the analysis of the
behaviour of the individual non-compliant. How the individual perceives his/her
economic opportunities to be affected by the tax code and by the instmments of
tax enforcement is particularly relevant. It is commonly assumed that there are
cultural differences with respect to how taxes are perceived by the population of
different countries (see Strumpel 1969; Schmolders 1970). Therefore this research
is being undertaken to study some of the demographic variables and to isolate
some possible factors that may have influenced behaviour, for example, in
Malaysia.
This chapter contains six major sections, the first four sections highlight
demographic variables such as age, gender, income level and income source of
non-compliants studied previously by researchers in other countries. However,
none of these research studies were conducted in Malaysia. Thus this research is
being undertaken to investigate whether similar results (or the opposites) are tme
for Malaysian taxpayers.
Section Five discusses some possible factors that may influenced taxpayers to not
comply with income tax law such as financial strain, complexity of the law and the
use of tax preparers as reported previously by other researchers. Thus, this
research will explore reasons given by Malaysian taxpayers for failing to comply
with the Income Tax Regulations. The last section summarises this chapter.
38
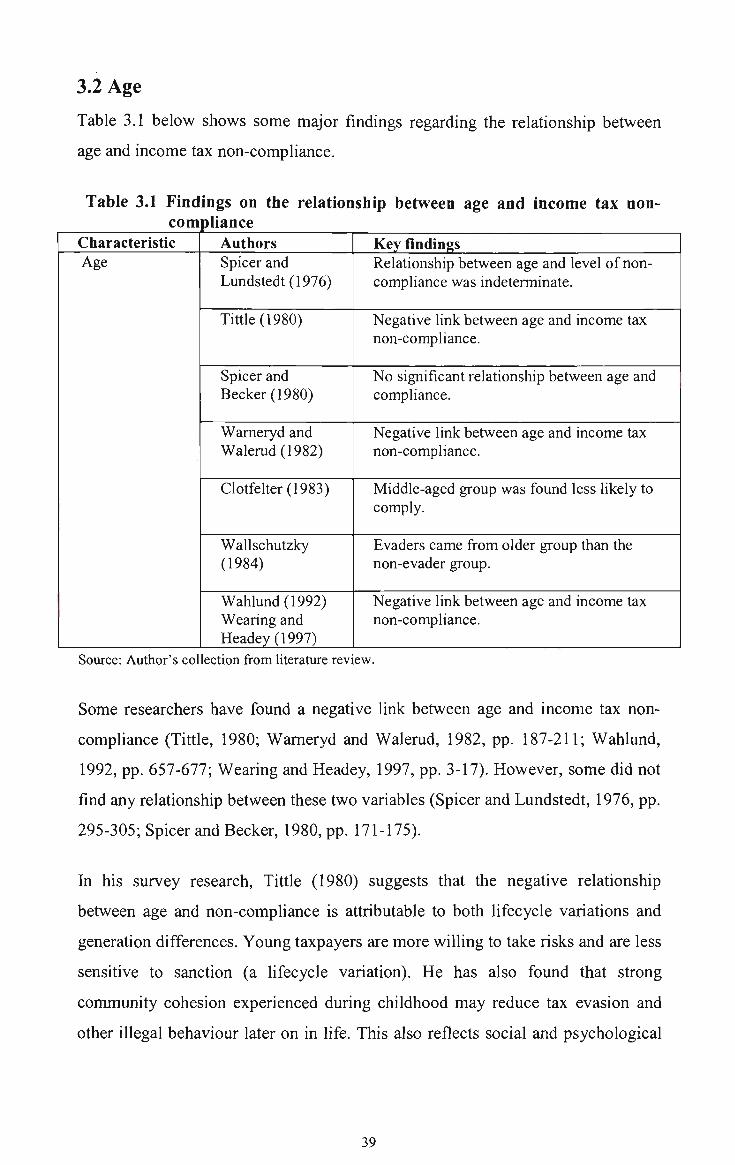
3.2 Age
Table 3.1 below shows some major findings regarding the relationship between
age and income tax non-compliance.
Table 3.1 Findings on the relationship between age and income tax noncompliance
Characteristic Age
Authors Spicer and Lundstedt (1976)
Tittle (1980)
Spicer and Becker (1980)
Wameryd and Walemd (1982)
Clotfelter (1983)
Wallschutzky (1984)
Wahlund (1992) Wearing and Headey (1997)
Key findings Relationship between age and level of noncompliance was indeterminate.
Negative link between age and income tax non-compliance.
No significant relationship between age and compliance.
Negative link between age and income tax non-compliance.
Middle-aged group was found less likely to comply.
Evaders came from older group than the non-evader group.
Negative link between age and income tax non-compliance.
Source: Author's collection from literature review.
Some researchers have found a negative link between age and income tax non-
comphance (Titfle, 1980; Wameryd and Walemd, 1982, pp. 187-211; Wahlund,
1992, pp. 657-677; Wearing and Headey, 1997, pp. 3-17). However, some did not
find any relationship between these two variables (Spicer and Lundstedt, 1976, pp.
295-305; Spicer and Becker, 1980, pp. 171-175).
In his survey research. Tittle (1980) suggests that the negative relationship
between age and non-compliance is attributable to both lifecycle variations and
generation differences. Young taxpayers are more willing to take risks and are less
sensitive to sanction (a lifecycle variation). He has also found that strong
community cohesion experienced during childhood may reduce tax evasion and
other illegal behaviour later on in life. This also reflects social and psychological
39

differences which can be attributed to the period in which the subjects were raised
(a generation difference).
hi their survey of 426 Swedish male adults in 1981,Wameryd and Walemd (1982)
found that multivariate analyses of the data indicated that younger people were
more prone to tax evasion. They explained that this might be due to younger
taxpayers having more opportunity for tax evasion than older people in general.
Opportunity means that the taxpayer is self-employed, is moonlighting without
withholding tax, or is otherwise able to control his income. It may also mean that
the probability of the evasion being detected is judged to be low (Wameryd and
Walemd, 1982). Since younger persons increase their eamings considerably and
are more likely to have part-time jobs or to moonlight compared with older
people, this group also has shown more negative attitudes than those of the
average age and also displayed a lenient attitude to tax crimes.
Wahlund (1992) also found the same trend of evasion in a Swedish survey, where
younger people evade taxes more than older people. He reasoned that younger
people are less negative towards tax evasion than older people, they judge the
risks of tax evasion to be smaller than older people, they have more opportunities
to evade taxes, and they are less "socialistic" than older people. According to his
model, high marginal tax rates result in aversion to taxes. Increased aversion to
taxes makes a person adopt a more lenient attitude towards tax evasion. The latter
causes the person to use the available actual opportunities for evading taxes. All
this leads in tum to more tax evasion.
Similarly, Wearing and Headey (1997) in their random sample of respondents in
Melboume found that there is a negative correlation between age and propensity
to evade taxes. Older persons are less likely to evade taxes.
However, Spicer and Lundstedt (1976) in their 1974 survey one hundred and thirty
middle and upper income households from two suburbs in a large metropolitan
area in central Ohio, found that the relationship between age and the level of non
compliance was indeterminate. Increasing age appears to be related to lower tax
resistance but the tax evasion index was not statistically significant with age with a
5 per cent of significance level. Given the contirol of opportunity factors such as
40

self-employment, income level, and the proportion of income received in salaries,
wages, or pension, these results may reflect differences in the extent to which
norms reflected in the law are intemalised by different age groups. Consequently,
Spicer and Becker (1980) in their experimental approach using fifty-seven
University of Colorado (Colorado Springs) students as their subjects, found that
there was no significant relationship between age and compliance. In explaining
these two findings, Jackson and Milliron (1986, pp. 125-165) proposed that for
researchers who used a limited subset of the population (e.g. Spicer and Ltmdstedt,
1976 whose sample is restricted to middle and upper income groups of two
suburbs of Central Ohio), a lack of significant results may be attributable to a wide
range of restrictions. The lack of variability in the restricted variable tends to
reduce the significance of the overall relationship. While in the case of using
students as their subjects (e.g Spicer and Becker, 1980), the lack of significance
may be due to statistical errors. Since a sample is a subset of a larger population, if
errors are made, the sample does not give reliable estimates of the population.
Unlike the above findings, Clotfelter's result was a plausible one since he uses a
rather large sample size (1983, pp. 363-373). Clotfelter used data from the IRS
Taxpayer Compliance Measurement Program. The sample includes approximately
47,000 individual tax retums for 1969. The TCMP survey consists of extensive
audits of a stratified random sample of the taxpaying population of the U.S. It was
found that the youngest and oldest segments of the population had the highest
degree of compliance. Thus this infers that the middle age group was found less
likely to comply.
On the contrary, Wallschutzky (1984, pp. 371-384) in his survey population of
"evaders" and "non-evaders" in Australia, found that age was significant at the 5
per cent level of these two groups. Evaders tended to be older when compared
with the non-evader group.
3.3 Gender
In modem societies such as those in western countries, the traditional role of the
father as the main bread winner and major decisions maker, has given way to
changing roles as more women work outside the home. Both men and women play
41

equally important roles in raising the family and it is not unusual for the wife to
work and eam a living while the husband does all the housework. However, in
Asian countries most of the major decisions are made by the husband wishes.
Hence the husband always plays an important role in earning a living, either solely
or helped by his wife in raising a family. In these countries, it is rather abnormal
for the wife to be the sole breadwinner in the family, since it is against the culture
and even the beliefs of some religions.
Based on the above situations, it is important to study whether males and females
particularly in Malaysia, behave as in westem countries regarding income tax non
compliance. Table 3.2 below provides some major findings regarding the
relationship between gender and income tax non-compliance.
Table 3.2 Findings on the relationship compliance
Characteristic Gender
Source: Author's col
Authors Vogel(1974) Mason and Calvin (1978) Friedland, Maital and Rutenburg (1978) Tittle (1980)
Grasmick, Finley and Glaser (1984)
Kinsey and Grasmick (1993) Kite (1997)
ection from literature review.
I)etween gender and income tax non-
Key findings Males less compliant than females.
Females were less compliant than male subjects.
Males less compliant than females.
A new generation of independent non-traditional women may be closing the compliance gap between men and women with regard to tax evasion.
Women comply more than men.
Females without college degree tended to be compliant & males without college degrees were non-compliant. On the other hand, females with college degrees tended not to comply & males with college degrees tended to comply.
The majority of studies including those of Vogel (1974, pp. 499-513), Mason and
Calvin (1978, pp. 73-83), Tittle (1980) and others found that males were less
compliant than females. In his research in Sweden, Vogel (1974) reasons that men
think themselves to have better illegal opportunities than do women, perhaps
42

providing an indication of a more aggressive gender role. Similarly, Tittle in his
research in a U.S. community (1980) suggests that the relationship between gender
and deviance is also attributable to both lifestyle variations and generation
differences. Traditionally, Tittle argues, females have been identified with
conforming roles, moral restraints and lead more conservative life pattems. This in
tum promotes tax compliance. However, Grasmick, Finley, and Glaser (1984, pp.
703-718) in their studies in the U.S. indicate that a new generation of independent,
non-traditional women may be closing the compliance gap between men and
women with regard to tax evasion. Further, Kinsey and Grasmick (1993, pp. 293-
325) analysed attitudes toward tax compliance in data from 1979, 1985, 1987, and
1988 surveys in the U.S. On controlling for the direct influence of income and
education in a large pooled sample size, gender tended to correlate with
compliance, with women complying more than men. It is important here to note
that the gender effect remains only after controlling other factors. However,
interaction effects were not examined.
While Hite (1997, pp. 155-180) in a telephone survey of 566 randomly selected
participants in a mid-westem state, found that females without college degrees
tended to be compliant but males without college degrees generally were non-
compliant. In contrast, males with college degrees had a tendency to comply while
females with a college degree tended not to comply. Hite also concludes that the
aggressive behaviour of college-educated females is prevalent among high
incomes. On the other hand, the aggressive behaviour of males without college
degrees is magnified for those who usually have a balance due at tax filing time.
There may also be some interactions between gender and the compliance variable
"probability of detection". Richards and Tittle (1981, pp. 1182-1199) noted that
women's perception of likelihood of arrest for tax evasion is significanfly higher
than men's. They attribute this to the fact that giris are more closely monitored by
their parents which leads to a greater stake in conformity and a greater perception
of visibility. However, if parents tend to make fewer distinctions based on sex
when rearing their children, this difference may be expected to be less.
On the contrary, Friedland, Maital, and Rutenburg's experimental study of 15
undergraduate Israeli students indicated that females were less compliant than
43

male subjects (1978, pp. 107-116). Since their study was based on a small sample
size, their results could not be generalised. Further, as Webley and Halstead raised
regarding the degree to which the experimental situation parallels taxpayers'
decisions in natural settings (1986, pp. 87-100), they found that when the situation
was defined as a "problem" rather than as a "game" subjects optimised more
efficiently. More importantly, in their post-experimental interviews, it was
revealed that most people saw the situation as a game, and only a minority saw it
as a tax-declaring situation or as an optimising situation. This suggests that
experimental evidence cannot be generalised especially when their external
vaUdity is doubtfiil.
In terms of the relationship between gender and the amount of tax evaded,
Friedland, Maital and Rutenburg (1978) found that males evade a greater
percentage of their taxes than females, holding other variables constant a finding,
which was later supported by Spicer and Becker (1980).
3.4 Income Level
Income level, usually defined as adjusted gross income (AGI), consists of taxable
sources of income as reported on the annual tax retum. AGI is a measure of the
individual income tax base and it has a positive correlation with income tax rates,
hence it is linked directiy to tax payments. Table 3.3 below shows some past
research studies and their findings regarding the relationship between income level
and income tax non-compliance.
44

Table 3.3 Findings on the relationship between income level and income tax non-compliance
Characteristic Income level
Authors Frank and Dekeyser-Meulders (1977)
Mason and Lowry (1981)
Wallschutzky (1984)
Witte and Woodbury (1985)
Christian and Gupta (1993)
Wearing and Headey(1997)
Key findings High-income professionals practice extensive tax evasion in Belgium.
Middle-income eamers were more compliant than high and low- income eamers.
Higher income eamers are more prone to evade their taxes.
Middle-income eamers were more compliant than high and low-income eamers.
hicome level is negatively correlated with tax evasion.
Lower occupational status, eam less and without family responsibilities tend to evade taxes more.
Source: Author's collection from literature review.
Based on Table 3.3 above, it can be deduced that the research examining
correlations for income with compliance has been inconsistent. Jackson and
Milliron (1986, pp. 125-165) reported that the mixed results could be a result of
the range of incomes the sample represents. For example. Christian and Gupta
(1993, pp. 72-93), who examined taxpayers with taxable incomes of less than
US$50,000, found that income was negatively correlated with tax evasion. On the
other hand, Witte and Woodbury's finding on analysing 1969 data from
randomised taxpayer audits, was that middle income eamers were more compHant
than higher income eamers (1985, pp. 1-14). They specified middle income
eamers as being those who eam US$30,000 adjusted gross income or less. The
correlation of higher income with non-compliance is consistent with the Arrow-
Pratt assumption that risk aversion decreases as income increases (Witte and
Woodbury, 1983, pp. 1-13). Non-compliance is expected to increase with income,
given the assumption that risk aversion decreases as income rises. Thus, higher
incomes are expected to increase aggressive levels of income reporting. However,
Witte and Woodbury (1985, pp. 1-14) also found that better educated areas with
large student populations have generally low levels of compliance, which might
45

explain knowledge of evasion opportunities. As found by Chang (1984), subjects
who know more about tax laws are more inclined to play the audit lottery, a
finding that appears to support the importance of the aspect of education on
taxpayers. Mason and Lowry (1981, pp. 73-83), and Witte and Woodbury (1985,
pp. 1-14) concluded that middle income taxpayers are most compliant and both
low and high-income level taxpayers are relatively non-compliant, which supports
Allingham and Sandmo's research (1972, pp. 323-338). Jackson and Milliron
(1986) explain that under a progressive income tax rate stmcture, higher level
taxpayers reahse a greater dollar retum by evading, but this retum may have less
economic utility. Lower income taxpayers have less stakes in society and thus
have less to lose if apprehended, but lower income taxpayers may also be in less
of a position to incur these risks because of a relatively high marginal utility
associated with the potential penalties. Jackson and Milliron also noted that
increases in the non-taxable base of taxpayers may have the effect of removing
more taxpayers from tax rolls. This may have the effect of reducing the
opportunities and necessity for evasion by taxpayers in the low and high-income
strata, but it also causes problems because these people are more difficult to track
administratively. Jackson and Milliron (1986) also gave two plausible analytical
arguments for the noted empirical differences. First, all past research appears to
have been conducted using linear models. Depending on the database used,
dominance by either low or high-income level taxpayer non-compliance may
mask non-compliance at the opposite end of the spectmm. If the relationship
between income level and compliance is really curvilinear, as Witte and
Woodbury suggest, then using a linear model will understate the correlation
coeffeicient with the result that the relatively non-compliant but weaker end of the
spectmm is ignored or that a finding of no significant relationship is reported,
even though one exists. Another plausible explanation supports the "no
significance" findings and involves a closely related compHance variable. It is
possible that the observed income level compliance variation is more properly
attributed to differences in the type of income eamed by the different income
groups. Frank and Dekeyser-Meulders's study of Belgian taxpayers found that the
propensity to evade taxes varied according to income level, income source and
occupation (1977, pp. 67-78). Only high-income professionals apparently had the
opportunity to practice extensive evasion in the Belgian system. Perhaps what the
46

study reveals is that the opportunity to evade is related to the type of income
derived and that the motivation to evade is related to the taxpayer's marginal rate
of tax. This also could explain the findings of Mason and Lowry (1981) and Witte
and Woodbury (1985) whereby both low and high income taxpayers may derive
more of their income from sources that are not subject to information reporting
such as self-employment and thus have greater opportunity for evasion than
middle-income taxpayers whose incomes are subject to withholding involved in
salaries or wages.
Similarly, Wallschutzky (1984, pp. 371-384) in his survey of "evaders" and "non-
evaders" among Australians, found that evaders tend to have slightly higher
incomes. This may be explained by the rational maximising model. One may
expect those with a high locus of control and a greater sense of economic agency
to be more effective maximisers. Consequently, they will be both more sensitive
to constraints on their economic activity. Thus higher eamers are more prone to
evade taxes. Being sensitive to constraints and possessed of economic agency, the
rational maximiser is not only prone to evade taxes but is particularly inclined to
do so if the government exercises restraint by "interfering" in the economy.
However, Wearing and Headey (1997, pp. 3-17) in their survey in Melboume
found that those of lower occupational status who eam less and are without family
responsibilities tend to evade taxes more. The high negative correlation with
occupational level may reflect two things in particular. First, the ability of those in
lower status occupations to work "black" or for cash in hand. Secondly, the greater
opportunities for legal tax minimisation available to those on higher incomes,
allowing them to reduce their effective rate of tax without breaking the law.
Based on the above results, income tax non-compliance varies across groups of
individuals but the directions are uncertain, because there are other factors which
have to be taken into consideration. Different people have different personalities,
some are risk takers and others are risk averse. In terms of ethics, different people
have different moral values or ethics. It also depends on individuals' level of
perceptions of faimess and equitable tax rate stmctures, different levels of peer
influence and other interactions as well.
47

3.5 Income Source
This refers to the type or nature of the income item. The IRS data have shown that
income subject to withholding tax and income subject to information reporting by
the employers to the taxation office (such as salaries, wages) have the highest
compliance ratios (IRS, 1983). As for wages, salaries and dividends, the payers
have a legal obligation to report to the authorities and must withhold estimated
income taxes and transfer them to the tax authorities. As for other types of income,
there is no reporting obligation on the part of payers. Thus salaries and dividends
are less likely to be evaded compared with other types of income.
As noted by the General Accounting Office (GAO, 1997), the IRS data show that
compliance is highest under tax withholding, a little lower without withholding
but with information reporting to IRS, and much lower when neither system is in
place.
The sectoral concentration of tax evasion can be seen from an Intemal Revenue
Service (IRS) study, conducted in 1978 for the U.S. Congress. The study was
based on a sample of workers classified as "independent contractors" and
therefore not subject to source withholding of tax. This group constitutes workers
in the cash and underground economy with the greatest opportunities for tax
evasion. Payers are required to file "1099" information retums to the IRS for
payees receiving over $600 but are not required to supply a copy to the worker.
The study found that over 40 per cent of payers failed to comply in filing the
required retums. Surprisingly, fiilly half of the industries had zero compHance
rates exceeding 50 per cent; in those industries more than half of payees reported
none of their independent contractor receipts. There is also wide variation across
industries in the per cent of total compensation reported, ranging from 43.5 per
cent for taxicabs to 98.3 per cent for insurance. Thus it can be seen from the IRS
results, as tabulated in Table 3.4 below, that certain industries are clearly much
more prone to income tax evasion than others, even for a type of payment
relatively vulnerable to evasion.
48

Table 3.4 Industries and the rate of compliance in
Industry
Taxicabs Logging & timber Warehousing Restaurants & bars Real estate construction Trucking Direct sales Home improvement Other Franchise operations Other sales Consulting Entertaimnent Real estate Barber/beauty shops Medical/health services Exempt organisations Insurance All industries
Percent of compensation reported 43.5 52.1
54.0 58.5
63.7
66.7 68.8 70.2
72.5 73.0
74.1 76.3 77.9 89.5 90.0
90.1
97.8
98.3 76.2
the U.S. Per cent of payees with Full compliance
32.4 22.9
16.0 33.1
31.3
40.9 51.0 39.8
45.0 38.2
48.2 55.6 54.0 75.1 73.3
67.4
76.1
89.9 48.2
Partial compliance
2.9 7.6
4.0 8.0
6.0
4.9 5.7 4.6
4.1 10.0
4.7 3.2 4.0 4.7 6.7
4.6
2.2
4.0 4.9
2^ro compliance
64.7 69.5
80.0 58.9
62.7
54.2 43.3 55.5
50.7 51.7
47.1 41.3 41.9 20.2 20.0
28.0
21.7
6.2 46.9
Source: U.S. Congress (1979, p. 24).
There is also a relationship between sources of income and voluntary reporting
percentages (VRPs). According to Kesselman (1994, pp. 62-84) voluntary
reporting percentages or VRPs are the proportions of tme incomes that were
actually reported by taxpayers without any enforcement action. This relationship
can be seen in the results from the Taxpayer Compliance Measurement Program
(TCMP) of the U.S. Intemal Revenue Service in 1983. Kesselman noted that for
those types of income sources that allow expense deductions, VRPs are reported
on both gross and net income bases. Wages and salaries, which were subject to
both source withholding and information reporting, had the highest VRP. Types of
incomes allowing deductions displayed some of the lowest compliance rates. Farm
proprietors even had a negative VRP for net income, since they reported negative
net incomes whereas they had substantial positive net incomes. Similarly,
Joulfaian and Rider (1998, pp. 675-687) in their research using pooled 1985 and
49

1988 TCMP data, found that differential taxation, due to self-employment taxes
(SECA), plays an important role in explaining the observed disparity in voluntary
reporting compliance among sources of self-employment income.
Table 3.5 Findings on the relationship between income source and income tax non-compliance
Characteristic hicome Source
Authors Clotfelter (1983)
Wallschutzky (1984)
Cowell (1985)
Yaniv(1990)
Wahlund (1992)
Key findings Incomes allowing deductions displayed the lowest compliance rates.
- Self-employed, independent trades or farming have the greatest opportunity to evade tax. - Self-empIoyed/empIoy others agree that avoidance & evasion activities are acceptable and practise them.
A person's evasion opportunities to evade tax are improved by diverting work effort into areas not subjected to withholding.
A taxpayer may evade taxes by declaring part of his higher-taxed income as stemming from lower-taxed source.
Self-employed evade taxes the most.
Source: Author's collection from literature review.
Several other researchers also have found a significant relationship between
income tax non-compliance and income source. Among them were Clotfelter
(1983, pp. 363-373), Wallschutzky (1984, pp. 371-384; 1985), Cowell (1985, pp.
163-193) and Wahlund (1992, pp. 657-677) as shown in Table 3.5 above.
Clotfelter (1983) used the data set from the Taxpayer Compliance Measurement
Program (TCMP) survey for 1969 that consists of extensive audits of a stratified
random sample of the taxpaying population of the U.S. He grouped the tax retums
into three classes: 1) Non-business retums; 2) Non-farm business retums; and 3)
Farms retums. Non-compliance was defined as the difference between reported
income and the amount of income that the IRS auditors determined was due.
Those who were over-compliant (reported too much income) were treated as
honest.'* He found that in each of ten categories of tax retums, it was apparent that
the tendency to under-report far exceeds the tendency to over-report income.
Taxpayers reporting too little income outnumbered those reporting too much by at
50
least four to one in each class. It was assumed that reporting mistakes were
random and the number of over-reporters were taken as an estimate of the
expected rate of honest mistakes on the under reporting side. From this, he
concluded that between 20 per cent to 58 per cent of taxpayers were evading taxes.
In addition, he found that the average understatement of taxable income in every
class was larger than the amount of overstatement. He also found that for each
group of taxpayers, both the marginal tax rate and the level of after-tax income
have significant effects on individual under reporting. The elasticity of expected
under reporting with respect to after-tax income varies from 0.292 for non
business retums to 0.656 for farm retums. The elasticity of the marginal tax rate
varies from 0.515 for non-farm businesses to 0.844 for non-business retums.
While for non-farm businesses, the tax rate elasticity for understated adjusted
gross income ranges from 3.7 in the low income group to 1.2 in the high income
group, the overall elasticity for these business retums is only 0.5. Clotfelter
concluded that tax compliance rates vary widely among income sources and
deductions from income. Types of incomes allowing deductions displayed some of
the lowest compliance rates. Wages were found to be fiilly reported in the
aggregate in 1969, with under reporting being offset by over reporting. Interest
and dividends ranked next in overall compHance rates with 98.3 per cent and 97.5
per cent respectively.
Factors that may explain those high -reporting values are: 1) Wages are usually
withheld by employers, and information on all three are reported to the IRS; and
2) High rates of compliance for wages, interest, and dividends may be due to the
simplicity of reporting them accurately on tax forms. Clotfelter also found that
among non-business retums, under statements are greater for married couples, but
marital status is insignificant for the business and farm retums. In both business
classes, under reporting is significantly higher for the youngest group of taxpayers
than those of age 65 and older.
Wallschutzky (1984), in a survey of Australian taxpayers, found that both evaders
and non-evaders agreed that the greatest opportunity for evading tax exists with
those who derive their livelihood from self-employment, independent trades, or
51

farming. Those whose source of income is dependent on wages or salaries, which
are subjected to withholding tax, have the least opportunity to evade taxes.
In September 1984, Wallschutzky conducted a wide scale survey on attitudes and
opinions about taxation by using mailed questionnaires to a sample of 750 New
South Wales residents (1985). He found that the self-employed/employ others not
only more frequently agree that avoidance or evasion activities are acceptable but
they are also more likely to undertake avoidance and evasion practices.
Cowell (1985) in his analytical studies of tax evasion, expanded AUingham and
Sandmo's (1972) classic economic model to account for tradeoffs between legal
income, which is subject to withholding, and illegal income which is difficult for
tax authorities to detect, and leisure. This model recognises that rather than
concealing a portion of income, a person's evasion opportunities are improved by
diverting work effort into areas that are not subjected to withholding or
information reporting. This model assumes that switches in economic activity may
be induced by the stmcture of tax rates, penalties and detection probabilities.
In his survey of Swedish taxpayers, Wahlund (1992) reported that self-employed
persons evade taxes somewhat more than others. They do this because they
perceive they have more opportunities to evade taxes than others do and they are
more "conservative" than others towards the tax system enforcement.
Beside the above findings, Yaniv (1990, pp. 327-337) reported that a taxpayer
receiving income from different sources may evade taxes by declaring part of his
higher-taxed income as stemming from a lower-taxed source. The rationale for
adopting such a practice rather than purely under-reporting one's higher taxed
income is twofold. First, the former may be considered a less serious offence,
being subject to a lighter penalty. Second, attempting to enjoy the benefits of
under-reporting by consuming in excess of one's declared (net) income might
attract the attention of the tax authorities. Thus, to avoid this risk, the taxpayer
undertakes a costly laundering. Adhering to income source misreporting
eliminates this problem since every dollar of income consumed is fiilly (yet not
tmly) reported. This type of misreporting actual income source composition is
usually common in countries that have differential taxation between different
52
source of income. As in the U.S. and the U.K's former tax stmctures, capital
income was taxed at a differentially higher rate than labour income. As a result,
this encourages the taxpayer to evade taxes by declaring part of capital income
(higher taxed) as stemming from labour source (lower-taxed).
3.5.1 Cash transactions
For independent contractors engaged in professional and business activities,
incomes often are not received from others but are directly created, as differences
between gross receipts and allowable expenses, in the process of rendering
services or selling goods. Collusion between the providers and receivers of
services, aimed at evading the payment of taxes, is not only possible, but occurs
often, because of the nature of transaction. This collusion between providers and
receivers benefits both parties. It benefits the purchaser through a reduction in the
cost of the service and the provider through a reduction in the income declared
since it is difficult to trace.
3.5.2 Occupation and socio-economic considerations
Vogel's Swedish data (1974) shows that self-employed taxpayers are more likely
to agree that tax revenue is used unwisely, that the burden of taxes is too high and
that the fiscal exchange rate is unfavourable. The Eurobarometer survey's result
shows that the self-employed in all four countries surveyed (France, Britain, West
Germany and Denmark) were less keen on seeing welfare services expanded than
were employees. In fact in Britain and Denmark the majority of the self-employed
favoured reducing tax even if welfare services and social security programs had to
be cut. A persuasive explanation is that the self-employed have higher tax-
compliance costs (Sandford, 1973; Godwin, 1976), and consequently the burden
on them, in terms of time as well as money, is too great. Because of these heavier
compliance costs, tax also becomes more "visible"; and even among the fiscally
well informed, the tax side of the fiscal connection is by far the more salient.
3.6 Factors that May Influence Income Tax Non-Compliance
There are several other factors that may influence income tax non-compliance.
These include the sociological, psychological and economic factors. One example
for each of the category will be explored below. Financial strain will represent the
53

economic factors, complexity represents psychological factors and the use of a tax
preparer represents sociological factors.
3.6.1 Financial strain
Table 3.6 below provides some findings regarding the relationship between
financial strain and income tax non-compliance.
Table 3.6 Findings on the relationship between financial strain and income tax non-compliance
Characteristic Financial Strain
Authors Vogel (1974)
Wameryd and Walemd (1982)
Webley and Halstead (1985)
Besley, Preston and Ridge(1997)
Key findings Improved economic status also evade tax more than deteriorated ones.
Financial strain is not a significant factor for taxpayer to practice tax evasion.
Perception of economic deterioration is only one way that strain may be conceptualised.
Economic hardship may have been a factor in poll tax non-compliance in England.
Source: Author's collection from literature review.
Intuitively, a person experiencing more financial strain is more prone to practise
tax evasion than someone with less economic strain. However, Vogel (1974, p.
507) found that those who reported an improvement in economic status also
reported practising tax evasion more than those who reported a deterioration in
economic status. He concluded that a change in economic status could sometimes
be a consequence rather than a cause of tax evasion.
Similarly, Wameryd and Walemd's results in a telephone survey of 426 Swedish
male adults indicated that financial strain was not a significant factor in evading
taxes (1982, pp. 187-211). Further, the results of a laboratory experiment by
Webley and Halstead (1986, pp. 87-100) suggest that perceptions of deterioration
of economic circumstances is only one way that "strain" may be conceptualised.
However, Besley, Preston and Ridge (1997, pp. 137-152) in their investigation of
poll tax compliance in England found that economic hardship may have been a
54

factor in poll tax non-compliance since the indicators of unemployment have a
consistently positive effect on non-compliance.
3.6.2 Complexity
Psychologically, a student will ignore or neglect difficult questions/complex
questions compared with simple ones. Applying this situation to the tax system,
there is a greater tendency for taxpayers to comply with Income Tax Regulation if
it is simple and clear. Table 3.7 below provides some past research regarding the
relationship between complexity and income tax non-compliance.
Table 3.7 Finding, tax non-
Characteristic Complexity
s regarding the relationship between complexity and income compliance
Authors Westat(1980)
Clotfelter (1983)
Milliron (1985)
Long (1988) Slemrod(1989)
Beck and Jung (1989) Scotchmer and Slemrod(1989)
Aim, Jackson and McKee (1992)
Brand (1997)
Key findings Complexity aggravates taxpayer uncertainty and acts to deter noncompliance.
Complexity of retums was associated with more under reporting non-business retums, but no significant effect for business retums.
Complexity had a significant effect on reporting but the directional impact was mixed.
A very strong relationship between the complexity of reporting requirements and errors detected by audit.
Uncertainty in tax administration is a deterrent to evasion.
Noise increases compliance and in others it reduces it.
Complexity in the law contributes to noncompliance and burden.
Source: Author's collection from literature review.
There seems to be a general belief that simplifying the tax code and reducing its
complexity increases compliance, but several analytical studies suggest that the
opposite may be tme (Beck and Jung, 1989; Scotchmer and Slemrod, 1989; Ahn,
55

Jackson and McKee, 1992). The general theme of these papers is that random
noise in the system makes the pay-off for tax evasion more uncertain (Bardsley,
1994). Risk averse taxpayers will wish to reduce uncertainty. Thus uncertainty in
tax administration is a deterrent to evasion.
There has been conflicting hypotheses regarding the effect of complexity on
compUance. Westat (1980, pp. 29-30) theorised that complexity aggravates
taxpayer uncertainty, which in tum acts to deter non-compliance. However,
Clotfelter (1983, pp. 363-373) claimed that in his analysis of individual retums of
TCMP audit procedures, the presence of several different tax forms - and thus
complexity of retums, was associated with more under-reporting among non
business retums, but there was no significant effect for business retums. Again,
Milliron (1985, pp. 794-816) found that complexity had a significant effect on
reporting, but the directional impact was mixed because of interactions with two
other compliance factors: perception of faimess and opportunity for evasion.
Voluntary compliance is enhanced when the rights of taxpayers are respected, for
example when the tax agency collects a fair share of income tax from all
taxpayers, and when the perception that the tax office is very active in combating
non-compliance is very high, thus the opportunity for escape from detection is
small. As a result, people voluntarily comply.
On the other hand, several researchers report that risk-averse taxpayers wish to
reduce uncertainty, thus uncertainty in tax administration is a deterrent to evasion
(Beck and Jung, 1989; Scotchmer and Slemrod, 1989; Aim, Jackson and McKee,
1992). However, the empirical evidence is mixed. Aim et al. (1992) report from an
experimental study that in some cases noise increases compliance and in others it
reduces it. Klepper and Nagin (1989a) also report mixed results from a study of
audit data.
Brand (1997, pp. 413-419) believes that complexity in the law contributes to non-
comphance and burdensomeness. Lack of clear-cut language, the need for
extensive guidance, interpretations, mles, and regulations, all contribute to less
compliance. It also makes difficult to administer the law hence creating
opportunity for intentional non-compliance and increases unintentional non
compliance. Similarly, Long (1988) reports that there is a very strong association
56

between the complexity of reporting requirements and errors detected by audit.
Slemrod (1989, pp. 3-27) confirms this in his review of complexity, compliance
costs and tax evasion.
Complexity and compliance costs
A tax system may be complex and thus involve greater compliance costs for many
reasons and in many ways, such as, the compliance costs arising from the need to
make the tax base more accurately reflect taxpayers' relative taxpaying ability.
Such compliance costs may arise on account of more complex mles. These include
mles that attempt to distinguish more precisely between deductible business
expenses and non-deductible personal expenses, or mles that include a range of
fiinge benefits in income. The complexity of tax mles may also influence the level
of compliance. The simpler the mles or the tax code, the more certain the results in
applying it and thus fewer opportunities exist for disagreements over the "fine
points" of tax law, hence there is less chance for exploitation by those who are
expert in this field such as the tax practitioners.
In his survey of Swedish taxpayers, Vogel (1974, pp. 499-513) concluded that
taxpayers usually need more tax stmcture information than that provided by the
tax forms in order to complete their retums. Important misunderstandings were
revealed and lack of awareness of possible deductions was noticeable. He claimed
that the feature of the Swedish tax collection system is a set of complicated retum
forms, of which the average taxpayer must complete from two to four annually.
The number and nature of regulations applicable, the legal language used and the
alleged confiising layout of the forms have been heavily criticised.
Kaplow (1995, pp. 135-150) emphasised that the immediate costs of complexity
cannot be measured by looking solely at the mles themselves. More visible tax
information promotes higher compliance. The primary source of compliance cost
involves taxpayers' behaviour, often involving record keeping, so estimates of
incremental paperwork costs are usually more probative than counts of the number
of pages of mles. Good records and other types of paper trails also lead to better
results when the tax administrators audit a retum or take some other enforcement
action. Similarly, the difficulty of an audit will usually depend upon problems of
57

verifying the details of taxpayer behaviour rather than challenges of understanding
the mles themselves.
Slemrod (1988, pp. 61-65) has identified three different aspects of the tax system
with respect to cost of compliance. The classifications are as follows:
(1) Unpredictability or uncertainty
Risk averse or conservative taxpayers are more likely to reduce or abandon
tax evasion and to report more taxable income unless they substitute tax
avoidance for evasion. Uncertainty also may lead taxpayers to hold the tax
system in low esteem and therefore comply less stringently.
(2) Difficulty
The more difficult it is to comply with the legal requirements, the more likely
it is that the taxpayer will not complete his or her annual retum, and will hold
the tax system in low esteem. Altematively, taxpayers may comply but
completely ignore or use guesswork about certain aspects of the tax system.
However, Lempert (1988, pp. 68-71) noted that the complexity of the law
might lead taxpayers to make greater use of agents, thereby increasing
compliance.
(3) Manipulability
Taxpayers invest some resources such as time and agents' fees into reducing
taxable income legally. These potential gains however depend upon the
marginal tax rate.
3.6.3 Tax preparers
Tax practitioners or preparers generally have greater technical knowledge,
professional experience and familiarity with the administration of the tax law
relative to ordinary taxpayers. Thus there is a tendency for taxpayers to shift the
burden of accurate filing of retums to tax practitioners or preparers. As a
consequence, tax practitioners are in a position to exert a strong and direct
influence on the compliance and tax administration processes (Erard, 1993, pp.
163-197), Table 3.8 below provides some key findings on the relationship between
the use of tax preparers and income tax non-compliance.
58

Table 3.8 Findings on the relationship between the use of tax preparer and income tax non-compliance
Characteristic Tax preparers
Authors Westat (1980)
Wallschutzky (1985)
Dubin, Graetz, Udell and Wilde (1989) Klepper, Nagin (1989c)
Erard (1993)
Key findings More audit adjustments from use of paid preparer than self-prepared retums, regardless of the type of retum.
Professional tax advisers make people more likely to avoid their taxes.
There is a linkage between taxpayer use of preparers and non-compliance.
Preparers play a mixed role in the compliance process.
The use of CPAs and attorneys is associated with increased tax noncompliance.
Source: Author's collection from literature review.
Two general roles for tax preparers in the collection process are as providers of
services and also as providers of information (Reinganum and Wilde, 1991, pp.
163-181). Dubin, Graetz, Udell and Wilde (1989) provided evidence that suggests
a linkage between taxpayer use of preparers or practitioners and non-compliance.
IRS data of the Taxpayer Compliance Measurement Program or TCMP 1979
individual retum indicates that 44.2 per cent of the individual retums filed in 1979
were self-prepared, and that these retums accounted for 22.8 per cent of detected
non-compliance. Retums prepared with third-party assistance accounted for 55.8
per cent of filings and 77.2 per cent of the detected non-compliance. Among
retums prepared with third-party assistance, however, under-reported tax was not
uniformly distributed. Only 10.6 per cent of all taxpayers used a tax practitioner,
yet their retums accounted for 32.5 per cent of under-reported tax. A total of 34.7
per cent used other paid preparers accounting for 40.9 per cent of under-reported
tax. The remaining 10.4 per cent used non-paid assistance accounting for 3.7 per
cent of under-reported tax. However, Klepper and Nagin (1989c, pp. 167-194)
provided empirical evidence related to the mixed roles played by tax preparers in
the compliance process. On the one hand they appear to contribute to non
compliance by helping taxpayers exploit ambiguous features of the tax code. On
the other hand, however, they appear to enforce legally unambiguous features of
59

the tax code and also to act as important conduits for communicating tax agency
enforcement priorities.
Similarly, Wallschutzky (1985), in his mailed survey in New South Wales,
discovered that in relation to tax avoidance, 84 per cent of respondents thought
that professional tax advisers would make people more likely to access tax
schemes which exploited loopholes in the laws.
Although a few preparers who dealt with lower income taxpayers reported that
they were viewed as government agents, Westat (1980, p. 81) reported that most
preparers believe they are viewed by their clients as advocates. Consistent with
this view of preparers as advocates, an analysis of tax retum data by the IRS
shows more audit adjustments occurred on paid preparer retums than self-prepared
retums, regardless of the type of retum.
The availability of tax preparers undoubtedly reduces many informational and
computational barriers to tax compliance, however, the results gathered by Erard
(1993, pp. 163-197) indicate that their use, particularly the use of CPAs and
attomeys, is associated with increased tax non-compliance, which may have
negative implications for both tax equity and tax efficiency.
The U.S. Treasury Department believes that an erosion of tax preparers'
perceptions of their reporting responsibilities has substantially contributed to
taxpayer non-compliance (1986). Recognising that tax preparers play an important
role in taxpayer non-compliance. Congress has enacted various sanctions aimed at
tax retum preparers.
3.7 Summary
In searching for suitable strategies, some characteristics associated with this non
compliance such as: gender, income level, income source and age group require
study. In addition, analysis of the reason or reasons for these groups to behave as
they do is necessary.
Most of the studies reviewed above found that young taxpayers, males, high-
income eamers and the self-employed are most likely to evade taxes. On the other
60

hand some studies did not find any relationship. The findings on possible causes
of income tax non-compliance especially financial strain and complexity were
rather mixed because of interaction with other compliance factors such as
perception of faimess and opportunity for evasion were not considered in these
studies (Milliron, 1985, pp. 794-816). However, most researchers reported that tax
preparers help taxpayers in exploiting ambiguous features of tax codes that
contributes to non-compliance.
61

CHAPTER FOUR
Review of Literature on Some Strategies in Overcoming Income Tax Non-Compliance
4.1 Introduction
This chapter explores some strategies for improving tax administration efficiency
and for overcoming income tax non-compliance that have already been introduced
in some advanced countries. Basically it comprises of three sections: the first
section discusses tax policy and successful tax reform explored by some
researchers, giving its definition, and providing the benchmarks for addressing the
tax issues in this research. The second section discusses tax enforcement
mechanisms, whose success is dependent on group cooperation. This section also
examines taxpayers' attitudes and behaviour which are important factors possibly
contributing to income tax non-compliance. There are five mechanisms discussed
in this section: 1) strategies to assist in changing attitudes; 2) positive approaches;
3) withholding of taxes and information reporting; 4) detection and punishment;
and 5) simplifying the tax system. Finally the last section summarises the
argument of this chapter.
4.2 Tax Policy and Reform
The trend towards tax reform in Asian and Pacific countries has been evident since
the late 1970s and has accelerated since the mid 1980s. Jenkins (1990) noted that
at least 25 major tax reform exercises were undertaken between 1984 and 1990.
However, the immediate motivation and context for undertaking tax reform vary
fi-om country to country. In those countries facing such fiscal problems such as
large and persistent fiscal deficits, high inflation, low levels of compliance,
problems with administrative efficiency, and excessive reliance on a single
category of taxes such as those on intemational trade or on excises, the immediate
motivation and context are fairly obvious. Further, the role played by the
government in responding to changes in the world economy, including
globalisation of economic activities, is inevitably important.
62

hi principle, the characteristics of a "good" tax system are fairiy clear. It should be
efficient, it does not distort economic decision-making and its administrative and
compliance costs should not be excessive (James and Nobes, 1992, Chapter 3).
Successfiil tax reform can be defined as a change to the tax system that results in
the final outcomes intended by government. However, it is a complex matter since
the tax system is used to achieve a wide range of fi-equently changing objectives,
some expHcit, others perhaps less so (James, 1997, pp. 205-226). The tax system
is also subjected to pressure for change in particular areas. The importance of a
carefiil analysis of the environment in which an organisation operates is widely
recognised as an essential part of the development of a successfiil business
strategy. Similarly, it is just as important to consider carefully the environment in
which any tax system is expected to operate. In analysing the tax environment, it
is usefiil to look not only at the current position but also at likely fiiture
developments as has been done by James and Wallschutzky (1995).
According to Silvani (1994, pp. 274-305) tax administration also should be
"effective" in enforcing voluntary compliance. Tax administration will be
effective if it is able to deal with the following key shortfalls.
(1) Reduce the number of unregistered taxpayers that originate in the gap between
potential taxpayers and registered taxpayers.
(2) Stop filing taxpayers that refer to the difference between registered taxpayers
and those who file retums. These taxpayers have failed to submit their annual
retums to the taxation authority hence failed to declare their annual income.
(3) Tax evaders that refer to the gap between the tax reported by taxpayers and the
potential tax according to the law.
(4) Delinquent taxpayers that refer to the difference between the amount of taxes
that taxpayers report owing, or that the tax administration may eventually
assess, and the tax actually paid by taxpayers.
Similarly, Tanzi and Pellechio (1995) address tax administration reform by
describing briefly the causes for inefficient tax administration, identifying the
essential elements of successful reform, and presenting measures to improve the
tax administration. The common strategy is to focus administrative resources on
problems in the tax collection system through promotion of voluntary taxpayer
63
compliance and adoption of a logical sequence of procedures for efficiently
identifying and handling instances of non-compliance. Besides voluntary
compHance, Goode (1981, pp. 249-275) also stresses the absence of wealthy
groups with enough power to block tax measures that they consider a threat to
their position. This pressure could be applied not only to legal changes in order to
increase tax due but also to administrative resolutions to fight evasion.
4.3 Enforcement
The primary role of the tax administration is to collect income taxes through
facilitating and inducing voluntary compliance. Generally, all taxpayers have an
incentive to misrepresent their activities which have tax implications, in order to
reduce or eliminate their tax liability. For this reason, no tax stmcture can stand
alone without an enforcement mechanism supporting it. A theory of optimal tax
systems must encompass not only the choice of tax mles but also the methods by
which they are enforced (Slemrod, 1990, pp. 157-178). Tax enforcement is a
behavioural problem. This means that the ability of a tax administration to
influence taxpayer behaviour is very much linked to its ability to read and
feedback overviews of this behaviour and of the changing environment in which it
operates. In this context, some understanding of taxpayers' differing perceptions
of taxation itself is important. Its success depends on cooperation between both
parties. Hence its success depends on how the system of taxation is perceived by
taxpayers for example, in terms of equity among all taxpayers, and the
government-taxpayer relationship, and whether the amount of tax paid is worth the
welfare that they receive in retum from the government. The tax administration
can make up not only for individual resistance but for the hostility of the whole
group or of everybody concemed. There is less resistance fi^om taxpayers when
they know that all taxpayers are charged fairly and that those who fail to declare or
escape paying taxes are punished accordingly. Hence the taxation authority should
be active in detecting tax evaders besides imposing a fair share of income tax, on
all levels of income, in all types of income eamed. Thus the taxation authority
should minimise loopholes in the income tax legislation that may be enjoyed by
only certain groups of taxpayers. In the long ran, by keeping tax laws within the
limit of the enforceable, there will be little leeway for evasion or insecurity on the
part of the taxpayer as well as for administrative arbitrariness. In contrast, any gap
64

between law and reality is bound to foster alienation, perceptions of inequity and
refiisal to cooperate. Thus the taxation authority should properly enforce the
income tax regulations and its legislation so that the public will be confident about
its enforcement. As for the government-taxpayer relationship, the taxation
authority could play its role by disseminating all information regarding taxes
collected and how they have been channelled through various channels that are
discussed below.
Enforcement is one aspect of tax administration and it includes prevention and
positive approaches. It must be seen as the means through which the objective of
facilitating and inducing voluntary compliance is achieved, not as an end in itself
Taxpayers' attitudes and behaviour
It is very important for tax administrators to understand taxpayers perceptions
towards income tax, so that the taxation office can provide suitable strategies in
enhancing voluntary compliance besides introducing effective strategies in
combating non-compliance. Thus it should explore human attitudes and behaviour,
people's likes and dislikes and ways to improve negative perceptions of the
income tax office.
Two important influences on human behaviour are attitudes and needs. Attitudes
are defined by Assael as "leamed predispositions to respond to an object or class
of objects in a consistently favourable or unfavourable way" (1984).
Understanding taxpayers' attitudes both towards the Tax Department and the
payment of tax is critical, thus the IRB has to develop strategies which will enable
it to influence or change these negative attitudes to positive attitudes towards
compliance. Based on United States survey data collected in 1974, Spicer and
Lundstedt (1976, pp. 295-305) developed and tested four hypotheses to analyse
the issue of tax non-compliance. They concluded that taxpayer decisions to
comply are closely related to two factors: the degree of perceived coercion and the
perception of inequity in the fiscal system. In this context, tax authorities need to
take remedial action against unfavourable attitudes toward the fiscal system by
introducing taxpayer education programs aimed at existing and potential
taxpayers. Dean, Keenan and Kenney (1980, pp. 28-44) conducted a study in 1977
65

on a sample of 424 adults in Scotland to analyse taxpayer attitudes towards
income tax evasion. He identified five factors that affect taxpayer decisions: (a)
the level of taxation and the worth of government expenditures; (b) tax equity; (c)
the probability of detection; (d) moral perceptions; and (e) economic
considerations. The result showed that taxpayers will evade tax when they feel the
general level of taxation is high. The results, based on two variables of probability
of detection and moral perceptions, support Allingham and Sandmo's (1972)
model.
Spicer and Becker (1980, pp. 171-175) examined the relationship between tax
evasion and perceived inequities in tax systems. They suggest that taxpayers hold
general perceptions and attitudes conceming the equity of their own and other's
exchange relationships with government, and that these perceptions and attitudes
are relevant to the tax evasion decision. The analysis suggests that taxpayers'
utility fiinctions are interdependent so that the utility derived from tax evasion
depends on the taxpayer's sense of equity regarding his relationship with the
government. It is hypothesised that the amount of taxes evaded increase for
victims of fiscal inequity but decrease for beneficiaries of fiscal inequity. The
results of their experiment support this hypothesis.
Another factor affecting behaviour is needs. Needs are inner motivational states
which can be aroused by either intemal cues or extemal stimuli (Coleman and
Freeman, 1997, pp. 311-336). Examples of intemal cues are thirst or hunger while
extemal stimuli consist of three types. They are as follows:
(1) Social influences of peer pressure as researched by Wallshutzky (1995)
confirm that compliant behaviour is influenced by peer group attitudes,
which is also significanfly supported in the Spicer and Lundstedt study
(1976, pp. 295-305) and the Besley, Preston and Ridge study in 1997
(pp. 137-152).
(2) Personal experience: Taxpayers' personal experience with the income
tax officers is critically important in influencing their attitudes towards
compliance. If taxpayers have negative personal contact with the income
tax officers, this may linger in their memories or even provoke them not
to comply with the Income Tax Law. On the other hand, positive
66

assistance to reduce tax by legitimate means may generate a change in
taxpayers' attitudes, which in tum may produce a change in behaviour
thus resulting in a greater tendency for them to comply with the law.
(3) Information: It has been recognised that one way of assisting taxpayers
in understanding and complying with the law is by providing them with
guidance, for example, in the form of a Tax Pack and information
booklets. Coleman et al. (1997) in their research in Australia have
ascertained that many small business taxpayers do not adequately
understand the benefits of many of the legitimate tax shelters available
to them (pp. 311-336).
4.3.1 Strategies to assist in changing attitudes
It is necessary for the taxation authority to develop strategies to change taxpayers'
attitudes towards voluntary compliance. Marketeers use adaptive strategies in
inducing new purchasers to try a product or to encourage existing users to increase
their consumption or to try a new product (Assael, 1984). IRB officers can use
similar tactics in enhancing voluntary compliance. There are four types of
adaptive strategies:
(1) Reinforcing positive attitudes among existing users of a brand.
A large percentage of taxpayers are compliant as established by Wallschutzky
(1995) and Nazir, Lowes and Letza (1995). Coleman and Freeman (1997, pp.
311-336) recommended that some acknowledgment or reward system needs to
be introduced to encourage continued compliant behaviour, especially for the
honest taxpayer who had been audited without a single adjustment which
should be compensated for loss of time.
(2) Attracting new users to an existing brand by emphasising the positive benefits
of the brand.
Many researchers (for example Wallschutzky, 1985; Nazir et al. 1995;
Coleman and Freeman 1997 and others) have agreed that if there was
feedback to taxpayers on the allocation of tax collected, this would have a
positive effect on voluntary compliance. Thus it is wiser for IRB officers to
inform taxpayers about government uses of revenue collected to increase the
range of goods and services available for taxpayers own benefits.
67

(3) Positioning new products and services to meet the needs of existing users.
The IRB can raise awareness among its staff of the importance of good
service. It could educate the existing taxpayers and develop a positive on
going helpful relationship apart from making taxpayers understand tax law so
that they will comply voluntarily as it costs less to collect revenue if they
understand the law rather than if they must be forced to comply. As Wegner
and Wallacher (1977) suggest, the IRB should create positive attitudes about
payment of tax and the fact that taxes provide public goods and welfare
benefits.
(4) Positioning new products to satisfy the needs of new and emerging markets.
The government needs to publicise the benefits to the existing taxpayers and
the potential taxpayers of the use of tax revenue in increasing the range of
goods and services available to the public.
Some activities being conducted by the IRB to increase public awareness
regarding their responsibility to pay income tax are, for example, conducting street
surveys and placing a fortnightly column in a local newspaper "Income Tax &
You." A street survey is conducted at the beginning of each year, whereby groups
of IRB officers make surprise checks on taxpayers' business premises particularly
in strategic business areas with the aim of improving taxpayers' business record
keeping as well as enlarging the tax base. "Income Tax & You" is a fortnightly
question and answer column which involves an IRB representative and a daily
newspaper The Star in the northem region of Malaysia. The public relations
officer of Pulau Pinang Branch answers income tax queries forwarded by readers.
4.3.2 Positive approaches
Traditionally, the government relies on penalties to overcome the problem of non
compliance. The reliance on penalties has been based on the relationships
specified in deterrence theory which assumes that there is a perceived likelihood
of apprehension and a severe but fair penalty for an offence (Rossi and Grasmick,
1985, pp. 79-101). Ross (1984, pp. 21-35) found that if the sanction was not
considered appropriate, it may not be imposed, and the deterrence theory would
not be effective. In his study of tax attitudes in several European countries,
Schmolders (1970, pp. 300-306) concluded that citizens are likely to be extt-emely
68

resentfiil of tax systems where extensive enforcement is used. This resentment can
lead to additional non-compliance.
4.3.2.1 Service approach
Taxpayers are the heart of the taxation office business, thus it is of great
importance for it to provide quality service to its "clients" besides increasing client
awareness of matters relating to taxation.
Wirth (1994, pp. 63-84) in his field experiment aimed at determining the impact of
certain service initiatives used by the Australian Taxation Office (ATO) auditors
on taxpayer compliance behaviour, found that the study supports the effectiveness
of a service approach in improving taxpayer compliance. In general, the survey
results appear to support the view that taxpayers saw the Lismore Project (which
was conducted in the Lismore region of New South Wales) in a favourable light.
Most taxpayers surveyed indicated that they believed the project was about
"helping taxpayers" and "administering" the law fairly, rather than "maximising"
revenue or "catching tax cheats". Using a service approach also enables the
auditors to identify non-compliance problems in an industry and to devise and
implement an education and information campaign to highlight the issues. Thus
through a combination of broad service initiatives and personal contacts, what
appears to be a high level of recognition, acceptance and change in reporting
behaviour can be achieved. The project also highlights the valuable role that
intermediaries, such as tax practitioners and industry associations, can play.
Similarly, the IRB of Malaysia introduced Taxpayer's Service Week (or MPPC) in
1988. Since the response from the public was very good, it has implemented this
activity yearly whereby officers of the IRB open service counters for one week at
shopping malls, banks or any other places that might have a greater number of
potential taxpayers. This usually takes place a month before the closing date of the
annual retums lodgment. This program is undertaken mainly to bring non-filers
into the system besides "going direct to the public" and providing information or
taking notes on any suggestion or objection. The counters operate between 8.00
am to 10.00 pm everyday except Sunday when they operate from 9.00 am to 2.00
pm.
69

(a) Payment through the bank system
Payment of taxes through any Bank Bumiputra throughout the nation was
introduced in 1995. This not only provides fiirther convenience for taxpayers in
paying taxes but also encourages punctuality of payment (IRD, 1995).
(b) Drive-in payment counter
This service was created to overcome the problem of traffic congestion caused by
the lack of parking bays at the Collection Branch Payment Counter office, which
poses a problem more to taxpayers who only need to settle their tax liabilities. The
counter is located at Jalan Duta, Kuala Lumpur and began its operation in mid-
November 1994. It is limited to accepting income tax payments by cheque (IRD,
1994, p. 58).
4.3.2.2 Public education program
A public education program that promotes some positive aspects of the Inland
Revenue authorities can affect taxpayer attitudes, and better attitudes may lead to
less non-compliance in the fiiture. It is a challenge to encourage and promote
taxpayer attitudes that will enhance the voluntary payment of taxes. This is
essential to create awareness and a sense of responsibility among taxpayers (Witte
and Woodbury, 1985, pp. 1-14; ABA, 1988, pp. 329-392; Roth, Scholz and Witte,
1989). It is especially important in developing countries, as in Malaysia, where
illiteracy rates are high. Chelvathurai stressed that this program should be used to
educate the general public, so that the tax laws can be understood easily (1990, pp.
594-599). According to Nagin (1990, pp.7-22), taxpayer education and assistance
provided by tax agencies can reduce compliance costs to taxpayers.
Mason (1987) conducted surveys in Oregon (U.S.) to analyse the linkages among
mass media exposure, interpersonal discussion and fear of sanctions for
individuals, and the joint contribution of their effects on compliance with income
tax laws. He develops a communication model that includes endogenous variables
such as mass media exposure, personal discussion and sanction fear, as well as
exogenous variables such as age, income, differential opportunity and education.
According to Mason, content analysis of the media's attention to tax issues is
important to describe more precisely the nature of messages received by the
general public. His study showed that: the communication variables (mass media
70

and personal discussion) are related to sanction fears as deterrence theorists have
hypothesised. Those heavily involved in personal discussion, however, have low
fear levels. Fear of sanctions, however, is related to compliance. Those with low
fear levels admit they evade their taxpaying responsibilities (Mason, 1987, pp.
246-258). This study also indicates that variables, such as age and income levels,
are positively related to mass media exposure.
Using TCMP data for 1969, Witte and Woodbury (1985) indicate that attitudes
have an important effect on compliance. Their findings suggest that the IRS's
educational efforts will increase compliance for all groups, but for small-business
owners the effect is not significant.^ Hence the taxation authority needs to use
some other means of combating non-compliance among small business such as the
use of audits.
To increase public tax knowledge, the IRB has conducted mass media
communications that include broadcasts through radio and television, publications
in newspapers, income tax leaflets, lectures and briefings, the IRB calendar, an
intemet web-site (http://www.hasilnet.org.my) and a telecommunications InfoLine
600-837-888 (IRB 1997a, p. 17).
The taxpayer education program will be effective if it focuses on populations in
which compliance rates are low, such as self-employed persons, and small and
medium scale businesses (Mahfar, 1994). The program also must cover new and
potential taxpayers, including high school and college students (Spicer and
Lundstedt, 1976; Witte and Woodbury, 1985; ABA, 1989).
Mahfar (1994) has proposed a taxpayer education program for use by the
government of Malaysia, as part of its ongoing effort to improve its fiscal
efficiency and reduce non-compliance. The proposed program contains three
important components, namely the organisational arrangements, modes of
communication and special programs. It is recommended that a special unit be
established within the IRB to be solely responsible for the program. Second, a
variety of approaches could be utilised to communicate with taxpayers. These
approaches include printed materials such as pamphlets, newsletters, leaflets; the
use of the media through radio, television, magazines and counters in giving
71

information and student tax programs that provide tax education and competitions
on taxation among students. Third, a special program, the Problem Resolution
Program should be promptly established to provide assistance to taxpayers having
problems dealing with the IRB. Such a program can maintain a close relationship
between the IRB and taxpayers thus demonstrating a more favourable attitude and
behaviours toward the taxation system. Mahfar incorporates the best features from
similar programs in selected developed countries into his proposal. However,
some modifications of these features have been recommended by him to suit the
local environment of Malaysia.
The prevention approach, such as detection, apprehension, and prosecution of non-
compliant taxpayers and intermediaries, is another method to combat income tax
non-compliance. Intermediaries are private-sector entities who are required to
submit withholding taxes and/or to provide information reports to the government;
examples are employers and payers of interest, dividends, and pensions
(Kesselman, 1994, pp. 62-84). Hence intermediaries can ease compUance for
taxpayers by withholding and remitting client taxes and also by simplifying the
government's tax administration.
4.3.3 Withholding of taxes and information reporting
The withholding of taxes at the source of income is the most basic of all
compliance techniques and it increases the costs of evasion to the taxpayer. It is
widely used in developed and developing countries for collecting revenue with
minimal use of administration resources. A popular mechanism is wage
withholding, commonly known as pay-as-you-eam (PAYE), in which employers
are withholding agents for personal income tax payable on the eamings of their
employees (see van der Heeden, 1994). This shifts the tax administration's
monitoring responsibilities from a large number of individual taxpayers to a
smaller number of employers, thus achieving a more efficient focusing of
administrative resources (Tanzi and Pellechio, 1995). While information reporting
involves information provided by the payer to the taxation office either by
withholding/without withholding the tax at the source of income other than wages
on behalf of the payee. As noted by Tanzi and Pellechio (1995) taxes can also be
withheld on sources of income other than wages by collecting from the payer
72

rather than the payee with the same efficiency gains. This includes payments of
interest by banks, dividend payments by companies to stockholders, interest and
dividend payments by mutual fiinds, and other similar payments. The following
examples prove the positive effect of withholding taxes and of information
reporting requirements. For the tax year 1992, the wage eamers whose wages were
subject to tax withholding (the most systematic method for making income visible
to IRS) were estimated to have reported 99 per cent of their wages. Additionally,
98 per cent of them reported their interest income and 92 per cent their dividend
income, most of which is subject to tax-information reporting but not tax
withholding requirements (GAO, 1997). In contrast, the IRS estimates that self-
employed individuals who formally operate businesses other than farms, report
about 68 per cent of their business income, which is neither subject to withholding
nor necessarily covered by information reporting. Finally, self-employed informal
suppliers, who are even less likely to have income reported to the IRS on
information retums, report an estimated only 19 per cent of their business income.
As for 1981 and 1987, Table 4.1 below also shows that in the United States,
compliance has been highest for wages and salary. This type of income is subject
to deduction at the source. Interest income experienced the next highest rate of
compliance because it was subject to information reporting. On the other hand, the
informal supplier income had the highest rate of non-compliance among these
incomes for it was not subject to either deduction at the source nor to information
reporting. This suggests the importance of tax withholding and information
reporting.
Table 4.1 Compliance rates for different classes of income for the United States 1981 and 1987 (percentages)
Type of income
Wages and salaries Interest Capital gains Informal supplier income
198 1 94 86 58 20
1987
97 80 85 11
Source: Income Tax Compliance Research: Estimates for 1973-81, Intemal Revenue Service, US Government Publishing Service, Washington, Table III, July 1983; and Income Tax Compliance Research: Supporting Appendices to Publication 7285, Publication 1415, US Government Publishing Service, Washington, Table D 16, July 1988.
73

Similarly, the American Bar Association or ABA (1988) recommends that a tax
withholding system be considered an important device to reduce the opportunity
for non-compliance. IRS statistics show that taxpayers who are subject to
withholding report on time and pay over 97 per cent of the taxes due on their
income compared with those not subject to withholding who report and pay only
78 per cent (IRS, 1992).
Two major forms of withholding exist: exact withholding without obligatory filing
of an end-of-year tax retum (the British system) and approximate withholding
with obligatory end-of-year fihng (the American system). Despite its lower load of
retums, the former is considered more costly to administer than the latter.
However, the latter is believed to be more evadable, as it allows for the evasion of
non-withheld taxes simply by failing to file an end-of-year retum. Nonethelessly,
exact withholding is not immune to tax evasion because a wage eamer may choose
to split work efforts between several jobs, failing to inform employers (as the law
requires) that he or she is also employed elsewhere. Consequently, each employer
heats him or her as a single job holder and the employee enjoys lower tax brackets
and also gains multiple tax allowances for personal attributes in excess of his or
her tme entitlement.
The IRB adopted Schedular Tax Deduction (STD) whereby the deduction of tax
by employers from employees' monthly remuneration is based on a schedule that
predetermines the amount of tax to be deducted. Thus it adopted the American
system of withholding of taxes. For taxpayers who commenced employment
anytime before 1 January 1995, the deductions made from their current
remuneration are for settlement of tax on income received in the preceding year
and not on income received in the current year. Taxpayers who commence
employment on or after 1 January 1995 pay tax as they eam (PAYE) meaning the
tax deduction made goes towards the tax to be raised in the following year.
A scheme for compulsory payment of tax by instalments was introduced to cover
companies, self-employed individuals, clubs, associations and tmsts effective from
1 January 1989 (IRD, 1992b). These taxpayers were directed to make five
bimonthly instalments starting from January and Febmary. However, they could
74

request variations of instalment payments if the estimates were not considered
acceptable.
However, based on Yaniv evidence, the taxation authority cannot rely totally on
the employers or intermediaries as its agents in withholding taxpayers' income
taxes. Yaniv (1992, pp. 312-321) seeks to evaluate the extent of collaboration
between employees and employers in a tax withholding system with regard to tax
compliance. He points out that one of the weaknesses in a tax withholding system
is the taxpayer's opportunity to cooperate with his or her employer to manipulate
the tax laws. For example, an employer might agree to withhold less than the
actual taxes due, in exchange for the employee's agreement to accept less than the
free market wage rate, which is common in cash economy transactions such as
restaurants, hawkers etc. Another example of employer-employee collusion is the
widespread use of non-taxable fiinge benefits. Thus it is important for tax
agencies, as part of their strategy in combating non-compliance, to focus on the
issue of dishonesty among employers and others who act as collection agents in a
tax withholding system. According to Soos (1991, p. 183), "withholding agents
must deduct the correct amount of tax, remit it to the government, file periodic
retums, and account to taxpayers for the tax withheld". He also suggests that self-
employment income should be subjected to tax withholding, because the self-
employed have more opportunity for non-compliance. This supports the view that
the taxation authority also has to enforce some deterrent strategies such as
detection and punishment.
75

4.3.4 Detection and punishment
One explanation for compliance stresses that the threat of detection and
punishment is responsible for compliance. This theory stems from the economics-
of-crime approach, based upon traditional expected utility theory of tax evasion by
Allingham and Sandmo (1972, pp. 323-338). An individual, by understating
taxable income, receives the reward of a lower tax liability if the evasion is
undetected, and pays a penalty if the evasion is detected. The decision will depend
on the chances of being caught and on the individual's attitude toward risk. Hence
detection and punishment are two main instmments used by the tax authorities to
overcome income tax non-compliance.
4.3.4.1 Audit plan
In a modem tax system it is cmcial for taxpayers to believe that if they engage in
fraudulent actions there is a reasonable chance they will be caught and
appropriately penalised. It is also important that taxpayers be confident that their
competitors are paying the same taxes so they may compete fairly. This requires
that an effective audit program be carried out by the tax administration.
In a number of empirical, experimental studies of US taxpayer behaviour, the
influence of the probability of audit on compliance decisions has been found to be
highly significant (e.g. Smith and Kinsey, 1987, pp. 639-663). Madeo, Schepanski
and Uecker (1987, pp. 323-342) in their modelling of taxpayer compHance using
tax professionals as subjects, found that the probability of audit was the most
significant factor affecting adopted tax positions on contentious tax issues. Thus
audit plays an important role in combating income tax non-compliance. As found
by Wallschutzky and Singh (1995), very few investigation cases were finalised by
the Malaysian taxation authority from 1981 to 1991, represented by a low of 0.009
of one per cent in 1986 to a high of 0.022 of one per cent in 1991. Hence the IRB
has to make extra effort in upgrading its investigation work in order to be effective
in combating non-compliance. Even if a tax administration is very effective in
registering taxpayers and detecting stop-filers or delinquent taxpayers, the
adminisfration's overall effectiveness will be low if auditing is not effective in
discouraging evasion. Silvani and Baer (1997) reasoned that the tax administration
is able to detect stop-filers and delinquent taxpayers through computerised or
76

mechanical means, while for detecting evasion or the under reporting of taxes,
auditing (intelligence and investigation) is required. For example, in Pem, in spite
of the fact that the tax administration's effectiveness has continued to increase,
whereby its tax collection has grown steadily as a percentage of GDP from 6.0 per
cent in 1990 to about 14.1 per cent of GDP in 1996, a plateau has been reached.
Further increases in collection will depend on the tax administration's ability to
focus its effort on audit. On the other hand, Denmark, which has a strong and
sophisticated audit program, has a compliance rate among the highest in the world
- reaching more than 95 per cent for the value added tax (VAT).̂
The main goal of auditing is to persuade taxpayers that evasion does not pay.
Silvani (1994) suggests that this can also be provided in an audit plan (pp. 274-
305). This can be achieved by the tax administration if it can show the taxpayer
that it has the information and the operational ability to punish taxpayers if they
evade taxes. Further, Silvani also recommends that the administration devise
enforcement programs whose chief purpose is to let the taxpayer know that the tax
administration has information on certain economic transactions such as imports,
leases, purchases, sales, and payments for professional services. This is to
demonstrate to a significant number of taxpayers, before they commit tax evasion,
that the tax administration processes data on their economic transactions. This
information will then be used to detect evasion. Audit rates are important and they
can be reinforced by additional, less costly interventions such as information
matching, public information, taxpayer assistance, and education (Brand, 1997,
pp. 413-419).
As found by Witte and Woodbury (1985), audit sfrategy is effective on small-
business owners, but only has a small effect on other groups of taxpayers such as
middle-income wage and salary workers. Hence audit strategy could be adopted
especially to recover tax evasion which involves cash transactions that can be
easily falsified (ABA 1989; Soos 1991).
Tanzi and Pellechio (1995) suggest that an audit plan should represent a sfrategy
to detect violations as efficiently as possible using the different types of audit with
the resources available to the tax administration. The plan should also specify how
many of the different types of audit should be conducted each year in each local
77

tax office, with the proportions varying based on the registration of new taxpayers,
business developments, and the results of previous audits. The plan should reflect
an analytic approach to increasing the probability of detection. Specific strategies
would likely vary from year to year.
1. Audit Selection
Although most empirical studies have focused on the probability of detection,
nevertheless improved understanding of the audit selection process is also
important in improving audit selection methods.
Among researchers who have explored this area are Erekson and Sullivan (1988),
Aim, Bahl and Murray (1993), and Erard and Feinstein (1996). Erekson and
Sullivan (1988) found that the audit selection mles followed by the IRS in the
low-income non-business classes appear to be quite different from the mles
followed for other classes.
Aim et al. (1993) conducted studies of tax audit programs obtaining tax retum
information for a random sample of Jamaican taxpayers. The sample consisted of
932 taxpayers for tax year 1980, none of whom was subjected to audit for that
year, and both tax retum information and audit results for an additional 148
taxpayers, each of whom was subjected to audit for one of the tax years 1980,
1981, or 1982. Aim et al. also estimated the stmctural econometric models of the
audit selection process and found that reports of capital income or a large tax
liabiUty are associated with a greater chance of audit in Jamaica.
Erard and Feinstein (1996) obtained information about Federal and Oregon state
tax retums and audits for several different audit classes for the tax year 1987.
Their data contain tax retum information for a stratified random sample of more
than 43,000 households, including information from Form 1040 and most
supplemental schedules. Approximately 6,500 of these households were placed in
a business audit class, while 2,000 were placed in a farm audit class. The data
include audit results for the approximately 4,500 households in the sample
subjected to a Federal audit and the approximately 3,000 households subjected to a
state audit. Erard and Feinstein report that several line items are important in
78

explaining audit selection in the non-business class that they analyse, but that few
line items are important in the business and farm classes they analyse.
Both studies of Aim et al. (1993), and Erard and Feinstein (1996) also concluded
that the tax agencies that they studied possess private information not recorded in
the available tax retum data, which plays an important role in audit selection.
In the United States, although some of the retums are selected manually for
investigation, most are chosen through a computer analysis on the basis of
"discriminant fiinction formulas" or DIF that generate a probability of recoverable
tax revenue (Morgan, 1990; Payne, 1993). For instance, a retum that included
claims for allowable deductions that were very high in relation to declared income
would generate a high DIF score.
Currently, the selection of cases for investigation and audit is done manually by
the IRB. It involves information obtained through local knowledge, press reports,
assessment branches, informers and the application of a means test. Some of the
investigation and audit strategies that have been introduced by the IRB are
discussed below.
A special intelligence and investigation unit has been set up in all branches of the
IRB to track down people who evade their taxes. In the selection of cases for
investigation, emphasis is placed on reports by informers and information gathered
through various sources including intelligence work performed by investigation
officers. Every IRB branch has its own investigation and intelHgence cenfre.
Investigation officers from all investigation and intelHgence centres throughout the
nation carry out prevention and detection activities. They deal in cases involving
back duty of more than RM 10,000. The back duty enquiry carried out is done
thoroughly, comprehensively and persistently. The cases that may require
investigation fall into four groups:
(a) Disclosure by the taxpayer himself
These may include cases of all degrees of gravity from an intimation of mere
error to a solemn confession of deliberate fraud. The nature of the disclosure
and the circumstances in which it is made may be factors to be taken into
79

account in determining the extent of investigation required and the basis of
settlement.
(b) Allegations by an informer
An informer's motive is seldom a pure one and his information and
allegations are usually vague and exaggerated. He or she cannot, however, be
ignored.
(c) Discovery from departmental sources
The majority of cases falls into this group and arises in the course of
examination of retums, accounts, or in the light of information received.
(d) General sources of information
Available to the Taxation Department are lists such as those of registrars of
companies, lists of payment made to contractors by Government Departments
and Armed Forces, lists of timber licences issued by the Forestry Department
and details of trade licences provided by Town Boards and Municipalities and
so forth.
2. Field audit
The IRB also has set up an extemal audit division in aligning its stmcture and
strategies along client segments that allows continuous leaming about its clients
and their behaviour especially among corporate and business taxpayers. Training
and guidance programs are held by expert and experienced investigation officers
and delivered to officers selected for the audit team. Apart from being given an
opportunity to examine the actual books and records at the taxpayers' premises
and of gaining a better understanding of how the various businesses are conducted,
audit activities are able to identify persons who do not disclose the tme incomes,
or, if carrying on a business are submitting retums that are not based on reliable
accounting books and records. The IRB introduced this program in 1991 to
overcome income tax non-compliance. Its main objective was to improve
compliance, as well as to encourage voluntary compliance. The main focus is
placed on company cases as well as individual cases in line with their
contributions to the total revenue collected in the system. Field audits are carried
out for cases involving less than RMl0,000.
80
3. Street Survey
Street surveys were introduced in 1995. They are mainly conducted to deal with
businessmen. Officers are required to randomly check the business accounts of
businessmen in a chosen area. They then provide a report on every business
premise they have visited to the income tax administration. These reports are
enclosed in the businesses respective income tax files and checked by income tax
officers for any understatement of income.
4.3.4.2 Sanctions
A good system of sanctions and penalties is an indispensable tool for enforcing
compliance. As part of the assessment of the tax administration, the effectiveness
of sanctions and penalty systems in encouraging taxpayers to voluntarily comply
with their tax obligations should be evaluated. As noted by Silvani and Baer
(1997), a guiding principle in the design of a good system of penalties and
sanctions should be to encourage taxpayers to settle their tax arrears quickly and to
discourage them from using legal challenges to delay the payment of taxes which
have been correctly assessed. In achieving these objectives, they argued that the
sanctions and penalties:
(a) should be levied promptly once a liability has been established;
(b) should not be excessive; and
(c) should, however, be higher than the prevailing market interest rates - the
prime or LIBOR rate plus a spread. This assumes that penalties are determined
on a percentage basis instead of being a fixed amount. In general, experience
has shown that it is preferable for penalties to be defined as a percentage of the
total outstanding amount of taxes in order to facilitate adjusting penalty rates
for inflation.
Conflicting evidence has been found by researchers regarding the importance of
different types of sanctions and interactions. Among them are Minor (1978, pp.
21-45), Tittle (1980), Grasmick and Scott (1982, pp. 213-220).
Minor (1978) and Titfle (1980) found no difference between legal sanctions and
interpersonal sanctions. On the other hand, Grasmick and Scott (1982) found that
interpersonal sanctions were more effective.
81
Another conflicting issue is the relationship between reported tax evasion and the
severity of sanctions. Spicer and Lundstedt (1976, pp. 295-305) Schwartz and
Orleans (1967, pp. 274-300), Witte and Woodbury (1985, pp. 1-14) are among the
researchers that have explored this area.
Spicer and Lundstedt (1976) in their survey in the United States found that there is
no significant relationship between reported evasion and sanctions. Conversely,
Schwartz and Orleans (1967) and Witte and Woodbury (1985) found that there is a
significant relationship between the severity of the sanctions and reported evasion
among high-income self-employed individuals. Schwartz and Orleans (1967)
examined the comparative effectiveness of the threat of legal sanctions and
appeals to conscience. They obtained tax compliance figures for three groups of
taxpayers namely a group threatened with legal sanctions, a group where appeal to
conscience was employed and a control group. All members of these groups were
interviewed about political and tax issues a month before they lodged their tax
retum. The questions that they were asked were themselves the experimental
manipulation. They stressed either sanctions or personal responsibiHty. The tax
records showed a mean change in income declaration of $181 in the "threat"
group, $804 in the conscience group and $87 in the control group. The sanctions
group also increased their claims for tax-deductible allowances, which suggests
that threats may actually increase tax avoidance or evasion. However, within each
group, the threat of legal sanctions were most effective for the upper class and the
better (but not the best) educated. Appeals to conscience had more effect on the
best and least educated employees. Schwartz and Orleans (1967) found marginally
significant (p<0.10) results for a moral approach over legal sanctions. Their results
are weakened argues by Hite (1997), because the dependent variables were the
averages of groups of taxpayers. Actual tax retum information was used, but
analysis based on the group mean does not allow for an examination of the
specific types of individuals who were and were not affected by moral strategies.
Nonetheless, some support was provided for encouraging moral ploys.
Consistent with Schwartz and Orieans's findings, Grasmick and Scott (1982)
conducted a survey in which they found that the threat of guilty feelings (which
they equated with Schwartz and Orleans's appeal to conscience) was a greater
82

deterrent to tax evasion than threats of stigma or legal sanctions. They concluded
that the most effective strategy to deter non-compHance would be a policy that
increased the public's sense of moral duty to comply. They cautioned, however,
that a mass moral appeal could have a negative impact because it would
inadvertently inform others that cheating is a viable altemative. Their reasoning
was based on the resuHs of a classroom experiment conducted by Titfle and Rowe
(1973) who found that cheating increased after a moral plea to comply was given
by the teachers. Only five of the 107 subjects refrained from cheating. This
suggests that some other message must have inadvertently been sent which
encourage or approved cheating. Grasmick and Scott (1982, pp. 213-220), citing
the Tittle and Rowe study, concluded that the statistical inference from their study
on the effectiveness of appeals to conscience may not hold in practice because the
norm moved towards tax evasion rather than towards tax compliance.
Strumpel (1969) and Schmolders (1970) forewamed that taxpayer willingness to
comply can be jeopardised by enforcement systems that are too strict. Moreover,
the American Bar Association Commission on Taxpayer Compliance (ABA 1987)
noted that even if enforcement programs were maximised, the IRS would collect
only one-third of the individual tax gap through enforcement programs. Similarly,
Pyle (1991, pp. 163-198) argued that an important role was played by sanctions
and penalties in creating incentives for individuals to engage or not to engage in
tax evasion. According to him, research shows that lower penalties which are
applied more consistently are more effective in deterring evasion than high
penalties applied fairly infrequently.
Silvani and Baer (1997) suggest that in ensuring that the sanctions and penalty
system is effective, sanctions and penalties should be easily applied by tax
administrators to non-complying taxpayers. To achieve this, penalties should be
relatively mild, since the application of lesser penalties does not require, as a mle,
a lengthy administrative and judicial process. The sanctions and penalties should
be designed to change the behaviour of the average taxpayer, which requires that
sanctions be applied to the largest possible number of non-complying taxpayers.
This is particularly relevant for countries with high levels of non-compliance (this
would refer to countries with a tax gap of over 20 per cent).
83

4.3.4.3 Preparer penalties
Over 40 per cent of all individual taxpayers use professional preparers in the U.S.
(Department of the Treasury, 1985, p. 85) and even greater proportion of complex
retiims are filed by these tax preparers (Jackson and Milliron, 1986, pp. 125-165).
Among these preparers, a significant proportion are qualified to represent clients
before the Intemal Revenue Service. The American Bar Association Commission
on Taxpayer CompHance refers to these individuals as tax practitioners. Like
preparers, practitioners can prepare and sign retums, but the term is used to
distinguish them from preparers who cannot represent clients during Intemal
Revenue Service audits and other enforcement actions.
Although the availability of tax practitioners undoubtedly reduces many of the
informational and computational barriers to tax compliance, they also possess the
means to exert an extraordinary influence on the tax compliance process. Their
knowledge of tax mles, enforcement procedures and also expertise enables them
to assist their clients in exploiting opportunities for tax non-compliance. The
United States Treasury Department believes that erosion of practitioners'
perceptions of their reporting responsibilities has substantially contributed to
taxpayer non-compHance (U.S. Department of Treasury 1986). ReaHsing that tax
retum preparers play an important role in taxpayer non-compliance, the Congress
has enacted various sanctions aimed at tax preparers. The two most commonly
cited preparer penalties are: I.R.C. §6694, the understatement of taxpayers'
liability; and I.R.C. §6695, other penalties with respect to the preparation of tax
retums (Reckers, Sanders and Wyndelts, 1994, pp. 14-20). Both of these penalties
apply to an income tax retum preparer, who is defined in the I.R.C. as a person
who prepares any tax retum for compensation (I.R.C. §7701(a)(36)). By
definition, these two penalties do not apply to practitioners who merely give tax
advice on contemplated actions and who do not prepare any portion of the retum
or its supporting statements (Tres. Reg. §301.7701 - 15(a)(2)). However, the
penalty for aiding and abetting understatement of tax liabiHties, I.R.C. §6701,
applies to any persons:
1) who aid, assist, procure or advise with respect to the preparation or
presentation of a retum;
84

2) who know that the information will be used in any material matter arising
under the tax laws; and
3) who know that an understatement of tax Hability will result (I.R.C. §6701 (a)).
As noted by Shapiro (1986), this penalty can be levied on tax practitioners,
however, proving that a practitioner has met all three requirements would be
difficult for the IRS.
Previous researchers like Schnee, Bindon and Ellis (1987, pp. 21-30), Jackson,
Milliron and Toy (1988, pp. 333-341), and Milliron and Toy, (1988, pp. 84-104)
have found that preparer penalties may not be effective in altering practitioners'
behaviour. These findings are based solely on opinions or beliefs elicited from tax
practitioners. Jackson et al. (1988) found that while practitioners considered
preparer penalties to be very serious, they believed that penalties were only
moderately effective. Similarly, Milliron and Toy (1988) found that CPAs were
overwhelmingly negative about preparer penalties and their effectiveness. They
reasoned that this could be due to the practitioners' attitudes toward penalties and
their self-interest in this area. The survey respondents of Schnee et al. (CPA tax
practitioners) likewise indicated that they would make only slight concessions in
their practice because of recent increase in preparer penalties. In contrast,
Milliron's (1988) interviews of "Big Eighf tax managers and partners concluded
that preparer penalties were one of the important or essential factors influencing
tax retum preparation decisions.
Reckers, Sanders and Wyndelts (1994, pp. 14-20) argued that characteristics of the
client may also influence the judgements and decisions of tax professionals. They
have classified two major services that tax practitioners provide - tax advice
(classified as judgements) and signing tax retums (classified as choices).
Consequently, they have proven that preparer penalties were effective in reducing
CPAs' aggressiveness in signing retums but failed to influence the aggressiveness
of CPAs in giving advice to a client. In their research, Reckers et al. (1994)
defined the importance of the client as value in terms of revenue generating
potential for the professional and his or her accounting firm.
85

As found in the audit literature, it is argued that clients generating large revenues
become more economically important to an accounting practice, and client
financial leverage (auditor financial dependency) may influence auditors'
judgements (SEC 1979). McGill's findings (1988) suggest that CPAs consider a
client's importance in limited situations. The preferences of more important clients
in selected circumstances have a larger influence on tax professionals' judgements
than the preferences of less important clients. As reasoned by Reckers et al. failure
to consider client importance and failure to distinguish between advice
(judgements) and signing tax retums (choices) may explain some of the mixed
results previously found regarding the influence of client aggressiveness. As
Einhom and Hogarth (1981) and Slovic, Fischhoff and Lichtenstein (1982, pp. 21-
36) found, judgments and decision choices may not be consistent. A judgement is
an evaluation of a situation, whereas choice is a selection of an action from two or
more options. Judgements may aid in making choices among alternatives, yet they
are not necessary or sufficient for choices. In fact, at the time a choice is made,
judgement may very well be ignored. As suggest by Einhom and Hogarth (1981),
a choice can be made that is contrary to one's better judgement.
Further, in a study of audit partners, Schultz and Reckers (1981) found that
subjects' responses varied significantly between conditions in which they were
asked to render financial reporting "advice" to a fellow partner versus conditions
in which they were cast as the engagement partner "signing off on the audit
opinion. Further, the potential influences of preparer penalties and cHent
importance may interact. As argued by Graetz and Wilde (1985), from a cost-
benefit perspective, sanctions against certain behaviour can be expected to be
effective deterrents when the "cost" of sanctions are greater than the
"compensation" received for unacceptable behaviour. Therefore, for tax retum
preparer penalties to be effective Reckers et al. (1994) suggest that the "cosf of
the penalties must be perceived to be greater than the "compensation" for
minimising a client's tax liability. Thus as the importance of the client increases,
the "compensation" from the client also increases. Hence, from a cost-benefit
perspective, client importance may progressively mitigate the effectiveness of
preparer penalties. They also believed that there is a difference between advice
decisions and signing decisions. To advise only and not to prepare or sign the
86

retum may be perceived by tax preparers as involving less risk and responsibility
compared with signing the retums. They concluded that increased penalties may
prove to be effective in improving compliance provided that the sanctions are not
idle threats. The sanctions can be idle threats either because the "cost" of the
sanction is small or because of the enforcement that is necessary to deter
practitioners' aggressive tax behaviour. They also suggest that for sanctions to be
effective deterrents, tax practitioners must be aware of their existence. Another
plausible explanation for the differences in the effectiveness of penalties in their
study could be due to tax professionals being less aware of the penalties applicable
to tax advice (I.R.C. §6701 as discussed earlier) and more aware of tax retum
preparation penalties as the researchers suggest.
One of the factors that contributes to an increase in the usage of tax preparers by
taxpayers is the complexity of the tax system.
4.3.5 Simplifying the tax system
Silvani and Baer (1997) stress that the tax administration should be simple from
the taxpayer's point of view, keeping annual retums and procedures as simple as
possible to encourage compliance. Long (1988) reports that there is a very strong
association between the complexity of reporting requirements and errors detected
by audit. Slemrod (1989) confirms this in his review of complexity, compliance
costs and tax evasion. Thus there is a general belief that simplifying the tax code
and reducing its complexity would increase compliance.
In helping to simpHfy tax administration, the information required on the tax
forms should be kept to a minimum and be readily available from the taxpayers'
books and records. Denmark, Canada, and New Zealand are among the many
countries that have introduced simplified tax retum forms in order to faciHtate
their use by taxpayers. Silvani and Baer (1997) also noted that simplifying the tax
system leads to a reduction in taxpayers' costs in compl)dng with their tax
obligations. Compliance costs, like administrative costs, can be reduced by such
measures as imposing a single rate (in the case of the VAT), defining a reasonable
registration threshold and reducing exemptions. Exemptions increase bookkeeping
requirements and raise the cost of compliance. In some cases, compliance costs
87

can be reduced through final withholding on transactions like payment of interest,
dividends, and salary bonuses as discussed earlier.
Simplifying the Tax System is also important to faciHtate tax administration and
reduce costs. This could enhance the effectiveness and efficiency of the tax
administration (Bird and Casanegra de Jantscher, 1992; Bird, 1990; Mansfield
1987; Tanzi, 1981; Tait, Graetz, Eichengreen 1979). According to Silvani and
Baer (1997), a tax system with few taxes, a limited number of rates for each tax,
limited exemptions, and a broad base has proven, in the context of many
developing countries, to be much easier to administer and to result in higher
compliance levels than a complex system.̂
In achieving a better compliance rate and improving the effectiveness and
efficiency of the tax administration, the taxation authority also should tackle some
of its weaknesses regarding laws, regulations and administration.
Cutting out tax loopholes
Cutting out tax loopholes is necessary especially in business taxation to allow fair
competition to take place. Ambiguity in the Income Tax Legislation may promote
certain group of taxpayers especially those who are expert in this field like tax
practitioners, to exploit these loopholes to their advantage.
A code of conduct approved by the Council of Economic and Finance Ministers of
the European Union (EU), or ecofin, on Business Taxation (Primarolo, 1999, pp.
24, 25) covers laws, regulations and adminisfrative practices that take in "the
nominal tax rate, the tax base or any other relevant factor" as stated in its
resolution whose object was to tackle harmfiil tax competition within the EU. This
was necessary in order to combat distortions of the single market and prevent
excessive tax losses as well as to encourage the evolution of taxation in an
employment-fiiendly way. The code outlines five issues to be addressed in
determining whether measures are harmfiil:
• whether advantages are given only to non-residents, or for offshore transactions;
• whether advantages are ring fenced from the domestic market;

• whether advantages are given without any real economic activity and substantial
economic presence within the member state;
• whether the mles for measuring profit within a multinational group depart
substantially from internationally accepted principles; and
• whether measures lack transparency.
As quoted by Britain's Paymaster General, Primarolo,
Tackling unfair tax practices is an important part of creating a single market in Europe. Of course comparisons are frequently complex, not least because of the different ways in which tax concessions can be made, but I am hopeful that our work will help to set a fi-amework in the EU in which fair competition can take place. (1999, p. 25)
Some tax avoidance occurs because of defects in the wording of specific
provisions. Other forms of avoidance occur because of more fiindamental
weaknesses in the tax system or in how it is administered. Some of loopholes that
are found in the Malaysian Income Tax Legislation as explored by Wallschutzky
and Singh (1995) are discussed below.
(a) Opportunities to split income with others
Income splitting has advantages if it is possible to transfer income to others
who pay less tax. This is especially important under a progressive rate
stmcture where high-income eamers transfer income to lower income eamers.
Hence the greater the progression and/or the greater the disparity in income
levels between transferor and transferee, the greater the advantage. For
example, it is possible for any savings by the husband and wife to be invested
in the name of the spouse with the lowest income.
(b) Opportunities to convert potentially taxable receipts into non-taxable receipts
Under Malaysian Income Tax Law, a non-resident taxpayer is subject to tax in
respect to income accming, arising, or derived from Malaysia. Hence if a non
resident has offshore income, it is free from Malaysian income tax if it is
brought into Malaysia. As for resident taxpayers, their offshore income is
taxable if and only if it is being remitted into Malaysia. Thus, a resident
taxpayer can enjoy his offshore income by not remitting it into Malaysia.
89
(c) Exemptions from the tax base
Notable exemptions from the tax base include:
• capital gains (except for gains on disposable of real property);
• donations received by approved charitable institutions;
• pensions upon retiring from employment;
• income of an approved pension/provident fund;
• scholarships;
• retirement gratuities, compensation for loss of employment and restrictive
covenants;
• business profits enjoying tax incentives such as pioneer status and
investment tax allowance;
• royalties up to RM20,000 per annum received from academic and literary
works;
• certain types of interest income such as interest on government bonds and
savings interest;
• benefit of employee's leave passage; and
• employee's medical and dental benefits.
Malaysian taxpayers have the opportunity of swapping some of their taxable
income for non-taxable income, making their effective rate much lower, hence
paying less taxes. In addition, there are some benefits-in-kind income that are
granted by employers to their employees that are not included in the employees'
pay-slips as the employers are not certain of the valuation of such benefits. This
may be due to lack of guidelines and lack of effective monitoring by the taxation
office, giving the impression that it is not important to report this income. As
suggest by Wallschutzky and Singh (1995), a fiinge benefit tax may need to be
considered by the IRB for this type of income.
4.4 Summary
A good tax system should be efficient, should not distort economic decision
making and should not have excessive compliance cost. It also should be effective
in enforcing compliance and being able to deal with non-compliance. The primary
role of the taxation office is to collect income taxes through facilitating voluntary
compliance. Hence understanding taxpayers' attitudes, behaviour and their
90

perceptions towards income tax is particularly important so that effective
sfrategies can be channelled to respective groups of taxpayers. Some of the
extemal stimuli that can affect taxpayers' behaviour are social influences such as
peer group attitudes, taxpayers' personal experience of the taxation authority and
information regarding taxation. Hence tackling these sources may improve
compliance decisions.
In combating income tax non-compliance, the taxation authority should search for
suitable strategies. It should study whether non-compliance is due to the failure of
its current system in regard to enforcement, complexity of income tax laws,
loopholes in the income tax legislation or lack of mass media coverage. Tax
enforcement is a behavioural problem hence its success depends on group
cooperation. Intermediaries can ease compliance for taxpayers by withholding and
remitting their taxes and the taxation authority should be able to cut out tax
loopholes to prevent any harmfiil tax competition especially in business taxation.
It should be pro-active in disseminating tax information to the public so that they
understand the tax laws and comply voluntarily.
Another possible cause of non-compliance originates from taxpayers; for example
their attitudes, financial constraints or being influenced by someone else such as
tax preparers or peer groups. When all of these factors are known, it will be much
easier to target groups of taxpayers and apply appropriate strategy or strategies to
make them comply at the'same time as enhancing voluntary compliance. In
adopting strategies, the IRB can examine strategies that have been applied
successfiilly to overcome this problem in advanced countries.
hicome tax administrative enforcement discussed in this chapter examines five of
the main approaches in combating non-compliance besides enhancing voluntary
compliance. They are as follows:
I)Strategies to assist in changing attitudes. Several researchers have
explored this area and suggest that the taxation authority could adopt
marketeers' sfrategies by reinforcing positive attitudes such as
introducing an acknowledgment or reward system and giving feedback
to taxpayers regarding the use of revenue collected by the government.
This could be done by developing an ongoing helpful relationship
91
between taxpayers and income tax staff in addition to publicising the
uses of the tax revenue collected to provide extra ranges of goods and
services to taxpayers.
2) Positive approaches. Several researchers have found that taxpayers are
more likely to be more resentfiil if extensive enforcement is used, hence
positive approaches are being recommended. Two main sfrategies have
been discussed in this chapter. They are the service approach and
education programs. The service approach is implemented by providing
quality service to taxpayers and giving direct information to them,
taking notes on any suggestions or objections in upgrading the current
service. Providing an easy method of payment of income tax is an
example of providing good service to taxpayers. According to Mahfar
(1994), public education programs are effective if they are focused on
population groups in which compliance rates are low. However,
according to Witte and Woodbury (1985) this method is not as effective
as a deterrent method with small business owners or cash transaction
evaders. Mason (1987) found that the communication variables are
related to sanctions, hence the taxation authority could place more stress
on sanctions and on the consequences of not complying with its
legislation through the mass media, newsletters, and income tax leaflets.
3) Withholding of taxes. One example is PAYE, when employers act as
withholding agents for personal income tax on eamings of their
employees. Information reporting however, involves payers providing
information to the taxation office either by withholding/without
withholding the tax at the source for income like interests and dividends.
However, some researchers argued that this method is not totally
effective because some taxpayers (payees) might collude with their
employers or payers. Hence, they also recommend deterrent methods
such as punishment or sanctions.
4)Detection and punishment. Three methods were discussed in this
chapter: audits, sanctions and preparer penalties. Most researchers have
found that the probability of audit is highly significant in combating
non-compliance especially among non-wage eamers. Witte and
Woodbury (1985) concluded that this method is not as effective with
92

salary/wage eamers as it is with small business owners. It is very
important for the taxation authority to be very efficient and effective in
detecting income tax evaders. It can detect them through an analysis of
annual tax retums either manually or chosen on the basis of
"discriminant fiinction formulas" or DIF as used by the IRS. While most
studies revealed that a good sanction system should be levied promptly,
not be excessive, be applied consistently, and be higher than market
interest rates. As for preparers penalties, most researchers found that
preparer penalties may not be effective in altering practitioners'
behaviour because of their self-interest in this area. However, Reckers et
al. (1994) argue that the clients' importance and the difference between
advice decisions and signing decisions are important in determining the
effectiveness of this strategy. They suggest that the "cost" of the
penalties must be perceived to be greater than the "compensation" for
minimising a client's tax liability and that these tax practitioners must be
aware of the existence of the sanctions.
5) Simplifying the tax system. Several researchers reported that simplifying
the tax code and reducing its complexity would reduce the costs of
compliance and hence increase the level of income tax compliance.
Reducing reporting requirements also results in the detection of fewer
errors during audit, hence the administrative costs of compliance are
decreased. Thus simplifying the tax system benefits both taxpayers and
the taxation office.
93

CHAPTER FIVE
Taxation System in Australia
5.1 Introduction This chapter focuses on the AustraHan Taxation Office (ATO) as a role model of
tax collecting agent outside Malaysia. It is divided into five sections. Section Two
introduces the ATO, its core business mission and the various challenges it needs
to overcome, particularly that of gaining community support.
Section Three explores the nature of the individual taxpayers registered with the
ATO which can be categorised into three groups: clients categorised as individual
non-business (INB) who form the majority of individual taxpayers; large
businesses and intemationals (LB&I) business Hne; and small business income
(SBI).
Section Four explains some policies adopted by the ATO to enhance voluntary
compliance, and to strive for productivity and efficiency, which are designed to
improve the relationship between the community and the ATO. It also discusses
some preventive actions undertaken by ATO in combating non-compHance in
Australia.
Section Five describes the most recent proposal made by the Taxation Institute of
Australia (TIA) for the establishment of two boards to provide a channel for
consultation on major policy and to oversee the Australian Taxation Office.
Section Six summarises various strategies being undertaken by the ATO to
achieve its core business mission, to face various challenges besides overcoming
income tax non-compliance in Australia and the recent proposal made by TIA to
ensure that the tax system is responsive to the changing business and tax
environment.
94

5.2 The Australian Taxation Office
The Australian Taxation Office or ATO is the office that is responsible for the
collection of income tax in Australia. Its head office is located in Canberra, with
branch and regional offices in various states. Its operations are supervised by the
Commissioner of Taxation.
The core business mission of tax administration in Australia is always focused
around the following three statements (ATO, 1997a, pp. 1-20):
• to collect the revenue, properly payable, so as to fimd services and support
for the people of Australia;
• to assist the payment of child support between payers and payees for the
benefit of children, whether by Child Support Agency (CSA) collection or
support for self administration; and
• to support the provision of retirement income for the people of Australia.
The above mission statements demonstrate that the ATO holds a particular 'niche'
in the community and AustraHa's system of government. This 'niche' can be
described as its collective insight into the whole system and its concern to
safeguard the interests of the whole community. In accentuating this latter point,
safeguarding of the interests of the whole community should be confrasted with
the particular client interest that are held by taxpayers, their representatives or
client groups. Thus the challenge for the ATO is to achieve:
• increased compliance;
• reduced compliance costs;
• community confidence; and
• an efficient and adaptive organisation.
Community support
In particular the challenge to gain community support has resutted in a much more
open and accountable administration. The need for this support has led to
innovations such as fomms for Haison with tax professionals and representative
groups and active participation through the media. The ATO is moving cautiously
to provide analysis and commentary on the operation of the Taxation system to
95

increase community understanding about its own system (ATO, 1997a, pp. 1-20).
It has developed a consultation with the community about the rights and
obligations of the community. Standards of service and accessible complaints
mechanisms are also created through these charters. Access to a well fiinctioning
complaints mechanism turns a burden into an opportunity for change and
improvement. The most significant steps in building a sfrong relationship with the
community are the creation of a Taxpayers' Charter and a Child Support Charter.
5.3 Individual Taxpayers in Australia
In 1996-97, 9.9 milHon individual taxpayers lodged retums, representing 54 per
cent of the total population of AustraHa (ATO 1998). Individual's incomes are
derived from a wide variety of sources. The most common sources are salary and
wages. In 1996-97, the majority (78 per cent) of individuals received income from
salary and wages. This income accounted for 74 per cent of all individuals'
income. While a large proportion of the population had interest income (58 per
cent), this represented only 3 per cent of total income.
Individual taxpayers may be clients of the individual non-business (INB), small
business income (SBI) or of the large business and intemational (LB&I) business
line. INB clients are those taxpayers who receive most of their income from salary
and wages, Australian government pensions and benefits, or investments, and who
do not have any business income or deductions. As for business income, if gross
income is equal to or greater than $10 million, then the individual is a client of the
LB&I business line. However, if gross business income is less than $10 milHon,
then the individual is a client of the SBI business line. The majority of individual
taxpayers registered with the ATO are clients of the INB business line which
accounts for 74 per cent (ATO, 1998).
Taxpayers are concentrated in the 30-49 year age group, in terms of total number
of people, income received and net tax paid. This age group forms 44 per cent of
the total taxpayer population. Males are over represented in the taxpayer
population (54 per cent) when compared with the total population (50 per cent).
This reflects the levels of participation in the labour force by men and women in
Australia.
96

Hiterestingly, the level of income also varies widely according to geographic
location. People of similar incomes tend to live in the same general areas. In 1996-
97, the area with the highest average taxable income was postcode 2027 in Sydney
(ATO, 1998).
5.4 Some Policies Adopted by the ATO
The ATO adopted some policies to improve its efficiency and relationship with its
cHents.
5.4.1 Self-assessment and fringe benefits tax (FBT)
The ATO has the policy of encouraging and facilitating voluntary compliance,
thus it adopted self-assessment in 1986. The ATO also has introduced fiill self-
assessment for companies in 1990 (ATO, 1991).
Self-assessment is defined by Marshall, Smith and Armstrong as "the
administration of the tax regime where the assessment of a taxpayer's tax liability
is based largely on information provided voluntarily by the taxpayer" (1997, pp. 9-
15). It has moved to a system of self-assessment so that the tax retums of most
taxpayers are not subject to technical scrutiny before assessment. Instead,
taxpayers calculate their own taxable income but do not enclose payment with
their tax retum. In fact, the way the system works, most taxpayers receive a
refiind, but if they are due to pay more they are billed by the ATO and given a
month to pay. Hence the administrative emphasis has shifted to post assessment
checking, including audit activity.
The philosophy underlying the move to self-assessment by the ATO was that the
traditional approach to processing income tax retums (i.e. a scmtiny of every
retum to check for technical and mathematical accuracy, calculation of tax
payable, etc.) was perceived to be an ineffective and inefficient method of
ensuring compliance with tax law. This new tax regime is predicated on a fair,
honest and voluntary reporting of tax liability. It imposes on taxpayers an
obligation to maintain appropriate records and to exercise reasonable care in
reporting matters affecting tax liability. The essence of the "self-assessmenf of
tax administration is the explicit shift from the revenue authority to taxpayers of
97

the assessment stage in revenue collection for much of the information upon which
the assessment is based is collected, sorted, categorised and presented by
taxpayers (Cooper, 1995, pp. 99-124). This in tum permitted the redeployment of
the resources of the revenue authority into the post-assessment audit of the
veracity and accuracy of taxpayers' assessments and was undertaken because of
the findings that aHocating the assessment of tax stage to the revenue authorities
was not cost-effective.
Under self-assessment principles, uncertainties arise in establishing appropriate
facts, and the proper evaluation of authority in support of tax reporting positions
assumes fiindamental importance. As a result, more taxpayers, in an era of
increased enforcement penalties, are tuming to tax professionals for assistance
(Mazur and Nagin, 1987; Collins, Milliron and Toy, 1990). In 1992,
approximately 72 per cent of taxpayers in Australia sought professional assistance
to prepare retums, especially those with the most complex tax situations (Marshall
et al, 1997, pp. 9-15). This compares with only 20 per cent in 1980 when the old
regime still prevailed.
Fringe Benefits Tax (FBT) is specifically levied on non-cash employment benefits
provided by employers to their employees. This income is often omitted, or not
fully taxed due to the difficuUies faced by the employers in evaluating "the value"
of benefits given to their employees. Prior to 1 July 1986, in Australia, such
benefits were to be included in employees' assessable income (Wallschutzky,
1993). As a result, more and more employers and employees took advantage in
their salary packaging of these deficiencies, to minimise tax liability. This led to
an unfair share of the income tax burden being taken by those who did not or
could not take advantage of such salary packaging. Instead it was decided to
introduce a tax on employers in respect of the fiinge benefits provided to
employees or to their associates. The impetus behind the Australian fringe benefits
tax was the increasing trend towards non-cash fringe benefits becoming a greater
part of employee compensation packages (Kreiser, Butcher and Jowitt, 1997, pp.
77-84).
98
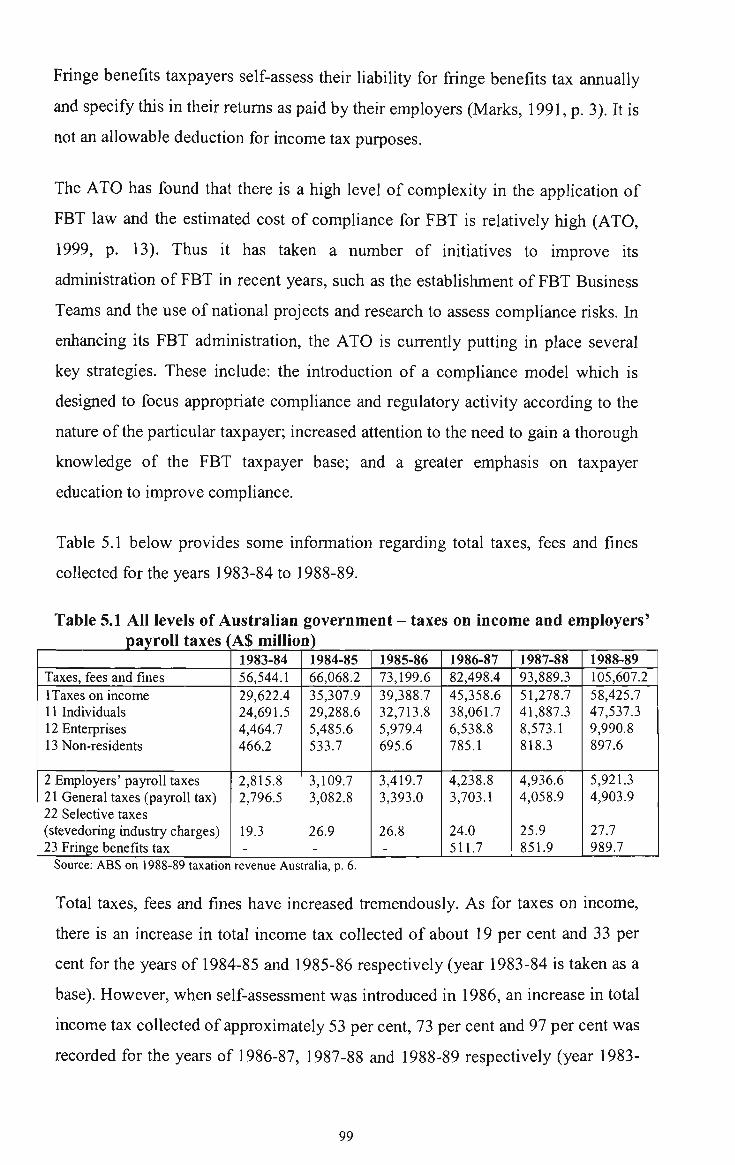
Fringe benefits taxpayers self-assess their liability for fringe benefits tax annually
and specify this in their rettims as paid by their employers (Marks, 1991, p. 3). It is
not an allowable deduction for income tax purposes.
The ATO has found that there is a high level of complexity in the application of
FBT law and the estimated cost of compliance for FBT is relatively high (ATO,
1999, p. 13). Thus it has taken a number of initiatives to improve its
administration of FBT in recent years, such as the estabHshment of FBT Business
Teams and the use of national projects and research to assess compliance risks. In
enhancing its FBT administration, the ATO is currently putting in place several
key strategies. These include: the introduction of a compliance model which is
designed to focus appropriate compliance and regulatory activity according to the
nature of the particular taxpayer; increased attention to the need to gain a thorough
knowledge of the FBT taxpayer base; and a greater emphasis on taxpayer
education to improve compliance.
Table 5.1 below provides some information regarding total taxes, fees and fines
collected for the years 1983-84 to 1988-89.
Table 5.1 All levels of Australian government - taxes on income and employers' payroll taxes (A$ million)
Taxes, fees and fines 1 Taxes on income 11 Individuals 12 Enterprises 13 Non-residents
2 Employers' payroll taxes 21 General taxes (payroll tax) 22 Selective taxes (stevedoring industry charges) 23 Fringe benefits tax
1983-84 56,544.1 29,622.4 24,691.5 4,464.7 466.2
2,815.8 2,796.5
19.3 -
1984-85 66,068.2 35,307.9 29,288.6 5,485.6 533.7
3,109.7 3,082.8
26.9 -
1985-86 73,199.6 39,388.7 32,713.8 5,979.4 695.6
3,419.7 3,393.0
26.8 -
1986-87 82,498.4 45,358.6 38,061.7 6,538.8 785.1
4,238.8 3,703.1
24.0 511.7
1987-88 93,889.3 51,278.7 41,887.3 8,573.1 818.3
4,936.6 4,058.9
25.9 851.9
1988-89 105,607.2 58,425.7 47,537.3 9,990.8 897.6
5,921.3 4,903.9
27.7 989.7
Source: ABS on 1988-89 taxation revenue Australia, p. 6.
Total taxes, fees and fines have increased tremendously. As for taxes on income,
there is an increase in total income tax collected of about 19 per cent and 33 per
cent for the years of 1984-85 and 1985-86 respectively (year 1983-84 is taken as a
base). However, when self-assessment was introduced in 1986, an increase in total
income tax collected of approximately 53 per cent, 73 per cent and 97 per cent was
recorded for the years of 1986-87, 1987-88 and 1988-89 respectively (year 1983-
99

84 is taken as a base). Thus the percentages of total taxes on income have
increased fremendously since the introduction of self-assessment.
As for the introduction of FBT, the employers' payroll taxes increased about 10
per cent and 21 per cent for the years of 1984-85 and 1985-86 respectively (year
1983-84 is taken as a base). However, with FBT's introduction in 1986, the
employers' payroll taxes increased tremendously at approximately 51 per cent, 75
per cent and more than 100 per cent for the years of 1986-87, 1987-88 and 1988-
89 respectively with 1983-84 is taken as a base. Thus it can be concluded that the
infroduction of self-assessment and FBT increased the collection of income taxes
and employers' payroll taxes compared with those years before these strategies
were introduced.
Revenue raised by FBT has steadily risen since its introduction in 1986. For
example in 1986-87, the ATO reported revenue collections of $52.9 bilHon (cash
basis), and FBT revenue in this period was $535 million (cash basis) representing
only 1 per cent of the ATO's revenue collections. However, in 1997-98, the ATO
coHected tax revenue of $110.3 bifiion (accmal basis) with FBT revenue in this
period of $3.3 billion (accmal basis), representing some 3 per cent of total ATO
tax revenue collected (ATO, 1999, p. 23). Thus FBT has succeeded in raising
revenue collection in Australia. The ATO also noted that tax agents play an
important role in FBT, as they have significant coverage of the taxpayer
population and therefore play a key role in ensuring tax compliance. For example,
in the 1998-99 financial year, 76 per cent of FBT taxpayers lodged their retums
through tax agents, accounting for 47 per cent of the revenue collected. Twenty-
one tax agents prepared retums relating to 58 per cent of the revenue lodged by tax
agents (ATO, 1999, p. 37).
5.4.2 Prescribed payment system (PPS) and pay-as-you-earn (PAYE) system
In many tax systems it is common for tax to be deducted at source for wages and
salary, though it is not common in respect of other types of income. However, in
Australia, certain classes of income are subject to withholding tax arrangements
including income derived by contractors operating in particular industries such as
building, transport and cleaning (the Prescribed Payment System). The PPS was
introduced in 1983 to check evasion in contract and sub-confract work, especially
100

in the building and constmction industry (Sandford, 1992, pp. 22-32). Tax is
required to be deducted from intra-industry payments, irrespective of whether the
payee is an individual, partnership or company. While salary and wages have tax
withheld by employers under the pay-as-you-eam (PAYE) systems (Nolan, 1993,
pp. 69-72). Income from which tax is withheld is subject to information reporting
by payers so that payments can be matched against amounts disclosed in retums.
The main source of revenue for the ATO has come from PAYE tax for the past ten
years. Hi the 1997-98 financial year, it collected $66.2 billion (ATO, 1998, p. 11)
from this source.
Table 5.2 Tax collected by the Prescribed Payments System Year 1983-84 1984-85 1985-86 1986-87 1987-88 1988-89 1989-90 1990-91
No. of payees 289,091 311,405 318,185 357,220 457,830 580,123 747,000 631,000
A$ million 251" 412 515 765 958 1308 1734 1358
Percent of total tax collected 0.7 1.0 1.1 1.5 1.6 1.9 2.3 1.8
^This sum is for a part year (17/24). Source: Commissioner of Taxation Annua! Report, 1983-84 to 1990-91.
Table 5.2 above shows the total amount of tax collected by the PPS for the period
of 1983-84 to 1990-91 in Australia. The industries covered were those where
compliance had been low. Based on the number of payees who registered and the
amount of tax collected, the system has been highly successfiil. This system
identified sonje 30,000 taxpayers who had not previously been lodging retums
(Wallschutzky, 1993, pp. 129-151).
5.4.3 Tax fde number (TFN)
Tax systems are not successful unless taxpayers can be identified. Identification
systems often allocate unique numbers to taxpayers who are then required to use
these numbers when lodging retums or participating in transactions involving
income. Payees were required to quote their tax file number. Non-lodgers
generally did not have a file number and could not quote file numbers. They had
the option of obtaining file numbers (and subsequently lodging rettmis) or having
tax deductions at a higher rate. There has been a greater incentive for taxpayers in
Ausfralia, since 1989, to obtain and quote their tax file numbers. Table 5.3 below
101

shows the range of circumstances where taxpayers are rewarded for having and
quoting tax file numbers.
Table 5.3 Consequence of i
Recipient of a Prescribed Payment (from 1/7/89) Employees (from 1/1/90)
Unemployment and sickness beneficiaries (from 8/1/90) Age and invalid pension (from 1/1/91)
Investors' interest-bearing accounts'' (from 1 /7/91) unfranked dividends
^ailure to quote a tax file number Tax file number Tax deducted at 20%
Tax deducted at varying marginal rates ranging from 20% to approximate 48.25% when 'salary or wages' reaches approximate A$700 per week
Entitled to benefits
Entitled to benefits
No tax deducted
No tax deducted
No tax file number Tax deducted at 48.25%'
Tax deducted on all 'salary or wages' at 48.25%o'
Not entitled to benefits
May not be entitled to benefits
Tax deducted at 48.25%'
Tax deducted at 48.25%"
Notes: ^ Or at prevailing maximum marginal rate (including Medicare levy). ** Subject to a de minimis rule, set initially at interest of A$120 per aimum. Source: Wallschutzky 1993, p. 138.
hi July 1991, the ATO introduced Stage 2 of the Tax File Number (TFN) system.
The expanded use of a unique tax file number for each taxpayer may serve the
purpose of combating tax evasion (Sandford, 1992, pp. 22-32). Taxpayers who do
not quote their TFN to their bank have tax withheld from the interest they eam.
Thus, it encourages taxpayers to disclose their interest income in their annual
retums.
5.4.4 Technology
The ATO is also continuing to strive for productivity, efficiency and service gains
through the use of technology and better work practices. It has adopted the
Electronic Lodgement Service (ELS) that has improved retums tumaround by
nearly half of the individual cHents and has enabled a reduction of staff in the
ATO by approximately 700 (ATO, 1991).
102

The ATO also has introduced Centralised Automated Document Dispatch from
two sites instead of sixteen locations (previously), which has enabled it to double
the throughput of individual assessments at peak times.
5.4.4.1 The electronic lodgement service
The Electronic Lodgement Service was implemented nationally in Australia in
1990. By 1991/92 over half of all individual tax retums were submitted
elecfronically (Commissioner of Taxation, 1992, p. 6) and by 1992/93 the figure
was almost 60 per cent (James, 1997, pp. 205-226). Hi 1996-97, 71 per cent of tax
retums were lodged through the electronic lodgment service (ATO, 1998). It was
found that the cost of processing an electronically filed retum was much less
compared with that of a paper retum. The electronic retum only cost three cents,
whereas the costs of a paper retum was 72.5 cents (CCH, 1988). It was also found
that the error rate in electronically filed retums was a mere 3 per cent, compared
with a rate of 17-20 per cent on paper retums. The benefits of electronic filing are
seen to include rapid tax rebates and the fact that the computer program will check
retums for mathematical and also certain theoretical errors before they are lodged.
James and Wallschutzky (1993) also reported that there might also be other
considerable benefits as discussed below.
A major opportunity created by the computerisation of tax retums is the ability of
the tax office to undertake far more sophisticated analyses than was previously
possible, for example in identifying areas where potentially large amounts of tax
were being evaded over many small transactions. It is also possible to detect such
practices even if this is being done on a frequent and systematic basis. One
approach is to analyse the tax retums submitted by different tax practitioners. The
Australian Taxation office uses Key Abnormal Tax Agent Evaluation or KATE
that allows it to detect tax practitioners whose clients' retums vary significantly
from the average of those of other tax practitioners in the same region (James,
1997, pp. 205-226), KATE can highlight areas where there appears to be
something unusual going on. Another enhancement to KATE involves dividing a
tax agent's client base into small, medium and large client segments and then
applying ratio analysis by industry classification.
103

5.4.4.2 Electronic record-keeping
Tax authorities throughout the world want organisations to maintain record,
regardless of form or media, to be tme and accurate, legible, accessible, and
retained for as long as they are needed for tax purposes. However, elecfronic
records pose certain risks not generally encountered with manual, paper-based
record keeping. The main features of Australia's DTR 97/D4, Income Tax:
Electronic Record keeping (Stephens, 1999, pp. 69-71) are subject to:
(i) inadvertent destmction or cormption as is any digital information;
(ii) unauthorised tampering, which may compromise their integrity as tme and
accurate records; and
(iii) obsolescence of the operating systems used to process them, due to the
constant upgrading or changing of computer systems over time.
DTR 97/D4 also sets forth provisions prescribing the characteristics of electronic
record keeping systems required to make computerised accounting systems
sufficient for tax purposes.
5.4.4.3 Control of non-filers
For small business taxpayers, detection of non-filers is usually based on
information obtained from third parties which indicates the receipt of income or
the accumulation of wealth implying the need for lodgement of a retum (Nolan,
1993, pp. 69-72). The information is obtained on commuter mediums, usually
tape, to facilitate matching with ATO information assisted by the tax file system.
However, a great deal of information is processed manually.
According to the ATO's research, it was found that small business proprietors in
Australia are often not very literate in tax matters and have low management skills
(Nolan, 1993, pp. 69-72). They do not keep good accounting records. Given these
factors, together with common perceptions that the burden of tax on them is high
and that there is a lack of confidence in the tax system, there are major risks of
non-compHance through understatement of income, over-claiming of business
expenses and other deductions or by failing to account for amounts of tax withheld
from customers and employees. Because of poor financial record maintenance in
the small business sector, a campaign of record retention audits is being applied to
reinforce the need for good record-keeping practices to assist both business
104

management and tax compHance. Record-keeping audits also identify some non-
filers. Prosecution in the courts or administrative penalties applied under offence
provisions in the tax law are used against offenders.
5.4.5 The taxpayers' charter
The taxpayers' charter is an integral part of the ATO's day-to-day operations. It
was formally launched in July 1997 and was designed to improve the relationship
between the community and the ATO (Commissioner of Taxation, 1998). It also
helps to reinforce community confidence in the ATO's operations. The charter
lists and explains taxpayers' legal rights and main obligations, lists and explains
other standards that taxpayers can expect to be observed and sets out the ATO's
standards for delivering particular transactions, such as the time frame in which an
assessment is to be processed. It provides access to a properly functioning
complaints mechanism which tums a burdensome situation into one of opportunity
to change and improve.
5.4.6 Enforcement and punishment
The system of controls within the ATO, that is, the enforcement or punishment
poHcies (e.g. audit activities, penalty provisions), preventive controls (e.g.
withholding systems of taxation collection), and administrative efficiency in
detecting under-reporting practices, is a significant contributing factor to the level
of taxpayer non-compHance (Strader and FogHasso, 1989, pp. 39-46). Ultimately,
it is likely that these controls will also have an impact on tax agents' perceived
expectations that unethical tax practices will be detected by the ATO. Although, in
Australia, the penalties are imposed on the taxpayer, the tax practitioner is likely
to feel the impact of these penalties in the form of damage to client relationships
and damage to professional reputation.
The Income Tax Act stipulates that only registered tax agents may demand or
receive a fee for preparing an income tax retum or for transacting business on
behalf of a taxpayer in income tax matters. The Acts regulatory regime also
requires that tax agents obtain a licence to practise, which takes the form of
regisfration subject to certain education and experience criteria set by the Tax
Agents' Board (MarshaH, Smith and Armstrong, 1997, pp. 9-15). Interestingly,
there is no other country with a formal requirement for registration of all tax retum
105
preparers or their equivalents, ft is pertinent that in Australia for 1990/91, tax
agents accounted for the completion of 71 per cent of all personal income tax
retums (Taxation in Australia, 1993, p. 317). Further, Boucher noted that 26 per
cent of tax agents' agencies generate 93 per cent of the tax revenue processed
through tax agents (1991, p. 16). Realising the important roles played by these tax
agents, the ATO has undertaken several research surveys of agents in order to
assess professional relationships, client satisfaction and progress towards meeting
the authorities' objectives, usually by consultants upon the ATO's behalf (ATO,
1992). The ATO has introduced initiatives to create a more dynamic and effective
partnership with tax practitioners by capturing their real-time input issues at the
regional and national levels (Commissioner of Taxation, 1998, p. 35). These
initiatives included:
• an agreement between the ATO and professional bodies to work together
to develop an information/assistance package and related programs to
help tax practitioners to understand compliance issues better, which was
recommended to tax practitioners through a joint communique from the
ATO and the professional bodies;
• working together to draft a new Regulatory Framework for Tax
Practitioners;
• establishing national liaison fomms to examine specific issues such as
lodgment and fringe benefits tax;
• establishing and maintaining national panels, comprising academics,
business specialists and subject experts to advise the ATO on issues
such as public ralings. Tax Pack and the Taxpayers' Charter;
• convening special, one-off meetings on high priority issues such as
compliance programs;
• establishing a register of specialist consultants who can be engaged
quickly to assist in the resolution of significant issues;
• establishing regional ATO/tax practitioner fomms and liaison groups to
help identify unintended or adverse consequences that may result when
ATO policies are implemented, and to advise on policies that may not
work on a practical level, in which participants also play an important
role in identifying issues that should be brought to the attention of the
106

•
National Tax Liaison Group or the National ATO/Tax Practitioner
Fomm; and
better communication strategies.
5.4.6.1 Policies adopted to combat non-compliance
Some policies adopted by the ATO to overcome tax avoidance and evasion in
Australia are as follows.
1. Anti-avoidance provisions
The Commissioner has the power under s 224 to impose penalty tax. This penalty
is 50 per cent of the difference between the tax properly payable and the tax that
would have been payable if the anti-avoidance provision had not been applied.
However, when a taxpayer has a reasonably arguable position, the level of the
penalty is reduced to 25 per cent (Lehmann and Coleman, 1996, p. 1191).
2. Taxation offences
A taxpayer is convicted under Section 8C for the failure to comply with
requirements under the taxation law and Section 8D for the failure to answer
questions when attending before the Commissioner, or failing to produce a book,
paper, record or other related document. Section 8E is related to penalties for
conviction under s 8C or 8D (Lehmann et al., 1996, pp. 1191, 1192).
• First offence - maximum fine of $2000
• Second offence - maximum fine of $4000.
• Third and subsequent offences - maximum fine of $5000 and or
imprisonment for 12 months.
Section 8M prescribes the penalties for offences against making false or
misleading statements to taxation officers or omitting something from a statement
so that it becomes false or misleading (s 8K), or keeping accounts or records in
such a way that they do not correctiy explain the matters or transactions etc to
which they relate (s 8L)(Lehmann et al., 1996, p. 1192).
• First offence - maximum fine of $2000.
• Second or subsequent offences - maximum fine of $4000.
107

(a) Record keeping requirements
Where taxpayers fail to keep adequate records, it is difficult to
establish their proper tax Hability. Hence good record keeping should
be encouraged by advising taxpayers that by keeping good records they
are less likely to be audited or that audits are less likely to be intmsive.
However, there is a greater chance that poor record keepers will be
audited or experience more intmsive audits. As suggested by
Wallschutzky (1993, pp. 129-151), other penalties for poor record
keeping could include fines or even denial of deductions. Since 1 July
1986, the Australian tax system has contained substantiation
requirements for work related expenses and for car expenses. In
essence these require taxpayers, who want to claim deduction for these
items, to keep receipts for such expenses and to keep log books in
respect of car travel. Failure to keep receipts or log books can mean
denial of the relevant deduction, even though the expenses may
actually have been incurred. These provisions were introduced to
correct a deficiency in the law which, while specifying the type of
expense which qualified for deduction, failed to specify what level of
proof was required to substantiate claims.
(b) Denial of deductions
Since 19 September 1985, the Australian tax system has denied
deductions for entertainment expenses since taxpayers exploit or are
likely to exploit this particular provision, hence the tax office can deny
deductions for this types of expenditure (Wallschutzky, 1993).
3. Liability of tax agents for false retums.
To engage in tax avoidance, taxpayers usually require professional help from
bankers, lawyers or accountants. In August 1980, the Australian Society of Labour
Lawyers was formed and one of its initial public statements condemned lawyers
who devoted their talents to devising tax minimisation schemes and judges who
upheld such schemes (WaHschutzky, 1982, pp. 122-124). Similarly, in September
1980, Wallschutzky (1982) noted that the Australian Institute of Chartered
Accountants issued a "Proposed Statement of Taxation Standards" which took a
108

harsh line against members who promoted tax avoidance schemes. The proposed
standard, was passed, and is mandatory and members who fail to observe it are
liable to investigation and disciplinary action.
Hi a random sample of 750 taxpayers in New South Wales, Wallschutzky (1986,
pp. 31-33) found that professional tax advisers were seen as influencing people's
likelihood to evade their taxes. Hence the extent to which professional bodies for
accountants and lawyers have ethical mles prohibiting members from assisting
taxpayers in undertaking tax avoidance arrangements, can have an important
impact on the proHferation of avoidance schemes. Wallschutzky (1993, pp. 129-
151) suggested that if necessary, governments can encourage professional bodies
to adopt ethical standards. Altematively, governments can make it a statutory
offence to promote certain types of schemes or to aid or abet taxpayers entering
into such schemes. Under s 8T, the Commissioner has remedies against tax agents
who invent or inflate claims but an essential element of the offence under s 8T is
the existence of a guilty intent (mens rea)(Lelimann et al., 1996, p. 1199).
WaHschutzky (1993, pp. 129-151), WaHschutzky and Singh (1995, pp. 42-71)
argued that if penalties are to be effective, they must be perceived as penalties and
the following principles need to apply. Where possible, penalties should be
expressed as a percentage of the tax which taxpayers sought to evade and the
penalty for late payment should at least equal "market rates'' of interest. The
Australian Government decided to replace the disparate late penafty arrangements
in legislation administered by the Commissioner of Taxation with an "Interest on
Outstanding Balance" (lOB) charge (Commonwealth of Ausfralia, 1998). The lOB
reflects interest rates and employs the weighted average yield of the 13-week
Treasury note topped up with an eight percentage point upHft factor. This upHft
factor takes the charge above commercial interest rates and is a deterrent to
taxpayers using taxation debts as a form of business finance. The charge is
calculated on a compounding basis and based on the relevant 13-week Treasury
note yield, the current lOB charge is in the order of 13 per cent. The existing
penalties carry simple interest rates of between 16 and 20 per cent depending on
the type of tax. The new interest charge was applied from 1 January 1999 and
109

fransitional arrangements that would provide for late penalties across all taxes to a
simple effective rate of 13.5 per cent.
The Budget Review 1998-99 also announced that "Failure to Notify" penalty.
Taxpayers who fail to correctly notify the Commissioner of Taxation when an
amount is due were required to pay a "Failure to Notify" penalty. The penalty is
calculated at the rate of 8 per cent per annum and replaces the flat rate culpability
penalties, ranging from 20 per cent to 200 per cent for failure to remit deductions
by the due date. As for the penalty for failure to lodge annual source deduction
reconciliations, a penalty is imposed of $10 per week for each week annual
reconciliations are not lodged by withholders of source deductions. The maximum
penalty is $200 and applies where documents are 20 weeks late or more.
4. Publishing of name of tax evaders in the annual report
ATO publishes the name of individuals who are convicted of evading taxes in its
annual report of the national tax office (Wallschutzky, 1984, pp. 371-384).
5. The formation of Cash Economy Task Force.
There is a general recognition that the cash economy is substantial and represents
a significant challenge to the integrity of the tax system. The ATO formed the
Cash Economy Task Force in November 1996 to examine the nature of the cash
economy, to determine what the likely compliance issues were, and to develop a
recommendation on the additional steps that the Australian Taxation Office
needed to address evasion in the cash economy (Commonwealth of Australia,
1998). The Task Force defined the "cash economy" as "income that is not
recorded in the books from which the tax retum is prepared" and presented its first
report in May 1997 where it suggested that the ATO needed to work with tax
practitioners, industry and community groups to develop effective solutions. Since
this definition of the cash economy was wide enough to include a wide range of
practices, the ATO has decided to focus its attention initially on cash income
derived from business and employment, whether legal or illegal in nature. The
Commissioner of Taxation responded to this report by announcing the
implementation of a range of initiatives, which included the redeployment of field
resources, by increasing the ATO's staff presence in cash industries and by
developing Task Force initiatives. The ATO endorsed national projects relating to
110
the cash economy in the following industries: Building and Constmction;
Clothing; Emit and Vegetables; Prescribed Computer Goods; Restaurants and
Cafes; Road Transport; and Taxis.
Hi its second report titled "Improving Tax Compliance in the Cash Economy"
pubHshed in April 1998, the Task Force noted that the ATO had increased its field
presence threefold in businesses with significant cash dealings, including those to
which the Prescribed Payments System (PPS) and the Reportable Payments
System (RPS) applied. This report also recorded that an ATO Corporate Survey of
taxpayer attitudes to the taxation system, which is conducted every six months
through AC Nielsen-McNair, showed that there was widespread acceptance in the
community that not paying tax on cash income was alright.
5.4.6.2 Audits
Under the self-assessment method, the ATO audits a percentage of all retums
lodged. It targets special groups such as large companies which, are paying tax at a
low rate or employ contract employees. Lehmann et al. (1996, p. 1201-1203)
describe these three types of audits as below.
1. Complex audits
These audits are directed towards large corporations. They focus on financial
fransactions and intemational transactions.
2. Business audits
A business audit may involve a complete check of the taxpayer's arrangements or
focus on specific issues such as fringe benefits tax. It is stmctured to be completed
in the minimum time, commensurate with achieving a high level of cost
effectiveness. Audits of individuals and partnerships usually involve the
preparation of a source and application of fiinds statement, and a reconciliation of
that with incomes retumed and movements in assets. Audits of private companies
are usually cenfred on an examination of specific deduction or income items that
appear to warrant verification.
3. Primary audits
These audits deal with three main groups:
111

1) Desk audits of salary and wage eamers, small businesses, and taxpayers who
have negative gearing arrangements.
2) Income matching in which the Tax Office compares its externally obtained
data with information supplied by taxpayers in their retums.
3) Obligations to deduct at the source. The Tax Office checks whether the
employers have properly withheld PAYE deductions or fiilfilled obligations
under the prescribed payments system.
5.4.6.3 Post audit critique
The post audit critique is a team review mechanism that contributes to the
development of best audit practices (ATO, 1995). This stage is used to critically
examine all aspects of the audit such as to ascertain whether objectives were
fiilfilled, tactics adopted were soundly based and how the next audit could be more
effectively carried out. The results of the critique are then forwarded to the
National Office for evaluation and input into a national database in order to share
best practice with all the branches.
The audit case was subject to a Quality Assurance Review, by an independent
committee, in order to improve the quality of audits by identifying and
communicating best practices, by eliminating unproductive activities and by
sharing all the experiences.
5.4.6.4 An Eliot Ness-style strategic intelligence network
This was established by the Australian Tax Office to monitor new methods of
avoidance and act on them quickly, before they became established and were
widely promoted. Its tax commissioner, Mr. Carmody said the ability of the tax
office to pursue cases was at risk if promoters of avoidance schemes, including
large accounting firms were able to use the courts to screen clients from the Tax
Office's attention (Macleay, 1998).
5.4.7 The role of marketing in the ATO
The Commissioner of Taxation's Annual Report 1989-90 (1990) acknowledged
the new direction to be taken by the ATO:
By setting service as the theme for the year, I aimed to raise awareness of the importance of good service among staff and the community. Service makes sense; it
112

costs less to coUect revenue if people understand tax law and comply voluntarily than if they make mistakes or must be forced to comply.
Marketing anticipates and measures the needs or desires of a particular group and
then responds with goods or services that meet those needs (Boyd and WaUcer,
1990). It acknowledges the importance of building relationships within an
exchange system. The ATO regards taxpayers as customers and has added a
service dimension to its deHvery systems (Coleman and Freeman, 1997, pp. 311-
336). Examples include: the establishment of consultative groups; electronic
lodgment of retums; information pamphlets; education and media campaigns;
school kits and the tax pack information product. As well as concenfrating on
customer service, the ATO has acknowledged the need both to improve customer
service and pubHc perception of it (Coleman and Freeman, 1994, pp. 347-367).
From the late 1980s, the ATO has acknowledged the need to improve its service to
its clients. The approach undertaken by the ATO consists of a combination of help
and enforcement. The ATO is also committed to improving the technical and
managerial skills of its staff who are encouraged to undertake studies in the AT AX
program fiinded by the ATO.
ATO also has undertaken customer satisfaction research. This is important
because it not only provides fiirther information about customers' needs, but it
also provides feedback on how customers perceive the quality of the service they
receive (McNeil, 1993).
5.4.7.1 Market research
Realising the importance of understanding its customers, the ATO has used
qualitative research as well as quantitative modelling. It has also acknowledged
the need to do research into different segments of the market (Bird, 1992). This
affects the type of marketing strategies which the ATO develops to improve
compliant behaviour.
Although the ATO potentially deals with all taxpayers who are engaged in
producing income, when applying strategic marketing principles there are various
factors the ATO has considered. The first step the ATO has taken is to define
various market segments (Coleman and Freeman, 1994, pp. 347-367) resulting in
the following categories.
113

• Large and medium businesses. Those businesses with an annual tumover of $5
million or more;
• small businesses, small companies, tmst, partnerships and sole traders; and
• non-business individuals, that is taxpayers who do not have business income.
The ATO also has acknowledged that the risks to revenue vary greatly between
market segments. Within each of these segments the issue is to find a basis for
heterogeneity in relation to their response to marketing activities. As suggested by
Coleman and Freeman (1994, pp. 347-367), specific marketing proposals should
be directed to different segments. Small business is so diverse and the cultural
background of small business people is so varied that a strategy which is
successfiil with one group may completely repel another. Users of market research
have become increasingly aware of the need to understand the culture of a market
segment because the values and attitudes of taxpayers are products of their cultural
background.
5.4.7.2 Measurement and analysis of voluntary compliance
Market research and analysis from audit activity is used to direct resources
towards assisting small businesses to achieve improved voluntary compliance.
Based on the ATO's research, small business proprietors are often not well literate
in tax matters and have low management skills (Nolan, 1993, pp. 69-72). The
major concems of small business operators are factors that affect their day-to-day
livelihood, such as the high rate of business failures, interest rates, economic
conditions and the burdens of location and compHance with government
regulations. They generally work long hours and often operate businesses that
handle considerable amounts of cash. Many of these small proprietors often do not
keep good accounting records. Given these factors, together with common
perceptions that the burden of tax on them is high and that there is a lack of
confidence in the tax system, Nolan (1993) claimed that there were major risks of
non-compliance through understatement of income, over-claiming of business
expenses and other deductions or by failing to account for amounts of tax withheld
from customers and employees. To address these risks, a balanced mixture of help
and enforcement activities is adopted by the ATO. A well designed audit activity
combined with the publication of interpretive mlings and other information to
114
inform taxpayers of what the law requires of them were developed whose primary
aim was to encourage voluntary compliance and detect non-compliance (Nolan,
1993).
5.4.8 Staff development and training
The ATO has generous study leave provisions which assist staff to undertake part-
time study, including study towards degrees in accountancy, law and economics
(Bird, 1994, pp. 123-151). It also conducts a program of Continuing Professional
Development in utilising both intemal and extemal presenters.
ATO staff are also encouraged to participate in the development programs that it
offers directly, or through the Public Service Commission. In particular there are a
number of programs which allow ATO officers to take up placements in private
sector organisations such as in large accounting firms, enabling them to gain a
better commercial understanding.
5.5 Administrative Reform Proposed for the ATO by the TIA
The Taxation Institute of Australia (TIA) has recently made a proposal for two
boards to oversee the Australian Taxation Office based on a view that tax
administration should be more responsive to the changing business and tax
environment (Dirkis, 1999, pp. 42-46). The boards would have two distinct roles
whereby each board would have a different focus, different responsibilities and
different members. There would be representatives of the taxpaying community on
each board, as well as representatives of other government departments besides the
Treasury and the ATO. Public interest should be protected by ensuring that both
boards would give advice directly to the Treasurer or the Prime Minister, where
considered necessary.
The first board or the Taxation Policy Review Board would focus on taxation
policy formulation and development. It should be strong, independent and provide
a strong consuHative fomm. Proposals will be received, challenged and debated
constmctively. While the other board or the Taxation Adminisfration Review
Board would focus primarily on improving the adminisfration of the tax law. This
board would oversee the administration of the ATO, and recommend
115

improvements where necessary, ft should be answerable to the Parliament, and be
constituted as an advisory board.
5.6 Summary
The ATO acts as a government agent for the collection of income tax in Ausfralia.
Its core business missions are: a) to collect proper revenue and provide proper
service, b) to assist payment of child support; and c) to support the provision of
retirement income for the people of Australia.
Individual taxpayers of Australia consist of individual non-business income (INB),
small business income (SBI) and large business and intemational (LB&I) business
line. Among these individual taxpayers, most of them are concentrated in the age
group of 30-49 years and males outnumber females.
Various sfrategies have been adopted by the ATO to overcome income tax non
compliance in Australia. They could be placed in five categories as follows:
1. Enforcement and punishment. This includes withholding of taxes, auditing
suspected taxpayers, formation of cash economy task force, introduction of self-
assessment and fiinge benefits tax or FBT, Prescribed Payment System (PPS)
and Pay-As-You-Eam System (PAYE), introduction of various sanctions, and
penalties involving taxpayers and tax preparers.
2. Technology. The introduction of ELS and computerised methods to detect tax
evaders. For detecting tax practitioners whose clients' retums vary significantly
from the average of those other tax practitioners in the same region it uses
KATE.
3. Dissemination of information. The ATO disseminates tax information through
tax pack. Taxpayers' Charter, dialogues with tax practitioners and making
agreement with professional bodies to work together to develop
information/assistance regarding compliance issues.
4. Conduct market research. Realising the importance of understanding its
customers, the ATO has used qualitative research as well as quantitative
modelling. It has also acknowledged the need to research different segments of
the market that would affect choices of marketing strategies, which the ATO
needs to develop to improve compHant behaviour.
116

5. Staff development. The ATO provides staff development and training to gain a
better commercial understanding besides organising market research to
understand better the needs of its clients. The recent proposal made by TIA to
create two advisory boards to deal with policy development and tax
administration are cmcial in ensuring that the tax system is responsive to the
changing business and tax environment.
117

CHAPTER SIX
The Gap Approach to the Measurement of Tax Non-Compliance
6.1 Introduction
The purpose of this chapter, and of the next chapter, is to assess the extent of tax
non-compliance in Malaysia. Non-compliance is by definition difficult to
measure, because it involves individuals and firms concealing the tme level of
their assessable income, whether intentionally or inadvertently. This difficulty is
especially marked in a developing country such as Malaysia, where taxation law,
statistical collections and taxation enforcement are less well established than in
developed countries such as the U.S. or Australia. However, these very facts may
imply that it is even more important to develop some broader indications of the
level of non-compliance for selected developing countries.
The approach used in this chapter to assess the extent of tax non-compliance in
Malaysia involves the application of a quantitative indicator of the level of non
compliance which has been used in a number of other countries. Although this
approach is far from perfect, but it may give some indication of the scale of non
compliance in Malaysia.
Applications of the gap method to the U.S. and Australia are also discussed in this
chapter, to provide some guide to the conclusions that can be drawn from the
application of this method to Malaysia.
6.2 Description of Malaysian Information Sources
In order to understand the methodologies that have been adopted in estimating the
extent of income tax non-compliance and their application to Malaysia, some
Malaysian information sources used in undertaking the analyses outlined in this
chapter (and also in Chapter Seven) are briefly reviewed in this initial section.
Data sources for the U.S. and Australian estimates using the gap approach are
outlined in the relevant sections.
118
6.2.1 Data sources from the national accounts
The system of national accounts in Malaysia is based on the concepts and
methodology outlined in the publication entitled "A System of National Accounts,
1968", of the United Nations Statistical Office. Estimates of GDP by kind of
economic activity in Malaysia, in constant prices, rely extensively on volume
indicators of production. These indicators are used to extrapolate base year value
added by sectors and sub-sectors. Current monthly/annual statistics for
agricultural production and output of the manufacturing, mining and other service
sectors form the basis for computation of the appropriate volume indices. For
producers of government services, the value added is derived from preliminary
estimates of expenditure obtained from the Accountant General's office (Dept. of
Statistics Malaysia; 1997). More recently, expenditure estimates have also been
provided (Dept. of Statistics Malaysia; 1999a), but the income based estimates of
the components of GDP, which are most usefiil for estimates of tax non
compliance, are not yet available for Malaysia. These and related issues are
discussed fiirther in Section 6.4 below.
6.2.2 Taxable income
Information conceming taxable income that has been extracted from the data
sources of the Intemal Revenue Board of Malaysia (IRB) is referred to here as
reported taxable income. It includes all kinds of eamings from all residents and
non-residents which are taxable in Malaysia, and hence covers:
• Income from business, trade or profession.
• Employment income: salary, wages, remuneration, fees, leave pay,
commission, allowances, bonus, gratuities and benefits (whether in money
or otherwise).
• Income from investments/savings - mainly dividends and interest, but only
in certain circumstances capital gains.
• Rateable value of living accommodation provided by the employer.
• Payments from an unapproved pension fund with respect to employers'
contributions.
• Compensation received by employees on termination of their jobs.
119

As for resident taxpayers, all income eamed in Malaysia and all income received
in Malaysia is taxable, while for non-residents only the income eamed in
Malaysia is taxable (IRB 1998a). Hence income tax in Malaysia is territorial
whereby tax is imposed only on income that has a Malaysian source. Where its
source is outside Malaysia, income is taxable only if it is remitted into Malaysia
by resident taxpayers only. However, if its source is outside Malaysia and this
income is not remitted by resident taxpayers into Malaysia, this income is tax-free
(Singh, 1995).
6.2.3 Analysis of direct taxes in Malaysia
Direct taxes, such as income tax, are a major source of Government revenue.
Companies and cooperatives are the main contributors to direct taxes followed by
individuals in the years of 1995, 1996 and 1997. The breakdown of tax
components is as shown in Table 6.1 below.
Table 6.1 Tax components of direct taxes in
Tax components Companies and cooperatives Individuals Real property gains tax Stamp duty Estate duty Petroleum Other taxes Total
1995,1996 and 1997 Net collection in RM billions
1995 14.3 6.0 0.4 2.7 0.006 2.4 0.01 25.8
1996 16.8 6.5 0.5 2.7 -
3.9 0.01 30.4
1997 17.4 6.9 0.4 1.2 -
4.0 0.01 29.9
Source: IRD/IRB Annual Reports for 1996 (p. 82), 1997a (p. 16) and 1998b (p. 16).
A total of RM25.8b, RM30.4b and RM29.9b of direct taxes were collected for
1995, 1996 and 1997 respectively. The highest component of direct taxes comes
from companies and cooperatives and individuals come in second place for all
these three years under study. As for estate duty taxes, no taxes have been levied
in this area from year 1996 onwards.
In ensuring the success of the revenue collection process, there is a need to
formulate a prevention system to maintain compliance at a high level. In the
Malaysia Income Tax Legislation, it is mandatory for all companies incorporated
under the Companies Act 1965 to submit audited accounts to the taxation
authority. For other companies and individual taxpayers, the Director General
120

may require audited accounts to be produced if the accounts or records produced
are insufficient for ascertaining taxable incomes. For IRB, investigation and
intelligence activity plays an important role not only in the collection of tax but
also to prompt taxpayers to be conscious of their tax responsibility and to step
forward voluntarily to declare their actual income.
6.3 The Gap Approach to Taxation Non-Compliance:
Methodology and International Estimates
This approach relates taxable income as reported by the taxation authorities to a
measure of taxable income derived from other sources, normally the national
accounts. The difference between the two estimates of taxable income can be used
to assess the total dollar value of income tax non-compliance, using the broad
methodology discussed below.
6.3.1 The gap methodology
The essence of the gap methodology for assessing the level of tax non-compliance
is to derive an estimate of a measure of taxable income (either total taxable
income or personal taxable income) from national accounting sources, and to
compare this estimate with the figure for the equivalent taxable income variable
as reported in the official taxation statistics. The former measure we refer to as
derived taxable income, while the latter measure might be termed reported
taxable income. Given certain conditions, the difference between these two
measures can be considered as a broad indicator of the level of tax non-
compHance.
One of these conditions is that the derived and reported taxable income variables
are conceptually equivalent. In the estimates prepared by the U.S. Department of
Commerce (see Section 6.3.2 below) the focus is on personal taxable income, and
considerable effort is put into ensuring that the derived and reported estimates are
conceptually comparable. In the AusfraHan and Malaysian estimates reported in
Sections 6.3.4 and 6.3.5 below, the focus is on aggregate taxable income. In these
two cases also, an important issue is the conceptual comparability of the derived
and reported taxable income variables.
121

Another condition is that the national accounting sources used in generating
derived taxable income have access to data sources (such as statistical surveys and
company statistics) in addition to taxation data. Hi most countries taxation
statistics are one of many sources used in compiling the national accounts
estimates. But clearly the national accounts can provide evidence on tax non
compliance only to the extent that they draw on additional sources of information.
Indeed, as the measure of non-compliance is generated as the difference between
derived and reported taxable income, it will be particularly sensitive to errors,
omissions or other data problems in the national accounts.
A third condition, which will be important in considering the Malaysian case, is
that there is high coverage by taxation law of the private incomes reported by the
national accounts. Where the level of coverage is an issue, a measured gap
between derived and reported taxable income may as much reflect low coverage
as in high rate of non-compliance. This is, of course, an example of the need to
aHgn closely the conceptual basis of both sets of estimates.
6.3.2 The U.S. estimates for personal income taxation
In seeking to assess the extent of income tax non-compliance for Malaysia, it is
usefiil to compare Malaysian estimates with the latest research done using a
similar approach for the U.S. and with estimates using comparable methodology
for Australia. As both the U.S. and Australia are developed countries, while
Malaysia is a developing country, this may enable us to compare the estimated
extent of personal income tax non-compHance between developed countries (the
U.S. and Australia) and Malaysia, an example of a developing country. It will also
enable us to get a sense of the reliability of methods appHed to the U.S. and
Ausfralia before they are applied to Malaysia.
The U.S. Bureau of Economic Analysis (BEA) prepares estimates of personal
income as an integral part of preparing the U.S. National Income and Product
Accounts, whereas the U.S. Intemal Revenue Service (IRS) prepares estimates of
adjusted gross income (income net of deductions) from its taxation records. The
methodology adopted by the BEA is to adjust its measure of personal income to
make it as close as possible conceptually to the IRS measure, and to freat the
difference between the two measures of adjusted gross income ('the AGI gap') as
122

a broad indicator of the level of non-compliance by individuals with the Federal
tax code.
The BEA's starting estimate of personal income contains both income reported to
the Hitemal Revenue Service and unreported income. As noted by Park (2000, pp.
12-22), it contains taxable, partly taxable and non-taxable income. This personal
income comes from a wide range of sources, such as from participation in current
production and from both government and business transfer payments. It is
calculated as the sum of wage and salary disbursements, other labour income,
proprietors' income with inventory valuation and capital consumption
adjustments, rental income of persons with capital consumption adjustment,
personal dividend income, personal interest income, and transfer payments to
persons after deducting personal contributions for social insurance.
On the other hand, the estimate of adjusted gross income (AGI) from the IRS
contains only taxable sources of income net of specific adjustments as reported to
the IRS. It represents the sum of all total income (including all income received in
the form of money, property and services which is not tax exempted), less a
specific set of adjustments authorised by legislation. However, it excludes all tax
exempt income, such as interest on tax-exempt State and local government bonds,
voluntary contributions to thrift savings plan and non-taxable social security
benefit payments. It is estimated on the basis of unaudited tax retums that are not
adjusted for misreporting.
Thus the BEA needs to adjust its measure of personal income to make it as far as
possible conceptually comparable with the AGI measure of the IRS. This involves
primarily deducting from personal income items of such income not included in
taxable income (such as non-taxable transfer payments, imputed income and
certain classes of investment income) and adding back some items of AGI not
included in personal income. The result of this exercise is a BEA-derived estimate
of AGI, and the difference between the two measures is the AGI gap. Details of
these adjustments can be found in Table 6.4.
However, the AGI gap also contains some errors, such as
(i) errors in the source data.
123
(ii) errors in the IRS measure of total AGI and its components (since the
estimates are based on a probability sample) and
(iii) errors in reconciliation items.
Further, reflecting the constmction of the personal income measure, the BEA-
derived AGI estimates include both explicit and impHcit adjustments for tax
retum misreporting or non-compliance. Explicit adjustments are made for the
effects of tax retum misreporting on the source data used to prepare the estimates
of wage and salary disbursements, non-farm proprietors' income, royalty income
and personal interest income. ImpHcit adjustments are made for some components
of personal income because the source data are from payers of the income. BEA
believes that the explicit and implicit adjustments for misreporting account form a
major part of the AGI gap.
Park (2000, pp. 12-22) concludes that the AGI gap can be considered a rough
indicator of the dollar value of income tax non-compliance by individuals. Using
this approach estimates of the gap between AGI-BEA derived income and AGI-
IRS derived income for the years of 1996 and 1997 have been calculated as
shown in Table 6.2 below. Similarly, Park also estimates the AGI gap and the
relative AGI gap for the years of 1959-97 as shown in Table 6.3 below.
124

Table 6.2 Derivation of adjusted gross income and AGI gap, U.S., 1996 and 1997 (billions of dollars)
1996 1997 1. Personal income (national accounts) 6547.4 6951.1 2. Less: Portion of personal income not included in AGI
3. Non-taxable transfer payments 4.0ther labour income except fees 5. Imputed income in personal income 6. Investment income of life insurance carriers and pension plans 7. Investment income received by non-profit institutions or retained by fiduciaries 8. Differences in accounting treatment between NIPA's and tax regulations, net 9. Other personal income exempt or excluded from AGI
10. Plus: Portion of adjusted gross income not included in personal income
11. Personal contributions for social insurance 12. Gains, net losses, from sale of property 13. Taxable pensions 14. Small business corporation income 15. Other types of income
16. Plus: Inter-component re-allocation
17. Equals: BEA-derived AGI
18. AGI of IRS (as reported)
19. Plus: Inter-component re-allocation
20. Adjusted gross income of IRS (reallocated)
21. Adjusted gross income gap
22. AGI gap (proportion of BEA derived AGI)
23. Addendum: Misreporting adjustments included in personal income
2373.8
978.0
Source: Park (2000, pp. 14, 15).
299.1
2498.4
842.3 487.5 264.3 366.7
59.9 79.9
273.2
870.1 498.2 293.0 394.9
60.0 87.4
294.8
1151.2
280.4 249.5 311.6 89.3 47.1
0
5151.6
4536.0
0
4536.0
615.6
12.0%
298.1 338.2 341.0 100.7 73.2
0
5604.0
4973.6
0
4973.6
630.3
11.2%
311.5
125

Table 6.3 The BEA and IRS measures of AGI, AGI gap and relative AGI gap, 1959-97 (per cent)
Year
1959
1960
1961 1962
1963 1964
1965
1966 1967
1968 1969
1970 1971 1972
1973 1974
1975 1976 1977 1978
1979 1980 1981 1982 1983 1984 1985 1986
1987 1988 1989 1990
1991 1992
1993 1994
1995
1996 1997
BEA-derived AGI 339.1
351.4
365.8
387.8
409.2 442.2
479.8
521.7 555.4
609.3
663.3 699.3 744.8
825.5 926.1 1005.4
1048.0
1169.1 1297.6
1469.6 1658.5 1831.6
2016.3 2094.7 2225.7
2473.3 2629.9 2848.3 3125.4
3415.8
3658.6 3813.2
3864.4
4108.3 4260.0 4485.7 4766.4
5151.6 5604.0
IRS AGI
305.1
315.5
329.9
348.7 368.8 396.7
429.2 468.5
504.8 554.4 603.5
631.7 673.6 746.0 827.1 905.5 947.8 1053.9 1158.5 1302.4
1465.4 1613.7 1772.6
1852.1 1942.6 2139.9 2306.0 2481.7 2773.8 3083.0
3256.4 3405.4
3464.5
3629.1 3723.3 3907.5 4189.4
4536.0 4973.6
AGI gap
34.0
36.0
36.0 39.1
40.4
45.6
50.6 53.3 50.6 54.9 59.7
67.6 71.2
79.5 99.0 99.8 100.2 115.2 139.1 167.1 193.1
217.9 243.7 242.6 283.1 333.4
323.9 366.6 351.6 332.8
402.3 407.8
399.9 479.2
536.7 578.2
577.0
615.6
630.3
Relative AGI (per cent)
gap
10.0 10.2
9.8 10.1 9.9 10.3 10.5 10.2
9.1 9.0 9.0 9.7 9.6 9.6 10.7
9.9 9.6 9.9 10.7 11.4
11.6 11.9 12.1 11.6 12.7
13.5 12.3
12.9 11.2 9.7 11.0 10.7 10.3 11.7
12.6 12.9
12.1 12.0 11.2
Source: Park (2000, pp. 14, 15).
The estimated AGI gap for the U.S. data increases steadily from $34 billion in
1959 to $630.3 bilHon in 1997, but most of this increase reflects the growth in
personal income over that time. The relative AGI gap, measured against the
BEA-derived AGI (in per cent) has been fairly constant, ranging from a low of 9.0
per cent (in 1968 and 1969) to a high of 13.5 per cent (in 1984) of the BEA
126

derived AGI. Thus it can be concluded that the relative AGI gap for the years of
1959 to 1997 ranges between 9 per cent to 13.5 per cent of the BEA derived AGI.
Since the eariy 1980s it has fluctuated in a fairly narrow range about an average
of approximately 12 per cent.
6.3.3 Data sources for Australia
The Australian Bureau of Statistics (ABS) provides estimates of GDP at current
prices derived from the production, income and expenditure approaches. In
practice in Australia, GDP is estimated mainly using the income and expenditure
approaches (Pulle, 1998, pp. 43-49). The income side of the Australian National
Accounts is broadly comprised of three aggregates (Comisari, 1997, pp. 35-53).
They are as follows:
1. Gross operating surplus or GOS;
2. Wages, salaries and supplements; and
3. Net indirect taxes.
However, wages, salaries and supplement form the largest part of GDP,
comprising about 50 per cent of GDP. Wages and salaries are mainly derived
from two ABS surveys, the Survey of Employment and Eamings (SEE) and the
Labour Force Survey (LFS). The Gross Operating Surplus or GOS component
required for the income approach is based on information obtained from taxation
statistics and other information available to the ABS. Taxation statistics, made
available by the Australian Taxation Office (ATO), are based on information
provided in tax retums. As such they suffer from the deficiency that they will not
include income understated in those retums nor the income of persons who do not
file tax retums. In addition, the so called "hidden economy" can be an important
influence in terms of measuring rates of economic growth over time, particularly
when changes in taxation legislation result in previously undisclosed income
being recorded.
Hence the ABS makes an allowance in the national accounts for the effect of
understatement of income, to avoid recording an artificial increase in GDP
because of such changes (Comisari, 1997, pp. 35-53). The current system used to
adjust for the understatement of business income in taxation statistics evolved
from initial estimates of the revenue foregone through understatement of business
127

income in tax retums which were produced by the ATO and included in the June
1985 Draft White Paper, Reform of the Australian Tax System. So, any difference
will largely reflect the assumptions made by the ABS about the extent of non
compliance, rather than an objective assessment of its magnitude.
Academic studies have estimated that the hidden cash economy of Australia could
range from 3.5 per cent to 13.4 per cent of its GDP.̂ However, the ABS has
provided information to Victoria University conceming the assumptions made in
the national accounts about the extent of unreported income, namely that the
adjustment for non-reported income was of the order of $6 bilHon in 1998/99 and
a similar proportion of GDP in earlier years (Sheehan, 2000). Based on this
information, the extent of the unreported income adjustment in the Australian
National Accounts is estimated to be as shown in Table 6.4 below.
Table 6.4 Unreported income adjustment, Australia National Accounts, 1994-95
Year
1998/99 1996/97 1995/96 1994/95
to 1998 GDP (A$m) 591 546 540 379 520 669 498 113
t-99 Extent of non-compliance as assumed by the ABS (A Sbillions) 6.0 5.5 5.3 5.1
Source: Author estimates based on information from the Austalian Bureau of Statistics.
6.3.4 Estimates for Australia: The overall taxable income gap
Methodology
The total level of income that is potentially taxable in an economy can be
considered as made up of income accming to national citizens in three parts:
• income arising from economic activity, whether in the home economy or
abroad,
• income arising from increases in the value of assets held by citizens, and
• income arising from taxable benefits to persons paid by the government.
Estimates of income arising from economic activities, that is from the creation,
production and distribution of goods and services, can be obtained from the
national accounts, which are designed to measure such productive activities.
However, several elements of income arising from economic activity are not
taxable. These include income accming to public sector organisations or other
128

non-taxable bodies, income in respect of which deductions are allowed by the tax
authorities and income which is not subject to tax as exempt income. The
Australian national accounts also impute a rental income to the owner occupiers
of dwellings, being the implicit income equivalent of the services that they obtain
from living in that dwelling. This imputed income is of course not taxable.
On the other side, the national accounts do not measure the increase in the value
of assets and hence do not provide any estimate of taxable income arising from
capital gains. The national accounts provide an estimate of income from economic
activity; they do not provide an estimate of income arising from the increased
value of assets. Nor do they provide a reHable estimate of that element of benefits
paid to persons which is taxable.
In recognition of these facts, in this section we approach the issue of measuring
non-compliance in Australia through the gap approach by focusing on estimates
of taxable income from economic activity. That is, we estimate taxable income
from economic activity from national accounting sources and compare that with
an estimate of the same variable from taxation sources. The latter estimate is
obtained by excluding income arising from capital gains and benefit payments
from the recorded measure of taxable income. This methodology means the
exclusion of non-compliance in relation to capital gains and benefit income from
the resulting measure of tax non-compliance.
The specific methodology to be used (subject to the availability of data) in
applying the gap approach to estimating tax non-compliance at the aggregate level
is as follows:
Derived Taxable Income From Economic Activity
Gross national income Less:
Imputed income from dwelling rent Depreciation (consumption of fixed capital)
Adjusted net national income Less:
Income accming to non taxable (public) enterprises Adjusted net private income Less:
Deductions allowed against taxable income (other than depreciation)
Derived taxable income from economic activity
129

Reported Taxable Income From Economic Activity
Total taxable income reported by taxation authorities Less:
Capital gains included in gross income Benefit payments included in gross income
Reported taxable income from economic activity
Income Tax Gap
Derived taxable income from economic activity Plus:
Allowance made in national accounts for non-reporting of income Less:
Reported taxable income from economic activity
Income tax gap.
Derived Taxable Income from Economic Activity
Table 6.5 below provides the calculations involved in deriving, for Australia,
taxable income arising from economic activity from national accounting sources
for the years of 1994/95, 1995/96 and 1996/97.
130

Table 6.5 Estimates of taxable income arising from economic activity, Australia, 1994/95,1995/96 and 1996/97 (A Sbillions)
Year 1994/95 1995/96 1996/97
Gross National Income Less:
Consumption of fixed capital Inputed income from dwelling rent
Adjusted Net National Income
Less: Income of public non-financial corporations'
Gross operating surplus Less: Consumption of fixed capital
Net income
Adjusted Net Private Income
Less: Deductions as allowed by the ATO on:
Individuals
Derived Taxable Income Arising from Economic Activity
456.3
76.9 17.7
361.7
21.3
9.1 12.2
349.5
488.9
80.6 19.2
389.1
512.9
82.4 21.2
409.3
19.4 19.6
6.9 6.5 12.5 13.1
376.6 396.2
6.5
343.0
13.1 13.6
363.5 382.6
' In excluding public sector income, which is non-taxable, only income of public non-financial corporations is considered. In the Australian national accounts the net income of general government is set at zero, with gross income being set equal to the consumption of fixed capital (see ABS 1999 Table 2.14, p. 54). The income of public financial corporations is excluded due to unavailability of the data. Source: Author estimates based on ABS and ATO data (see text).
In calculating Adjusted Net National Income (NNI) for Ausfralia for the years of
1994/95, 1995/96 and 1996/97, the starting point is Gross National Hicome or
GNI. Consumption of fixed capital or depreciation (excluding general government
and public sector enterprises) is then deducted for these years, as is the imputed
income for dwelling rent for owner occupiers. These data are extracted from the
national income accounts at current prices (ABS, 1999, Table 1.12 p. 32). In
deriving Adjusted Net Private Hicome, a fiirther adjustment is made for the net
income of public non-financial corporations, obtained by subtracting their
consumption of fixed capital from the gross operating surplus of non-financial
corporations (ABS, 1999, p. 46). This consumption of fixed capital by pubHc non-
131

financial corporations is estimated on the basis that 80 per cent of their net saving
consists of depreciation or the consumption of fixed capital (ABS, 1999, p. 46).
Taxable income arising from economic activity is derived by taking from
Adjusted Net Private Income the deductions that have been allowed by the ATO
in the respective years, other than for depreciation, which has akeady been
covered. Deductions as allowed by the ATO were extracted from the publication
Taxation Statistics for each of the three years. (ATO, 1996, Table P2, p. 7; ATO,
1997b, Table 3.2 p. 16; ATO, 1998, Table 3.3 p. 16). Only tax deductions in
relation to individuals are considered here, because of the difficulty of estimating
the extent of business tax deductions which are additional to the allowances made
in the national accounts to calculate gross operating surplus of companies.
Reported Taxable Income from Economic Activity
Within the Australian Tax Office, individual taxpayers may be clients of the
individuals non-business (INB), small business income (SBI) or large business
and intemational (LB&I) business lines. If gross income is equal to or greater than
$10 million, then the individual is a client of the LB&I business line. If gross
income is less than $10 million and there is business income, then the individual
is a client of the SBI line. However, the majority of the individual taxpayers,
accounting for about 74 per cent of all taxpayers, are clients of the INB business
line (ATO 1998, p. 14). INB clients are those taxpayers who receive most of their
income from salary and wages, Australian government pensions and benefits, or
investments, and who do not have any business income or deductions. As for the
companies, they are clients of either the small business income (SBI) business
line or the large business and intemational (LB&I) business line. Companies
which have total income less than $10 million and which are not public
companies are classified as small businesses and are administered by the SBI
business line. Public companies operating as bodies corporate are also clients of
the SBI business line. Companies which have total income greater than $10
million, or which are public companies not operating as bodies corporate, are
classified as large businesses and are administered by the LB&I business line
(ATO 1998, p. 56). Consistent with this organisation of the ATO, the data in
132

Table 6.6 are assembled in terms of individuals, small businesses and large
businesses.
Table 6.6 provides the results of the calculation deriving reported taxable income
arising from economic activity based on reported income to the ATO, which
includes the gross incomes of individuals (non-business), small businesses and
large businesses. These incomes come from individual taxpayers, companies,
partnerships and tmsts, and fiinds.
Individual taxpayers and corporate taxpayers are the two main contributors to
total taxable income as assessed by the ATO. It was noted that in the three years
under study, individual taxpayers (consisting of individuals with non-business
income, with small business income and with large business income) outstripped
corporate taxpayers (companies with small and large business income) in terms of
total taxable income as assessed by the ATO. The other contributors are
partnership, trusts and fund incomes.
Taxable income from individuals non-business was extracted from the ATO
publication Taxation Statistics for 1995/96, 1996/97 and 1997/98 (Table P2, p. 7;
p. 15 and p. 14) respectively. The taxable income of small businesses for these
years was also extracted from these publications Table P4 (p. 7) for 1994/95.
Taxable income for small businesses (excluding INB income) for 1995/96 and
1996/97 was derived from Tables 4.4 and 4.5 (pp. 34, 35) for both years. The
derivation involves separating the non-business income of individuals from small
business income by use of the data in these tables. This separation is not possible
for 1994-95. Taxable income of large business (Table P4, p. 8, Table 5.4, p. 41
and Table 6.3 p. 50) for 1994/95, 1995/96 and 1996/97 respectively.
133

Table 6.6 Taxable income declared to the Australian Taxation Office, 1994/95, 1995/96 and 1996/97 (A Sbillions)
Year Taxable Income as declared by: 1. Individuals: non -business* 2. Small businesses
3. Large businesses
Total Declared Taxable Income Less:
Capital gains income Benefit income Australian Govemment pensions
Total Gross Income from Economic Activity
1994/95
197.1 80.1
59.3
336.5
5.2 4.0** 4.0**
323.3
1995/96
254.0 31.8
84.0
369.8
6.3 4.6 4.2
354.7
1996/97
263.8 30.9
96.4
391.1
9.5 4.5 4.5
372.6
* Note: Business income of individuals in INB is included in line 2 in 1994/95, but for 1995/96 and 1996/97 it is included in line 1. ** Estimated value by the author. Source: Author estimates based on ABS and ATO data (see text).
In deriving total taxable income from economic activity, income from capital
gains, benefits and Australian Govemment pensions has been deducted, as the
national accounts do not however measure these incomes and hence the estimates
of derived taxable income from economic activity do not include these items.
Total taxable capital gains income for the years of 1995/96 and 1996/97 was
extracted from Taxation Statistics (ATO, 1997b, Table 11.1 p. 79 and ATO 1998,
Table 12.1, p. 93), while total net capital gains for 1994/95 were extracted from
Taxation Statistics (ATO, 1996, a sum of net capital gains from Tables P2 and P3,
p. 7 and Table P4 p. 8). As for benefits given by the govemment to individuals
and Australian Govemment pensions, the figures were extracted from the same
publication (ATO, 1997b, Table 3.1 p. 15 and 1998, Table 3.2 p. 15).
Income tax gaps in Australia
The income tax gap for Australia for the years of 1994/95, 1995/96 and 1996/97
is derived by subtracting the reported taxable income arising from economic
activity from taxation office (ATO) from the derived taxable income arising from
economic activity from national accounting sources (ABS). Since the ABS has
made allowances of about one percent of GDP for the effect of the hidden cash
economy in Australia, these allowances (as tabulated in Table 6.4) have been
134

added back to get the derived taxable income from the national accounts. The
resulting estimates are summarised in Table 6.7 below.
Table 6.7 Income tax gaps, Australia, 1994/95,1995/96 and 1996/97 (A Sbillions) Year
Taxable income from economic activity (national accounts)
Add back: ABS allowance for unreported income Derived taxable income (national accounts)
Reported taxable income from economic activity (declared to ATO)
Income tax gap
Per cent of derived taxable income
1994/95
343.0
5.1 348.1
323.3
24.8
7.1%
1995/96
363.5
5.3 368.8
354.7
14.1
3.8%
1996/97
382.6
5.5 388.1
372.6
15.5
4.0%
Source: Estimates of the author, derived firom Tables 6.4, 6.5 and 6.6.
Based on these calculations, the income tax gap for Australia for the years of
1994/95 to 1996/97 ranges from A$14.1 billion in 1995/96 to A$24.8 bilHon in
1994/95. While these are large numbers, they represent modest proportions of
derived taxable income in these three years, from 3.8 per cent in 1995/96 to 7.1
per cent in 1994/95, with an average for the three years of 5.0 per cent. While
these estimates must be treated with considerable caution, for the reasons noted in
Section 6.3.1 above, they do suggest that tax compHance is relatively high in
Australia, and that the taxation compliance programs of the ATO have been
relatively successfiil.
6.3.5 Lessons of the gap approach estimates for the U.S. and Australia
One of the main reasons for exploring, in this study, examples of the gap
approach to assessing the level of taxation non-compliance in the U.S. and
Australia is to test the applicability of tiiis method in developed countries with
fairly sophisticated data systems. This test could be expected to throw light on the
applicability of this approach to a developing country such as Malaysia, where
statistical information systems are not so well developed.
135

Three conclusions emerge from the analyses of this Section. One is that this
method does seem to give sensible and consistent results for the two developed
countries. In the case of the U.S., where the use of the technique is most advanced
and the data sources in relation to personal income are most detailed, the method
generates a consistent and slowly changing estimate of the adjusted gross income
gap over a period of nearly forty years. Secondly, the value of this method in
assessing the level of tax non-compliance depends substantially on the quality and
availability of data, especially national accounts data drawn from sources separate
from the national taxation collections. Thirdly, these two conclusions suggest that
such a method might well throw light on the level of tax non-compliance in
Malaysia, but that the specific results of any Malaysian estimate may be heavily
qualified by issues conceming data availability. It is on this basis that we proceed
to apply the gap approach to Malaysia.
6.4 Estimating the Overall Taxable Income Gap for Malaysia
6.4.1 Calculating the taxable income gap
Gross domestic product or GDP can be measured in three theoretically equivalent
ways, namely as the sum of value added, as the sum of final expenditures and as
the sum of incomes. However, in Malaysia, the Department of Statistics compiles
annual GDP estimates using the sum of value added and the sum of final
expenditure approaches. This is a major initial limitation in applying the gap
approach to Malaysia, as it is the income approach to the national accounts which
has provided much of the data used in the U.S. and Australian estimates above. It
is also a reason why, in applying the gap approach to Malaysia, we follow the
Australian estimates above and seek to estimate the gap in overall taxable income.
The detailed income data required are not available to attempt to replicate the
U.S. exercise on personal income.
However, the Malaysian national accounts do include an estimate of the Gross
National Hicome (GNI) of Malaysia for the years of 1995, 1996 and 1997. GNI is
a measure of the total income, before adjusting for the consumption of fixed
capital, accming to all Malaysian residents in the years in question. This is our
starting point, and we have exfracted GNI for Malaysia for these years based on
136

the national accounts figures (Department of Statistics, Malaysia; 1999a, Table
2(a), p. 7).
Hi making the adjustments to GNI to obtain an estimate of derived taxable income
arising from economic activity for Malaysia (c.f Table 6.5 for Ausfralia) the first
issue is depreciation or the consumption of fixed capital. There are no data on the
consumption of fixed capital available for Malaysia. To make an estimate, we
have assumed that the ratio of the consumption of fixed capital to GNI in the
Australian data is also applicable to the Malaysian data. This assumption can only
be regarded as providing an order of magnitude estimate, as the capital stmctures
of the two economies may differ significantly.
The second adjustment required in line with the methodology of Table 6.5 is to
exclude income accming to non-taxable (public) enterprises. While the national
accounts for Malaysia do not provide such information, estimates were provided
to the author by the Ministry of Finance, Malaysia. Non-Financial Public
Enterprises (NFPEs) are public sector agencies undertaking the sale of industrial
and commercial goods and services. NFPE's includes statutory bodies.
Government-owned and/or Govemment controlled companies and agencies
owned by statutory bodies, whereby Govemment or a public-sector agency
controls more than 50 per cent of total equity. However, only non-taxable income
(that of enterprises owned wholly by the govemment) has been considered here.
This income is deducted in Table 6.8, to derive a measure of net private income.
Finally, taxable income from economic activity in these three years is derived by
subtracting all the deductions as allowed by the IRD/IRB (other than
depreciation) for the respective years. Table 6.8 below provides the calculations
estimating the total derived taxable income from economic activity in Malaysia
for the years of 1995, 1996 and 1997.
137

Table 6.8 Estimates of taxable income arising from economic activity, Malaysia, 1995,1996 and 1997 (RM billions)
Year Gross National income (GNI) Less: Depreciation (consumption of fixed capital) Net National income Less: Income accming to non taxable (public) enterprises Net Private Income Less: Deductions as allowed by the IRD/IRB (other than depreciation) Derived taxable income from economic activity
1995 212.1
37.0 175.1
2.2 172.9
13.4
159.5
1996 241.9
39.9 202.0
2.7 199.3
11.8
187.5 Source: Author estimates based on data from the IRB Statistics and the Ministry (
1997 266.8
42.9 223.9
3.2 220.7
13.6
207.1 )f Finance (see
As for taxable income as reported to IRD/IRB for the years of 1995, 1996 and
1997, the data are extracted from IRD/IRB 1995, 1996 and 1997 Taxation
Statistics and are Hsted as in Table 6.9 (IRD, 1996; IRB 1997b; IRB 1998c).
In deriving reported taxable income from economic activity for individuals in
Malaysia for the years of 1995, 1996 and 1997, total deductions as allowed by the
IRD/IRB for the respective years were deducted from the total amount of income
as reported to the IRD/IRB.
Capital gains income (except real property gains income) and govemment
pensions are not taxable in Malaysia, so that adjustments for these factors are not
included in Table 6.9 other than for real property gains. Real property gains and
estate duty incomes should be deducted from the total income in deriving reported
taxable income from economic activity, but there are substantial problems with
data availability. These two types of direct taxes are assessed manually, and the
IRD/IRB only provide information on the total amount of tax collected by these
taxes for the years in question. Thus the total amount of taxable income for these
two types of direct taxes is not available to be deducted from the total of income
as reported to the IRD/IRB.
138

Table 6.9 Taxable income declared to the IRD/IRB, 1995,1996 and 1997 (RM billions)
Year a) Individuals - gross income
Less: Total deductions allowed to individuals
Individuals - taxable income
b) Taxable trust income
c) Taxable clubs and associations
d) Taxable Hindu joint family income
e) Taxable companies income
f) Taxable cooperatives income
Total taxable income
Less: Estimated taxable income on real property gain;
and estate duty Reported taxable income from economic activity
1995 49.4
13.4
36.0
0.3
0.06
0.001
50.1
0.1
86.6
2.4
84.2
1996 47.0
11.8
35.2
0.3
0.09
0.001
61.9
0.2
97.7
2.9
94.8
1997 53.9
13.6
40.3
0.3
0.1
0.001
69.5
0.2
110.4
2.4
108.0
1998c, p. 4).
As seen in Table 6.1 earHer, estate duty was only coHected prior to 1996, because
this source of income was only taxable prior to 1 Nov. 1991. Thus, the amount of
tax collected in 1996 was in relation to income of estate duty eamed before this
date. As for real property gains income, it contributed about one per cent of the
total direct taxes in 1995 and 1997 and about two per cent in 1996. Thus in
considering the effects of the real property gains income in the above calculations
of the gaps, we have to estimate the total taxable income of this income based on
the amount of taxes collected in these three years. The tax rates imposed by the
IRB on disposal of the assets on or after 27 October 1995 are as in Table 6.10
below.
139

Table 6.10 Tax rates for disposal of real property gains income for Malaysia Category of disposal
Disposal within 2 years Disposal within 3̂**. year Disposal within 4*.year Disposal within 5*. Year Disposal within 6"̂ .year
Company (per cent) 30 20 15 5 5
Individuals & other person (per cent) 30 20 15 5 NIL
Source: Inland Revenue Board of Malaysia.
The total amount of tax on real capital gains tax collected in the years of 1995,
1996 and 1997 amounted to RM 0.4 billions, RM 0.5 billions and RM 0.4 billions
respectively (IRD/IRB 1996, p. 82; 1997a, p. 16; 1998a, p. 16). Assuming that the
timing of property disposal was such that this tax was assessed at the average rate
of about 17 per cent (see Table 6.10), the approximate taxable income in respect
of real property gains would be about RM 2.4 bilHons, RM 2.9 biHions and RM
2.4 billions in the years of 1995, 1996 and 1997 respectively. These amounts are
deducted from total taxable income to derive reported taxable income from
economic activity in Table 6.9.
Table 6.11 Income tax gap, Malaysia in 1995,1996 and 1997 (RM billions) Year Derived taxable income from economic activity Reported taxable income from economic activity
Income tax gap
Gap as proportion of derived taxable income
1995 159.5 84.2
75.3
47.2%
1996 187.5 94.8
92.7
49.4%
1997 207.1 108.0
99.1
47.8%
Source: Estimates of the author, derived from Tables 6.8 and 6.9.
The resuHing estimates of the taxable income gap for Malaysia for the years
1995-97 are shown in Table 6.11. In value terms they range from RM 75.3 bilHon
in 1995 to RM 99.1 bilHon in 1997; in proportional terms they He between 47.2
per cent and 49.4 per cent of the derived taxable income to the IRD/IRB in the
three years under study. That is, about 48 per cent of derived taxable income is
not captured in reported taxable income in Malaysia. By comparison, the
estimates of the income tax gap for Australia, for broadly the same three years, lie
between A$14.1 billion and A$24.8 billion, or between 3.8 per cent and 7.1 per
cent of its derived taxable income (Table 6.7). Thus the estimates prepared for the
two countries, using a similar methodology, suggest that the income tax gap is
very much higher in Malaysia than in Ausfralia, in proportional terms. The
140

explanation of this fact is the main issue that we now address in the remainder of
this chapter.
6.4.2 Comments on the gap approach used for Malaysian and Australian
data
Before considering the broader factors involved in the explanation of the very
high income tax gap in Malaysia, some more technical matters need to be noted.
No adjustments have been made in the Malaysian data for official estimates of
non-compliance, because the Department of Statistics of Malaysia does not
consider the presence of the hidden cash economy in estimating its GDP as does
its Australian counterpart. On the other hand, the ABS has made an allowance in
the Australian National Accounts for the understatement of income in each year,
as noted above.
Some assumptions, and inevitably some errors, have been introduced in estimating
the income tax gaps for both Australian and Malaysian data. These cannot be
entirely avoided, given the limitations of data from the national accounts and
taxation offices. As mentioned earlier, in the case of Australian data, we have
ignored the income of public financial corporations in deriving the taxable income
arising from economic activity (based on the national accounts), as the data are
not available. Further, we have assumed that the consumption of fixed capital by
public non-financial corporations is 80 per cent of their net saving, because we do
not have the data on consumption of fixed capital by these corporations in the
three years under study.
For the Malaysian estimates, we have estimated the total amount of taxable
income arising from real property gains income in deriving the taxable income
from economic activity, because direct data are not available. These type of
income is assessed manually by the IRD/IRB. It does not keep records on taxable
income in respect of real property gains, but only keeps records on total tax
collected. Furthermore, we also have estimated the consumption of fixed capital
(depreciation) for Malaysia in the above data based on the assumption of the same
ratio of consumption of fixed capital to GNI as is revealed in the Australian data.
We made such an assumption because there is no estimate of the consumption of
fixed capital available in the Malaysian data. Hence there are some possible errors
141

which have been introduced in estimating the above income tax gaps for both
AustraHan and Malaysian data. But the differences in the proportional income tax
gaps for Malaysia and Ausfralia (and also for Malaysia and the U.S., by
implication from the personal income measures for the US noted above) are so
substantial that these and other errors and assumptions will not distort this central
finding.
6.5 Interpreting the Taxable Income Gap - Coverage or Non-Compliance
6.5.1 Interpreting the taxable income gap
The estimates provided above imply that only about 52 per cent of derived taxable
income in Malaysia is in fact subject to tax, by comparison with about 95 per cent
for Ausfralia. This in tum means that a very substantial part of Malaysia's
potential taxing capacity is unutilised, by comparison with the position in
Australia, and hence that, for a given level of govemment expenditure, tax rates
on income currently subject to tax are higher than might otherwise be the case.
There are two potential reasons for a low ratio of actual to derived taxable
income. One is coverage: the possibility that the coverage of the taxation law is
limited, so that a significant proportion of derived taxable income is not legally
liable for tax. The other is non-compliance: the possibility that a significant
proportion of derived taxable income, while legally liable for tax, is subject to
non-compliance and does not in fact lead to tax being paid. Given the focus of this
thesis on non-compliance, it is important to form some view on the extent to
which coverage rather than non-compliance provides an explanation for the very
high level of the taxable income gap in Malaysia. Thus we investigate the issue of
coverage in the next two sections. The discussion must inevitably be brief, and
coverage is a topic that could be the subject of a fiill additional study.
6.5.2 Coverage of personal income taxation
The available evidence suggests that, relative to developed countries such as
Australia, the coverage of personal income taxation in Malaysia is quite low. This
is, of course, to be expected in a developing countries, where corporate income
taxes tend to be more important than taxes on personal incomes, while the reverse
142

is tme in developed economies (Burgess and Stem, 1993). We do not here
examine the coverage of personal income tax in Malaysia relative to that in other
developing countries.
One simple indicator of the coverage of the personal income tax system is the
ratio of the number of taxable individuals to the number of employed persons.
This indicator should, of course, be freated with care, for many factors other than
the level of employment affect the number of individuals paying tax. Thus in
AustraHa, for example, many individuals not working but living on retirement
incomes or incomes from assets are subject to tax. It should also be remembered
that coverage in terms of individuals is very different to coverage in terms of
income, for if many persons on low incomes are not required to pay tax the
aggregate income foregone may be modest. In addition, in Malaysia it is possible
for a married couple to elect to be taxed as a household (combined assessment),
while this is not possible in Ausfralia. Nevertheless, the figures shown in Table
6.12 are striking. For the three years under study, the average ratio of the number
of taxable individuals to the number of persons employed was 17.5 per cent in
Malaysia and 97.6 per cent in Australia. By this measure, the coverage of personal
income tax is much lower in Malaysia than in Australia.
Table 6.12 Ratio of taxable individuals for Malaysia and Australia for the three years un(
Country Year No. of employed individuals ('000s) No. of taxable individuals ('000s) Ratio (%)
er study Malaysia 1995 7645
1547
20.2%
1996 8400
1275
15.2%
1997 8569
1459
17.0%
Australia 1995 8218
7861
95.7%
1996 8320
8200
98.6%
1997 8316
8200
98.6% Source: Malaysia: Taxation Statistics, various years and Intemational labour Office 1998, p. 108; Australia: ATO, Taxation Statistics, various years and ABS Labour Statistics (August data) for various years.
In large part, this low coverage in Malaysia can be explained by the stmcture of
the income tax system, relative to the stmcture of the incomes of Malaysian
households. In 1995 the average household income in Malaysia was RM24,084
(Department of Statistics, 1997) and it is likely that, as is common with most
national income distributions, the median income was significantly below the
143

mean. Thus we can conclude that in 1995 considerably more than 50 per cent of
Malaysian households had incomes of less than RM24,000.
Table 6.13 Selected personal income tax deductions allowable, Malaysia, 1998 Type of deductions
1. Self and Dependent 2. Disabled Individual 3. Disabled Wife 4. Fees for education in scientific technology or vocational (Max) 5. Medical expenses for parents (Max) 6. Medical expenses on serious diseases individual, spouse and children (Max) 7. Purchases of basic supporting equipment for disabled person (Max) 8. Wife/Wives 9. Child relief® RM800
Amount allowed (RM) 5000 5000 2500
2000 5000
5000
5000 3000 (No limit number of child).
Source: ERB 1998a, p. 183.
The Malaysian income tax system includes a relatively generous set of deductions
(or 'reHefs'), a tax free threshold of RM2500 and a number of rebates. Some of the
available deductions are shown in Table 6.13. If we assume that median
household income in Malaysia in 1995 was RM20,000, then deductions for the
husband, wife and (say) three children alone would amount to RMl0,400, or 51
per cent of median income. Taken together with the RM2,500 threshold, 63.5 per
cent of median income is already not subject to tax. Hi many cases, the availability
of further deductions may mean that no income is subject to tax.
In a recent publication, the Malaysian IRB has given a hypothetical example of the
tax position of a family (IRB 1998a, pp. 152, 153). The husband is an employee and
receives a salary of RM 18,000 per annum, while paying RM 3,500 for Employees'
Provident Fund (EPF) and insurance. His wife is a housewife but she receives rental
income of RM 2,000 from a house (given to her by her father). They have four
children, all below 18 years of age, and claim RM950 for medical expenses for the
husband's parents. The wife elects for combined assessment. The broad outline of
the resulting tax assessment is shown in Table 6.14. The key point is that this
family, with an income of RM20,000, close to the median household income in
144

1997, is not subject to tax, after consideration of deductions, the tax free threshold
and rebates.
Table 6.14 Example of tax computation for household with combined assessment in Malaysia for year 1997
RM
Total income 20,000 Less: Deductions
Personal 5000 Medical expenses for parents 950 Wife 3000 Children (RM800 x 4) 3200 E.P.F. and Insurance Premium 3700 Total Deductions 15,850
Chargeable Income 4,150
Tax on first RM2500 0
Tax on RM 1,650 @ 2% 33
Income Tax Chargeable 33
Less: Rebates Self 110.00
Wife 60.00 (Restricted 33)
Total Tax Payable Nil
Source: Inland Revenue Board of Malaysia 1998a, pp. 152-3.
In addition to these deductions and rebates against personal income, the
Malaysian income tax system provides for a range of exemptions of types of
personal income from tax, more generous than those in Australia. Section 127 of
the Malaysian Income Tax Act empowers the Minister of Finance to declare
exemptions from income tax and states that the income specified in Part 1 of
schedule 6 shall be exempt from tax. Some of them include:
• Donations received by approved charitable institutions.
• Pensions upon retiring from employment.
• Compensation for loss of employment and restrictive covenants.
• Certain types of interest income, such as govemment bonds and savings
certificates.
145

• Hicome of an approved pension/provident fiind.
• Scholarships;
• Retirement gratuities;
• Business profits enjoying tax incentives, as discussed below in the case of
companies.
Capital gains (except for gains on the disposal of real property) are also exempt for
tax in Malaysia, as noted above. Real Property Gains Tax is charged on gains arising
from the disposal of real property situated in Malaysia or of interest, options or other
rights in or over such land as well as the disposal of shares. However, as also noted
earlier in the chapter, income from capital gains is not captured in the measure of
derived taxable income estimated from national accounts data.
6.5.3 Coverage of company taxation
As a developing country, Malaysia provides several tax incentive programs, both
direct and indirect, such as in the manufacturing, agriculture and tourism sectors.
These are provided primarily under the Promotion of Investments Act 1986,
Income Tax Act 1967, Customs Act 1967, Sales Tax Act 1972 and Excise Act
1976. In a range of respects they are more generous than those in Australia. Many
of these also have the effect of exempting income from tax, and hence reducing
reported taxable income, rather than lowering the rate of tax.
The direct incentives are designed to grant partial or total relief from the payment
of corporate income tax for a limited period of time, while the indirect incentives
are given in the form of exemptions from import duty, sales tax and excise duty.
Some of the direct incentives provided by the Malaysian Govemment are
discussed below (Malaysian Industrial Development Authority [MIDA], 1999, pp.
1- 22).
6.5.3.1 Incentives for the manufacturing sector
The major incentives for companies in the manufacturing sector are the Pioneer
Status and Hivestment Tax Allowance (ITA) and Reinvestment Allowance (RA).
Eligibility for either Pioneer Status or Hivestment Tax Allowance is determined
according to priorities, termed as 'promoted activities' or 'promoted products', as
determined by the Minister of Intemational Trade and Industry.
146
A company granted Pioneer Status enjoys partial exemption from the payment of
income tax. It will only have to pay tax on 30 per cent of its statutory income. The
period of tax exemption is five years, commencing from the Production Day as
determined by the Minister of Intemational Trade and Industry. There is also an
added incentive for companies that are located in the States of Sabah, Sarawak,
the Federal Teritory of Labuan,^ and the designated "Eastem Corridor" of
Peninsular Malaysia (covers Kelantan, Terengganu, Pahang and the disfrict of
Mersing in Johor), whereby they have to pay tax only on 15 per cent of their
statutory income during the tax exemption period of five years.
A company granted an Investment Tax Allowance (ITA) is given an allowance of
60 per cent in respect of qualifying capital expenditure incurred within five years
from the date on which the first qualifying capital expenditure is incurred. The
allowance can be utilised to offset against 70 per cent of the statutory income in
the year of assessment. Any unutilised allowance can be carried forward to
subsequent years until the whole amount has been used up. The balance of 30 per
cent of the statutory income will be taxed at the prevailing company tax rate. As
with Pioneer Status, there is also an added incentive for companies located in the
States of Sabah, Sarawak, the Federal Territory of Labuan^ and the "Eastem
Corridor" of Peninsular Malaysia. They are granted an allowance of 80 per cent in
respect of the qualifying capital expenditure incurred. The allowance can be
utilised to offset against 85 per cent of the statutory income in the year of
assessment.
A Reinvestment Allowance (RA) is granted to manufacturing companies which
have been in operation for at least 12 months and incur quaHfying capital
expenditure for the expansion of production capacity, modemisation and
upgrading of production facilities, and diversification into related products and
automation of production facilities. The RA is in the form of an allowance of 60
per cent of capital expenditure incurred by the companies. The allowance can be
utilised to offset against 70 per cent of the statutory income in the year of
assessment. Any unabsorbed allowance is allowed to be carried forward to the
following years until it is fiilly utilised. An RA will be given for a period of five
(5) years beginning from the year the first reinvestment is made. The RA can only
147

be claimed on completion of the quaHfying project i.e. after the building is
completed or when the plant/machinery is put to operational use. However, assets
acquired from the reinvestment cannot be disposed within two years of
reinvestment.
6.5.3.2. Incentives for high technology companies
High technology companies are defined as companies engaged in promoted
activities or in the production of promoted products in areas of new and emerging
technologies. They must fulfil the following criteria:
Local research and development (R&D) expenditure to gross sales should be at least
1 per cent on an annual basis. However, companies are allowed a period of three
years from the date of operation/commencement of business to comply with this
requirement. The percentage of science and technical graduates to total workforce
should be at least 7 per cent.
High technology companies are eligible for the following incentives:
1) Pioneer Status with fiill tax exemption at statutory income level for a period
of five years; or
2) Investment Tax Allowance of 60 per cent on qualifying capital expenditure
incurred within a period of five years. The allowance can be offset against
the statutory income for each assessment year without any restriction.
6.5.3.3 Incentives for strategic projects
Sfrategic projects are generally defined as projects involving products/activities of
national importance. They usually involve heavy capital investments with long
gestation periods; have high levels of technology and are integrated; generate
extensive linkages and generally have significant impact on the economy. Such
projects are eligible for the following incentives:
1) Pioneer Status with fiill tax exemption at statutory income level for a
period of 10 years; or
2) Investment Tax Allowance of 100 per cent on qualifying capital
expenditure incurred within a period of five years. The allowance can be
148

offset against the statutory income for each assessment year without any
restriction.
6:5,.3.4 Incentives for the agricultural sector
Under the Promotion of Investments Act 1986, the term "company" in relation to
agriculture includes agro-based cooperative societies and associations, and sole
proprietorships and partnerships engaged in agriculture. Companies producing
promoted products or engaged in promoted activities are eligible to apply for
Pioneer Status and for the Investment Tax Allowance.
In enabling agricultural projects to enjoy greater benefits, the Malaysian
Govemment has broadened the definition of qualifying capital expenditure to
include the following:
A) The clearing and preparation of land;
B) Planting of crops;
C) Provision of plant and machinery used in Malaysia for the purposes of
crop cultivation, animal farming;
D) Aquaculture, inland or deep-sea fishing and other agricultural or pastoral
pursuits;
E) Constmction of access roads including bridges, the constmction or
purchase of buildings (including those provided for the welfare of persons
or as living accommodation for persons) and stmctural improvements on
land or other stmctures which are used for the purposes of crop cultivation,
animal farming, aquaculture, inland fishing and other agricultural or
pastoral pursuits. Such roads, bridges, buildings, stmctural improvements
on land and other stmctures should be on land forming part of the land
used for the purpose of such crop cultivation, animal farming, aquaculture,
inland fishing and other agricultural or pastoral pursuits.
Hi view of the time lag between start-up of the agricultural project and processing
of the produce, integrated agricultural projects are eligible for an ITA for an
additional five years for expenditure incurred for processing or manufacturing
operations.
149
6.5.4 Coverage of the Malaysian income tax system
Thus, while this discussion of coverage is far from complete, it is evident that the
coverage of the Malaysian income tax system is much lower than in Australia and
other developed countries. In part, this difference is due to the current stage of
development of the Malaysian economy, but it is also partly due to specific features
of Malaysia's economic and fiscal strategy.
It is apparent from the figures on different types of taxable income analysed
above, (Table 6.9) that the IRB in Malaysia depends more on corporate income
taxes than on individual income taxes, while the reverse is tme for the ATO.
Hence this confirms the finding of Burgess and Stem (1993, pp. 762-830) that
corporate income taxes are more important than taxes on the incomes of
individuals in developing countries, while in developed countries taxes on
incomes are more important. They argued that the constraints on raising revenue
through personal income taxation in developing countries are many, including
problems of measurement, administrative capability, low literacy, and poor
accounting. An economic stmcture dominated by agriculture and small-scale
(often unregistered) enterprises makes personal income difficult to trace, and
hence to tax these incomes (see Musgrave 1969; Goode 1984; Bird and Oldman
1990). As a result, revenue from this source in developing countries tends to
accme largely from taxes on the wages of employees in public-sector enterprises
and foreign corporations to whom tax laws can be more easily applied. Collection
from such a narrow base, often at high rates, creates resistance which is apparent
in the experience of a number of countries (see GilHs 1989; Tanzi 1991). On the
contrary, in industrial countries, wage and salary employment is more widespread
and the capability to tax eamed incomes outside this net, for example those of
self-employed persons is greater. This partly explains the greater importance of
individual income taxation in revenue for developed or industrialised countries.
6.6 Conclusion
The central finding of this chapter is that the income tax gap in Malaysia,
calculated in terms of a methodology validated by its application to AusfraHan
and US data, amounted to about 48 per cent of derived taxable income. That is,
only about 52 per cent of derived taxable income, estimated primarily from
150
national accounting sources, is captured in reported taxable income in Malaysia.
This is very much lower than the comparable figures of about 95 per cent for total
income tax in AustraHa and of about 88 per cent for personal income in the U.S.
Indeed, it is so low that it must be regarded as highly likely that both of the
possible explanations - low coverage and a high level of non-compliance - are
significant contributing factors to the outcome.
While some aspects of the low coverage of the Malaysian income tax system,
relative to that in Australia and other similar countries, have been documented in
this chapter, it has not been possible to quantify the relative contributions of low
coverage and high non-compliance to the explanation of the central finding of this
chapter. Thus the finding that only 52 per cent of derived taxable income in
Malaysia is subject to tax provides a strong indicator of a substantial level of
income tax non-compliance, but does not lead to a quantitative estimate of this
level. Thus in the next chapter we consider other indicators of the level of tax
non-compliance in Malaysia.
151

CHAPTER SEVEN
Other Approaches to Assessing the Level of Tax Non-Compliance in Malaysia
7.1 Introduction
Chapter Six presented the gap approach in an attempt to measure the extent of
income tax non-compliance in Malaysia and Australia. In principle, this approach
enables one to compare the level of income tax non-compliance between these two
different countries on a broad perspective. It was found that the proportion of
potential taxable income on which tax is paid is much lower in Malaysia compared
with Australia, and that this is likely to be due to both the low coverage and to a
significant level of non-compliance with that tax regime. It was not possible,
however, to derive a quantitative measure of the level of non-compliance, and
hence of the relative importance of non-compliance and low-coverage. Hence this
chapter uses other methods to throw light on the extent of income tax non
compliance in Malaysia.
Two specific approaches are used in this chapter. Firstly, the failure to submit
annual tax retums to the IRB is used as a quantitative indicator of the level of non
compliance. Secondly, the other specific approach used involves surveying the
opinions of taxation officers about the extent of non-compliance in this country.
Each of these approaches is far from perfect, but together they may give some
more direct indication of the level of this problem in Malaysia.
7.2 Description of the Personal Income Tax System in Malaysia
Peninsular Malaysia has a "preceding year" basis of assessment. The basis year
refers to the calendar year immediately preceding a year of assessment. The year
of assessment mns from 1 January to 31 December annually. Thus for instance the
Year of Assessment 1998 refers to the 12 months from 1 January 1998 to 31
December 1998. The basis year for the Year of Assessment 1998 is the 12 months
from 1 January 1997 to 31 December 1997. This means that the profits or income
received in 1997 will be assessed in the Year of Assessment 1998. Hi Sabah and
152

Sarawak, the pay-as-you-eam or PAYE system has been operating since 1968.
Based on the 1999 budget decision announced by the Finance Minister 1 in
October 1998, the Peninsular Malaysia began operating in PAYE system in 1999.
7.2.1 Income tax returns and related offence
Income tax retum forms are issued to taxpayers in late January of each year under
Section 77(1) of the Income Act 1967 (Act 53). The IRB issues the atmual tax
retums based on its master Hsts, which include:
A. Past registered taxpayers, addressed to the latest address that the IRB has
on its records,
B. Voluntarily declared taxable taxpayers.
C. Names of non-registered taxpayers that have been compiled by a special
unit of IRB in each of its assessment branches {IV Unit), whose main duty
is to collect any information regarding payments received by these
taxpayers, and are individuals likely to be taxable and but whose names
do not appear in the lists. For example information may be obtained from
lists of contract payments made by some organisations to its contractors.
D. Names provided by an employer unit {EIV Unit) in each of the IRB
assessment branches, which is responsible for registering new tax file
number for non-registered employees through cooperation with their
employers.
These annual tax retum forms must be duly completed and retumed with business
accounts (if any) to the IRB within 30 days from the date indicated on the retum
forms or such extended period as agreed by the Director General. Under Section
77(2) taxpayers who have not received retums within three months of a given year
must, within 14 days of April, inform the IRB of the same. An offence is
committed under the Income Tax Act 1967 if taxpayers
A. fail (without reasonable excuse) to submit a completed tax retum within the
appropriate time limit (as in para 1.7);
B. (without reasonable excuse) to give notice of chargeability to tax within the
appropriate time limit (as in para 1.5).
153

Persons or organisations which receive a form are required to submit a retum even
though in their assessment their income is not sufficient to make them subject to
tax.
Notify charzeability to tax
If a taxpayer is taxable and has never received any income tax retum before, he or
she must notify the chargeability to the nearest IRB office and request an income
tax retum. Similarly, if a taxpayer already has an income tax file but has not
received an income tax retum by 31 March in the year, he or she must
immediately write in to the IRB office (which issued the last retum) for a retum
for the relevant year. As a registered taxpayer, he or she must also inform the IRB
office of any change in the address within three months from the date of change.
An offence is committed by a taxpayer if he or she does any of the following
actions:
A. Makes an incorrect tax retum by omitting/understating income.
B. Gives incorrect information in matters affecting the tax liability of oneself
or some other person.
C. Attempts to leave the country without payment of tax, when certificates
have been issued to prevent the person from leaving the country for non
payment of outstanding taxes.
D. Obstmcts any authorised officers of IRB in carrying out his or her duties.
E. Fails (without reasonable excuse) to comply with a notice asking for certain
information as required by the IRB.
If a taxpayer commits an offence, he or she can be prosecuted or subject to a
penalty. On conviction he or she can be liable to a fine or/an imprisonment and in
some instances to a special penaHy. However, an offence also can be compounded
by the IRB office that issued the summon if the taxpayer manage to give
satisfactory reason/reasons for his or her failure to comply.
The type of annual tax retums mailed to taxpayers depend on the nature of income
they receive. Altogether there are five types of annual tax retums issued to various
categories of taxpayers. They are as categorised below:
1) Form BE for individual taxpayers who receive only employment income.
154

2) Form B for individual taxpayers who receive employment income and
other incomes or individual taxpayers with business income.
3) Form C for companies.
4) Form CI for co-operative societies and
5) Form T for tmst/estate/body of persons such as the Hindu Joint Family.
Thus there are two types of forms to be completed by personal taxpayers, (BE and
B) one of which has to be completed by a given individual taxpayer according to
the character of his or her income source. Individual taxpayers are registered
within the IRB under two different groups. They are the SG group (salary eamers),
while the OG group (other groups) includes company directors, self-employed
taxpayers or non-salary eamers. Hence the SG taxpayers are mailed with either
Form BE or B, while the OG taxpayers are mailed only with Form B. Hence the
type of form mailed to individual taxpayers could be summarised as below:
Form BE - specifically for one source income eamers of salaries or wages
income only, and these taxpayers are registered under SG group.
FormB - business income with or without salary or wages income,
investment income with or without salary or wages or business
income. This type of form is mailed to either SG group (salary
eamers with other income or incomes) or OG group.
7.3 Failure to Return Annual Tax Forms among Registered
Taxpayers Using this distinctive aspect of the Malaysian tax system, it is possible to obtain
some indication of the extent of income tax non-compliance is by referring to
registered taxpayers who fail to submit their annual tax retums to the taxation
authority. Every year the IRB issues income tax annual retums to registered
taxpayers that are likely to be taxable, based on information contained in its
master Hsts (see Section 7.2.1 above).
At the end of January to Febmary of each year, the IRB issues annual tax retums
to its registered taxpayers and other identified individuals or organisations in
stages. If taxpayers do not receive their annual tax retums by 1 March in each
year, they are required to contact the IRB branch that handles their income tax file
155
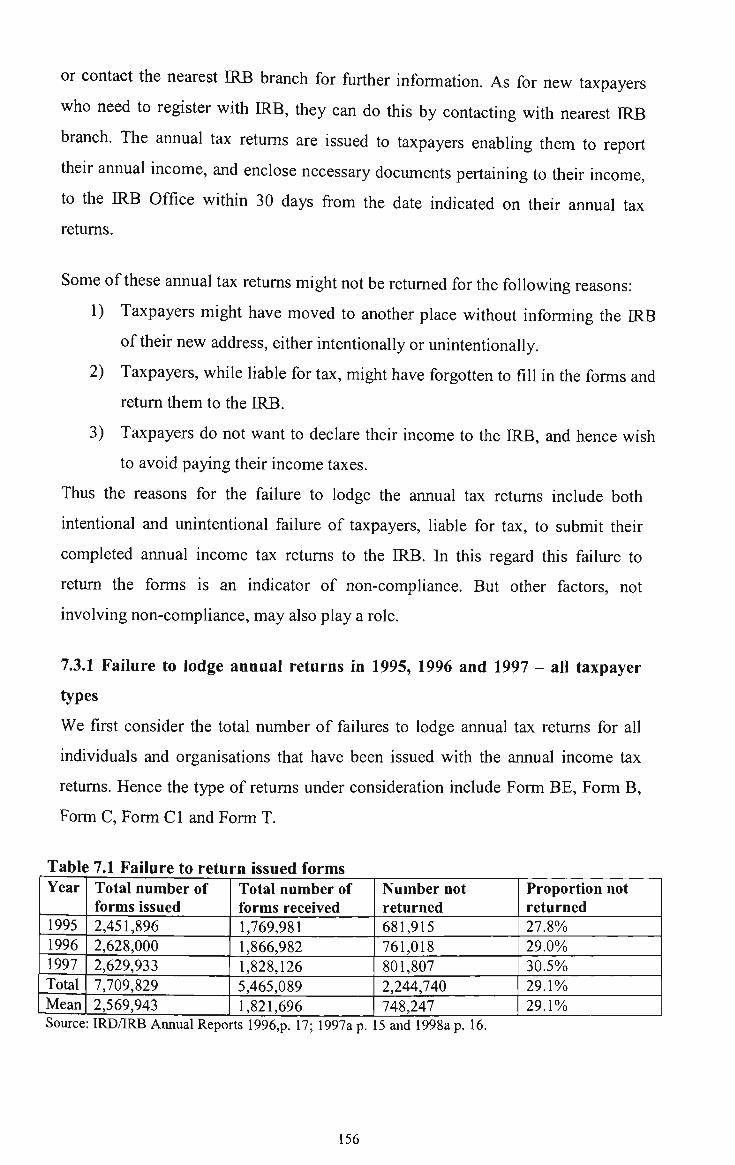
or contact the nearest IRB branch for fiirther information. As for new taxpayers
who need to register with IRB, they can do this by contacting with nearest IRB
branch. The annual tax retums are issued to taxpayers enabling them to report
then annual income, and enclose necessary documents pertaining to their income,
to the IRB Office within 30 days from the date indicated on their annual tax
retums.
Some of these annual tax retums might not be rettimed for the following reasons:
1) Taxpayers might have moved to another place without informing the IRB
of their new address, either intentionally or unintentionally.
2) Taxpayers, while liable for tax, might have forgotten to fill in the forms and
retum them to the JRB.
3) Taxpayers do not want to declare their income to the IRB, and hence wish
to avoid paying their income taxes.
Thus the reasons for the failure to lodge the annual tax retums include both
intentional and unintentional failure of taxpayers, liable for tax, to submit their
completed annual income tax retums to the IRB. In this regard this failure to
retum the forms is an indicator of non-compliance. But other factors, not
involving non-compliance, may also play a role.
7.3.1 Failure to lodge annual returns in 1995, 1996 and 1997 - all taxpayer
types
We first consider the total number of failures to lodge annual tax retums for all
individuals and organisations that have been issued with the annual income tax
retums. Hence the type of retums under consideration include Form BE, Form B,
Form C, Form CI and Form T.
Table 7.1 Failure to return issued forms Year
1995 1996 1997 Total Mean Source
Total number of forms issued 2,451,896 2,628,000 2,629,933 7,709,829 2,569,943
: IRD/IRB Annual Repo
Total number of forms received 1,769,981 1,866,982 1,828,126 5,465,089 1,821,696
rtsl996,p. 17; 1997a p.
Number not returned 681,915 761,018 801,807 2,244,740 748,247
15 and 1998a p. 16.
Proportion not returned 27.8% 29.0% 30.5% 29.1% 29.1%
156

Table 7.1 above shows total number of annual retums (known as retum forms in
Malaysia) issued by the IRB and total number of completed retum forms received
by the IRB for the years of 1995, 1996 and 1997 for all taxpayers registered in the
IRB. It includes forms issued to individuals, tmst, clubs and associations, Hindu
Joint Family, companies and co-orperatives. The proportion not retumed indicates
the extent of failure to submit annual tax retums by all registered taxpayers and
other identified individuals and organisations in Malaysia for the years of
1995,1996 and 1997. From Table 7.1 it can be seen that the percentage of failure
to submit the annual tax retums was 27.8 per cent in 1995, 29.0 per cent in 1996
and 30.5 per cent in 1997. It could be deduced that on the average about 29 per
cent of all registered Malaysian taxpayers (and other identified individuals and
organisations) have failed to submit their annual tax retums for the years of 1995,
1996 and 1997. There is a small increase (of approximately one percentage point)
in the non-retum rate in each year under study.
This non-retum rate is high, with about 800,000 forms sent out but not retumed in
1997. As noted, there a number of reasons other than non-compliance for non-
retum - failure to receive the form, mistakes in IRB identification, failure to retum
because in fact non-taxable, and so on. Nevertheless, such a high and persisting
non-retum rate is another indicator of income tax non-compliance in Malaysia.
7.3.2 Non-compliance in 1995, 1996 and 1997 for individual taxpayers of the
IRB
We now tum to consider individual taxpayers for the years of 1995, 1996 and
1997. As noted above, there are two different groups of taxpayers classified under
this category. They are the OG and SG groups, with two different annual tax
retum forms mailed to them, according to the nature of income they receive. Sole-
proprietors and self-employed individuals including company directors are
registered under OG group (Other Groups) and the annual tax retums mailed to
them are known as Form B (indicated as Form B [OG] in the table below).
Hidividuals with employment and other incomes are registered under SG group
(Salary Group) and the annual tax retums mailing to them are also Form B
(indicated by Form B [SG] in the table below). Hidividuals with employment
157

income only are also registered under SG group. However, their annual tax retum
is known as Form BE and indicated as Form BE (SG) in the table below.
Table 7.2 Failure to return issued forms among individual taxpayers Type Of returns
FormB (OG)
FormB (SG)
Form BE (SG)
Year
1995 1996 1997 1995 1996 1997 1995 1996 1997
Number of forms issued
750349 784629 781686 738212 449268 498679 677449 1096169 1047263
Number of forms received
579108 597587 603420 543817 344828 374921 454462 719134 640865
Number not returned
171241 187042 178266 194395 104440 123758 222987 377035 406398
Proportion not returned
22.8% 23.8% 22.8% 26.3% 23.3% 24.8% 32.9% 34.4% 38.8%
Average Proportion not returned
23.1%
24.8%
35.4%
Source: Unpublished documents from IRD/IRB of Malaysia record.
Table 7.2 above indicates that annual non-retum rates for annual tax retums by
individual taxpayers ranges between 22.8 per cent to 38.8 per cent across the
taxpayer types over the period 1995-97. Among these groups of individuals,
taxpayers with employment income only, whose annual tax retums use Form BE,
have the highest mean rate of non-compliance, followed by SG group with Form
B and finally the OG group. As discussed in the literature review in Section 4.3.3
in these years employees' income taxes are being withheld by their employers
either under the Schedular Tax Deduction (STD) scheme (whereby regular
deductions are made in relation to the prior year's income - applying in Peninsular
Malaysia 1995-1998) or the Pay As You Eam (PAYE) scheme (applying in Sabah
and Sarawak and those who commenced employment anytime on or after 1
January 1995). Thus this could be a possible reason that these taxpayers might not
retum their annual tax retum forms. They might have misunderstood that they do
not have to fill in their annual tax retums because their employers have withheld
their income taxes. However, they are still required to fill in then income tax
annual retums because the taxes withheld by their employers were merely based
on estimation.
Again pointed out in Section 7.3.1 above, the IRB will only issue annual tax
retums to those taxpayers who are likely to be taxable based on their past records.
Not all of these annual tax retums would have been successfiilly received by all
158

individual taxpayers. Thus these non-retum rates actually measure the gap
between the number of individuals that have been issued with annual tax retums
(rather than those that actual received them) and those complied by submitting
their annual tax retums to the IRB.
Table 7.2 also shows that on average OG taxpayers have the lowest rate of non
compliance in submitting their annual completed retums. This could be so because
most of OG taxpayers hire tax preparers in filing their income tax retums, and will
be discussed fiirther in Section 8.3.6. Nevertheless this fact does not mean that OG
taxpayers are the most compliant among these individual taxpayers. Rather, the
fact that there is a non-retum rate about 23 per cent in spite of widespread use of
tax preparers suggests that many in this group do indeed avoid tax. As discussed
below, most of our survey respondents (income tax officers of the ERB) were of
the opinion that the OG taxpayers are more prone to income tax avoidance and tax
evasion due to the nature of their income, which is not withheld by employers
compared to SG taxpayers. Thus they were of the view that there are more self-
employed individuals or specifically OG taxpayers not included in the taxation
system. Hence it may be of great significance if the IRB could introduce a
withholding tax on all contractors and subcontractors, as done on Prescribed
Payment System (PPS) of the ATO. This could impact strongly on tax evasion by
this group of individual taxpayers.
The total number of annual tax retum forms issued for all types of retums to
individual taxpayers (Form BE and Form B) in 1995 was about 2.17 million,
rising to 2.33 million by 1997. The total number of annual tax retum forms
received in 1995 was 1.58 million rising to 1.62 million in 1997. Thus the total
number of annual tax forms not retumed was 588,623 in 1995, rising to 708,422 or
30.4 per cent of the total in 1997. Table 7.3 below summarises these results.
Table 7.3 Total rate of non-return in submitting annual tax forms among individual taxpayers
Year
1995 1996 1997
Total forms issued
2,166,010 2,330,066 2,327,628
Total forms received
1,577,387 1,661,549 1,619,206
Total forms not returned 588,623 668,517 708,422
Proportion total forms not returned
27.2% 28.7% 30.4%
Source: Author's calculations derived from Table 7.2.
159

Table 7.4 Total rate of non-return in submitting annual tax forms among companies and other organisations
Year
1995 1996 1997
Source:
Total forms issued 285,886 297,934 302,305
Total forms received
192,594 205,433 208,920
Author's calculations derived from Table 7.
Total forms not returned
93,292 92,501 93,385 and Table 7.3.
Proportion total forms not returned 32.6% 31.0% 30.9%
Conclusions and implications
While there are many reasons other than non-compliance for failure to retum
annual tax forms to the IRB, the high non-retum rate of issued forms must be
taken as an indicator of significant levels of income tax non-compliance in
Malaysia. In 1997 over 800,000 issued forms, or 30.5 per cent of the total, were
not retumed. For these wage and salary eamers issued Form BE, the non-retum
rate was 38.8 per cent. For individuals with business income with or without
salary, investment income with or without salary or business income with issued
Form B, the non-retum rate was 22.8 per cent in spite of the widespread use of tax
preparers. Among companies and other organisations the non-retum rate in 1997
was 30.9 per cent. While part of these high non-retum rates can be explained by
other factors, they constitute powerfiil evidence of persistent income tax non-
compHance. This system is also costly and somewhat ineffective for the IRB,
which could step up existing activities, or organise new activities, to overcome the
low retum rates, tt could stress the importance of informing the IRB regarding the
changes in address by taxpayers, to minimise unintentionally failure to submit the
completed annual tax retums, and also stress the consequences of failing to submit
the annual tax retums to taxation authority. IRB also could use various means to
educate taxpayers, especially wage and salary eamers, regarding their
responsibility to fill in their annual tax retums even though then income taxes
have been withheld by their employers.
7.4 Views of Taxation Officers about Non-Compliance in IMalaysia
Another approach to gauging the extent of income tax non-compliance in
Malaysia is by interviewing income tax officers of the IRB conceming this issue.
Thus this section provides the resuHs on views of the extent of income tax non-
160

compliance in Malaysia obtained through the interviews - other results of these
interviews will be provided in Chapter Eight.
Sixty income tax officers from four different branches of IRB were face-to-face
interviewed and their opinions regarding this problem were extracted and
tabulated as in Table 7.5 below. We were very carefiil in choosing the respondents
to match with the ones who had raised the omission or investigation in the file
data. The respondents were chosen selectively because we were trying to get a
clear picture of the reason or reasons given by these taxpayers for their failure to
declare their tme income. We were of the opinion that the respective officers who
had raised the omission cases or involved in the investigation cases would know
better than those who were not so involved. They would know better the reasons
why these particular taxpayers failed to declare their tme incomes, for these
taxpayers could give several excuses in their personal files to escape from severe
penalties fi-om the IRB. Hence, their opinions are valuable in getting the real
reason, especially in cases in which taxpayers give several excuses for failing to
declare their tme incomes, or offer no reason. Thus all of our respondents have
experience in raising omission cases. Table below indicates that a substantial
majority of the respondents were of the opinion that income tax non-compliance in
Malaysia is at a serious stage.
Table 7.5 Response on the seriousness of income tax non-compliance in Malaysia Branch
Kuala Lumpur
Johor Bahm
Pulau Pinang
Kota Kinabalu
Total
Percentage
Very serious
2
3
2
2
9
15%
Serious
12
10
10
10
42
70%
Not serious
1
2
3
3
9
15%
No. of respondents
15
15
15
15
60
100%
Source: Primary interview data collection for this research.
161

Seventy per cent of the respondents were of the opinion that income tax non
compliance in Malaysia is at a serious stage, while an equal percentage of fifteen
per cent were of the opinion that income tax non-compliance in Malaysia is very
serious stage and that it is not serious. Overall, 85 per cent of the respondents from
these four different branches of IRB were of the opinion that income tax non
compliance in Malaysia is either serious or very serious stage. The responses were
highly uniform across the four branches, with a sHght higher reading for Kuala
Lumpur, where 14 out of 15 officers surveyed (93.3 per cent) were of the view
that non-compliance is either serious or very serious.
7.5 The Extent of Income Tax Non-Compliance - Limitations and
Conclusions
In seeking different indicators of the extent of income tax non-compliance in
Malaysia, we have performed three different approaches in Chapters Six and
Seven. These involved estimating the taxable income gap between derived and
reported taxable income (the gap approach), estimating the rate of non-retum of
the annual tax form and obtaining the opinion of income tax officers on the
seriousness of this problem in Malaysia. Each of these methods has its limitations,
as noted in the appropriate sections.
In spite of these and other limitations addressed earlier, the three indicators which
have been studied in Chapters Six and Seven all point a similar conclusion, that
the level of income tax non-compliance in Malaysia is high. About 48 per cent of
derived taxable income in Malaysia is not included in reported taxable income in
Malaysia, by comparison with about 5 per cent for Australia. While variations in
income tax coverage explain a significant part of this difference, much must also
be due to lower compliance levels in Malaysia. Over 800,000 issued tax forms, or
30.5 per cent of the total issued, were not retumed in the form of income tax
retums in Malaysia in 1997. Again, while other factors explain part of this high
non-retum rate, it remains powerfiil evidence of persistent income tax non
compliance. Finally, 85 per cent of a group of sixty experienced tax officers
interviewed were of the opinion that income tax non-compliance in Malaysia is
either serious or very serious.
162

Thus, which this research has not been able to provide a firm quantitative estimate
of income tax non-compliance in Malaysia, it does provide a number of strong and
consistent indicators that the level of non-compliance is high. The two remaining
chapters explore some characteristics of those individuals who fail to comply
(Chapter Eight) and examine strategies for increasing the rate of income tax
compliance in Malaysia, drawing in part on the experience of the Australian Tax
Office, reviewed in Chapter Five.
163

CHAPTER EIGHT
A Profile of Income Tax Non-Compliance in Malaysia
8.1 Introduction
Chapter Six and Seven explored the extent of income tax non-compliance, using
quantitative indicators as well as surveying the opinions of taxation officers
regarding this problem in Malaysia. While a definitive, quantitative estimate of the
level of tax non-compHance could not be obtained, several indicators showed that
this is a serious problem in Malaysia. Hence, this problem cannot be ignored by the
IRB, and indeed by the Malaysian Govemment, in pursuing its objective of
implementing an effective, just and fair tax management system.
Thus fiirther study of the types of non-compliance that are most popular among
taxpayers, analysis of the demographics of evaders and an exploration of some
reasons for non-compliance may be assistance in devising strategies and plans to
overcome this problem. The main aim of this chapter is to provide some of these
analyses, by using the file data and interview data as discussed below.
8.2 Description of File Data and Interview Data
In addition to the use of published or unpublished statistical data collected by
others, this analysis of tax non-compliance in Malaysia makes use of two types of
data collected by the author. The first is referred to as the file data, where details are
recorded of 507 taxation files of individuals identified as non-compliant by the IRB.
The second is referred to as the interview data, which records the resuHs of a survey
by the author of the views of fifteen taxation officers in four branches of IRB
conceming non-compliance.
The samples used in both cases involve a non-probability purposive type of
sampling. That is, no attempt is made to select a random sample of taxpayers or
taxation officers, but individuals with certain known characteristics were selected.
163

We used this type of sampling in respect of the file data because we would like to
select only individuals who have been found guilty of evading their income taxes in
the years of 1995, 1996 and 1997. As for the interview data, we also chose non-
probability purposive sampling whereby only those respondents who were
knowledgeable regarding tax non-compliance would be included. This in tum could
allow a more informed investigation regarding the reasons for income tax non
compliance in Malaysia.
The consequence of using a non-random sampling approach is that great care must
be taking in generalising any conclusions from the sample data to a broader
population.
File data
There are 507 files in the sample. These consist of 415 files for non-salary taxpayers
(OG files) and 92 files for salary group taxpayers (SG files) from four different
branches of IRB. Table 8.1 below shows the distribution of the non-compliance
files under study in this research. Since we have taken all of the available files for
individuals that have been found guilty of evading income taxes in the years of
1995, 1996 and 1997 from these four different branches of lElB, it can be concluded
that the OG files outnumbered the SG files in the file data in the offices in question.
Table 8.1 File data: Disi IRB Branch
Kuala Lumpur Johore Bahru Pulau Pinang Kota Kinabalu Total
OG fdes
120 64 84 147 415
tribution SG fdes
3 0 6 83 92
bylR] Total
123 64 90 230 507
by IRB branch and type of taxpayer
Source: Author collection from IRB records.
Interview data
As discussed in Chapter Seven, fifteen income tax officers from each of these four
different branches of IRB - a total of sixty tax officers - were chosen to be
interviewed regarding income tax non-compliance in Malaysia. Table 8.2 below
164

shows their gender distribution and working experience with the IRB. As shown in
Table 8.2, sHghtly more than half of the officers were female and over 80 per cent
had more than ten years experience.
Table 8.2 Interview data: Distribution of officers interviewed, by IRB branch, gender and working experience
Source: Author col
IRB Branch
Kuala Lumpur Johore Bahru Pulau Pinang Kota Kinabalu Total
Male
6 7 5 9 27
Female
9 8 10 6 33
Working experience
< 5 yrs.
2 1 -
2 5
5 to 10 yrs.
3 -
1 1 5
> 10 yrs
10 14 14 12 50
ection from IRB records.
8.3 Types of Non-Compliance among Individual Taxpayers
There are various ways for taxpayers to omit or evade their share of income taxes.
They can inflate their expenses in their annual business accounts, over-claim their
deductions in their annual income tax retums, and under-declare or even fail to
declare their incomes in their annual tax retums. Thus one of our aims in this
research study is to determine the most common type of omission among Malaysian
taxpayers.
There are two methods of examining the types of non-compliance among individual
taxpayers in Malaysia, as noted above. First, by extracting the nature of non
compliance committed by the taxpayers found guiHy in the file data. The second is
through interviewing income tax officers based on their working experience with
the IRB.
8.3.1 Types of non-compliance obtained from file data
Table 8.3 below provides data on the types of non-compliance gathered from file
data.
165

Table 8.3 Nature of omission from file data Nature of omission
Failed to declare income/s Under-declared income/s Over-claimed expenses Over-claimed deductions Total
Type of file
SG 90 2 -
-
92 SG
OG 255 152 6 1 415 OG
Total no. of cases
346 154 6 1 507
Percentage
68.2% 30.4% 1.2% 0.2% 100%
Source: Primary file data collection of this research.
Whether an omission is treated as failing to declare incomes or as under-declaring
incomes depends on the sources of income that were declared by taxpayers. If the
omitted income came from a source of incomes which had already been declared by
the taxpayer in his or her annual tax retum, we regard the omission as one of under-
declaring income. However, if the omitted income has not been reported at all by
the taxpayer in his or her annual tax retum, then we regard the omission as failing to
declare income. Over-claiming expenses or inflating expenses is usually related to
the preparation of business accounts, while over-claiming deductions or reliefs is
related to the preparation of annual tax retums.
Only one type of non-compliance was extracted per taxpayer. However, if a
taxpayer has committed more than one type of non-compliance, the type of non
compliance that has resulted in the greater loss of income tax was taken to avoid
confiision.
The significance of the above table is that the OG taxpayers exceed SG taxpayers
more than threefold in the file data. Since we have considered all of the guilty files
in the years of 1995, 1996 and 1997 that were available in these four different
branches of IRB, it can be concluded that more OG taxpayers than SG taxpayers
were found guilty of evading their income taxes in these branches. This could be
due to the policy adopted by the IRB to go after taxpayers who have more
opportunity for evasion and avoidance. Additionally, no income taxes have been
withheld for this group of taxpayers. Hence by pursuing this group of taxpayers the
IRB could induce an awareness on the part of OG taxpayers regarding the
importance of declaring their tme incomes.
166
Based on the above table, most common type of omission is failing to declare
income. The second most common type is under-declaring income. Among SG files
(salary earners' income tax files) involved in omission, more than 97 per cent are
involved in failing to declare their incomes and less than 3 per cent involved in
under-declaring their incomes. None of these SG files involved over-claiming
expenses and over-claiming deductions. However, more than 61 per cent of OG
files involved in the omission failed to declare income, and more than 36 per cent of
OG omission files involved under-declaring their income. Hence based on file data,
both types of files show that the most common type of omission is failing to declare
income.
Individuals with non-salary income are those taxpayers registered under OG files.
They are sole-proprietors, self-employed, or companies' directors. They tend to
under-declare their income, relative to salary eamers, partly because of the nature of
their income. Since the amount of wage and salary income received by SG
taxpayers is specified in their annual income statements by their employers, none is
so declared for OG taxpayers. However, taxation officers can trace additional
income not reported by OG taxpayers through other sources such as contractors,
sub-contractors, company files or information from clients. Hence, information
from third parties plays an important role in detecting tax non-compliance among
OG taxpayers.
8.3.2 Views on types of non-compliance
The second method of determining the most common type of non-compHance
committed by Malaysian taxpayers is by interviewing income tax officers of the
IRB. Our respondents were asked to fill in the attached form (Appendix 1) and the
results were analysed by the author.
In order to find the most common type of omission during the interview session, our
respondents were given 4 options (as in Table 8.4 below) and were asked to arrange
them in their order of importance. Scores were given according to their views: the
type of omission judged most important (number 1) was scored at 4 points, the
167

second in the list received 3 points, third was given 2 points and last received only 1
point. Thus the total number of scores for the different types of omission that our
respondents have come across were gathered as in Table 8.4 below. In interpreting
this table, it should be noted that, if all types of omission were ranked equally by the
tax officer, each would receive 25 per cent of the total score.
Table 8.4 Response on the common nature of income tax omission
Branch
Kuala Lumpur Johor Bahru Pulau Pinang Kota Kinabalu Total no. of scores Percentage
Failed to declare 41 38 48 52 179
29.83%
Under-declared 52 51 51 45 199
33.17%
Inflated expenses 40 45 34 33 152
25.33%
Over-claimed Deductions 17 16 17 20 70
11.67%
Total
150 150 150 150 600
100% Source: Primary interview data collection of this research.
Table 8.4 above shows the nature of omission versus total number of scores from
four different branches of IRB. The highest total score (33.2 per cent of the total)
was received by under-declaring income, followed by failing to declare income,
inflating expenses or over-claiming deductions. Thus according to our respondents,
the order of importance of the different types of omission are as follows:
1. Under-declaring income,
2. Failing to declare income,
3. Inflating expense and
4. Over-claiming deductions.
The main differences between the resuHs of analyses of the omission data (Table
8.3) and the views of the tax officers (Table 8.4) are two-fold. Relative to the
findings from the omission data the tax officers rate failure to declare income as less
important and inflating expenses as more important. Indeed, in Table 8.4 inflating
expenses receives 25.3 per cent of the total scores, whereas for only 1.2 per cent of
the omission files was of the main type. The difference between Tables 8.3 and 8.4
could be attributed in part to the ranking methodologies used, and especially to the
168

f̂ ct that only one type is included in Table 8.3 for each file. However, our
respondents, bas^ on their personal experience (whereby more than 80 per cent of
them have worked with the IRB for more than ten years) were of the opinion that
taxpayers tend to under-declare their income so that they will pay less income taxes
and that inflation of expenses was an important form of non-compHance.
8.3.3 Implications obtained from the review of types of non-compliance
IRB officers should pay more attention to business accounts prepared by taxpayers
or their accountants, for this group of taxpayers have more opportunities to
misrepresent their tme incomes compared to salary eamers. Non-salary eamers
(taxpayers registered under OG income tax files) also have more opportunities to
practice tax avoidance by over-claiming their expenses or deductions. Hence they
tend to under declare their incomes compared to salary eamers. As for salary
eamers it was found that 97.8 per cent of the omission files involved failure to
declare income. This income could be their additional income, besides their primary
employment income.
8.4 Characteristics of Individuals Engaged in Income Tax Non-
Compliance
Study of the characteristics or demographics of taxpayers who involved in this
problem will enable the authorities to channel most of their efforts or strategies to
the groups of taxpayers who are more likely to be involved.
Some characteristics of individuals that have been involved in income tax non
compliance in the years of 1995, 1996 and 1997 that are studied here are age level,
gender, income level and income source. These characteristics were chosen because
they are associated with the problem under investigation (income tax non
compliance) and can be extracted from the omission files for these three years.
8.4.1 Age level
We have categorised age level into three categories, as below:
i. Young taxpayers, whose age is between 15 to 29,
169

ii. Middle-aged taxpayers, whose age is between thirty to fifty and
iii. Old taxpayers, whose age is above fifty.
Hi comparing the incidence of a non-compliant with this characteristic in the non-
compliant population to a distribution of such characteristic of population in
Malaysia, we should make the comparison with the population of taxpayers of
different age levels registered with the IRB. However since the data on different age
levels registered with the IRB are not available, we make the comparison with
different age levels in the labour force of Malaysia, based on Labour Force Survey
Report 1998 (Department of Statistics Malaysia, 1999b).
8.4.1.1 Description of gender distribution in the labour force
Table 8.5 below shows the percentage distribution, by age levels and gender, of the
population data for the years of 1995, 1996 and 1997.
Table 8.5 Age level Sex 1995 1996 1997 Total
Percentage by gender of the labour force Age 15 to 29
M 31% 31% 31% 31%
F 36% 35% 35% 35%
Age 30 to 50
M 64% 64% 64% 64%
F 61% 61% 62% 61%
Age above 50
M 5% 5% 5% 5%
F 3% 4% 3% 4%
Source: Extracted from Labour Force Survey Report Malaysia 1998 (p. 25).
They are uniformly distributed in these three years, whereby a total of 64 per cent of
the male labour force is concentrated in the age 30 to 50, while a total of 61.3 per
cent of female labour force is in this age group. The next largest age level of the
labour force is in the age range between 15 to 29, where a total of 31 per cent and
35.3 per cent of male and female workforce respectively are found. The smallest
age group in terms of age is found in the age above 50, where a total of 5 per cent of
the male workforce and 3.3 per cent of female workforce are found in this age level.
170

8.^.1.2 Possibility that a tax evader comes from different age groups and gender in
a tax evading population from file data
Table 8.6 Distribution of age levels and gender of the fde data
Year
1995
1996
1997
Total
Age level Gender
No. of taxpayers
No. of taxpayers
No. of taxpayers
Total no. of taxpayers Total percentage
Age 15 to 29 M
12
20
11
43
10.2'
F
1
10
4
15
17.6^
Age 30 to 50 M
89
99
80
268
63.5'
F
15
22
24
61
71.8'
Age above 50 M
47
35
29
111
26.3'
F
3
2
4
9
10.6'
Total M
148
154
120
422
83.2'
F
19
34
32
85
16.8'
*Note: M = Male F = Female
' Share of all males,' share of all females and' share of total persons. Source: Primary file data collection of this research.
Table 8.6 above depicts the distribution of gender and age level of income tax non-
compliants gathered from four different branches of IRB for the years of 1995, 1996
and 1997. Thus, for example, there are a total of 167 income tax non-compliants
(148 males and 19 females) in the year of 1995. Among the total of male non-
compliants in this year, 12 of them were aged between 15 to 29 (8.1 per cent), 89 of
them were aged between 30 to 50 (60.1 per cent) and the remaining of 47 were aged
above 50 (31.8 per cent). Hence according to Table 8.6 above, it can be deduced
that the larger number of tax evaders from the sample were aged between 30 to 50
for both sexes, here defined as middle-aged taxpayers. As seen in Table 8.5 earHer,
64 per cent and 61 per cents of male work force and female workforce are found in
this age level respectively. Thus the resuHs based on file data are consistent with the
distribution of the workforce. Based on the omission and investigation files from
these four different branches of IRB that Have been finalised in the years of 1995,
1996 and 1997, it can be concluded that the total percentage of male and female
taxpayers aged between 30 to 50 exceeds sixty percent. The total of 63.5 per cent of
the male tax evaders aged between 30 to 50 exceeds, more than six times, of those
171

male tax evaders whose aged 15 to 29 and more than twice of those male tax
evaders whose aged above fifty in the sample. As for female tax evaders, there are a
total of 71.8 per cent of the female tax evaders aged between 30 to 50, which is four
times the share of those female tax evaders aged 15 to 29 and more than six times
the share of female tax evaders whose aged above fifty in the sample. But the
interpretation of these age shares in the file data can only be correctly made in the
content of the labour force shares in Table 8.5. Perhaps the central messages of
Tables 8.5 and 8.6 are that older taxpayers are more highly represented in the
omission data than in the labour force, especially for man, while younger taxpayers
are less represented, also especially for men. Thus, for example, males aged over 50
account for 26.3 per cent of the males in the omission data but only 5 per cent of the
labour force, while for men aged 15-29 years account for only 10.2 per cent of
males in the omission data but constitute 31 per cent of the labour force. Similar, if
less pronounced, trends are evident for females. Thus, from this analyses, it would
seem that non-compliance is more common among older taxpayers, but less
common among younger ones, the would be suggested by workforce shares.
The result is somewhat in contrast to Sabri's measurement of tax ethics among the
Kuala Lumpur and Petaling Jaya respondents. He showed that respondents aged
between 30 to 39 Had the highest level of tax ethics, respondents above 50 years old
were the second, followed by respondents of aged 40 to 49. Those respondents aged
below 29 had the lowest level of tax ethics (1993). This difference might be due to
the different nature of the research studies undertaken. Sabri's research was based
on taxpayers' attitude measurement, while this research is specifically done to
determine the characteristics of income tax non-complier. The decisions of older
taxpayers not to comply with the IRB could be due to some of the other factors as
identified by Dean, Keenan and Kenney (1980) such as (a) the level of taxation and
worth of govemment expenditures, (b) tax equity, (c) the probability of detection,
(d) moral perceptions and (e) economic considerations. In particular, it is likely that
older taxpayers had both greater incentive and more opportunity to become
involved in income tax non-compliance.
172

8.4.1.3 Age group in relation to total income omitted, total tax evaded and penalty
imposed
Table 8.7 below shows mean income omitted, mean tax evaded and mean penaHy
imposed by the IRB on each age level of taxpayers from the file data sample. Those
aged above 50 were found to evade twice the total amount of income taxes
compared to those aged between 30 to 50, and almost 10 times the amount of
income and tax evaded by the aged group of below 30. However, their tax penalties
were correspondingly greater - they were penalised about 3 times as much as of
those aged between 30 to 50 and nine times as much as those aged below 30. Thus
the order of income tax non-compliance and the amount of total income omitted,
total tax evaded and penalty imposed in descending order is as below:
1. Older taxpayers (aged above 50)
2. Middle-aged taxpayers (aged between 30 to 50) and
3. Young taxpayers (aged below 30).
Table 8.7 Relationship between mean of total income omitted, mean tax evaded and mean penah
Total income omitted
Total tax evaded
Total penalty imposed
ies imposed and age Age level Below 30 Between 30 to 50 Above 50 Below 30 Between 30 to 50 Above 50 Below 30 Between 30 to 50 Above 50
evels Mean in RM 55,500 242,500 530,000 20,200 85,600 218,500 12,600 38,300 111,700
Source: Primary file data collection of this research.
Thus, as well as having a higher incidence of non-compliance, older taxpayers
evade a much higher average level of tax. If the RMl46.6 milHon of total income
omitted in the 507 files under consideration, older taxpayers accounted for RM63.6
milHon or 43.4 per cent, in spite of accounting for only 23.7 per cent of the files. If
the total tax evaded of RM55.6 milHon, they accounted for 47.1 per cent. Many
older taxpayers have accumulated their wealth and have established themselves
173

compared to younger taxpayers, and some may be willing to take the risk of non
compliance when only a small proportion are detected.
8.4.2 Gender
There are again two ways of determining the gender of taxpayers that are most
likely to evade their income taxes. As before, the first method is by analysing the
gender of tax evaders (from their personal income tax files) for the years of 1995,
1996 and 1997, while the other is through interviewing income tax officers.
8.4.2.1 Gender distribution in the labour force
by gender of the labour force, Malaysia, 1997 Table 8.8 Percentage Gender
1995
1996
1997
Total
M
66%
66%
66%
66%
by gender F
34%
34%
34%
34%
Source: Intemational Labour Office, Yearbook of Labour Statistics 1998, p. 108.
As before, the labour force is used as reference group against wish to assess the
gender distribution of tax evaders. In some respects it would have been more
appropriate to use the gender distribution of taxpayers as the reference group.
However, these figures are not available in a usefiil form, given the prevalence of
combined assessment in Malaysia. As Table 8.8 shows, 66 per cent of persons in the
labour force are male and 34 per cent female, and these proportions are steady over
the three years shown (Intemational Labour Office, Yearbook of Labour Statistics,
1998, p. 108).
174
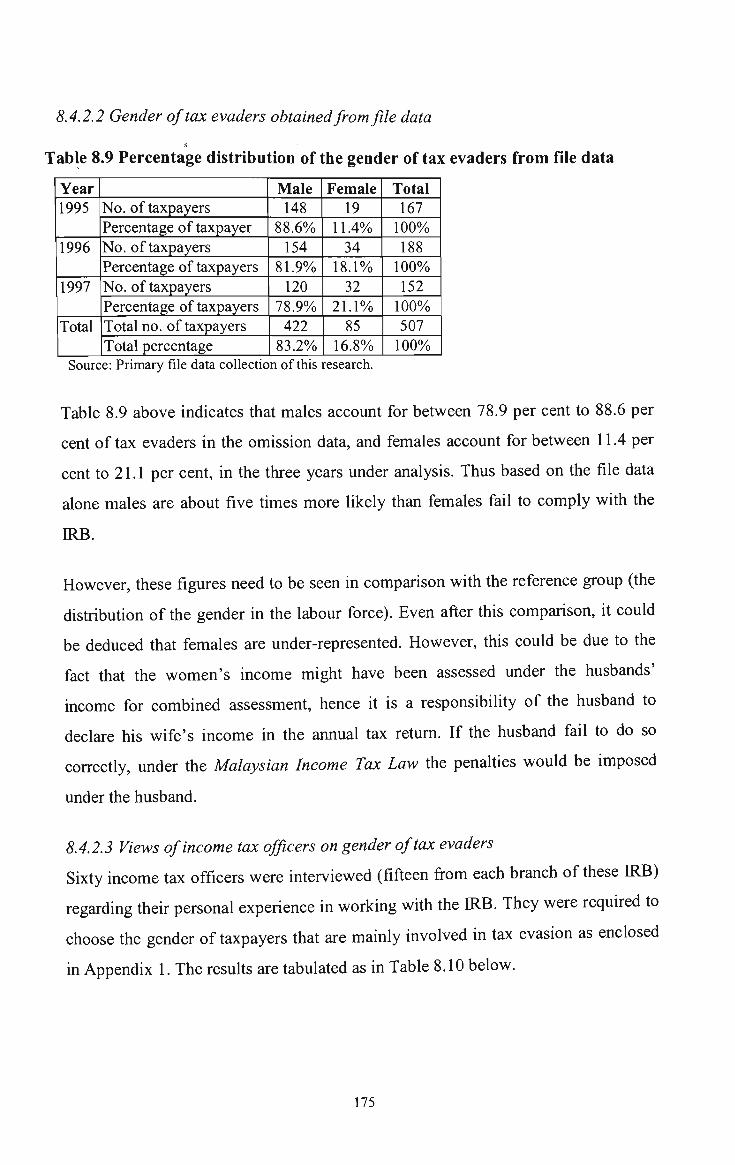
8.4.2.2 Gender of tax evaders obtained from file data
Table 8.9 Percentage distribution of the gender of tax evaders from file data
Year 1995
1996
1997
Total
No. of taxpayers Percentage of taxpayer No. of taxpayers Percentage of taxpayers No. of taxpayers Percentage of taxpayers Total no. of taxpayers Total percentage
Male 148
88.6% 154
81.9% 120
78.9% 422
83.2%
Female 19
11.4% 34
18.1% 32
21.1% 85
16.8%
Total 167
100% 188
100% 152
100% 507
100% Source: Primary file data collection of this research.
Table 8.9 above indicates that males account for between 78.9 per cent to 88.6 per
cent of tax evaders in the omission data, and females account for between 11.4 per
cent to 21.1 per cent, in the three years under analysis. Thus based on the file data
alone males are about five times more likely than females fail to comply with the
IRB.
However, these figures need to be seen in comparison with the reference group (the
distribution of the gender in the labour force). Even after this comparison, it could
be deduced that females are under-represented. However, this could be due to the
fact that the women's income might have been assessed under the husbands'
income for combined assessment, hence it is a responsibility of the husband to
declare his wife's income in the annual tax retum. If the husband fail to do so
correctly, under the Malaysian Income Tax Law the penalties would be imposed
under the Husband.
8.4.2.3 Views of income tax officers on gender of tax evaders
Sixty income tax officers were interviewed (fifteen from each branch of these IRB)
regarding their personal experience in working with the IRB. They were required to
choose the gender of taxpayers that are mainly involved in tax evasion as enclosed
in Appendix 1. The results are tabulated as in Table 8.10 below.
175

Table 8.10 Results based on interview with IRB officers regarding gender of tax evaders
Branch Kuala Lumpur Johor Bahru Pulau Pinang Kota Kinabalu Total Percentage
Male 15 15 15 13 58 96.7%
Female 0 0 0 2 2 3.3 %
Total no. of respondents. 15 15 15 15 60 100 %
Source: Primary interview data collection of this research.
Table 8.10 indicates that 96.7 per cent of our respondents agreed that the gender of
a tax evader from a population of tax evaders would be more likely to be male than
female. Only two officers, or 3.3 per cent of the income tax officers, were of the
opinion that the gender of a tax evader is often female. Hence using this approach
also suggests that the gender of the income tax non-compliant is much more likely
to be male in a population of tax evaders.
Based on the above resuHs it can be deduced that males are more likely to be non-
compliant than females in a population of tax evaders, which supports the findings
of Vogel (1974), Mason and Calvin (1978) and Tittle (1980). This resuH also agrees
with Sabri's resuH (1993) from his tax ethics survey, whereby male respondents
were found to have slightly lower level of tax ethics than the females.
8.4.2.4 Gender in relation to total income omitted, total tax evaded and penalty
imposed
Table 8.11 below shows the mean for income omitted, mean tax evaded and mean
penalty imposed for the found guilty tax evaders for both genders in these four
different branches of IRB for the years of 1995, 1996 and 1997.
176
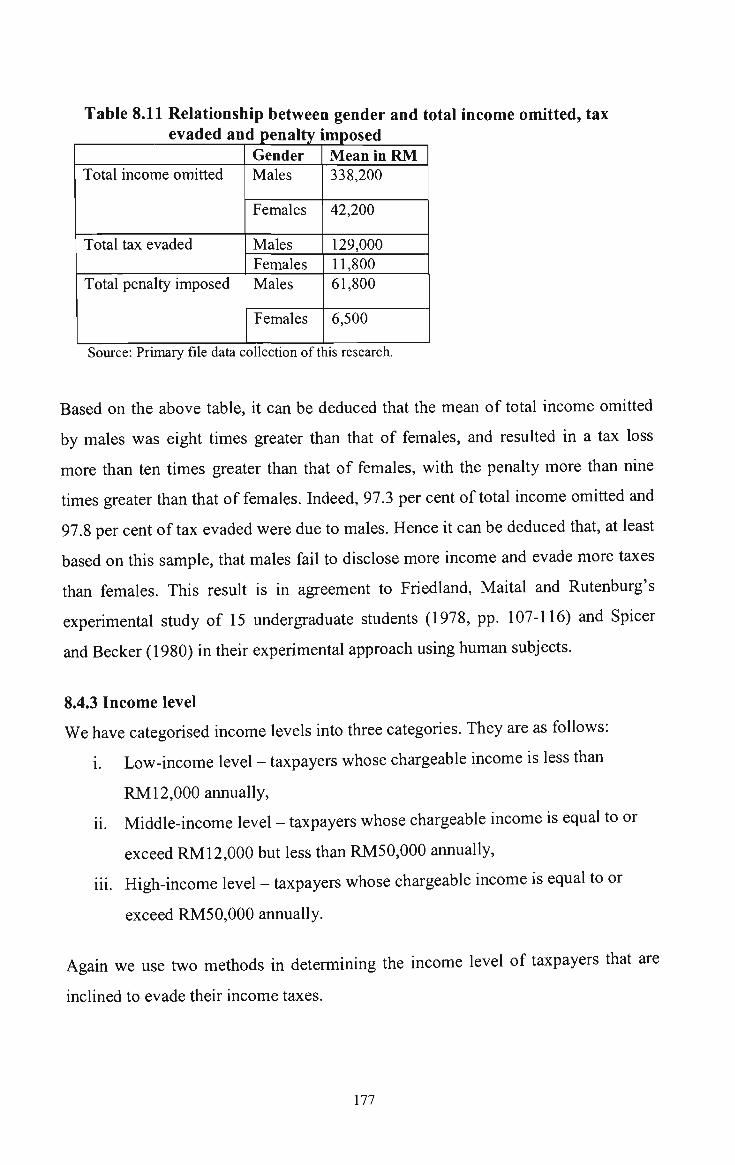
Table 8.11 Relationship between gender and total income omitted, tax evaded and penalty imposed
Total income omitted
Total tax evaded
Total penalty imposed
Gender Males
Females
Males Females Males
Females
Mean in RM 338,200
42,200
129,000 11,800 61,800
6,500
Source: Primary file data collection of this research.
Based on the above table, it can be deduced that the mean of total income omitted
by males was eight times greater than that of females, and resuHed in a tax loss
more than ten times greater than that of females, with the penalty more than nine
times greater than that of females. Indeed, 97.3 per cent of total income omitted and
97.8 per cent of tax evaded were due to males. Hence it can be deduced that, at least
based on this sample, that males fail to disclose more income and evade more taxes
than females. This result is in agreement to Friedland, Maital and Rutenburg's
experimental study of 15 undergraduate students (1978, pp. 107-116) and Spicer
and Becker (1980) in their experimental approach using human subjects.
8.4.3 Income level
We have categorised income levels into three categories. They are as follows:
i. Low-income level - taxpayers whose chargeable income is less than
RMl2,000 annually,
ii. Middle-income level - taxpayers whose chargeable income is equal to or
exceed RMl 2,000 but less than RM50,000 annually,
iii. High-income level - taxpayers whose chargeable income is equal to or
exceed RM5 0,000 annually.
Again we use two methods in determining the income level of taxpayers that are
inclined to evade their income taxes.
177

8.4.3.1 Description of reference data for income level - all individual taxpayers
Table 8.12 Income levels of Malaysian taxpayers Year
1995
1996
1997
Total
Source: Taxat
Number of taxpayers Percentage of taxpayers Number of taxpayers Percentage of taxpayers Number of taxpayers Percentage of taxpayers Total number of taxpayers Total percentage of taxpayer
ion Statistics of the IRD/IF
Below RM12,000
556,702 36.2%
338,021 26.7%
363,864 25.7%
1,258,587
29.8%
LB for the years
Between RM12,000 to RM50,000 859,787 55.9%
800,073 63.1%
896,772 63.4%
2,556,632
60.6%
of 1996, 1997 anc
Above RM50,000
122,265 7.9%
128,731 10.2%
154,377 10.9%
405,373
9.6%
11998.
The data on the chargeable income distribution of all individual taxpayers were
extracted from IRB taxation statistics for the years of 1996, 1997 and 1998, as
tabulated in Table 9.12 above. Based on the these data, the possibility that an
individual taxpayer comes from low-income level ranged from 25.7 per cent to 36.2
per cent for the three years in question, that for middle-income level ranged from
55.9 per cent to 63.4 per cent and that high-income level ranged from 7.9 per cent to
10.9 per cent. Thus over the three years, on average the proportion of taxpayers in
the low-income level was 29.8 per cent, that in the middle-income level was 60.6
per cent and that of the high-income level was 9.6 per cent. The changes in the
shares over the period mainly reflect the growth in income over this time.
8.4.3.2 Income levels of tax evaders obtained from file data
Table 8.13 below summarises the results on income levels of tax evaders exfracted
from omission and investigation files of the four different branches of IRB for the
years of 1995, 1996 and 1997 (file data).
178

Table 8.13 Results based on file data on income level from four different branches of IRB
Year
1995
1996
1997
Total
Number of taxpayers Percentage of taxpayers Number of taxpayers Percentage of taxpayers Number of taxpayers Percentage of taxpayers Total number of taxpayers Total percentage of taxpayer
Below RMl 2,000
8 4.8% 10 5.3% 7 4.6% 25 4.9%
Between RM12,000 to RM50,000 102 61.1% 105 55.9% 98 64.5% 305 60.2%
Above RM50,000
57 34.1% 73 38.8% 47 30.9% 177 34.9%
Source: Primary file data collection of this research.
Based on file data, the proportion of tax evaders with chargeable income below
RM12,000 is 4.9 per cent, the proportion between RM12,000 to RM50,000 is 60.2
per cent and the proportion above RM50,000 is 34.9 per cent.
In comparing file data and reference data for different income levels, it is in
consistent that the middle-income level has the highest percentage compared to
other income levels. However, it is found that file data gives the high-income level
in second place after the middle-income level. On the other hand, based on the
reference data as in Table 8.12, the High-income level is in third place. H should be
noted that this effect is strong - only 9.6 per cent of all taxpayers had chargeable
incomes over RM50,000 but 34.9 per cent of those in the omission data were in this
income band. This could be due to the policy adopted by the IRB to go after high-
income eamers compared to low-income eamers, because it will get better payoff
This is an issue to which we will retum below.
This resuH appears to contradict to the findings of Mason and Lowry (1981), and
Witte and Woodbury (1985), whereby they concluded that middle income taxpayers
are most compliant and that both low and high income level taxpayers are relatively
non-compliant in comparison. But it is consistent with a general view in many
countries that tax non-compHance is higher at higher income levels.
179

8.4.3.3 Views of income tax officers on income levels of tax evaders
The resuHs of the interviews with income tax officers produced a similar version.
The respondents were asked to arrange taxpayers' annual income levels in the order
that is the most common in evading their income taxes. Then scores were given to
these responses, with 3 points to the most common level, 2 points for the second
most common and only 1 point given for the income level selected as least likely to
income tax non-compHance. The results of aggregating the scores are as follows:
Table 8.14 Interview results with income tax officers regarding income levels of tax evaders
Branch
Kuala Lumpur Johor Bahru Pulau Pinang Kota Kinabalu Total no. of scores Percentage
Below RM12,000
17 17 15 22 71 19.7%
Between RMl 2,000 to RM50,000 34 30 34 35 133 37%
Above RM50,000 39 43 41 33 156 43.3%
Total
90 90 90 90 360 100%
Source: Primary interview data collection of this research.
Table 8.14 indicates that the respondents were of the opinion that high-income
eamers evade tax the most (43.3 per cent of the total score), followed by middle-
income with 37 per cent of the total score and finally the low income eamers with
only 19.7 per cent. Thus the respondents were of the opinion that high-income
eamers would be the most non-compliant among these three groups in a tax evading
population. This resuH is also consistent with Christian and Gupta's resuH (1993).
Hiterestingly, Sabri's result indicates that respondents with higher income had a
higher level of tax ethics compared to lower income eamers (1993). This difference,
which might appear to contradict the finding of a relatively high level of non
compliance at high income levels, could be explained simply that these higher
income eamers know what the tax authority expects from them (as in Sabri's
result), but acting to the contrary. Another possible explanation is that they practice
tax avoidance, which they think is legal and difficuH to detect by taxation authority.
The third explanation could be attributed to IRB practices: that it concentrates its
180
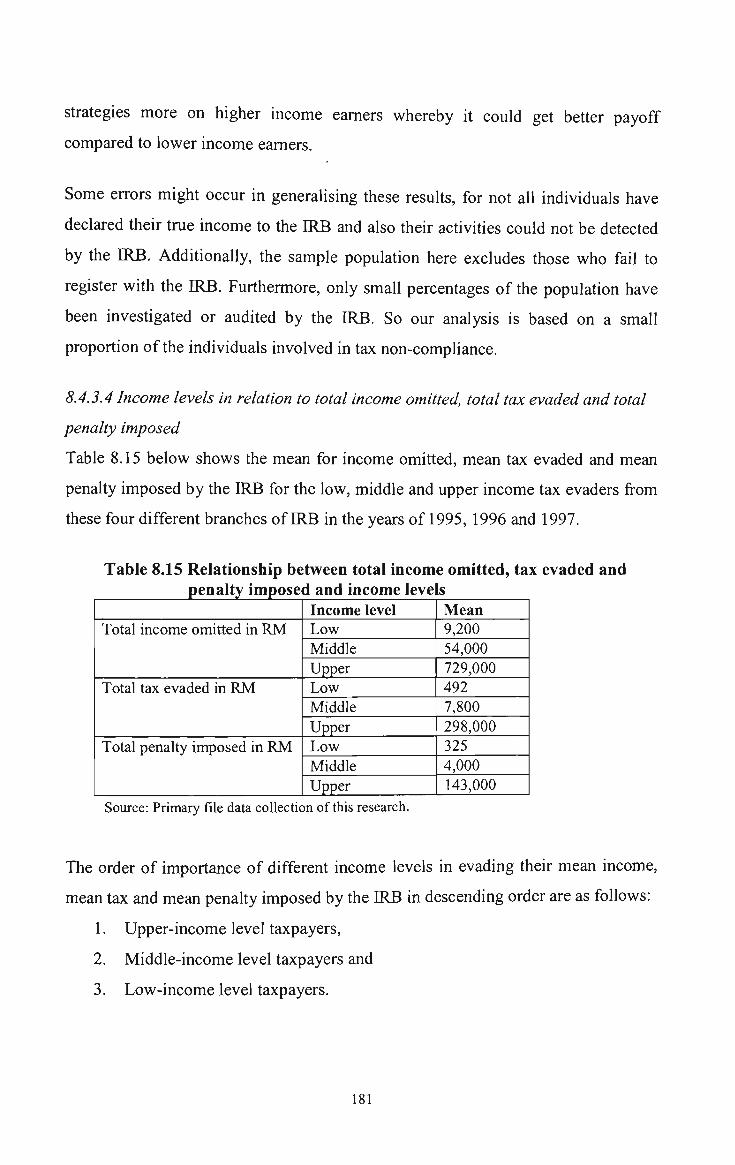
sfrategies more on higher income eamers whereby it could get better payoff
compared to lower income eamers.
Some errors might occur in generalising these resuHs, for not all individuals have
declared their tme income to the IRB and also their activities could not be detected
by the IRB. Additionally, the sample population here excludes those who fail to
register with the IRB. Furthermore, only small percentages of the population have
been investigated or audited by the IRB. So our analysis is based on a small
proportion of the individuals involved in tax non-compliance.
8.4.3.4 Income levels in relation to total income omitted, total tax evaded and total
penalty imposed
Table 8.15 below shows the mean for income omitted, mean tax evaded and mean
penalty imposed by the IRB for the low, middle and upper income tax evaders from
these four different branches of IRB in the years of 1995, 1996 and 1997.
Table 8.15 Relationship between total income omitted, tax evaded and penalty imposed and income leve
Total income omitted in RM
Total tax evaded in RM
Total penalty imposed in RM
Income level Low Middle Upper Low Middle Upper Low Middle Upper
s Mean 9,200 54,000 729,000 492 7,800 298,000 325 4,000 143,000
Source: Primary file data collection of this research.
The order of importance of different income levels in evading their mean income,
mean tax and mean penalty imposed by the ERB in descending order are as follows:
1. Upper-income level taxpayers,
2. Middle-income level taxpayers and
3. Low-income level taxpayers.
181
Hideed, upper income groups account for 88.5 per cent of all income omitted and
95.6 per cent of all tax evaded in the omission data files.
8.4.4 Income source
The fourth characteristic that has been analysed is income source. The IRB has
categorised individuals' files according to their sources of income. There are two
types of files registered for individual taxpayers, namely OG files and SG files as
explained below.
8.4.4.1 Income sources in relation to file type
The OG taxpayers are the sole-proprietors, self-employed or companies' directors,
while SG taxpayers are mainly employed individuals whose income tax has been
deducted monthly by their employers, either under "Pay As You Eam" Scheme
(PAYE) or under Schedular Tax Deduction Scheme (STD). Unlike SG taxpayers,
most of taxpayers under OG group are mainly sole-proprietors and self-employed
individuals who paid their taxes according to the arrangement that they have made
with the IRB's representatives. It could be on instalment basis or one lump sum,
except for those who are also employed, whereby their taxes are also being withheld
from their employment income either under STD or PAYE schemes, as discussed in
Chapter Four of this research study.
8.4.4.2 Reference data for income sources of individual taxpayers
The reference data we used as comparison for income source is the disttibution of
the number of these two types of files that are currently active in the whole of IRB.
Table 8.16 below shows the distribution of these two types of files.
182

Table 8.16- Distribution of total active files in the whole of IRB Year .1995
1996
1997
Total
No. of files Percentage of files No. of files Percentage of files No. of files Percentage of files Total no. of files Percentage of total files
OGFUe 750,349 25.8% 784,629 28.2% 781,686 27.7% 2,316,664 27.2%
SGFUe 2,153,873 74.2% 1,994,705 71.8% 2,044,621 72.3% 6,193,199 72.8%
Total 2,904,222 100% 2,779,334 100% 2,826,307 100% 8,509,863 100%
Source: Taxation Statistics of the IRD/IRB for the years of 1996, 1997 and 1998
AHogether 27.2 per cent of all currently active individuals' files over 1995-97
belonged to OG taxpayers and 72.8 per cent belonged to SG taxpayers. Thus there
are about 2.7 times as many SG files in the IRB compared to OG files.
8.4.4.3 Income source obtained from file data
The distribution by file type of the sample of tax evader files under study is as in
Table 8.17 below.
Table 8.17 Classification of file data according to \ Year 1995
1996
1997
Total
No. of files Percentage of files No. of files Percentage of files No. of files Percentage of files Total no. of files Percentage of total files
OG File 144 86.2% 154 81.9% 117 77% 415 81.9%
heir file ty SGFUe 23 13.8% 34 18.1% 35 23% 92 18.1%
pes Total 167 100% 188 100% 152 100% 507 100%
Source: Primary file data collection of this research.
H was found that based on file data, there were a total percentage of 81.9 per cent of
total non-compHants' files belong to OG taxpayers, while only 18.1 per cent of
these files belong to SG taxpayers. Hence there were more than four times more OG
tax evaders than SG tax evaders in the file data, even though there are neariy three
times more SG than OG files among the total taxpayer group (Table 8.16). The non
compliance seems to be especially concentrated on OG taxpayers. Since these
groups of taxpayers have several means of cheating the tax authority - such as
falsifying their business accounts or failing to declare some of their incomes - thus
183

the IRB concentrates its action against this group of taxpayers. Some of its activities
to counter evasion include undergoing field auditing and investigating these
taxpayers to recover back duty. The knowledge that the IRB is active in these
activities will not only lend to recovery of duty or tax lost, but will also act as a
deterrent to those who are ready or inclined to evade their due liabilities.
As observed by Wameryd and Walemd (1982), and Wallschutzky (1984), self-
employed perceive more opportunities for tax evasion. Hence the above results
confirmed their observations. They are also in agreement with Sabri's tax ethics
results (1993), whereby self-employed persons were found to have the lowest level
of tax ethics, which could be a possible cause of the above result. Another factor
that might contribute to such result could be a lower level of tax literacy, as found in
the post analysis of a survey conducted by the IRB in 1997. In this survey, self-
employed or OG group taxpayers were found to be less well informed or too
dependent on tax agents, compared to salary eamers or SG taxpayers (will be
discussed in Chapter Nine of this research study).
8.4.4.4 Income source in relation to total tax omitted, tax evaded and penalty
imposed
Table 8.18 below shows the distribution of the mean income omitted, mean of tax
evaded and mean of penaHy imposed on these two different types of files that were
found guiHy in evading their taxes from four different branches of IRB for the years
ofl995, 1996 and 1997.
184

Table 8.18 Types of files in relation to mean income omitted, mean tax evaded and mean of penalty imposed
Mean income omitted in RM
Mean tax evaded in RM
Mean penalty imposed in RM
OG fdes (N = 415) 351,200
133,400
64,100
SG files (N = 92) 6,400
877
549
Source: Primary file data collection of this research.
Table 8.18 shows that the mean income omitted from OG files is more than fifty
four times than that from SG files, and the mean tax evaded is more than one-
hundred and fifty two times than the SG files. As a result, they were penalised more
than one-hundred and sixteen times than the SG taxpayers. Thus, in terms of income
omitted and tax evaded it could be deduced that the OG taxpayers Have been evaded
more income taxes than the SG taxpayers.
A strong and highly consistent picture of the dominant characteristics of those
involved in income tax non-compliance in Malaysia emerges from this analyses of
the file data and the interview data. Non-compliance is especially concentrated in
• Older persons, those aged over 50 years,
• Men rather than women,
• Individuals on higher incomes over RM50,000 per annum, and
• Individuals classified to OG files.
While this is distinct evidence of non-compliance among other groups, the
concenfration in individuals with these characteristics is very marked. Thus, for
example, 97.8 per cent of tax evaded in the omission sample was due to men rather
than women, 95.6 per cent was in the Higher income groups and over 99 per cent
was associated with OG files.
185

One important qualification to these results should be noted, however. Both sets of
data - the omission files from four tax offices and the files resulting from the
interviews of officers who have worked on these files - are intimately involved with
the activities of the ERB. Thus, to a degree which must remain uncertain, these
striking results may reflect the prevailing views and policies of the IRB rather than
the actual reality of income tax non-compHance.
8.5 Factors that Might Influence Income Tax Non-Compliance
Studying the factors influencing income tax non-compliance is as important as
studying the characteristics of those involved in income tax non-compliance. Here,
however, we confine attention to some limited information on the reasons why
taxpayers fail to comply. This section is specifically being allocated for analysis of
this issue.
8.5.1 Reasons for non-compliance
As in previous sections of this chapter, two sources of information are available for
studying the reasons of non-compliance. First, data can be extracted from the files
that have been found guilty of evading their taxes in the years of 1995-1997, and the
second source is the results of interviewing income tax officers.
8.5.1.1 Reasons for non-compliance extracted from file data
Every file involved in evading income tax in the years of 1995, 1996 and 1997 was
scmtinised for the reason or reasons given by taxpayer for failing to declare his or
her income in the annual tax retum. Several reasons have been extracted from these
files - with one main reason being extracted from each file.
Let Ignorance - ignorance of income tax law
Preparer - tax preparer's faults
Excuses - forget to declare/careless/ account not yet prepared
No reasons - no reasons given
Clerk - wrongly prepared by the clerk
Others - reason/s other than above
186

The results obtained are as summarised in Table 8.19 below.
Table 8.19 Summary on reasons given for income tax non-compliance based on file data
Years 1995 1996 1997
Total Percentage
Reasons Extracted Ignorance
27 19 30 76
15%
Preparer 8 7 1
16 3.2%
Excuses 32 39 26 97
19.1%
No reason 100 120 95
315 62.1%
Clerk 0 2 0 2
0.4%
Others 0 1 0 1
0.2%
Total 167 188 152 507
100%
Source: Primary file data collection of this research.
Reasons given by tax evaders when they were detected by the income tax authority
in the years of 1995-1997, in their order of importance, are as follows:
1. No reasons given;
2. forget to declare/careless/ account not yet prepared;
3. ignorance of income tax law;
4. tax preparer's faults;
5. wrongly prepared by the clerk and
6. other reasons than the above.
H can be seen from Table 8.19 that 62.1 per cent of aH taxpayers found guilty of
evasion did not give any reason for their failure to declare their tme incomes. Hi
addition, 15 per cent pleaded ignorance of tax law and 19.1 per cent gave excuses
such as that they forgot to declare income sources or made careless errors. Thus the
96.2 per cent of taxpayers in these three categories gave limited or no reasons for
their evasion. Given that the IRB already had concrete information to go after these
taxpayers, especially those files under investigation and intelligence centres of the
IRB, it could be deduced that many tax evaders that Have been found guilty in the
years of 1995-1997 had a deliberate intention to evading their taxes, and were just
giving excuses for failing to do so.
187

8.5.1.2 Reason of non-compliance in relation to total income omitted, total tax
evaded and total penalty imposed
Table 8.20 below shows the mean value of income omitted, mean tax evaded and
mean penalty imposed on different reasons given by tax evaders for failure to
declare their income or incomes in their annual tax retums.
Table 8.20 Relationship between total income omitted, tax evaded and penalty imposed and reasons of non-compliance based on file data
Total income omitted
Total tax evaded
Total penalty imposed
Reason
Ignorance Preparer Excuses No Reasons Clerk Others Ignorance Preparer Excuses No Reasons Clerk Others Ignorance Preparer Excuses No Reasons Clerk Others
Total (N) 77 16 96 315 2 1 77 16 96 315 2 1 77 16 96 315 2 1
Mean (in RM) 22,700 372,800 11,200 436,400 38,300 9,900 4,500 157,200 1,600 166,300 11,200 985 3,024 86,165 1,166 79,081 7,247 591
Source: Primary file data collection of this research.
Examining the reasons given in terms of other characteristics of the files is also
revealing. As we have seen, more than 62 per cent (315 files out of 507 files) failed
to give reasons for their failure to declare their tme income. Table 8.20 shows that
the files where no reason was given were larger than average, resulting in omission
on average of more than RM400,000 of their income. This in tum led to an average
of more than RMl66,000 income tax loss and penalties on average of more than
RM79,000. This 'no reason' files accounted for 93.9 per cent of total income loss,
again suggesting the prevalence of intentional non-compliance. It is also notable
that the average income loss 'preparer' files is High.
188

Hiterestingly, although this 'no reason' ranks first in the list in terms of mean
income omitted and mean tax evaded, it comes second in terms of mean penalty
imposed by the IRB. Files for which tax preparers' faults were cited as the reason
attracted the Highest average penalty, ft is possible that the IRB penalised those
taxpayers who gave their reason as tax preparer's fauH, so as to discourage them
from Hiring unethical tax agents who might have helped them to falsify their yearly
business accounts.
8.5.1.3 Viewing income tax officers' opinions on reasons of non-compliance
The second method concems the interview of income tax officers.
The rate of penalty imposed by the IRB officers is guided by the Malaysian Income
Tax Law, whereby the more offences one has committed, the heavier the penalty
will be. However, some consideration would be given to taxpayers who have
appealed to the officers involved, with the approval of the Director General of the
IRB. This appeal will be based on reasons given by taxpayers on their failure to
declare their incomes and on the recommendations made by these officers. Hence
these officers play important role in determining the rate of penalty imposed on
these non-compliants, and in the process gain insight into the real reasons for non-
compHance.
The respondents were asked to arrange the reasons of non-compliance (as in
Appendix 1) in their order of importance. Scores were given, with 5 points to the
top reason in the list, 4 points to the second in the list, 3 points to the third in the
list, 2 points to the fourth in the list and 1 point to the last reason in the list. The
results are tabulated as in Table 8.21 below.
189

Table 8.21 Scores on interview of income tax officers regarding reasons for non-comp
Branch
Kuala Lumpur
Johor Bahm
Pulau Pinang
Kota Kinabalu
Total no. of scores
Percentage
lance Ignorance
57
68
70
62
257
18.9%
Intention
80
78
88
78
324
23.8%
Loopholes
76
76
69
67
288
21.1%
Strain
40
58
50
49
197
14.4%
Preparer
83
69
86
59
297
21.8%
Total
336
349
363
315
1363
100%
Source: Primary interview data collection of this research.
One notable feature of Table 8.21 is that each of the five reasons offered atfracted
significant scores, with the reasons getting the highest scores being intentional
evasion (23.8 per cent of total points), tax preparers (21.8 per cent) and use of
loopholes (21.1 per cent).
Reasons for non-compliance according to respondents in their order of importance
are as follows:
1. Taxpayers' intentional evasion.
2. Tax preparers play important role in the omission of income among
taxpayers.
3. Taxpayers taking advantage of the loopholes in the Income Tax Legislation
4. Taxpayers' ignorance of the income tax law.
5. Taxpayers practice evasion because of financial sfrain.
Again the income tax officers of the IRB were of the opinion that taxpayers evade
their income taxes because they have their own intention to do so. Thus this
confirmed the results in Section 8.5.1.1 above. In relation to the use of tax
preparers, it was found in Section 8.5.1.1, using file data, that for only 3.2 per cent
of the files involved in evading taxes was the fault of tax preparer cited as the
reason. But in this section, the respondents were of the opinion that tax preparers
also play important role in the omission of the income tax. The difference might be
due to the samples taken, for not all files that had been falsified by tax preparers
have been detected and some of these taxpayers did not reveal the real sittiation.
190

They may not have revealed the real situation because they were afraid that the IRB
would investigate the problems thoroughly, and this would cost them more. Tax
preparers or tax practitioners possess the means to exert an extraordinary influence
on tax compliance process. Their knowledge of tax mles and enforcement
procedures far exceeds than that of ordinary taxpayers, and they also possess the
expertise to assist their clients in exploiting opportunities for tax non-compHance.
Furthermore, individuals carrying on a business in Malaysia (except incorporated
companies) are not required to submit audtted accounts with their annual tax
retums. Thus small traders and those with a high proportion of cash fransactions,
like restaurant owners and hawkers, are most likely do not keep proper business
records and are totally dependent on their tax preparers. As suggested by Radcliffe
Commission (1955, United Kingdom) evasion can begin with careless record
keeping.
In line with the findings of Vogel (1974), Wameryd and Walemd (1982), financial
sfrain was not an important factor in evading taxes for 85.6 per cent of our
respondents were not of opinion that financial strain is an important factor in
evading taxes as depicted in Table 8.21.
8.5.2 The use of tax agent
IRB has a list of approved tax agents for taxpayers to refer to if they have any
problem or problems regarding taxation. However, there are some unapproved tax
agents who operate to help taxpayers and who charge them at a much lower rate.
Usually their correspondence with IRB is without letter heads, as though the letter
was written by the taxpayer. They dare not reveal themselves so that the IRB cannot
detect their activities.
Based on our results obtained from file data there is a relationship between tax
agent service and total income omitted, total tax evaded and total penalty imposed
by the IRB.
191

Among this sample of tax evaders, only 182 of them making used of approved tax
agents and the remainder (325) did not use a tax agent or used an unapproved tax
agent in lodging their annual tax retums instead. Thus only 36 per cent of these
taxpayers making use of approved tax agents and 64 per cent were not. Hence only
modest number of taxpayers in the sample hired approved tax agents. However, the
use of unapproved tax agents on income tax non-compliance could not be
determined by the IRB, unless it was revealed by the taxpayers.
Table 8.22 below shows the mean value of income omitted, mean tax evaded and
mean penalty imposed on taxpayers who did not use tax agent's service (no tax
agent) and used tax agent's service (tax agent) in the file data. These data are quite
separate from the reasons given for evasion - they concem simply whether, in the
files in question, a tax preparer was used.
Table 8.22 Relationship between total income omitted, tax evaded,
Total income omitted
Total tax evaded
Total penalty
imposed
Use of tax agent
No tax agent
Tax agent
No tax agent
Tax agent
No tax agent
Tax agent
Total (N)
325
182
325
182
325
182
Mean (inRM) 91,553
640,499
15947
276,061
6,554
134,720
Source: Primary file data collection of this research.
Based on the Table 8.22, it could be seen that there was a big difference in the mean
income omitted, mean tax evaded and mean penalty imposed between those
taxpayers who used tax agents and those who did not hire tax agents. The total
number of files using tax agents is about half of those who did not hire tax agent,
192

but the mean of total amount of income omitted by these files was more than seven
times of those who did not use tax agents. About 80 per cent of total income omitted
in these files were in cases in which tax agents were used. The mean tax evaded in
preparer files was more than seventeen times, and the mean penalty was more than
twenty times, that in those files not using tax agents. But the larger taxpayers will
use tax preparers, so that there will be a natural income bias.
8.6 Conclusions and Limitations
The most common type of non-compHance based on file data is failing to declare
income followed by under-declaring income. The opposite is tme based on
interview data. The difference could be attributed in part to the ranking
methodologies used, and especially to the fact that only one type of non-compliance
was extracted from file data. However, over-claiming expenses and deductions were
found only in the OG (non-salary eamers) files. Thus the IRB officers should pay
more attention to the business accounts prepared by taxpayers or their accountants,
for this group of taxpayers have more opportunities to misrepresent their tme
income compared to salary eamers or taxpayers registered under SG files due to the
nature of income that they receive. As for salary eamers, they might have not
reported their additional sources of income (other than employment income), hence
modem technology like on-line cash transactions with other organisations or
departments could be a usefiil tool to detect such activities by detecting the
abnormal amount of payments made by taxpayers when compared to their declared
amount of income in their yearly annual tax retums.
In organising its activities, the IRB should target those who are more inclined to
evade their income taxes the most. Based on the above results it should target these
groups of taxpayers: middle-aged groups, male taxpayers, high-income and middle-
income eamers, self-employed or taxpayers registered under OG group.
Tax agents were found to have helped taxpayers to evade more taxes compared to
those who did not hire tax agents. Hence the IRB should organise seminars to tax
agents, cultivating their sense of responsibility in preparing their clients' accounts
193

besides informing them of possible consequences that they have to face like
publishing their names in the IRB annual reports (as done in Australia), or
terminating their business licence with the help of business registration department
if after several reprimands, they were still found to continue helping their clients in
evading their income taxes. Another altemative is to advice OG taxpayers to select
only good reputation tax agents in preparing their annual business accounts, instead
of being penaHsed heavily by the IRB.
The above findings in relation to file data and interview data only hold tme for the
sample collected hence could not be generalised for the whole population because
of the following reasons:
(i) the files were not randomly sampled and
(ii) the interview carried was very selective.
By assuming that such findings hold tme for all non-compliance population, hence
the above findings would give some ideas regarding the characteristics of these non-
compliants and the reasons why they fail to comply with the IRB. It should be noted
that this study's results would only reflect the demographic of tax evaders
neglecting tax avoiders who are difficult to detect by the taxation authority. These
non-compliants' characteristics and causes of non-compliance were extracted from
the individuals' files who Have been found guilty in evading their income taxes
from four different branches of IRB in the years of 1995-97 besides interviewing
some income tax officers. Thus these results will not give any tax attitudes or
perceptions of the Malaysian taxpayers regarding the Malaysian Income Tax
System.
In studying the characteristics of non-compliants and the reasons why they failed to
comply, since the study was conducted in four different branches of IRB, thus the
sample of taxpayers were only limited to the total number of omission and
investigation cases that Have been finaHsed in the years of 1995, 1996 and 1997
from these four different branches of IRB that have been recorded in the books of
omission and listed in the books of files under investigation. Furthermore, not all
files from these branches were being audited or investigated. Only suspected
194

taxpayers were subjected to these activities. However, by studying the
demographics of these tax evaders, at least the IRB has a basis in targeting this
particular group of taxpayers in channelling its effort to combat non-compliance.
Further, by studying reasons of non-compliance, the taxation authority can enforce
proper strategies in overcoming this problem.
Hi comparing the pattern of income tax non-compHance from file data to the
population of Malaysia, since the characteristics like genders and age levels among
taxpayers in Malaysia were not available in the IRB record, thus we used the labour
force survey report 1998 instead. Since the survey population of the labour force
survey was defined to cover persons who lived in private living quarters and hence
have excluded persons residing in institutions such as hotels, hostels, hospitals,
prisons, boarding houses and military barracks. Hence the population (reference)
data for these demographics is also restricted to the population coverage of the
labour force survey. As a result, this might introduce some errors in comparing the
findings to the reference. It would be of great help if the IRB keep these
demographic records for future researchers to explore this area of study.
195

CHAPTER NINE
Enforcement Analysis and Strategy Recommendations
9.1 Introduction
Studying income tax non-compHance will be incomplete without proposing some
strategies to overcome this problem. In proposing strategies, it will be usefiil to
highlight some of the major weaknesses in existing system, and to gather some
strategies that have been introduced by other taxation offices, especially the ATO in
Australia and the IRS in the U.S. to counter such problems in their own countries.
This chapter consists of three sections. Section Two analyses the current enforcement
system of the IRB. It explores some of the weaknesses, drawing an information
gathered from our respondents, from the survey carried during Taxpayers' Service
Week in 1997, from past studies done by Wallschutzky and Singh (1995) and from
our analysis on the nature of taxable income procedures of the IRB compared to the
ATO. Some of the weaknesses of the current enforcement system include its detection
rate, which is very low, and its method of selection cases for detection which is not
efficient. Further, the IRB places stress on penalties but its penalty system is
inadequate to change the behaviour of average taxpayers.
This section also discusses some major loopholes in the Malaysian Income Tax
Legislation that have been addressed by Wallschutzky and Singh (1995), and which
promote income tax avoidance. As discussed in Chapter Six, currently partnership and
tmst incomes are assessed separately but are taxed under individual taxpayers'
income tax files. This will contribute to inefficiency in collecting taxes for these
incomes. With fiinge benefit income, IRB relies on individual taxpayers to report this
in their annual income tax retums, or it is reported by their employers in the
employees' annual income statements. Thus they may introduce room for employers
to collude with their employees in not reporting fiinge benefit income in their
employees' annual income statements.
196

Section Three discusses some strategy improvement recommendations to overcome
thesie weaknesses. It discusses in eight main areas. They are as follows: 1) adopting
proper enforcement practice uniformly in all of IRB branches; 2) working closely
with third parties; 3) adopting modem facility and skilled staff and strengthening
detection activity; 4) introducing of new tax procedures; 5) improving tax knowledge/
education among the public; 6) introducing new mles and regulations; 7) amendment
of its income tax law and 8) upgrading its research and development. Section Four
summarises the conclusions of this chapter.
9.2 Analysis on the Current Enforcement System
The enforcement system of the IRB plays an important role in combating income tax
non-compliance. Hence we have analysed some of major activities that have been
conducted by the IRB in overcoming this problem, such as audit/investigation
activity, the penalty system and exposure of some major loopholes in the Malaysian
Income Tax Legislation that might promote income tax avoidance. We also have
analysed the post-mortem of a Taxpayers' Service Week survey that had been
conducted by the IRB in 1997 and some weaknesses revealed in the analysis of
taxable incomes and of the taxing procedures of the IRD/IRB, compared to the ATO
(as discussed in Chapter Six).
9.2.1 Detection activity
Detection activity plays an important role in determining taxpayers' behaviour
towards non-compliance; hence it's important role in combating non-compliance. As
argued by behavioural scientists, taxpayers' perceptions of the level of this activity
are vital in confrolling tax evasion. Hence we Have explored it in two main areas: a)
estimating percentage of taxpayers being caught and b) the method of selection for
detection.
9.2.1.1 Estimating percentage of tax evaders being caught
Estimating the percentage of tax evaders being caught by the taxation authority is
indirect way of measuring the rate of detection, for we do not have complete data
regarding the frequency of this activity conducted by the IRB nor on the total number
197

engaged in non-compliance. However, this analyses enables one to draw some
conclusion about JRB enforcement in overcoming this problem.
The total number of taxpayers that had been caught evading their income taxes in the
years of 1995, 1996 and 1997 from four branches of the IRB of Malaysia is compared
with total number of registered individual taxpayers in these three years in the
respective branches in Table 9.1 below.
Table 9.1 Estimated percentage of tax evaders in four different jranches of IRB Branch of the IRB Kuala Lumpur
Johore Bahm
Pulau Pinang
Kota Kinabalu
Total
Year
1995 1996 1997 1995 1996 1997 1995 1996 1997 1995 1996 1997
No. of registered individual taxpayers*
736316 720250 705444 144178 172304 181079 187627 166176 158619 126326 96655 98580
3493554
No. of tax evaders detected
42 54 27 20 25 19 32 33 25 73 76 81
507
Percentage of tax evaders (%)
0.0057 0.0075 0.0038 0.0139 0.0145 0.0105 0.0171 0.0199 0.0158 0.0578 0.0786 0.0822 0.0145
Source: Primary data collection of this research (file data) and IRD/IRB Taxation Statistics 1996, 1997 and 1998 (*population data).
The percentage of tax evaders that had been caught from these four branches of IRB
for the years of 1995, 1996 and 1997 is very small, being approximately 0.0145 per
cent or about one taxpayer in 7000. On average, the Kota Kinabalu IRB Branch had
the highest number of detected tax evaders with 0.07 per cent, and Kuala Lumpur has
the lowest number detected tax evaders with 0.006 per cent in these three years. These
differences are substantial, ranging from one in 1200 in Kota Kinabalu to one in
26,000 in Kuala Lumpur. For the years under study, 1996 has the highest number of
detected tax evaders with 0.016 per cent and 1997 has the lowest with 0.013 per cent.
Thus variations between the years is small, but only small proportion of taxpayers
have been caught in evading their income taxes.
198

Implication
This result implies that the activities carried by the IRB in combating taxpayer non
compliance is still very limited for only about one in 7000 of its registered taxpayers
were found guilty in evading their income taxes. This low detection rate seems to be
especially acute in Kuala Lumpur. Most of them (as found in Chapter Eight of this
research study) failed to give good reasons for doing so. This implies that many
intentionally evade their taxes and take the risk of being caught, for the detection rate
is low. As a resuH, this might encourage other taxpayers to take the risk in not
declaring their tme income. As noted by Smith and Kinsey (1987, pp.639-663),
Madeo, Schepanski and Uecker (1987, pp.323-342), the probability of audH was a
most significant factor in combating income tax non-compHance. Hence the IRB
should step up this activity to increase taxpayers' perceptions of the risk of detection.
Not only must the IRB do more, but it also must be seen to be doing more to increase
taxpayers' perception that they are at greater risk in not complying with the IRB.
This analysis Has some limitations, which should be noted although they do not affect
the central conclusion. They are as follows:
The total number of taxpayers being audited or investigated from these four different
branches of IRB were not available, for the IRB only keeps records on the taxpayers
found guiHy for its future reference. Hence the percentage of found guilty taxpayers
from those investigated or audited could not be determined. In estimating the
percentage of tax evaders, it is only limited to the total number of registered taxpayers
in these four different branches of IRB. Furthermore, not all tax evaders from these
four different branches were successfully detected by the IRB. Additionally, the total
number of files available was restiicted to those individuals' files that have been
found guilty and Have been recorded in the record books of omission and listed in
record books of the investigation branches of these four branches of IRB. Moreover,
some of these omission cases were not recorded in the record books of omission,
especially the SG cases (taxpayers with employment income or incomes). Thus file
data only covers the recorded cases of detected non-compliance, ignoring the
unrecorded ones.
199
9.2.1.2 Method of selection for detection
Currently, selection cases for investigation and audit are done manually by the IRB. H
involves information obtained through local knowledge, press reports, assessment
branches, informers and the application of a means test.
These methods are not the most efficient ones available for the detection of possible
non-compliance, and hence the IRB should upgrade its information system in
selecting cases for audits. An on-line operations system, linking various organisations
to the IRB, would be of great help to detect abnormal amounts of payment made by
taxpayers, compared to their declared income in their armual tax retums. It would also
be of great significance for the IRB to adopt modem tools of detecting tax evaders,
such as using computer analysis on the basis of Discriminant Function Formulas or
DIF, as adopted by the IRS in generating a probability of recoverable tax revenue. In
terms of improving the efficiency of the lodging of tax retums, the IRB could adopt
Electronic Lodgement Service. This would also be of great help in detecting tax
evaders, and is currently being used by the ATO. Similarly, IRB also could adopt Key
Abnormal Tax Agent Evaluation (KATE), that would allow it to detect tax
practitioners whose clients' retums vary significantly from the average of those of
other tax practitioners in the same region. This was discussed in Chapter Five.
9.2.2 Penalty system
The penalty system adopted by the IRB also may affect the rate of compliance among
its taxpayers. For example, the total level of penalties imposed by the IRB may
provide important factor in containing the total number of non-compliants in any year.
9.2.2.1 Increase reliance on penalty
Data gathered from four different branches of IRB are summarised as in Table 9.2
below.
200
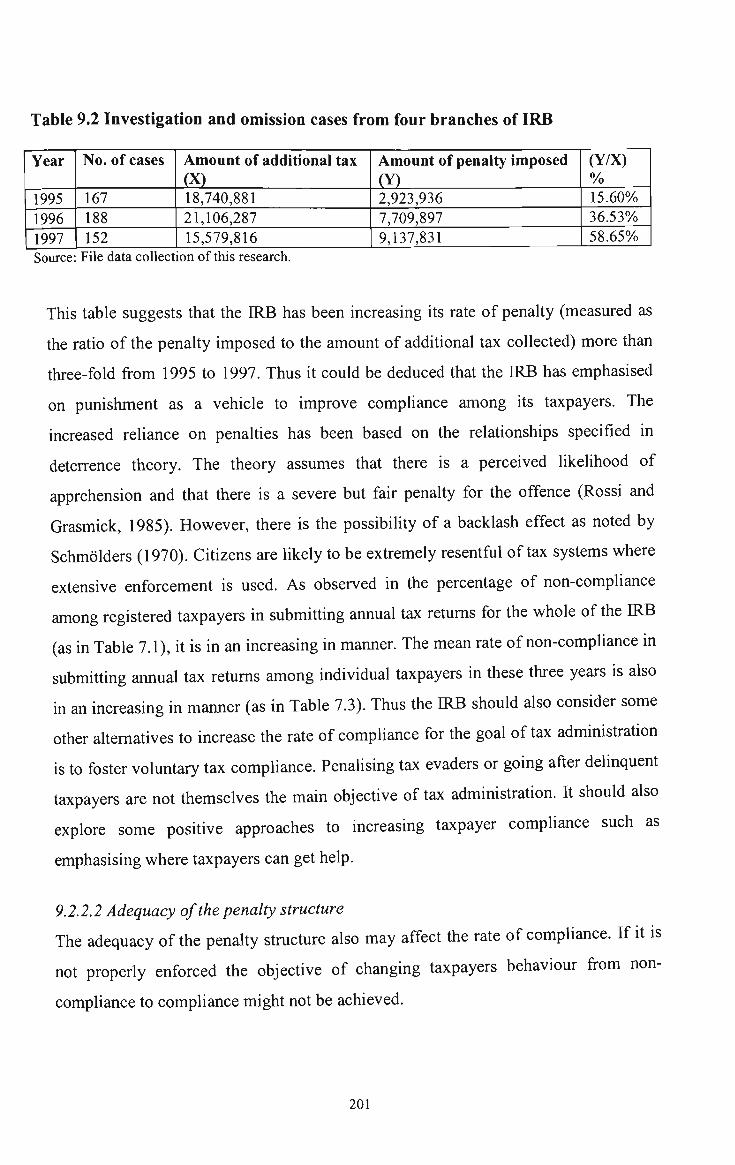
Table 9.2 Investigation and omission cases from four branches of IRB
Year
1995 1996 1997
No. of cases
167 188 152
Amount of additional tax (X) 18,740,881 21,106,287 15,579,816
Amount of penalty imposed (Y) 2,923,936 7,709,897 9,137,831
(Y/X) % 15.60% 36.53% 58.65%
Source: File data collection of this research.
This table suggests that the IRB Has been increasing its rate of penalty (measured as
the ratio of the penalty imposed to the amount of additional tax collected) more than
three-fold from 1995 to 1997. Thus it could be deduced that the ERB has emphasised
on punishment as a vehicle to improve compliance among its taxpayers. The
increased reliance on penalties has been based on the relationships specified in
deterrence theory. The theory assumes that there is a perceived Hkelihood of
apprehension and that there is a severe but fair penalty for the offence (Rossi and
Grasmick, 1985). However, there is the possibility of a backlash effect as noted by
Schmolders (1970). Citizens are likely to be exfremely resentful of tax systems where
extensive enforcement is used. As observed in the percentage of non-compHance
among registered taxpayers in submitting annual tax retums for the whole of the IRB
(as in Table 7.1), H is in an increasing in manner. The mean rate of non-compliance in
submitting annual tax retums among individual taxpayers in these three years is also
in an increasing in manner (as in Table 7.3). Thus the IRB should also consider some
other altematives to increase the rate of compliance for the goal of tax administration
is to foster voluntary tax compliance. Penalising tax evaders or going after delinquent
taxpayers are not themselves the main objective of tax administration. H should also
explore some positive approaches to increasing taxpayer compHance such as
emphasising where taxpayers can get help.
9.2.2.2 Adequacy of the penalty structure
The adequacy of the penalty stmcture also may affect the rate of compliance. If it is
not property enforced the objective of changing taxpayers behaviour from non
compliance to compliance might not be achieved.
201

Currently, the severity of the penalties varies with the nature of the offence and the
amount of penalty is frequently based on the discretion of the Director General of the
IRB (as the law stipulates maximum penalties). Similarly, if a taxpayer has been
successfiilly prosecuted in the court, the court has the discretion to determine the total
fine to be imposed. Furthermore, the Director General also has the power to
compound offences before the case is due for prosecution in court. Hi practice, the
maximum amount of penaHy is usually not imposed. This reveals some weaknesses in
the Malaysian penalty provisions, particularly the fact that the maximum penaHies are
in currency of fixed amounts. Some drawbacks of this penalty system, as discussed by
Wallschutzky and Singh (1995), are as follows:
1. Over time they lose their significance, as they eroded by inflation and
2. It might not be possible to discriminate adequately between large and small
offences.
They recommend that a better system of penalties would be one based on a
percentage of the tax that was not paid or altematively, fixed dollar amounts could be
indexed to account for inflation. As noted by Silvani and Baer (1997), a guiding
principle in the design of a good system of penalties and sanctions should be to
encourage taxpayers to settle their tax arrears quickly and to discourage them from
using legal challenges to delay the payment of taxes which have been correctly
assessed. In achieving these objectives, they recommend that the sanction and
penalties:
1. Should be levied promptly once liability Has been established.
2. Should not be excessive; penalties should be relatively mild since the
application of lesser penalties does not require, as a mle, a lengthy
administrative and judicial process.
3. The cost to the taxpayer of delay paying should However, be higher than the
prevailing market interest rates - the prime or LIBOR rate plus a spread. This
assumes that the penalties are determined on a percentage basis instead of being
fixed amount.
Experience has shown that it is preferable for penalties to be defined as a percentage
of the total outstanding amount of taxes (also recommended by Wallschutzky and
202

Singh in the above), in order to faciHtate adjusting penalty rates for inflation. The
sanctions and penalties should be designed to change the behaviour of the average
taxpayer, which requires that sanctions be applied to the largest possible number of
non-complying taxpayers.
9.2.3 Loopholes in the income tax legislation
Hicome tax legislation is important in determining whether it provides loopholes
otherwise to be exploited by some taxpayers to their advantage. Cutting out tax
loopholes is necessary, especially in the business taxation. This is necessary to allow
fair competition to take place. Ambiguity in the income tax legislation might promote
certain groups of taxpayers, especially those who are expert in this field (like tax
practitioners), to exploit these loopholes. Some of the loopholes in the Malaysian
Income Tax Legislation are as discussed below.
9.2.3.1 Discrepancy between law and compliance
Wallschutzky and Singh (1995) argued that although there is an anti-avoidance
provision (s 140) and some specific provisions like s 65, paragraphs 38, 39, 40, and
62 to Schedule 3 of the Malaysian Income Tax Act, 1967 to deter avoidance, there is a
gap where some people manage to squeeze through. Section 82 of the Income Tax
Act, 1967 requires every taxpayer carrying on a business to keep and retain sufficient
records to enable the IRB to ascertain income or loss from his or her business.
However, under s 82(4) the Director General may waive all or any of the provisions
regarding the keeping of records and the issuing of receipts. Hence this provides a gap
in the income tax legislation that might be exploited by some groups of taxpayers
regarding their record keeping and issuing receipts. Hence the IRB should amend its
legislation to close this loophole.
9.2.3.2 Benefits-in-kind income
Under the Malaysian Income Tax Act 1967, benefits-in-kind income such as
motorcars and related benefits, living accommodation. Household fiimishings,
apparatus and appliances, gardeners, domestic servants and so forth is taxable under
individual's income tax file. This income will be reported by the employers in
203
taxpayers' annual income remuneration, which will be submitted to the IRB by the
employees together with their annual income tax retums. However, some of these
taxpayers might have escaped paying taxes, due to the failure of their employers to
declare this income. Perhaps because they are not certain of the valuation of such
benefits. This could be due to the lack of guidelines and effective monitoring by the
IRB, giving the impression that this income is not important to report. As suggest by
Wallschutzky and Singh (1995), a fiinge benefit tax may need to be considered by the
IRB, to be levied on the employers (as is current practice for the ATO) for this type of
income.
9.2.3.3 Withholding tax requirements
The withholding tax requirements for all income only apply to the non-residents.
However, they do apply to residents in the cases of interest income that is paid or
credited by various deposit-taking institutions such as banks, finance companies, and
cooperative societies (Wallschutzky and Singh, 1995). As for salary eamers, their
taxes have been withheld by their employers either under PAYE or Schedular Tax
Deduction or STD as discussed in Chapters One and Four of this research study. Thus
the Malaysian personal tax deduction provisions are not adequate, especially for non-
salary eamers for it relies on information provided by taxpayers in their annual
income tax retums. The practice followed by the ATO is for certain other classes of
income to be subject to withholding tax arrangements, including income derived by
contractors operating in particular industries such as building, transport and cleaning.
This is achieved under the Prescribed Payment System or PPS, as discussed in
Chapter Five of this research study.
9.2.3.4 Opportunities to split income with others
Tax avoiders can practice income splitting if it is possible to transfer income to others
who will pay less tax. As discussed in Chapter Four, this is especially important under
a progressive rate stmcture, where high-income eamers can transfer income to lower
income eamers. In the case of husband and wife, it is possible for any savings by the
husband and wife to be invested in the name of the spouse who cams less. Similarly,
shares and other investments can be bought and sold in that person's name. Since the
204

IRB income tax rate stmcture is progressive in nature. Hence it is important for the
IRB officers to be alert and ask for proof in dealing with such income to avoid income
tax avoidance.
9.2.3.5 Opportunities to convert potentially taxable receipts into non-taxable receipts
Under Malaysian Income Tax Law, a non-resident taxpayer is subject to tax in respect
to income accming, arising, or derived from Malaysia. Hence if a non-resident had
offshore income, it would be free from Malaysian income tax if it is brought into
Malaysia. As for resident taxpayers, their offshore income will be taxable if and only
if it is being remitted into Malaysia. This implies that a resident taxpayer can enjoy
his offshore income by not remitting it into Malaysia. He also will be able to enjoy the
use of this income, such as by purchasing offshore assets or using it as collateral for
loans that are made to Him in Malaysia. Hence, as suggested by Wallschutzky and
Singh (1995), the Malaysian Income Tax Law needs to be amended to ensure that
Malaysian residents are taxed on worldwide income as and when it is derived.
9.2.4 Analysing weaknesses exposed in the post mortem of Taxpayers' Service
Week's survey
Taxpayers' Service Week was first introduced in 1991. Every year the IRB opens its
counters for one week in various places that are accessible to the public in all
branches of IRB (as discussed in Chapter Four of this research study). IRB also
conducted a survey during Taxpayers' Service Week (MPPC) in 1997. The total
number of respondents to this survey was 4,215. The highest percentage of the
respondents was employees or the SG group (86 per cent) and followed by sole-
proprietors or OG group (9 per cent). This difference could be due to the nature of
communication with IRB. Usually, taxpayers from OG group are represented by tax
agents or accountants and seldom use Taxpayers Service Week as do SG group
taxpayers. The main findings of the above survey were as follows:
1. For all categories of respondents, about 29 per cent of the respondents did not
know their responsibiHty to contact the taxation office if they were taxable and
did not receive their annual retums by 14 April each year.
205

2. About 86 per cent of the respondents knew their responsibility to inform the
taxation office regarding any changes in address.
3. About 83 per cent of SG group and only 73 per cent of OG category understood
that they Have to submit their annual tax retums although currently they are
taxed under Schedular Tax Deduction (STD) Scheme.
4. About 82 per cent of SG group taxpayers understand that it is an offence not
declaring all of their income to taxation office, while only 73 per cent comes
from OG group understood this fact.
Several inferences could be extracted from the above survey. They are as follows:
1. Not all Malaysian taxpayers are tax literate, thus the IRB could take some
fiirther actions to overcome this problem. The IRB should be more aggressive
and pro-active in upgrading tax knowledge among the public, especially
regarding their responsibility in declaring their incomes and the consequences
they face if they fail to do so. This could take place via the mass media,
distributing pamphlets and establishing regional tax fomms and liaison groups.
2. In comparing SG and OG group taxpayers, the OG category has less knowledge
and is too dependent on tax agents, and are thus not well-informed about
taxation. Thus the IRB should concentrate on this particular group in
conducting its activities.
9.2.5 Weakness in the assessment procedure
As seen in Chapter Six, partnership and tmst incomes are being assessed separately
by the partnership/tmst unit of the Assessment Branches of the IRB. At the same
time, these taxpayers are also required to estimate their partnership/tmst income in
their annual income tax retums. Hence, for these taxpayers income tax will be first
assessed according to their declared income in their annual income tax retums and
finalised when the information regarding their partnership/tmst income being received
from partnership/tmst unit of the IRB. Hence, these incomes are assessed under
individuals income tax files, by contrast with the present practice of the ATO. H will
be more efficient for the IRB to assess these incomes separately (as done by the
ATO), for it takes time for the information from partnership/tmst unit to reach
206

taxpayers' personal income tax files and some of them might be lost/misplaced and
even wrongly enclosed during filing time.
9.2.6 Weaknesses highlighted by our respondents and their suggestions
As noted earlier, we also have conducted a survey among the Inland Revenue Board
officers in these four different branches of IRB. Fifteen income tax officers were
chosen from each branch. The respondents were chosen based on those who have
raised the omission cases or involved in the investigation of the files in the 'file
data ". They were given the opportunity to comment/ give some possible causes of
non-compliance and some suggestions to improve this problem. Some comments that
have been forwarded by the IRB officers are as follows:
1. Ineffectiveness and slow enforcement by the IRB in regard to those who
involved in income tax non-compliance.
2. Street surveys should be introduced in some branches, such like Johor Bahm, so
that many others who are liable to tax should be registered and pay their share
oftax.
3. IRB was slow in liasing with employers and other groups.
4. The lack of an up-to-date, centralised Collection System makes taxpayers feel
reluctant to pay tax.
5. Shortage of manpower and equipment to detect potential taxpayers.
6. The requirement for business licence approval should include proof that the
person has been registered and contacted IRB. 7. IRB should be firm when imposing penalties for intentional tax evasion.
8. IRB should be firm in taxing benefits-in-kind incomes, for some firms fail to
declare these incomes in their employees' annual income statements and hence
their employees did not pay their taxes on these incomes.
Besides the above comments, the respondents also give some usefiil suggestions.
Some suggestions that have been forwarded by them are as listed below:
1. Immediate actions, as provided under the law, should be taken on income tax
non-compliance and this should be made public, so as to provide a good lesson
to the public.
207

2. The IRB should employ skilled, efficient officers in the enforcement or
prosecution divisions.
3. Steps should be taken to educate taxpayers, especially starting from college or
university level, in regard to income tax law, and also cultivating their sense of
responsibility and moral obligation to this country by disclosing the importance
of their taxes for the development of this country.
4. Dialogues should be held to inform taxpayers of the current taxation system.
5. An increased the level of public awareness should be sought, especially through
mass media and posters should be placed at strategic public areas.
6. By linking up all govemment agencies and departments, hence tax evaders
could easily be traced.
7. IRB should strengthen field audit teams.
8. A simplification of tax law is essential to increase tax compliance.
9. Full examination of accounts, involving a personal approach or a visit to
business premises and designed to test the accuracy of the information supplied,
should be engaged.
10. A critical and detailed investigation of books and the proprietors' financial
affairs should be undertaken where fraud is suspected or discovered.
11. As for cases with lawyers, since they are very well informed about income tax
regulations, their names should be submitted to the Bar Council so that their
license will not be renewed if they fail to comply with the IRB mles and
legislation.
12. Regulations should be made whereby only registered and approved tax
preparers are eligible to represent taxpayers, to avoid these tax preparers taking
advantage of innocent taxpayers.
9.2.7 Weaknesses in the administrative procedures
As pointed out by Wallschutzky and Singh (1995), there are unbalanced
administrative procedures whereby the IRB imposes strict limits whenever a taxpayer
is required to act but there are no corresponding time limits imposed on the Director
General. They argued that if income tax is not paid within the stipulated time limits, a
208

penalty is imposed. On the other hand, if the IRB delays refiinding any amount due to
taxpayer, no penaHy (in the form of interest) is imposed. Additionally, it has been
established that in a number of court decisions that once an assessment has been
issued, the tax assessed must be paid notwithstanding an appeal. Regarding appeals,
especially to the Special Commissioners of Income Tax (if the taxpayer is dissatisfied
with the Director General's decision on his objection), in practice it is not a speedy
process and it may remain umesolved for a considerable period of time. All of these
weaknesses on the part of the IRB would have an impact on taxpayers that can
influence their compliance decisions. Hence, the IRB also could play its part by
improving its administrative procedures, especially in dealing with tax refimds,
objections and appeals from taxpayers.
9.3 Discussion on Strategies Recommendation
Based on the weaknesses discussed above, we would like to propose some strategies
to overcome these weaknesses, besides taking into considerations the comments made
by our respondents.
As seen in Chapter Six, the percentage of estimated extent of income tax non
compliance in Australia and the U.S. appears to be very much smaller than the extent
of non-compliance in Malaysia. Thus it could be inferred, in part, that the ATO and
the IRS are superior to the IRB in combating this problem. As a result, we would like
to suggest some strategies that have been adopted by the ATO and the IRS in
combating this problem, that are not currently adopted by the IRB. Some other usefiil
strategies also could be exfracted from some advanced countries, as discussed in
Chapter Four, and can also be gathered from the suggestions that have been proposed
by our respondents.
Since clients are the hearts of its business, the strategies recommended are of "Client
Service Focus". This requires increasing awareness of the importance of courteous
and quality service among staff and the community. Quality service makes good
sense, as it costs less to collect revenue if people understand the tax laws and comply
voluntarily than if they make mistakes or forced to comply.
209

Our strategy improvement suggestions can be categorised into eight categories as
foHows:
1. Adopting a proper enforcement practice uniformly in all of its branches.
2. Working closely with third parties.
3. Adopting modem facility and skilful staff and strengthening detection activity.
4. The introduction of new tax procedures.
5. Increased emphasis on tax education.
6. Introduction of new mles and regulations.
7. Amendment of income tax law and
8. Upgrading of IRB research and development.
9.3.1. Adopting a proper enforcement and practice uniformly in all branches of
IRB
Various piece of evidence have been presented in this thesis to suggest that income
tax non-compliance is a substantial problem. However, only a small number of
taxpayers Have been found guilty of evading their taxes. As found in Table 9.1 above,
only 0.0145 per cent of tax evaders were found guilty in evading their income taxes in
the years of 1995,1996 and 1997 from four different branches of IRB. This implies
that the IRB has not done enough to combat non-compliance. Our respondents are
also of the opinion that the activities that are currently undertaken by the IRB are still
inadequate to combat income tax non-compliance in Malaysia. Particularly attention
needs to be given to the detection of tax evasion in Kuala Lumpur.
As for failure to submit annual tax retums, the IRB should take some actions, such as
publicising in the mass media the consequences for failing to notify the change of
address to taxation authority. This also could highlight the importance of submitting
their annual tax retums to taxation authority, for some taxpayers still do not
understand their role as taxpayers. Some of the respondents were of the opinions that
the IRB was slow in liasing with hawkers and employers; this might cause these
taxpayers to continue evading their taxes and the latter delay in remitting the withheld
taxes to the IRB. The Hicome Tax Law on withholding employees' taxes will not be
effective if the IRB does not act firmly on those employers who failed to remH their
210
employees' taxes and punish accordingly those who have found guilty in evading
their taxes. Similariy, the IRB also has not paid serious attention to the benefit-in-kind
incomes, hence some firms have failed to declare these incomes in the employees'
annual income statements. Thus some employees failed to declare their benefit-in-
kind incomes, which results in an imbalance in the burden of tax, whereby only
honest employees who declared these type of incomes paid more than those who
failed to declare in their annual tax retums. Hence there is a loophole that should be
considered seriously by the IRB management. As for non-registered taxpayers, the
IRB could highlight their role to notify chargeability to tax to the IRB and the
consequences they Have to face if they fail to do so.
The IRB should properly implement the current enforcement practice uniformly in all
of its branches. As found in Table 9.2, different branches of IRB impose different
rates of penalty on tax evaders. Thus there is a gap in interpreting the Income Tax
Law, especially on evasion. The respondents also have suggested that the IRB should
be firm in imposing penalties for intentional tax evasion and should take prompt
action in liasing with hawkers. They also recommended that a fiill examination of
accounts should be undertaken involving a personal approach or a visit to business
premises designed to test the accuracy of the information supplied, especially where
fraud is suspected or discovered.
We also would recommend that the IRB adopt a better system of penalty and
sanction, as suggested by Silvani and Baer (1997), to encourage taxpayers to settie
their tax arrears quickly and to discourage them from using legal challenges to delay
payment of taxes which have been correctly assessed. Hence the sanctions and
penalties should be levied promptly, should not be excessive but be determined on a
percentage basis instead of being a fixed amount. At the same time, IRB also should
give a good example to taxpayers, by not delaying taxpayers' refimd, and should try
to improve its administrative procedures, especially in dealing with taxpayers'
objections or appeals, which can influence taxpayers' compliance decisions. Thus, it
is recommended that the IRB should strengthen the current enforcement system, as
211

well as introducing new approaches in controlling this problem. The IRB also should
improve its current administrative procedures and adopt a better penalty system.
9.3.2 Work closely with third parties
Tax enforcement is a behavioural problem and its success depends on group
cooperation. Thus the IRB should work together with intermediaries in enforcing
voluntary compliance. The IRB administrative should be effective in dealing with this
problem by strengthening its linkage with other organisations like making agreements
with employers or other organisations that always deal with public. The IRB also will
be able to fiinction more effectively and more efficiently with a sfrong cooperation
from employers by withholding of taxes such as PAYE and PPS as practiced by the
ATO. The current system of STD whereby the amount payable is pre-determined by
the taxation authority directed to the employers based on the previous year eaming is
changed to the current year eaming withheld by the employers and the contractors for
payment of taxes of their employees and sub-contractors.
As seen in Chapter Three, tax practitioners play important roles in enhancing
voluntary compliance by disseminating income tax knowledge to their clients and
explain the mles and regulations that are expected by the taxation authority. Thus, it is
wise for the IRB to tackle these practitioners and work closely with them to
understand the problem of non-compliance that are currently faced by their clients.
The IRB is also encourage to work hand in Hand with other organisations especially
regarding their information through computer on-line of large amount of cash
transactions replacing the traditional information through letters, which takes time to
process or might be lost during filing time.
With the introduction of Self-Assessment System, more taxpayers will be expected to
tum to tax professionals for assistance as mirrored in Australia (as discussed in
Chapter Five). As a consequence, tax practitioners are therefore in a position to exert
a strong and direct influence on the compliance and tax administration process (Erard,
1993). Hence it is wise for the IRB to tackle these tax professionals, work hand in
hand with them besides amending Income Tax Legislation, closing some possible
212

loopholes that might be exploited by them. If their roles go beyond the obligation to
serve their taxpayers' interests, then introducing preparer penalty is an option.
9.3.3 Adopting modern facility/skilful staff and strengthening detection activity
Currenfly the IRB depends on traditional methods of information from various
resources like obtaining through local knowledge, press reports, assessment branches,
informers, and the application of a means test. These methods are not efficient ones
hence the IRB should upgrade its methods of detection. H would be beneficial for the
IRB to adopt various methods that have been adopted by the ATO and the IRS in
detecting tax evaders in Ausfralia and the U.S. It could adopt the Self-Assessment
System that has been practiced by the ATO in improving its assessment activity
besides imposing on taxpayers an obligation to maintain appropriate records and
reasonable care in reporting matters. It is of great importance for them to obey the
mles properly for their tax Hability information would determine whether they would
be liable to post-assessment audit activity or otherwise. The current "tick and flick"
processing of retums is time consuming and cost ineffective hence less productive.
However, we would like to suggest to the IRB to increase taxpayers' income tax
knowledge before imposing such system, for it would be unfair and would become a
burden to taxpayers. It would be of great significance for the IRB to adopt modem
tools of detecting tax evaders, such as using computer analysis on the basis of
Discriminant Function Formulas or DIF, as adopted by the IRS in generating a
probability of recoverable tax revenue. In terms of improving the efficiency of the
lodging of tax retums, the IRB could adopt Electronic Lodgment Service. This would
also be of great help in detecting tax evaders, and is currenfly being used by the ATO.
An on-line operations system, linking various organisations to the IRB, would be of
great help to detect abnormal amounts of payment made by taxpayers, compared to
their declared income in their annual tax retums.
IRB also should adopt approach as use by the ATO in Key Abnormal Tax Agent
Evaluation (KATE) in detecting tax practitioners whose clients' retums vary
significantly from the average of those of other tax practitioners in the same region as
discussed in Chapter Five of this research study.
213

Modem technology require skilfiil staff to operate the system, thus the IRB should
provide special training for its staff before adopting this modem technology. The
organisational success also depends on its staff capabilities and their skills in handling
this problem effectively. Thus it is wise for the IRB to conduct leadership program in
improving its staff skills in coping with various issues related to this problem.
Detection of tax evaders is vital in combating income tax non-compliance. Hence it is
important for the IRB to be aggressive in detecting tax evaders and abusive avoiders
by adopting several activities that have been conducted in some advanced countries
besides strengthening its current enforcement. Non-compliance becomes a problem
due to lacking in facility to detect tax evaders more effectively instead of depending
on traditional means of detecting tax evaders. Detection of tax evaders is also
important in enhancing voluntary compliance. As reported by Witte and Woodbury
(1985), audit strategy is effective in combating non-compliance among small business
owners or cash transaction tax evaders. Further, a number of researchers also have
found that the probability of audit on compliance decisions has been found significant
(Smith and Kinsey, 1987; Madeo, Schepanski and Uecker, 1987). Hence the IRB
could use this strategy in combating income tax non-compliance among small
business owners, stall owners and so forth. This strategy also must be seen actively
activated in detecting tax evaders, hence they will be at higher risk if not complying
to the IRB.
In relation to cash economy tax evasion, the IRB should form a Cash Economy Task
Force as done by the ATO to study this problem thoroughly and provide suitable
sfrategies in dealing with these taxpayers like hawkers, small fraders and food stall
owners. As suggested by our respondents, business registration office also could play
its role in improving income tax compliance whereby it should also include proof that
the clients have been registered or contacted with the IRB in approving their business
licences.
214

The audits will be more effective if the IRB could target those who are more inclined
to evade their taxes. This could be done by segmenting the present taxpayers into
three groups as follows:
1. Most incline to evade their taxes with the current tax enforcement and
regulation.
2. Most unlikely to evade their taxes with the current tax enforcement and
regulation.
3. Others who do not include in (1) and (2) above.
This categorisation could be done based on taxpayers' past history on taxation and
research conducted by the Research and Development (R&D) section of the IRB.
Audits activities will be conducted based on these segmentations and will be reviewed
from time to time based on their performance.
9.3.4 Introduction of new income tax procedures
Regarding the benefit-in-kind incomes, the IRB could introduce Fringe Benefits Tax
as adopted by the ATO, which has been discussed in Chapter Five of this research
study. As seen in Chapter Six, the IRB should also assess and tax partnership and tmst
incomes separately as done by the ATO, for the current procedures of taxing fringe
benefits, partnership and tmst incomes under individual taxpayers have several
weaknesses as discussed earlier.
9.3.5 Improving tax knowledge/education among the public
Tax education is necessary in increasing public awareness about taxation especially
regarding taxation laws, the necessity of taxation for the development of the country
especially in disseminating information like where the collected taxes have been
channelled and so forth. It is also useful to educate taxpayers or potential taxpayers
regarding taxation and their share of responsibility to the country. This could be in the
form of dialogues, seminars or with cooperation of Ministry of Education in
introducing it as a subject in upper secondary schools or college levels. Punishing the
ignorant taxpayers is not the aim of the JRB. Only the 'hardcores' that have the
intention to evade their taxes should be punished accordingly.
215

Hi disseminating tax knowledge to taxpayers, the IRB could enclose tax pack together
with the annual tax retums or organising seminars to the public about mles and
regulations that are expected by the IRB in filling in their annual tax retums. It could
also stress various consequences that they have to face for failing to obey such
regulations or failing to declare all or part of their incomes. This is very important for
the main aim of the IRB is to punish the delinquent taxpayers instead of punishing the
ignorant ones. As suggested by our respondents, IRB also could increase the level of
public awareness through local mass media and some posters by placing them at
strategic public areas. The Ministry of Education also could play its role by
introducing taxation as a compulsory subject to the upper secondary level for these
students are the potential taxpayers. The syllabus should include the past statistics of
taxpayers' revenue that have been channelled by the govemment in developing this
country. Many researchers have agreed that if they were feedback to taxpayers on the
allocation of tax collected, this would have a positive effect on voluntary compHance.
It also should include various tax laws so that it could educate them and encourage
them to comply voluntarily.
It is also recommended that the IRB should held dialogues with the public as
suggested by our respondents to inform taxpayers of the current taxation system. The
dialogues also will be helpful if attended by tax agents whereby the IRB could stress
the importance of tax practitioners in helping taxpayers to comply and remind them of
their responsibilities besides getting feedback from them on various issues regarding
income tax compliance.
As found by Mason (1987), communication variables are related to sanction fears, as
deterrence theorists have Hypothesised that variables such as age and income levels
are positively related to mass media exposure. Hence, it is wise to have mass media
advertisement that focusing on adults viewers that stress more on consequences of not
complying to Income Tax Rules and Regulation.
216

9.3.6 Introduction of new rules and regulations
New regulations like permitting only registered tax preparers to represent taxpayers
and the introduction of new mles regarding lawyers who have been found guilty in
not complying with the IRB mles and regulations by submitting their names to the
Bar Council, so that necessary actions could be taken by this council on its members
based on the mutual agreement with the IRB to combat income tax non-compliance.
The IRB also should be firm with the offence committed by these practitioners if they
were found committing fraud in the process of preparing their clients' accounts. They
should be punished heavily and made known to the public, as a lesson to others, black
listing them and publishing their names inside the IRB annual report.
While in dealing with professionals like lawyers or tax agents, the IRB should act
firmly by submitting their names to the BAR Council or registration office if they fail
to comply so that their business licence cannot be renewed.
9.3.7 Amendment of income tax law
Our respondents also suggest that the IRB should simplify the income tax law so that
it could be uniformly interpreted by all income tax officers, hence practising
uniformly in all branches of the IRB. Amending of income tax law also enable to
close any loopholes that might provide opportunities for tax avoidance and evasion as
addressed by Wallschutzky and Singh (1995, pp. 42-71). Successfiil reduction of
opportunities for non-compliance may permit more effective allocation of
enforcement resources. Additionally, if targeted properly, reducing opportunities for
non-compliance also can increase public support for tax compliance.
The amended income tax legislation and standard practices have to be issued to
ensure certainty and uniformity. Tax law changes and implications will have to be
very clearly communicated to the public. As suggested by Wallschutzky and Singh
(1995), the IRB should introduce Fringe Benefits Tax to those benefit-in-kind
incomes provided by employers to employees by withholding it at source on behalf of
217

their employees, so that less chances for these benefits receivers to escape paying
their share of tax.
9.3.8 Upgrading its research and development
Besides expecting taxpayers to do their parts, the IRB also should sttidy its
weaknesses and try to upgrade or improve them. It could be helpfiil for the IRB to
measure or estimate tax evasion in Malaysia every year so that it could compare its
performance from time to time, and would lead to more efficient allocation of
resources as suggested by Oldman and Holland (1971). H should also stiidy various
methods in reducing costs of compliance and simplify income tax law, hence
practising uniformly in all branches of the IRB. Carefiil analysis of the environment
in which it operates is equally important for this is an essential part of the
development of successful business strategies as suggested by James (1997, pp. 205-
226), James and Wallschutzky (1995).
9.4 Summary
Strategies improvement are recommended based on the analysis of the weaknesses of
the current enforcement, adminisfrative procedures, its income tax legislation and its
clients, Malaysian taxpayers. In retum it will also promote efficiency, and be more
effective in dealing with income tax non-compliance in this country.
The IRB should enforce a proper enforcement and practice uniformly in all of its
branches. We also suggest that the IRB to improve its penalty system besides
exploring positive approaches like disseminating tax knowledge through dialogues,
tax pack or introducing income tax as a subject to upper secondary schools, colleges
with cooperation from Ministry of Education. It should also improve Hs
administrative procedures especially regarding income tax refunds, objections and
appeals from taxpayers.
Detection activity is important in controlling income tax non-compliance. Hence we
also suggest that the IRB should use modem technology like the introduction of
Electronic Lodgement Service (ELS), DIF and KATE in improving its case selection
218

for audits besides strengthening its audit activity. Audit activity also must be seen
actively activated in detecting tax evaders, thus they will be at higher risk if not
complying to the IRB.
Hi overcoming income tax avoidance, the IRB should amend its Income Tax
Legislation closing all loopholes and cleariy communicated to the public. H will be
more efficient and more effective if the IRB introduces FBT and levied on employers,
taxing partnership and tmst incomes separately as currenfly practice by the ATO. It
should also introduce new mles and regulations conceming tax preparers and lawyers.
Only registered tax preparers are allowed to represent taxpayers and those non-
compliant lawyers' names will be submitted to the Bar Council.
Achieving equity is important in every tax system. Hence the tax burden should be
shared equally among all taxpayers. Hence we also suggest that the IRB could
introduce Prescribed Payment System or PPS for self-employed taxpayers as
currently practice by the ATO. The IRB should strengthen its linkage with other
organisations especially those who always deal with the public. It is also advisable for
the IRB to work closely with tax preparers, understanding compliance problems that
are currently faced by their clients. Lasfly, the IRB also should upgrade its research
and development, which would lead to more efficient allocation of resources besides
analysing the environment in which it operates.
219

NOTES
The tax laws are as follows: the Income Tax and Supplementary Income Tax Act, 1967; the Petroleum (Hicome Tax) Act, 1967; the Promotion Hivestment Act, 1986; the Real Property Gain Tax Act, 1965; the Cinematograph Fihn Hire Duty Act, 1965; the Stamp Ordinance, 1949; and the Estate Duty Enactment, 1941.
^ Income tax gap estimates released in 1988 and 1996 have excluded unpaid income taxes owed from illegal activities such as dmg dealing and prostitution. IRS tax gap estimates in 1979 and 1983 included such an estimate. Since then, IRS researchers have decided that the data and methodology for reliably making this estimate are lacking.
It should be noted that the tax retums examined did not represent a random sample of residents of Rotterdam. There were two separate pools of retums were initially selected for review. One of these pools was comprised of residents for whom no corrections or additional taxes had been assessed in the normal course of review for either 1981 or 1982. The non-evader group, then represent the "cleanest" subset of this category: individuals whose retums, after two additional line-by-line audits, were still found to require no corrections with respect to undeclared income or unjustified deductions. By contrast, the second pool was composed entirely of persons who had already been charged with evading taxes during both of the years under consideration and whose cases had already been settled, unprotested prior to the beginning of the study.
^ Webley et al. (1991) argued that there are three limitations for this type of evasion measurement. They are as follows: Lit assesses only those instances of evasion that can be detected by auditors and may be difficult for them to discover certain forms of unreported income such as income from moonlighting and cash-only businesses. Obviously there is no information on taxpayers who did not file retums. 2.There is no way of distinguishing between deliberate evasion and unintended errors on individual level. 3.TCMP data has very limited information about personal variables because of anonymity and it is not possible to explore the social and psychological factors associated with non-compliance.
^ According to ABA (1989), one of the problems is that small-business activities involve cash transactions which can easily be falsified (see also Soos, 1991).
^ In countries like Austria, Denmark, and the Netheriands, auditors tasks are greafly facilitated by easy access - via laptop computers to a range of computerised information, including the tax laws and regulations and all data from the taxpayers' accounts. Auditors can access information from the taxpayer master file regarding import and export shipments (volume and value), invoices, sales to customers, and purchases from suppliers.
220
^ Many countries have introduced or are in the process of introducing fundamental tax policy and/or tax administration reforms aimed at simplifying the tax system and improving compHance levels during the 1980s and 1990s, including practically all the Latin American countries, many Afiican countries (Benin, Chad, Cote d'lvoire, Gabon, Guinea, Mali, Niger, Senegal, South Afiica, Togo, Uganda), and Korea, the Philippines, and Indonesia, among others.
^ Extracted from Hepbum, Glen of the Department of Economics, University of Melboume in 'Estimates of Cash-based Income Tax Evasion in Australia' in the AustraHan Economic Review, 2"'' Quarter 1992. GDP for 1994/95, 1995/96 and 1996/97 are $474,646 millions, $508,806 milHons and $532,204 milHons respectively.
^ Only applicable to the hotel and tourist industry.
221

Appendix 1
Please tick ( • ) question 1 to 6 once only.
1. My gender
I.Male 2. Female
2. lam working with the IRB of
1. Kuala Lumpur 2. Pulau Pinang 3. Johore Bahru 4. Kota Kinabalu
3. I have been working with the IRB for years.
1. Below 5 years 2. 5 to 10 years 3. More than 10 years
4. Evasion is common among taxpayers.
LMale 2. Female
5. I would classify that income tax non-compliance in Malaysia is
1. very serious. 2. serious. 3. not serious.
Please arrange questions 7 to 9 in their order of importance, e.g. 1 being the most important and 4 is the least important and so on.
6. The most common nature of omission that I Have come across:
Nature of omission Failed to declare income Under-declared income Inflate expenses Over-claimed relief
Rank
7. The taxpayer's annual income-level that most common in evading their taxes:
Income-level Below RMl2,000 Betweem RMl2,000 and RM50,000 Above RM50,000
Rank
222
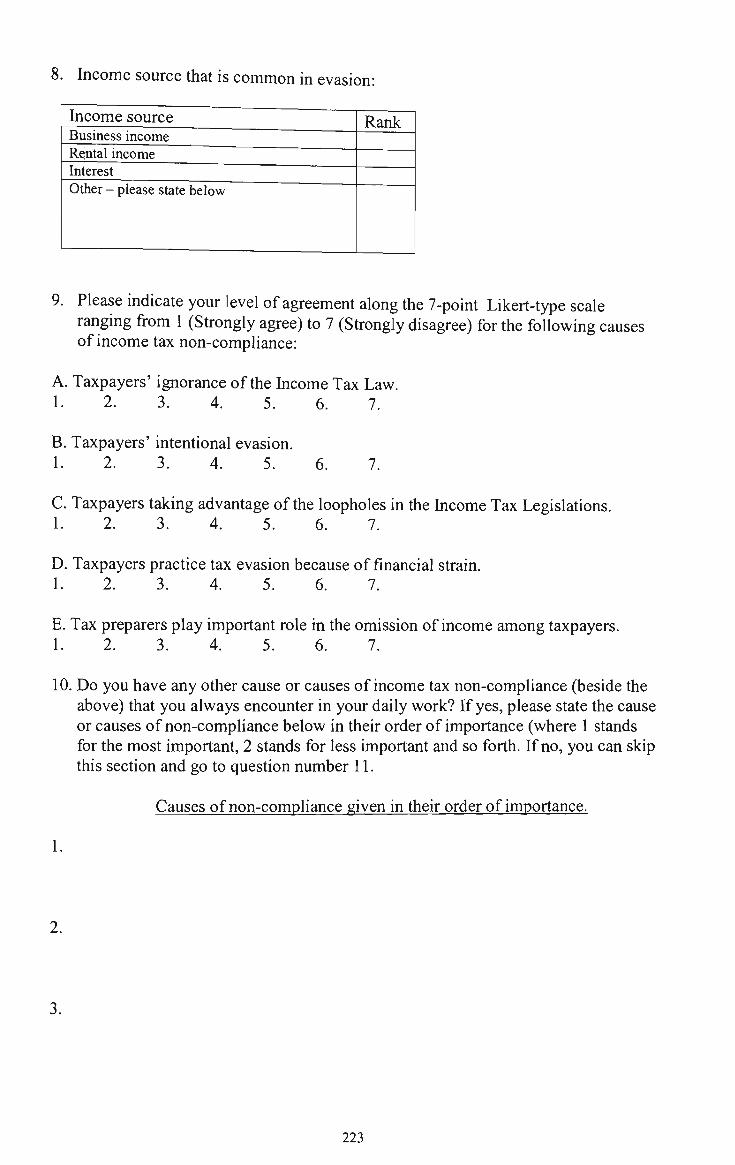
8. Hicome source that is common in evasion:
Income source Business income Rental income Interest Other - please state below
Rank
9. Please indicate your level of agreement along the 7-point Likert-type scale ranging from 1 (Strongly agree) to 7 (Strongly disagree) for the following causes of income tax non-compliance:
A. Taxpayers' ignorance of the Income Tax Law. 1. 2. 3. 4. 5. 6. 7.
B. Taxpayers' intentional evasion. 1. 2. 3. 4. 5. 6. 7.
C. Taxpayers taking advantage of the loopholes in the Hicome Tax Legislations. 1. 2. 3. 4. 5. 6. 7.
D. Taxpayers practice tax evasion because of financial strain. 1. 2. 3. 4. 5. 6. 7.
E. Tax preparers play important role in the omission of income among taxpayers. 1. 2. 3. 4. 5. 6. 7.
10. Do you Have any other cause or causes of income tax non-compHance (beside the above) that you always encounter in your daily work? If yes, please state the cause or causes of non-compliance below in their order of importance (where 1 stands for the most important, 2 stands for less important and so forth. If no, you can skip this section and go to question number 11.
Causes of non-compliance given in their order of importance.
1.
3.
223

11. Do you have any suggestion or suggestions to overcome the income tax noncompliance in Malaysia? Please write your suggestion or suggestions below.
Please check that you have answered all the questions and thank you for your participation in this project.
224

References
Aigner, D.J., Schneider, F. and Ghosh, D. 1988, 'Me and My Shadow: Estimating the Size of the Hidden Economy From Time Series Data', in W.A. Bamett et al. (eds.). Dynamic Econometrics Modelling: Proceedings of the Third International Symposium in Economic Theory and Econometrics, Cambridge University Press, Cambridge, pp. 297-334.
Albers, W. 1974, 'Umverteilungswirkungen der Einkommensteuer' in W. Albers (ed.), Oeffentliche Finanzwritschaft und Verteilung II, Duncker & Humblot, Beriin, pp. 69-144.
Allingham, M.G. and Sandmo, A. 1972, 'hicome Tax Evasion: A Theoretical Analysis', Journal of Public Economics, vol. 1, no. 3-4, pp. 323-338.
Aim, J., Jackson, B. and McKee, M. 1992, 'histitutional Uncertainty and Taxpayer Compliance', American Economic Review, vol. 82, pp. 1018-1026.
Aim, J., Bahl, R. and Murray, N. 1993, 'Audit Selection and Income Tax Underreporting in the Tax Compliance Game', Journal of Development Economics, vol. 42, no. 1, pp. 1-33.
American Bar Association Commission on Taxpayer Compliance 1987, American Bar Association Commission on Taxpayer Compliance: Report and Recommendations, American Bar Foundation, Chicago.
American Bar Association Commission on Taxpayer Compliance 1988, 'Report and Recommendations on Taxpayer Compliance', Tax Lawyer, vol. 42, no. 2, pp. 329-392.
American Bar Association Section of Taxation, American Bar Foundation 1989, 'Report of the Second Invitational Conference on Income Tax Compliance', Tax Lawyer, vol. 42, no. 3, pp. 705-731.
Asher, M. G., Ismail, M.S. and Datuk Kamal Salih 1994, 'Tax Reform in Malaysia: Trends and Options' in R. Mushgrave, C. Chang and J. Riew (eds), Taxation and Economic Development Among Pacific Asian Countries, Westview Press, Inc., pp. 82-103.
Assael, H. 1984, Consumer Behavior and Marketing Action, 2nd edn, Kent PubHshing Co., Boston.
Aushalian Bureau of Statistics (ABS) 1981, Australian National Accounts - Concepts Sources and Methods, AGPS, Canberra, pp. 158-159.
Australian Bureau of Statistics (ABS) 1990, Australian System of National Accounts 1988-89, Commonwealth of Australia, Canberra, p. 6.
AusfraHan Bureau of Statistics (ABS) 1999, Australian System of National Accounts 1997-98, Commonwealth of Australia, Canberra, pp. 32,46, 54.
225

Ausfralian Bureau of Statistics (ABS) 2000, Australian System of National Accounts 1998-99, Commonwealth of Ausfralia, Canberra.
AusfraHan Bureau of Statistics (ABS) 1995-1997, Labour Statistics, Commonwealth of Australia, Canberra.
AusfraHan Taxation Office 1991, Measures Taken by the Tax administration as Regards 0>) System of Assessment and Collection to Meet the Changing Tax Environment', paper presented at Study Group on Asian Tax Administration and Research, in Report on the 21" SGATAR meeting, Genting Highlands, Malaysia.
AusfraHan Taxation Office 1992, Market Research Register, Marketing and Research Strategies Unit, Canberra.
Ausfralian Taxation Office 1995, 'Discussion on Audit Cases: Australia and Malaysia' paper presented at Study Group on Asian Tax Adminisfration and Research XXV SGATAR '95 Singapore, Final Report, 19-23 November.
Ausfralian Taxation Office 1996, Taxation Statistics 1994-95: A Summary of Taxation, Superannuation and Child Support Statistics, Australian Taxation Office, Canberra.
Ausfralian Taxation Office 1997a, 'Reinventing Tax Adminisfration Systems,' paper presented at Study Group on Asian Tax Administration and Research, 1997, 27* SGATAR Meeting, Working Paper prepared by Australia.
Ausfralian Taxation Office 1997b, Taxation Statistics 1995-96: A Summary of Taxation, Superannuation and Child Support Statistics, Australian Taxation Office, Canberra.
Australian Taxation Office 1998, Taxation Statistics 1996-91: A Summary of Taxation, Superannuation and Child Support Statistics, Australian Taxation Office, Canberra.
Ausfralian Taxation Office 1999, Fringe Benefits Tax, Auditor-General Audit Report No. 34, 1998-99, Performance Audit, Ausfralian National Audit Office, Canberra.
Bardsley, P. 1994, 'Complexity, Honest Mistakes, and Tax Evasion', Discussion Paper No. A.94.23, La Trobe University, Melboume.
Beck, P. J. and Woon-Oh Jung, 1989, 'Taxpayer Compliance under Uncertainty', Journal of Accounting and Public Policy, vol. 8, pp. 1-27.
Besley, T., Preston, I. and Ridge, M. 1997, 'Fiscal Anarchy in the UK: Modeling Poll Tax Noncompliance', Journal of Public Economics, vol. 64, pp. 137-152.
Bhattacharyya, O.K. 1990, 'An Econometric Method of Estimating the Hidden Economy United Kingdom (1960-1984): Estimates and Tests', Economic Journal, vol. 100, no. 402, pp. 703-717.
226

Bird, R. 1990, 'Tax Adminishation and Tax Reform: Reflections on Experience', paper presented at the Worid Bank Conference on Tax Policy in Developing Countries, Washington, March.
Bird, R. and Casanegra de Jantscher, M. (eds), 1992, Improving Tax Administration in Developing Countries, Intemational Monetary Fund, Washington, D.C.
Bird, R. and Oldman, O. 1990, Taxation in Developing Countries, John Hopkins University Press, Baltimore.
Bird, S. 1992, Small Business and the ATO: Moving Towards a Market Based Approach, Ausfralian Taxation Office, Canberra.
Bird, S. 1994, 'Helping Tax Agents Help Taxpayers', Australian Tax Forum, vol. II, pp. 123-151.
Boucher, T. 1991, 'Tax Simplification - Some Different Dimensions', address by the Commissioner of Taxation to the Monash University Law School Foundation, Melboume, 3 September. [For an edited summary see: 'The Simplification Debate: Too Simplistic?, 1991, Taxation in Australia, vol. 26, pp. 277-282.]
Boyd, H.W. Jr. and Walker, O.C.Jr. 1990, Marketing Management: A Strategic Approach, Irwin, Homewood Illinois.
Brand, P. 1997, 'Compliance: A 21'' Century Approach', National Tax Journal, vol. XIIX, no. 3, pp. 413-419.
Burgess, R. and Stem, N. 1993, 'Taxation and Development', Jowrna/ of Economic Literature, vol. XXXI, pp. 762-830
Cagan, P. 1958, 'The Demand for Currency Relative to the Total Money Supply', Jowrna/ of Political Economy, vol. 66, no. 4, pp. 303-323.
Carson, C.S. 1984, 'The Underground Economy: An hifroduction' in Survey of Current Business, Bureau of Economic Analysis, US Department of Commerce, Washington D.C.
CCH, 26 October 1988, CCH Tax Focus, vol. 75, no. 54.
Cebula, R.S. 1997, 'An Empirical Analysis of the Impact of Govemment Tax and Auditing Policies on the Size of the Underground Economy: The Case of the United States, 1973-94', The American Journal of Economics and Sociology, vol. 56, April, pp. 173-185.
Chang, O. 1984, 'Tax Avoidance: A Prospect Theory Perspectives', Ph.D. Dissertation, University of Illinois, Illinois.
227

Chang, O.H., Nichols, D.R. and Schultz, J.J. 1987, 'Taxpayer Attitudes Toward Tax Audit Risk' Journal of Economic Psychology, vol. 8, September, pp. 299-309.
Chelvathurai, S.I. 1990, 'Tax Avoidance, Tax Evasion and the Underground Economy - The CATA Experience', Bulletin For International Fiscal Documentation, vol. 44, pp. 594-599.
Chote, R. 1995, 'Black Economy Believed to Exceed SlOObn', Financial Times, 10-11 June.
Christian, C , and Gupta, S. 1993, 'New Evidence on "Secondary Evasion",' Journal of the American Taxation Association, vol. 15, no. 1, pp. 72-93.
Clotfelter, C.T. 1983, 'Tax Evasion and Tax Rates: An Analysis of Individual Returns', Review of Economics and Statistics, vol. 65, pp. 363-373.
Coleman, C. and Freeman, L. 1994, 'The Development of Strategic Marketing Options Directed at Improving Compliance Levels in Small Business', Australian Tax Forum vol. 11, pp. 347-367.
Coleman, C. and Freeman, L. 1997, 'Cultural Foundations of Taxpayer Attitudes to Voluntary Compliance', Australian Tax Forum, vol. 13, pp. 311-336.
Collins, J.H., Milliron, V.C. and Toy, D.R. 1990, 'Factors Associated with Household Demand for Tax Preparers', Journal of the American Taxation Association, Fall, pp. 9-25.
Comisari, P. 1997, 'National Accounts: Sources and Uses', Australian Tax Forum, pp.35-53.
Commissioner of Taxation 1984-1998, Annual Report, Australian Govemment PubHshing Service, Canberra.
Commonwealth Association of Tax Adminisfrators 1989, 'Improving Tax Compliance through Better Taxpayer Education', in Report on 10th Technical Conference, pp. 69-107, Commonwealth Association of Tax Administrators, London.
Commonwealth of Australia 1998, Budget Review 1998-1999, Canberra, (available from the Pariiamentary of Ausfralia at http://www.aph.gov.au/library/pubs/budget/1998-99/budget2.htm).
Cooper, G. S. 1995, 'hicentives and Sfrategic Choices Facing Taxpayers Under the Tax Self-Assessment System', Australian Tax Forum, vol. 12, pp. 99-124.
Cowell, F. A. 1985, 'The Economic Analysis of Tax Evasion', Bulletin of Economic Research, vol. 37, pp. 163-193.
Cowell, F. A. 1990, Cheating the Government, MIT Press, Cambridge, Massachusetts.
228

Dean, P., Keenan, T. and Kenney, F. 1980,' Taxpayers' Attitudes to hicome Tax Evasion: An Empirical Study', British Tax Review, vol. 1, pp. 28-44.
De Grazia, R. 1980, 'Clandestine Employment: A Problem of Our Time', International Labour Review, vol. 119, September/October, pp. 549-563.
Department of Statistics Malaysia 1997, Yearbook of Statistics, Kuala Lumpur.
Department of Statistics Malaysia 1998, National Accounts Statistics 1995-1997, Kuala Lumpur, p. 3.
Department of Statistics Malaysia 1999a, System of National Accounts Annual National Product and Expenditure Accounts 1987-1998, Kuala Lumpur.
Department of Statistics Malaysia 1999b, Labour Force Survey Report Malaysia 1998, Kuala Lumpur.
Department of the Treasury 1984-1985, Statistics of Income Bulletin, vol. 4, no. 3.
Dirkis, M. 1999, 'Administrative Reform Proposed for the ATO', Business Council of Australia Papers, vol. 1, no. 2, pp. 42-46.
Dubin, J., Graetz, M., Udell, M. and Wilde, L. 1989, 'The Demand For Preparation Services', unpublished, California Institute of Technology.
Einhom, H. and Hogarth, R. 1981, 'Behavioral Decision Theory: Processes of Judgement and Choice', Journal of Accounting Research, vol. 18, Spring, pp. 1-31.
Elffers, H., Robben, H.S.J, and Hessing, D.J. 1992, 'On Measuring Tax Evasion', Journal of Economic Psychology, vol. 13, pp. 545-567.
Elffers, H., Weigel, R.H. and Hessing, D.J. 1987. 'The Consequences of Different Sfrategies for Measuring Tax Evasion Behavior', Journal of Economic Psychology, vol. 8, pp. 311-337.
Erard, B. 1993, 'Taxation with Representation: An Analysis of the Role of Tax Practitioners in Tax CompHance', Journal of Public Economics, vol. 52, pp. 163-197.
Erard, B. and Feinstein, J. S. 1996, 'Reporting Behavior and Audit Selection Decisions', unpublished manuscript, Yale School of Management.
Erekson, O.H. and SuHivan, D.H. 1988, 'A Cross-Section Analysis of IRS Auditing', National Tax Journal, vol. 41, pp. 175-189.
229

Etzioni, A. 1986, 'Tax Evasion and Perceptions of Tax Faimess: A Research Note', The Journal of Applied Behavioral Science, vol. 22, no. 2, pp. 177-185.
Feige, E.L. 1979, 'How Big is the frregular Economy?' Challenge, The Magazine of Economic Affairs, vol. 22, no. 5, pp. 5-13.
Feige, E.L. 1980a, 'Den Dolda Sektoms Tillvaxt - 70-talets Ekonomiska Problem I Nytt Ijus', EkonomiskDebatt, vol. 8, pp. 570-589.
Feige, E.L. 1980b,' A New Perspective on Macroeconomic Phenomena, The Theory and Measurement of the Unobserved Sector of the United States: Causes, Consequences, and Implications', mimeograph, Netherlands histitute for Advanced Study, Wassenar.
Frank, M. 1972, 'La Sous-Estimation et la Fraude Fiscale en Belgique: Ampleur et Remedes', Cashiers Economiques de Bruxelles, vol. 53, no. 1, pp. 5-46.
Frank, M. 1976, 'Fraude des Revenus Soumis a I'lmpot des Personnes Physiques et Perte d'hnpot qui en Resulte pour leTresor-Etude Methodologique',PMMcFmance, vol. 31, no. l,pp. 1-30.
Frank, M. and Dekeyser-Meulders, D. 1977, 'A Tax Discrepancy Coefficient Resulting from Tax Evasion or Tax Expenditures', Journal of Public Economics, August, pp. 67-78.
Frey, B.S. and Pommerehne, W.W. 1982, 'Measuring the Hidden Economy: Though This Be Madness, There Is Method in It', in T. Vito (ed.), The Underground Economy in the United States and Abroad, pp. 3-27, Lexington Books, New York.
Friedland, N., Maital, S. and Rutenburg, A. 1978, 'A Simulation Study of Income Tax Evasion', Journal of Public Economics, August, pp. 107-116.
Garcia, G. 1978, 'The Currency Ratio and the Subterranean Economy', Financial Analysts Journal, November-December, pp. 64-69.
Garcia, G. and Pak, S. 1979, 'The Ratio of Currency to Demand Deposits in the United States', Journal of Finance, vol. 34, no. 3, pp. 703-715.
General Accounting Office 1997, Taxpayer Compliance: Analyzing the Nature of the Income Tax Gap, Report No. T-GGD-97-35, Washington D.C.
Giles, D.E.A. 1998, 'The Underground Economy: Minimizing the Size of Government', in H. Gmbel (ed.). How to Spend the Fiscal Dividend: Minimizing the Size of Government, Eraser Institute, Vancouver, pp. 93-110.
Giles, D.E.A. 1997, 'The Hidden Economy and Tax-Evasion Prosecutions in New Zealand', Applied Economics Letters, vol. 4, pp. 281-285.
230

Giles, D.E.A. and Caragata, P.J. 1996, 'The Leaming Path of the Hidden Economy: Tax and Growth Effects in New Zealand', Working Paper No. 21, hiland Revenue Department, Wellington.
Gillis, M. 1989, Tax Reform in Developing Countries, Duke University Press, Durham.
Godwin, M.R. 1976, 'Compliance Costs to the hidependent Retailer', Accountancy, September, pp. 48-60.
Goode, R. 1981, 'Some Economic Aspects of Tax Administration', IMF Staff Papers, vol. 28, pp. 249-275.
Goode, R. 1984, Government Finance in Developing Countries, Brookings Institution, Washington D.C.
Graetz, M. and Wilde, L. 1985, 'The Economics of Tax Compliance: Facts and Fantasy', National Tax Journal, vol. 38, September, pp. 355-363.
Grasmick, H., Finley, N. and Glaser, D. 1984, 'Labor Force Participation, Sex-Role, Attitudes, and Female Crime: Evidence from a Survey of Adults', Social Science Quarterly, vol. 65, pp. 703-718.
Grasmick, H., and Scott, W. 1982, 'Tax Evasion and Mechanisms of Social Control: A Comparison with Grand and Petty Theft', Journal of Economic Psychology, vol. 2, pp. 213-220.
Gunn, A. 1979, 'Tax Avoidance', Michigan Law Review, vol. 76, pp. llZ-ldl.
Gutmann, P. M. 1977, 'The Subterranean Economy', Financial Analysts Journal, November-December, pp. 26-28.
Hansson, I. 1980, Sveriges svarta sektor, Ekonomisk Debatt, vol. 8, May, pp. 395-602.
Hepbum, G. 1992, 'Estimates of Cash-Based Income Tax Evasion in Australia', The Australian Economic Review, 2"** Quarter, pp. 54-62.
Herschel, F.J. 1978, 'Tax Evasion and its Measurement in Developing Countries', Public Finance, vol. 33, no. 3, pp. 232-268.
Hite, P. A. 1997, 'Identifying and Mitigating Taxpayer Non-compliance', Australian Tax Forum, vol. 13, pp. 155-180.
231

Hock, O. Y. 1991, Ethnic Chameleon Multiracial Politics in Malaysia, Pelanduk Publications, Kuala Lumpur.
Holland, D.M. and Kahn, C H. 1956, 'Comparison of Personal and Taxable hicome', in Federal Tax Policy for Economic Growth and Stability, 84* Congress, Joint Economic Committee Report, p. 316, Washington D.C.
Income Tax Act, 1967 (Act 53), Govemment of Malaysia, Kuala Lumpur.
hiland Revenue Board of Malaysia 1996, Annual Report, Percetakan Nasional Malaysia Berhad, Kuala Lumpur.
hiland Revenue Board of Malaysia 1997a, Annual Report, Percetakan Nasional Malaysia Berhad, Kuala Lumpur.
hiland Revenue Board of Malaysia 1997b, Taxation Statistics for 1996, Percetakan Nasional Malaysia Berhad, Kuala Lumpur.
Inland Revenue Board of Malaysia 1998a, Tax Guide For Individuals, Percetakan Nasional Malaysia Berhad, Kuala Lumpur.
Inland Revenue Board of Malaysia 1998b, Annual Report, Percetakan Nasional Malaysia Berhad, Kuala Lumpur.
Inland Revenue Board of Malaysia 1998c, Taxation Statistics for 1997, Percetakan Nasional Malaysia Berhad, Kuala Lumpur.
Inland Revenue Department of Malaysia 1994 Annual Report, Percetakan Nasional Malaysia Berhad, Kuala Lumpur.
Inland Revenue Department of Malaysia 1995 Annual Report, Percetakan Nasional Malaysia Berhad, Kuala Lumpur.
hiland Revenue Department of Malaysia 1992a, Report of Management Monthly Meeting from January to December 1992, unpublished document. Inland Revenue Department of Malaysia, Kuala Lumpur.
hiland Revenue Deparhnent of Malaysia 1992b, paper presented at the 12* COFAB Meeting, Bandung, Indonesia, 18-20 June.
Intemal Revenue Service 1978, A Dictionary of Compliance Factors, Office of the Assistant Commissioner Research Division, Washington D.C.
232

hitemal Revenue Service 1979, Statistics of Income - 1976, Individual Income Tax Returns, Govemment Printing Office, Washington D.C.
hitemal Revenue Service 1983, Income Tax Compliance Research: Estimates for 1973-1981, Research Division, U.S. Govemment Printing Office, Washington D.C.
hitemal Revenue Service 1987, Survey of Tax Practitioners and Advisers: Summary of Results by Occupation, IRS Research Division, Washington D.C.
Intemal Revenue Service, 1992, 'Individual Tax Gap', unpublished IRS report, Washington D.C.
Intemational Labour Office 1998, Yearbook of Labour Statistics, 57* issue, Geneva.
Jackson, B.R. and Milliron, V.C. 1986, 'Tax Compliance Research: Findings, Problems and Prospects', Journal of Accounting Literature, vol. 5, pp. 125-165.
Jackson, I. A. 1986, 'Amnesty and Creative Tax Administration', National Tax Journal, vol. XXXDC, pp. 317-323.
Jackson, B., Milliron, V. and Toy, D. 1988, 'Tax Practitioners and the Government', Tax Notes, October 17, pp. 333-341.
James, S. 1997, 'Self-Assessment and the UK Tax System', Australian Tax Forum, vol. 13, pp. 205-226.
James, S. and Nobes, C 1992, The Economics of Taxation, Philip Allan Publishers Ltd.
James, S. and WaHschutzky, I. 1995, 'The Shape of Future Tax Administration', Bulletin for International Fiscal Documentation, vol. 49, no. 5.
James, S. and WaHschutzky, I. 1993, 'Returns to the Fuhire: The Case for Electronically Submitted Tax Returns', British Tax Review, no. 5.
Jenkins, G.P. 1990, 'Tax Reform: Lessons Learned', September, mimeograph, Duke University, Durham.
Joulfaian, D. and Rider, M. 1998, 'Differential Taxation and Tax Evasion by Small Business', National Tax Journal, vol. 51, no. 4, December, pp. 675-687.
Kaldor, N. 1956, Indian Tax Reform, Report of a Survey, Minisfry of Finance, New Delhi..
Kaldor, N. 1963, 'Will Underdeveloped Countries Leam to Tax?' in R.M. Bird and O. Oldman (eds), 1975, Readings on Taxation in Developing Countries, pp. 29-38, The John Hopkins University Press, Maryland.
233

Kaplow, L. 1995, 'How Tax Complexity and Enforcement Affect the Equity and Efficiency of the hicome Tax', National Tax Journal, vol. XLDC, no.l, pp. 135-150.
Kesselman, J. R. 1994, 'Compliance, Enforcement, and Administrative Factors in Improving Tax Fairness', in A.M. Maslove, (ed.) Issues in the Taxation of Individuals, Queen's Printer, Ontario, pp. 62-84.
Kheong, C Y. 1997, Malaysian Taxation, 4* edn, Butterworths, Kuala Lumpur.
Kinsey, K.A. 1988, 'Measurement Bias or Honest Disagreement? Problems Validating Measures of Tax Evasion', Working Paper 8811, American Bar Foundation, Chicago.
Kinsey, K.A. and Grasmick, H. 1993, 'Did the Tax Reform Act of 1986 Improve Compliance? Three Studies of Pre- and Post-TRA Compliance Attitudes', Law and Policy, vol. 15, no. 4, pp. 293-325.
Klepper, S. and Nagin D. 1989a, 'The Anatomy of Tax Evasion', Journal of Law, Economics and Organization, vol. 5, no. 1, pp. 1-24.
Klepper, S. and Nagin D. 1989b, 'The Criminal Deterrence Literature: Implications for Research on Taxpayer Compliance', in J. A. Roth and J.T. Scholz (eds), Taxpayer Compliance: Social Science Perspectives, vol. 2, pp. 126-155, University of Pennsylvania Press, Philadelphia.
Klepper, S. and Nagin D. 1989c, 'The Role of Tax Preparers in Tax Compliance', Policy Sciences, pp. 167-194.
Kreiser, L. Butcher, B. and Jowitt, E. 1997, 'Toward a More Equitable Tax Treatment of Employee Fringe Benefits: The Ausfralian Experience', The International Tax Journal, vol. 23, no. 2, pp. 77-84.
Lehmann, G. and Coleman, C 1996, Taxation Law in Australia, 4th edn, LBC hiformation Services, New South Wales.
Lempert, R. 1988,' hitemal Revenue Service', in F. M. Malanga, Memorial Research Conference Report, 17-18 November, pp. 68-71,Washington, D.C.
Lewis, A. 1982, The Psychology of Taxation, Basic Books, New York.
Loftus, E.F. 1985, 'To File, Perchance to Cheat', Psychology Today, vol. 19, pp. 35-39.
Long, S.B. 1988, 'Comment' in J. Roth and J. Scholtz (eds). Why People Pay Taxes, University of Pennsylvania Press, Philadelphia.
234

Long, S.B. and Swingen, J.A. 1991, 'Taxpayer Compliance: Setting New Agendas for Research', Review of National Academy of Sciences panel report on Taxpayer Compliance, vols. 1 and 2, Law and Society Review, vol. 25, pp. 639-683.
Macafee, K. 1980, 'A Glimpse of the Hidden Economy in the National Accounts', Economic Trends, Cenfral Statistical Office, U.K. Febmary, pp. 81-87.
Macleay, J. 1998, 'Untouchables out to beat tax cheats'. The Australian, 29 October, p. 3.
Madeo, S.A., Schepanski, A. and Uecker, W.C 1987, 'Modelling Judgments of Taxpayer Compliance', The Accounting Review, April, pp. 323-342.
Mahfar, M. S. 1994, 'An Investigation of a Taxpayer Education Program for Developing Countries: A Malaysian Example', Ph. D. Dissertation, Golden Gate University, U.S.A.
Malaysian Industrial Development Authority 1999, 'Incentives for Investment', (available from http//j aring.my/mida/policy/chapter3 .html).
Mansfield, C Y. 1987, 'Tax Administtation in Developing Countries, an Economic Perspective', IMF Working Paper 87/42, Intemational Monetary Fund, Washington D.C.
Marks, B. 1991, Understanding Fringe Benefits Tax in Australia, 2)'^ edn, CCH Australia Ltd.
Marshall, R., Smith, M. and Armsfrong, R. W. 1997, 'Self-Assessment and the Tax Audit Lottery: The AustraHan Experience', Managerial Auditing Journal, vol. 12, no. 1, pp. 9-15.
Martino, A. 1980, 'Another Italian Economic Miracle', Mont Pelerin Society, Standford Conference, mimeograph, September.
Mason, R. 1987, 'A Communication Model of Taxpayer Honesty', Law and Policy, vol. 9, no. 3, pp. 246-258.
Mason, R. and Calvin, L.D. 1978, 'A Sttidy of Admitted hicome Tax Evasion', Law and Society Review, vol. 13, pp. 73-83.
Mason, R. and Lowry, H. 1981, yln Estimate of Income Tax Evasion in Oregon, Survey Research Center, Oregon State University, CorvalHs, Oregon.
Mazur, M. and Nagin, D.S. 1987, 'Tax Preparers and Tax CompHance: A Theoretical and Empirical Analysis', paper presented at the Role of Tax Practitioners in the Tax System, Research Conference, IRS Washington D.C, November.
235

McGill, G. 1988, 'The CPA's Role in hicome Tax CompHance: and Empirical Sttidy of Variabdity in Recommending Aggressive Tax Positions; Ph.D. Dissertation, Texas Tech University.
Mc Neil, R. 1993, 'Customer Care', Research Plus, April.
Mikesell, J.L. 1974, 'Adminisfration and the Public Revenue System: A View of Tax Administt-ation', Public Administration Review, pp. 615-624.
Milliron, V.C. 1985, 'A Behavioral Sttidy of the Meaning and Influence of Tax Complexity', Journal of Accounting Research, Autumn, pp. 794-816.
Milliron, V.C. 1988, 'A Conceptual Model of Factors Influencing Tax Preparers' Aggressiveness', in S. Moriarity and J. Collins (eds) Contemporary Tax Research, University of Oklahoma, pp. 1-15.
Milliron, V.C. and Toy, D.R. 1988, 'Tax Compliance: Investigation of Key Factors', The Journal of the American Taxation Association, vol. 9, no. 2, pp. 84-104.
Ministry of Finance Malaysia 1996, The Economic Report 1996/1997, Percetakan Nasional Malaysia Berhad, Kuala Lumpur.
Ministry of Finance Malaysia 1998, The 1999 Budget, Jabatan Penerangan Malaysia, Kuala Lumpur.
Ministry of Finance Malaysia 2000, Unpublished data (given to author by a senior officer via e-mail).
Minor, W. 1978, 'Deterrence Research: Problems of Theory and Method', in J. A., Cramer (ed.). Preventing Crime, pp. 21-45, Sage, Beverly HiHs.
Morgan, P.T. 1990, Tax Procedure and Tax Fraud, West Publishing, St. Paul, Minnesota.
Musgrave, R. A. 1969, Fiscal Systems, Yale University Press, New Haven, Connecticutt.
Nagin, D.S. 1990, 'Policy Options for Combating Tax NoncompHance', Jowrna/ of Policy Analysis and Management, vol. 9, no. 1, pp. 7-22.
Nazir, A., Lowes, B. and Letza, S.R. 1995, 'Ethics, Equity and Evasion in Taxpayer Behavior', paper presented at the British Accounting Association National Conference, 5-7 April.
Nolan, B. 1993, 'Presentation On Topic IF, paper presented at Sttidy Group on Asian Tax Administration and Research, SGATAR XXIII Final Report, Seoul, Korea, 13-17 September, pp. 69-72.
236

O'Higgins, M. 1980, 'Measuring the Hidden Economy: A Review of Evidence and Methodologies', mimeograph. Outer Circle Policy Unit, London, July.
0konomiske RM 1967, Den personlige indkomstfordeling og indkomstudjaevningen over de offentligefinanser, Statens Trykningskontor, Kopenhagen.
0konomiske Rad 1977, Dansk okonomi, Statens Trykningskontor, Kopenhagen.
Oldman, O. and Holland, D.M. 1971, 'Measuring Tax Evasion', 5* General Assembly of the hiter-American Center of Tax Administrators, Rio de Janeiro.
Park, S. T. 1979, 'ReconciHation between Personal hicome and Taxable hicome, 1947-1977', mimeograph. Bureau of Economic Analysis, Washington, D.C, May.
Park, S. T. 2000, 'Comparison of BEA Estimates of Personal Income and IRS Estimates of Adjusted Gross Income', Survey of Current Business, vol. 80, no. 2, pp. 12-22.
Payne, J. 1993, Costly Returns: The Burdens of the US Tax System, ICS Press, San Francisco.
Primarolo, D. 1999, 'Cutting out Tax Loopholes in the EU', Accounting & Business, June, pp. 24, 25.
Prime Minister Department 1996, Seventh Malaysia Plan 1996-2000, Percetakan Nasional Malaysia Berhad, Kuala Lumpur.
Pulle, B. 1998, 'Budgeted Tax Revenue, the Cash (or Black or Underground) Economy and the Tax Gap', in Budget Review 1998-99 Report, Canberra, (available from http://www.aph.gov.au/library/pubs/budget/1998-99/budget2.htm).
Pyle, D.J. 1991, 'The Economics of Taxpayer Compliance', Journal of Economic Surveys, vol. 5, no. 2, pp. 163-198.
Reckers, P.M.J., Sanders, D.L. and Wyndelts, R.W. 1994, 'An Empirical hivestigation of Factors hifluencing Tax Practitioner Compliance', Journal Akauntan Nasional, April, pp. 14-20.
Reinganum, J.F. and Wilde, L.L. 1991, 'Equilibrium Enforcement and Compliance in the Presence of Tax Practitioners', Journal of Law, Economics and Organization, vol. 7, pp. 163-181.
Richards, P. and Tittle, C 1981, 'Gender and Perceived Chances of Arrest', Social Forces, June, pp.1182-1199.
237

Ross, H.L. 1984, 'Social Conttol Through Deterrence: Drinking-and-Drinking Laws', Annual Review of Sociology, vol. 10, pp. 21-35.
Rossi, P. and Grasmick, H. 1985, 'Appeals Within our Social Stmcttire that can Enhance Voluntary Compliance', Conference on Tax Administration, Office of the Assistant Commissioner, Washington, DC, January, pp. 79-101.
Roth, J. A., Scholz, J.T. and Witte, A.D. 1989, Taxpayer Compliance: An Agenda for Research, vol. 1, p. 34, University of Pennsylvania Press, Philadelphia.
Roze, H. 1971, 'Prestations Sociales, Impot Direct et Cellule de Revenus', Economic et Statisque, vol. 20, Febmary, pp. 3-14.
Sabri, S. 1993, 'Tax Ethics and Taxpayers Attitude', unpublished thesis for Master of Business Adminisfration, University of Malaya, Kuala Lumpur.
Sandford, C.T. 1973, Hidden Costs of Taxation, Institute for Fiscal Studies, Publication No. 6, London.
Sandford, C 1992, 'Worldwide Tax Reform 'How Does Australia Compare?', Australian Economic Review 1*' Quarter, pp. 22-32.
Schmolders, G. 1970, 'Survey Research in Public Finance: A Behavioral Approach to Fiscal Theory', Public Finance, vol. 25, pp. 300-306.
Schnee, E., Bindon, K. and Ellis, C 1987, 'The Policy Implications of and Experience with. Preparer Penalties', Nevada Review of Business and Economics, Spring, pp. 21-30.
Schultz, J., and Reckers, P. 1981, 'The Impact of Group Processing on Selected Audit Disclosure Decisions', Journal of Accounting Research, vol. 18, Autumn, pp. 482-501.
Schwartz, R.D. and Orleans, S. 1967, 'On Legal Sanctions', University of Chicago Law Review, vol. 34, pp. 274-300.
Scotchmer, S. and Slemrod, J. 1989, 'Randomness in Tax Enforcement', Journal of Public Economics, vol. 38, pp. 17-32.
Shapiro, L. 1986, 'Professional Responsibility in the Eyes of the IRS', The Tax Advisor, March, pp. 136-143.
Sheehan, P. 2000, Memorandum (based on phone discussion with senior officer of the Ausfralia Bureau of Statistics (Canberra), Victoria University, Melboume).
238

Silvani, C A. 1994, 'hnproving Tax Compliance' in Federal Taxation 1994-Comprehensive Prentice HaH, pp. 274-305.
Silvani, C and Baer, K. 1997, 'Designing a Tax Administration Reform Sfrategy: Experien and Guidelines', working paper, hitemational Monetary Fund, Washington D.C.
ces
Singh, V. 1997, Malaysian Taxation Administrative and Technical Aspects, 3rd edn Longman, New York.
Singh, V. 1995, Malaysian Master Tax Guide, 12* edn, CCH Asia Limited.
Slemrod, J. 1988, 'Complexity, Compliance Costs and Tax Evasion', cited in Intemal Revenue Service, Frank M. Malanga Memorial Research Conference Report, Washington, D.C, 17-18 November, pp. 61-65.
Slemrod, J. 1989, 'The Retum to Tax Simplification: An Economefric Analysis', Public Finance Quarterly, vol. 17, pp. 3-27.
Slemrod, J. 1990, 'Optimal Taxation and Optimal Tax Systems', Journal of Economic Perspectives, vol. 4, no.l, pp. 157-178.
Slovic, P., Fischhoff, B. and Lichtenstein, S. 1982, 'Response Mode, Framing, and Information Processing Effects in Risk Assessment', in R. Hogarth (ed), Question Framing and Response Consistency: New Directions for Methodology of Social and Behavioral Science, pp. 21-36, Kossey-Bass, Inc., San Francisco.
Smith, K.W. and Kinsey, K.A. 1987, 'Understanding Taxpaying Behavior: A Conceptual Framework with Implications for Research', Law and Society Review, vol. 21, pp. 639-663.
Song, Y. and Yarbrough, T.E. 1978, 'Tax Ethics and Taxpayer Attittides: A Survey', Public Administration Review, September-October, pp. 442-452.
Soos, P. 1991, 'Self-Employed Evasion and Tax Withholding: A Comparative Sttidy and Analysis of the Issues', U.C. Davis Law Review, vol. 24, pp. 107-193.
Spicer, M.W. 1986, 'Civilization at a Discount: The Problem of Tax Evasion', National Tax Journal, vol. 39, pp. 13-20.
Spicer, M.W. and Becker, L.A. 1980, 'Fiscal hiequity and Tax Evasion: An Experimental Approach', National Tax Journal, vol. 33, pp. 171-175.
Spicer, M.W. and Lundstedt, S.B. 1976, 'Understanding Tax Evasion', Public Finance vol. 31, pp. 295-305.
239

Stephens, D. O. 1999, 'A New Ausfralian Regulation for Elecfronic Tax Records', Information Management Journal, vol. 33, no.2, pp. 69-71.
Sfrader, J. and FogHasso, CE. 1989, 'An hivestigation of Some Factors Affecting Taxpayer Non-Compliance', Accounting and Business Review, vol. 20, no, 77, pp. 39-46.
Sfrumpel, B. 1969, 'The Contribution of Survey Research to Public Finance', in A.T. Peacock (ed.), Quantitative Analysis in Public Finance, pp. 13-22, Praeger Publishers, New York.
Surrey, S.S. 1958, 'Tax Adminisfration in Underdeveloped Countiies'. in R.M. Bird and O. Oldman (eds), 1975, Readings on Taxation in Developing Countries, pp. 479-499. The John Hopkins University Press, Maryland.
Tait, A. A., Graetz, W. and Eichengreen, B. J. 1979, 'International Comparisons of Taxation in Selected Developing Countries 1972-76', IMF Staff Papers, Intemational Monetary Fund, vol. 26, March, pp. 123-156.
Tanzi, V. 1980, 'Underground Economy Built on Illicit Pursuits is Growing Concem of Economic Policymakers', IMF Survey, 4 Febmary, pp. 34-37.
Tanzi, V. 1981, 'Tax Policy in Middle-Income Countries: Some Lessons of Experience', Departmental Memorandum No. 62, Intemational Monetary Fund, Washington D.C.
Tanzi, V. 1982, 'Underground Economy and Tax Evasion in the United States: Estimates and Implications', in V. Tanzi (ed.). The Underground Economy in the United States and Abroad, Lexington Books, Lexington.
Tanzi, V. 1991, Public Finance in Developing Countries, Edward Elgar, Aldershot.
Tanzi, V. and Pellechio, A. 1995, 'The Reform of Tax Adminisfration', IMF Working Paper WP/95/22, Washington D.C.
Taxation in Australia 1993, 'Tax Agents: Many are just Passengers', vol. 27, no. 6, p. 317.
Tittle, C 1980, Sanctions and Social Deviance: The Question of Deterrence, Praeger, Westport, Connecticutt.
Tittle, C and Rowe, A. 1973, 'Moral Appeal, Sanction Threat, and Deviance: An Experimental Test', Social Problems, Spring, pp. 448-498.
Trengove, C D. 1985, 'Measuring the Hidden Economy', Australian Tax Forum, vol. 2, no. 1, pp.85-95.
240

Tucker, M. 1982, 'The Underground Economy in Ausfralia', in V. Tanzi (ed.). The Underground Economy in the United States and Abroad, pp. 315-322, Lexington Books, Lexington.
U.S. Deparhnent of the Treasury 1979, Estimates of Income Unreported on Individuals Tax Returns, Publication 1104, U.S. Govemment Printing Office, Washington D.C.
U.S. Department of Treasury 1986, Proposed Regulations and Amendments of Regulations: Treasury Department, Practice Before: Advice to Clients - Regulation Section 10.22(a) and Regulation Section 10.34, Federal Register, August 14, Washington D.C.
van der Heeden, K. 1994, 'The Pay-As-You-Eam Tax on Wages - Options for Developing Countries and Countries in Transition', IMF Working Paper 94/105, Intemational Monetary Fund, Washington D.C.
Vogel, J. 1974, 'Taxation and Public Opinion in Sweden: An Interpretation of Recent Survey Data', National Tax Journal, vol. 27, pp. 499-513.
Wahlund, R. 1992, 'Tax Changes and Economic Behavior: The Case of Tax Evasion', Journal of Economic Psychology, vol. 13, pp. 657-677.
Wai, U.T. 1962, 'Taxation Problems and Policies of Underdeveloped Countries', IMF Staff Papers, vol. 9, pp. A1%-AA1.
WaHschutzky, I.G. 1982, 'The Multi-Million Dollar Growth hidustry Called Tax Avoidance', Accountancy, vol. 94, no. 1065, pp. 122-124.
WaHschutzky, I.G. 1984, 'Possible Causes of Tax Evasion', Journal of Economic Psychology, vol. 5, pp. 371-384.
Wallschutzky, I.G. 1985, Taxpayer Attitudes to Tax Avoidance and Evasion, Ausfralian Tax Research Foundation, Canberra.
Wallschutzky, I.G. 1986, 'Taxpayers' Attitude to Tax Avoidance and Evasion', Australian Accountant, vol. 56, no. 2, pp. 31-33.
Wallschutzky, I.G. 1993, 'Minimising Evasion and Avoidance - Lessons from Ausfralia' in C Sandford (ed.), Key Issues in Tax Reform, pp. 129-151, Fiscal Publications, Bath, UK.
Wallschutzky, I.G. 1995, 'Evasion of the Tax Law. Improvement Project: Stages 1 & 2', paper presented at the ATO Compliance Research Conference, Ausfralian Taxation Office, Canberra, December.
Wallschutzky, I.G. and Singh, V. 1995, 'Opporttmities for Tax Avoidance and Tax Evasion in the Malaysian Income Tax System', The International Tax Journal, vol. 21, no. 1, pp. 42-71.
241
Wameryd, K.E. and Walemd, B. 1982, 'Taxes and Economic Behavior: Some Interview Data on Tax Evasion in Sweden', Journal of Economic Psychology, vol. 2, pp. 187-211.
Wearing, A. and Headey, B. 1997, 'The Would-be Tax Evader: A Profile', Australian Tax Forum, vol. 13, pp. 3-17.
Webley, P. and Halstead, S. 1986, 'Tax Evasion on the Micro: Significant Simulations or Expedient Experiments?', Journal of Interdisciplinary Economics, vol. 1, pp. 87-100.
Webley, P., Robben, H., Elffers H. and Hessing D. 1991, Tax Evasion: An Experimental Approach, Cambridge University Press, Cambridge.
Wegner, D.M. and Wallacher, R.R. 1977, Implicit Psychology An Introduction to Social Cognition, Oxford University Press, Oxford.
Westat Inc., 1980, 'Individual Income Tax Compliance Factors Study Qualitative Research', prepared for the Intemal Revenue Service, 4 Febmary, Washington D.C.
Wirth, A. 1994, 'Changing Taxpayer Compliance: The Impact of Business Auditors as Service Providers', Australian Tax Forum, vol. 11, pp. 63-84.
Witte, A. and Woodbury, D.F. 1983, 'What We Know about the Factors Affecting Compliance with the Tax Laws', in P. Sawicki (ed.). Income Tax Compliance: A Report of the ABA Section of Taxation Invitational Conference on Income Tax Compliance, pp. 133-148, American Bar Association, Chicago.
Witte, A. and Woodbury, D.F. 1985, 'The Effect of Tax Laws and Tax Adminisfration on Tax Compliance: The Case of the US Individual Income Tax', National Tax Journal vol. 38, no. 1, pp. 1-14.
Yaniv, G. 1990, 'Tax Evasion Under Differential Taxation. The Economics of Income Source Misreporting', Journal of Public Economics, vol. 43, pp. yil-Zll.
Yaniv, G. 1992,' Collaborated Employee-Employer Tax Evasion', Public Finance, vol. 47, no. 2, pp. 312-321.
242