Personal income tax - National Treasury statistics/2008/Chapter 2... · 29 2 Personal income tax...
48
29 2 Personal income tax Introduction Personal income tax (PIT) is one of government's main sources of income. Income tax is levied on residents' worldwide income, with appropriate relief to avoid double taxation. Non-residents are taxed on their income from a South African source. Tax is levied on taxable income that, in essence, consists of gross income less exemptions and allowable deductions. (Taxable capital gains also form part of taxable income.) Individuals generally receive most of their income as salary/wages, pension/retirement payments and investment income (interest and dividends). Some individuals may also have business income which is taxable as personal income (for example, sole proprietors and partners). This chapter gives an overview of: • Personal income tax rates • Tax returns and individual taxpayers • Taxable income and tax assessed • Individual taxpayers with business income • Individual taxpayers’ allowances, deductions and fringe benefits. Personal income tax rates The relative tax burden of all individual taxpayers - low, middle and high income earners - has reduced since 1999/00. The top marginal income tax rate for individuals decreased from 45 percent in 1999/00 to 42 percent in 2000/01 and to 40 percent in 2002/03. During this period the personal income tax brackets were increased significantly, which more than compensated for any fiscal drag. Table 2.1 illustrates the percentage increase in the personal income tax brackets between 2002/03 and 2008/09. The top personal income tax bracket increased from R240 001 in 2002/03 to R490 001 in 2008/09, a cumulative increase of 104.2 percent. During this period, the bottom income tax bracket increased by 205 percent. The primary rebate increased by 70.4 percent, which resulted in a similar increase in the income tax threshold (the level of annual income below which no income tax is payable) for individuals aged younger than 65 years from R27 000 to R46 000 per year. For individuals aged 65 years’ old and above, the income tax threshold increased by 73.5 percent from R42 640 to R74 000 per year. From 2002/03 to 2007/08, over R60 billion was granted in personal income tax relief across the board, for all income groups. This suggests that because the individual tax burden decreased, the disposable income of most taxpayers improved.
Transcript of Personal income tax - National Treasury statistics/2008/Chapter 2... · 29 2 Personal income tax...

29
2 Personal income tax
Introduction Personal income tax (PIT) is one of government's main sources of income. Income tax is levied on residents' worldwide income, with appropriate relief to avoid double taxation. Non-residents are taxed on their income from a South African source. Tax is levied on taxable income that, in essence, consists of gross income less exemptions and allowable deductions. (Taxable capital gains also form part of taxable income.)
Individuals generally receive most of their income as salary/wages, pension/retirement payments and investment income (interest and dividends). Some individuals may also have business income which is taxable as personal income (for example, sole proprietors and partners).
This chapter gives an overview of:
• Personal income tax rates • Tax returns and individual taxpayers • Taxable income and tax assessed • Individual taxpayers with business income • Individual taxpayers’ allowances, deductions and fringe benefits.
Personal income tax rates The relative tax burden of all individual taxpayers - low, middle and high income earners - has reduced since 1999/00. The top marginal income tax rate for individuals decreased from 45 percent in 1999/00 to 42 percent in 2000/01 and to 40 percent in 2002/03. During this period the personal income tax brackets were increased significantly, which more than compensated for any fiscal drag.
Table 2.1 illustrates the percentage increase in the personal income tax brackets between 2002/03 and 2008/09. The top personal income tax bracket increased from R240 001 in 2002/03 to R490 001 in 2008/09, a cumulative increase of 104.2 percent. During this period, the bottom income tax bracket increased by 205 percent. The primary rebate increased by 70.4 percent, which resulted in a similar increase in the income tax threshold (the level of annual income below which no income tax is payable) for individuals aged younger than 65 years from R27 000 to R46 000 per year. For individuals aged 65 years’ old and above, the income tax threshold increased by 73.5 percent from R42 640 to R74 000 per year.
From 2002/03 to 2007/08, over R60 billion was granted in personal income tax relief across the board, for all income groups. This suggests that because the individual tax burden decreased, the disposable income of most taxpayers improved.

2008 TAX STATISTICS
30
Table 2.1: Personal Income Tax (PIT) brackets, 2002/03 and 2008/09
Rand
2002/03 2008/09 Marginal PIT rates
Cumulative percentage
increaseBrackets – 40 000 – 122 000 18% 205.0%
40 001 80 000 122 001 195 000 25% 143.8%80 001 110 000 195 001 270 000 30% 145.5%
110 001 170 000 270 001 380 000 35% 123.5%170 001 240 000 380 001 490 000 38% 104.2%
240 001 and over 490 001 and over 40%Rebates
Primary 4 860 8 280 70.4%
Secondary 3 000 5 040 68.0%Tax thresholds
Below age 65 27 000 46 000 70.4%Age 65 and over 42 640 74 000 73.5%
Tax returns and individual taxpayers It should be noted that information on the number of individual taxpayers relates only to those taxpayers who are required to register with SARS. A large number of formal sector workers – those earning taxable income below R60 000 per annum (commonly referred to as SITE only taxpayers) – are not required to register with SARS. During the 2005/06 tax year there were an estimated 4 million formal workers with annual taxable income below R60 000.
Standard income tax on employees (SITE) is not a separate kind of tax. SITE represents payments towards an employee's income tax liability and in cases of employees subject only to SITE, the tax deducted from their remuneration by their employers, is their actual income tax liability. SITE generally applies as a final tax for individuals:
• whose annual net remuneration does not exceed R60 000
• who do not receive a travelling allowance
• who do not receive any other income.
Employees who pay SITE-only do not normally need to register for income tax or submit tax returns. The tables do reflect some of these registered individual taxpayers with taxable income below R60 000. A few individual taxpayers in this category are in fact registered due to claims for retirement fund contributions or medical expenses, prior year trading income or other non-SITE income, or assessed losses brought forward from previous tax years.
Although SARS does have some information on these individuals, detailed information on their characteristics and income distribution patterns is not available for inclusion in this publication. It should also be noted that for individuals below 65 years of age, in 2005/06, the income tax threshold below which no income tax was payable was R35 000.
The number of individuals registered for income tax (excluding SITE only taxpayers as indicated above) has grown from 3.6 million in 2002/03 to 5.3 million in 2007/08 (See table 2.2). After growing at a rate of about 10 percent in 2003/04, this rate has averaged at around 8.3 percent between 2004/05 and 2005/06.
The number of individuals liable to submit income tax returns increased from 3.5 million in 2002/03 to over 4.8 million in 2006/07. The percentage of individual taxpayers assessed at the time the data was extracted (July 2007) was 95.1 percent in 2002/03, 92.3 percent in 2003/04, 87 percent in 2004/05 and 71 percent in 2005/06. The tables in this chapter are based on these assessed returns.
CHAPTER 2: PERSONAL INCOME TAX
31
Table 2.2: Number of Individual taxpayers, 2002/03 – 2007/08
NumberRegistered1 Liable to
submit returns2Assessed Percentage
assessed2002/03 3 628 263 3 526 339 3 352 190 95.1%
2003/04 3 991 236 3 836 422 3 542 006 92.3%
2004/05 4 321 354 4 145 746 3 605 378 87.0%
2005/06 4 683 821 4 530 820 3 215 192 71.0%
2006/07 5 005 807 4 866 117
2007/08 5 318 441 1. Number of individuals registered as at 31 March of each year.
Includes coded cases where status is in suspense, estate and address unknown.2. Liable taxpayers are those who are liable to submit a return for a specific tax year.
Cases can be on register and active for other years, but might not be active for the specific tax year.
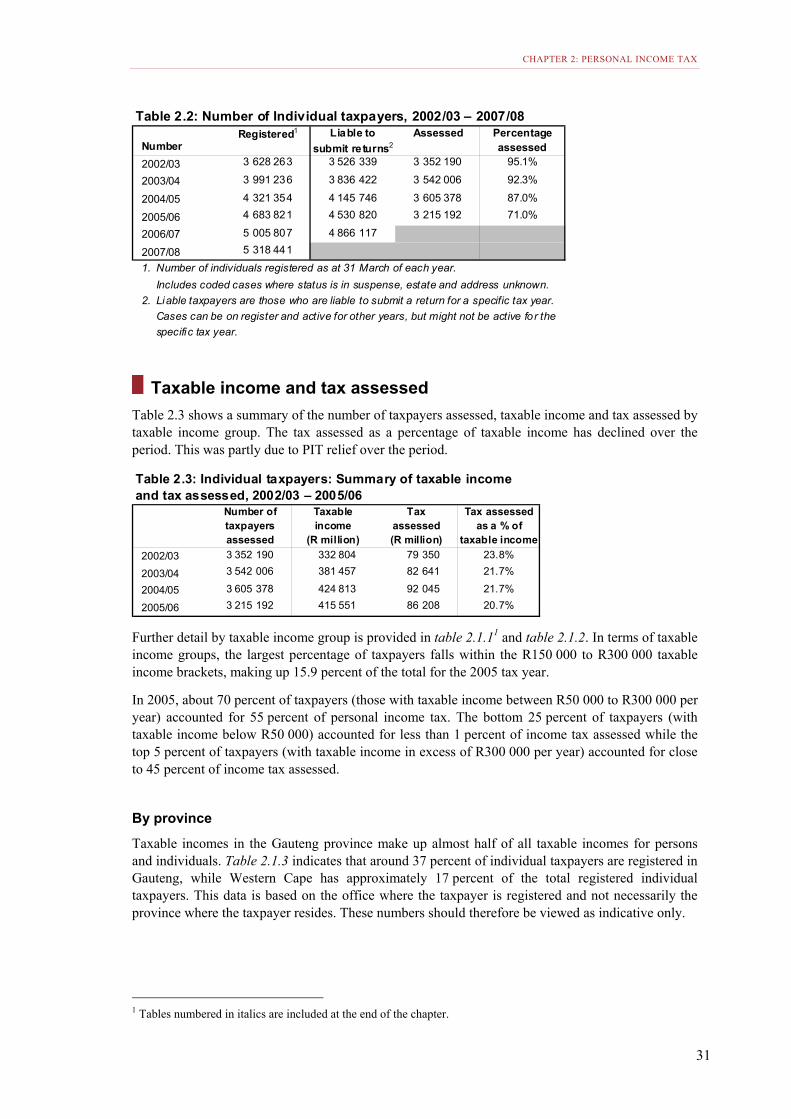
Taxable income and tax assessed Table 2.3 shows a summary of the number of taxpayers assessed, taxable income and tax assessed by taxable income group. The tax assessed as a percentage of taxable income has declined over the period. This was partly due to PIT relief over the period.
Number of taxpayers assessed
Taxable income
(R million)
Tax assessed(R million)
Tax assessed as a % of
taxable income2002/03 3 352 190 332 804 79 350 23.8%
2003/04 3 542 006 381 457 82 641 21.7%
2004/05 3 605 378 424 813 92 045 21.7%
2005/06 3 215 192 415 551 86 208 20.7%
Table 2.3: Individual taxpayers: Summary of taxable income and tax assessed, 2002/03 – 2005/06
Further detail by taxable income group is provided in table 2.1.11 and table 2.1.2. In terms of taxable income groups, the largest percentage of taxpayers falls within the R150 000 to R300 000 taxable income brackets, making up 15.9 percent of the total for the 2005 tax year.
In 2005, about 70 percent of taxpayers (those with taxable income between R50 000 to R300 000 per year) accounted for 55 percent of personal income tax. The bottom 25 percent of taxpayers (with taxable income below R50 000) accounted for less than 1 percent of income tax assessed while the top 5 percent of taxpayers (with taxable income in excess of R300 000 per year) accounted for close to 45 percent of income tax assessed.
By province
Taxable incomes in the Gauteng province make up almost half of all taxable incomes for persons and individuals. Table 2.1.3 indicates that around 37 percent of individual taxpayers are registered in Gauteng, while Western Cape has approximately 17 percent of the total registered individual taxpayers. This data is based on the office where the taxpayer is registered and not necessarily the province where the taxpayer resides. These numbers should therefore be viewed as indicative only.
1 Tables numbered in italics are included at the end of the chapter.

2008 TAX STATISTICS
32
By age group
Table 2.1.4 and figure 2.1 give a breakdown of registered individual taxpayers by age group. Around 30 percent of taxpayers are in the 35 to 44 year-old age group, accounting for around 33 percent of total personal income tax assessed.
Figure 2.1 Numbers of individual taxpayers by age group, 2003 – 2006
–
100 000
200 000
300 000
400 000
500 000
600 000
700 000
800 000
900 000
1 000 000
1 100 000
Below 18 18 - 24 25 - 34 35 - 44 45 - 54 55 - 64 65 andolder
Age group
Num
ber o
f tax
paye
rs
2003 2004 2005 2006
By gender
Males accounted for almost 58 percent of registered individual taxpayers, 65 percent of the total recorded taxable income earned by registered individual taxpayers and 70 percent of personal income tax assessed. This reflects the uneven income and employment patterns between males and females. Females make up about 43 percent of the working population (StatsSA: 2007).
Table 2.1.5 shows the breakdown of taxable income and tax assessed by gender over the period.
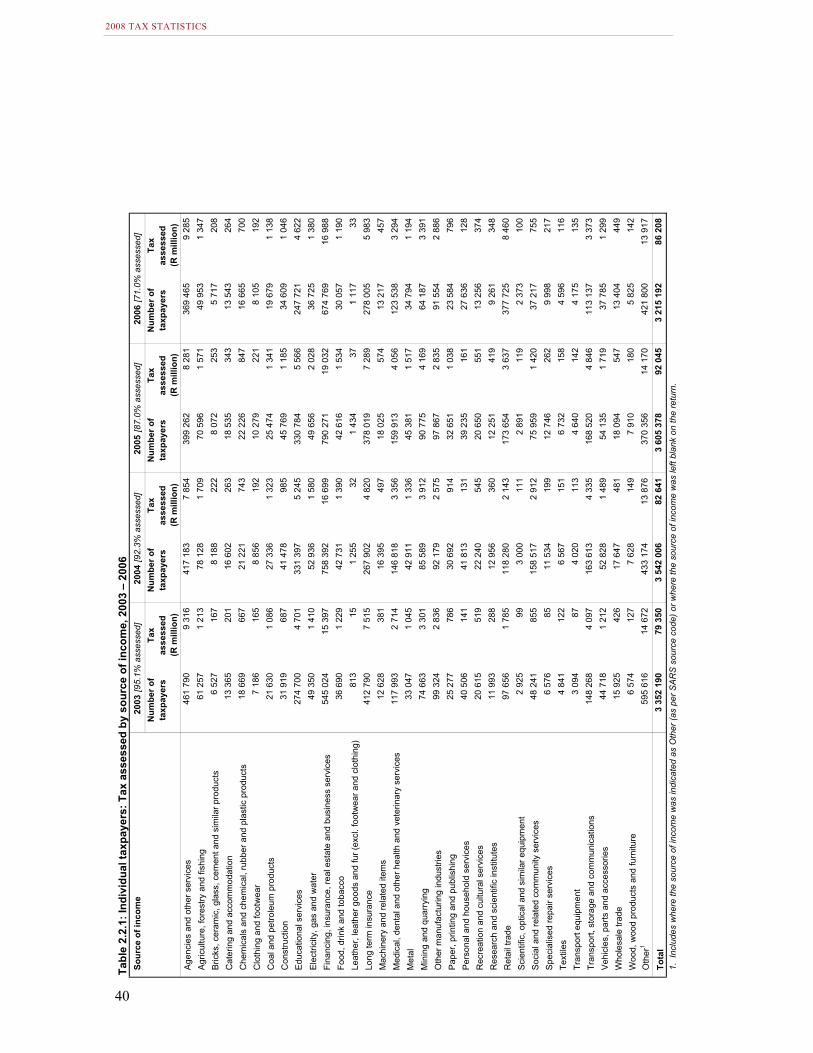
By source of income
Registered individual taxpayers employed in the finance, insurance, real estate and business services sector account for the largest share of total income tax assessed from individuals, averaging about 20 percent of the total for the period 2003 to 2006. The number of individuals registered as taxpayers within the sector grew from 545 024 in 2003 to 674 769 in 2006 (24 percent).
Table 2.2.1 and table 2.2.2 show the breakdown by source of income; the “other” category as a source of income comprises on average around 13 percent of individual taxpayers. This category includes those who indicated their source of income as “other” (as per the SARS source code) or who left the source of income column blank on the return.
Table 2.2.3 uses the SARS source of income code as in table 2.2.1 and classifies it according to the Standard Industrial Classification (SIC). It should be noted that the source of income codes by SARS are not fully aligned with the SIC system used by Stats SA. This means that the numbers per sector in these tables may differ from those published by Stats SA.

CHAPTER 2: PERSONAL INCOME TAX
33
Table 2.2.4 shows the breakdown according to source of income as indicated on the IRP5 form. This is based on the sector indicated by the employer on the IRP5 form.
Individual taxpayers with business income Individual taxpayers with business income amounted to about 4.9 percent of total individual taxpayers in 2006 (7.5 percent of the total in 2003). Individual taxpayers with business income derive almost a third of total assessed income (29.9 percent in 2006) from the financing, insurance, real estate and business services sector. This equates to 18.4 percent of the total taxpayers with business income and is closely followed by the medical, dental and other health and veterinary sciences sector, at 20 percent of total assessed income and 23.1 percent of total taxable income.
Table 2.3.1 and table 2.3.2 give a breakdown of the sectors in which individual taxpayers with business income are active. On average, just over 20 percent of individual taxpayers with business income recorded negative taxable income (making a loss) over the period.
Individual taxpayers’ allowances, deductions and fringe benefits Individual taxpayers’ allowances
Travel allowances make up the largest share of allowances for individuals (60.5 percent in 2006). The drop in the share of this allowance from 66.1 percent in 2004 can be partly explained by the changes introduced in 2006 to curb the rise in the abuse of the travel allowance.
Table 2.4.1 provides a summary of individual taxpayers’ allowances. The total allowances amount to R35.7 billion in 2003, R39.3 billion in 2004, R41.8 billion in 2005 and R41.4 billion in 2006. It should be noted that the data for 2006 is incomplete due to the lower percentage returns that were assessed at the time the data was extracted (July 2007).
The more significant allowances are shown per taxable income group in tables 2.4.2 to 2.4.7.
Individual taxpayers’ deductions
At 38.8 percent in 2006, contributions to retirement funding accounted for the largest share of deductions by individual taxpayers. The use of this deduction is the highest among individual taxpayers within the R150 000 to R300 000 taxable income brackets.
Table 2.5.1 provides a summary of individual taxpayers’ deductions. The amounts were R44.2 billion in 2003, R49.6 billion in 2004, R53.2 billion in 2005 and R49 billion in 2006. It should be noted that the data for 2006 is incomplete due to the lower percentage returns that were assessed at the time the data was extracted (July 2007).
The more significant deductions are shown by taxable income group in tables 2.5.2 to 2.5.15.
Individual taxpayers’ fringe benefits
Table 2.6.1 provides a summary of fringe benefits. The number of taxpayers receiving fringe benefits was 1 million in 2003, growing to 1.1 million in 2006. Total fringe benefits amounted to R6.4 billion in 2003, increasing to R7.3 billion in 2006.
Medical scheme contributions paid on behalf of the employees form the largest share of fringe benefits in 2006 (35.4 percent), followed closely by the right of an employee to use a company owned vehicle (33.3 percent).
The more significant fringe benefits are shown by taxable income group in tables 2.6.2 to 2.6.9.

2008 TAX STATISTICS
34
Tables
Table 2.1.1 Individual taxpayers: Taxable income and tax assessed by taxable income group, 2003 – 2006................................................................................................... 36
Table 2.1.2 Individual taxpayers: Taxable income and tax assessed by taxable income group, 2003 – 2006 [Percentage of total]..................................................................................... 37
Table 2.1.3 Individual taxpayers: Taxable income and tax assessed by province, 2003 –2006 .......... 38
Table 2.1.4 Individual taxpayers: Taxable income and tax assessed by age group, 2003 – 2006 ....... 39
Table 2.1.5 Individual taxpayers: Taxable income and tax assessed by gender, 2003 – 2006 ............ 39
Table 2.2.1 Individual taxpayers: Tax assessed by source of income, 2003 – 2006................ 40
Table 2.2.2 Individual taxpayers: Tax assessed by source of income, 2003 – 2006 [percentage of total] ................................................................................................................................. 41
Table 2.2.3 Individual taxpayers: Tax assessed by economic activity, 2003 – 2006........................... 42
Table 2.2.4 Individual taxpayers: Tax assessed by source of income as on IRP5 forms, 2003 – 2006 ...................................................................................................................... 43
Table 2.3.1 Individual taxpayers with business income: Taxable income and tax assessed by sector, 2003 – 2006 ......................................................................................... 44
Table 2.3.2 Individual taxpayers with business income: Taxable income and tax assessed by sector, 2003 – 2006 [percentage of total] ..................................................................................... 45
Table 2.4.1 Individual taxpayers: Allowances, 2003 – 2006..................................................... 46 Table 2.4.2 Individual taxpayers: Allowances - Travelling allowance (code 3701) by taxable
income group, 2003 – 2006 .............................................................................................. 47
Table 2.4.3 Individual taxpayers: Allowances - Travelling allowance (code 3701) by taxable income group, 2003 – 2006 [percentage of total] ............................................................. 48
Table 2.4.4 Individual taxpayers: Allowances - Share option exercised (code 3707) by taxable income group, 2003 – 2006 .............................................................................................. 49
Table 2.4.5 Individual taxpayers: Allowances - Share option exercised (code 3707) by taxable income group, 2003 – 2006 [percentage of total] ............................................................. 50
Table 2.4.6 Individual taxpayers: Allowances - Other allowance (code 3713) by taxable income group, 2003 – 2006 ........................................................................................................... 51
Table 2.4.7 Individual taxpayers: Allowances - Other allowance (code 3713) by taxable income group, 2003 – 2006 [percentage of total].......................................................................... 52
Table 2.5.1 Individual taxpayers: Deductions, 2003 – 2006 ..................................................... 53 Table 2.5.2 Individual taxpayers: Deductions - Current pension fund contributions (code 4001) by
taxable income group, 2003 – 2006.................................................................................. 54
Table 2.5.3 Individual taxpayers: Deductions - Current pension fund contributions (code 4001) by taxable income group, 2003 – 2006 [percentage of total]................................................. 55
Table 2.5.4 Individual taxpayers: Deductions - Current retirement annuity fund contributions (code 4006) by taxable income group, 2003 – 2006......................................................... 56

CHAPTER 2: PERSONAL INCOME TAX
35
Table 2.5.5 Individual taxpayers: Deductions - Current retirement annuity fund contributions (code 4006) by taxable income group, 2003 – 2006 [percentage of total] ........................57
Table 2.5.6 Individual taxpayers: Deductions - Medical expenses (total) (code 4008) by taxable income group, 2003 – 2006 ...............................................................................................58
Table 2.5.7 Individual taxpayers: Deductions - Medical expenses (total) (code 4008) by taxable income group, 2003 – 2006 [percentage of total] ..............................................................59
Table 2.5.8 Individual taxpayers: Deductions - Medical expenses (disabled) (code 4009) by taxable income group, 2003 – 2006...................................................................................60
Table 2.5.9 Individual taxpayers: Deductions - Medical expenses (disabled) (code 4009) by taxable income group, 2003 – 2006 [percentage of total] .................................................61
Table 2.5.10 Individual taxpayers: Deductions - Travel expenses (fixed cost) (code 4014) by taxable income group, 2003 – 2006...................................................................................62
Table 2.5.11 Individual taxpayers: Deductions - Travel expenses (fixed cost) (code 4014) by taxable income group, 2003 – 2006 [percentage of total] .................................................63
Table 2.5.12 Individual taxpayers: Deductions - Travel expenses (actual cost) (code 4015) by taxable income group, 2003 – 2006...................................................................................64
Table 2.5.13 Individual taxpayers: Deductions - Travel expenses (actual cost) (code 4015) by taxable income group, 2003 – 2006 [percentage of total] .................................................65
Table 2.5.14 Individual taxpayers: Deductions - Other (code 4016) by taxable income group, 2003 – 2006 .......................................................................................................................66
Table 2.5.15 Individual taxpayers: Deductions - Other (code 4016) by taxable income group, 2003 – 2006 [percentage of total]......................................................................................67
Table 2.6.1 Individual taxpayers: Fringe benefits, 2003 – 2006 ............................................... 68 Table 2.6.2 Individual taxpayers: Fringe benefits - Use of motor vehicle (code 3802) by taxable
income group, 2003 – 2006 ...............................................................................................69
Table 2.6.3 Individual taxpayers: Fringe benefits - Use of motor vehicle (code 3802) by taxable income group, 2003 – 2006 [percentage of total] ..............................................................70
Table 2.6.4 Individual taxpayers: Fringe benefits - Free or cheap residential / holiday accommodation (code 3805) by taxable income group, 2003 – 2006 ...............................71
Table 2.6.5 Individual taxpayers: Fringe benefits - Free or cheap residential / holiday accommodation (code 3805) by taxable income group, 2003 – 2006 [percentage of total] ..................................................................................................................................72
Table 2.6.6 Individual taxpayers: Fringe benefits - Bursaries and scholarships (code 3809) by taxable income group, 2003 – 2006...................................................................................73
Table 2.6.7 Individual taxpayers: Fringe benefits - Bursaries and scholarships (code 3809) by taxable income group, 2003 – 2006 [percentage of total] .................................................74
Table 2.6.8 Individual taxpayers: Fringe benefits - Medical aid paid on your behalf (code 3810) by taxable income group, 2003 – 2006..............................................................................75
Table 2.6.9 Individual taxpayers: Fringe benefits - Medical aid paid on your behalf (code 3810) by taxable income group, 2003 – 2006 [percentage of total].............................................76

Tabl
e 2.
1.1:
Indi
vidu
al ta
xpay
ers:
Tax
able
inco
me
and
tax
asse
ssed
by
taxa
ble
inco
me
grou
p, 2
003
– 20
06Ta
xabl
e in
com
e gr
oup
2003
[95.
1% a
sses
sed]
2004
[92.
3% a
sses
sed]
2005
[87.
0% a
sses
sed]
2006
[71.
0% a
sses
sed]
Num
ber o
f ta
xpay
ers
Taxa
ble
inco
me
(R m
illio
n)
Tax
asse
ssed
(R m
illio
n)
Num
ber o
f ta
xpay
ers
Taxa
ble
inco
me
(R m
illio
n)
Tax
asse
ssed
(R m
illio
n)
Num
ber o
f ta
xpay
ers
Taxa
ble
inco
me
(R m
illio
n)
Tax
asse
ssed
(R m
illio
n)
Num
ber o
f ta
xpay
ers
Taxa
ble
inco
me
(R m
illio
n)
Tax
asse
ssed
(R m
illio
n)A
:<
074
707
-12
472
1
76 8
62
-1
2 46
41
75
535
-12
127
0
55 1
96
-6
768
0
B:
= 0
218
166
–
4
22
0 88
9
–
2
211
092
–
2
15
9 25
6
–
2
C:
1 –
20 0
0020
2 61
0
2 15
3
13
188
830
1
980
11
17
5 18
2
1 80
5
9
13
3 34
0
1 36
4
5
D:
20 0
01 –
30
000
185
207
4
734
34
16
3 33
5
4 24
1
16
126
317
3
242
13
85
390
2 17
2
8
E:
30 0
01 –
40
000
186
651
6
538
255
181
936
6
372
162
177
698
6
207
97
12
9 48
6
4 56
8
37
F:40
001
– 5
0 00
018
2 25
4
8 20
9
60
2
17
8 21
6
8 02
9
43
4
16
6 09
3
7 49
0
33
7
13
3 63
8
6 01
5
21
0
G:
50 0
01 –
60
000
191
898
10
613
1 14
1
18
2 21
5
10 0
64
78
2
17
0 68
9
9 42
9
65
1
13
8 78
2
7 66
1
43
1
H:
60 0
01 –
70
000
257
774
16
733
2 17
8
25
6 76
0
16 7
52
1
598
221
942
14
476
1 27
5
17
1 29
6
11 1
68
85
7
I:70
001
– 8
0 00
025
7 88
4
19 3
71
2
844
250
115
18
747
2 08
5
25
8 02
1
19 3
03
1
974
213
165
16
031
1 48
2
J:80
001
– 9
0 00
023
7 40
0
20 1
48
3
256
260
182
22
079
2 81
9
24
9 81
1
21 2
97
2
551
207
824
17
634
1 88
4
K:
90 0
00 –
100
000
213
830
20
296
3 57
7
22
5 61
4
21 3
99
3
009
235
812
22
368
2 97
5
21
6 21
4
20 5
97
2
532
L:10
0 00
1 –
110
000
170
040
17
812
3 34
2
19
9 82
3
20 9
49
3
164
201
701
21
167
3 05
2
19
5 48
2
20 4
73
2
753
M:
110
001
– 12
0 00
013
9 05
9
15 9
73
3
185
156
756
17
998
2 90
8
18
1 07
8
20 7
85
3
196
169
750
19
530
2 82
8
N:
120
001
– 13
0 00
010
7 30
2
13 3
87
2
823
127
314
15
893
2 74
0
13
8 96
7
17 3
53
2
857
164
358
20
508
3 14
1
O:
130
001
– 14
0 00
084
395
11 3
80
2
513
103
289
13
924
2 52
9
12
1 93
7
16 4
44
2
869
125
791
16
963
2 74
6
P:
140
001
– 15
0 00
073
240
10 6
11
2
436
82 7
39
11
984
2 29
0
96
211
13 9
37
2
548
106
277
15
395
2 63
7
Q:
150
001
– 20
0 00
023
5 04
4
40 4
20
10
063
276
490
47
590
10 2
76
30
9 99
8
53 4
28
10
987
315
506
54
330
10 4
17
R:
200
001
– 30
0 00
019
0 31
8
45 8
41
13
056
226
934
54
727
14 2
10
26
3 29
1
63 5
95
15
920
268
125
64
710
15 2
02
S:
300
001
– 40
0 00
067
457
23 0
99
7
281
85 9
86
29
460
8 74
2
10
3 06
4
35 3
74
10
239
104
764
35
993
9 95
4
T:40
0 00
1 –
500
000
29 4
30
13
060
4 33
5
37
793
16 7
78
5
320
46 9
60
20
864
6 48
8
48
452
21 5
18
6
474
U:
500
001
– 75
0 00
027
269
16 3
44
5
664
34 8
11
20
858
6 97
7
43
303
25 9
27
8
540
43 7
14
26
109
8 39
9
V:
750
001
– 1
000
000
9 09
3
7
789
2 80
5
11
442
9 80
5
3
439
14 0
02
11
991
4 13
9
13
888
11 8
85
4
040
W:
1 00
0 00
1 –
2 00
0 00
08
573
11 4
03
4
237
10 7
36
14
249
5 20
0
12
859
17 1
38
6
194
12 2
61
16
214
5 78
2
X:
2 00
0 00
1 –
5 00
0 00
02
221
6 29
0
2
431
2 59
4
7
287
2 78
4
3
326
9 36
5
3
569
2 81
7
7
852
2 96
7
Y:
5 00
0 00
1 +
368
3 07
3
1
274
345
2 75
6
1
144
489
3 95
3
1
563
420
3 62
9
1
418
Tota
l3
352
190
332
804
79
350
3 54
2 00
6
38
1 45
7
82 6
41
3
605
378
424
813
92
045
3 21
5 19
2
41
5 55
1
86 2
08
E
xclu
des
SIT
E o
nly
taxp
ayer
s.
2008 TAX STATISTICS
36

Tabl
e 2.
1.2:
Indi
vidu
al ta
xpay
ers:
Tax
able
inco
me
and
tax
asse
ssed
by
taxa
ble
inco
me
grou
p, 2
003
– 20
06 [P
erce
ntag
e of
tota
l]Ta
xabl
e in
com
e gr
oup
2003
[95.
1% a
sses
sed]
2004
[92.
3% a
sses
sed]
2005
[87.
0% a
sses
sed]
2006
[71.
0% a
sses
sed]
Num
ber o
f ta
xpay
ers
Taxa
ble
inco
me
Tax
asse
ssed
Num
ber o
f ta
xpay
ers
Taxa
ble
inco
me
Tax
asse
ssed
Num
ber o
f ta
xpay
ers
Taxa
ble
inco
me
Tax
asse
ssed
Num
ber o
f ta
xpay
ers
Taxa
ble
inco
me
Tax
asse
ssed
A:
< 0
2.2%
-3.7
%0.
0%2.
2%-3
.3%
0.0%
2.1%
-2.9
%0.
0%1.
7%-1
.6%
0.0%
B:
= 0
6.5%
0.0%
0.0%
6.2%
0.0%
0.0%
5.9%
0.0%
0.0%
5.0%
0.0%
0.0%
C:
1 –
20 0
006.
0%0.
6%0.
0%5.
3%0.
5%0.
0%4.
9%0.
4%0.
0%4.
1%0.
3%0.
0%
D:
20 0
01 –
30
000
5.5%
1.4%
0.0%
4.6%
1.1%
0.0%
3.5%
0.8%
0.0%
2.7%
0.5%
0.0%
E:
30 0
01 –
40
000
5.6%
2.0%
0.3%
5.1%
1.7%
0.2%
4.9%
1.5%
0.1%
4.0%
1.1%
0.0%
F:40
001
– 5
0 00
05.
4%2.
5%0.
8%5.
0%2.
1%0.
5%4.
6%1.
8%0.
4%4.
2%1.
4%0.
2%
G:
50 0
01 –
60
000
5.7%
3.2%
1.4%
5.1%
2.6%
0.9%
4.7%
2.2%
0.7%
4.3%
1.8%
0.5%
H:
60 0
01 –
70
000
7.7%
5.0%
2.7%
7.2%
4.4%
1.9%
6.2%
3.4%
1.4%
5.3%
2.7%
1.0%
I:70
001
– 8
0 00
07.
7%5.
8%3.
6%7.
1%4.
9%2.
5%7.
2%4.
5%2.
1%6.
6%3.
9%1.
7%
J:80
001
– 9
0 00
07.
1%6.
1%4.
1%7.
3%5.
8%3.
4%6.
9%5.
0%2.
8%6.
5%4.
2%2.
2%
K:
90 0
00 –
100
000
6.4%
6.1%
4.5%
6.4%
5.6%
3.6%
6.5%
5.3%
3.2%
6.7%
5.0%
2.9%
L:10
0 00
1 –
110
000
5.1%
5.4%
4.2%
5.6%
5.5%
3.8%
5.6%
5.0%
3.3%
6.1%
4.9%
3.2%
M:
110
001
– 12
0 00
04.
1%4.
8%4.
0%4.
4%4.
7%3.
5%5.
0%4.
9%3.
5%5.
3%4.
7%3.
3%
N:
120
001
– 13
0 00
03.
2%4.
0%3.
6%3.
6%4.
2%3.
3%3.
9%4.
1%3.
1%5.
1%4.
9%3.
6%
O:
130
001
– 14
0 00
02.
5%3.
4%3.
2%2.
9%3.
7%3.
1%3.
4%3.
9%3.
1%3.
9%4.
1%3.
2%
P:
140
001
– 15
0 00
02.
2%3.
2%3.
1%2.
3%3.
1%2.
8%2.
7%3.
3%2.
8%3.
3%3.
7%3.
1%
Q:
150
001
– 20
0 00
07.
0%12
.1%
12.7
%7.
8%12
.5%
12.4
%8.
6%12
.6%
11.9
%9.
8%13
.1%
12.1
%
R:
200
001
– 30
0 00
05.
7%13
.8%
16.5
%6.
4%14
.3%
17.2
%7.
3%15
.0%
17.3
%8.
3%15
.6%
17.6
%
S:
300
001
– 40
0 00
02.
0%6.
9%9.
2%2.
4%7.
7%10
.6%
2.9%
8.3%
11.1
%3.
3%8.
7%11
.5%
T:40
0 00
1 –
500
000
0.9%
3.9%
5.5%
1.1%
4.4%
6.4%
1.3%
4.9%
7.0%
1.5%
5.2%
7.5%
U:
500
001
– 75
0 00
00.
8%4.
9%7.
1%1.
0%5.
5%8.
4%1.
2%6.
1%9.
3%1.
4%6.
3%9.
7%
V:
750
001
– 1
000
000
0.3%
2.3%
3.5%
0.3%
2.6%
4.2%
0.4%
2.8%
4.5%
0.4%
2.9%
4.7%
W:
1 00
0 00
1 –
2 00
0 00
00.
3%3.
4%5.
3%0.
3%3.
7%6.
3%0.
4%4.
0%6.
7%0.
4%3.
9%6.
7%
X:
2 00
0 00
1 –
5 00
0 00
00.
1%1.
9%3.
1%0.
1%1.
9%3.
4%0.
1%2.
2%3.
9%0.
1%1.
9%3.
4%
Y:
5 00
0 00
1 +
0.0%
0.9%
1.6%
0.0%
0.7%
1.4%
0.0%
0.9%
1.7%
0.0%
0.9%
1.6%
Tota
l10
0.0%
100.
0%10
0.0%
100.
0%10
0.0%
100.
0%10
0.0%
100.
0%10
0.0%
100.
0%10
0.0%
100.
0%
Perc
enta
ge o
f tot
al
CHAPTER 2: PERSONAL INCOME TAX
37

Tabl
e 2.
1.3:
Indi
vidu
al ta
xpay
ers:
Tax
able
inco
me
and
tax
asse
ssed
by
prov
ince
, 200
3 –
2006
Prov
ince
120
03 [9
5.1%
ass
esse
d]20
04 [9
2.3%
ass
esse
d]20
05 [8
7.0%
ass
esse
d]20
06 [7
1.0%
ass
esse
d]N
umbe
r of
taxp
ayer
sTa
xabl
e in
com
e (R
mill
ion)
Tax
asse
ssed
(R m
illio
n)
Num
ber o
f ta
xpay
ers
Taxa
ble
inco
me
(R m
illio
n)
Tax
asse
ssed
(R m
illio
n)
Num
ber o
f ta
xpay
ers
Taxa
ble
inco
me
(R m
illio
n)
Tax
asse
ssed
(R m
illio
n)
Num
ber o
f ta
xpay
ers
Taxa
ble
inco
me
(R m
illio
n)
Tax
asse
ssed
(R m
illio
n)E
aste
rn C
ape
278
011
22
388
4 56
5
29
5 10
8
25 7
76
4
650
299
973
28
612
5 15
5
26
7 88
8
27 5
61
4
692
Free
Sta
te17
1 51
1
12 0
13
2
721
180
735
13
887
2 75
3
18
2 38
6
15 1
20
3
012
158
423
15
287
2 75
3
Gau
teng
1 25
7 94
9
15
1 71
9
38 5
02
1
320
399
172
961
40
555
1 34
2 11
3
19
2 29
9
45 1
40
1
186
399
183
377
41
540
Kw
aZul
u-N
atal
505
970
45
135
9 97
7
53
2 80
1
51 6
36
10
251
539
636
57
340
11 4
24
49
1 87
7
58 0
02
11
298
Lim
popo
96 0
28
7
616
1 50
2
10
3 47
2
8 92
5
1
545
106
463
10
295
1 79
2
98
022
10 6
87
1
792
Mpu
mal
anga
289
281
25
479
5 84
4
31
1 92
5
30 2
90
6
206
321
512
34
510
7 06
6
29
3 71
1
35 8
17
7
056
Nor
th W
est
102
588
8
198
1 83
3
10
8 45
5
9 42
0
1
881
110
003
10
208
2 03
3
97
594
10 5
32
1
996
Nor
ther
n C
ape
66 7
86
4
748
1 05
6
71
644
5 53
8
1
091
73 9
39
6
220
1 20
8
64
831
6 66
4
1
202
Wes
tern
Cap
e57
5 36
4
54 7
41
13
148
609
613
62
388
13 5
58
62
2 75
0
69 6
97
15
092
551
520
67
317
13 8
12
Oth
er2
8 70
2
76
8
20
2
7
854
637
153
6 60
3
51
3
12
2
4
927
306
66
Tota
l3
352
190
332
804
79
350
3 54
2 00
6
38
1 45
7
82 6
41
3
605
378
424
813
92
045
3 21
5 19
2
41
5 55
1
86 2
08
Perc
enta
ge o
f tot
alE
aste
rn C
ape
8.3%
6.7%
5.8%
8.3%
6.8%
5.6%
8.3%
6.7%
5.6%
8.3%
6.6%
5.4%
Free
Sta
te5.
1%3.
6%3.
4%5.
1%3.
6%3.
3%5.
1%3.
6%3.
3%4.
9%3.
7%3.
2%
Gau
teng
37.5
%45
.6%
48.5
%37
.3%
45.3
%49
.1%
37.2
%45
.3%
49.0
%36
.9%
44.1
%48
.2%
Kw
aZul
u-N
atal
15.1
%13
.6%
12.6
%15
.0%
13.5
%12
.4%
15.0
%13
.5%
12.4
%15
.3%
14.0
%13
.1%
Lim
popo
2.9%
2.3%
1.9%
2.9%
2.3%
1.9%
3.0%
2.4%
1.9%
3.0%
2.6%
2.1%
Mpu
mal
anga
8.6%
7.7%
7.4%
8.8%
7.9%
7.5%
8.9%
8.1%
7.7%
9.1%
8.6%
8.2%
Nor
th W
est
3.1%
2.5%
2.3%
3.1%
2.5%
2.3%
3.1%
2.4%
2.2%
3.0%
2.5%
2.3%
Nor
ther
n C
ape
2.0%
1.4%
1.3%
2.0%
1.5%
1.3%
2.1%
1.5%
1.3%
2.0%
1.6%
1.4%
Wes
tern
Cap
e17
.2%
16.4
%16
.6%
17.2
%16
.4%
16.4
%17
.3%
16.4
%16
.4%
17.2
%16
.2%
16.0
%
Oth
er
0.3%
0.2%
0.3%
0.2%
0.2%
0.2%
0.2%
0.1%
0.1%
0.2%
0.1%
0.1%
Tota
l10
0.0%
100.
0%10
0.0%
100.
0%10
0.0%
100.
0%10
0.0%
100.
0%10
0.0%
100.
0%10
0.0%
100.
0%1.
Bas
ed o
n th
e of
fice
whe
re th
e ta
xpay
er is
regi
ster
ed a
nd n
ot n
eces
saril
y th
e pr
ovin
ce w
here
the
taxp
ayer
resi
des.
The
pro
vinc
ial a
lloca
tion
is th
us a
refle
ctio
n of
the
prov
ince
in w
hich
the
taxp
ayer
s'
offic
e is
loca
ted.
2. O
ther
incl
udes
VIP
s an
d th
e pa
rliam
enta
ry u
nit.
2008 TAX STATISTICS
38

Tabl
e 2.
1.4:
Indi
vidu
al ta
xpay
ers:
Tax
able
inco
me
and
tax
asse
ssed
by
age
grou
p, 2
003
– 20
06A
ge g
roup
(yea
rs)
2003
[95.
1% a
sses
sed]
2004
[92.
3% a
sses
sed]
2005
[87.
0% a
sses
sed]
2006
[71.
0% a
sses
sed]
Num
ber o
f ta
xpay
ers
Taxa
ble
inco
me
(R m
illio
n)
Tax
asse
ssed
(R m
illio
n)
Num
ber o
f ta
xpay
ers
Taxa
ble
inco
me
(R m
illio
n)
Tax
asse
ssed
(R m
illio
n)
Num
ber o
f ta
xpay
ers
Taxa
ble
inco
me
(R m
illio
n)
Tax
asse
ssed
(R m
illio
n)
Num
ber o
f ta
xpay
ers
Taxa
ble
inco
me
(R m
illio
n)
Tax
asse
ssed
(R m
illio
n)B
elow
18
12 2
67
33
8
42
13 8
66
41
9
50
15 1
01
52
1
62
11 1
98
43
4
59
18 -
2427
897
875
111
44 5
07
1
819
211
69 9
12
3
747
465
89 0
97
6
340
829
25 -
3457
8 32
5
49 9
70
10
256
683
346
65
938
12 1
94
75
4 77
3
81 8
55
15
492
715
025
89
101
16 9
13
35 -
441
012
499
108
780
25
598
1 06
7 16
9
12
5 62
8
27 0
65
1
076
889
139
805
30
447
956
055
13
6 82
8
28 9
46
45 -
5483
8 60
3
94 7
65
23
962
863
870
10
6 01
4
24 6
18
85
8 00
9
115
769
26
985
748
054
10
8 75
2
24 1
35
55 -
6448
0 15
1
50 5
06
13
405
484
165
54
346
13 2
48
47
1 81
0
57 1
12
13
754
399
860
51
443
11 6
91
65 a
nd o
lder
402
448
27
569
5 97
6
38
5 08
3
27 2
93
5
256
358
884
26
003
4 84
0
29
5 90
3
22 6
54
3
636
Tota
l3
352
190
332
804
79
350
3 54
2 00
6
38
1 45
7
82 6
41
3
605
378
424
813
92
045
3 21
5 19
2
41
5 55
1
86 2
08
Perc
enta
ge o
f tot
alB
elow
18
0.4%
0.1%
0.1%
0.4%
0.1%
0.1%
0.4%
0.1%
0.1%
0.3%
0.1%
0.1%
18 -
240.
8%0.
3%0.
1%1.
3%0.
5%0.
3%1.
9%0.
9%0.
5%2.
8%1.
5%1.
0%
25 -
3417
.3%
15.0
%12
.9%
19.3
%17
.3%
14.8
%20
.9%
19.3
%16
.8%
22.2
%21
.4%
19.6
%
35 -
4430
.2%
32.7
%32
.3%
30.1
%32
.9%
32.7
%29
.9%
32.9
%33
.1%
29.7
%32
.9%
33.6
%
45 -
5425
.0%
28.5
%30
.2%
24.4
%27
.8%
29.8
%23
.8%
27.3
%29
.3%
23.3
%26
.2%
28.0
%
55 -
6414
.3%
15.2
%16
.9%
13.7
%14
.2%
16.0
%13
.1%
13.4
%14
.9%
12.4
%12
.4%
13.6
%
65 a
nd o
lder
12.0
%8.
3%7.
5%10
.9%
7.2%
6.4%
10.0
%6.
1%5.
3%9.
2%5.
5%4.
2%
Tota
l10
0.0%
100.
0%10
0.0%
100.
0%10
0.0%
100.
0%10
0.0%
100.
0%10
0.0%
100.
0%10
0.0%
100.
0%
Tabl
e 2.
1.5:
Indi
vidu
al ta
xpay
ers:
Tax
able
inco
me
and
tax
asse
ssed
by
gend
er, 2
003
– 20
06G
ende
r20
03 [9
5.1%
ass
esse
d]20
04 [9
2.3%
ass
esse
d]20
05 [8
7.0%
ass
esse
d]20
06 [7
1.0%
ass
esse
d]N
umbe
r of
taxp
ayer
sTa
xabl
e in
com
e (R
mill
ion)
Tax
asse
ssed
(R m
illio
n)
Num
ber o
f ta
xpay
ers
Taxa
ble
inco
me
(R m
illio
n)
Tax
asse
ssed
(R m
illio
n)
Num
ber o
f ta
xpay
ers
Taxa
ble
inco
me
(R m
illio
n)
Tax
asse
ssed
(R m
illio
n)
Num
ber o
f ta
xpay
ers
Taxa
ble
inco
me
(R m
illio
n)
Tax
asse
ssed
(R m
illio
n)Fe
mal
e1
370
463
108
488
21
548
1 47
8 78
1
12
7 33
0
22 5
00
1
539
520
145
094
25
881
1 41
7 23
8
14
7 97
1
25 7
65
Mal
e1
981
727
224
316
57
801
2 06
3 22
5
25
4 12
7
60 1
41
2
065
858
279
719
66
164
1 79
7 95
4
26
7 58
0
60 4
42
Tota
l3
352
190
332
804
79
350
3 54
2 00
6
38
1 45
7
82 6
41
3
605
378
424
813
92
045
3 21
5 19
2
41
5 55
1
86 2
08
Perc
enta
ge o
f tot
alFe
mal
e40
.9%
32.6
%27
.2%
41.7
%33
.4%
27.2
%42
.7%
34.2
%28
.1%
44.1
%35
.6%
29.9
%
Mal
e59
.1%
67.4
%72
.8%
58.3
%66
.6%
72.8
%57
.3%
65.8
%71
.9%
55.9
%64
.4%
70.1
%
Tota
l10
0.0%
100.
0%10
0.0%
100.
0%10
0.0%
100.
0%10
0.0%
100.
0%10
0.0%
100.
0%10
0.0%
100.
0%
CHAPTER 2: PERSONAL INCOME TAX
39
Tabl
e 2.
2.1:
Indi
vidu
al ta
xpay
ers:
Tax
ass
esse
d by
sou
rce
of in
com
e, 2
003
– 20
06So
urce
of i
ncom
e20
03 [9
5.1%
ass
esse
d]20
04 [9
2.3%
ass
esse
d]20
05 [8
7.0%
ass
esse
d]20
06 [7
1.0%
ass
esse
d]N
umbe
r of
taxp
ayer
sTa
x as
sess
ed(R
mill
ion)
Num
ber o
f ta
xpay
ers
Tax
asse
ssed
(R m
illio
n)
Num
ber o
f ta
xpay
ers
Tax
asse
ssed
(R m
illio
n)
Num
ber o
f ta
xpay
ers
Tax
asse
ssed
(R m
illio
n)A
genc
ies
and
othe
r ser
vice
s46
1 79
0
9
316
41
7 18
3
7
854
39
9 26
2
8
281
36
9 46
5
9
285
Agr
icul
ture
, for
estry
and
fish
ing
61 2
57
1 21
3
78 1
28
1 70
9
70 5
96
1 57
1
49 9
53
1 34
7
Bric
ks, c
eram
ic, g
lass
, cem
ent a
nd s
imila
r pro
duct
s6
527
16
7
8
188
22
2
8
072
25
3
5
717
20
8
Cat
erin
g an
d ac
com
mod
atio
n13
365
20
1
16
602
26
3
18
535
34
3
13
543
26
4
Che
mic
als
and
chem
ical
, rub
ber a
nd p
last
ic p
rodu
cts
18 6
69
667
21 2
21
743
22 2
26
847
16 6
65
700
Clo
thin
g an
d fo
otw
ear
7 18
6
165
8 85
6
192
10 2
79
221
8 10
5
192
Coa
l and
pet
role
um p
rodu
cts
21 6
30
1 08
6
27 3
36
1 32
3
25 4
74
1 34
1
19 6
79
1 13
8
Con
stru
ctio
n31
919
68
7
41
478
98
5
45
769
1
185
34
609
1
046
Edu
catio
nal s
ervi
ces
274
700
4 70
1
331
397
5 24
5
330
784
5 56
6
247
721
4 62
2
Ele
ctric
ity, g
as a
nd w
ater
49 3
50
1 41
0
52 9
36
1 58
0
49 6
56
2 02
8
36 7
25
1 38
0
Fina
ncin
g, in
sura
nce,
real
est
ate
and
busi
ness
ser
vice
s54
5 02
4
15
397
75
8 39
2
16
699
79
0 27
1
19
032
67
4 76
9
16
988
Food
, drin
k an
d to
bacc
o36
690
1
229
42
731
1
390
42
616
1
534
30
057
1
190
Leat
her,
leat
her g
oods
and
fur (
excl
. foo
twea
r and
clo
thin
g)81
3
15
1
255
32
1
434
37
1
117
33
Long
term
insu
ranc
e41
2 79
0
7
515
26
7 90
2
4
820
37
8 01
9
7
289
27
8 00
5
5
983
Mac
hine
ry a
nd re
late
d ite
ms
12 6
28
381
16 3
95
497
18 0
25
574
13 2
17
457
Med
ical
, den
tal a
nd o
ther
hea
lth a
nd v
eter
inar
y se
rvic
es11
7 99
3
2
714
14
6 81
8
3
356
15
9 91
3
4
056
12
3 53
8
3
294
Met
al33
047
1
045
42
911
1
336
45
381
1
517
34
794
1
194
Min
ing
and
quar
ryin
g74
663
3
301
85
589
3
912
90
775
4
169
64
187
3
391
Oth
er m
anuf
actu
ring
indu
strie
s99
324
2
836
92
179
2
575
97
867
2
835
91
554
2
886
Pap
er, p
rintin
g an
d pu
blis
hing
25 2
77
786
30 6
92
914
32 6
51
1 03
8
23 5
84
796
Per
sona
l and
hou
seho
ld s
ervi
ces
40 5
06
141
41 8
13
131
39 2
35
161
27 6
36
128
Rec
reat
ion
and
cultu
ral s
ervi
ces
20 6
15
519
22 2
40
545
20 6
50
551
13 2
56
374
Res
earc
h an
d sc
ient
ific
inst
itute
s11
993
28
8
12
956
36
0
12
251
41
9
9
261
34
8
Ret
ail t
rade
97 6
56
1 78
5
118
280
2 14
3
173
654
3 63
7
377
725
8 46
0
Sci
entif
ic, o
ptic
al a
nd s
imila
r equ
ipm
ent
2 92
5
99
3 00
0
111
2 89
1
119
2 37
3
100
Soc
ial a
nd re
late
d co
mm
unity
ser
vice
s48
241
85
5
15
8 51
7
2
912
75
959
1
420
37
217
75
5
Spe
cial
ised
repa
ir se
rvic
es6
576
85
11
534
19
9
12
746
26
2
9
998
21
7
Text
iles
4 84
1
122
6 56
7
151
6 73
2
158
4 59
6
116
Tran
spor
t equ
ipm
ent
3 09
4
87
4 02
0
113
4 64
0
142
4 17
5
135
Tran
spor
t, st
orag
e an
d co
mm
unic
atio
ns14
8 26
8
4
097
16
3 61
3
4
335
16
8 52
0
4
846
11
3 13
7
3
373
Veh
icle
s, p
arts
and
acc
esso
ries
44 7
18
1 21
2
52 8
28
1 48
9
54 1
35
1 71
9
37 7
85
1 29
9
Who
lesa
le tr
ade
15 9
25
426
17 6
47
481
18 0
94
547
13 4
04
449
Woo
d, w
ood
prod
ucts
and
furn
iture
6 57
4
127
7 62
8
149
7 91
0
180
5 82
5
142
Oth
er1
595
616
14 6
72
433
174
13 8
76
370
356
14 1
70
421
800
13 9
17
Tota
l3
352
190
79
350
3
542
006
82
641
3
605
378
92
045
3
215
192
86
208
1.
Inc
lude
s w
here
the
sour
ce o
f inc
ome
was
indi
cate
d as
Oth
er (a
s pe
r SA
RS
sou
rce
code
) or w
here
the
sour
ce o
f inc
ome
was
left
blan
k on
the
retu
rn.
2008 TAX STATISTICS
40

Tabl
e 2.
2.2:
Indi
vidu
al ta
xpay
ers:
Tax
ass
esse
d by
sou
rce
of in
com
e, 2
003
– 20
06 [p
erce
ntag
e of
tota
l]So
urce
of i
ncom
e20
03 [9
5.1%
ass
esse
d]20
04 [9
2.3%
ass
esse
d]20
05 [8
7.0%
ass
esse
d]20
06 [7
1.0%
ass
esse
d]N
umbe
r of
taxp
ayer
sTa
x as
sess
edN
umbe
r of
taxp
ayer
sTa
x as
sess
edN
umbe
r of
taxp
ayer
sTa
x as
sess
edN
umbe
r of
taxp
ayer
sTa
x as
sess
edA
genc
ies
and
othe
r ser
vice
s13
.8%
11.7
%11
.8%
9.5%
11.1
%9.
0%11
.5%
10.8
%
Agr
icul
ture
, for
estry
and
fish
ing
1.8%
1.5%
2.2%
2.1%
2.0%
1.7%
1.6%
1.6%
Bric
ks, c
eram
ic, g
lass
, cem
ent a
nd s
imila
r pro
duct
s0.
2%0.
2%0.
2%0.
3%0.
2%0.
3%0.
2%0.
2%
Cat
erin
g an
d ac
com
mod
atio
n0.
4%0.
3%0.
5%0.
3%0.
5%0.
4%0.
4%0.
3%
Che
mic
als
and
chem
ical
, rub
ber a
nd p
last
ic p
rodu
cts
0.6%
0.8%
0.6%
0.9%
0.6%
0.9%
0.5%
0.8%
Clo
thin
g an
d fo
otw
ear
0.2%
0.2%
0.3%
0.2%
0.3%
0.2%
0.3%
0.2%
Coa
l and
pet
role
um p
rodu
cts
0.6%
1.4%
0.8%
1.6%
0.7%
1.5%
0.6%
1.3%
Con
stru
ctio
n1.
0%0.
9%1.
2%1.
2%1.
3%1.
3%1.
1%1.
2%
Edu
catio
nal s
ervi
ces
8.2%
5.9%
9.4%
6.3%
9.2%
6.0%
7.7%
5.4%
Ele
ctric
ity, g
as a
nd w
ater
1.5%
1.8%
1.5%
1.9%
1.4%
2.2%
1.1%
1.6%
Fina
ncin
g, in
sura
nce,
real
est
ate
and
busi
ness
ser
vice
s16
.3%
19.4
%21
.4%
20.2
%21
.9%
20.7
%21
.0%
19.7
%
Food
, drin
k an
d to
bacc
o1.
1%1.
5%1.
2%1.
7%1.
2%1.
7%0.
9%1.
4%
Leat
her,
leat
her g
oods
and
fur (
excl
. foo
twea
r and
clo
thin
g)0.
0%0.
0%0.
0%0.
0%0.
0%0.
0%0.
0%0.
0%
Long
term
insu
ranc
e12
.3%
9.5%
7.6%
5.8%
10.5
%7.
9%8.
6%6.
9%
Mac
hine
ry a
nd re
late
d ite
ms
0.4%
0.5%
0.5%
0.6%
0.5%
0.6%
0.4%
0.5%
Med
ical
, den
tal a
nd o
ther
hea
lth a
nd v
eter
inar
y se
rvic
es3.
5%3.
4%4.
1%4.
1%4.
4%4.
4%3.
8%3.
8%
Met
al1.
0%1.
3%1.
2%1.
6%1.
3%1.
6%1.
1%1.
4%
Min
ing
and
quar
ryin
g2.
2%4.
2%2.
4%4.
7%2.
5%4.
5%2.
0%3.
9%
Oth
er m
anuf
actu
ring
indu
strie
s3.
0%3.
6%2.
6%3.
1%2.
7%3.
1%2.
8%3.
3%
Pap
er, p
rintin
g an
d pu
blis
hing
0.8%
1.0%
0.9%
1.1%
0.9%
1.1%
0.7%
0.9%
Per
sona
l and
hou
seho
ld s
ervi
ces
1.2%
0.2%
1.2%
0.2%
1.1%
0.2%
0.9%
0.1%
Rec
reat
ion
and
cultu
ral s
ervi
ces
0.6%
0.7%
0.6%
0.7%
0.6%
0.6%
0.4%
0.4%
Res
earc
h an
d sc
ient
ific
inst
itute
s0.
4%0.
4%0.
4%0.
4%0.
3%0.
5%0.
3%0.
4%
Ret
ail t
rade
2.9%
2.3%
3.3%
2.6%
4.8%
4.0%
11.7
%9.
8%
Sci
entif
ic, o
ptic
al a
nd s
imila
r equ
ipm
ent
0.1%
0.1%
0.1%
0.1%
0.1%
0.1%
0.1%
0.1%
Soc
ial a
nd re
late
d co
mm
unity
ser
vice
s1.
4%1.
1%4.
5%3.
5%2.
1%1.
5%1.
2%0.
9%
Spe
cial
ised
repa
ir se
rvic
es0.
2%0.
1%0.
3%0.
2%0.
4%0.
3%0.
3%0.
3%
Text
iles
0.1%
0.2%
0.2%
0.2%
0.2%
0.2%
0.1%
0.1%
Tran
spor
t equ
ipm
ent
0.1%
0.1%
0.1%
0.1%
0.1%
0.2%
0.1%
0.2%
Tran
spor
t, st
orag
e an
d co
mm
unic
atio
ns4.
4%5.
2%4.
6%5.
2%4.
7%5.
3%3.
5%3.
9%
Veh
icle
s, p
arts
and
acc
esso
ries
1.3%
1.5%
1.5%
1.8%
1.5%
1.9%
1.2%
1.5%
Who
lesa
le tr
ade
0.5%
0.5%
0.5%
0.6%
0.5%
0.6%
0.4%
0.5%
Woo
d, w
ood
prod
ucts
and
furn
iture
0.2%
0.2%
0.2%
0.2%
0.2%
0.2%
0.2%
0.2%
Oth
er17
.8%
18.5
%12
.2%
16.8
%10
.3%
15.4
%13
.1%
16.1
%
Tota
l10
0.0%
100.
0%10
0.0%
100.
0%10
0.0%
100.
0%10
0.0%
100.
0%
Perc
enta
ge o
f tot
al
CHAPTER 2: PERSONAL INCOME TAX
41

Tabl
e 2.
2.3:
Indi
vidu
al ta
xpay
ers:
Tax
ass
esse
d by
eco
nom
ic a
ctiv
ity, 2
003
– 20
06Ec
onom
ic a
ctiv
ity1
2003
[95.
1% a
sses
sed]
2004
[92.
3% a
sses
sed]
2005
[87.
0% a
sses
sed]
2006
[71.
0% a
sses
sed]
Num
ber o
f ta
xpay
ers
Tax
asse
ssed
(R m
illio
n)
Num
ber o
f ta
xpay
ers
Tax
asse
ssed
(R m
illio
n)
Num
ber o
f ta
xpay
ers
Tax
asse
ssed
(R m
illio
n)
Num
ber o
f ta
xpay
ers
Tax
asse
ssed
(R m
illio
n)Pr
imar
y se
ctor
Agr
icul
ture
, for
estr
y an
d fis
hing
61 2
57
1 21
3
78
128
1
709
70 5
96
1 57
1
49
953
1
347
Min
ing
and
quar
ryin
g74
663
3
301
85 5
89
3 91
2
90
775
4
169
64 1
87
3 39
1
Se
cond
ary
sect
orM
anuf
actu
ring
279
225
8 81
3
31
2 97
9
9
748
326
198
10 7
95
261
458
9 28
6
Bric
ks, c
eram
ic, g
lass
, cem
ent a
nd s
imila
r pro
duct
s6
527
167
8
188
222
8
072
253
5
717
208
Che
mic
als
and
chem
ical
, rub
ber a
nd p
last
ic p
rodu
cts
18 6
69
667
21
221
74
3
22 2
26
847
16
665
70
0
Clo
thin
g an
d fo
otw
ear
7 18
6
16
5
8 85
6
19
2
10 2
79
221
8
105
192
Coa
l and
pet
role
um p
rodu
cts
21 6
30
1 08
6
27
336
1
323
25 4
74
1 34
1
19
679
1
138
Food
, drin
k an
d to
bacc
o36
690
1
229
42 7
31
1 39
0
42
616
1
534
30 0
57
1 19
0
Leat
her,
leat
her g
oods
and
fur (
excl
. foo
twea
r and
clo
thin
g)81
3
15
1
255
32
1
434
37
1
117
33
Mac
hine
ry a
nd re
late
d ite
ms
12 6
28
381
16
395
49
7
18 0
25
574
13
217
45
7
Met
al33
047
1
045
42 9
11
1 33
6
45
381
1
517
34 7
94
1 19
4
Pap
er, p
rintin
g an
d pu
blis
hing
25 2
77
786
30
692
91
4
32 6
51
1 03
8
23
584
79
6
Sci
entif
ic, o
ptic
al a
nd s
imila
r equ
ipm
ent
2 92
5
99
3 00
0
11
1
2 89
1
11
9
2 37
3
10
0
Text
iles
4 84
1
12
2
6 56
7
15
1
6 73
2
15
8
4 59
6
11
6
Tran
spor
t equ
ipm
ent
3 09
4
87
4 02
0
11
3
4 64
0
14
2
4 17
5
13
5
Woo
d, w
ood
prod
ucts
and
furn
iture
6 57
4
12
7
7 62
8
14
9
7 91
0
18
0
5 82
5
14
2
Oth
er m
anuf
actu
ring
indu
strie
s99
324
2
836
92 1
79
2 57
5
97
867
2
835
91 5
54
2 88
6
Elec
tric
ity, g
as a
nd w
ater
49 3
50
1 41
0
52
936
1
580
49 6
56
2 02
8
36
725
1
380
Con
stru
ctio
n31
919
68
7
41 4
78
985
45
769
1
185
34 6
09
1 04
6
Te
rtia
ry s
ecto
rW
hole
sale
and
reta
il tr
ade,
cat
erin
g an
d ac
com
mod
atio
n17
8 24
0
3
711
216
891
4 57
4
27
7 16
4
6
508
452
455
10 6
90
Cat
erin
g an
d ac
com
mod
atio
n13
365
20
1
16 6
02
263
18
535
34
3
13 5
43
264
Spe
cial
ised
repa
ir se
rvic
es6
576
85
11
534
19
9
12 7
46
262
9
998
217
Ret
ail t
rade
97 6
56
1 78
5
11
8 28
0
2 14
3
17
3 65
4
3 63
7
37
7 72
5
8 46
0
Veh
icle
s, p
arts
and
acc
esso
ries
44 7
18
1 21
2
52
828
1
489
54 1
35
1 71
9
37
785
1
299
Who
lesa
le tr
ade
15 9
25
426
17
647
48
1
18 0
94
547
13
404
44
9
Tran
spor
t, st
orag
e an
d co
mm
unic
atio
ns14
8 26
8
4
097
163
613
4 33
5
16
8 52
0
4
846
113
137
3 37
3
Fina
ncia
l int
erm
edia
tion,
insu
ranc
e, re
al-e
stat
e an
d bu
sine
ss s
ervi
ces
1 43
1 59
7
32 5
16
1 45
6 43
3
29 7
32
1 57
9 80
3
35 0
21
1 33
1 50
0
32 6
04
Age
ncie
s an
d ot
her s
ervi
ces
461
790
9
316
417
183
7
854
399
262
8
281
369
465
9
285
Fina
ncin
g, in
sura
nce,
real
est
ate
and
busi
ness
ser
vice
s54
5 02
4
15 3
97
758
392
16
699
79
0 27
1
19 0
32
674
769
16
988
Long
term
insu
ranc
e41
2 79
0
7 51
5
26
7 90
2
4 82
0
37
8 01
9
7 28
9
27
8 00
5
5 98
3
Res
earc
h an
d sc
ient
ific
inst
itute
s11
993
28
8
12 9
56
360
12
251
41
9
9 26
1
34
8
Com
mun
ity, s
ocia
l and
per
sona
l ser
vice
s50
2 05
5
8
930
700
785
12 1
89
626
541
11 7
53
449
368
9 17
3
Edu
catio
nal s
ervi
ces
274
700
4
701
331
397
5
245
330
784
5
566
247
721
4
622
Med
ical
, den
tal a
nd o
ther
hea
lth a
nd v
eter
inar
y se
rvic
es11
7 99
3
2 71
4
14
6 81
8
3 35
6
15
9 91
3
4 05
6
12
3 53
8
3 29
4
Per
sona
l and
hou
seho
ld s
ervi
ces
40 5
06
141
41
813
13
1
39 2
35
161
27
636
12
8
Rec
reat
ion
and
cultu
ral s
ervi
ces
20 6
15
519
22
240
54
5
20 6
50
551
13
256
37
4
Soc
ial a
nd re
late
d co
mm
unity
ser
vice
s48
241
85
5
158
517
2
912
75 9
59
1 42
0
37
217
75
5
Oth
er2
595
616
14 6
72
433
174
13 8
76
370
356
14 1
70
421
800
13 9
17
Tota
l3
352
190
79
350
3
542
006
82
641
3
605
378
92
045
3
215
192
86
208
1.
SA
RS
' sou
rce
of in
com
e co
de is
use
d to
cla
ssify
acc
ordi
ng to
the
Sta
ndar
d In
dust
rial C
lass
ifica
tion
(SIC
) sys
tem
. S
AR
S' s
ourc
e of
inco
me
code
is n
ot fu
lly a
ligne
d w
ith th
e S
IC s
yste
m th
at
Sta
tistic
s S
outh
Afri
ca u
ses.
2. I
nclu
des
whe
re th
e so
urce
of i
ncom
e w
as in
dica
ted
as O
ther
(as
per S
AR
S s
ourc
e co
de) o
r whe
re th
e so
urce
of i
ncom
e w
as le
ft bl
ank
on th
e re
turn
.
2008 TAX STATISTICS
42

CHAPTER 2: PERSONAL INCOME TAX
Tabl
e 2.
2.4:
Indi
vidu
al ta
xpay
ers:
Tax
ass
esse
d by
sou
rce
of in
com
e as
on
IRP5
form
s, 2
003
– 20
06So
urce
of i
ncom
e20
03 [9
5.1%
ass
esse
d]20
04 [9
2.3%
ass
esse
d]20
05 [8
7.0%
ass
esse
d]20
06 [7
1.0%
ass
esse
d]N
umbe
r of
taxp
ayer
sTa
x as
sess
ed(R
mill
ion)
Num
ber o
f ta
xpay
ers
Tax
asse
ssed
(R m
illio
n)
Num
ber o
f ta
xpay
ers
Tax
asse
ssed
(R m
illio
n)
Num
ber o
f ta
xpay
ers
Tax
asse
ssed
(R m
illio
n)A
genc
ies
and
othe
r ser
vice
s32
8 80
4
35
775
28
9 87
6
33
573
28
3 61
4
35
325
29
0 95
5
40
270
Agr
icul
ture
, for
estry
and
fish
ing
31 2
67
2 99
8
46 1
59
5 31
0
42 6
54
5 25
2
34 6
36
4 78
7
Bric
ks, c
eram
ic, g
lass
, cem
ent a
nd s
imila
r pro
duct
s5
597
66
6
7
195
94
7
7
179
1
044
5
313
85
6
Cat
erin
g an
d ac
com
mod
atio
n7
876
75
3
11
244
1
158
12
817
1
421
9
518
1
150
Che
mic
als
and
chem
ical
, rub
ber a
nd p
last
ic p
rodu
cts
18 2
75
2 42
5
20 7
92
2 97
3
21 6
57
3 33
1
16 4
16
2 74
1
Clo
thin
g an
d fo
otw
ear
6 14
8
633
7 68
9
835
8 88
6
973
7 17
8
835
Coa
l and
pet
role
um p
rodu
cts
21 4
54
3 46
0
27 1
31
4 45
9
25 0
81
4 48
5
19 5
24
3 75
8
Con
stru
ctio
n22
185
2
410
31
432
3
888
35
195
4
645
27
518
4
129
Edu
catio
nal s
ervi
ces
270
375
25 5
32
326
780
33 7
32
322
700
35 6
76
244
778
29 7
10
Ele
ctric
ity, g
as a
nd w
ater
48 4
62
5 92
2
51 8
74
7 10
3
48 3
54
7 33
1
36 2
12
6 06
8
Fina
ncin
g, in
sura
nce,
real
est
ate
and
busi
ness
ser
vice
s46
8 92
7
54
668
63
1 86
2
68
933
65
4 93
3
77
590
57
7 92
0
73
198
Food
, drin
k an
d to
bacc
o35
326
4
488
41
166
5
565
40
747
6
012
29
107
4
691
Leat
her,
leat
her g
oods
and
fur (
excl
. foo
twea
r and
clo
thin
g)67
9
64
1
140
14
0
1
301
16
7
1
046
15
3
Long
term
insu
ranc
e40
8 08
7
38
694
26
4 23
9
27
556
37
0 46
7
41
682
27
5 97
8
34
059
Mac
hine
ry a
nd re
late
d ite
ms
11 3
54
1 43
8
15 2
12
2 09
3
16 7
47
2 44
5
12 5
40
1 98
3
Med
ical
, den
tal a
nd o
ther
hea
lth a
nd v
eter
inar
y se
rvic
es10
7 10
1
10
395
13
5 98
7
14
586
14
7 81
1
17
142
11
6 65
4
14
480
Met
al31
590
3
935
41
595
5
720
43
773
6
373
33
917
5
208
Min
ing
and
quar
ryin
g73
588
10
974
84
378
13
525
89
214
14
709
63
679
11
594
Oth
er m
anuf
actu
ring
indu
strie
s24
350
3
033
29
753
3
973
31
316
4
445
22
956
3
490
Pap
er, p
rintin
g an
d pu
blis
hing
7 19
4
502
7 93
6
590
8 07
5
666
5 95
7
554
Per
sona
l and
hou
seho
ld s
ervi
ces
17 6
60
1 95
2
19 4
67
2 32
6
17 7
83
2 29
2
11 4
64
1 57
9
Rec
reat
ion
and
cultu
ral s
ervi
ces
11 0
63
1 19
2
12 0
91
1 56
4
11 7
93
1 75
3
9 05
5
1 49
4
Res
earc
h an
d sc
ient
ific
inst
itute
s60
038
6
054
79
581
8
464
13
0 77
3
14
879
34
0 20
1
42
541
Ret
ail t
rade
2 82
0
378
2 91
3
440
2 76
2
455
2 31
4
407
Sci
entif
ic, o
ptic
al a
nd s
imila
r equ
ipm
ent
47 3
10
4 26
1
157
206
16 5
19
74 4
09
8 08
9
36 6
79
4 28
5
Soc
ial a
nd re
late
d co
mm
unity
ser
vice
s3
502
31
2
8
387
91
6
9
461
1
127
7
695
99
7
Spe
cial
ised
repa
ir se
rvic
es4
512
49
8
6
162
69
6
6
255
73
3
4
348
55
3
Text
iles
2 93
7
345
3 87
0
504
4 47
1
626
4 06
8
608
Tran
spor
t equ
ipm
ent
135
371
15 8
33
146
082
18 7
42
147
690
20 2
85
93 8
19
14 2
74
Tran
spor
t, st
orag
e an
d co
mm
unic
atio
ns42
447
4
935
50
728
6
553
51
659
7
372
36
535
5
679
Veh
icle
s, p
arts
and
acc
esso
ries
13 3
22
1 55
4
15 3
87
1 98
1
16 0
24
2 23
4
12 3
39
1 84
1
Who
lesa
le tr
ade
5 66
6
540
6 70
1
709
6 88
5
821
5 11
4
665
Woo
d, w
ood
prod
ucts
and
furn
iture
489
549
50 6
51
386
584
49 0
85
368
916
52 5
03
519
288
78 8
94
Oth
er1
428
125
21 5
41
382
401
23 3
72
341
300
24 7
38
285
495
22 8
79
Tota
l3
192
961
31
8 81
3
3
351
000
36
8 53
2
3
402
702
40
8 62
1
3
200
216
42
0 41
2
1.
Inc
lude
s w
here
the
sour
ce o
f inc
ome
was
indi
cate
d as
Oth
er o
r whe
re th
e so
urce
of i
ncom
e w
as le
ft bl
ank
on th
e re
turn
.
43
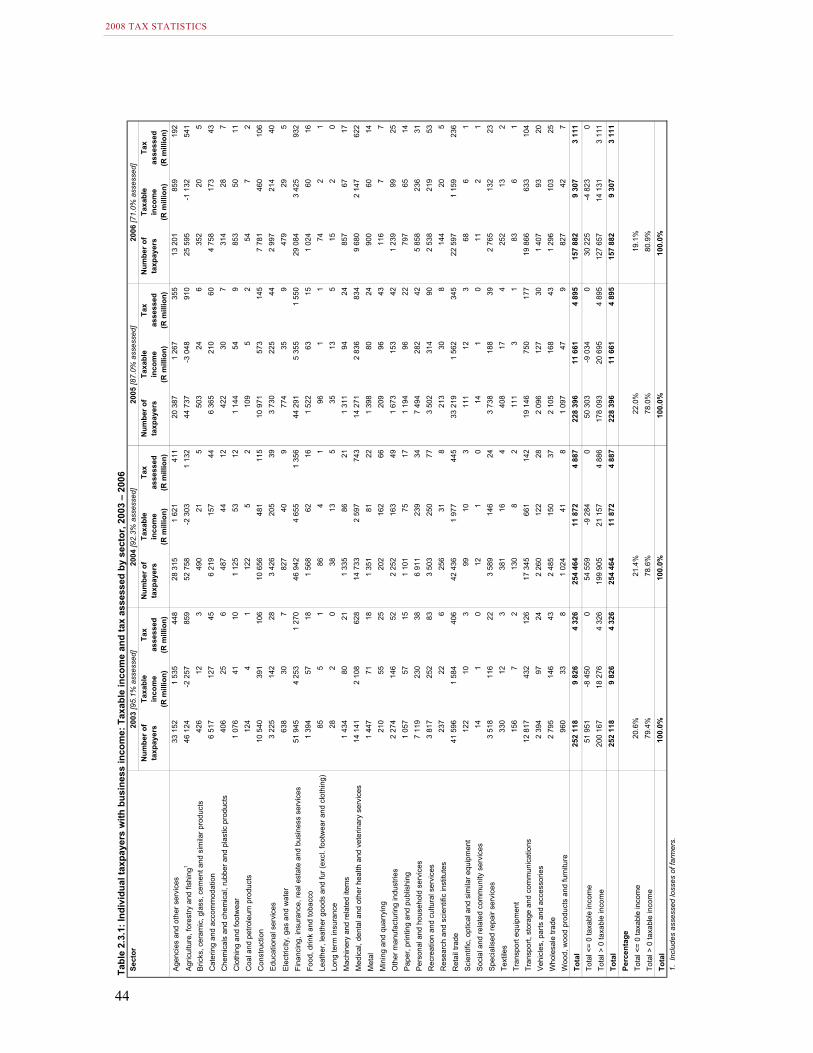
Tabl
e 2.
3.1:
Indi
vidu
al ta
xpay
ers
with
bus
ines
s in
com
e: T
axab
le in
com
e an
d ta
x as
sess
ed b
y se
ctor
, 200
3 –
2006
Sect
or20
03 [9
5.1%
ass
esse
d]20
04 [9
2.3%
ass
esse
d]20
05 [8
7.0%
ass
esse
d]20
06 [7
1.0%
ass
esse
d]N
umbe
r of
taxp
ayer
sTa
xabl
e in
com
e (R
mill
ion)
Tax
asse
ssed
(R m
illio
n)
Num
ber o
f ta
xpay
ers
Taxa
ble
inco
me
(R m
illio
n)
Tax
asse
ssed
(R m
illio
n)
Num
ber o
f ta
xpay
ers
Taxa
ble
inco
me
(R m
illio
n)
Tax
asse
ssed
(R m
illio
n)
Num
ber o
f ta
xpay
ers
Taxa
ble
inco
me
(R m
illio
n)
Tax
asse
ssed
(R m
illio
n)A
genc
ies
and
othe
r ser
vice
s33
152
1 53
5
448
28 3
15
1
621
41
1
20
387
1 26
7
355
13 2
01
85
9
19
2
Agr
icul
ture
, for
estry
and
fish
ing1
46 1
24
-2
257
859
52 7
58
-2
303
1 13
2
44 7
37
-3
048
910
25 5
95
-1
132
541
Bric
ks, c
eram
ic, g
lass
, cem
ent a
nd s
imila
r pro
duct
s42
6
12
3
49
0
21
5
50
3
24
6
35
2
20
5
Cat
erin
g an
d ac
com
mod
atio
n6
517
12
7
45
6
219
15
7
44
6
365
21
0
60
4
758
17
3
43
Che
mic
als
and
chem
ical
, rub
ber a
nd p
last
ic p
rodu
cts
406
25
6
487
44
12
422
30
7
314
28
7
Clo
thin
g an
d fo
otw
ear
1 07
6
41
10
1 12
5
53
12
1 14
4
54
9
853
50
11
Coa
l and
pet
role
um p
rodu
cts
124
4
1
122
5
2
109
5
2
54
7
2
Con
stru
ctio
n10
540
391
106
10 6
56
48
1
11
5
10
971
573
145
7 78
1
460
106
Edu
catio
nal s
ervi
ces
3 22
5
142
28
3 42
6
205
39
3 73
0
225
44
2 99
7
214
40
Ele
ctric
ity, g
as a
nd w
ater
638
30
7
827
40
9
774
35
9
479
29
5
Fina
ncin
g, in
sura
nce,
real
est
ate
and
busi
ness
ser
vice
s51
945
4 25
3
1 27
0
46 9
42
4
655
1
356
44
291
5 35
5
1 55
0
29 0
84
3
425
93
2
Food
, drin
k an
d to
bacc
o1
394
57
18
1
568
62
16
1
522
63
15
1
024
60
16
Leat
her,
leat
her g
oods
and
fur (
excl
. foo
twea
r and
clo
thin
g)85
5
1
86
4
1
96
1
1
74
2
1
Long
term
insu
ranc
e28
2
0
38
13
5
35
13
5
15
2
0
Mac
hine
ry a
nd re
late
d ite
ms
1 43
4
80
21
1 33
5
86
21
1 31
1
94
24
857
67
17
Med
ical
, den
tal a
nd o
ther
hea
lth a
nd v
eter
inar
y se
rvic
es14
141
2 10
8
628
14 7
33
2
597
74
3
14
271
2 83
6
834
9 68
0
2 14
7
622
Met
al1
447
71
18
1
351
81
22
1
398
80
24
90
0
60
14
Min
ing
and
quar
ryin
g21
0
55
25
20
2
16
2
66
20
9
96
43
11
6
7
7
Oth
er m
anuf
actu
ring
indu
strie
s2
274
14
6
52
2
252
16
3
49
1
673
15
3
42
1
239
99
25
Pap
er, p
rintin
g an
d pu
blis
hing
1 05
7
57
15
1 10
1
75
17
1 19
4
96
22
797
65
14
Per
sona
l and
hou
seho
ld s
ervi
ces
7 11
9
230
38
6 91
1
239
34
7 49
4
282
42
5 85
8
236
31
Rec
reat
ion
and
cultu
ral s
ervi
ces
3 81
7
252
83
3 50
3
250
77
3 50
2
314
90
2 53
8
219
53
Res
earc
h an
d sc
ient
ific
inst
itute
s23
7
22
6
25
6
31
8
21
3
30
8
14
4
20
5
Ret
ail t
rade
41 5
96
1
584
40
6
42
436
1 97
7
445
33 2
19
1
562
34
5
22
597
1 15
9
236
Sci
entif
ic, o
ptic
al a
nd s
imila
r equ
ipm
ent
122
10
3
99
10
3
111
12
3
68
6
1
Soc
ial a
nd re
late
d co
mm
unity
ser
vice
s14
1
0
12
1
0
14
1
0
11
2
1
Spe
cial
ised
repa
ir se
rvic
es3
518
11
6
22
3
589
14
6
24
3
738
18
8
39
2
765
13
2
23
Text
iles
330
12
3
381
16
4
408
17
4
252
13
2
Tran
spor
t equ
ipm
ent
156
7
2
130
8
2
111
3
1
83
6
1
Tran
spor
t, st
orag
e an
d co
mm
unic
atio
ns12
817
432
126
17 3
45
66
1
14
2
19
146
750
177
19 8
66
63
3
10
4
Veh
icle
s, p
arts
and
acc
esso
ries
2 39
4
97
24
2 26
0
122
28
2 09
6
127
30
1 40
7
93
20
Who
lesa
le tr
ade
2 79
5
146
43
2 48
5
150
37
2 10
5
168
43
1 29
6
103
25
Woo
d, w
ood
prod
ucts
and
furn
iture
960
33
8
1 02
4
41
8
1 09
7
47
9
827
42
7
Tota
l25
2 11
8
9
826
4
326
25
4 46
4
11
872
4 88
7
228
396
11 6
61
4
895
15
7 88
2
9
307
3
111
Tota
l <=
0 ta
xabl
e in
com
e51
951
-8 4
500
54
559
-9 2
840
50
303
-9 0
340
30
225
-4 8
230
Tota
l > 0
taxa
ble
inco
me
200
167
18 2
76
4
326
19
9 90
5
21
157
4 88
6
178
093
20 6
95
4
895
12
7 65
7
14
131
3 11
1
Tota
l25
2 11
8
9
826
4
326
25
4 46
4
11
872
4 88
7
228
396
11 6
61
4
895
15
7 88
2
9
307
3
111
Perc
enta
geTo
tal <
= 0
taxa
ble
inco
me
20.6
%21
.4%
22.0
%19
.1%
Tota
l > 0
taxa
ble
inco
me
79.4
%78
.6%
78.0
%80
.9%
Tota
l10
0.0%
100.
0%10
0.0%
100.
0%1.
Inc
lude
s as
sess
ed lo
sses
of f
arm
ers.
2008 TAX STATISTICS
44

Tabl
e 2.
3.2:
Indi
vidu
al ta
xpay
ers
with
bus
ines
s in
com
e: T
axab
le in
com
e an
d ta
x as
sess
ed b
y se
ctor
, 200
3 –
2006
[per
cent
age
of to
tal]
Sect
or20
03 [9
5.1%
ass
esse
d]20
04 [9
2.3%
ass
esse
d]20
05 [8
7.0%
ass
esse
d]20
06 [7
1.0%
ass
esse
d]N
umbe
r of
taxp
ayer
sTa
xabl
e in
com
eTa
x as
sess
edN
umbe
r of
taxp
ayer
sTa
xabl
e in
com
eTa
x as
sess
edN
umbe
r of
taxp
ayer
sTa
xabl
e in
com
eTa
x as
sess
edN
umbe
r of
taxp
ayer
sTa
xabl
e in
com
eTa
x as
sess
edA
genc
ies
and
othe
r ser
vice
s13
.1%
15.6
%10
.4%
11.1
%13
.7%
8.4%
8.9%
10.9
%7.
2%8.
4%9.
2%6.
2%
Agr
icul
ture
, for
estry
and
fish
ing
18.3
%-2
3.0%
19.9
%20
.7%
-19.
4%23
.2%
19.6
%-2
6.1%
18.6
%16
.2%
-12.
2%17
.4%
Bric
ks, c
eram
ic, g
lass
, cem
ent a
nd s
imila
r pro
duct
s0.
2%0.
1%0.
1%0.
2%0.
2%0.
1%0.
2%0.
2%0.
1%0.
2%0.
2%0.
2%
Cat
erin
g an
d ac
com
mod
atio
n2.
6%1.
3%1.
0%2.
4%1.
3%0.
9%2.
8%1.
8%1.
2%3.
0%1.
9%1.
4%
Che
mic
als
and
chem
ical
, rub
ber a
nd p
last
ic p
rodu
cts
0.2%
0.3%
0.1%
0.2%
0.4%
0.2%
0.2%
0.3%
0.1%
0.2%
0.3%
0.2%
Clo
thin
g an
d fo
otw
ear
0.4%
0.4%
0.2%
0.4%
0.4%
0.2%
0.5%
0.5%
0.2%
0.5%
0.5%
0.3%
Coa
l and
pet
role
um p
rodu
cts
0.0%
0.0%
0.0%
0.0%
0.0%
0.0%
0.0%
0.0%
0.0%
0.0%
0.1%
0.1%
Con
stru
ctio
n4.
2%4.
0%2.
4%4.
2%4.
0%2.
4%4.
8%4.
9%3.
0%4.
9%4.
9%3.
4%
Edu
catio
nal s
ervi
ces
1.3%
1.4%
0.6%
1.3%
1.7%
0.8%
1.6%
1.9%
0.9%
1.9%
2.3%
1.3%
Ele
ctric
ity, g
as a
nd w
ater
0.3%
0.3%
0.2%
0.3%
0.3%
0.2%
0.3%
0.3%
0.2%
0.3%
0.3%
0.2%
Fina
ncin
g, in
sura
nce,
real
est
ate
and
busi
ness
ser
vice
s20
.6%
43.3
%29
.4%
18.4
%39
.2%
27.7
%19
.4%
45.9
%31
.7%
18.4
%36
.8%
29.9
%
Food
, drin
k an
d to
bacc
o0.
6%0.
6%0.
4%0.
6%0.
5%0.
3%0.
7%0.
5%0.
3%0.
6%0.
6%0.
5%
Leat
her,
leat
her g
oods
and
fur (
excl
. foo
twea
r and
clo
thin
g)0.
0%0.
0%0.
0%0.
0%0.
0%0.
0%0.
0%0.
0%0.
0%0.
0%0.
0%0.
0%
Long
term
insu
ranc
e0.
0%0.
0%0.
0%0.
0%0.
1%0.
1%0.
0%0.
1%0.
1%0.
0%0.
0%0.
0%
Mac
hine
ry a
nd re
late
d ite
ms
0.6%
0.8%
0.5%
0.5%
0.7%
0.4%
0.6%
0.8%
0.5%
0.5%
0.7%
0.5%
Med
ical
, den
tal a
nd o
ther
hea
lth a
nd v
eter
inar
y se
rvic
es5.
6%21
.4%
14.5
%5.
8%21
.9%
15.2
%6.
2%24
.3%
17.0
%6.
1%23
.1%
20.0
%
Met
al0.
6%0.
7%0.
4%0.
5%0.
7%0.
4%0.
6%0.
7%0.
5%0.
6%0.
6%0.
5%
Min
ing
and
quar
ryin
g0.
1%0.
6%0.
6%0.
1%1.
4%1.
4%0.
1%0.
8%0.
9%0.
1%0.
1%0.
2%
Oth
er m
anuf
actu
ring
indu
strie
s0.
9%1.
5%1.
2%0.
9%1.
4%1.
0%0.
7%1.
3%0.
9%0.
8%1.
1%0.
8%
Pap
er, p
rintin
g an
d pu
blis
hing
0.4%
0.6%
0.3%
0.4%
0.6%
0.4%
0.5%
0.8%
0.5%
0.5%
0.7%
0.5%
Per
sona
l and
hou
seho
ld s
ervi
ces
2.8%
2.3%
0.9%
2.7%
2.0%
0.7%
3.3%
2.4%
0.9%
3.7%
2.5%
1.0%
Rec
reat
ion
and
cultu
ral s
ervi
ces
1.5%
2.6%
1.9%
1.4%
2.1%
1.6%
1.5%
2.7%
1.8%
1.6%
2.4%
1.7%
Res
earc
h an
d sc
ient
ific
inst
itute
s0.
1%0.
2%0.
1%0.
1%0.
3%0.
2%0.
1%0.
3%0.
2%0.
1%0.
2%0.
2%
Ret
ail t
rade
16.5
%16
.1%
9.4%
16.7
%16
.7%
9.1%
14.5
%13
.4%
7.1%
14.3
%12
.4%
7.6%
Sci
entif
ic, o
ptic
al a
nd s
imila
r equ
ipm
ent
0.0%
0.1%
0.1%
0.0%
0.1%
0.1%
0.0%
0.1%
0.1%
0.0%
0.1%
0.0%
Soc
ial a
nd re
late
d co
mm
unity
ser
vice
s0.
0%0.
0%0.
0%0.
0%0.
0%0.
0%0.
0%0.
0%0.
0%0.
0%0.
0%0.
0%
Spe
cial
ised
repa
ir se
rvic
es1.
4%1.
2%0.
5%1.
4%1.
2%0.
5%1.
6%1.
6%0.
8%1.
8%1.
4%0.
8%
Text
iles
0.1%
0.1%
0.1%
0.1%
0.1%
0.1%
0.2%
0.1%
0.1%
0.2%
0.1%
0.1%
Tran
spor
t equ
ipm
ent
0.1%
0.1%
0.0%
0.1%
0.1%
0.0%
0.0%
0.0%
0.0%
0.1%
0.1%
0.0%
Tran
spor
t, st
orag
e an
d co
mm
unic
atio
ns5.
1%4.
4%2.
9%6.
8%5.
6%2.
9%8.
4%6.
4%3.
6%12
.6%
6.8%
3.3%
Veh
icle
s, p
arts
and
acc
esso
ries
0.9%
1.0%
0.5%
0.9%
1.0%
0.6%
0.9%
1.1%
0.6%
0.9%
1.0%
0.7%
Who
lesa
le tr
ade
1.1%
1.5%
1.0%
1.0%
1.3%
0.8%
0.9%
1.4%
0.9%
0.8%
1.1%
0.8%
Woo
d, w
ood
prod
ucts
and
furn
iture
0.4%
0.3%
0.2%
0.4%
0.3%
0.2%
0.5%
0.4%
0.2%
0.5%
0.4%
0.2%
Tota
l10
0.0%
100.
0%10
0.0%
100.
0%10
0.0%
100.
0%10
0.0%
100.
0%10
0.0%
100.
0%10
0.0%
100.
0%
Perc
enta
ge o
f tot
al
CHAPTER 2: PERSONAL INCOME TAX
45

Tabl
e 2.
4.1:
Indi
vidu
al ta
xpay
ers:
Allo
wan
ces,
200
3 –
2006
Allo
wan
ce20
03 [9
5.1%
ass
esse
d]20
04 [9
2.3%
ass
esse
d]20
05 [8
7.0%
ass
esse
d]20
06 [7
1.0%
ass
esse
d]N
umbe
r of
taxp
ayer
sA
mou
nt
(R m
illio
n)N
umbe
r of
taxp
ayer
sA
mou
nt
(R m
illio
n)N
umbe
r of
taxp
ayer
sA
mou
nt
(R m
illio
n)N
umbe
r of
taxp
ayer
sA
mou
nt
(R m
illio
n)37
01Tr
avel
ling
allo
wan
ce57
6 20
5
23
471
588
978
25 9
48
58
9 53
3
27
233
533
176
25 0
58
3702
Rei
mbu
rsiv
e tra
vel a
llow
ance
- ta
xabl
e68
851
1 00
4
95 8
37
1
378
94
108
1 42
4
100
985
1 15
6
3704
Sub
sist
ence
allo
wan
ce (L
ocal
trav
el) -
taxa
ble
43 6
14
29
2
50
938
297
41 1
67
24
4
38
698
179
3706
Ent
erta
inm
ent a
llow
ance
101
341
223
16 8
91
43
6
424
21
3
919
14
3707
Sha
re o
ptio
n ex
erci
sed
21 3
99
1
498
17
979
1 72
4
20 5
72
2
387
24
987
3 87
5
3708
Pub
lic o
ffice
allo
wan
ce5
719
25
4
5
919
24
9
6
042
22
8
4
775
18
2
3710
Tool
allo
wan
ce6
391
13
5
107
8
5 05
8
9
5
133
10
3711
Com
pute
r allo
wan
ce42
800
172
27 6
34
12
0
19
787
89
13 2
10
61
3712
Tele
phon
e/C
ell p
hone
allo
wan
ce13
1 89
4
41
0
10
8 64
5
36
3
99
849
362
90 4
70
35
2
3713
Oth
er a
llow
ance
s - t
axab
le1
110
328
8
383
89
9 65
1
9
122
93
9 67
1
9
845
1
037
020
10
514
Tota
l2
108
542
35
720
1 81
7 57
9
39 2
53
1
822
211
41
842
1 85
2 37
3
41 4
02
Perc
enta
ge o
f tot
al37
01Tr
avel
ling
allo
wan
ce27
.3%
65.7
%32
.4%
66.1
%32
.4%
65.1
%28
.8%
60.5
%
3702
Rei
mbu
rsiv
e tra
vel a
llow
ance
- ta
xabl
e3.
3%2.
8%5.
3%3.
5%5.
2%3.
4%5.
5%2.
8%
3704
Sub
sist
ence
allo
wan
ce (L
ocal
trav
el) -
taxa
ble
2.1%
0.8%
2.8%
0.8%
2.3%
0.6%
2.1%
0.4%
3706
Ent
erta
inm
ent a
llow
ance
4.8%
0.6%
0.9%
0.1%
0.4%
0.1%
0.2%
0.0%
3707
Sha
re o
ptio
n ex
erci
sed
1.0%
4.2%
1.0%
4.4%
1.1%
5.7%
1.3%
9.4%
3708
Pub
lic o
ffice
allo
wan
ce0.
3%0.
7%0.
3%0.
6%0.
3%0.
5%0.
3%0.
4%
3710
Tool
allo
wan
ce0.
3%0.
0%0.
3%0.
0%0.
3%0.
0%0.
3%0.
0%
3711
Com
pute
r allo
wan
ce2.
0%0.
5%1.
5%0.
3%1.
1%0.
2%0.
7%0.
1%
3712
Tele
phon
e/C
ell p
hone
allo
wan
ce6.
3%1.
1%6.
0%0.
9%5.
5%0.
9%4.
9%0.
9%
3713
Oth
er a
llow
ance
s - t
axab
le52
.7%
23.5
%49
.5%
23.2
%51
.6%
23.5
%56
.0%
25.4
%
Tota
l10
0.0%
100.
0%10
0.0%
100.
0%10
0.0%
100.
0%10
0.0%
100.
0%
2008 TAX STATISTICS
46

Tabl
e 2.
4.2:
Indi
vidu
al ta
xpay
ers:
Allo
wan
ces
- Tra
velli
ng a
llow
ance
(cod
e 37
01) b
y ta
xabl
e in
com
e gr
oup,
200
3 –
2006
Taxa
ble
inco
me
grou
p20
03 [9
5.1%
ass
esse
d]20
04 [9
2.3%
ass
esse
d]20
05 [8
7.0%
ass
esse
d]20
06 [7
1.0%
ass
esse
d]N
umbe
r of
taxp
ayer
sA
mou
nt
(R m
illio
n)N
umbe
r of
taxp
ayer
sA
mou
nt
(R m
illio
n)N
umbe
r of
taxp
ayer
sA
mou
nt
(R m
illio
n)N
umbe
r of
taxp
ayer
sA
mou
nt
(R m
illio
n)A
:<
01
771
61
1
771
62
1
521
53
80
7
24
B:
= 0
57
1
49
1
61
2
38
1
C:
1 –
20 0
007
102
70
5
886
56
4
810
45
2
984
23
D:
20 0
01 –
30
000
10 4
69
16
0
8
111
12
4
5
387
77
2
635
33
E:
30 0
01 –
40
000
13 4
49
22
0
11
519
189
8 97
6
151
4 98
1
78
F:40
001
– 5
0 00
017
912
318
14 9
16
26
7
11
658
207
6 60
2
108
G:
50 0
01 –
60
000
21 3
77
40
9
18
205
350
15 1
09
28
5
8
731
15
7
H:
60 0
01 –
70
000
23 9
74
48
2
21
199
438
17 8
06
35
3
11
037
211
I:70
001
– 8
0 00
025
778
554
22 9
62
50
3
20
294
434
13 1
73
27
1
J:80
001
– 9
0 00
025
932
604
23 7
48
55
6
20
990
483
14 3
47
31
9
K:
90 0
00 –
100
000
25 6
32
64
1
23
692
590
21 4
02
52
9
15
061
357
L:10
0 00
1 –
110
000
25 3
99
68
6
23
693
635
21 3
61
56
2
15
878
401
M:
110
001
– 12
0 00
024
905
722
23 4
64
67
7
21
766
618
16 4
28
43
8
N:
120
001
– 13
0 00
023
751
735
22 8
53
69
7
21
316
649
16 8
43
48
1
O:
130
001
– 14
0 00
023
095
764
22 0
80
72
8
20
924
684
17 0
36
51
4
P:
140
001
– 15
0 00
022
063
780
21 6
00
76
0
20
447
702
17 1
76
54
9
Q:
150
001
– 20
0 00
091
857
3 73
0
94 1
74
3
844
92
736
3 70
8
79 9
54
2
960
R:
200
001
– 30
0 00
010
2 77
6
5
563
11
3 72
1
6
137
12
6 35
7
6
600
15
0 45
8
7
540
S:
300
001
– 40
0 00
042
165
2 89
4
53 8
41
3
759
61
483
4 26
7
61 9
83
4
042
T:40
0 00
1 –
500
000
18 5
39
1
451
24
542
1 94
8
29 5
82
2
370
30
751
2 31
0
U:
500
001
– 75
0 00
016
862
1 46
2
21 9
77
1
986
27
290
2 47
3
28 0
52
2
368
V:
750
001
– 1
000
000
5 29
4
506
7 00
2
712
8 62
7
865
8 63
7
816
W:
1 00
0 00
1 –
2 00
0 00
04
765
49
5
6
355
70
1
7
540
82
4
7
601
79
6
X:
2 00
0 00
1 –
5 00
0 00
01
116
14
0
1
463
20
1
1
835
24
7
1
727
22
4
Y:
5 00
0 00
1 +
165
21
155
27
255
44
256
38
Tota
l57
6 20
5
23
471
588
978
25 9
48
58
9 53
3
27
233
533
176
25 0
58
CHAPTER 2: PERSONAL INCOME TAX
47

Tabl
e 2.
4.3:
Indi
vidu
al ta
xpay
ers:
Allo
wan
ces
- Tra
velli
ng a
llow
ance
(cod
e 37
01) b
y ta
xabl
e in
com
e gr
oup,
200
3 –
2006
Taxa
ble
inco
me
grou
p20
03 [9
5.1%
ass
esse
d]20
04 [9
2.3%
ass
esse
d]20
05 [8
7.0%
ass
esse
d]20
06 [7
1.0%
ass
esse
d]N
umbe
r of
taxp
ayer
sPe
rcen
tage
Num
ber o
f ta
xpay
ers
Perc
enta
geN
umbe
r of
taxp
ayer
sPe
rcen
tage
Num
ber o
f ta
xpay
ers
Perc
enta
ge
A:
< 0
0.3%
0.3%
0.3%
0.2%
0.3%
0.2%
0.2%
0.1%
B:
= 0
0.0%
0.0%
0.0%
0.0%
0.0%
0.0%
0.0%
0.0%
C:
1 –
20 0
001.
2%0.
3%1.
0%0.
2%0.
8%0.
2%0.
6%0.
1%
D:
20 0
01 –
30
000
1.8%
0.7%
1.4%
0.5%
0.9%
0.3%
0.5%
0.1%
E:
30 0
01 –
40
000
2.3%
0.9%
2.0%
0.7%
1.5%
0.6%
0.9%
0.3%
F:40
001
– 5
0 00
03.
1%1.
4%2.
5%1.
0%2.
0%0.
8%1.
2%0.
4%
G:
50 0
01 –
60
000
3.7%
1.7%
3.1%
1.3%
2.6%
1.0%
1.6%
0.6%
H:
60 0
01 –
70
000
4.2%
2.1%
3.6%
1.7%
3.0%
1.3%
2.1%
0.8%
I:70
001
– 8
0 00
04.
5%2.
4%3.
9%1.
9%3.
4%1.
6%2.
5%1.
1%
J:80
001
– 9
0 00
04.
5%2.
6%4.
0%2.
1%3.
6%1.
8%2.
7%1.
3%
K:
90 0
00 –
100
000
4.4%
2.7%
4.0%
2.3%
3.6%
1.9%
2.8%
1.4%
L:10
0 00
1 –
110
000
4.4%
2.9%
4.0%
2.4%
3.6%
2.1%
3.0%
1.6%
M:
110
001
– 12
0 00
04.
3%3.
1%4.
0%2.
6%3.
7%2.
3%3.
1%1.
7%
N:
120
001
– 13
0 00
04.
1%3.
1%3.
9%2.
7%3.
6%2.
4%3.
2%1.
9%
O:
130
001
– 14
0 00
04.
0%3.
3%3.
7%2.
8%3.
5%2.
5%3.
2%2.
1%
P:
140
001
– 15
0 00
03.
8%3.
3%3.
7%2.
9%3.
5%2.
6%3.
2%2.
2%
Q:
150
001
– 20
0 00
015
.9%
15.9
%16
.0%
14.8
%15
.7%
13.6
%15
.0%
11.8
%
R:
200
001
– 30
0 00
017
.8%
23.7
%19
.3%
23.7
%21
.4%
24.2
%28
.2%
30.1
%
S:
300
001
– 40
0 00
07.
3%12
.3%
9.1%
14.5
%10
.4%
15.7
%11
.6%
16.1
%
T:40
0 00
1 –
500
000
3.2%
6.2%
4.2%
7.5%
5.0%
8.7%
5.8%
9.2%
U:
500
001
– 75
0 00
02.
9%6.
2%3.
7%7.
7%4.
6%9.
1%5.
3%9.
5%
V:
750
001
– 1
000
000
0.9%
2.2%
1.2%
2.7%
1.5%
3.2%
1.6%
3.3%
W:
1 00
0 00
1 –
2 00
0 00
00.
8%2.
1%1.
1%2.
7%1.
3%3.
0%1.
4%3.
2%
X:
2 00
0 00
1 –
5 00
0 00
00.
2%0.
6%0.
2%0.
8%0.
3%0.
9%0.
3%0.
9%
Y:
5 00
0 00
1 +
0.0%
0.1%
0.0%
0.1%
0.0%
0.2%
0.0%
0.2%
Tota
l10
0.0%
100.
0%10
0.0%
100.
0%10
0.0%
100.
0%10
0.0%
100.
0%
Perc
enta
ge o
f tot
al
2008 TAX STATISTICS
48

Tabl
e 2.
4.4:
Indi
vidu
al ta
xpay
ers:
Allo
wan
ces
- Sha
re o
ptio
n ex
erci
sed
(cod
e 37
07) b
y ta
xabl
e in
com
e gr
oup,
200
3 –
2006
Taxa
ble
inco
me
grou
p20
03 [9
5.1%
ass
esse
d]20
04 [9
2.3%
ass
esse
d]20
05 [8
7.0%
ass
esse
d]20
06 [7
1.0%
ass
esse
d]N
umbe
r of
taxp
ayer
sA
mou
nt
(R m
illio
n)N
umbe
r of
taxp
ayer
sA
mou
nt
(R m
illio
n)N
umbe
r of
taxp
ayer
sA
mou
nt
(R m
illio
n)N
umbe
r of
taxp
ayer
sA
mou
nt
(R m
illio
n)A
:<
031
3
24
1
25
8
18
2
B:
= 0
1
0
3
2
3
0
2
3
C:
1 –
20 0
0022
2
1
107
1
49
1
50
0
D:
20 0
01 –
30
000
205
0
95
0
56
0
42
0
E:
30 0
01 –
40
000
397
1
30
1
1
177
1
13
4
1
F:40
001
– 5
0 00
067
5
2
420
1
36
2
1
320
1
G:
50 0
01 –
60
000
694
1
48
8
1
508
2
59
0
2
H:
60 0
01 –
70
000
748
2
61
3
2
641
2
77
8
2
I:70
001
– 8
0 00
070
6
2
603
2
62
1
2
992
3
J:80
001
– 9
0 00
068
5
3
618
2
61
6
3
1 07
6
4
K:
90 0
00 –
100
000
816
3
53
1
3
651
4
96
0
4
L:10
0 00
1 –
110
000
848
4
52
0
3
607
5
81
5
5
M:
110
001
– 12
0 00
099
9
6
416
3
59
0
5
712
5
N:
120
001
– 13
0 00
077
8
5
461
4
53
7
4
657
6
O:
130
001
– 14
0 00
070
0
4
403
3
44
7
5
561
5
P:
140
001
– 15
0 00
061
7
4
373
4
42
7
6
563
6
Q:
150
001
– 20
0 00
02
117
20
1
624
22
1
783
26
2
257
31
R:
200
001
– 30
0 00
02
822
41
2
342
50
2
718
11
1
4
092
72
9
S:
300
001
– 40
0 00
01
942
47
1
816
60
1
869
68
1
697
71
T:40
0 00
1 –
500
000
1 18
1
52
1 26
6
64
1 55
0
82
1 46
9
87
U:
500
001
– 75
0 00
01
683
14
0
2
050
18
7
2
473
22
2
2
660
25
4
V:
750
001
– 1
000
000
931
138
974
162
1 27
2
195
1 42
1
255
W:
1 00
0 00
1 –
2 00
0 00
01
123
36
6
1
334
42
3
1
674
51
5
2
127
78
6
X:
2 00
0 00
1 –
5 00
0 00
039
1
35
8
47
9
43
2
72
9
59
1
80
7
82
0
Y:
5 00
0 00
1 +
87
297
118
292
187
528
187
794
Tota
l21
399
1 49
8
17 9
79
1
724
20
572
2 38
7
24 9
87
3
875
CHAPTER 2: PERSONAL INCOME TAX
49
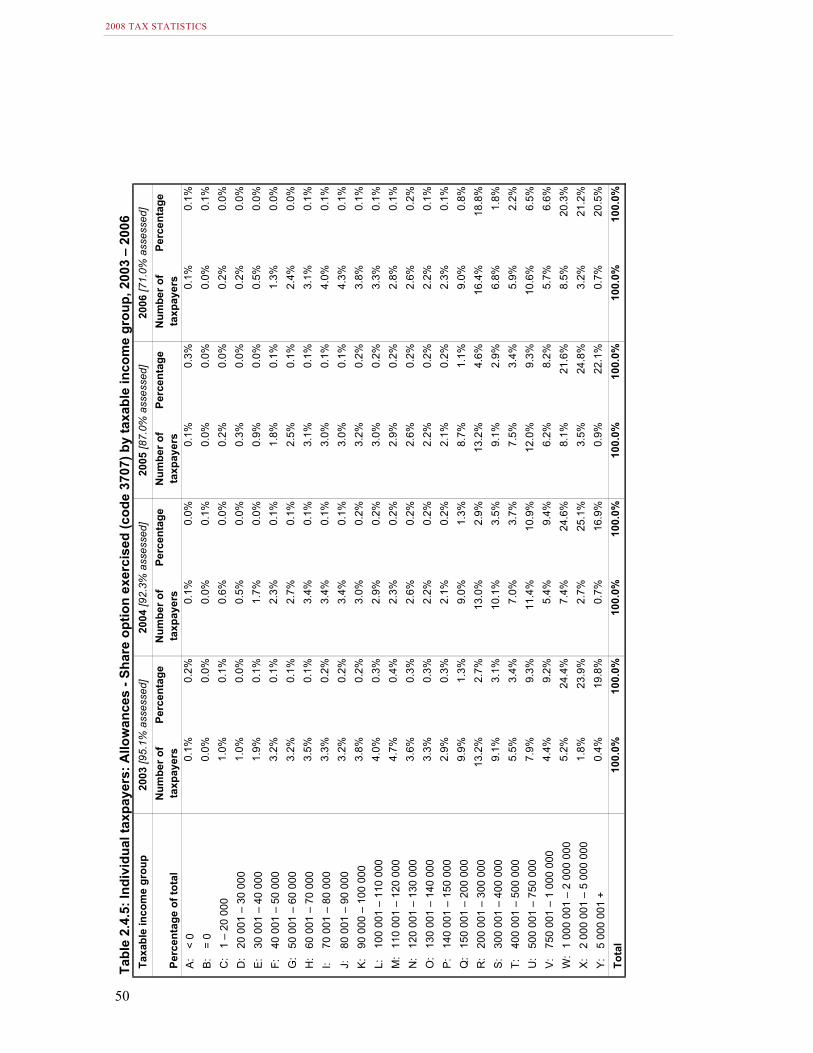
Tabl
e 2.
4.5:
Indi
vidu
al ta
xpay
ers:
Allo
wan
ces
- Sha
re o
ptio
n ex
erci
sed
(cod
e 37
07) b
y ta
xabl
e in
com
e gr
oup,
200
3 –
2006
Taxa
ble
inco
me
grou
p20
03 [9
5.1%
ass
esse
d]20
04 [9
2.3%
ass
esse
d]20
05 [8
7.0%
ass
esse
d]20
06 [7
1.0%
ass
esse
d]N
umbe
r of
taxp
ayer
sPe
rcen
tage
Num
ber o
f ta
xpay
ers
Perc
enta
geN
umbe
r of
taxp
ayer
sPe
rcen
tage
Num
ber o
f ta
xpay
ers
Perc
enta
ge
A:
< 0
0.1%
0.2%
0.1%
0.0%
0.1%
0.3%
0.1%
0.1%
B:
= 0
0.0%
0.0%
0.0%
0.1%
0.0%
0.0%
0.0%
0.1%
C:
1 –
20 0
001.
0%0.
1%0.
6%0.
0%0.
2%0.
0%0.
2%0.
0%
D:
20 0
01 –
30
000
1.0%
0.0%
0.5%
0.0%
0.3%
0.0%
0.2%
0.0%
E:
30 0
01 –
40
000
1.9%
0.1%
1.7%
0.0%
0.9%
0.0%
0.5%
0.0%
F:40
001
– 5
0 00
03.
2%0.
1%2.
3%0.
1%1.
8%0.
1%1.
3%0.
0%
G:
50 0
01 –
60
000
3.2%
0.1%
2.7%
0.1%
2.5%
0.1%
2.4%
0.0%
H:
60 0
01 –
70
000
3.5%
0.1%
3.4%
0.1%
3.1%
0.1%
3.1%
0.1%
I:70
001
– 8
0 00
03.
3%0.
2%3.
4%0.
1%3.
0%0.
1%4.
0%0.
1%
J:80
001
– 9
0 00
03.
2%0.
2%3.
4%0.
1%3.
0%0.
1%4.
3%0.
1%
K:
90 0
00 –
100
000
3.8%
0.2%
3.0%
0.2%
3.2%
0.2%
3.8%
0.1%
L:10
0 00
1 –
110
000
4.0%
0.3%
2.9%
0.2%
3.0%
0.2%
3.3%
0.1%
M:
110
001
– 12
0 00
04.
7%0.
4%2.
3%0.
2%2.
9%0.
2%2.
8%0.
1%
N:
120
001
– 13
0 00
03.
6%0.
3%2.
6%0.
2%2.
6%0.
2%2.
6%0.
2%
O:
130
001
– 14
0 00
03.
3%0.
3%2.
2%0.
2%2.
2%0.
2%2.
2%0.
1%
P:
140
001
– 15
0 00
02.
9%0.
3%2.
1%0.
2%2.
1%0.
2%2.
3%0.
1%
Q:
150
001
– 20
0 00
09.
9%1.
3%9.
0%1.
3%8.
7%1.
1%9.
0%0.
8%
R:
200
001
– 30
0 00
013
.2%
2.7%
13.0
%2.
9%13
.2%
4.6%
16.4
%18
.8%
S:
300
001
– 40
0 00
09.
1%3.
1%10
.1%
3.5%
9.1%
2.9%
6.8%
1.8%
T:40
0 00
1 –
500
000
5.5%
3.4%
7.0%
3.7%
7.5%
3.4%
5.9%
2.2%
U:
500
001
– 75
0 00
07.
9%9.
3%11
.4%
10.9
%12
.0%
9.3%
10.6
%6.
5%
V:
750
001
– 1
000
000
4.4%
9.2%
5.4%
9.4%
6.2%
8.2%
5.7%
6.6%
W:
1 00
0 00
1 –
2 00
0 00
05.
2%24
.4%
7.4%
24.6
%8.
1%21
.6%
8.5%
20.3
%
X:
2 00
0 00
1 –
5 00
0 00
01.
8%23
.9%
2.7%
25.1
%3.
5%24
.8%
3.2%
21.2
%
Y:
5 00
0 00
1 +
0.4%
19.8
%0.
7%16
.9%
0.9%
22.1
%0.
7%20
.5%
Tota
l10
0.0%
100.
0%10
0.0%
100.
0%10
0.0%
100.
0%10
0.0%
100.
0%
Perc
enta
ge o
f tot
al
2008 TAX STATISTICS
50

Tabl
e 2.
4.6:
Indi
vidu
al ta
xpay
ers:
Allo
wan
ces
- Oth
er a
llow
ance
(cod
e 37
13) b
y ta
xabl
e in
com
e gr
oup,
200
3 –
2006
Taxa
ble
inco
me
grou
p20
03 [9
5.1%
ass
esse
d]20
04 [9
2.3%
ass
esse
d]20
05 [8
7.0%
ass
esse
d]20
06 [7
1.0%
ass
esse
d]N
umbe
r of
taxp
ayer
sA
mou
nt
(R m
illio
n)N
umbe
r of
taxp
ayer
sA
mou
nt
(R m
illio
n)N
umbe
r of
taxp
ayer
sA
mou
nt
(R m
illio
n)N
umbe
r of
taxp
ayer
sA
mou
nt
(R m
illio
n)A
:<
098
8
8
832
8
75
0
7
457
5
B:
= 0
34
0
30
0
60
1
18
0
C:
1 –
20 0
008
557
19
7
701
17
6
717
15
4
919
12
D:
20 0
01 –
30
000
17 2
39
38
5
873
19
4
926
17
4
230
14
E:
30 0
01 –
40
000
38 5
57
97
17
715
55
14 2
43
43
14
866
47
F:40
001
– 5
0 00
039
325
133
26 8
05
11
0
23
819
84
30 4
64
90
G:
50 0
01 –
60
000
56 2
30
20
6
35
749
173
32 1
52
14
1
31
245
122
H:
60 0
01 –
70
000
115
948
428
57 2
77
32
3
56
110
300
49 9
83
24
1
I:70
001
– 8
0 00
012
5 68
7
53
7
76
193
501
69 0
07
40
2
68
870
372
J:80
001
– 9
0 00
012
4 51
7
69
0
78
866
582
72 9
94
50
1
78
956
461
K:
90 0
00 –
100
000
118
632
789
91 1
72
72
3
83
337
597
78 1
05
48
8
L:10
0 00
1 –
110
000
89 3
42
66
3
88
127
807
85 2
20
70
1
87
290
574
M:
110
001
– 12
0 00
070
168
558
67 3
02
63
7
78
544
687
78 9
52
62
4
N:
120
001
– 13
0 00
050
155
452
52 0
95
51
3
58
318
535
84 6
15
69
7
O:
130
001
– 14
0 00
034
642
343
42 6
37
44
8
50
829
501
60 5
45
55
5
P:
140
001
– 15
0 00
030
125
304
31 1
98
36
6
38
084
425
49 5
03
48
9
Q:
150
001
– 20
0 00
086
573
1 06
2
97 3
39
1
318
11
1 67
7
1
494
12
8 78
6
1
616
R:
200
001
– 30
0 00
066
356
967
76 4
78
1
263
96
599
1 64
4
122
094
2 18
0
S:
300
001
– 40
0 00
018
972
388
24 3
24
51
1
29
078
678
32 6
26
82
2
T:40
0 00
1 –
500
000
7 29
6
177
9 09
8
221
11 7
11
36
6
13
647
420
U:
500
001
– 75
0 00
06
334
19
5
7
465
21
3
9
156
31
3
10
358
364
V:
750
001
– 1
000
000
2 08
7
111
2 36
3
82
2 86
6
123
3 00
5
110
W:
1 00
0 00
1 –
2 00
0 00
01
978
13
7
2
332
14
9
2
661
16
6
2
761
13
2
X:
2 00
0 00
1 –
5 00
0 00
050
3
65
59
6
66
69
2
87
62
6
64
Y:
5 00
0 00
1 +
83
15
84
17
121
19
99
15
Tota
l1
110
328
8
383
89
9 65
1
9
122
93
9 67
1
9
845
1
037
020
10
514
1. P
aym
ents
to re
imbu
rse
the
empl
oyee
for l
oss
on th
e sa
le o
f a p
revi
ous
resi
denc
e du
ring
trans
fer a
nd A
rchi
tect
’s fe
es fo
r the
des
ign
or a
ltera
tion
of a
new
resi
denc
e.
CHAPTER 2: PERSONAL INCOME TAX
51

Tabl
e 2.
4.7:
Indi
vidu
al ta
xpay
ers:
Allo
wan
ces
- Oth
er a
llow
ance
(cod
e 37
13) b
y ta
xabl
e in
com
e gr
oup,
200
3 –
2006
Taxa
ble
inco
me
grou
p20
03 [9
5.1%
ass
esse
d]20
04 [9
2.3%
ass
esse
d]20
05 [8
7.0%
ass
esse
d]20
06 [7
1.0%
ass
esse
d]N
umbe
r of
taxp
ayer
sPe
rcen
tage
Num
ber o
f ta
xpay
ers
Perc
enta
geN
umbe
r of
taxp
ayer
sPe
rcen
tage
Num
ber o
f ta
xpay
ers
Perc
enta
ge
A:
< 0
0.1%
0.1%
0.1%
0.1%
0.1%
0.1%
0.0%
0.0%
B:
= 0
0.0%
0.0%
0.0%
0.0%
0.0%
0.0%
0.0%
0.0%
C:
1 –
20 0
000.
8%0.
2%0.
9%0.
2%0.
7%0.
2%0.
5%0.
1%
D:
20 0
01 –
30
000
1.6%
0.5%
0.7%
0.2%
0.5%
0.2%
0.4%
0.1%
E:
30 0
01 –
40
000
3.5%
1.2%
2.0%
0.6%
1.5%
0.4%
1.4%
0.4%
F:40
001
– 5
0 00
03.
5%1.
6%3.
0%1.
2%2.
5%0.
8%2.
9%0.
9%
G:
50 0
01 –
60
000
5.1%
2.5%
4.0%
1.9%
3.4%
1.4%
3.0%
1.2%
H:
60 0
01 –
70
000
10.4
%5.
1%6.
4%3.
5%6.
0%3.
0%4.
8%2.
3%
I:70
001
– 8
0 00
011
.3%
6.4%
8.5%
5.5%
7.3%
4.1%
6.6%
3.5%
J:80
001
– 9
0 00
011
.2%
8.2%
8.8%
6.4%
7.8%
5.1%
7.6%
4.4%
K:
90 0
00 –
100
000
10.7
%9.
4%10
.1%
7.9%
8.9%
6.1%
7.5%
4.6%
L:10
0 00
1 –
110
000
8.0%
7.9%
9.8%
8.8%
9.1%
7.1%
8.4%
5.5%
M:
110
001
– 12
0 00
06.
3%6.
7%7.
5%7.
0%8.
4%7.
0%7.
6%5.
9%
N:
120
001
– 13
0 00
04.
5%5.
4%5.
8%5.
6%6.
2%5.
4%8.
2%6.
6%
O:
130
001
– 14
0 00
03.
1%4.
1%4.
7%4.
9%5.
4%5.
1%5.
8%5.
3%
P:
140
001
– 15
0 00
02.
7%3.
6%3.
5%4.
0%4.
1%4.
3%4.
8%4.
6%
Q:
150
001
– 20
0 00
07.
8%12
.7%
10.8
%14
.5%
11.9
%15
.2%
12.4
%15
.4%
R:
200
001
– 30
0 00
06.
0%11
.5%
8.5%
13.8
%10
.3%
16.7
%11
.8%
20.7
%
S:
300
001
– 40
0 00
01.
7%4.
6%2.
7%5.
6%3.
1%6.
9%3.
1%7.
8%
T:40
0 00
1 –
500
000
0.7%
2.1%
1.0%
2.4%
1.2%
3.7%
1.3%
4.0%
U:
500
001
– 75
0 00
00.
6%2.
3%0.
8%2.
3%1.
0%3.
2%1.
0%3.
5%
V:
750
001
– 1
000
000
0.2%
1.3%
0.3%
0.9%
0.3%
1.3%
0.3%
1.0%
W:
1 00
0 00
1 –
2 00
0 00
00.
2%1.
6%0.
3%1.
6%0.
3%1.
7%0.
3%1.
3%
X:
2 00
0 00
1 –
5 00
0 00
00.
0%0.
8%0.
1%0.
7%0.
1%0.
9%0.
1%0.
6%
Y:
5 00
0 00
1 +
0.0%
0.2%
0.0%
0.2%
0.0%
0.2%
0.0%
0.1%
Tota
l10
0.0%
100.
0%10
0.0%
100.
0%10
0.0%
100.
0%10
0.0%
100.
0%
Perc
enta
ge o
f tot
al
2008 TAX STATISTICS
52
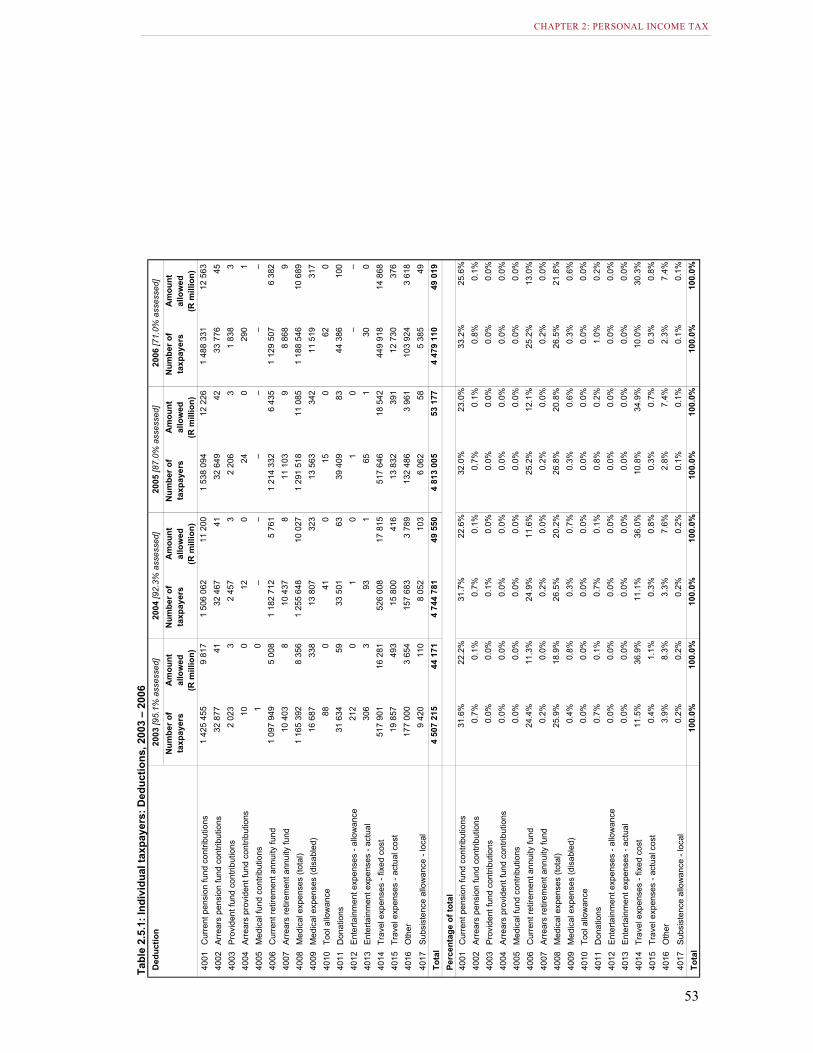
Tabl
e 2.
5.1:
Indi
vidu
al ta
xpay
ers:
Ded
uctio
ns, 2
003
– 20
06D
educ
tion
2003
[95.
1% a
sses
sed]
2004
[92.
3% a
sses
sed]
2005
[87.
0% a
sses
sed]
2006
[71.
0% a
sses
sed]
Num
ber o
f ta
xpay
ers
Am
ount
al
low
ed
(R m
illio
n)
Num
ber o
f ta
xpay
ers
Am
ount
al
low
ed
(R m
illio
n)
Num
ber o
f ta
xpay
ers
Am
ount
al
low
ed
(R m
illio
n)
Num
ber o
f ta
xpay
ers
Am
ount
al
low
ed
(R m
illio
n)40
01C
urre
nt p
ensi
on fu
nd c
ontri
butio
ns1
425
455
9
817
1
506
062
11
200
1
538
094
12
226
1
488
331
12
563
4002
Arr
ears
pen
sion
fund
con
tribu
tions
32 8
77
41
32 4
67
41
32 6
49
42
33 7
76
45
4003
Pro
vide
nt fu
nd c
ontri
butio
ns2
023
3
2
457
3
2
206
3
1
838
3
4004
Arr
ears
pro
vide
nt fu
nd c
ontri
butio
ns10
0
12
0
24
0
29
0
1
4005
Med
ical
fund
con
tribu
tions
1
0
–
–
–
–
–
–
4006
Cur
rent
retir
emen
t ann
uity
fund
1 09
7 94
9
5 00
8
1 18
2 71
2
5 76
1
1 21
4 33
2
6 43
5
1 12
9 50
7
6 38
2
4007
Arr
ears
retir
emen
t ann
uity
fund
10 4
03
8
10 4
37
8
11 1
03
9
8 86
8
9
4008
Med
ical
exp
ense
s (to
tal)
1 16
5 39
2
8 35
6
1 25
5 64
8
10 0
27
1 29
1 51
8
11 0
85
1 18
8 54
6
10 6
89
4009
Med
ical
exp
ense
s (d
isab
led)
16 6
87
338
13 8
07
323
13 5
63
342
11 5
19
317
4010
Tool
allo
wan
ce88
0
41
0
15
0
62
0
4011
Don
atio
ns31
634
59
33
501
63
39
409
83
44
386
10
0
4012
Ent
erta
inm
ent e
xpen
ses
- allo
wan
ce21
2
0
1
0
1
0
–
–
4013
Ent
erta
inm
ent e
xpen
ses
- act
ual
306
3
93
1
65
1
30
0
4014
Trav
el e
xpen
ses
- fix
ed c
ost
517
901
16 2
81
526
008
17 8
15
517
646
18 5
42
449
918
14 8
68
4015
Trav
el e
xpen
ses
- act
ual c
ost
19 8
57
493
15 8
00
416
13 8
32
391
12 7
30
376
4016
Oth
er17
7 00
0
3
654
15
7 68
3
3
789
13
2 48
6
3
961
10
3 92
4
3
618
4017
Sub
sist
ence
allo
wan
ce -
loca
l9
420
11
0
8
052
10
3
6
062
58
5
385
49
Tota
l4
507
215
44
171
4
744
781
49
550
4
813
005
53
177
4
479
110
49
019
Perc
enta
ge o
f tot
al40
01C
urre
nt p
ensi
on fu
nd c
ontri
butio
ns31
.6%
22.2
%31
.7%
22.6
%32
.0%
23.0
%33
.2%
25.6
%
4002
Arr
ears
pen
sion
fund
con
tribu
tions
0.7%
0.1%
0.7%
0.1%
0.7%
0.1%
0.8%
0.1%
4003
Pro
vide
nt fu
nd c
ontri
butio
ns0.
0%0.
0%0.
1%0.
0%0.
0%0.
0%0.
0%0.
0%
4004
Arr
ears
pro
vide
nt fu
nd c
ontri
butio
ns0.
0%0.
0%0.
0%0.
0%0.
0%0.
0%0.
0%0.
0%
4005
Med
ical
fund
con
tribu
tions
0.0%
0.0%
0.0%
0.0%
0.0%
0.0%
0.0%
0.0%
4006
Cur
rent
retir
emen
t ann
uity
fund
24.4
%11
.3%
24.9
%11
.6%
25.2
%12
.1%
25.2
%13
.0%
4007
Arr
ears
retir
emen
t ann
uity
fund
0.2%
0.0%
0.2%
0.0%
0.2%
0.0%
0.2%
0.0%
4008
Med
ical
exp
ense
s (to
tal)
25.9
%18
.9%
26.5
%20
.2%
26.8
%20
.8%
26.5
%21
.8%
4009
Med
ical
exp
ense
s (d
isab
led)
0.4%
0.8%
0.3%
0.7%
0.3%
0.6%
0.3%
0.6%
4010
Tool
allo
wan
ce0.
0%0.
0%0.
0%0.
0%0.
0%0.
0%0.
0%0.
0%
4011
Don
atio
ns0.
7%0.
1%0.
7%0.
1%0.
8%0.
2%1.
0%0.
2%
4012
Ent
erta
inm
ent e
xpen
ses
- allo
wan
ce0.
0%0.
0%0.
0%0.
0%0.
0%0.
0%0.
0%0.
0%
4013
Ent
erta
inm
ent e
xpen
ses
- act
ual
0.0%
0.0%
0.0%
0.0%
0.0%
0.0%
0.0%
0.0%
4014
Trav
el e
xpen
ses
- fix
ed c
ost
11.5
%36
.9%
11.1
%36
.0%
10.8
%34
.9%
10.0
%30
.3%
4015
Trav
el e
xpen
ses
- act
ual c
ost
0.4%
1.1%
0.3%
0.8%
0.3%
0.7%
0.3%
0.8%
4016
Oth
er3.
9%8.
3%3.
3%7.
6%2.
8%7.
4%2.
3%7.
4%
4017
Sub
sist
ence
allo
wan
ce -
loca
l0.
2%0.
2%0.
2%0.
2%0.
1%0.
1%0.
1%0.
1%
Tota
l10
0.0%
100.
0%10
0.0%
100.
0%10
0.0%
100.
0%10
0.0%
100.
0%
CHAPTER 2: PERSONAL INCOME TAX
53

Taxa
ble
inco
me
grou
p20
03 [9
5.1%
ass
esse
d]20
04 [9
2.3%
ass
esse
d]20
05 [8
7.0%
ass
esse
d]20
06 [7
1.0%
ass
esse
d]N
umbe
r of
taxp
ayer
sA
mou
nt
allo
wed
(R m
illio
n)
Num
ber o
f ta
xpay
ers
Am
ount
al
low
ed(R
mill
ion)
Num
ber o
f ta
xpay
ers
Am
ount
al
low
ed(R
mill
ion)
Num
ber o
f ta
xpay
ers
Am
ount
al
low
ed(R
mill
ion)
A:
< 0
1 21
8
8
1
282
8
1 11
6
8
71
4
5
B:
= 0
31
0
36
0
75
0
34
0
C:
1 –
20 0
008
769
10
7
695
10
6
677
9
4 75
6
6
D:
20 0
01 –
30
000
21 1
44
44
12
888
26
8 49
4
16
5 27
5
10
E:
30 0
01 –
40
000
49 0
27
12
1
46
608
120
37 7
42
10
2
22
476
61
F:40
001
– 5
0 00
051
202
156
50 2
42
15
5
45
818
144
41 8
41
13
1
G:
50 0
01 –
60
000
73 7
37
27
9
62
988
234
55 2
75
20
6
45
095
168
H:
60 0
01 –
70
000
139
509
612
130
329
586
97 3
28
42
8
70
541
304
I:70
001
– 8
0 00
015
0 20
3
75
6
13
1 78
5
65
7
13
4 13
7
67
8
10
9 82
2
55
4
J:80
001
– 9
0 00
014
7 44
0
82
0
15
7 36
6
89
6
14
1 70
1
81
8
11
0 50
7
61
5
K:
90 0
00 –
100
000
139
913
854
140
035
867
140
900
888
130
706
841
L:10
0 00
1 –
110
000
108
374
708
128
688
863
122
204
829
121
024
834
M:
110
001
– 12
0 00
087
140
609
96 5
33
69
1
11
2 38
1
81
9
10
5 26
5
78
5
N:
120
001
– 13
0 00
064
537
470
77 8
68
59
6
83
269
643
110
082
883
O:
130
001
– 14
0 00
047
873
365
60 8
72
48
4
74
039
612
79 4
34
66
6
P:
140
001
– 15
0 00
041
622
342
45 6
64
37
7
54
413
463
66 3
48
59
3
Q:
150
001
– 20
0 00
012
7 33
5
1
168
14
9 37
1
1
416
16
7 18
5
1
609
17
6 82
4
1
720
R:
200
001
– 30
0 00
010
2 60
1
1
237
12
2 28
2
1
484
15
2 15
8
1
790
17
7 18
7
2
105
S:
300
001
– 40
0 00
032
155
520
42 4
33
71
1
51
072
858
53 8
57
89
4
T:40
0 00
1 –
500
000
12 9
98
24
8
17
130
346
21 8
87
44
2
23
848
477
U:
500
001
– 75
0 00
011
287
254
14 5
26
34
5
18
427
444
19 8
35
46
9
V:
750
001
– 1
000
000
3 52
6
96
4 52
4
131
5 57
7
161
6 10
7
173
W:
1 00
0 00
1 –
2 00
0 00
03
014
97
3
908
13
7
4
840
17
2
5
437
19
1
X:
2 00
0 00
1 –
5 00
0 00
067
2
33
89
0
47
1
184
64
1
146
62
Y:
5 00
0 00
1 +
128
10
119
12
195
22
170
16
Tota
l1
425
455
9
817
1
506
062
11
200
1 53
8 09
4
12 2
26
1
488
331
12
563
Tabl
e 2.
5.2:
Indi
vidu
al ta
xpay
ers:
Ded
uctio
ns -
Cur
rent
pen
sion
fund
con
trib
utio
ns (c
ode
4001
) by
taxa
ble
inco
me
grou
p,
2003
– 2
006
2008 TAX STATISTICS
54

Taxa
ble
inco
me
grou
p20
03 [9
5.1%
ass
esse
d]20
04 [9
2.3%
ass
esse
d]20
05 [8
7.0%
ass
esse
d]20
06 [7
1.0%
ass
esse
d]N
umbe
r of
taxp
ayer
sA
llow
edN
umbe
r of
taxp
ayer
sA
llow
edN
umbe
r of
taxp
ayer
sA
llow
edN
umbe
r of
taxp
ayer
sA
llow
ed
A:
< 0
0.1%
0.1%
0.1%
0.1%
0.1%
0.1%
0.0%
0.0%
B:
= 0
0.0%
0.0%
0.0%
0.0%
0.0%
0.0%
0.0%
0.0%
C:
1 –
20 0
000.
6%0.
1%0.
5%0.
1%0.
4%0.
1%0.
3%0.
0%
D:
20 0
01 –
30
000
1.5%
0.4%
0.9%
0.2%
0.6%
0.1%
0.4%
0.1%
E:
30 0
01 –
40
000
3.4%
1.2%
3.1%
1.1%
2.5%
0.8%
1.5%
0.5%
F:40
001
– 5
0 00
03.
6%1.
6%3.
3%1.
4%3.
0%1.
2%2.
8%1.
0%
G:
50 0
01 –
60
000
5.2%
2.8%
4.2%
2.1%
3.6%
1.7%
3.0%
1.3%
H:
60 0
01 –
70
000
9.8%
6.2%
8.7%
5.2%
6.3%
3.5%
4.7%
2.4%
I:70
001
– 8
0 00
010
.5%
7.7%
8.8%
5.9%
8.7%
5.5%
7.4%
4.4%
J:80
001
– 9
0 00
010
.3%
8.3%
10.4
%8.
0%9.
2%6.
7%7.
4%4.
9%
K:
90 0
00 –
100
000
9.8%
8.7%
9.3%
7.7%
9.2%
7.3%
8.8%
6.7%
L:10
0 00
1 –
110
000
7.6%
7.2%
8.5%
7.7%
7.9%
6.8%
8.1%
6.6%
M:
110
001
– 12
0 00
06.
1%6.
2%6.
4%6.
2%7.
3%6.
7%7.
1%6.
2%
N:
120
001
– 13
0 00
04.
5%4.
8%5.
2%5.
3%5.
4%5.
3%7.
4%7.
0%
O:
130
001
– 14
0 00
03.
4%3.
7%4.
0%4.
3%4.
8%5.
0%5.
3%5.
3%
P:
140
001
– 15
0 00
02.
9%3.
5%3.
0%3.
4%3.
5%3.
8%4.
5%4.
7%
Q:
150
001
– 20
0 00
08.
9%11
.9%
9.9%
12.6
%10
.9%
13.2
%11
.9%
13.7
%
R:
200
001
– 30
0 00
07.
2%12
.6%
8.1%
13.3
%9.
9%14
.6%
11.9
%16
.8%
S:
300
001
– 40
0 00
02.
3%5.
3%2.
8%6.
3%3.
3%7.
0%3.
6%7.
1%
T:40
0 00
1 –
500
000
0.9%
2.5%
1.1%
3.1%
1.4%
3.6%
1.6%
3.8%
U:
500
001
– 75
0 00
00.
8%2.
6%1.
0%3.
1%1.
2%3.
6%1.
3%3.
7%
V:
750
001
– 1
000
000
0.2%
1.0%
0.3%
1.2%
0.4%
1.3%
0.4%
1.4%
W:
1 00
0 00
1 –
2 00
0 00
00.
2%1.
0%0.
3%1.
2%0.
3%1.
4%0.
4%1.
5%
X:
2 00
0 00
1 –
5 00
0 00
00.
0%0.
3%0.
1%0.
4%0.
1%0.
5%0.
1%0.
5%
Y:
5 00
0 00
1 +
0.0%
0.1%
0.0%
0.1%
0.0%
0.2%
0.0%
0.1%
Tota
l10
0.0%
100.
0%10
0.0%
100.
0%10
0.0%
100.
0%10
0.0%
100.
0%
Perc
enta
ge o
f tot
al
Tabl
e 2.
5.3:
Indi
vidu
al ta
xpay
ers:
Ded
uctio
ns -
Cur
rent
pen
sion
fund
con
trib
utio
ns (c
ode
4001
) by
taxa
ble
inco
me
grou
p,
2003
– 2
006
[per
cent
age
of to
tal]
CHAPTER 2: PERSONAL INCOME TAX
55

Taxa
ble
inco
me
grou
p20
03 [9
5.1%
ass
esse
d]20
04 [9
2.3%
ass
esse
d]20
05 [8
7.0%
ass
esse
d]20
06 [7
1.0%
ass
esse
d]N
umbe
r of
taxp
ayer
sA
mou
nt
allo
wed
(R m
illio
n)
Num
ber o
f ta
xpay
ers
Am
ount
al
low
ed(R
mill
ion)
Num
ber o
f ta
xpay
ers
Am
ount
al
low
ed(R
mill
ion)
Num
ber o
f ta
xpay
ers
Am
ount
al
low
ed(R
mill
ion)
A:
< 0
4 19
7
14
4 57
0
16
4 46
2
16
3 44
2
12
B:
= 0
1 74
8
3
1
617
3
1 67
6
3
1
254
2
C:
1 –
20 0
0029
704
82
26 4
69
76
22
963
68
16 8
26
51
D:
20 0
01 –
30
000
34 5
26
10
4
28
156
92
20 9
68
73
13
388
49
E:
30 0
01 –
40
000
37 9
79
12
1
37
784
120
34 7
80
11
3
23
478
81
F:40
001
– 5
0 00
040
924
140
38 1
23
13
3
34
211
121
26 6
56
91
G:
50 0
01 –
60
000
51 9
69
16
8
44
803
156
38 9
91
14
4
28
991
106
H:
60 0
01 –
70
000
76 5
57
21
1
75
866
214
57 3
28
18
2
38
342
132
I:70
001
– 8
0 00
087
955
238
77 9
72
22
8
77
960
226
59 5
19
17
5
J:80
001
– 9
0 00
091
000
252
98 6
33
26
8
92
682
261
61 5
21
18
9
K:
90 0
00 –
100
000
88 2
84
25
3
90
797
264
89 1
91
26
0
82
212
227
L:10
0 00
1 –
110
000
71 0
42
22
8
85
005
260
82 2
55
26
6
75
149
226
M:
110
001
– 12
0 00
060
098
206
66 7
31
22
9
76
684
255
69 9
82
22
7
N:
120
001
– 13
0 00
046
236
178
57 3
62
21
1
59
710
225
70 9
93
23
5
O:
130
001
– 14
0 00
037
000
159
46 1
48
18
9
55
297
215
54 3
90
20
5
P:
140
001
– 15
0 00
033
293
146
36 2
95
16
5
42
251
190
47 5
91
18
8
Q:
150
001
– 20
0 00
011
2 46
3
59
1
13
0 94
6
69
4
14
2 08
3
76
2
13
8 92
9
71
4
R:
200
001
– 30
0 00
010
5 72
6
74
1
12
4 25
3
89
1
14
7 08
2
1
084
18
2 57
1
1
563
S:
300
001
– 40
0 00
040
691
394
51 4
72
50
6
60
557
609
60 1
68
59
3
T:40
0 00
1 –
500
000
18 0
41
21
5
23
339
291
28 5
56
36
6
29
340
364
U:
500
001
– 75
0 00
016
806
252
21 5
20
34
2
26
429
441
26 8
19
43
9
V:
750
001
– 1
000
000
5 52
8
103
6 93
1
140
8 43
7
183
8 57
6
184
W:
1 00
0 00
1 –
2 00
0 00
04
896
12
9
6
283
17
9
7
634
23
9
7
429
20
5
X:
2 00
0 00
1 –
5 00
0 00
01
114
58
1
476
74
1
879
10
0
1
720
91
Y:
5 00
0 00
1 +
172
22
161
20
266
32
221
34
Tota
l1
097
949
5
008
1
182
712
5
761
1
214
332
6
435
1
129
507
6
382
Tabl
e 2.
5.4:
Indi
vidu
al ta
xpay
ers:
Ded
uctio
ns -
Cur
rent
retir
emen
t ann
uity
fund
con
trib
utio
ns (c
ode
4006
) by
taxa
ble
inco
me
grou
p, 2
003
– 20
06
2008 TAX STATISTICS
56

Taxa
ble
inco
me
grou
p20
03 [9
5.1%
ass
esse
d]20
04 [9
2.3%
ass
esse
d]20
05 [8
7.0%
ass
esse
d]20
06 [7
1.0%
ass
esse
d]N
umbe
r of
taxp
ayer
sA
llow
edN
umbe
r of
taxp
ayer
sA
llow
edN
umbe
r of
taxp
ayer
sA
llow
edN
umbe
r of
taxp
ayer
sA
llow
ed
A:
< 0
0.4%
0.3%
0.4%
0.3%
0.4%
0.3%
0.3%
0.2%
B:
= 0
0.2%
0.1%
0.1%
0.0%
0.1%
0.0%
0.1%
0.0%
C:
1 –
20 0
002.
7%1.
6%2.
2%1.
3%1.
9%1.
1%1.
5%0.
8%
D:
20 0
01 –
30
000
3.1%
2.1%
2.4%
1.6%
1.7%
1.1%
1.2%
0.8%
E:
30 0
01 –
40
000
3.5%
2.4%
3.2%
2.1%
2.9%
1.8%
2.1%
1.3%
F:40
001
– 5
0 00
03.
7%2.
8%3.
2%2.
3%2.
8%1.
9%2.
4%1.
4%
G:
50 0
01 –
60
000
4.7%
3.4%
3.8%
2.7%
3.2%
2.2%
2.6%
1.7%
H:
60 0
01 –
70
000
7.0%
4.2%
6.4%
3.7%
4.7%
2.8%
3.4%
2.1%
I:70
001
– 8
0 00
08.
0%4.
8%6.
6%4.
0%6.
4%3.
5%5.
3%2.
7%
J:80
001
– 9
0 00
08.
3%5.
0%8.
3%4.
7%7.
6%4.
1%5.
4%3.
0%
K:
90 0
00 –
100
000
8.0%
5.0%
7.7%
4.6%
7.3%
4.0%
7.3%
3.6%
L:10
0 00
1 –
110
000
6.5%
4.5%
7.2%
4.5%
6.8%
4.1%
6.7%
3.5%
M:
110
001
– 12
0 00
05.
5%4.
1%5.
6%4.
0%6.
3%4.
0%6.
2%3.
6%
N:
120
001
– 13
0 00
04.
2%3.
6%4.
9%3.
7%4.
9%3.
5%6.
3%3.
7%
O:
130
001
– 14
0 00
03.
4%3.
2%3.
9%3.
3%4.
6%3.
3%4.
8%3.
2%
P:
140
001
– 15
0 00
03.
0%2.
9%3.
1%2.
9%3.
5%3.
0%4.
2%2.
9%
Q:
150
001
– 20
0 00
010
.2%
11.8
%11
.1%
12.0
%11
.7%
11.8
%12
.3%
11.2
%
R:
200
001
– 30
0 00
09.
6%14
.8%
10.5
%15
.5%
12.1
%16
.9%
16.2
%24
.5%
S:
300
001
– 40
0 00
03.
7%7.
9%4.
4%8.
8%5.
0%9.
5%5.
3%9.
3%
T:40
0 00
1 –
500
000
1.6%
4.3%
2.0%
5.1%
2.4%
5.7%
2.6%
5.7%
U:
500
001
– 75
0 00
01.
5%5.
0%1.
8%5.
9%2.
2%6.
9%2.
4%6.
9%
V:
750
001
– 1
000
000
0.5%
2.1%
0.6%
2.4%
0.7%
2.8%
0.8%
2.9%
W:
1 00
0 00
1 –
2 00
0 00
00.
4%2.
6%0.
5%3.
1%0.
6%3.
7%0.
7%3.
2%
X:
2 00
0 00
1 –
5 00
0 00
00.
1%1.
2%0.
1%1.
3%0.
2%1.
5%0.
2%1.
4%
Y:
5 00
0 00
1 +
0.0%
0.4%
0.0%
0.4%
0.0%
0.5%
0.0%
0.5%
Tota
l10
0.0%
100.
0%10
0.0%
100.
0%10
0.0%
100.
0%10
0.0%
100.
0%
Perc
enta
ge o
f tot
al
Tabl
e 2.
5.5:
Indi
vidu
al ta
xpay
ers:
Ded
uctio
ns -
Cur
rent
retir
emen
t ann
uity
fund
con
trib
utio
ns (c
ode
4006
) by
taxa
ble
inco
me
grou
p, 2
003
– 20
06 [p
erce
ntag
e of
tota
l]
CHAPTER 2: PERSONAL INCOME TAX
57

Tabl
e 2.
5.6:
Indi
vidu
al ta
xpay
ers:
Ded
uctio
ns -
Med
ical
exp
ense
s (to
tal)
(cod
e 40
08) b
y ta
xabl
e in
com
e gr
oup,
200
3 –
2006
Taxa
ble
inco
me
grou
p20
03 [9
5.1%
ass
esse
d]20
04 [9
2.3%
ass
esse
d]20
05 [8
7.0%
ass
esse
d]20
06 [7
1.0%
ass
esse
d]N
umbe
r of
taxp
ayer
sA
mou
nt
allo
wed
(R m
illio
n)
Num
ber o
f ta
xpay
ers
Am
ount
al
low
ed(R
mill
ion)
Num
ber o
f ta
xpay
ers
Am
ount
al
low
ed(R
mill
ion)
Num
ber o
f ta
xpay
ers
Am
ount
al
low
ed(R
mill
ion)
A:
< 0
32 0
15
59
0
35
919
735
37 6
63
81
3
30
079
651
B:
= 0
79
1
72
2
204
4
56
1
C:
1 –
20 0
0043
682
469
42 3
92
52
7
40
267
537
31 3
18
42
8
D:
20 0
01 –
30
000
54 1
83
46
2
43
096
459
35 0
56
42
6
25
414
327
E:
30 0
01 –
40
000
81 6
98
56
6
77
585
605
67 6
55
60
1
47
742
465
F:40
001
– 5
0 00
085
475
610
81 1
67
65
0
73
862
645
60 9
67
52
9
G:
50 0
01 –
60
000
97 4
63
65
8
86
723
673
77 8
92
66
3
64
325
573
H:
60 0
01 –
70
000
114
474
663
116
912
754
97 8
24
74
3
72
179
606
I:70
001
– 8
0 00
011
3 33
9
64
7
10
9 39
9
72
0
10
7 58
0
74
0
90
661
659
J:80
001
– 9
0 00
010
0 17
2
56
4
11
3 58
0
68
1
11
1 93
0
74
7
85
146
628
K:
90 0
00 –
100
000
84 6
17
48
0
95
035
589
98 9
28
65
0
95
676
647
L:10
0 00
1 –
110
000
62 7
26
39
3
82
021
503
87 2
20
57
5
78
651
554
M:
110
001
– 12
0 00
050
146
320
59 8
84
42
1
71
137
481
72 8
96
51
8
N:
120
001
– 13
0 00
037
435
258
47 7
80
34
6
55
717
418
64 3
52
43
5
O:
130
001
– 14
0 00
030
838
222
37 3
25
29
2
47
297
350
48 4
52
37
3
P:
140
001
– 15
0 00
027
082
191
30 3
67
25
0
36
241
294
38 9
19
30
4
Q:
150
001
– 20
0 00
081
802
604
100
132
831
114
271
991
115
272
1 00
7
R:
200
001
– 30
0 00
050
824
425
69 9
46
63
7
95
485
934
130
307
1 52
9
S:
300
001
– 40
0 00
010
527
120
16 2
22
18
6
21
906
252
22 6
77
24
8
T:40
0 00
1 –
500
000
3 39
6
46
5 14
9
73
6 94
1
96
7 27
9
95
U:
500
001
– 75
0 00
02
363
39
3
554
60
4
697
82
4
571
75
V:
750
001
– 1
000
000
550
12
767
17
1 04
2
22
919
18
W:
1 00
0 00
1 –
2 00
0 00
038
0
10
48
7
13
55
9
16
54
8
15
X:
2 00
0 00
1 –
5 00
0 00
010
1
4
114
4
11
9
4
115
4
Y:
5 00
0 00
1 +
25
1
20
1
25
1
25
1
Tota
l1
165
392
8
356
1
255
648
10
027
1 29
1 51
8
11 0
85
1
188
546
10
689
2008 TAX STATISTICS
58

Taxa
ble
inco
me
grou
p20
03 [9
5.1%
ass
esse
d]20
04 [9
2.3%
ass
esse
d]20
05 [8
7.0%
ass
esse
d]20
06 [7
1.0%
ass
esse
d]N
umbe
r of
taxp
ayer
sA
llow
edN
umbe
r of
taxp
ayer
sA
llow
edN
umbe
r of
taxp
ayer
sA
llow
edN
umbe
r of
taxp
ayer
sA
llow
ed
A:
< 0
2.7%
7.1%
2.9%
7.3%
2.9%
7.3%
2.5%
6.1%
B:
= 0
0.0%
0.0%
0.0%
0.0%
0.0%
0.0%
0.0%
0.0%
C:
1 –
20 0
003.
7%5.
6%3.
4%5.
3%3.
1%4.
8%2.
6%4.
0%
D:
20 0
01 –
30
000
4.6%
5.5%
3.4%
4.6%
2.7%
3.8%
2.1%
3.1%
E:
30 0
01 –
40
000
7.0%
6.8%
6.2%
6.0%
5.2%
5.4%
4.0%
4.4%
F:40
001
– 5
0 00
07.
3%7.
3%6.
5%6.
5%5.
7%5.
8%5.
1%5.
0%
G:
50 0
01 –
60
000
8.4%
7.9%
6.9%
6.7%
6.0%
6.0%
5.4%
5.4%
H:
60 0
01 –
70
000
9.8%
7.9%
9.3%
7.5%
7.6%
6.7%
6.1%
5.7%
I:70
001
– 8
0 00
09.
7%7.
7%8.
7%7.
2%8.
3%6.
7%7.
6%6.
2%
J:80
001
– 9
0 00
08.
6%6.
7%9.
0%6.
8%8.
7%6.
7%7.
2%5.
9%
K:
90 0
00 –
100
000
7.3%
5.7%
7.6%
5.9%
7.7%
5.9%
8.0%
6.1%
L:10
0 00
1 –
110
000
5.4%
4.7%
6.5%
5.0%
6.8%
5.2%
6.6%
5.2%
M:
110
001
– 12
0 00
04.
3%3.
8%4.
8%4.
2%5.
5%4.
3%6.
1%4.
8%
N:
120
001
– 13
0 00
03.
2%3.
1%3.
8%3.
4%4.
3%3.
8%5.
4%4.
1%
O:
130
001
– 14
0 00
02.
6%2.
7%3.
0%2.
9%3.
7%3.
2%4.
1%3.
5%
P:
140
001
– 15
0 00
02.
3%2.
3%2.
4%2.
5%2.
8%2.
7%3.
3%2.
8%
Q:
150
001
– 20
0 00
07.
0%7.
2%8.
0%8.
3%8.
8%8.
9%9.
7%9.
4%
R:
200
001
– 30
0 00
04.
4%5.
1%5.
6%6.
4%7.
4%8.
4%11
.0%
14.3
%
S:
300
001
– 40
0 00
00.
9%1.
4%1.
3%1.
9%1.
7%2.
3%1.
9%2.
3%
T:40
0 00
1 –
500
000
0.3%
0.5%
0.4%
0.7%
0.5%
0.9%
0.6%
0.9%
U:
500
001
– 75
0 00
00.
2%0.
5%0.
3%0.
6%0.
4%0.
7%0.
4%0.
7%
V:
750
001
– 1
000
000
0.0%
0.1%
0.1%
0.2%
0.1%
0.2%
0.1%
0.2%
W:
1 00
0 00
1 –
2 00
0 00
00.
0%0.
1%0.
0%0.
1%0.
0%0.
1%0.
0%0.
1%
X:
2 00
0 00
1 –
5 00
0 00
00.
0%0.
1%0.
0%0.
0%0.
0%0.
0%0.
0%0.
0%
Y:
5 00
0 00
1 +
0.0%
0.0%
0.0%
0.0%
0.0%
0.0%
0.0%
0.0%
Tota
l10
0.0%
100.
0%10
0.0%
100.
0%10
0.0%
100.
0%10
0.0%
100.
0%
Perc
enta
ge o
f tot
al
Tabl
e 2.
5.7:
Indi
vidu
al ta
xpay
ers:
Ded
uctio
ns -
Med
ical
exp
ense
s (to
tal)
(cod
e 40
08) b
y ta
xabl
e in
com
e gr
oup,
200
3 –
2006
[p
erce
ntag
e of
tota
l]
CHAPTER 2: PERSONAL INCOME TAX
59

Taxa
ble
inco
me
grou
p20
03 [9
5.1%
ass
esse
d]20
04 [9
2.3%
ass
esse
d]20
05 [8
7.0%
ass
esse
d]20
06 [7
1.0%
ass
esse
d]N
umbe
r of
taxp
ayer
sA
mou
nt
allo
wed
(R m
illio
n)
Num
ber o
f ta
xpay
ers
Am
ount
al
low
ed(R
mill
ion)
Num
ber o
f ta
xpay
ers
Am
ount
al
low
ed(R
mill
ion)
Num
ber o
f ta
xpay
ers
Am
ount
al
low
ed(R
mill
ion)
A:
< 0
536
20
465
19
440
21
311
18
B:
= 0
2
0
–
–
1
0
–
–
C:
1 –
20 0
0071
5
15
51
3
12
42
0
11
27
3
8
D:
20 0
01 –
30
000
779
14
478
10
413
10
247
6
E:
30 0
01 –
40
000
898
16
629
13
559
12
400
10
F:40
001
– 5
0 00
01
012
18
71
1
15
61
9
13
45
5
11
G:
50 0
01 –
60
000
1 00
3
18
778
15
716
15
497
11
H:
60 0
01 –
70
000
1 10
2
19
850
17
745
16
550
13
I:70
001
– 8
0 00
01
138
18
80
7
15
75
1
15
61
2
14
J:80
001
– 9
0 00
01
076
17
83
5
15
79
5
16
59
0
13
K:
90 0
00 –
100
000
1 01
0
16
780
15
770
15
605
12
L:10
0 00
1 –
110
000
794
13
698
13
685
13
587
12
M:
110
001
– 12
0 00
067
6
12
60
3
12
55
0
11
54
5
11
N:
120
001
– 13
0 00
059
2
11
50
7
12
53
0
11
47
7
10
O:
130
001
– 14
0 00
049
3
10
44
6
9
458
10
391
9
P:
140
001
– 15
0 00
047
1
10
39
4
9
374
9
34
1
7
Q:
150
001
– 20
0 00
01
534
33
1
414
33
1
435
36
1
269
33
R:
200
001
– 30
0 00
01
500
36
1
434
37
1
587
44
1
818
60
S:
300
001
– 40
0 00
063
2
16
64
7
19
69
6
21
62
7
20
T:40
0 00
1 –
500
000
279
9
28
1
9
379
13
346
12
U:
500
001
– 75
0 00
025
5
8
295
11
331
13
323
14
V:
750
001
– 1
000
000
86
3
11
6
6
130
5
12
0
5
W:
1 00
0 00
1 –
2 00
0 00
078
4
96
5
14
0
9
112
6
X:
2 00
0 00
1 –
5 00
0 00
023
1
25
1
34
2
22
2
Y:
5 00
0 00
1 +
3
0
5
0
5
0
1
1
Tota
l16
687
338
13 8
07
32
3
13
563
342
11 5
19
31
7
Tabl
e 2.
5.8:
Indi
vidu
al ta
xpay
ers:
Ded
uctio
ns -
Med
ical
exp
ense
s (d
isab
led)
(cod
e 40
09) b
y ta
xabl
e in
com
e gr
oup,
20
03 –
200
6
2008 TAX STATISTICS
60

Taxa
ble
inco
me
grou
p20
03 [9
5.1%
ass
esse
d]20
04 [9
2.3%
ass
esse
d]20
05 [8
7.0%
ass
esse
d]20
06 [7
1.0%
ass
esse
d]N
umbe
r of
taxp
ayer
sA
llow
edN
umbe
r of
taxp
ayer
sA
llow
edN
umbe
r of
taxp
ayer
sA
llow
edN
umbe
r of
taxp
ayer
sA
llow
ed
A:
< 0
3.2%
6.0%
3.4%
5.9%
3.2%
6.2%
2.7%
5.6%
B:
= 0
0.0%
0.0%
0.0%
0.0%
0.0%
0.0%
0.0%
0.0%
C:
1 –
20 0
004.
3%4.
5%3.
7%3.
9%3.
1%3.
2%2.
4%2.
6%
D:
20 0
01 –
30
000
4.7%
4.2%
3.5%
3.2%
3.0%
3.0%
2.1%
1.9%
E:
30 0
01 –
40
000
5.4%
4.6%
4.6%
3.9%
4.1%
3.6%
3.5%
3.2%
F:40
001
– 5
0 00
06.
1%5.
4%5.
1%4.
7%4.
6%3.
9%3.
9%3.
4%
G:
50 0
01 –
60
000
6.0%
5.3%
5.6%
4.6%
5.3%
4.3%
4.3%
3.4%
H:
60 0
01 –
70
000
6.6%
5.6%
6.2%
5.3%
5.5%
4.5%
4.8%
4.0%
I:70
001
– 8
0 00
06.
8%5.
4%5.
8%4.
7%5.
5%4.
5%5.
3%4.
5%
J:80
001
– 9
0 00
06.
4%5.
1%6.
0%4.
7%5.
9%4.
5%5.
1%4.
2%
K:
90 0
00 –
100
000
6.1%
4.8%
5.6%
4.7%
5.7%
4.4%
5.3%
3.9%
L:10
0 00
1 –
110
000
4.8%
3.7%
5.1%
3.9%
5.1%
3.9%
5.1%
3.9%
M:
110
001
– 12
0 00
04.
1%3.
5%4.
4%3.
6%4.
1%3.
2%4.
7%3.
4%
N:
120
001
– 13
0 00
03.
5%3.
4%3.
7%3.
6%3.
9%3.
3%4.
1%3.
1%
O:
130
001
– 14
0 00
03.
0%2.
9%3.
2%2.
9%3.
4%2.
8%3.
4%2.
7%
P:
140
001
– 15
0 00
02.
8%2.
9%2.
9%2.
7%2.
8%2.
5%3.
0%2.
3%
Q:
150
001
– 20
0 00
09.
2%9.
6%10
.2%
10.2
%10
.6%
10.7
%11
.0%
10.4
%
R:
200
001
– 30
0 00
09.
0%10
.6%
10.4
%11
.4%
11.7
%12
.9%
15.8
%18
.8%
S:
300
001
– 40
0 00
03.
8%4.
9%4.
7%6.
0%5.
1%6.
2%5.
4%6.
4%
T:40
0 00
1 –
500
000
1.7%
2.8%
2.0%
2.8%
2.8%
3.8%
3.0%
3.8%
U:
500
001
– 75
0 00
01.
5%2.
4%2.
1%3.
4%2.
4%3.
9%2.
8%4.
3%
V:
750
001
– 1
000
000
0.5%
1.0%
0.8%
1.7%
1.0%
1.5%
1.0%
1.6%
W:
1 00
0 00
1 –
2 00
0 00
00.
5%1.
2%0.
7%1.
6%1.
0%2.
7%1.
0%1.
9%
X:
2 00
0 00
1 –
5 00
0 00
00.
1%0.
4%0.
2%0.
4%0.
3%0.
5%0.
2%0.
5%
Y:
5 00
0 00
1 +
0.0%
0.0%
0.0%
0.1%
0.0%
0.1%
0.0%
0.2%
Tota
l10
0.0%
100.
0%10
0.0%
100.
0%10
0.0%
100.
0%10
0.0%
100.
0%
Perc
enta
ge o
f tot
al
Tabl
e 2.
5.9:
Indi
vidu
al ta
xpay
ers:
Ded
uctio
ns -
Med
ical
exp
ense
s (d
isab
led)
(cod
e 40
09) b
y ta
xabl
e in
com
e gr
oup,
20
03 –
200
6 [p
erce
ntag
e of
tota
l]
CHAPTER 2: PERSONAL INCOME TAX
61

Taxa
ble
inco
me
grou
p20
03 [9
5.1%
ass
esse
d]20
04 [9
2.3%
ass
esse
d]20
05 [8
7.0%
ass
esse
d]20
06 [7
1.0%
ass
esse
d]N
umbe
r of
taxp
ayer
sA
mou
nt
allo
wed
(R m
illio
n)
Num
ber o
f ta
xpay
ers
Am
ount
al
low
ed(R
mill
ion)
Num
ber o
f ta
xpay
ers
Am
ount
al
low
ed(R
mill
ion)
Num
ber o
f ta
xpay
ers
Am
ount
al
low
ed(R
mill
ion)
A:
< 0
1 09
8
37
1 12
3
39
910
33
464
13
B:
= 0
43
1
27
1
35
1
21
1
C:
1 –
20 0
004
304
55
3
061
42
2
294
32
1
220
14
D:
20 0
01 –
30
000
8 12
9
136
5 71
3
101
3 54
9
61
1 46
4
23
E:
30 0
01 –
40
000
10 6
43
18
4
8
615
15
5
6
557
12
2
3
441
61
F:40
001
– 5
0 00
014
086
259
11 4
26
21
4
8
574
16
4
4
626
81
G:
50 0
01 –
60
000
17 2
57
33
2
14
152
277
11 1
56
22
3
6
235
11
4
H:
60 0
01 –
70
000
19 6
73
38
9
16
902
347
13 2
92
27
5
8
037
15
4
I:70
001
– 8
0 00
021
648
450
18 5
99
39
6
15
639
339
9 67
7
194
J:80
001
– 9
0 00
022
459
497
19 8
01
44
5
16
623
378
10 8
67
22
7
K:
90 0
00 –
100
000
22 9
13
53
4
20
289
475
17 6
70
42
5
11
559
257
L:10
0 00
1 –
110
000
23 2
50
56
9
20
826
517
17 9
79
45
2
12
513
287
M:
110
001
– 12
0 00
023
036
593
21 2
30
56
1
18
858
503
13 0
46
31
5
N:
120
001
– 13
0 00
021
931
583
20 9
79
57
4
18
978
529
13 6
08
34
3
O:
130
001
– 14
0 00
021
241
595
20 4
38
58
5
19
188
560
14 1
27
37
0
P:
140
001
– 15
0 00
020
653
600
19 9
47
59
5
18
569
555
14 4
32
39
7
Q:
150
001
– 20
0 00
086
473
2 74
2
88 8
69
2
891
85
850
2 82
2
68 8
38
2
041
R:
200
001
– 30
0 00
096
411
3 70
9
106
720
4 17
3
115
356
4 52
5
129
779
4 51
8
S:
300
001
– 40
0 00
039
565
1 76
3
50 4
26
2
326
57
475
2 70
1
56 2
00
2
275
T:40
0 00
1 –
500
000
17 3
29
84
2
22
886
1 14
4
27 5
75
1
402
28
061
1 20
9
U:
500
001
– 75
0 00
015
563
813
20 4
35
1
112
25
131
1 40
5
25 4
90
1
176
V:
750
001
– 1
000
000
4 82
9
269
6 45
6
382
7 86
5
470
7 78
5
378
W:
1 00
0 00
1 –
2 00
0 00
04
271
25
4
5
705
36
1
6
737
43
0
6
735
33
3
X:
2 00
0 00
1 –
5 00
0 00
096
3
65
1
270
92
1
583
11
6
1
485
77
Y:
5 00
0 00
1 +
133
9
11
3
10
20
3
17
20
8
10
Tota
l51
7 90
1
16
281
526
008
17 8
15
51
7 64
6
18
542
449
918
14 8
68
Tabl
e 2.
5.10
: Ind
ivid
ual t
axpa
yers
: Ded
uctio
ns -
Trav
el e
xpen
ses
(fixe
d co
st) (
code
401
4) b
y ta
xabl
e in
com
e gr
oup,
20
03 –
200
6
2008 TAX STATISTICS
62

Taxa
ble
inco
me
grou
p20
03 [9
5.1%
ass
esse
d]20
04 [9
2.3%
ass
esse
d]20
05 [8
7.0%
ass
esse
d]20
06 [7
1.0%
ass
esse
d]N
umbe
r of
taxp
ayer
sA
llow
edN
umbe
r of
taxp
ayer
sA
llow
edN
umbe
r of
taxp
ayer
sA
llow
edN
umbe
r of
taxp
ayer
sA
llow
ed
A:
< 0
0.2%
0.2%
0.2%
0.2%
0.2%
0.2%
0.1%
0.1%
B:
= 0
0.0%
0.0%
0.0%
0.0%
0.0%
0.0%
0.0%
0.0%
C:
1 –
20 0
000.
8%0.
3%0.
6%0.
2%0.
4%0.
2%0.
3%0.
1%
D:
20 0
01 –
30
000
1.6%
0.8%
1.1%
0.6%
0.7%
0.3%
0.3%
0.2%
E:
30 0
01 –
40
000
2.1%
1.1%
1.6%
0.9%
1.3%
0.7%
0.8%
0.4%
F:40
001
– 5
0 00
02.
7%1.
6%2.
2%1.
2%1.
7%0.
9%1.
0%0.
5%
G:
50 0
01 –
60
000
3.3%
2.0%
2.7%
1.6%
2.2%
1.2%
1.4%
0.8%
H:
60 0
01 –
70
000
3.8%
2.4%
3.2%
2.0%
2.6%
1.5%
1.8%
1.0%
I:70
001
– 8
0 00
04.
2%2.
8%3.
5%2.
2%3.
0%1.
8%2.
2%1.
3%
J:80
001
– 9
0 00
04.
3%3.
1%3.
8%2.
5%3.
2%2.
0%2.
4%1.
5%
K:
90 0
00 –
100
000
4.4%
3.3%
3.9%
2.7%
3.4%
2.3%
2.6%
1.7%
L:10
0 00
1 –
110
000
4.5%
3.5%
4.0%
2.9%
3.5%
2.4%
2.8%
1.9%
M:
110
001
– 12
0 00
04.
4%3.
6%4.
0%3.
2%3.
6%2.
7%2.
9%2.
1%
N:
120
001
– 13
0 00
04.
2%3.
6%4.
0%3.
2%3.
7%2.
9%3.
0%2.
3%
O:
130
001
– 14
0 00
04.
1%3.
7%3.
9%3.
3%3.
7%3.
0%3.
1%2.
5%
P:
140
001
– 15
0 00
04.
0%3.
7%3.
8%3.
3%3.
6%3.
0%3.
2%2.
7%
Q:
150
001
– 20
0 00
016
.7%
16.8
%16
.9%
16.2
%16
.6%
15.2
%15
.3%
13.7
%
R:
200
001
– 30
0 00
018
.6%
22.8
%20
.3%
23.4
%22
.3%
24.4
%28
.8%
30.4
%
S:
300
001
– 40
0 00
07.
6%10
.8%
9.6%
13.1
%11
.1%
14.6
%12
.5%
15.3
%
T:40
0 00
1 –
500
000
3.3%
5.2%
4.4%
6.4%
5.3%
7.6%
6.2%
8.1%
U:
500
001
– 75
0 00
03.
0%5.
0%3.
9%6.
2%4.
9%7.
6%5.
7%7.
9%
V:
750
001
– 1
000
000
0.9%
1.7%
1.2%
2.1%
1.5%
2.5%
1.7%
2.5%
W:
1 00
0 00
1 –
2 00
0 00
00.
8%1.
6%1.
1%2.
0%1.
3%2.
3%1.
5%2.
2%
X:
2 00
0 00
1 –
5 00
0 00
00.
2%0.
4%0.
2%0.
5%0.
3%0.
6%0.
3%0.
5%
Y:
5 00
0 00
1 +
0.0%
0.1%
0.0%
0.1%
0.0%
0.1%
0.0%
0.1%
Tota
l10
0.0%
100.
0%10
0.0%
100.
0%10
0.0%
100.
0%10
0.0%
100.
0%
Perc
enta
ge o
f tot
al
Tabl
e 2.
5.11
: Ind
ivid
ual t
axpa
yers
: Ded
uctio
ns -
Trav
el e
xpen
ses
(fixe
d co
st) (
code
401
4) b
y ta
xabl
e in
com
e gr
oup,
20
03 –
200
6 [p
erce
ntag
e of
tota
l]
CHAPTER 2: PERSONAL INCOME TAX
63
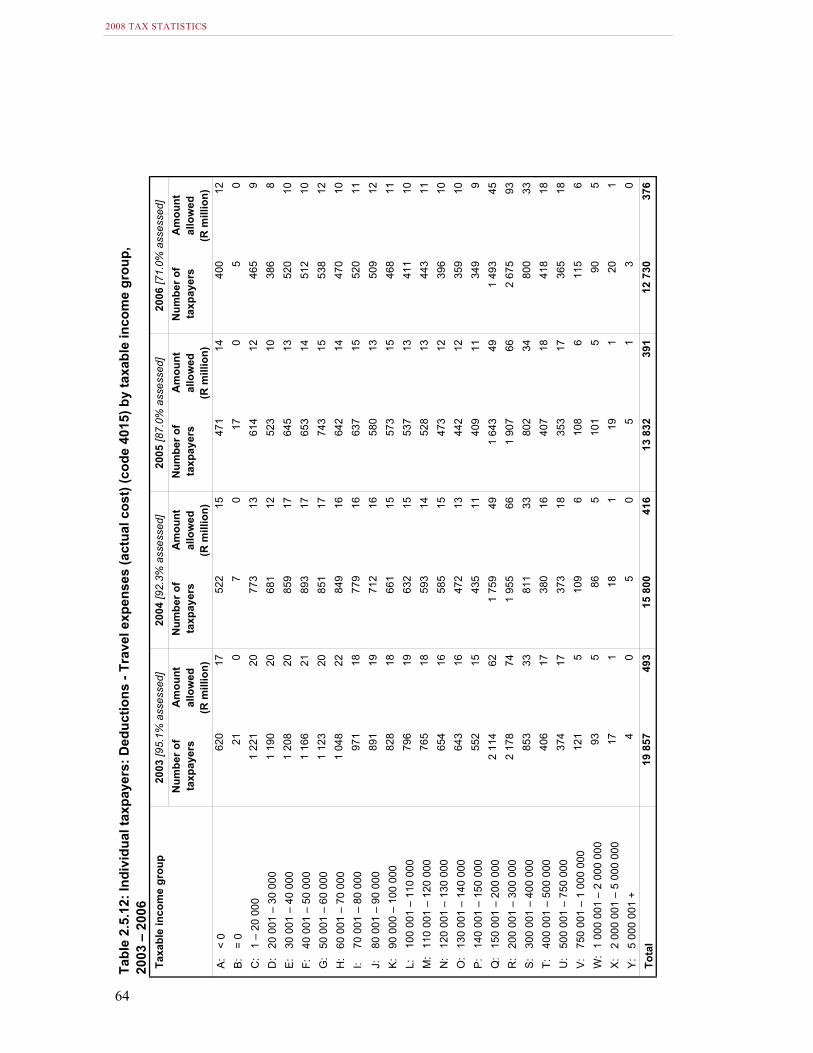
Taxa
ble
inco
me
grou
p20
03 [9
5.1%
ass
esse
d]20
04 [9
2.3%
ass
esse
d]20
05 [8
7.0%
ass
esse
d]20
06 [7
1.0%
ass
esse
d]N
umbe
r of
taxp
ayer
sA
mou
nt
allo
wed
(R m
illio
n)
Num
ber o
f ta
xpay
ers
Am
ount
al
low
ed(R
mill
ion)
Num
ber o
f ta
xpay
ers
Am
ount
al
low
ed(R
mill
ion)
Num
ber o
f ta
xpay
ers
Am
ount
al
low
ed(R
mill
ion)
A:
< 0
620
17
522
15
471
14
400
12
B:
= 0
21
0
7
0
17
0
5
0
C:
1 –
20 0
001
221
20
77
3
13
61
4
12
46
5
9
D:
20 0
01 –
30
000
1 19
0
20
681
12
523
10
386
8
E:
30 0
01 –
40
000
1 20
8
20
859
17
645
13
520
10
F:40
001
– 5
0 00
01
166
21
89
3
17
65
3
14
51
2
10
G:
50 0
01 –
60
000
1 12
3
20
851
17
743
15
538
12
H:
60 0
01 –
70
000
1 04
8
22
849
16
642
14
470
10
I:70
001
– 8
0 00
097
1
18
77
9
16
63
7
15
52
0
11
J:80
001
– 9
0 00
089
1
19
71
2
16
58
0
13
50
9
12
K:
90 0
00 –
100
000
828
18
661
15
573
15
468
11
L:10
0 00
1 –
110
000
796
19
632
15
537
13
411
10
M:
110
001
– 12
0 00
076
5
18
59
3
14
52
8
13
44
3
11
N:
120
001
– 13
0 00
065
4
16
58
5
15
47
3
12
39
6
10
O:
130
001
– 14
0 00
064
3
16
47
2
13
44
2
12
35
9
10
P:
140
001
– 15
0 00
055
2
15
43
5
11
40
9
11
34
9
9
Q:
150
001
– 20
0 00
02
114
62
1
759
49
1
643
49
1
493
45
R:
200
001
– 30
0 00
02
178
74
1
955
66
1
907
66
2
675
93
S:
300
001
– 40
0 00
085
3
33
81
1
33
80
2
34
80
0
33
T:40
0 00
1 –
500
000
406
17
380
16
407
18
418
18
U:
500
001
– 75
0 00
037
4
17
37
3
18
35
3
17
36
5
18
V:
750
001
– 1
000
000
121
5
10
9
6
108
6
11
5
6
W:
1 00
0 00
1 –
2 00
0 00
093
5
86
5
10
1
5
90
5
X:
2 00
0 00
1 –
5 00
0 00
017
1
18
1
19
1
20
1
Y:
5 00
0 00
1 +
4
0
5
0
5
1
3
0
Tota
l19
857
493
15 8
00
41
6
13
832
391
12 7
30
37
6
Tabl
e 2.
5.12
: Ind
ivid
ual t
axpa
yers
: Ded
uctio
ns -
Trav
el e
xpen
ses
(act
ual c
ost)
(cod
e 40
15) b
y ta
xabl
e in
com
e gr
oup,
20
03 –
200
6
2008 TAX STATISTICS
64

Taxa
ble
inco
me
grou
p20
03 [9
5.1%
ass
esse
d]20
04 [9
2.3%
ass
esse
d]20
05 [8
7.0%
ass
esse
d]20
06 [7
1.0%
ass
esse
d]N
umbe
r of
taxp
ayer
sA
llow
edN
umbe
r of
taxp
ayer
sA
llow
edN
umbe
r of
taxp
ayer
sA
llow
edN
umbe
r of
taxp
ayer
sA
llow
ed
A:
< 0
3.1%
3.4%
3.3%
3.7%
3.4%
3.5%
3.1%
3.3%
B:
= 0
0.1%
0.1%
0.0%
0.0%
0.1%
0.1%
0.0%
0.0%
C:
1 –
20 0
006.
1%4.
1%4.
9%3.
1%4.
4%3.
0%3.
7%2.
4%
D:
20 0
01 –
30
000
6.0%
4.0%
4.3%
3.0%
3.8%
2.5%
3.0%
2.2%
E:
30 0
01 –
40
000
6.1%
4.2%
5.4%
4.0%
4.7%
3.3%
4.1%
2.7%
F:40
001
– 5
0 00
05.
9%4.
3%5.
7%4.
0%4.
7%3.
5%4.
0%2.
8%
G:
50 0
01 –
60
000
5.7%
4.1%
5.4%
4.1%
5.4%
3.9%
4.2%
3.3%
H:
60 0
01 –
70
000
5.3%
4.4%
5.4%
3.9%
4.6%
3.6%
3.7%
2.7%
I:70
001
– 8
0 00
04.
9%3.
7%4.
9%3.
8%4.
6%3.
9%4.
1%3.
1%
J:80
001
– 9
0 00
04.
5%3.
9%4.
5%3.
8%4.
2%3.
3%4.
0%3.
1%
K:
90 0
00 –
100
000
4.2%
3.7%
4.2%
3.6%
4.1%
3.8%
3.7%
2.8%
L:10
0 00
1 –
110
000
4.0%
3.8%
4.0%
3.7%
3.9%
3.3%
3.2%
2.6%
M:
110
001
– 12
0 00
03.
9%3.
7%3.
8%3.
5%3.
8%3.
3%3.
5%2.
9%
N:
120
001
– 13
0 00
03.
3%3.
3%3.
7%3.
6%3.
4%3.
0%3.
1%2.
6%
O:
130
001
– 14
0 00
03.
2%3.
3%3.
0%3.
1%3.
2%3.
0%2.
8%2.
6%
P:
140
001
– 15
0 00
02.
8%3.
0%2.
8%2.
7%3.
0%2.
7%2.
7%2.
5%
Q:
150
001
– 20
0 00
010
.6%
12.5
%11
.1%
11.9
%11
.9%
12.6
%11
.7%
12.0
%
R:
200
001
– 30
0 00
011
.0%
14.9
%12
.4%
15.9
%13
.8%
17.0
%21
.0%
24.7
%
S:
300
001
– 40
0 00
04.
3%6.
6%5.
1%7.
8%5.
8%8.
7%6.
3%8.
9%
T:40
0 00
1 –
500
000
2.0%
3.5%
2.4%
3.8%
2.9%
4.6%
3.3%
4.9%
U:
500
001
– 75
0 00
01.
9%3.
4%2.
4%4.
4%2.
6%4.
4%2.
9%4.
7%
V:
750
001
– 1
000
000
0.6%
1.1%
0.7%
1.3%
0.8%
1.5%
0.9%
1.7%
W:
1 00
0 00
1 –
2 00
0 00
00.
5%0.
9%0.
5%1.
1%0.
7%1.
2%0.
7%1.
3%
X:
2 00
0 00
1 –
5 00
0 00
00.
1%0.
2%0.
1%0.
2%0.
1%0.
2%0.
2%0.
2%
Y:
5 00
0 00
1 +
0.0%
0.0%
0.0%
0.1%
0.0%
0.1%
0.0%
0.0%
Tota
l10
0.0%
100.
0%10
0.0%
100.
0%10
0.0%
100.
0%10
0.0%
100.
0%
Perc
enta
ge o
f tot
al
Tabl
e 2.
5.13
: Ind
ivid
ual t
axpa
yers
: Ded
uctio
ns -
Trav
el e
xpen
ses
(act
ual c
ost)
(cod
e 40
15) b
y ta
xabl
e in
com
e gr
oup,
20
03 –
200
6 [p
erce
ntag
e of
tota
l]
CHAPTER 2: PERSONAL INCOME TAX
65

Tabl
e 2.
5.14
: Ind
ivid
ual t
axpa
yers
: Ded
uctio
ns -
Oth
er (c
ode
4016
) by
taxa
ble
inco
me
grou
p, 2
003
– 20
06Ta
xabl
e in
com
e gr
oup
2003
[95.
1% a
sses
sed]
2004
[92.
3% a
sses
sed]
2005
[87.
0% a
sses
sed]
2006
[71.
0% a
sses
sed]
Num
ber o
f ta
xpay
ers
Am
ount
al
low
ed(R
mill
ion)
Num
ber o
f ta
xpay
ers
Am
ount
al
low
ed(R
mill
ion)
Num
ber o
f ta
xpay
ers
Am
ount
al
low
ed(R
mill
ion)
Num
ber o
f ta
xpay
ers
Am
ount
al
low
ed(R
mill
ion)
A:
< 0
3 44
3
135
3 27
7
110
2 56
3
109
1 69
1
88
B:
= 0
115
3
81
4
66
2
40
2
C:
1 –
20 0
006
780
89
5
183
84
4
076
81
2
539
62
D:
20 0
01 –
30
000
7 37
8
97
5 34
3
86
3 54
7
75
2 13
3
52
E:
30 0
01 –
40
000
7 74
4
106
6 35
9
115
5 05
9
102
3 18
1
72
F:40
001
– 5
0 00
08
235
10
9
6
527
11
2
5
051
10
5
3
233
79
G:
50 0
01 –
60
000
7 88
8
116
6 54
3
118
5 05
2
113
3 48
6
84
H:
60 0
01 –
70
000
7 66
8
110
6 63
9
121
5 14
9
112
3 43
8
86
I:70
001
– 8
0 00
07
782
11
3
6
691
12
2
5
263
11
7
3
636
88
J:80
001
– 9
0 00
07
775
11
6
6
530
10
9
5
038
10
9
3
511
86
K:
90 0
00 –
100
000
7 38
7
110
6 46
3
120
4 95
3
104
3 56
6
90
L:10
0 00
1 –
110
000
7 21
0
108
6 31
6
114
4 92
0
106
3 50
3
84
M:
110
001
– 12
0 00
06
884
10
3
5
822
11
0
4
776
10
8
3
468
87
N:
120
001
– 13
0 00
06
347
10
1
5
585
10
8
4
510
98
3
482
83
O:
130
001
– 14
0 00
06
059
10
1
5
308
10
4
4
367
10
6
3
292
85
P:
140
001
– 15
0 00
05
709
97
4
977
99
4
191
98
3
092
79
Q:
150
001
– 20
0 00
022
744
426
20 6
15
44
5
17
186
456
13 1
34
36
4
R:
200
001
– 30
0 00
025
050
633
23 8
13
65
7
22
361
735
25 1
54
1
006
S:
300
001
– 40
0 00
010
781
344
11 0
00
37
4
10
234
407
7 81
8
359
T:40
0 00
1 –
500
000
5 18
6
209
5 39
4
221
5 14
6
255
4 00
3
222
U:
500
001
– 75
0 00
04
912
22
1
5
106
23
7
5
043
28
5
3
926
25
5
V:
750
001
– 1
000
000
1 70
4
82
1 80
9
98
1 75
4
122
1 22
3
91
W:
1 00
0 00
1 –
2 00
0 00
01
676
83
1
783
87
1
647
12
4
1
065
92
X:
2 00
0 00
1 –
5 00
0 00
047
5
29
45
9
26
45
3
20
26
7
20
Y:
5 00
0 00
1 +
68
12
60
8
81
9
43
2
Tota
l17
7 00
0
3
654
15
7 68
3
3
789
13
2 48
6
3
961
10
3 92
4
3
618
2008 TAX STATISTICS
66
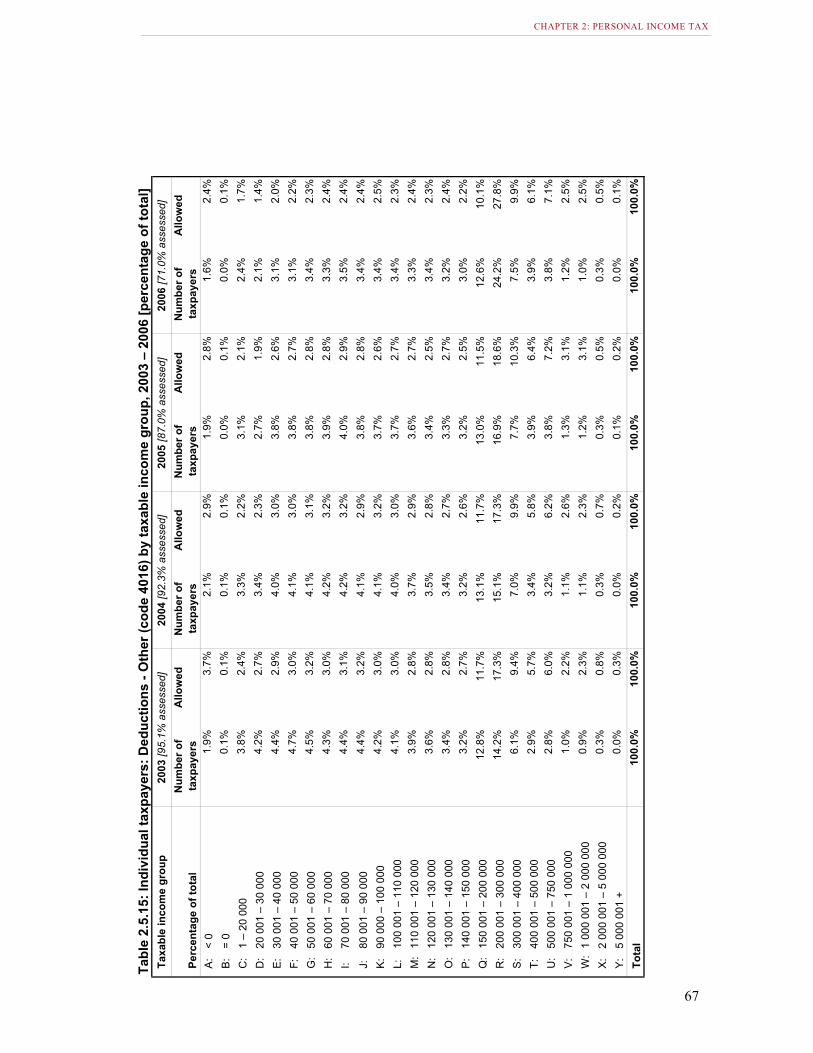
Tabl
e 2.
5.15
: Ind
ivid
ual t
axpa
yers
: Ded
uctio
ns -
Oth
er (c
ode
4016
) by
taxa
ble
inco
me
grou
p, 2
003
– 20
06 [p
erce
ntag
e of
tota
l]Ta
xabl
e in
com
e gr
oup
2003
[95.
1% a
sses
sed]
2004
[92.
3% a
sses
sed]
2005
[87.
0% a
sses
sed]
2006
[71.
0% a
sses
sed]
Num
ber o
f ta
xpay
ers
Allo
wed
Num
ber o
f ta
xpay
ers
Allo
wed
Num
ber o
f ta
xpay
ers
Allo
wed
Num
ber o
f ta
xpay
ers
Allo
wed
A:
< 0
1.9%
3.7%
2.1%
2.9%
1.9%
2.8%
1.6%
2.4%
B:
= 0
0.1%
0.1%
0.1%
0.1%
0.0%
0.1%
0.0%
0.1%
C:
1 –
20 0
003.
8%2.
4%3.
3%2.
2%3.
1%2.
1%2.
4%1.
7%
D:
20 0
01 –
30
000
4.2%
2.7%
3.4%
2.3%
2.7%
1.9%
2.1%
1.4%
E:
30 0
01 –
40
000
4.4%
2.9%
4.0%
3.0%
3.8%
2.6%
3.1%
2.0%
F:40
001
– 5
0 00
04.
7%3.
0%4.
1%3.
0%3.
8%2.
7%3.
1%2.
2%
G:
50 0
01 –
60
000
4.5%
3.2%
4.1%
3.1%
3.8%
2.8%
3.4%
2.3%
H:
60 0
01 –
70
000
4.3%
3.0%
4.2%
3.2%
3.9%
2.8%
3.3%
2.4%
I:70
001
– 8
0 00
04.
4%3.
1%4.
2%3.
2%4.
0%2.
9%3.
5%2.
4%
J:80
001
– 9
0 00
04.
4%3.
2%4.
1%2.
9%3.
8%2.
8%3.
4%2.
4%
K:
90 0
00 –
100
000
4.2%
3.0%
4.1%
3.2%
3.7%
2.6%
3.4%
2.5%
L:10
0 00
1 –
110
000
4.1%
3.0%
4.0%
3.0%
3.7%
2.7%
3.4%
2.3%
M:
110
001
– 12
0 00
03.
9%2.
8%3.
7%2.
9%3.
6%2.
7%3.
3%2.
4%
N:
120
001
– 13
0 00
03.
6%2.
8%3.
5%2.
8%3.
4%2.
5%3.
4%2.
3%
O:
130
001
– 14
0 00
03.
4%2.
8%3.
4%2.
7%3.
3%2.
7%3.
2%2.
4%
P:
140
001
– 15
0 00
03.
2%2.
7%3.
2%2.
6%3.
2%2.
5%3.
0%2.
2%
Q:
150
001
– 20
0 00
012
.8%
11.7
%13
.1%
11.7
%13
.0%
11.5
%12
.6%
10.1
%
R:
200
001
– 30
0 00
014
.2%
17.3
%15
.1%
17.3
%16
.9%
18.6
%24
.2%
27.8
%
S:
300
001
– 40
0 00
06.
1%9.
4%7.
0%9.
9%7.
7%10
.3%
7.5%
9.9%
T:40
0 00
1 –
500
000
2.9%
5.7%
3.4%
5.8%
3.9%
6.4%
3.9%
6.1%
U:
500
001
– 75
0 00
02.
8%6.
0%3.
2%6.
2%3.
8%7.
2%3.
8%7.
1%
V:
750
001
– 1
000
000
1.0%
2.2%
1.1%
2.6%
1.3%
3.1%
1.2%
2.5%
W:
1 00
0 00
1 –
2 00
0 00
00.
9%2.
3%1.
1%2.
3%1.
2%3.
1%1.
0%2.
5%
X:
2 00
0 00
1 –
5 00
0 00
00.
3%0.
8%0.
3%0.
7%0.
3%0.
5%0.
3%0.
5%
Y:
5 00
0 00
1 +
0.0%
0.3%
0.0%
0.2%
0.1%
0.2%
0.0%
0.1%
Tota
l10
0.0%
100.
0%10
0.0%
100.
0%10
0.0%
100.
0%10
0.0%
100.
0%
Perc
enta
ge o
f tot
al
CHAPTER 2: PERSONAL INCOME TAX
67

Tabl
e 2.
6.1:
Indi
vidu
al ta
xpay
ers:
Frin
ge b
enef
its, 2
003
– 20
06Fr
inge
ben
efit
2003
[95.
1% a
sses
sed]
2004
[92.
3% a
sses
sed]
2005
[87.
0% a
sses
sed]
2006
[71.
0% a
sses
sed]
Num
ber o
f ta
xpay
ers
Am
ount
(R m
illio
n)N
umbe
r of
taxp
ayer
sA
mou
nt(R
mill
ion)
Num
ber o
f ta
xpay
ers
Am
ount
(R m
illio
n)N
umbe
r of
taxp
ayer
sA
mou
nt(R
mill
ion)
3801
Acq
uisi
tion
of a
sset
s20
036
216
26 9
33
24
5
30
476
255
27 1
71
23
8
38
02R
ight
of u
se o
f mot
or v
ehic
le11
1 75
7
2
179
10
9 08
1
2
407
10
5 42
0
2
533
95
347
2 44
5
3803
Rig
ht o
f use
of a
sset
6 16
8
17
6 20
9
22
6 92
3
34
6 95
2
17
3804
Mea
ls a
nd re
fresh
men
ts v
ouch
ers
9 90
6
9
15 8
83
15
17
928
19
15 8
67
17
38
05Fr
ee o
r che
ap re
side
ntia
l / h
olid
ay a
ccom
mod
atio
n10
1 81
8
73
7
10
1 91
1
90
0
10
3 69
4
97
8
97
447
956
3806
Free
or c
heap
ser
vice
s10
8 24
4
13
8
13
5 29
8
17
3
13
1 84
1
20
8
13
1 79
5
20
2
38
07Lo
w o
r int
eres
t-fre
e lo
ans:
hou
se10
4 62
1
31
1
11
4 84
6
31
5
86
139
185
78 0
52
15
9
38
08P
aym
ent o
f em
ploy
ees
debt
57 3
99
46
7
91
449
497
123
082
592
147
170
615
3809
Bur
sarie
s an
d sc
hola
rshi
ps10
003
61
10 7
10
62
10
760
60
9 93
3
59
3810
Med
ical
aid
pai
d on
beh
alf o
f em
ploy
ee49
2 33
9
2
240
52
0 99
6
2
514
50
2 70
9
2
651
48
9 88
6
2
600
O
ther
574
50
543
40
516
31
641
28
Tota
l1
022
865
6
425
1
133
859
7
190
1
119
488
7
544
1
100
261
7
337
Perc
enta
ge o
f tot
al38
01A
cqui
sitio
n of
ass
ets
2.0%
3.4%
2.4%
3.4%
2.7%
3.4%
2.5%
3.2%
3802
Rig
ht o
f use
of m
otor
veh
icle
10.9
%33
.9%
9.6%
33.5
%9.
4%33
.6%
8.7%
33.3
%38
03R
ight
of u
se o
f ass
et0.
6%0.
3%0.
5%0.
3%0.
6%0.
4%0.
6%0.
2%38
04M
eals
and
refre
shm
ents
vou
cher
s1.
0%0.
1%1.
4%0.
2%1.
6%0.
3%1.
4%0.
2%38
05Fr
ee o
r che
ap re
side
ntia
l / h
olid
ay a
ccom
mod
atio
n10
.0%
11.5
%9.
0%12
.5%
9.3%
13.0
%8.
9%13
.0%
3806
Free
or c
heap
ser
vice
s10
.6%
2.1%
11.9
%2.
4%11
.8%
2.8%
12.0
%2.
8%38
07Lo
w o
r int
eres
t-fre
e lo
ans:
hou
se10
.2%
4.8%
10.1
%4.
4%7.
7%2.
5%7.
1%2.
2%38
08P
aym
ent o
f em
ploy
ees
debt
5.6%
7.3%
8.1%
6.9%
11.0
%7.
8%13
.4%
8.4%
3809
Bur
sarie
s an
d sc
hola
rshi
ps1.
0%0.
9%0.
9%0.
9%1.
0%0.
8%0.
9%0.
8%38
10M
edic
al a
id p
aid
on b
ehal
f of e
mpl
oyee
48.1
%34
.9%
45.9
%35
.0%
44.9
%35
.1%
44.5
%35
.4%
Oth
er0.
1%0.
8%0.
0%0.
6%0.
0%0.
4%0.
1%0.
4%
Tota
l10
0.0%
100.
0%10
0.0%
100.
0%10
0.0%
100.
0%10
0.0%
100.
0%
2008 TAX STATISTICS
68

Tabl
e 2.
6.2:
Indi
vidu
al ta
xpay
ers:
Frin
ge b
enef
its -
Use
of m
otor
veh
icle
(cod
e 38
02) b
y ta
xabl
e in
com
e gr
oup,
200
3 –
2006
Taxa
ble
inco
me
grou
p20
03 [9
5.1%
ass
esse
d]20
04 [9
2.3%
ass
esse
d]20
05 [8
7.0%
ass
esse
d]20
06 [7
1.0%
ass
esse
d]N
umbe
r of
taxp
ayer
sA
mou
nt(R
mill
ion)
Num
ber o
f ta
xpay
ers
Am
ount
(R m
illio
n)N
umbe
r of
taxp
ayer
sA
mou
nt(R
mill
ion)
Num
ber o
f ta
xpay
ers
Am
ount
(R m
illio
n)A
:<
043
4
13
38
8
12
33
3
10
14
7
4
B:
= 0
2
0
4
0
8
0
3
0
C:
1 –
20 0
0063
0
5
495
5
39
2
3
237
2
D:
20 0
01 –
30
000
955
9
74
6
8
495
6
23
6
2
E:
30 0
01 –
40
000
1 14
8
13
841
10
790
10
472
6
F:40
001
– 5
0 00
01
399
16
1
143
14
88
9
11
50
9
6
G:
50 0
01 –
60
000
1 75
1
19
1 29
2
16
1 05
4
14
633
9
H:
60 0
01 –
70
000
2 40
9
25
1 81
4
22
1 30
3
16
773
10
I:70
001
– 8
0 00
03
130
34
2
387
27
1
778
23
1
069
14
J:80
001
– 9
0 00
03
701
43
2
990
36
2
165
27
1
481
19
K:
90 0
00 –
100
000
4 21
9
51
3 48
2
44
2 60
2
34
1 78
8
23
L:10
0 00
1 –
110
000
4 56
4
60
3 98
6
55
3 24
5
45
2 21
1
29
M:
110
001
– 12
0 00
04
809
65
4
200
62
3
580
53
2
560
37
N:
120
001
– 13
0 00
05
046
69
4
448
69
3
665
58
2
873
45
O:
130
001
– 14
0 00
05
247
79
4
559
73
3
840
63
2
957
49
P:
140
001
– 15
0 00
04
803
74
4
645
76
3
942
67
2
967
52
Q:
150
001
– 20
0 00
020
911
364
20 3
70
38
2
18
795
363
15 8
76
30
8
R:
200
001
– 30
0 00
022
855
477
24 4
71
56
1
26
677
635
30 1
61
79
7
S:
300
001
– 40
0 00
09
681
24
7
10
914
301
11 9
05
34
3
11
534
341
T:40
0 00
1 –
500
000
4 57
5
136
5 29
9
172
6 03
8
200
5 95
6
202
U:
500
001
– 75
0 00
04
886
16
9
5
577
21
1
6
351
25
3
5
919
23
4
V:
750
001
– 1
000
000
1 89
8
73
2 08
6
90
2 27
8
105
2 25
5
105
W:
1 00
0 00
1 –
2 00
0 00
01
970
92
2
240
11
6
2
450
13
4
2
133
10
9
X:
2 00
0 00
1 –
5 00
0 00
062
0
36
62
1
40
72
4
50
52
7
35
Y:
5 00
0 00
1 +
114
8
83
6
121
10
70
7
Tota
l11
1 75
7
2
179
10
9 08
1
2
407
10
5 42
0
2
533
95
347
2 44
5
CHAPTER 2: PERSONAL INCOME TAX
69

Taxa
ble
inco
me
grou
p20
03 [9
5.1%
ass
esse
d]20
04 [9
2.3%
ass
esse
d]20
05 [8
7.0%
ass
esse
d]20
06 [7
1.0%
ass
esse
d]N
umbe
r of
taxp
ayer
sPe
rcen
tage
Num
ber o
f ta
xpay
ers
Perc
enta
geN
umbe
r of
taxp
ayer
sPe
rcen
tage
Num
ber o
f ta
xpay
ers
Perc
enta
ge
A:
< 0
0.4%
0.6%
0.4%
0.5%
0.3%
0.4%
0.2%
0.2%
B:
= 0
0.0%
0.0%
0.0%
0.0%
0.0%
0.0%
0.0%
0.0%
C:
1 –
20 0
000.
6%0.
2%0.
5%0.
2%0.
4%0.
1%0.
2%0.
1%
D:
20 0
01 –
30
000
0.9%
0.4%
0.7%
0.3%
0.5%
0.2%
0.2%
0.1%
E:
30 0
01 –
40
000
1.0%
0.6%
0.8%
0.4%
0.7%
0.4%
0.5%
0.3%
F:40
001
– 5
0 00
01.
3%0.
7%1.
0%0.
6%0.
8%0.
4%0.
5%0.
3%
G:
50 0
01 –
60
000
1.6%
0.9%
1.2%
0.7%
1.0%
0.6%
0.7%
0.3%
H:
60 0
01 –
70
000
2.2%
1.1%
1.7%
0.9%
1.2%
0.7%
0.8%
0.4%
I:70
001
– 8
0 00
02.
8%1.
5%2.
2%1.
1%1.
7%0.
9%1.
1%0.
6%
J:80
001
– 9
0 00
03.
3%2.
0%2.
7%1.
5%2.
1%1.
1%1.
6%0.
8%
K:
90 0
00 –
100
000
3.8%
2.4%
3.2%
1.8%
2.5%
1.3%
1.9%
0.9%
L:10
0 00
1 –
110
000
4.1%
2.7%
3.7%
2.3%
3.1%
1.8%
2.3%
1.2%
M:
110
001
– 12
0 00
04.
3%3.
0%3.
9%2.
6%3.
4%2.
1%2.
7%1.
5%
N:
120
001
– 13
0 00
04.
5%3.
2%4.
1%2.
8%3.
5%2.
3%3.
0%1.
9%
O:
130
001
– 14
0 00
04.
7%3.
6%4.
2%3.
0%3.
6%2.
5%3.
1%2.
0%
P:
140
001
– 15
0 00
04.
3%3.
4%4.
3%3.
2%3.
7%2.
6%3.
1%2.
1%
Q:
150
001
– 20
0 00
018
.7%
16.7
%18
.7%
15.9
%17
.8%
14.3
%16
.7%
12.6
%
R:
200
001
– 30
0 00
020
.5%
21.9
%22
.4%
23.3
%25
.3%
25.1
%31
.6%
32.6
%
S:
300
001
– 40
0 00
08.
7%11
.3%
10.0
%12
.5%
11.3
%13
.5%
12.1
%14
.0%
T:40
0 00
1 –
500
000
4.1%
6.3%
4.9%
7.1%
5.7%
7.9%
6.2%
8.3%
U:
500
001
– 75
0 00
04.
4%7.
8%5.
1%8.
8%6.
0%10
.0%
6.2%
9.6%
V:
750
001
– 1
000
000
1.7%
3.4%
1.9%
3.8%
2.2%
4.2%
2.4%
4.3%
W:
1 00
0 00
1 –
2 00
0 00
01.
8%4.
2%2.
1%4.
8%2.
3%5.
3%2.
2%4.
5%
X:
2 00
0 00
1 –
5 00
0 00
00.
6%1.
7%0.
6%1.
7%0.
7%2.
0%0.
6%1.
4%
Y:
5 00
0 00
1 +
0.1%
0.4%
0.1%
0.3%
0.1%
0.4%
0.1%
0.3%
Tota
l10
0.0%
100.
0%10
0.0%
100.
0%10
0.0%
100.
0%10
0.0%
100.
0%
Perc
enta
ge o
f tot
al
Tabl
e 2.
6.3:
Indi
vidu
al ta
xpay
ers:
Frin
ge b
enef
its -
Use
of m
otor
veh
icle
(cod
e 38
02) b
y ta
xabl
e in
com
e gr
oup,
200
3 –
2006
[p
erce
ntag
e of
tota
l]
2008 TAX STATISTICS
70

Taxa
ble
inco
me
grou
p20
03 [9
5.1%
ass
esse
d]20
04 [9
2.3%
ass
esse
d]20
05 [8
7.0%
ass
esse
d]20
06 [7
1.0%
ass
esse
d]N
umbe
r of
taxp
ayer
sA
mou
nt(R
mill
ion)
Num
ber o
f ta
xpay
ers
Am
ount
(R m
illio
n)N
umbe
r of
taxp
ayer
sA
mou
nt(R
mill
ion)
Num
ber o
f ta
xpay
ers
Am
ount
(R m
illio
n)A
:<
010
4
1
98
1
74
1
48
1
B:
= 0
2
0
2
0
7
0
1
0
C:
1 –
20 0
0033
1
1
364
1
29
0
1
215
0
D:
20 0
01 –
30
000
678
1
52
4
1
450
1
27
7
0
E:
30 0
01 –
40
000
2 07
4
4
1
616
3
1 14
4
3
60
0
2
F:40
001
– 5
0 00
02
585
7
2 96
4
7
2
497
7
2 26
1
6
G:
50 0
01 –
60
000
3 43
0
11
3 46
2
13
3 13
5
12
2 77
1
9
H:
60 0
01 –
70
000
6 57
3
25
5 78
6
23
5 36
5
22
4 05
8
16
I:70
001
– 8
0 00
07
081
34
7
298
37
6
919
35
5
991
31
J:80
001
– 9
0 00
08
400
49
7
487
47
7
225
45
8
186
51
K:
90 0
00 –
100
000
9 66
1
60
7 61
7
53
7 66
2
53
5 91
6
41
L:10
0 00
1 –
110
000
9 81
8
66
9 53
1
75
7 22
7
53
6 44
6
49
M:
110
001
– 12
0 00
08
158
55
7
776
64
9
302
77
5
628
44
N:
120
001
– 13
0 00
06
988
47
6
310
53
6
978
61
7
388
63
O:
130
001
– 14
0 00
05
287
38
5
739
50
5
995
53
7
238
69
P:
140
001
– 15
0 00
03
952
29
4
689
43
4
985
48
4
684
44
Q:
150
001
– 20
0 00
012
778
105
13 5
96
13
6
14
686
161
14 4
21
16
7
R:
200
001
– 30
0 00
09
053
93
10
563
125
12 9
27
16
8
14
063
198
S:
300
001
– 40
0 00
02
267
29
3
030
45
3
108
53
3
358
56
T:40
0 00
1 –
500
000
883
14
1 25
3
21
1 36
8
25
1 51
0
27
U:
500
001
– 75
0 00
082
3
14
1
101
21
1
233
25
1
306
26
V:
750
001
– 1
000
000
330
9
43
6
16
47
1
16
49
4
15
W:
1 00
0 00
1 –
2 00
0 00
039
4
22
48
7
37
49
4
32
47
2
25
X:
2 00
0 00
1 –
5 00
0 00
014
9
21
16
9
28
13
9
22
10
4
12
Y:
5 00
0 00
1 +
19
4
13
3
13
3
11
2
Tota
l10
1 81
8
73
7
10
1 91
1
90
0
10
3 69
4
97
8
97
447
956
Tabl
e 2.
6.4:
Indi
vidu
al ta
xpay
ers:
Frin
ge b
enef
its -
Free
or c
heap
resi
dent
ial /
hol
iday
acc
omm
odat
ion
(cod
e 38
05) b
y ta
xabl
e in
com
e gr
oup,
200
3 –
2006
CHAPTER 2: PERSONAL INCOME TAX
71
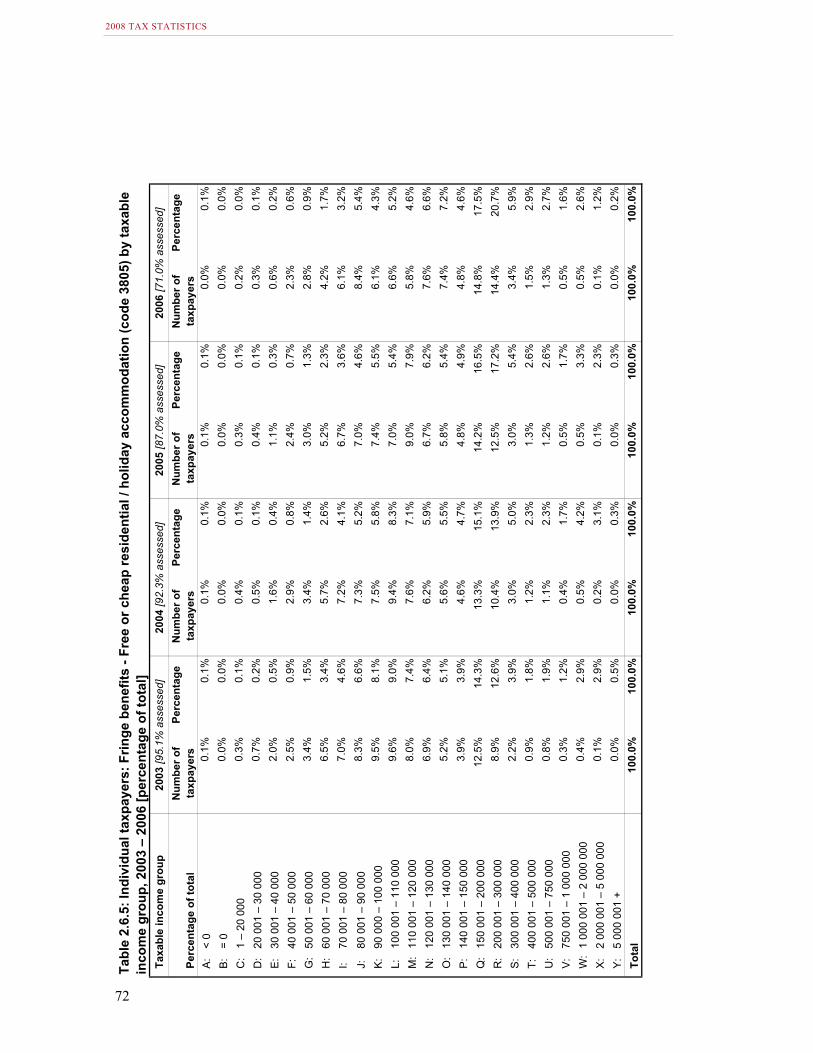
Taxa
ble
inco
me
grou
p20
03 [9
5.1%
ass
esse
d]20
04 [9
2.3%
ass
esse
d]20
05 [8
7.0%
ass
esse
d]20
06 [7
1.0%
ass
esse
d]N
umbe
r of
taxp
ayer
sPe
rcen
tage
Num
ber o
f ta
xpay
ers
Perc
enta
geN
umbe
r of
taxp
ayer
sPe
rcen
tage
Num
ber o
f ta
xpay
ers
Perc
enta
ge
A:
< 0
0.1%
0.1%
0.1%
0.1%
0.1%
0.1%
0.0%
0.1%
B:
= 0
0.0%
0.0%
0.0%
0.0%
0.0%
0.0%
0.0%
0.0%
C:
1 –
20 0
000.
3%0.
1%0.
4%0.
1%0.
3%0.
1%0.
2%0.
0%
D:
20 0
01 –
30
000
0.7%
0.2%
0.5%
0.1%
0.4%
0.1%
0.3%
0.1%
E:
30 0
01 –
40
000
2.0%
0.5%
1.6%
0.4%
1.1%
0.3%
0.6%
0.2%
F:40
001
– 5
0 00
02.
5%0.
9%2.
9%0.
8%2.
4%0.
7%2.
3%0.
6%
G:
50 0
01 –
60
000
3.4%
1.5%
3.4%
1.4%
3.0%
1.3%
2.8%
0.9%
H:
60 0
01 –
70
000
6.5%
3.4%
5.7%
2.6%
5.2%
2.3%
4.2%
1.7%
I:70
001
– 8
0 00
07.
0%4.
6%7.
2%4.
1%6.
7%3.
6%6.
1%3.
2%
J:80
001
– 9
0 00
08.
3%6.
6%7.
3%5.
2%7.
0%4.
6%8.
4%5.
4%
K:
90 0
00 –
100
000
9.5%
8.1%
7.5%
5.8%
7.4%
5.5%
6.1%
4.3%
L:10
0 00
1 –
110
000
9.6%
9.0%
9.4%
8.3%
7.0%
5.4%
6.6%
5.2%
M:
110
001
– 12
0 00
08.
0%7.
4%7.
6%7.
1%9.
0%7.
9%5.
8%4.
6%
N:
120
001
– 13
0 00
06.
9%6.
4%6.
2%5.
9%6.
7%6.
2%7.
6%6.
6%
O:
130
001
– 14
0 00
05.
2%5.
1%5.
6%5.
5%5.
8%5.
4%7.
4%7.
2%
P:
140
001
– 15
0 00
03.
9%3.
9%4.
6%4.
7%4.
8%4.
9%4.
8%4.
6%
Q:
150
001
– 20
0 00
012
.5%
14.3
%13
.3%
15.1
%14
.2%
16.5
%14
.8%
17.5
%
R:
200
001
– 30
0 00
08.
9%12
.6%
10.4
%13
.9%
12.5
%17
.2%
14.4
%20
.7%
S:
300
001
– 40
0 00
02.
2%3.
9%3.
0%5.
0%3.
0%5.
4%3.
4%5.
9%
T:40
0 00
1 –
500
000
0.9%
1.8%
1.2%
2.3%
1.3%
2.6%
1.5%
2.9%
U:
500
001
– 75
0 00
00.
8%1.
9%1.
1%2.
3%1.
2%2.
6%1.
3%2.
7%
V:
750
001
– 1
000
000
0.3%
1.2%
0.4%
1.7%
0.5%
1.7%
0.5%
1.6%
W:
1 00
0 00
1 –
2 00
0 00
00.
4%2.
9%0.
5%4.
2%0.
5%3.
3%0.
5%2.
6%
X:
2 00
0 00
1 –
5 00
0 00
00.
1%2.
9%0.
2%3.
1%0.
1%2.
3%0.
1%1.
2%
Y:
5 00
0 00
1 +
0.0%
0.5%
0.0%
0.3%
0.0%
0.3%
0.0%
0.2%
Tota
l10
0.0%
100.
0%10
0.0%
100.
0%10
0.0%
100.
0%10
0.0%
100.
0%
Perc
enta
ge o
f tot
al
Tabl
e 2.
6.5:
Indi
vidu
al ta
xpay
ers:
Frin
ge b
enef
its -
Free
or c
heap
resi
dent
ial /
hol
iday
acc
omm
odat
ion
(cod
e 38
05) b
y ta
xabl
e in
com
e gr
oup,
200
3 –
2006
[per
cent
age
of to
tal]
2008 TAX STATISTICS
72

Taxa
ble
inco
me
grou
p20
03 [9
5.1%
ass
esse
d]20
04 [9
2.3%
ass
esse
d]20
05 [8
7.0%
ass
esse
d]20
06 [7
1.0%
ass
esse
d]N
umbe
r of
taxp
ayer
sA
mou
nt(R
mill
ion)
Num
ber o
f ta
xpay
ers
Am
ount
(R m
illio
n)N
umbe
r of
taxp
ayer
sA
mou
nt(R
mill
ion)
Num
ber o
f ta
xpay
ers
Am
ount
(R m
illio
n)A
:<
04
0
3
0
3
0
4
0
B:
= 0
–
–
1
0
–
–
1
0
C:
1 –
20 0
0015
0
21
0
10
0
17
0
D:
20 0
01 –
30
000
31
0
27
0
18
0
17
0
E:
30 0
01 –
40
000
117
0
71
0
55
0
34
0
F:40
001
– 5
0 00
032
5
1
304
0
27
3
0
122
0
G:
50 0
01 –
60
000
514
1
44
5
1
405
1
28
5
0
H:
60 0
01 –
70
000
788
2
75
3
1
749
1
54
1
1
I:70
001
– 8
0 00
087
0
2
822
2
84
2
2
671
2
J:80
001
– 9
0 00
078
3
2
797
2
78
2
2
691
2
K:
90 0
00 –
100
000
645
2
75
3
2
695
2
69
2
2
L:10
0 00
1 –
110
000
511
2
58
1
2
599
2
58
7
2
M:
110
001
– 12
0 00
045
6
2
543
2
55
7
2
538
2
N:
120
001
– 13
0 00
044
9
2
414
2
43
2
2
443
2
O:
130
001
– 14
0 00
044
4
2
461
2
41
9
2
382
2
P:
140
001
– 15
0 00
034
4
2
408
2
42
6
2
355
2
Q:
150
001
– 20
0 00
01
424
9
1 61
9
10
1 53
1
9
1
451
9
R:
200
001
– 30
0 00
01
250
11
1
518
13
1
683
13
1
843
16
S:
300
001
– 40
0 00
045
0
4
516
5
57
6
6
562
6
T:40
0 00
1 –
500
000
215
3
26
5
4
288
4
26
2
3
U:
500
001
– 75
0 00
019
0
3
212
3
24
8
4
265
4
V:
750
001
– 1
000
000
73
2
66
1
89
1
84
1
W:
1 00
0 00
1 –
2 00
0 00
067
2
73
2
56
1
70
1
X:
2 00
0 00
1 –
5 00
0 00
029
5
29
3
21
1
12
0
Y:
5 00
0 00
1 +
9
1
8
2
3
0
4
0
Tota
l10
003
61
10 7
10
62
10
760
60
9 93
3
59
Tabl
e 2.
6.6:
Indi
vidu
al ta
xpay
ers:
Frin
ge b
enef
its -
Bur
sarie
s an
d sc
hola
rshi
ps (c
ode
3809
) by
taxa
ble
inco
me
grou
p,
2003
– 2
006
CHAPTER 2: PERSONAL INCOME TAX
73

Taxa
ble
inco
me
grou
p20
03 [9
5.1%
ass
esse
d]20
04 [9
2.3%
ass
esse
d]20
05 [8
7.0%
ass
esse
d]20
06 [7
1.0%
ass
esse
d]N
umbe
r of
taxp
ayer
sPe
rcen
tage
Num
ber o
f ta
xpay
ers
Perc
enta
geN
umbe
r of
taxp
ayer
sPe
rcen
tage
Num
ber o
f ta
xpay
ers
Perc
enta
ge
A:
< 0
0.0%
0.0%
0.0%
0.0%
0.0%
0.1%
0.0%
0.0%
B:
= 0
0.0%
0.0%
0.0%
0.0%
0.0%
0.0%
0.0%
0.0%
C:
1 –
20 0
000.
1%0.
1%0.
2%0.
1%0.
1%0.
1%0.
2%0.
1%
D:
20 0
01 –
30
000
0.3%
0.1%
0.3%
0.1%
0.2%
0.1%
0.2%
0.2%
E:
30 0
01 –
40
000
1.2%
0.3%
0.7%
0.1%
0.5%
0.2%
0.3%
0.2%
F:40
001
– 5
0 00
03.
2%0.
9%2.
8%0.
5%2.
5%0.
5%1.
2%0.
3%
G:
50 0
01 –
60
000
5.1%
1.4%
4.2%
1.2%
3.8%
1.2%
2.9%
0.6%
H:
60 0
01 –
70
000
7.9%
2.7%
7.0%
2.2%
7.0%
2.1%
5.4%
1.5%
I:70
001
– 8
0 00
08.
7%3.
5%7.
7%3.
0%7.
8%3.
4%6.
8%2.
9%
J:80
001
– 9
0 00
07.
8%3.
8%7.
4%3.
7%7.
3%3.
9%7.
0%3.
3%
K:
90 0
00 –
100
000
6.4%
3.7%
7.0%
3.9%
6.5%
4.0%
7.0%
3.8%
L:10
0 00
1 –
110
000
5.1%
3.3%
5.4%
3.8%
5.6%
3.9%
5.9%
3.9%
M:
110
001
– 12
0 00
04.
6%3.
4%5.
1%3.
7%5.
2%3.
8%5.
4%3.
9%
N:
120
001
– 13
0 00
04.
5%3.
4%3.
9%3.
1%4.
0%3.
2%4.
5%3.
1%
O:
130
001
– 14
0 00
04.
4%3.
4%4.
3%3.
6%3.
9%3.
4%3.
8%2.
9%
P:
140
001
– 15
0 00
03.
4%2.
9%3.
8%3.
2%4.
0%3.
8%3.
6%3.
1%
Q:
150
001
– 20
0 00
014
.2%
15.5
%15
.1%
15.8
%14
.2%
14.8
%14
.6%
15.4
%
R:
200
001
– 30
0 00
012
.5%
18.2
%14
.2%
20.8
%15
.6%
22.5
%18
.6%
26.5
%
S:
300
001
– 40
0 00
04.
5%7.
0%4.
8%8.
2%5.
4%9.
6%5.
7%10
.1%
T:40
0 00
1 –
500
000
2.1%
4.3%
2.5%
6.1%
2.7%
6.1%
2.6%
5.4%
U:
500
001
– 75
0 00
01.
9%4.
7%2.
0%5.
1%2.
3%6.
1%2.
7%7.
0%
V:
750
001
– 1
000
000
0.7%
2.5%
0.6%
1.8%
0.8%
2.3%
0.8%
2.4%
W:
1 00
0 00
1 –
2 00
0 00
00.
7%3.
9%0.
7%2.
7%0.
5%2.
1%0.
7%2.
4%
X:
2 00
0 00
1 –
5 00
0 00
00.
3%8.
9%0.
3%4.
7%0.
2%2.
5%0.
1%0.
5%
Y:
5 00
0 00
1 +
0.1%
2.3%
0.1%
2.5%
0.0%
0.3%
0.0%
0.4%
Tota
l10
0.0%
100.
0%10
0.0%
100.
0%10
0.0%
100.
0%10
0.0%
100.
0%
Perc
enta
ge o
f tot
al
Tabl
e 2.
6.7:
Indi
vidu
al ta
xpay
ers:
Frin
ge b
enef
its -
Bur
sarie
s an
d sc
hola
rshi
ps (c
ode
3809
) by
taxa
ble
inco
me
grou
p,
2003
– 2
006
[per
cent
age
of to
tal]
2008 TAX STATISTICS
74

Taxa
ble
inco
me
grou
p20
03 [9
5.1%
ass
esse
d]20
04 [9
2.3%
ass
esse
d]20
05 [8
7.0%
ass
esse
d]20
06 [7
1.0%
ass
esse
d]N
umbe
r of
taxp
ayer
sA
mou
nt(R
mill
ion)
Num
ber o
f ta
xpay
ers
Am
ount
(R m
illio
n)N
umbe
r of
taxp
ayer
sA
mou
nt(R
mill
ion)
Num
ber o
f ta
xpay
ers
Am
ount
(R m
illio
n)A
:<
064
2
3
580
3
55
6
3
318
2
B:
= 0
12
0
17
0
31
0
21
0
C:
1 –
20 0
002
967
4
2 43
3
4
2
320
3
1 70
9
2
D:
20 0
01 –
30
000
3 79
2
9
2
707
7
2 14
8
5
1
387
3
E:
30 0
01 –
40
000
7 35
8
17
5 93
7
13
3 98
9
10
2 62
8
6
F:40
001
– 5
0 00
012
084
32
10 2
18
25
6
824
18
4
924
14
G:
50 0
01 –
60
000
16 2
78
49
15
627
47
12 2
18
41
8
140
24
H:
60 0
01 –
70
000
23 9
75
79
24
755
84
23 8
65
91
15
598
53
I:70
001
– 8
0 00
030
127
107
27 9
37
99
24
092
94
25 4
05
10
1
J:80
001
– 9
0 00
036
426
127
33 0
33
12
2
27
122
104
21 8
83
88
K:
90 0
00 –
100
000
48 9
95
16
6
41
828
140
29 7
12
11
5
22
804
92
L:10
0 00
1 –
110
000
37 0
13
13
9
49
147
163
42 6
63
13
7
24
679
99
M:
110
001
– 12
0 00
029
799
116
31 9
54
12
4
39
227
146
32 4
09
10
3
N:
120
001
– 13
0 00
023
597
100
24 9
73
10
7
25
573
112
39 3
02
13
0
O:
130
001
– 14
0 00
019
256
88
21 4
49
99
20
832
102
25 4
86
10
9
P:
140
001
– 15
0 00
016
667
79
18 6
04
90
17
831
93
19 4
05
92
Q:
150
001
– 20
0 00
061
934
322
68 2
85
37
1
66
908
388
68 1
44
38
0
R:
200
001
– 30
0 00
061
737
367
70 1
93
44
4
76
532
502
93 2
34
61
6
S:
300
001
– 40
0 00
025
737
174
30 2
15
21
9
32
862
252
33 7
02
25
3
T:40
0 00
1 –
500
000
12 2
54
89
14
764
117
16 7
81
14
0
17
410
142
U:
500
001
– 75
0 00
012
051
92
14 5
73
12
4
17
018
156
17 6
37
15
7
V:
750
001
– 1
000
000
4 30
2
35
5 33
6
49
5 98
0
58
6 21
0
60
W:
1 00
0 00
1 –
2 00
0 00
04
118
35
5
116
50
5
832
60
5
875
59
X:
2 00
0 00
1 –
5 00
0 00
01
035
9
1 17
2
12
1 54
8
16
1 37
3
15
Y:
5 00
0 00
1 +
183
2
14
3
2
245
3
20
3
2
Tota
l49
2 33
9
2
240
52
0 99
6
2
514
50
2 70
9
2
651
48
9 88
6
2
600
Tabl
e 2.
6.8:
Indi
vidu
al ta
xpay
ers:
Frin
ge b
enef
its -
Med
ical
aid
pai
d on
beh
alf o
f em
ploy
ee (c
ode
3810
) by
taxa
ble
inco
me
grou
p, 2
003
– 20
06
CHAPTER 2: PERSONAL INCOME TAX
75

Taxa
ble
inco
me
grou
p20
03 [9
5.1%
ass
esse
d]20
04 [9
2.3%
ass
esse
d]20
05 [8
7.0%
ass
esse
d]20
06 [7
1.0%
ass
esse
d]N
umbe
r of
taxp
ayer
sPe
rcen
tage
Num
ber o
f ta
xpay
ers
Perc
enta
geN
umbe
r of
taxp
ayer
sPe
rcen
tage
Num
ber o
f ta
xpay
ers
Perc
enta
ge
A:
< 0
0.1%
0.1%
0.1%
0.1%
0.1%
0.1%
0.1%
0.1%
B:
= 0
0.0%
0.0%
0.0%
0.0%
0.0%
0.0%
0.0%
0.0%
C:
1 –
20 0
000.
6%0.
2%0.
5%0.
2%0.
5%0.
1%0.
3%0.
1%
D:
20 0
01 –
30
000
0.8%
0.4%
0.5%
0.3%
0.4%
0.2%
0.3%
0.1%
E:
30 0
01 –
40
000
1.5%
0.7%
1.1%
0.5%
0.8%
0.4%
0.5%
0.2%
F:40
001
– 5
0 00
02.
5%1.
4%2.
0%1.
0%1.
4%0.
7%1.
0%0.
5%
G:
50 0
01 –
60
000
3.3%
2.2%
3.0%
1.9%
2.4%
1.6%
1.7%
0.9%
H:
60 0
01 –
70
000
4.9%
3.5%
4.8%
3.3%
4.7%
3.4%
3.2%
2.0%
I:70
001
– 8
0 00
06.
1%4.
8%5.
4%3.
9%4.
8%3.
6%5.
2%3.
9%
J:80
001
– 9
0 00
07.
4%5.
7%6.
3%4.
9%5.
4%3.
9%4.
5%3.
4%
K:
90 0
00 –
100
000
10.0
%7.
4%8.
0%5.
6%5.
9%4.
4%4.
7%3.
5%
L:10
0 00
1 –
110
000
7.5%
6.2%
9.4%
6.5%
8.5%
5.2%
5.0%
3.8%
M:
110
001
– 12
0 00
06.
1%5.
2%6.
1%5.
0%7.
8%5.
5%6.
6%4.
0%
N:
120
001
– 13
0 00
04.
8%4.
5%4.
8%4.
2%5.
1%4.
2%8.
0%5.
0%
O:
130
001
– 14
0 00
03.
9%3.
9%4.
1%3.
9%4.
1%3.
8%5.
2%4.
2%
P:
140
001
– 15
0 00
03.
4%3.
5%3.
6%3.
6%3.
5%3.
5%4.
0%3.
5%
Q:
150
001
– 20
0 00
012
.6%
14.4
%13
.1%
14.7
%13
.3%
14.6
%13
.9%
14.6
%
R:
200
001
– 30
0 00
012
.5%
16.4
%13
.5%
17.6
%15
.2%
18.9
%19
.0%
23.7
%
S:
300
001
– 40
0 00
05.
2%7.
8%5.
8%8.
7%6.
5%9.
5%6.
9%9.
7%
T:40
0 00
1 –
500
000
2.5%
4.0%
2.8%
4.6%
3.3%
5.3%
3.6%
5.5%
U:
500
001
– 75
0 00
02.
4%4.
1%2.
8%4.
9%3.
4%5.
9%3.
6%6.
0%
V:
750
001
– 1
000
000
0.9%
1.6%
1.0%
1.9%
1.2%
2.2%
1.3%
2.3%
W:
1 00
0 00
1 –
2 00
0 00
00.
8%1.
5%1.
0%2.
0%1.
2%2.
3%1.
2%2.
3%
X:
2 00
0 00
1 –
5 00
0 00
00.
2%0.
4%0.
2%0.
5%0.
3%0.
6%0.
3%0.
6%
Y:
5 00
0 00
1 +
0.0%
0.1%
0.0%
0.1%
0.0%
0.1%
0.0%
0.1%
Tota
l10
0.0%
100.
0%10
0.0%
100.
0%10
0.0%
100.
0%10
0.0%
100.
0%
Perc
enta
ge o
f tot
al
Tabl
e 2.
6.9:
Indi
vidu
al ta
xpay
ers:
Frin
ge b
enef
its -
Med
ical
aid
pai
d on
beh
alf o
f em
ploy
ee (c
ode
3810
) by
taxa
ble
inco
me
grou
p, 2
003
– 20
06 [p
erce
ntag
e of
tota
l]
2008 TAX STATISTICS
76