Personal Accident and Health Insurance in India, Key ... · Insurance in India, Key Trends and...
18
www.timetric.com Personal Accident and Health Insurance in India, Key Trends and Opportunities to 2018 Market Intelligence Report Reference code: IS0706MR Published: October 2014 www.timetric.com Timetric John Carpenter House 7 Carmelite Street London EC4Y 0BS United Kingdom Tel: +44 (0)20 7936 6400 Fax: +44 (0)20 7336 6813
Transcript of Personal Accident and Health Insurance in India, Key ... · Insurance in India, Key Trends and...
www.timetric.com
Personal Accident and Health
Insurance in India, Key Trends
and Opportunities to 2018
Market Intelligence Report
Reference code: IS0706MR
Published: October 2014
www.timetric.com
Timetric
John Carpenter House
7 Carmelite Street
London EC4Y 0BS
United Kingdom
Tel: +44 (0)20 7936 6400
Fax: +44 (0)20 7336 6813
Personal Accident and Health Insurance in India, Key Trends and Opportunities to 2018 Page 2
© Timetric. This product is licensed and is not to be photocopied Published: October 2014
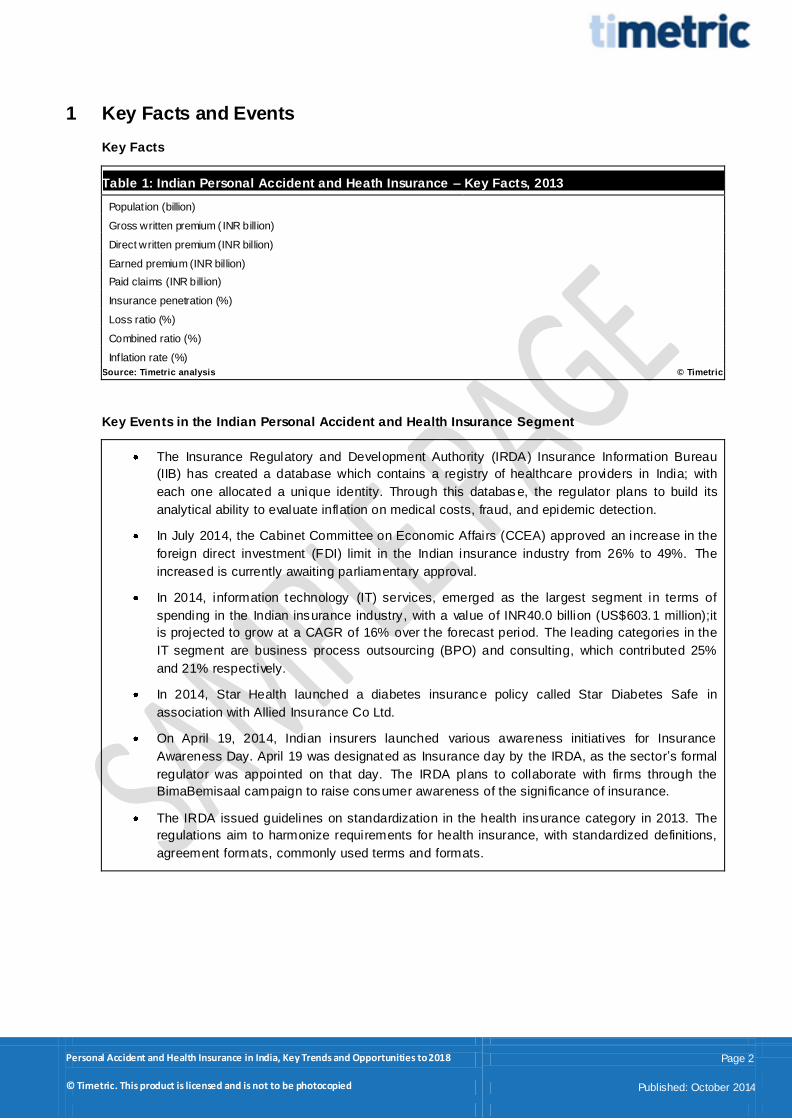
1 Key Facts and Events
Key Facts
Table 1: Indian Personal Accident and Heath Insurance – Key Facts, 2013
Population (billion)
Gross written premium ( INR billion)
Direct written premium (INR billion)
Earned premium (INR billion)
Paid claims (INR billion)
Insurance penetration (%)
Loss ratio (%)
Combined ratio (%)
Inflation rate (%)
Source: Timetric analysis © Timetric
Key Events in the Indian Personal Accident and Health Insurance Segment
The Insurance Regulatory and Development Authority (IRDA) Insurance Information Bureau
(IIB) has created a database which contains a registry of healthcare providers in India; with
each one allocated a unique identity. Through this databas e, the regulator plans to build its
analytical ability to evaluate inflation on medical costs, fraud, and epidemic detection.
In July 2014, the Cabinet Committee on Economic Affairs (CCEA) approved an increase in the
foreign direct investment (FDI) limit in the Indian insurance industry from 26% to 49%. The
increased is currently awaiting parliamentary approval.
In 2014, information technology (IT) services, emerged as the largest segment in terms of
spending in the Indian insurance industry, with a value of INR40.0 billion (US$603.1 million);it
is projected to grow at a CAGR of 16% over the forecast period. The leading categories in the
IT segment are business process outsourcing (BPO) and consulting, which contributed 25%
and 21% respectively.
In 2014, Star Health launched a diabetes insurance policy called Star Diabetes Safe in
association with Allied Insurance Co Ltd.
On April 19, 2014, Indian insurers launched various awareness initiatives for Insurance
Awareness Day. April 19 was designated as Insurance day by the IRDA, as the sector’s formal
regulator was appointed on that day. The IRDA plans to collaborate with firms through the
BimaBemisaal campaign to raise consumer awareness of the significance of insurance.
The IRDA issued guidelines on standardization in the health insurance category in 2013. The
regulations aim to harmonize requirements for health insurance, with standardized definitions,
agreement formats, commonly used terms and formats.

Personal Accident and Health Insurance in India, Key Trends and Opportunities to 2018 Page 3
© Timetric. This product is licensed and is not to be photocopied Published: October 2014
2 Executive Summary
The Indian personal accident and health insurance segment posted significant growth during the review
period. The segment’s gross written premium increased at a review-period (2009–2013) compound
annual growth rate (CAGR) of 21.1%, despite the global financial crisis. The robust growth was driven by
increasing healthcare expenditure, favorable government initiatives for large-scale health insurance
programs, and the liberalization of industry regulations. Despite the increase, penetration remains low
due to a lack of consumer awareness of personal accident and health insurance – especially in rural
areas, a lack of cover for many diseases, and dependence on sales of products with attached tax
benefits.
Increase in FDI cap and upcoming regulations to build international base for insurers
In July 2013, the IRDA proposed an increase in the FDI limit from 26% to 49% in order to improve,
promote and develop the domestic insurance industry. The CCEA approved the increase in July 2014,
which is now awaiting parliamentary approval. The increased FDI cap is expected to encourage global
insurers to invest in the segment, intensifying competition over the forecast period. The regulator has also
proposed solvency margin amendments to the government, and also appointed a committee to advise on
risk-based capital (RBC) standards implementation equivalent to Solvency II, which are being
implemented around the world. These upcoming changes in the industry are expected to increase
insurers’ efficiency and give them global exposure.
Rising pharmaceuticals industry and health reforms to promote health insurance
The Indian pharmaceuticals industry is expanding at 8–9% per annum, and is expected to be among the
world’s 10 leading pharmaceutical industries by 2017. Consequently, public awareness of diseases has
increased and the need for cover is being increasingly recognized. This is expected to cont ribute to the
growth of the health insurance category over the forecast period (2013−2018).
Growing travel industry to drive demand for travel insurance
The number of international travelers from India increased from 11.1 million in 2009 to 14.9 million in
2012, at a CAGR of 10.5%. This was largely responsible for the growth of travel insurance in India during
the review period. Domestic travelers are also taking out travel insurance. The tourism sector is expected
to grow at a forecast-period CAGR of 14.1%, leading to growth in the travel insurance category.
Increasing awareness of road accidents contributing to accident insurance
Accident rates in India have increased substantially, with poor road infrastructure and a rise in the number
of drink-driving cases rises. According to statistics from the Ministry of Road Transport and Highways, the
total number road accidents was 486,476 in 2013, and the number of people killed in road accidents
stood at 137,572. According to the first ever Global Status report on road safety, published by World
Health Organization (WHO) in the year 2009, India recorded the highest number of road accident deaths
in the world. Along with numerous precautionary traffic control measures and awareness programs, the
need for accident cover is also rising. Rapid urbanization a slow rate of infrastructure development are
expected to contribute to the growth of the personal accident and health segment over the forecast
period.

Personal Accident and Health Insurance in India, Key Trends and Opportunities to 2018 Page 4
© Timetric. This product is licensed and is not to be photocopied Published: October 2014
2.1 Key Findings
The personal accident and health segment accounted for 5.2% of the overall insurance industry’s
gross written premium in 2013
During the review period (2009–2013) Indian personal accident and health insurance segment
recorded a CAGR of 21.1%.
Healthcare was one of the fastest-growing categories in India with a review-period CAGR of
22.0%, but a substantial proportion of the population is still unaware of health insurance,
especially in rural areas.
In July 2013, the IRDA proposed an increase in the FDI limit from 26% to 49% in order to
improve, promote and develop the domestic insurance industry, which was approved by the
CCEA in July 2014. The increased cap is anticipated to attract global insurers to invest in the
segment, intensifying competition over the forecast period.
Health insurers used numerous prominent plat forms such as print media and television, as well
as organizing free health camps, to raise awareness of health insurance during the review
period.
2.2 Reasons to Buy
Make strategic business decisions using in depth historic and forecast market data related to
Indian personal accident and health insurance segment and each category within it
Understand the demand-side dynamics, key market trends and growth opportunities within Indian
personal accident and health insurance segment
Assess the competitive dynamics in the personal accident and health insurance segment, along
with the reinsurance segment
Identify the growth opportunities and market dynamics within key product categories
Gain insights into key regulations governing Indian insurance seg ment and its impact on
companies and the market 's future
Personal Accident and Health Insurance in India, Key Trends and Opportunities to 2018 Page 5
© Timetric. This product is licensed and is not to be photocopied Published: October 2014
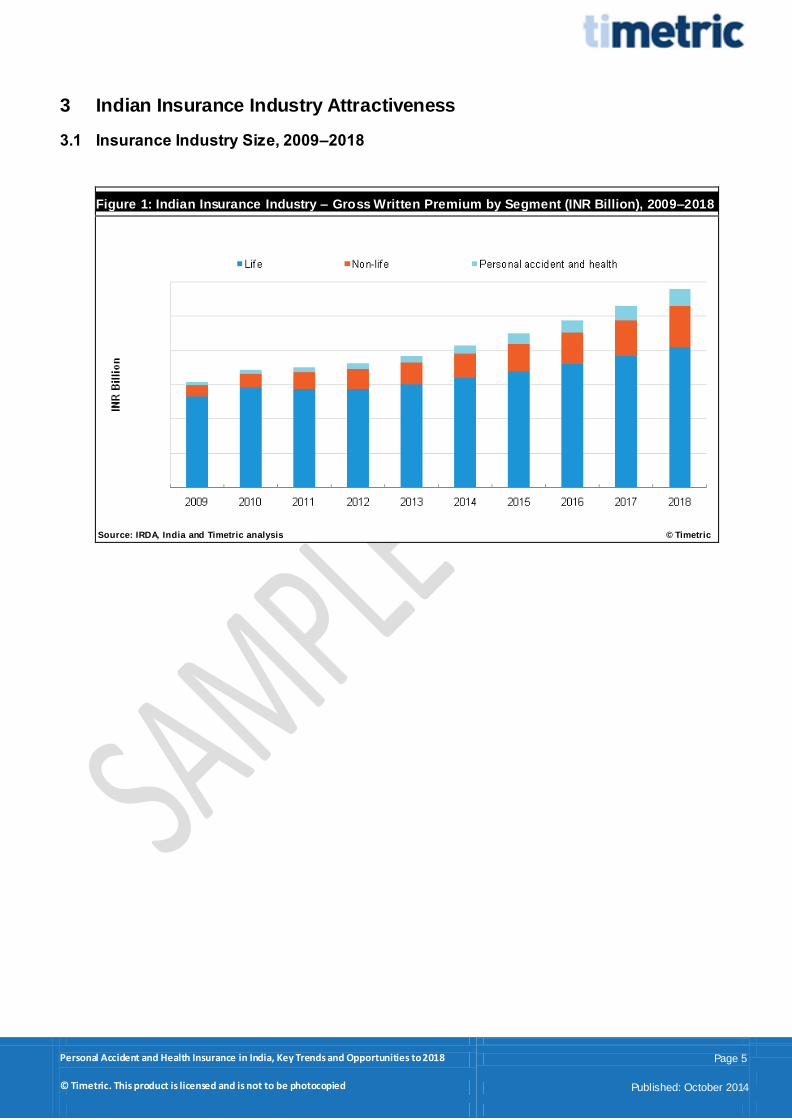
3 Indian Insurance Industry Attractiveness
3.1 Insurance Industry Size, 2009–2018
Figure 1: Indian Insurance Industry – Gross Written Premium by Segment (INR Billion), 2009–2018
Source: IRDA, India and Timetric analysis © Timetric
Personal Accident and Health Insurance in India, Key Trends and Opportunities to 2018 Page 6
© Timetric. This product is licensed and is not to be photocopied Published: October 2014
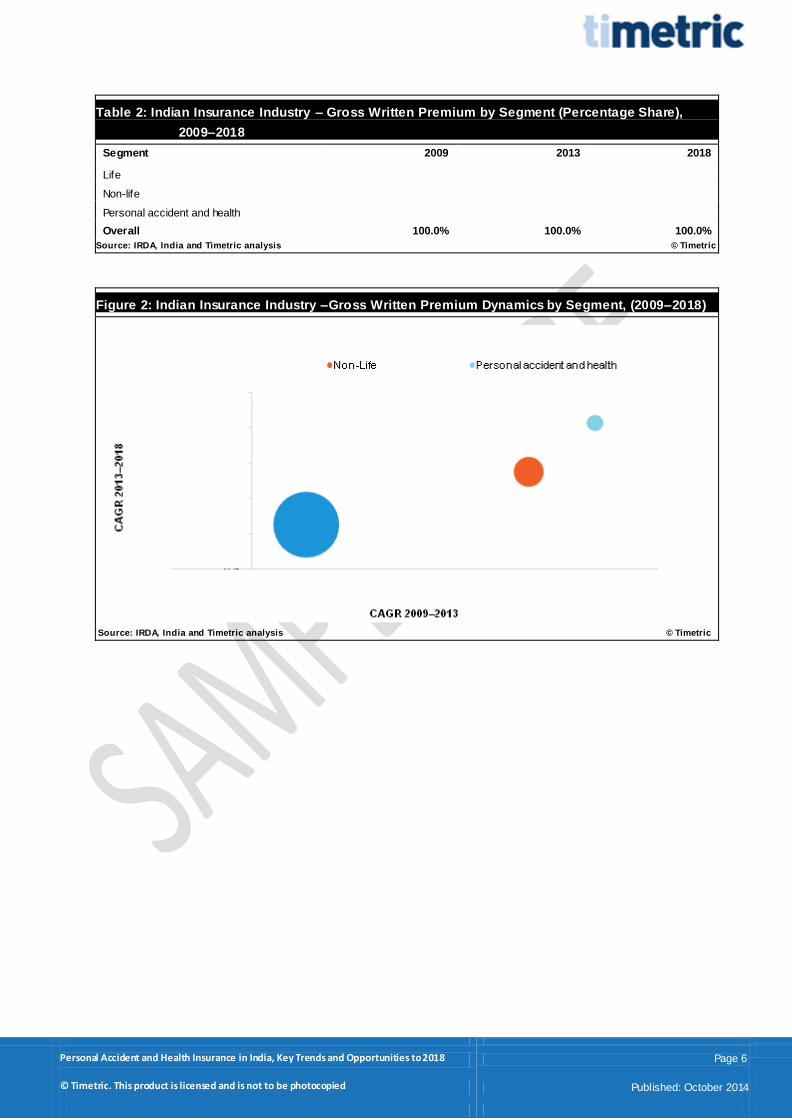
Table 2: Indian Insurance Industry – Gross Written Premium by Segment (Percentage Share),
2009–2018
Segment 2009 2013 2018
Life
Non-life
Personal accident and health
Overall 100.0% 100.0% 100.0%
Source: IRDA, India and Timetric analysis © Timetric
Figure 2: Indian Insurance Industry –Gross Written Premium Dynamics by Segment, (2009–2018)
Source: IRDA, India and Timetric analysis © Timetric

Personal Accident and Health Insurance in India, Key Trends and Opportunities to 2018 Page 7
© Timetric. This product is licensed and is not to be photocopied Published: October 2014
4 Personal Accident and Health Insurance Outlook
4.1 Personal Accident and Health Insurance Growth Prospects by Category
Figure 1: Indian Personal Accident and Health Insurance – Gross Written Premium by Category
(INR Billion), 2009–2018
Source: IRDA, India and Timetric analysis © Timetric
0
100
200
300
400
500
600
2009 2010 2011 2012 2013 2014 2015 2016 2017 2018
INR
Billio
n
Health Personal accident Travel
Personal Accident and Health Insurance in India, Key Trends and Opportunities to 2018 Page 8
© Timetric. This product is licensed and is not to be photocopied Published: October 2014
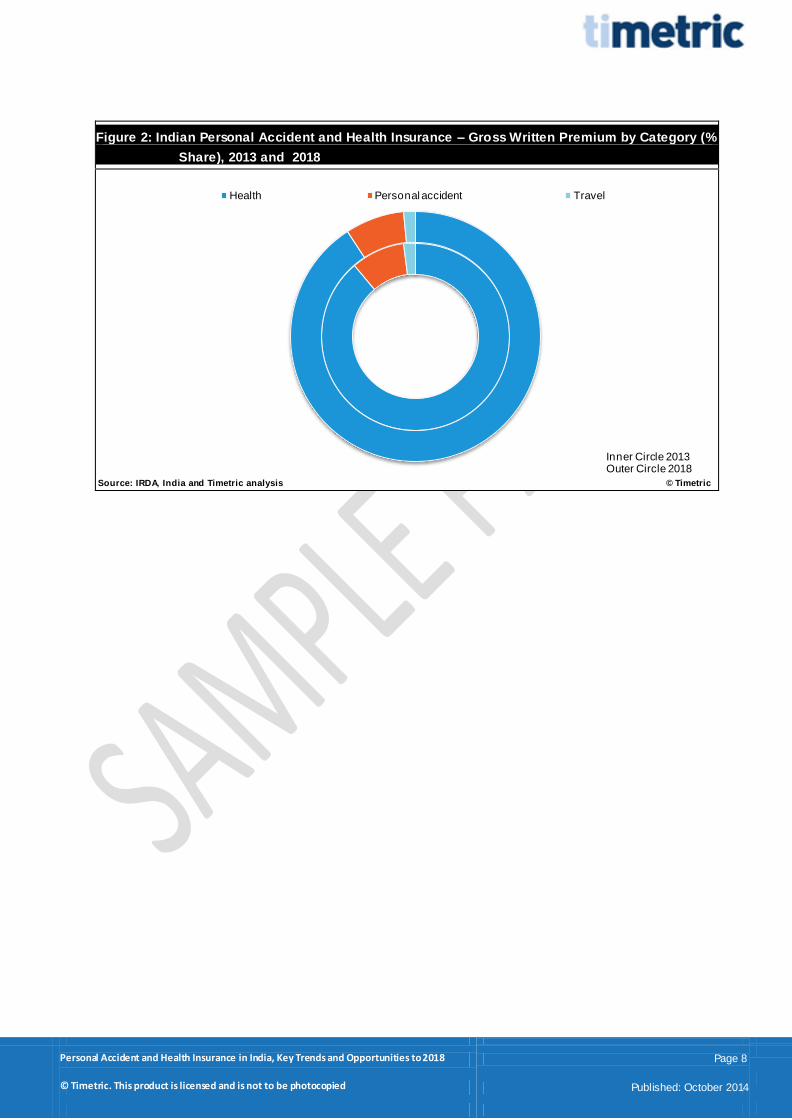
Figure 2: Indian Personal Accident and Health Insurance – Gross Written Premium by Category (%
Share), 2013 and 2018
Source: IRDA, India and Timetric analysis © Timetric
Health Personal accident Travel
Inner Circle 2013Outer Circle 2018
Personal Accident and Health Insurance in India, Key Trends and Opportunities to 2018 Page 9
© Timetric. This product is licensed and is not to be photocopied Published: October 2014
5 Methodology
All Timetric insurance reports are created by following a comprehensive, four-stage methodology. This
includes market study, research, analysis and quality control.
1) Market Study
A. Standardization
Definitions are specified using recognized industry classifications. The same definition is
used for every country.
Annual average currency exchange rates are used for the latest completed year. These are
then applied across both the historical and forecast data to remove exchang e rate
fluctuations.
B. Internal audit
Review of in-house databases to gather existing data:
Historic market databases and reports
Company database
C. Trend monitoring
Review of the latest insurance companies and industry trends
2) Research
A. Sources
Collection of the latest market-specific data from a wide variety of industry sources:
Government statistics
Industry associations
Company filings
International organizations
Insurance regulatory agencies
B. Expert opinion
Collation of opinion taken from leading insurance industry experts
Analysis of third-party opinion and forecasts:
Broker reports
Media
Official government sources
C. Data consolidation and verification
Consolidation of data and opinion to create historical datasets
Creation of models to benchmark data across sectors and regions
3) Analysis
A. Market forecasts
Feeding forecast data into market models:
Macroeconomic indicators
Industry-specific drivers
Analysis of insurance industry database to identify trends:
Latest insurance trends
Key drivers of the insurance industry
Personal Accident and Health Insurance in India, Key Trends and Opportunities to 2018 Page 10
© Timetric. This product is licensed and is not to be photocopied Published: October 2014
B. Report writing
Analysis of market data
Discussion of company and industry trends and issues
Review of financial deals and insurance trends
4) Quality Control
Templates
Detailed process manuals
Standardized report templates and accompanying style guides
Complex forecasting tools to ensure that forecast methodologies are consistently applied
Quality-control checklists
Quality-control process
Peer review
Senior-level QC
Random spot checks on data integrity
Benchmark checks across databases
Market data cross-checked for consistency with accumulated data from:
Company filings
Government sources
5.1 Related Reports
Personal Accident and Health Insurance in India, Key Trends and Opportunities to 2018
Personal Accident and Health Insurance in Indonesia, Key Trends and Opportunities to 2018
Personal Accident and Health Insurance in Colombia, Key Trends and Opportunities to 2018
Personal Accident and Health Insurance in Russia, Key Trends and Opportunities to 2018
Personal Accident and Health Insurance in Mexico, Key Trends and Opportunities to 2018
Personal Accident and Health Insurance in Argentina, Key Trends and Opportunities to 2018

Personal Accident and Health Insurance in India, Key Trends and Opportunities to 2018 Page 11
© Timetric. This product is licensed and is not to be photocopied Published: October 2014
TABLE OF CONTENTS
1 Key Facts and Events ................................................................................................................. 2
2 Executive Summary .................................................................................................................... 3
3 Introduction ................................................................................................................................. 12
3.1 What is this Report About? ..........................................................................................................12
3.2 Definitions .....................................................................................................................................12
3.3 Methodology .................................................................................................................................14
4 Indian Insurance Industry Attractiveness ........................................................................... 16
4.1 Insurance Industry Size, 2009–2018 ...........................................................................................18
4.2 Regional Benchmarking ...............................................................................................................22
4.2.1 Overview................................................................................................................................ 22
4.2.2 Market trends ......................................................................................................................... 24
4.2.3 Scale and penetration ............................................................................................................. 27
4.2.4 Total segment gross written premium ....................................................................................... 27
5 Personal Accident and Health Insurance Segment Outlook.......................................... 28
5.1 Consumer Segmentation..............................................................................................................30
5.2 Key Drivers ...................................................................................................................................33
5.3 Key Trends ...................................................................................................................................35
5.4 Challenges ....................................................................................................................................36
5.5 Personal Accident and Health Insurance Growth Prospects by Category..................................37
5.5.1 Personal accident insurance.................................................................................................... 57
5.5.2 Travel insurance ..................................................................................................................... 60
5.5.3 Health insurance..................................................................................................................... 63
6 Analysis by Distribution Channel.......................................................................................... 68
6.1 Direct Marketing ...........................................................................................................................71
6.2 Bancassurance .............................................................................................................................75
6.3 Agencies .......................................................................................................................................79
6.4 E-commerce .................................................................................................................................83
6.5 Brokers .........................................................................................................................................87
6.6 Other Channels ............................................................................................................................91
7 Governance, Risk and Compliance....................................................................................... 95
7.1 Legislation Overview and Historical Evolution .............................................................................96
7.2 Legislation Trends by Type of Insurance .....................................................................................99
7.2.1 Life insurance regulatory trends ............................................................................................. 100
7.2.2 Property insurance regulatory trends ...................................................................................... 103
7.2.3 Motor insurance regulatory trends .......................................................................................... 106
7.2.4 Marine, aviation and transit insurance regulatory trends .......................................................... 108
7.2.5 Personal accident and health insurance regulatory trends ....................................................... 108
7.3 Compulsory Insurance ...............................................................................................................110

Personal Accident and Health Insurance in India, Key Trends and Opportunities to 2018 Page 12
© Timetric. This product is licensed and is not to be photocopied Published: October 2014
7.3.1 Motor third-party liability insurance ......................................................................................... 110
7.3.2 Workmen's compensation insurance/employers’ liability insurance ........................................... 112
7.4 Supervision and Control .............................................................................................................113
7.4.1 International Association of Insurance Supervisors ................................................................. 113
7.4.2 Insurance Regulatory and Development Authority ................................................................... 114
7.5 Non-Admitted Insurance Regulatory Trends .............................................................................115
7.5.1 Overview.............................................................................................................................. 115
7.5.2 Intermediaries ...................................................................................................................... 116
7.5.3 Market practices ................................................................................................................... 116
7.5.4 Fines and penalties ............................................................................................................... 116
7.6 Company Registration and Operations ......................................................................................117
7.6.1 Types of insurance organization ............................................................................................ 118
7.6.2 Establishing a local company ................................................................................................. 118
7.6.3 Foreign ownership ................................................................................................................ 119
7.6.4 Types of license.................................................................................................................... 120
7.6.5 Capital requirements ............................................................................................................. 120
7.6.6 Solvency margins ................................................................................................................. 121
7.6.7 Reserve requirements ........................................................................................................... 123
7.6.8 Investment regulations .......................................................................................................... 123
7.6.9 Statutory return requirements ................................................................................................ 125
7.6.10 Fee structure ........................................................................................................................ 126
7.7 Taxation ......................................................................................................................................127
7.7.1 Insurance premium or policy taxation ..................................................................................... 127
7.7.2 Corporate tax ....................................................................................................................... 127
7.7.3 VAT ..................................................................................................................................... 128
7.7.4 Captives ............................................................................................................................... 129
7.8 Legal System ..............................................................................................................................130
7.8.1 Introduction .......................................................................................................................... 130
7.8.2 Access to court ..................................................................................................................... 131
7.8.3 Alternative dispute resolution (ADR)....................................................................................... 133
8 Competitive Landscape and Strategic Insights............................................................... 135
8.1 Overview .....................................................................................................................................135
8.2 Leading Companies in Indian Personal Accident and Health Insurance Segment ..................136
8.3 Comparison of the Top Five Insurers.........................................................................................137
8.3.1 Gross written premium .......................................................................................................... 137
8.3.2 Net earned premium ............................................................................................................. 138
8.3.3 Paid claims........................................................................................................................... 139
8.3.4 Incurred loss......................................................................................................................... 140
8.4 Leading Personal accident and health Insurers – New Product Launches ..............................141
8.5 Leading Personal accident and health Insurers – Key Developments......................................144
8.6 New India Assurance Co. Ltd – Company Overview.................................................................146
8.6.1 New India Assurance Co. Ltd – key facts................................................................................ 146

Personal Accident and Health Insurance in India, Key Trends and Opportunities to 2018 Page 13
© Timetric. This product is licensed and is not to be photocopied Published: October 2014
8.6.2 New India Assurance Co. Ltd – key financials ......................................................................... 146
8.7 United India Insurance Co. Ltd – Company Overview ..............................................................147
8.7.1 United India Insurance Co. Ltd – key facts.............................................................................. 147
8.7.2 United India Insurance Co. Ltd – key financials ....................................................................... 147
8.8 National Insurance Co. Ltd – Company Overview.....................................................................148
8.8.1 National Insurance Co. Ltd – key facts ................................................................................... 148
8.8.2 National Insurance Co. Ltd – key financials ............................................................................ 148
8.9 ICICI Lombard General Insurance Co. Ltd – company overview ..............................................149
8.9.1 ICICI Lombard General Insurance Co. Ltd – key facts ............................................................. 149
8.9.2 ICICI Lombard General Insurance Co. Ltd – key financials ...................................................... 149
8.10 Oriental Insurance Company Ltd – Company Overview ...........................................................150
8.10.1 Oriental Insurance Company Ltd – key facts ........................................................................... 150
8.10.2 Oriental Insurance Company Ltd – key financials .................................................................... 150
8.11 Star Health and Allied Insurance Co. Ltd – Company Overview...............................................151
8.11.1 Star Health & Allied Insurance Co. Ltd – key facts................................................................... 151
8.11.2 Star Health & Allied Insurance Co. Ltd – key financials ............................................................ 151
8.12 HDFC Ergo General Insurance Company Ltd –Company Overview ........................................152
8.12.1 HDFC Ergo General Insurance Company Ltd – key facts ........................................................ 152
8.12.2 HDFC Ergo General Insurance Company Ltd – key financials.................................................. 152
8.13 Bajaj Allianz General Insurance Co. Ltd – Company Overview ................................................153
8.13.1 Bajaj Allianz General Insurance Co. Ltd – key facts................................................................. 153
8.13.2 Bajaj Allianz General Insurance Co. Ltd – key financials .......................................................... 153
8.14 Apollo Munich Health Insurance Company Ltd – Company Overview .....................................154
8.14.1 Apollo Munich Health Insurance Company Ltd – key facts ....................................................... 154
8.14.2 Apollo Munich Health Insurance Company Ltd – key financials ................................................ 154
8.15 Reliance General Insurance Company Ltd – Company Overview............................................155
8.15.1 Reliance General Insurance Company Ltd – key facts............................................................. 155
8.15.2 Reliance General Insurance Company Ltd – key financials ...................................................... 155
9 Appendix – 1 ............................................................................................................................. 156
9.1 Market Capitalization Trend – Bombay Stock Exchange, India ................................................156
9.2 GDP at Constant Prices (US$)...................................................................................................157
9.3 GDP per Capita at Constant Prices (US$).................................................................................158
9.4 GDP at Current Prices (US$) .....................................................................................................159
9.5 GDP per Capita at Current Prices (US$) ...................................................................................160
9.6 Inflation Rate...............................................................................................................................161
9.7 Unemployment Rate...................................................................................................................162
9.8 Household Consumption Expenditure (US$) .............................................................................163
9.9 Total Population..........................................................................................................................164
9.10 Urban and Rural Populations .....................................................................................................165
9.11 Age Distribution of the Total Population.....................................................................................166
10 Appendix – 2 ............................................................................................................................. 167
Personal Accident and Health Insurance in India, Key Trends and Opportunities to 2018 Page 14
© Timetric. This product is licensed and is not to be photocopied Published: October 2014
10.1 Methodology ...............................................................................................................................167
10.2 Contact Timetric .........................................................................................................................167
10.3 About Timetric ............................................................................................................................167
10.4 Timetric’s Services .....................................................................................................................168
10.5 Disclaimer ...................................................................................................................................169

Personal Accident and Health Insurance in India, Key Trends and Opportunities to 2018 Page 15
© Timetric. This product is licensed and is not to be photocopied Published: October 2014
LIST OF FIGURES
Figure 1: Indian Insurance Industry – Gross Written Premium by Segment (INR Billion), 2009–2018 ........................................................... 18 Figure 2: Indian Insurance Industry – Gross Written Premium Dynamics by Segment, (2009–2018) ............................................................ 19 Figure 3: Indian Insurance Industry – Direct Written Premium by Segment (INR Billion), 2009–2018 ........................................................... 20 Figure 4: Indian Insurance Industry – Direct Written Premium Dynamics by Segment (2009–2018) ............................................................. 21 Figure 5: BRICS Region – A Snapshot of the Economies and Populations, 2011 ......................................................................................... 23 Figure 6: BRICS Region – Grow th Trends in the Insurance Industry ............................................................................................................. 24 Figure 7: BRICS Region – GDP at Constant Prices (US$ Trillion) and Annual Per Capita Disposable Income (US$), 2007 and 2011 ......... 25 Figure 8: BRICS Region – Health Expenditure Per Capita (US$), 2007 and 2011......................................................................................... 26 Figure 9: BRICS Personal Accident and Health Insurance – Gross Written Premiums (US$ Billion), 2011 ................................................... 27 Figure 10: Gross Written Premium and Health Expenditure Statistics, 2008−2012 ....................................................................................... 30 Figure 11: Distribution of Employment by Sector (%), 2010–2012 ................................................................................................................. 31 Figure 12: Population Distribution by Gender and Age Group ....................................................................................................................... 31 Figure 13: Rural and Urban Populations (%) and Outbound Tourism (Million), 2009–2013 ........................................................................... 32 Figure 14: Indian Personal Accident and Health Insurance – Gross Written Premium by Category (INR Billion), 2009–2018....................... 37 Figure 15: Indian Personal Accident and Health Insurance – Gross Written Premium by Category (% Share), 2013 and 2018................... 38 Figure 16: Indian Personal Accident and Health Insurance – Direct Written Premium by Category (INR Billion), 2009–2018 ....................... 39 Figure 17: Indian Personal Accident and Health Insurance – Direct Written Premium by Category (% Share), 2013 and 2018 ................... 40 Figure 18: Indian Personal Accident and Health Insurance – Earned Premium ( INR Billion), 2009–2013 ..................................................... 41 Figure 19: Indian Personal Accident and Health Insurance– Earned Premium ( INR Billion), 2013–2018 ...................................................... 41 Figure 20: Indian Personal Accident and Health Insurance – Paid Claims by Category (INR Billion), 2009–2018......................................... 42 Figure 21: Indian Personal Accident and Health Insurance – Incurred Loss by Category (INR Billion), 2009–2018 ...................................... 43 Figure 22: Indian Personal Accident and Health Insurance – Retentions by Category (INR Billion), 2009–2018........................................... 44 Figure 23: Indian Personal Accident and Health Insurance – Loss Ratio (%), 2009–2013 ............................................................................ 45 Figure 24: Indian Personal Accident and Health Insurance – Loss Ratio (%), 2013–2018 ............................................................................ 45 Figure 25: Indian Personal Accident and Health Insurance – Commission and Expenses (INR Billion), 2009–2013..................................... 46 Figure 26: Indian Personal Accident and Health Insurance – Commission and Expenses (INR Billion), 2013–2018..................................... 46 Figure 27: Indian Personal Accident and Health Insurance – Combined Ratio (%), 2009–2013.................................................................... 47 Figure 28: Indian Personal Accident and Health Insurance – Combined Ratio (%), 2013–2018.................................................................... 47 Figure 29: Indian Personal Accident and Health Insurance – Frauds and Crimes (INR Billion), 2009–2013.................................................. 48 Figure 30: Indian Personal Accident and Health Insurance – Frauds and Crimes (INR Billion), 2013–2018.................................................. 48 Figure 31: Indian Personal Accident and Health Insurance – Total Assets (INR Billion), 2009–2013 ............................................................ 49 Figure 32: Indian Personal Accident and Health Insurance – Total Assets (INR Billion), 2013–2018 ............................................................ 49 Figure 33: Indian Personal Accident and Health Insurance – Total Investment Income ( INR Billion), 2009–2013 ......................................... 50 Figure 34:Indian Personal Accident and Health Insurance – Total Investment Income ( INR Billion), 2013–2018 .......................................... 50 Figure 35: Indian Personal Accident and Health Insurance – Retentions (INR Billion), 2009–2013............................................................... 51 Figure 36: Indian Personal Accident and Health Insurance – Retentions (INR Billion), 2013–2018............................................................... 51 Figure 37: Indian Personal Accident and Health Insurance – Total Investment (INR Billion), 2009–2013...................................................... 52 Figure 38: Indian Personal Accident and Health Insurance – Total Investment (% Share), 2009 and2013.................................................... 52 Figure 39: Indian Personal Accident and Health Insurance – Penetration (%), 2009–2013 ........................................................................... 53 Figure 40: Indian Personal Accident and Health Insurance – Number of Policies Sold (Thousand), 2009–2013........................................... 54 Figure 41: Indian Personal Accident and Health Insurance – Number of Policies Sold (Thousand), 2013–2018........................................... 55 Figure 42: Indian Personal Accident and Health Insurance – Premium Per Capita (INR), 2009–2013 .......................................................... 56 Figure 43: Indian Personal Accident Insurance –Number of Policies Sold (Thousand), 2009–2013.............................................................. 57 Figure 44: Indian Personal Accident Insurance –Number of Policies Sold (Thousand), 2013–2018.............................................................. 57 Figure 45: Indian Personal Accident Insurance –Gross Written Premium (INR Billion),2009–2013 ............................................................... 58 Figure 46: Indian Personal Accident Insurance –Gross Written Premium (INR Billion), 2013–2018 .............................................................. 58 Figure 47: Indian Personal Accident Insurance – Loss Ratio (%), 2009–2013............................................................................................... 59 Figure 48: Indian Personal Accident Insurance – Loss Ratio (%), 2013–2018............................................................................................... 59 Figure 49: Indian Travel Insurance –Number of Policies Sold (Thousand), 2009–2013................................................................................. 60 Figure 50: Indian Travel Insurance –Number of Policies Sold (Thousand), 2013–2018................................................................................. 60 Figure 51: Indian Travel Insurance –Gross Written Premium ( INR Billion), 2009–2013................................................................................. 61 Figure 52: Indian Travel Insurance –Gross Written Premium ( INR Billion), 2013–2018................................................................................. 61 Figure 53: Indian Travel Insurance – Loss Ratio (%), 2009–2013 ................................................................................................................. 62 Figure 54: Indian Travel Insurance – Loss Ratio (%), 2013–2018 ................................................................................................................. 62 Figure 55: Indian Health Insurance –Number of Policies Sold (Thousand), 2009–2013 ................................................................................ 63 Figure 56: Indian Health Insurance –Number of Policies Sold (Thousand), 2013–2018 ................................................................................ 63 Figure 57: Indian Health Insurance – Gross Written Premium ( INR Billion), 2009–2013 ............................................................................... 64 Figure 58: Indian Health Insurance – Gross Written Premium ( INR Billion), 2013–2018 ............................................................................... 64 Figure 59: Indian Health Insurance – Direct Written Premium (INR Billion), 2009–2013................................................................................ 65 Figure 60: Indian Health Insurance – Direct Written Premium (INR Billion), 2013–2018................................................................................ 65 Figure 61: Indian Non-Life Health Insurance – Loss Ratio (%), 2009–2013................................................................................................... 66 Figure 62: Indian Non-Life Health Insurance – Loss Ratio (%), 2013–2018................................................................................................... 66 Figure 63: Indian Non-Life Health Insurance – Retentions (INR Billion), 2009–2013 ..................................................................................... 67

Personal Accident and Health Insurance in India, Key Trends and Opportunities to 2018 Page 16
© Timetric. This product is licensed and is not to be photocopied Published: October 2014
Figure 64: Indian Non-Life Health Insurance – Retentions (INR Billion), 2013–2018 ..................................................................................... 67 Figure 65: Indian Personal Accident and Health Insurance – Written Premium by Distribution Channel (% Share), 2013 and 2018............. 70 Figure 66: Indian Personal Accident and Health Insurance –Direct Marketing Commission Paid ( INR Billion), 2009–2013 .......................... 71 Figure 67: Indian Personal Accident and Health Insurance – Direct Marketing Commission Paid ( INR Billion), 2013–2018 ......................... 71 Figure 68: Indian Personal Accident and Health Insurance – New Business Gross Written Premium Through Direct Marketing (INR Billion),
2009–2013 ..................................................................................................................................................................................................... 72 Figure 69: Indian Personal Accident and Health Insurance – New Business Gross Written Premium Through Direct Marketing (INR Billion),
2013–2018 ..................................................................................................................................................................................................... 72 Figure 70: Indian Personal Accident and Health Insurance –Policies Sold Through Direct Marketing (Thousand), 2009–2013 .................... 73 Figure 71: Indian Personal Accident and Health Insurance –Policies Sold Through Direct Marketing (Thousand), 2013–2018 .................... 73 Figure 72: Indian Personal Accident and Health Insurance – Number of Direct Marketing Distributors, 2009–2013 ..................................... 74 Figure 73: Indian Personal Accident and Health Insurance – Number of Direct Marketing Distributors, 2013–2018 ..................................... 74 Figure 74: Indian Personal Accident and Health Insurance – Bancassurance Commission Paid (INR Billion), 2009–2013........................... 75 Figure 75: Indian Personal Accident and Health Insurance – Bancassurance Commission Paid (INR Billion), 2013–2018........................... 75 Figure 76: Indian Personal Accident and Health Insurance – New Business Gross Written Premium Through Bancassurance (INR Billion),
2009–2013 ..................................................................................................................................................................................................... 76 Figure 77: Indian Personal Accident and Health Insurance – New Business Gross Written Premium Through Bancassurance (INR Billion),
2013–2018 ..................................................................................................................................................................................................... 76 Figure 78: Indian Personal Accident and Health Insurance –Policies Sold Through Bancassurance (Thousand), 2009–2013 ..................... 77 Figure 79: Indian Personal Accident and Health Insurance –Policies Sold Through Bancassurance (Thousand), 2013–2018 ..................... 77 Figure 80: Indian Personal Accident and Health Insurance – Number of Bancassurance Distributors, 2009–2013....................................... 78 Figure 81: Indian Personal Accident and Health Insurance – Number of Bancassurance Distributors, 2013–2018....................................... 78 Figure 82: Indian Personal Accident and Health Insurance – Commission Paid to Agencies (INR Billion), 2009–2013................................. 79 Figure 83: Indian Personal Accident and Health Insurance – Commission Paid to Agencies (INR Billion), 2013–2018................................. 79 Figure 84: Indian Personal Accident and Health Insurance – New Business Gross Written Premium Through Agencies (INR Billion), 2009–
2013............................................................................................................................................................................................................... 80 Figure 85: Indian Personal Accident and Health Insurance – New Business Gross Written Premium Through Agencies (INR Billion), 2013–
2018............................................................................................................................................................................................................... 80 Figure 86: Indian Personal Accident and Health Insurance –Policies Sold Through Agencies (Thousand), 2009–2013 ............................... 81 Figure 87: Indian Personal Accident and Health Insurance –Policies Sold Through Agencies (Thousand), 2013–2018 ............................... 81 Figure 88: Indian Personal Accident and Health Insurance – Number of Agencies, 2009–2013.................................................................... 82 Figure 89: Indian Personal Accident and Health Insurance – Number of Agencies, 2013–2018.................................................................... 82 Figure 90: Indian Personal Accident and Health Insurance – E-Commerce Commission Paid ( INR Billion), 2009–2013 .............................. 83 Figure 91: Indian Personal Accident and Health Insurance – E-Commerce Commission Paid ( INR Billion), 2013–2018 .............................. 83 Figure 92: Indian Personal Accident and Health Insurance – New Business Gross Written Premium Through E-Commerce (INR Billion),
2009–2013 ..................................................................................................................................................................................................... 84 Figure 93: Indian Personal Accident and Health Insurance – New Business Gross Written Premium Through E-Commerce (INR Billion),
2013–2018 ..................................................................................................................................................................................................... 84 Figure 94: Indian Personal Accident and Health Insurance – Policies Sold Through E-Commerce (Thousand), 2009–2013 ........................ 85 Figure 95: Indian Personal Accident and Health Insurance –Policies Sold Through E-Commerce (Thousand), 2013–2018 ......................... 85 Figure 96: Indian Personal Accident and Health Insurance – Number of E-Commerce Distributors, 2009–2013 .......................................... 86 Figure 97: Indian Personal Accident and Health Insurance – Number of E-Commerce Distributors, 2013–2018 .......................................... 86 Figure 98: Indian Personal Accident and Health Insurance – Commission Paid to Brokers (INR Billion), 2009–2013 ................................... 87 Figure 99: Indian Personal Accident and Health Insurance – Commission Paid to Brokers (INR Billion), 2013–2018 ................................... 87 Figure 100: Indian Personal Accident and Health Insurance – New Business Gross Written Premium Through Brokers (INR Billion), 2009–
2013............................................................................................................................................................................................................... 88 Figure 101: Indian Personal Accident and Health Insurance – New Business Gross Written Premium Through Brokers (INR Billion), 2013–
2018............................................................................................................................................................................................................... 88 Figure 102: Indian Personal Accident and Health Insurance –Policies Sold Through Brokers (Thousand), 2009–2013................................ 89 Figure 103: Indian Personal Accident and Health Insurance – Policies Sold Through Brokers (Thousand), 2013–2018............................... 89 Figure 104: Indian Personal Accident and Health Insurance – Number of Brokers, 2009–2013 .................................................................... 90 Figure 105: Indian Personal Accident and Health Insurance – Number of Brokers, 2013–2018 .................................................................... 90 Figure 106: Indian Personal Accident and Health Insurance – Commission Paid to Other Channels (INR Billion), 2009–2013 .................... 91 Figure 107: Indian Personal Accident and Health Insurance – Commission Paid to Other Channels (INR Billion), 2013–2018 .................... 91 Figure 108: Indian Personal Accident and Health Insurance – New Business Gross Written Premium Through Other Channels (INR Billion),
2009–2013 ..................................................................................................................................................................................................... 92 Figure 109: Indian Personal Accident and Health Insurance – New Business Gross Written Premium Through Other Channels (INR Billion),
2013–2018 ..................................................................................................................................................................................................... 92 Figure 110: Indian Personal Accident and Health Insurance –Policies Sold Through Other Channels (Thousand), 2009–2013 ................... 93 Figure 111: Indian Personal Accident and Health Insurance –Policies Sold Through Other Channels (Thousand), 2013–2018 ................... 93 Figure 112: Indian Personal Accident and Health Insurance – Number of Distributors in Other Channels, 2009–2013................................. 94 Figure 113: Indian Personal Accident and Health Insurance – Number of Distributors in Other Channels, 2013–2018................................. 94 Figure 114: India – The Insurance Regulatory Framework ............................................................................................................................ 95 Figure 115: India – Insurance Supervision and Control at Various Levels ................................................................................................... 113 Figure 116: India – Insurance Regulatory Framew orks for Company Registration and Operation............................................................... 117 Figure 117: India – Judiciary System ........................................................................................................................................................... 132
Personal Accident and Health Insurance in India, Key Trends and Opportunities to 2018 Page 17
© Timetric. This product is licensed and is not to be photocopied Published: October 2014
Figure 118: Shares of Key Insurers in Indian Personal Accident and Health Insurance Segment (%), 2013 ............................................... 136 Figure 119: Gross Written Premium – Top Five Indian Personal Accident and Health Insurers, 2013......................................................... 137 Figure 120: Net Earned Premium – Top Five Indian Personal Accident and Health Insurers, 2013 ............................................................ 138 Figure 121: Paid Claims –Top Five Indian Personal Accident and Health Insurers, 2013............................................................................ 139 Figure 122: Incurred Loss –Top Five Indian Personal Accident and Health Insurers, 2013 ......................................................................... 140 Figure 123: Indian, Bombay Stock Exchange Market Capitalization (US$ Billion), 2008–2012.................................................................... 156 Figure 124: Indian GDP at Constant Prices (US$ Billion), 2008–2012......................................................................................................... 157 Figure 125: Indian GDP Per Capita at Constant Prices (US$), 2008–2012 ................................................................................................. 158 Figure 126: Indian GDP at Current Prices (US$ Billion), 2008–2012 ........................................................................................................... 159 Figure 127: Indian GDP Per Capita at Current Prices (US$), 2008–2012.................................................................................................... 160 Figure 128: Indian Inflation Rate (%), 2008–2012........................................................................................................................................ 161 Figure 129: Indian Unemployment Rate (%), 2008–2012 ............................................................................................................................ 162 Figure 130: Indian Household Consumption Expenditure(US$ Billion), 2008–2012..................................................................................... 163 Figure 131: Indian Total Population (Million), 2008–2012 ............................................................................................................................ 164 Figure 132: Indian Urban and Rural Populations (%), 2008–2012 ............................................................................................................... 165 Figure 133: Indian Population Distribution by Age (%), 2008–2012 ............................................................................................................. 166
Personal Accident and Health Insurance in India, Key Trends and Opportunities to 2018 Page 18
© Timetric. This product is licensed and is not to be photocopied Published: October 2014
LIST OF TABLES
Table 1: Indian Personal Accident and Heath Insurance – Key Facts, 2013.................................................................................................... 2 Table 2: Insurance Industry Definitions .......................................................................................................................................................... 12 Table 3: Indian Insurance Industry – Gross Written Premium by Segment (% Shares), 2009–2018 ............................................................. 19 Table 4: Indian Insurance Industry – Direct Written Premium by Segment (% Shares), 2009–2018.............................................................. 21 Table 5: India – Life Insurance Regulatory Framew ork ................................................................................................................................ 100 Table 6: India – Property Insurance Regulatory Framew ork ........................................................................................................................ 103 Table 7: India – Motor Insurance Regulatory Framew ork ............................................................................................................................ 106 Table 8: India – Premium Rates for Third-Party (TP) Liability Insurance...................................................................................................... 111 Table 9: India – Corporate Income Tax Rates for the Financial Year 2013 – 2014 ...................................................................................... 127 Table 10: India – Other Corporate Tax Rates for the Financial Year 2012–2013......................................................................................... 128 Table 11: India – Changes in Corporate Tax Rates on Implementation of DTC........................................................................................... 128 Table 12: Shares of Key Insurers in Indian Personal Accident and Health Insurance Segment (%), 2013 .................................................. 136 Table 13: New India Assurance Co. Ltd, Key Facts ..................................................................................................................................... 146 Table 14:New India Assurance Co. Ltd, Key Financials (INR Million), 2009-2013 ....................................................................................... 146 Table 15: United India Insurance Co. Ltd, Key Facts ................................................................................................................................... 147 Table 16:United India Insurance Co. Ltd, Key Financials (INR Million), 2009-2013 ..................................................................................... 147 Table 17: National Insurance Co. Ltd, Key Facts ......................................................................................................................................... 148 Table 18:National Insurance Co. Ltd, Key Financials (INR Million), 2009-2013 ........................................................................................... 148 Table 19: ICICI Lombard General Insurance Co. Ltd, Key Facts ................................................................................................................. 149 Table 20:ICICI Lombard General Insurance Co. Ltd, Key Financials (INR Million), 2009-2013 ................................................................... 149 Table 21: Oriental Insurance Company Ltd, Key Facts ................................................................................................................................ 150 Table 22:Oriental Insurance Company Ltd, Key Financials (INR Million), 2009-2013 .................................................................................. 150 Table 23: Star Health & Allied Insurance Co. Ltd, Key Facts ....................................................................................................................... 151 Table 24:Star Health & Allied Insurance Co. Ltd, Key Financials (INR Million), 2009-2013 ......................................................................... 151 Table 25: HDFC Ergo General Insurance Company Ltd, Key Facts ............................................................................................................ 152 Table 26:HDFC Ergo General Insurance Company Ltd, Key Financials (INR Million), 2009-2013 .............................................................. 152 Table 27: Bajaj Allianz General Insurance Co. Ltd, Key Facts ..................................................................................................................... 153 Table 28:Bajaj Allianz General Insurance Co. Ltd, Key Financials (INR Million), 2009-2013 ....................................................................... 153 Table 29: Apollo Munich Health Insurance Company Ltd, Key Facts........................................................................................................... 154 Table 30:Apollo Munich Health Insurance Company Ltd, Key Financials (INR Million), 2009-2013............................................................. 154 Table 31: Reliance General Insurance Company Ltd, Key Facts................................................................................................................. 155 Table 32: Reliance General Insurance Company Ltd, Key Financials (INR Million), 2009-2013 .................................................................. 155