Pershing Holdings UK Limited 2015 - BNY Mellon · 3 Scope of Application 3.1 Company Description...
44
Pershing Holdings (UK) Limited 2015 Pillar 3 Disclosure Page 1 of 44 Pershing Holdings (UK) Limited PILLAR 3 DISCLOSURE DECEMBER 31, 2015
Transcript of Pershing Holdings UK Limited 2015 - BNY Mellon · 3 Scope of Application 3.1 Company Description...
Pershing Holdings (UK) Limited 2015 Pillar 3 Disclosure
Page 1 of 44
Pershing Holdings (UK) Limited
PILLAR 3 DISCLOSURE
DECEMBER 31, 2015
Pershing Holdings (UK) Limited 2015 Pillar 3 Disclosure
Page 2 of 44
Pillar 3 Disclosure Report
December 31, 2015
Table of Contents
1 Overview .................................................................................................................................. 6
1.1 Background ............................................................................................................................... 6
1.2 Disclosure Requirements .............................................................................................................. 6
1.3 Disclosure Policy ....................................................................................................................... 6
1.4 Post Year-end Events ............................................................................................................... 7
2 Key Metrics .............................................................................................................................. 7
3 Scope of Application ............................................................................................................... 7
3.1 Company Description ..................................................................................................................... 7
3.2 Core Business Lines ................................................................................................................. 8
4 Own Funds .................................................................................................................................... 10
5 Capital Requirements ........................................................................................................... 12
5.1 Calculating capital requirements ............................................................................................. 12
6 Risk Management Objectives and Policies ................................................................................. 13
6.1 Risk Governance ..................................................................................................................... 14
6.1.1 Board of Directors ..................................................................................................................... 14
6.1.2 Risk Committees ...................................................................................................................... 14
6.2 Risk Management Framework ............................................................................................. 15
6.3 Risk Appetite Statement .......................................................................................................... 16
6.4 Stress Testing ......................................................................................................................... 17
7 Credit Risk ..................................................................................................................................... 17
7.1 Definition and Identification .................................................................................................. 17
7.2 Management of Credit Risk ................................................................................................. 17
7.3 Governance ......................................................................................................................... 18
7.4 Analysis of past due and impaired exposures ......................................................................... 18
7.5 Credit Risk Mitigation ........................................................................................................... 18
7.5.1 ISDA Master Agreements and Netting ...................................................................................... 19
7.5.2 Collateral Valuation and Management ...................................................................................... 19
7.5.3 Wrong-Way Risk ....................................................................................................................... 19
7.5.4 Credit Risk Concentration ......................................................................................................... 19
7.6 Analysis of Credit Risk ............................................................................................................ 19
7.7 External Credit Rating Agencies .............................................................................................. 23
8 Market Risk ..................................................................................................................................... 27
8.1 Interest Rate Risk – Non-Trade Book ...................................................................................... 27
9 Operational Risk .................................................................................................................... 27
9.1 Operational Risk Management Framework ............................................................................. 27
9.2 Operational Risk Capital Resource Requirement .................................................................... 29
Pershing Holdings (UK) Limited 2015 Pillar 3 Disclosure
Page 3 of 44
10 Leverage Ratio ...................................................................................................................... 29
11 Remuneration Disclosure ..................................................................................................... 30
11.1 Governance ............................................................................................................................... 30
11.2 Aligning Pay with Performance ............................................................................................ 30
11.3 Fixed Remuneration ............................................................................................................ 30
11.4 Variable Compensation Funding and Risk Adjustment ........................................................ 31
11.5 Ratio between Fixed and Variable Pay ................................................................................ 31
11.6 Deferral Policy and Vesting Criteria ..................................................................................... 31
11.7 Variable Remuneration of Control Function Staff ................................................................. 31
11.8 Quantitative Disclosures ...................................................................................................... 31
Pershing Holdings (UK) Limited 2015 Pillar 3 Disclosure
Page 4 of 44
List of Tables
Table 1: Reconciliation of Regulatory Own Funds............................................................................ 10
Table 2: Composition of regulatory Own Funds................................................................................ 11
Table 3: Transitional Own Funds disclosure..................................................................................... 11
Table 4: Capital requirements overview.......................................................................................... 13
Table 5: Credit Risk Pre and Post Credit Risk Mitigation Techniques (CRM).................................. 20
Table 6: Credit Risk Pre CRM Techniques - Standardised Approach by Geographical Area.......... 21
Table 7: Credit Risk Pre CRM Techniques - Standardised Approach by Counterparty Type........... 22
Table 8: Credit Risk Pre CRM Techniques - Standardised Approach by Residual Maturity............ 22
Table 9: Exposures covered by financial and other eligible collateral............................................. 23
Table 10: Mapping of ECAIs credit assessments to credit quality steps.......................................... 23
Table 11: Credit quality steps (CQS) and risk weights..................................................................... 24
Table 12: Credit quality step pre CRM by credit exposure class...................................................... 24
Table 13: Credit quality step post CRM and CCF by credit exposure class.................................... 25
Table 14: Counterparty Credit Risk.................................................................................................. 26
Table 15: Credit valuation adjustment (CVA)................................................................................... 26
Table 16: Market Risk – Standardised Approach............................................................................. 27
Table 17: Leverage Ratio.................................................................................................................. 29
Table 18: Aggregate Remuneration Expenditure for MRTs in 2015 by Business (£000s)............... 32
Table 19: Aggregate Remuneration Expenditure for MRTs by Remuneration Type........................ 32
Table 20: Total Deferred Variable Remuneration for MRTs Outstanding from Previous Years ...... 32
Table 21: Number and Value of New Sign-on and Severance Payments made during 2015.......... 33
Table 22: Number of Individuals being Remunerated EUR 1 million or more ................................. 33
Pershing Holdings (UK) Limited 2015 Pillar 3 Disclosure
Page 5 of 44
List of Appendices
Appendix 1 Liquidity and Other Risks......................................................................................... 34
Regulatory and Compliance Risk .......................................................................................34
Reputation Risk ................................................................................................................... 34
Legal Risk............................................................................................................................ 34
Outsourcing Risk............................................................................................................................. 35
Business Risk ...................................................................................................................................35
Concentration Risk ..........................................................................................................................35
Group Risk...................................................................................................................................... 35
Model Risk....................................................................................................................................... 36
Strategic Risk................................................................................................................................... 36
Country Risk..................................................................................................................................... 36
Appendix 2 Glossary of Terms...................................................................................................... 37
Appendix 3 Supplementary Tables.............................................................................................. 39
Pershing Holdings (UK) Limited 2015 Pillar 3 Disclosure
Page 6 of 44
1 Overview
1.1 Background
This document comprises the Pershing Holdings (UK) Limited and its subsidiary undertakings
(together the “PHUK Group” or “Pershing”) Pillar 3 disclosures on capital and risk management at
31 December 2015. These Pillar 3 disclosures are published in accordance with the requirements of
the Capital Requirements Regulation (CRR) and the Capital Requirements Directive (CRD) referred
to together as CRD IV, which came into effect on 1 January 2014. CRD IV has the effect of
implementing the international Basel III reforms of the Basel Committee on Banking Supervision
within the European Union. The Pillar 3 disclosure requirements are contained in Part Eight of the
CRR, in particular articles 431 to 455.
Pillar 3 disclosures are required for a consolidated group and for those parts of the group covered
by CRD IV. As such, these disclosures have been prepared for the PHUK Group and information in
this report has been prepared solely to meet the Pillar 3 disclosure requirements of the entities
noted, and to provide certain specified information about capital and other risks and details about
the management of those risks, and for no other purpose. These disclosures do not constitute any
form of financial statement of the business nor do they constitute any form of contemporary or
forward looking record or opinion of the business.
1.2 Disclosure Requirements
Pillar 3 requires the external publication of exposures and associated risk weighted assets and the
approach to calculating capital requirements for the following risk and exposure types:
• Credit Risk
• Counterparty Credit Risk
• Market Risk
• Credit Valuation Adjustment
• Securitisations
• Operational Risk
Not all of the above risk and exposure types are relevant to PHUK Group. In accordance with CRD
IV, the Board may omit one or more disclosures if the information provided is not regarded as
material. Accordingly, these Pillar 3 disclosures only focus on those risk and exposure types
relevant to PHUK Group. Furthermore, the Board may omit one or more disclosures if the
information provided is regarded as proprietary or confidential. In such circumstance, the Board will
state in its disclosures the fact that specific items of information are not disclosed and the reason for
non-disclosure.
For completeness, other risks that the PHUK Group is exposed to, but are not covered above, are
also discussed in Appendix 1.
1.3 Disclosure Policy
These disclosures were approved for publication by the PHUK Group’s Board of Directors (“the
Board”) on 29 November 2016.
Disclosure will be made annually based on calendar year end and will be published following the
preparation of the Annual Report and Financial Statements. PHUK will reassess the need to publish
some or all of the disclosures more frequently than annually in light of any significant change to the
relevant characteristics of its business including disclosure about capital resources and adequacy,
and information about risk exposure and other items prone to rapid change.
Pershing Holdings (UK) Limited 2015 Pillar 3 Disclosure
Page 7 of 44
Disclosures will be published on The Bank of New York Mellon group website
(www.bnymellon.com), within the “Investor relations, financial reports, other regulatory filings”
section of the Company’s website.
1.4 Post Year-end Events
In relation to the assessment and monitoring of economic, political and regulatory risks, the
Company is continuing to evaluate the impact of the outcome of the recent referendum in relation to
the UK’s membership of the EU on the company’s business strategy and business risks in the short,
medium and long term. In the short term there is no significant impact expected on the Company’s
business activities, there will be no immediate change in business strategy, and it does not affect
the going concern position of the company. Over the course of the expected two year transition
period following a notification of intention to leave the EU, the Company will continue to closely
monitor developments and will make appropriate changes to the business strategy once the impact
of the referendum result on the UK and European financial services industry is more certain.
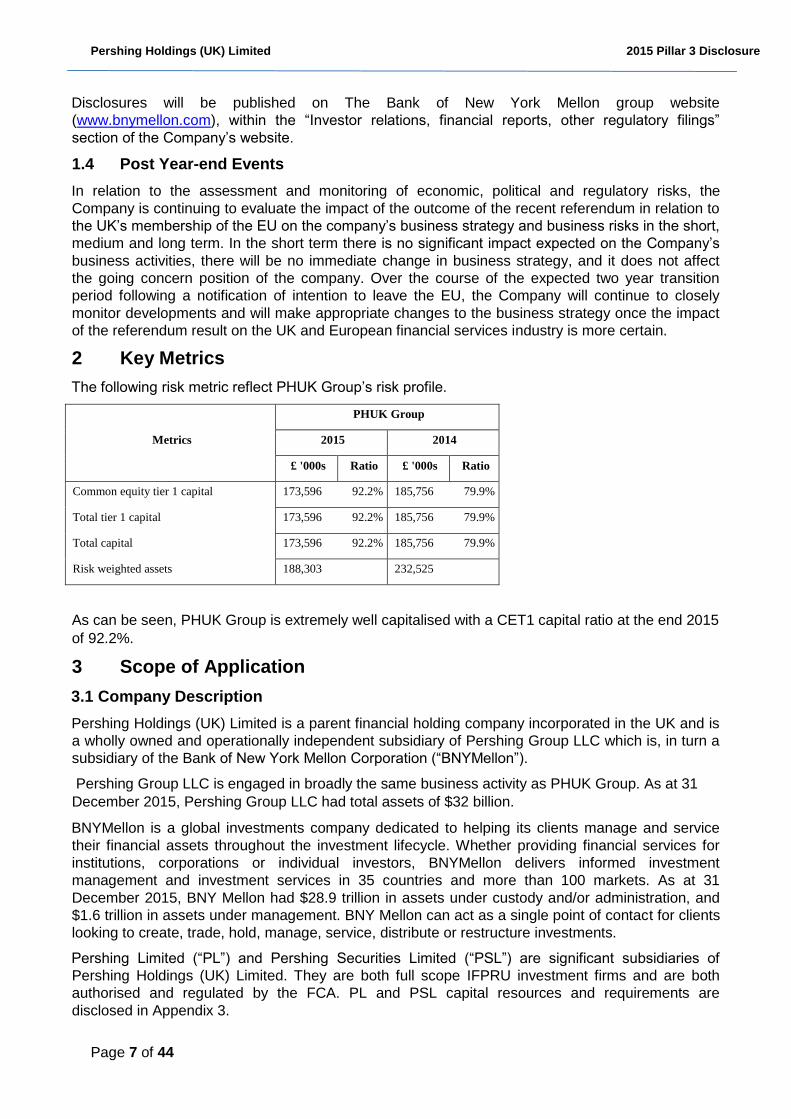
2 Key Metrics
The following risk metric reflect PHUK Group’s risk profile.
Metrics
PHUK Group
2015 2014
£ '000s Ratio £ '000s Ratio
Common equity tier 1 capital 173,596 92.2% 185,756 79.9%
Total tier 1 capital 173,596 92.2% 185,756 79.9%
Total capital 173,596 92.2% 185,756 79.9%
Risk weighted assets 188,303 232,525
As can be seen, PHUK Group is extremely well capitalised with a CET1 capital ratio at the end 2015
of 92.2%.
3 Scope of Application
3.1 Company Description
Pershing Holdings (UK) Limited is a parent financial holding company incorporated in the UK and is
a wholly owned and operationally independent subsidiary of Pershing Group LLC which is, in turn a
subsidiary of the Bank of New York Mellon Corporation (“BNYMellon”).
Pershing Group LLC is engaged in broadly the same business activity as PHUK Group. As at 31
December 2015, Pershing Group LLC had total assets of $32 billion.
BNYMellon is a global investments company dedicated to helping its clients manage and service
their financial assets throughout the investment lifecycle. Whether providing financial services for
institutions, corporations or individual investors, BNYMellon delivers informed investment
management and investment services in 35 countries and more than 100 markets. As at 31
December 2015, BNY Mellon had $28.9 trillion in assets under custody and/or administration, and
$1.6 trillion in assets under management. BNY Mellon can act as a single point of contact for clients
looking to create, trade, hold, manage, service, distribute or restructure investments.
Pershing Limited (“PL”) and Pershing Securities Limited (“PSL”) are significant subsidiaries of
Pershing Holdings (UK) Limited. They are both full scope IFPRU investment firms and are both
authorised and regulated by the FCA. PL and PSL capital resources and requirements are
disclosed in Appendix 3.
Pershing Holdings (UK) Limited 2015 Pillar 3 Disclosure
Page 8 of 44
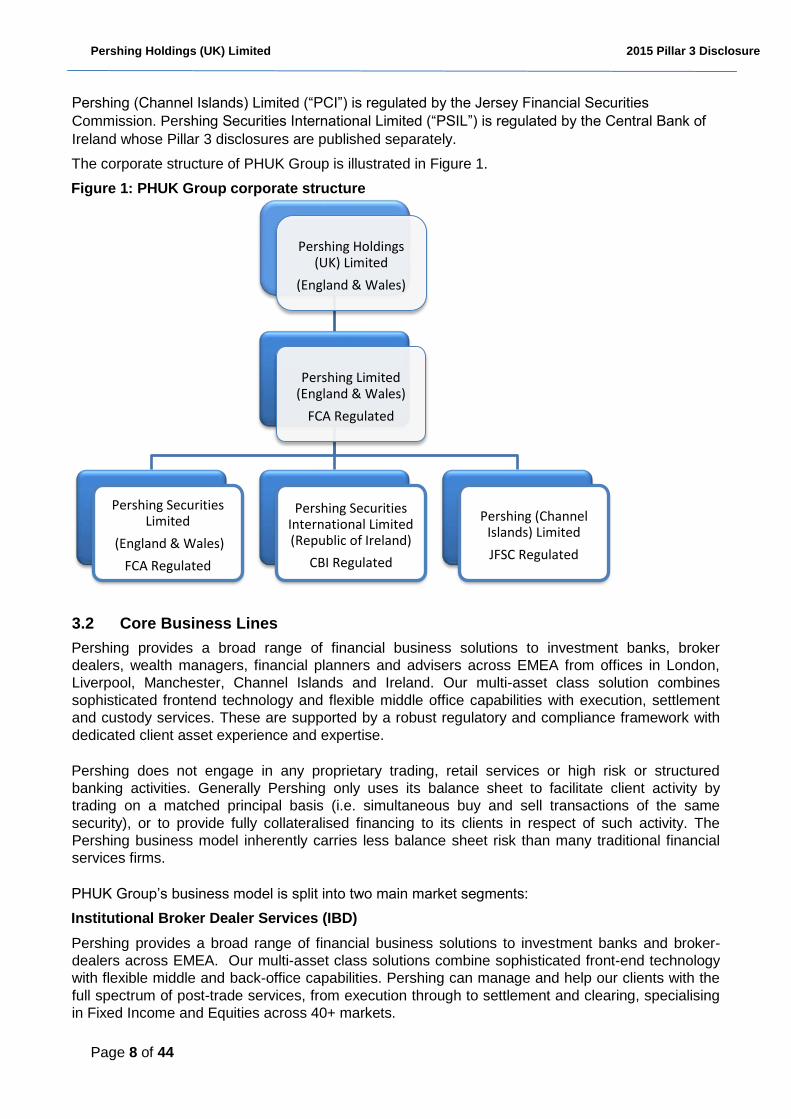
Pershing (Channel Islands) Limited (“PCI”) is regulated by the Jersey Financial Securities
Commission. Pershing Securities International Limited (“PSIL”) is regulated by the Central Bank of
Ireland whose Pillar 3 disclosures are published separately.
The corporate structure of PHUK Group is illustrated in Figure 1.
Figure 1: PHUK Group corporate structure
3.2 Core Business Lines
Pershing provides a broad range of financial business solutions to investment banks, broker
dealers, wealth managers, financial planners and advisers across EMEA from offices in London,
Liverpool, Manchester, Channel Islands and Ireland. Our multi-asset class solution combines
sophisticated frontend technology and flexible middle office capabilities with execution, settlement
and custody services. These are supported by a robust regulatory and compliance framework with
dedicated client asset experience and expertise.
Pershing does not engage in any proprietary trading, retail services or high risk or structured
banking activities. Generally Pershing only uses its balance sheet to facilitate client activity by
trading on a matched principal basis (i.e. simultaneous buy and sell transactions of the same
security), or to provide fully collateralised financing to its clients in respect of such activity. The
Pershing business model inherently carries less balance sheet risk than many traditional financial
services firms.
PHUK Group’s business model is split into two main market segments:
Institutional Broker Dealer Services (IBD)
Pershing provides a broad range of financial business solutions to investment banks and broker-
dealers across EMEA. Our multi-asset class solutions combine sophisticated front-end technology
with flexible middle and back-office capabilities. Pershing can manage and help our clients with the
full spectrum of post-trade services, from execution through to settlement and clearing, specialising
in Fixed Income and Equities across 40+ markets.
Pershing Holdings UK) Limited (
England & Wales) (
Pershing Limited ( England & Wales)
FCA Regulated
Pershing Securities Limited
(England & Wales)
FCA Regulated
Pershing Securities International Limited ( Republic of Ireland)
CBI Regulated
Pershing (Channel Islands) Limited
JFSC Regulated
Pershing Holdings (UK) Limited 2015 Pillar 3 Disclosure
Page 9 of 44
Our clients recognise us as an industry leader in directing them to operate more efficiently by
affording them the facility to outsource any, or all, of their trade life-cycle. Our clients leverage upon
our technology, strength and global stability and as such we have become a trusted and
independent partner to many financial institutions.
We retain our leadership by investing heavily in our technology, so that our customers can be
confident in the knowledge that the functionality and capability of our systems and services will
continually meet their industry needs, whilst simultaneously addressing the ever changing
regulatory landscape, thereby enabling them to focus on their core business proposition and future
proof their corporate positioning.
Wealth and Adviser Solutions (WAS)
Pershing specialises in providing administration and custody services to wealth management
professionals. Many of our clients prefer to outsource back and middle office functions to Pershing
so they can focus on serving their existing clients and developing new business. Clients benefit from
reduced operational costs, Pershing’s expertise in meeting regulatory requirements and from
holding their clients’ assets with the world’s largest global custodian.
Clients include banks, wealth managers, family offices, advisers and “consolidator” platforms that
provide platform services for smaller advisory firms.
Many wealth management firms are large enough to self-clear their business and most will choose
to do this. However, the increasing rate of technological change, transparency in pricing exerting a
downward pressure on charges, and the increasing cost of regulatory demands can reduce profit
margins and so there is a general industry trend for wealth management firms to consider other
ways of working to reduce costs.
Contract bases
Clients contract on a basis appropriate to their business needs, either Model A, B or GlobalClear, as
outlined below.
Model A
Model A business provides the outsourcing of settlement and clearing functions by client firms. All
settlement accounts are maintained in the name of the client and Pershing has no settlement
obligation to any counterparty, except where it is providing a General Clearing Member (“GCM”)
service. Therefore, in all other cases, Pershing is not exposed to any credit and market risk relating
to such activity. Pershing does however have credit exposure as a GCM, as it assumes an
obligation to deliver cash and stock to the Central Counterparty (“CCP”) and is reliant upon
receiving cash or stock from the CCP or client firm.
Model B
The largest portion of Pershing’s business is contracted on a Model B basis where we assume the
settlement obligations of clients and it is Pershing’s name not the clients in the market place. The
main risk exposure from this activity relates to credit risk arising from clients failing to meet their
corresponding obligations to PHUK Group. However the actual exposure is generally limited to any
adverse mark to market movement in the underlying securities and is mitigated through various
techniques and processes, including credit risk monitoring, rights over retained commissions and
cash collateral deposits.
GlobalClear
The GlobalClear Model is designed as an intermediate model. The model utilises key Model A
components where, for non-GCM trades, PHUK Group does not assume the settlement obligations
of clients as we do under Model B. Clients support these trades on their own balance sheet and
PHUK Group is under no obligation to clear such transactions. GlobalClear also utilises key Model B
Pershing Holdings (UK) Limited 2015 Pillar 3 Disclosure
Page 10 of 44
components where the client uses PHUK Group’s network for clearing of GCM trades and PHUK
Group’s settlement network for settlement of GCM and non-GCM transactions. Clients also use
PHUK Group for associated cash and network management.
Nexus Loans
Nexus loans provide a mechanism for investors (including corporate investors) to leverage fully-paid
for securities held in custody with PLC for purpose borrowing. Whilst the loan account gives the
investor access to loans, many investors use their assets to gain leverage as well as using cash to
purchase additional securities.
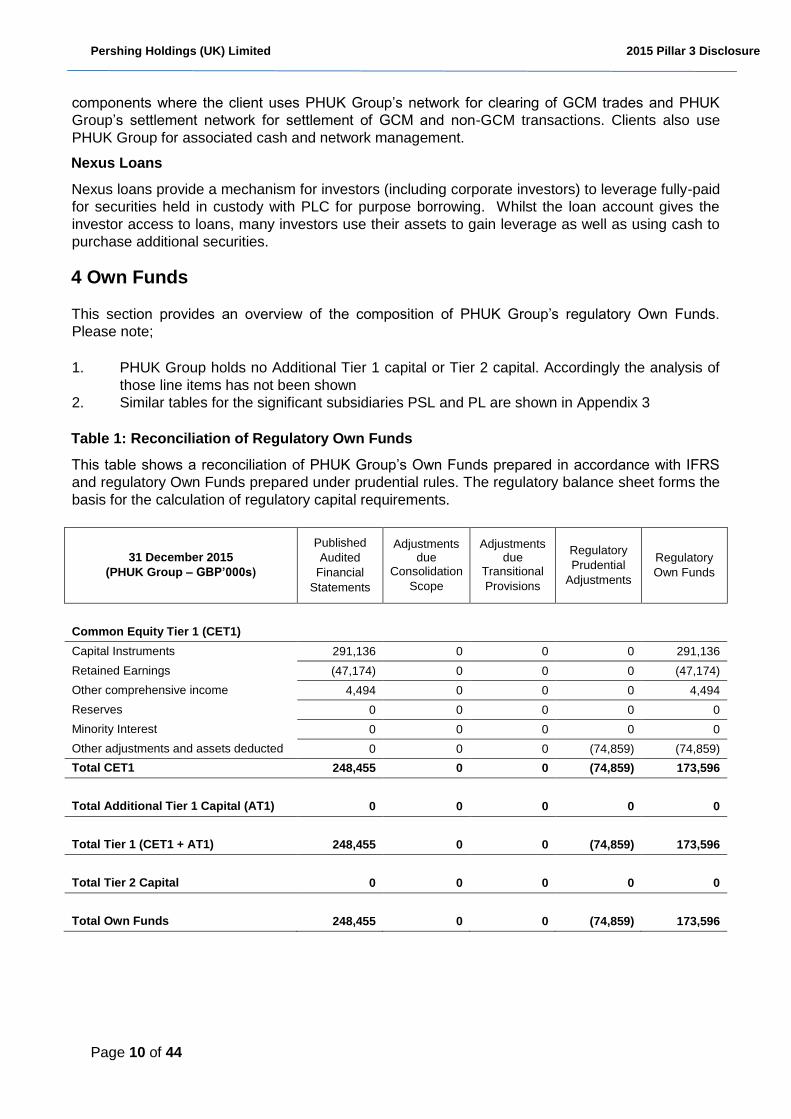
4 Own Funds
This section provides an overview of the composition of PHUK Group’s regulatory Own Funds.
Please note;
1. PHUK Group holds no Additional Tier 1 capital or Tier 2 capital. Accordingly the analysis of
those line items has not been shown
2. Similar tables for the significant subsidiaries PSL and PL are shown in Appendix 3
Table 1: Reconciliation of Regulatory Own Funds
This table shows a reconciliation of PHUK Group’s Own Funds prepared in accordance with IFRS
and regulatory Own Funds prepared under prudential rules. The regulatory balance sheet forms the
basis for the calculation of regulatory capital requirements.
31 December 2015
(PHUK Group – GBP’000s)
Published
Audited
Financial
Statements
Adjustments due
Consolidation
Scope
Adjustments due
Transitional
Provisions
Regulatory
Prudential
Adjustments
Regulatory
Own Funds
Common Equity Tier 1 (CET1)
Capital Instruments 291,136 0 0 0 291,136
Retained Earnings (47,174) 0 0 0 (47,174)
Other comprehensive income 4,494 0 0 0 4,494
Reserves 0 0 0 0 0
Minority Interest 0 0 0 0 0
Other adjustments and assets deducted 0 0 0 (74,859) (74,859)
Total CET1 248,455 0 0 (74,859) 173,596
Total Additional Tier 1 Capital (AT1) 0 0 0 0 0
Total Tier 1 (CET1 + AT1) 248,455 0 0 (74,859) 173,596
Total Tier 2 Capital 0 0 0 0 0
Total Own Funds 248,455 0 0 (74,859) 173,596
Pershing Holdings (UK) Limited 2015 Pillar 3 Disclosure
Page 11 of 44
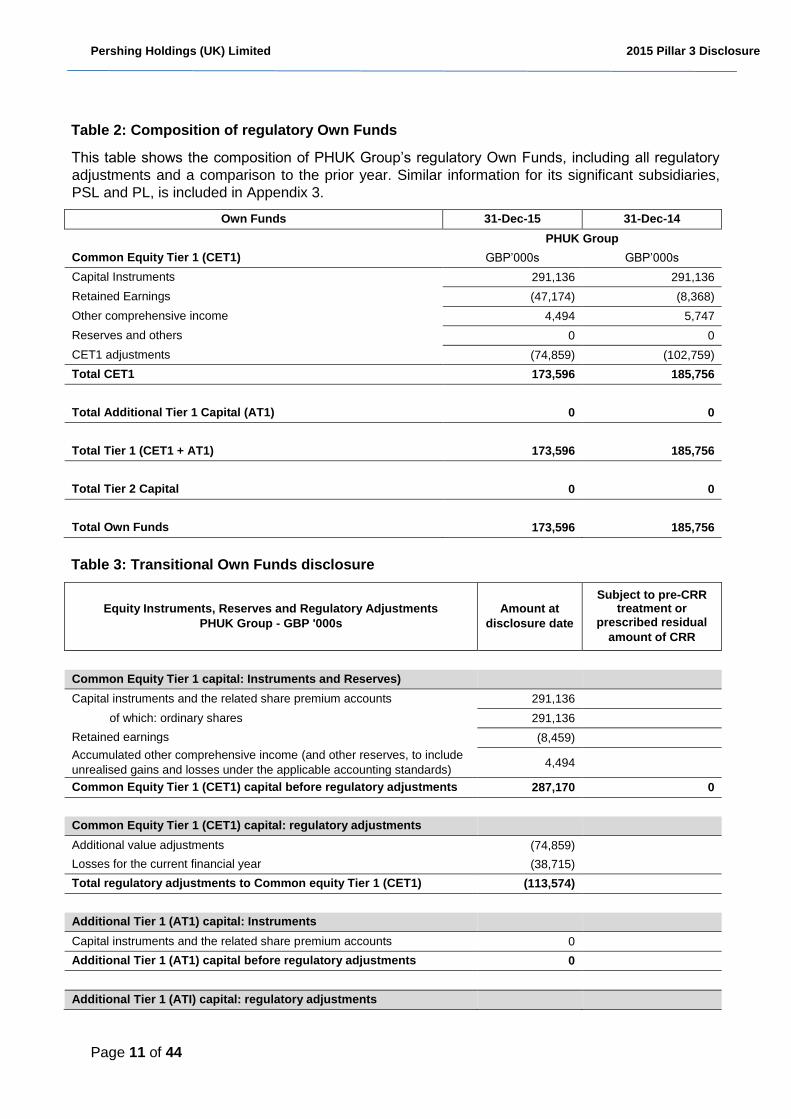
Table 2: Composition of regulatory Own Funds
This table shows the composition of PHUK Group’s regulatory Own Funds, including all regulatory
adjustments and a comparison to the prior year. Similar information for its significant subsidiaries,
PSL and PL, is included in Appendix 3.
Own Funds 31-Dec-15 31-Dec-14
PHUK Group
Common Equity Tier 1 (CET1) GBP’000s GBP’000s
Capital Instruments 291,136 291,136
Retained Earnings (47,174) (8,368)
Other comprehensive income 4,494 5,747
Reserves and others 0 0
CET1 adjustments (74,859) (102,759)
Total CET1 173,596 185,756
Total Additional Tier 1 Capital (AT1) 0 0
Total Tier 1 (CET1 + AT1) 173,596 185,756
Total Tier 2 Capital 0 0
Total Own Funds 173,596 185,756
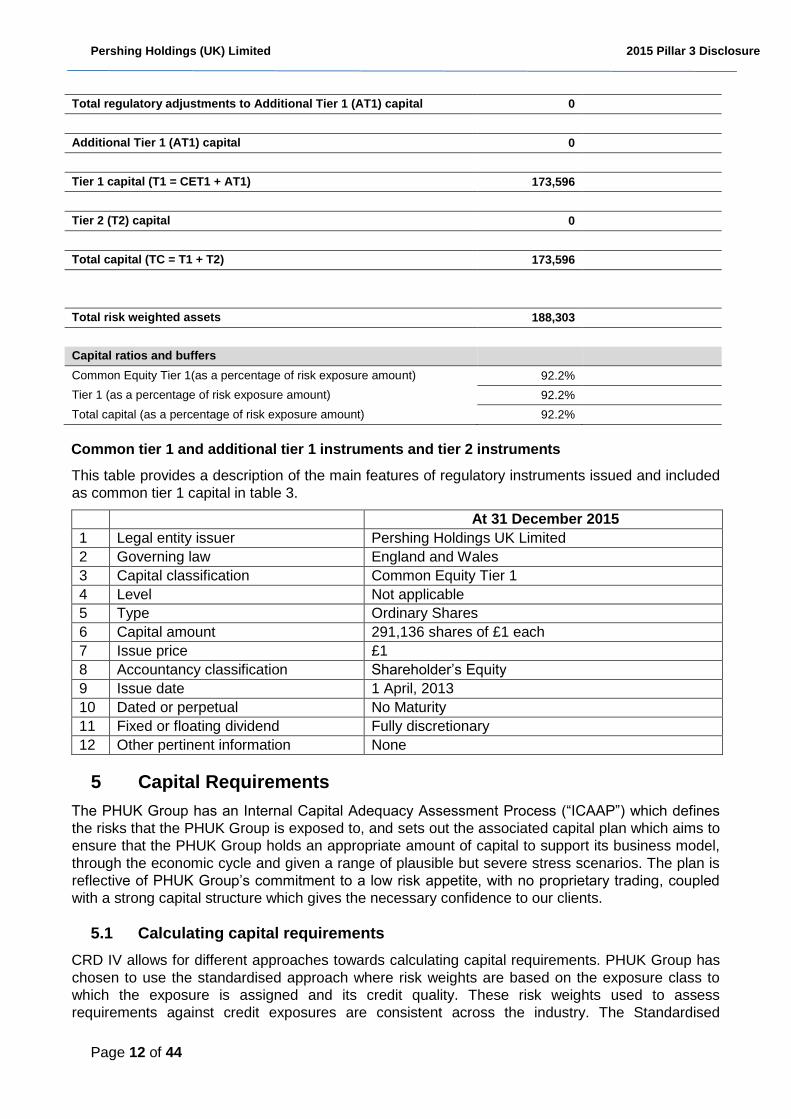
Table 3: Transitional Own Funds disclosure
Equity Instruments, Reserves and Regulatory Adjustments
PHUK Group - GBP '000s
Amount at
disclosure date
Subject to pre-CRR treatment or
prescribed residual
amount of CRR
Common Equity Tier 1 capital: Instruments and Reserves)
Capital instruments and the related share premium accounts 291,136
of which: ordinary shares 291,136
Retained earnings (8,459)
Accumulated other comprehensive income (and other reserves, to include
unrealised gains and losses under the applicable accounting standards) 4,494
Common Equity Tier 1 (CET1) capital before regulatory adjustments 287,170 0
Common Equity Tier 1 (CET1) capital: regulatory adjustments
Additional value adjustments (74,859)
Losses for the current financial year (38,715)
Total regulatory adjustments to Common equity Tier 1 (CET1) (113,574)
Additional Tier 1 (AT1) capital: Instruments
Capital instruments and the related share premium accounts 0
Additional Tier 1 (AT1) capital before regulatory adjustments 0
Additional Tier 1 (ATI) capital: regulatory adjustments
Pershing Holdings (UK) Limited 2015 Pillar 3 Disclosure
Page 12 of 44
Total regulatory adjustments to Additional Tier 1 (AT1) capital 0
Additional Tier 1 (AT1) capital 0
Tier 1 capital (T1 = CET1 + AT1) 173,596
Tier 2 (T2) capital 0
Total capital (TC = T1 + T2) 173,596
Total risk weighted assets 188,303
Capital ratios and buffers
Common Equity Tier 1(as a percentage of risk exposure amount) 92.2%
Tier 1 (as a percentage of risk exposure amount) 92.2%
Total capital (as a percentage of risk exposure amount) 92.2%
Common tier 1 and additional tier 1 instruments and tier 2 instruments
This table provides a description of the main features of regulatory instruments issued and included
as common tier 1 capital in table 3.
At 31 December 2015
1 Legal entity issuer Pershing Holdings UK Limited
2 Governing law England and Wales
3 Capital classification Common Equity Tier 1
4 Level Not applicable
5 Type Ordinary Shares
6 Capital amount 291,136 shares of £1 each
7 Issue price £1
8 Accountancy classification Shareholder’s Equity
9 Issue date 1 April, 2013
10 Dated or perpetual No Maturity
11 Fixed or floating dividend Fully discretionary
12 Other pertinent information None
5 Capital Requirements
The PHUK Group has an Internal Capital Adequacy Assessment Process (“ICAAP”) which defines
the risks that the PHUK Group is exposed to, and sets out the associated capital plan which aims to
ensure that the PHUK Group holds an appropriate amount of capital to support its business model,
through the economic cycle and given a range of plausible but severe stress scenarios. The plan is
reflective of PHUK Group’s commitment to a low risk appetite, with no proprietary trading, coupled
with a strong capital structure which gives the necessary confidence to our clients.
5.1 Calculating capital requirements
CRD IV allows for different approaches towards calculating capital requirements. PHUK Group has
chosen to use the standardised approach where risk weights are based on the exposure class to
which the exposure is assigned and its credit quality. These risk weights used to assess
requirements against credit exposures are consistent across the industry. The Standardised
Pershing Holdings (UK) Limited 2015 Pillar 3 Disclosure
Page 13 of 44
Approach is used for calculating the risk weights assigned to each risk component including Credit
Risk, Counterparty Credit Risk, Market Risk and Operational Risk.
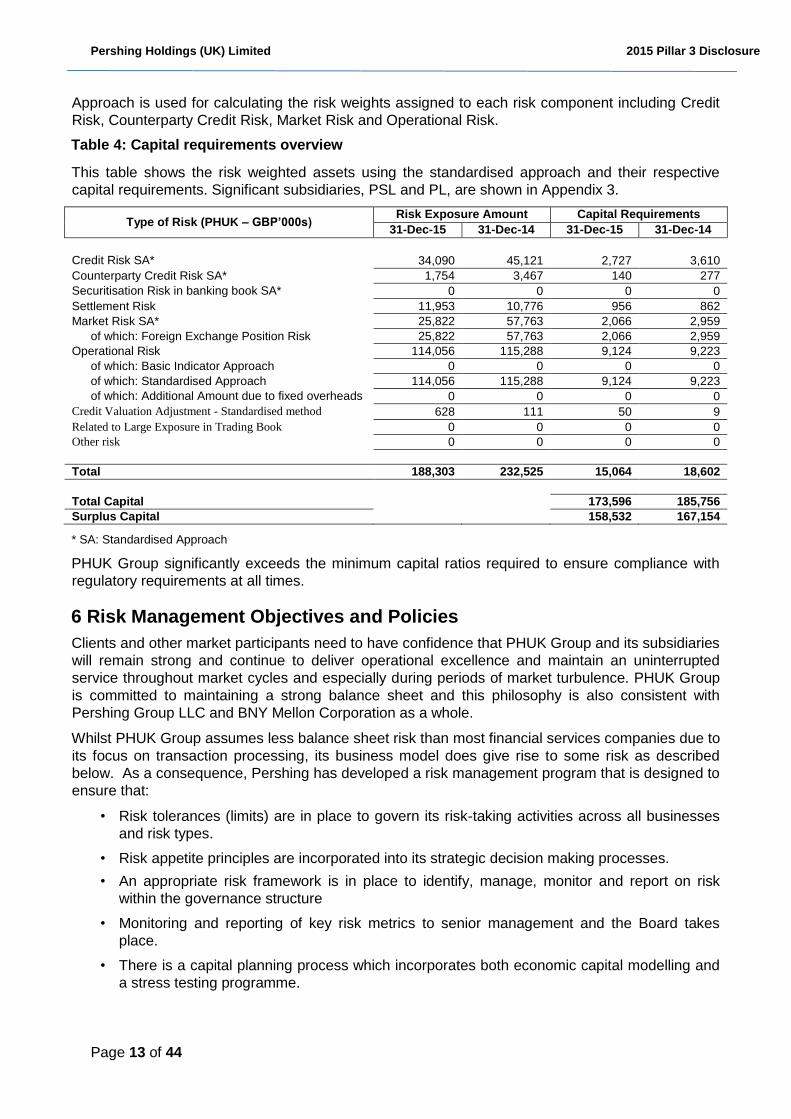
Table 4: Capital requirements overview
This table shows the risk weighted assets using the standardised approach and their respective
capital requirements. Significant subsidiaries, PSL and PL, are shown in Appendix 3.
Type of Risk (PHUK – GBP’000s) Risk Exposure Amount Capital Requirements
31-Dec-15 31-Dec-14 31-Dec-15 31-Dec-14
Credit Risk SA* 34,090 45,121 2,727 3,610
Counterparty Credit Risk SA* 1,754 3,467 140 277
Securitisation Risk in banking book SA* 0 0 0 0
Settlement Risk 11,953 10,776 956 862
Market Risk SA* 25,822 57,763 2,066 2,959
of which: Foreign Exchange Position Risk 25,822 57,763 2,066 2,959
Operational Risk 114,056 115,288 9,124 9,223
of which: Basic Indicator Approach 0 0 0 0
of which: Standardised Approach 114,056 115,288 9,124 9,223
of which: Additional Amount due to fixed overheads 0 0 0 0
Credit Valuation Adjustment - Standardised method 628 111 50 9
Related to Large Exposure in Trading Book 0 0 0 0
Other risk 0 0 0 0
Total 188,303 232,525 15,064 18,602
Total Capital 173,596 185,756
Surplus Capital 158,532 167,154
* SA: Standardised Approach
PHUK Group significantly exceeds the minimum capital ratios required to ensure compliance with
regulatory requirements at all times.
6 Risk Management Objectives and Policies
Clients and other market participants need to have confidence that PHUK Group and its subsidiaries
will remain strong and continue to deliver operational excellence and maintain an uninterrupted
service throughout market cycles and especially during periods of market turbulence. PHUK Group
is committed to maintaining a strong balance sheet and this philosophy is also consistent with
Pershing Group LLC and BNY Mellon Corporation as a whole.
Whilst PHUK Group assumes less balance sheet risk than most financial services companies due to
its focus on transaction processing, its business model does give rise to some risk as described
below. As a consequence, Pershing has developed a risk management program that is designed to
ensure that:
• Risk tolerances (limits) are in place to govern its risk-taking activities across all businesses
and risk types.
• Risk appetite principles are incorporated into its strategic decision making processes.
• An appropriate risk framework is in place to identify, manage, monitor and report on risk
within the governance structure
• Monitoring and reporting of key risk metrics to senior management and the Board takes
place.
• There is a capital planning process which incorporates both economic capital modelling and
a stress testing programme.
Pershing Holdings (UK) Limited 2015 Pillar 3 Disclosure
Page 14 of 44
6.1 Risk Governance
6.1.1 Board of Directors
The main duty and responsibility of the Board is to define the strategy of PHUK Group and to
supervise the management of PHUK Group. Whilst acting autonomously and in accordance with its
legal and regulatory requirements, the Board also aligns PHUK Group’s strategy to that of its
primary shareholder, Pershing Group LLC. The Board has overall responsibility for the
establishment and maintenance of PHUK Group’s risk appetite framework and for the approval of
the risk appetite statement. The Board ensures that strategic business plans are consistent with the
approved risk appetite.
The Board is also responsible for both the management and the oversight of risks, together with the
quality and effectiveness of internal controls, but delegates risk management oversight to general
management, supported by the risk management committees. It is also responsible for reviewing,
challenging and approving all risk management processes including risk identification and
assessment, stress testing and capital adequacy. The various control functions provide further
support for the management of risk within the business.
6.1.2 Risk Committees
PHUK Group Risk Governance
The PHUK Group Board is the senior strategic and decision making body. The Board delegates day
to day responsibility for managing the business to the Executive Committee according to approved
plans, policies and risk appetite.
The Executive Committee further delegates specific responsibilities to various committees to
provide an appropriate oversight and direction to various risk and regulatory processes and
activities, including:
Pershing Risk Committee
The Pershing Risk Committee (PRC) provides senior management oversight to the overall risk
framework and all individual risk types that could potentially impact PHUK Group. The PRC reports
to the Executive Committee and forms a central point for the oversight and management of risk and
the escalation of significant risk issues and events to the Executive Committee and the Board. All
other risk committees report to the PRC to ensure a consistent and holistic reporting of risks and
these include the Operational Risk Committee, Credit and Market Risk Committee, Assets and
Liability Committee, Client Asset Committee, the Business Acceptance Committee, and the Audit
Oversight Committee.
Operational Risk Committee
The Operational Risk Committee (ORC) has oversight of the embedding of the operational risk
framework within PHUK Group. The Operational Risk Management Department is responsible for
providing all necessary support to the ORC to ensure that the framework meets regulatory
requirements and industry best practice in identifying, measuring and reporting on the relevant
operational risks inherent in PHUK Group’s business (including events such as, but not limited to,
technical system failures, disaster events, failed processes or fraud).
Credit and Market Risk Committee
The Credit and Market Risk Committee (C&MRC) oversees the review of all Credit and Market Risk
issues associated with and impacting on business undertaken by PHUK Group.
The Committee’s principal Credit Risk responsibility is to determine and maintain an acceptable
credit exposure to PHUK Group’s clients, as well as to market makers, custodians and banks, within
the limits set by the Boards.
Pershing Holdings (UK) Limited 2015 Pillar 3 Disclosure
Page 15 of 44
Asset and Liability Committee
The Asset and Liability Committee (ALCO) is responsible for overseeing the asset and liability
management activities of the balance sheets of PHUK Group and its subsidiaries, and for ensuring
compliance with all liquidity related regulatory requirements.
Client Asset Committee
The Client Asset Committee is responsible for the oversight and governance of PHUK Group’s
adherence to the FCA, CBI and JFSC custody and client money rules, and reviews the adequacy of
systems and controls in place to identify, segregate, and hold client assets in accordance with
regulatory rules.
Business Acceptance Committee
The Business Acceptance Committee (BAC) is responsible for the review and approval of all new
clients, products/services and material changes to existing processes before they can be executed
or implemented.
Audit Oversight Committee
The Audit Oversight Committee is responsible for providing assurance that key business risks are
being managed and that internal controls are operating effectively, actively soliciting input from
PHUK Group’s risk and control functions, and embedding risk management and control awareness
across the business. The Committee provides a forum to outline management’s expectations for
Internal Audit, as well as monitor and review the effectiveness of PHUK Group’s Internal Audit
function in relation to their role in providing an independent oversight of PHUK Group’s systems and
controls.
In addition, there are specific regional committees as follows:
Irish Compliance and Oversight Committee
The Irish Compliance and Oversight Committee oversees the adherence of PSIL to applicable Irish
laws, guidelines and notices effecting its operations and to fulfil the requirements of the Standards
for Stockbrokers, as issued by the Central Bank of Ireland.
Jersey Compliance and Oversight Committee
The Jersey Compliance and Oversight Committee oversees the adherence of Pershing Channel
Islands Limited to applicable Jersey laws, guidelines and notices effecting its operations and to fulfil
the requirements of the investment firms, as issued by the Jersey Financial Services Commission
6.2 Risk Management Framework
PHUK Group’s risk management framework is designed to:
• Ensure that risks are identified, managed, mitigated, monitored and reported.
• Define and communicate the types and amount of risks to take.
• Ensure that risk-taking activities are consistent with the risk appetite.
• Monitor emerging risks and ensure they are weighed against the risk appetite.
• Promote a strong risk management culture that considers risk-adjusted performance.
Suitable policies and procedures have been adopted by PHUK Group in order to ensure an
appropriate level of risk management is directed at the relevant element of the business.
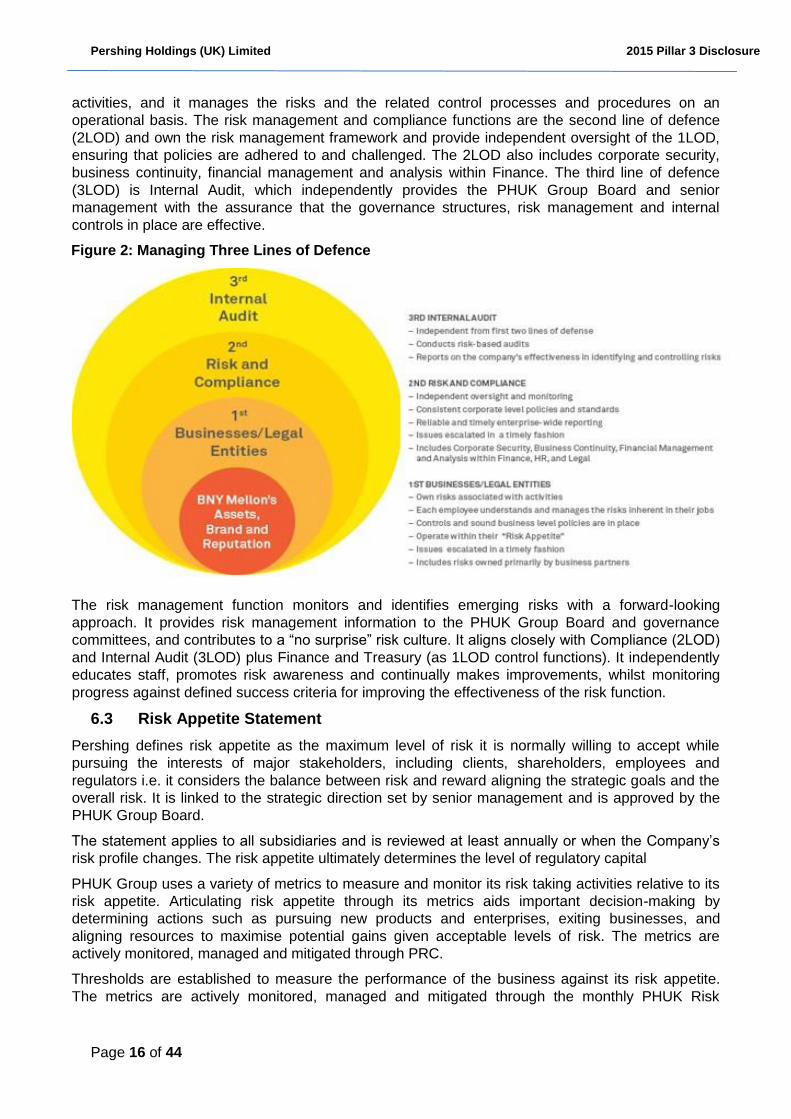
PHUK Group has adopted the ‘Three Lines of Defence’ (3LOD) model in deploying its risk
management framework (figure 2 below). The first line of defence (1LOD) is the business or, in
some cases, business partner level. The business takes and owns the risk associated with its
Pershing Holdings (UK) Limited 2015 Pillar 3 Disclosure
Page 16 of 44
activities, and it manages the risks and the related control processes and procedures on an
operational basis. The risk management and compliance functions are the second line of defence
(2LOD) and own the risk management framework and provide independent oversight of the 1LOD,
ensuring that policies are adhered to and challenged. The 2LOD also includes corporate security,
business continuity, financial management and analysis within Finance. The third line of defence
(3LOD) is Internal Audit, which independently provides the PHUK Group Board and senior
management with the assurance that the governance structures, risk management and internal
controls in place are effective.
Figure 2: Managing Three Lines of Defence
The risk management function monitors and identifies emerging risks with a forward-looking
approach. It provides risk management information to the PHUK Group Board and governance
committees, and contributes to a “no surprise” risk culture. It aligns closely with Compliance (2LOD)
and Internal Audit (3LOD) plus Finance and Treasury (as 1LOD control functions). It independently
educates staff, promotes risk awareness and continually makes improvements, whilst monitoring
progress against defined success criteria for improving the effectiveness of the risk function.
6.3 Risk Appetite Statement
Pershing defines risk appetite as the maximum level of risk it is normally willing to accept while
pursuing the interests of major stakeholders, including clients, shareholders, employees and
regulators i.e. it considers the balance between risk and reward aligning the strategic goals and the
overall risk. It is linked to the strategic direction set by senior management and is approved by the
PHUK Group Board.
The statement applies to all subsidiaries and is reviewed at least annually or when the Company’s
risk profile changes. The risk appetite ultimately determines the level of regulatory capital
PHUK Group uses a variety of metrics to measure and monitor its risk taking activities relative to its
risk appetite. Articulating risk appetite through its metrics aids important decision-making by
determining actions such as pursuing new products and enterprises, exiting businesses, and
aligning resources to maximise potential gains given acceptable levels of risk. The metrics are
actively monitored, managed and mitigated through PRC.
Thresholds are established to measure the performance of the business against its risk appetite.
The metrics are actively monitored, managed and mitigated through the monthly PHUK Risk
Pershing Holdings (UK) Limited 2015 Pillar 3 Disclosure
Page 17 of 44
Committee (PRC), to ensure that the performance of business activities remains within risk
tolerance levels.
6.4 Stress Testing
Stress testing is undertaken at PHUK Group to monitor and quantify risk and ascertain that sufficient
capital resources are held against risks on a forward-looking basis. The process reflects stressed
scenarios that identify an appropriate range of adverse circumstances of varying nature, severity
and duration relevant to PHUK Group’s risk profile. PHUK Group’s stress testing process conclusion
is a statement of the future risk(s) that the business faces, control improvements to mitigate the
impact should the risk arise and where appropriate, a recommendation for capital to be held against
each risk type.
Scenarios are derived from current, emerging, and plausible future risks and strategy, and reviewed,
discussed and agreed by PHUK Group’s Risk Committee and Board.
7 Credit Risk
7.1 Definition and Identification
Credit Risk is the risk of loss arising from counterparties defaulting on their obligations to PHUK
Group.
On balance sheet Credit Risk covers default risk for loans, commitments, securities, receivables and
other assets where the realisation of the value of the asset is dependent on the counterparty’s
ability and willingness to repay its contractual obligations.
Due to the nature of PHUK Group’s business as a provider of clearing and settlement services,
Credit Risk mainly arises from the risk of loss in the event that a client, underlying investor or market
counterparty fails to meet its contractual obligations to pay for a trade, or to deliver securities for
sale. However, the legal structure of the clearing agreements provides PHUK Group with the right
to set-off any indebtedness of underlying clients against any credit balance in the name of the same
underlying client. PHUK Group also has recourse to securities and cash as collateral and
indemnities from client firms in respect of any underlying clients. Consequently, the residual credit
risk (i.e. post mitigation) will devolve to market risk, as the exposure in such cases is the movement
in the underlying stock and foreign currency prices. In addition, Pershing also requires clients to
place a security deposit with PHUK Group to cover this potential mark to market exposure.
Credit Risk also arises from the non-payment of other receivables, cash at bank, loans to third
parties, investment securities and outstanding client invoices and loans to third parties.
7.2 Management of Credit Risk
PHUK Group manages credit risk exposure by a two-stage process:
1) Setting minimum thresholds for the type of client acceptable to PHUK Group in terms of net
worth and business profile, including:
• The type of business to be conducted through PHUK Group (e.g. retail vs. institutional;
agency vs. matched principal);
• Markets and financial instruments in which the client can trade; and
• Any special conditions clients are subject to (e.g. cash on account).
Pershing Holdings (UK) Limited 2015 Pillar 3 Disclosure
Page 18 of 44
Obtaining credit approval for a particular client is the primary responsibility of the business as the
first line of defence alongside guidance and oversight from Credit Risk as the second line. Any new
relationship requires approval from the Business acceptance Committee.
2) Monitoring all exposure (both pre- and post-settlement) on a daily basis against various
limits for its clients, as follows:
• Trade Limit (set per client following analysis of the financial strength, management expertise,
nature of business and expected – or historical – peak and average exposure levels);
• Gross Exposure Limit (calculated with reference to the security deposit and net worth of the
client and utilised as the higher of total purchases or total sales);
• Negative mark to market exposure.
It should also be noted that the metrics supporting the management of credit risk are monitored on a
daily basis and reported to senior management. Breaches are reported to senior management
which may lead to management action such as requesting additional collateral, or requiring the
client to inject additional capital into the business.
7.3 Governance
Governance of credit risk oversight as a second line of defence function is described and controlled
through credit risk policies and day-to-day procedures as follows:
• Credit policy describes the outsourcing of credit risk tasks, defines roles and responsibilities
and requires reporting to be carried out to each business line and entity that the policy
applies to. Any deviation from approved policy requires either senior business or senior legal
entity approval depending on the type of event.
• Approvals for excesses are controlled by a series of credit risk authorities held within credit
policy – each Credit Risk Officer has their own level granted ultimately by the Director, Credit
and Market Risk and acts within those limits when making approvals. If an excess is beyond
the Officer’s approval limit, it is escalated to the Director of Credit Risk.
• Limit excesses are reported in the daily Risk Management Pack and reviewed at the weekly
Credit Committee.
7.4 Analysis of past due and impaired exposures
An aspect of credit risk management relates to problem debt management, which entails early
problem identification through to litigation and recovery of cash where there is no realistic potential
for rehabilitation.
As at 31 December 2015, PHUK Group had no material impaired assets for which a specific or
general provision was required. There were no material assets past due greater than 90 days. PHUK
Group did not incur any material write-offs of bad debts or make any recovery of amounts previously
written off during the year to 31 December 2015.
7.5 Credit Risk Mitigation
PHUK Group mitigates Credit Risk through a variety of strategies including obtaining collateral, and
entering into ISDA Master Agreements with associated netting arrangements.
Pershing Holdings (UK) Limited 2015 Pillar 3 Disclosure
Page 19 of 44
7.5.1 ISDA Master Agreements and Netting
The ISDA Master Agreement incorporates schedules that allow the contracting parties to customise
the terms and conditions to their mutual satisfaction to cover termination events, netting
arrangements, security and other matters.
Netting may take two different forms, close-out netting and settlement netting. Close-out netting
refers to an agreement between PHUK Group and a counterparty that, in the event of a default, the
non-defaulting party can require that:
• A single net payment be made as final settlement to whichever party holds the overall profit
from the contracts; and
• Collateral be liquidated (if held).
Settlement netting requires that all foreign exchange obligations are payable on the same
settlement date, be netted to produce a single payment obligation for each currency traded.
7.5.2 Collateral Valuation and Management
PHUK Group can receive collateral from a counterparty which can include guarantees, cash and
both equity and debt securities and has the ability to call on this collateral in the event of a default
by the counterparty.
Collateral amounts are adjusted on a daily basis to reflect market activity to ensure they continue to
achieve an appropriate mitigation of risk value. Securities are marked-to-market daily and haircuts
are applied to protect PHUK Group in the event of the value of the collateral suddenly reducing in
value due to adverse market conditions. Customer agreements can include requirements for the
provision of additional collateral should valuations decline.
7.5.3 Wrong-Way Risk
PHUK Group takes care to ensure that Wrong-way Risk between collateral and exposures do not
exist. Wrong-way Risk results when the exposure to the counterparty increases when the
counterparty’s credit quality deteriorates.
7.5.4 Credit Risk Concentration
Credit risk mitigation taken by PHUK Group to reduce Credit Risk may result in Credit Risk
Concentration. Credit Concentration Risk results from concentration of exposures to a single
counterparty, borrower or group of connected counterparties or borrowers.
PHUK Group is exposed to Credit Concentration Risk through exchanges and central
counterparties, correspondent banks and issuers of securities. These risks are managed and
mitigated through the establishment of various limits, on-going monitoring of exposure, collateral
and contractual obligations upon the client, including margin calls.
The number of counterparties PHUK Group is willing to place funds with is limited and hence,
Concentration Risk can also arise from cash balances placed with a relatively small number of
counterparties. To mitigate this, exposures are only placed on a very short-term basis, generally
overnight (maximum of 180 days), ensuring ability to withdraw funds in a timely manner.
7.6 Analysis of Credit Risk
Credit risk exposure is computed under the standardised approach which uses external credit
assessment institution ratings and supervisory risk weights supplied by external credit assessment
agencies. The following credit risk exposure tables summarise the credit exposure for PHUK Group
in accordance with the CRD IV requirements.
The following definitions are used in the tables:
Pershing Holdings (UK) Limited 2015 Pillar 3 Disclosure
Page 20 of 44
Exposure at Default (EAD) is defined as the amount expected to be outstanding, after any Credit
Risk Mitigation, if and when a counterparty defaults. Exposure reflects drawn balances as well as
allowance for undrawn amounts of commitments and contingent exposures over a one-year time
horizon. As such, exposure in this context may differ from statutory IFRS accounting balance sheet
carrying values.
Credit Risk Mitigation (CRM) is defined as a technique to reduce the credit risk associated with an
exposure by application of Credit Risk mitigants such as collateral, guarantees and credit protection.
Geographic area is based on the continental location for the counterparty.
Residual maturity is defined as the period outstanding from the reporting date to the maturity or
end date of an exposure.
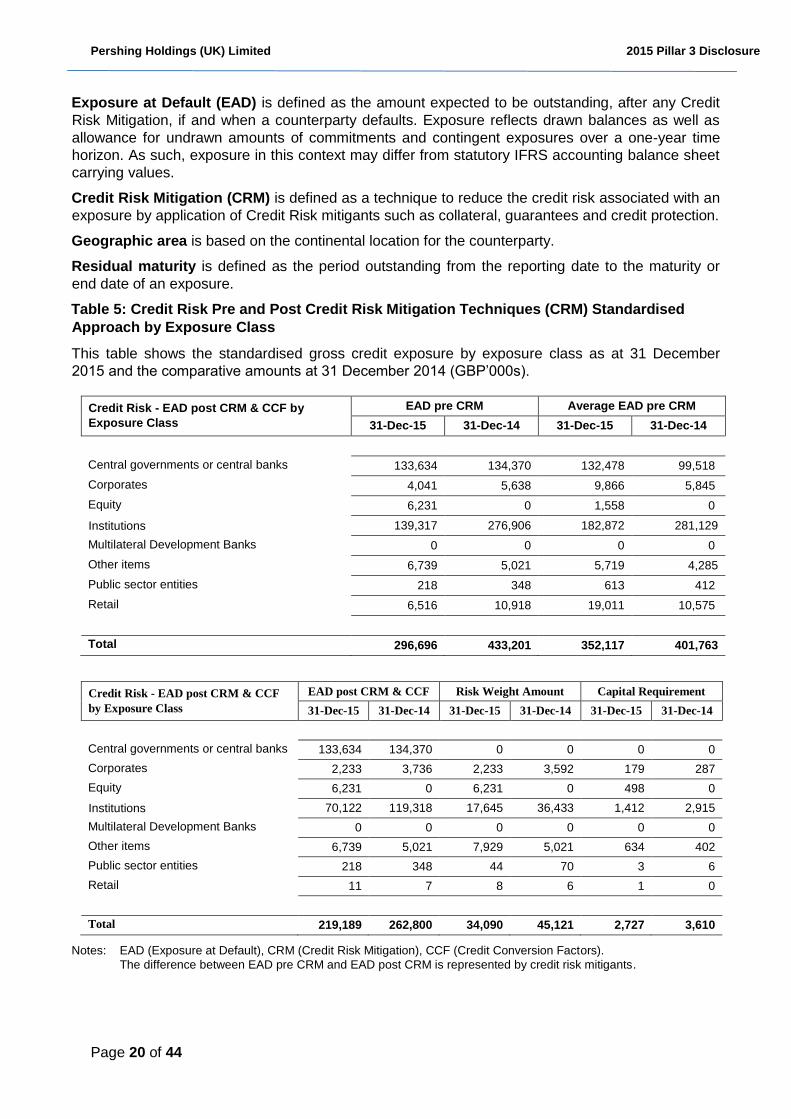
Table 5: Credit Risk Pre and Post Credit Risk Mitigation Techniques (CRM) Standardised
Approach by Exposure Class
This table shows the standardised gross credit exposure by exposure class as at 31 December
2015 and the comparative amounts at 31 December 2014 (GBP’000s).
Credit Risk - EAD post CRM & CCF by
Exposure Class
EAD pre CRM Average EAD pre CRM
31-Dec-15 31-Dec-14 31-Dec-15 31-Dec-14
Central governments or central banks 133,634 134,370 132,478 99,518
Corporates 4,041 5,638 9,866 5,845
Equity 6,231 0 1,558 0
Institutions 139,317 276,906 182,872 281,129
Multilateral Development Banks 0 0 0 0
Other items 6,739 5,021 5,719 4,285
Public sector entities 218 348 613 412
Retail 6,516 10,918 19,011 10,575
Total 296,696 433,201 352,117 401,763
Credit Risk - EAD post CRM & CCF
by Exposure Class
EAD post CRM & CCF Risk Weight Amount Capital Requirement
31-Dec-15 31-Dec-14 31-Dec-15 31-Dec-14 31-Dec-15 31-Dec-14
Central governments or central banks 133,634 134,370 0 0 0 0
Corporates 2,233 3,736 2,233 3,592 179 287
Equity 6,231 0 6,231 0 498 0
Institutions 70,122 119,318 17,645 36,433 1,412 2,915
Multilateral Development Banks 0 0 0 0 0 0
Other items 6,739 5,021 7,929 5,021 634 402
Public sector entities 218 348 44 70 3 6
Retail 11 7 8 6 1 0
Total 219,189 262,800 34,090 45,121 2,727 3,610
Notes: EAD (Exposure at Default), CRM (Credit Risk Mitigation), CCF (Credit Conversion Factors).
The difference between EAD pre CRM and EAD post CRM is represented by credit risk mitigants.
Pershing Holdings (UK) Limited 2015 Pillar 3 Disclosure
Page 21 of 44
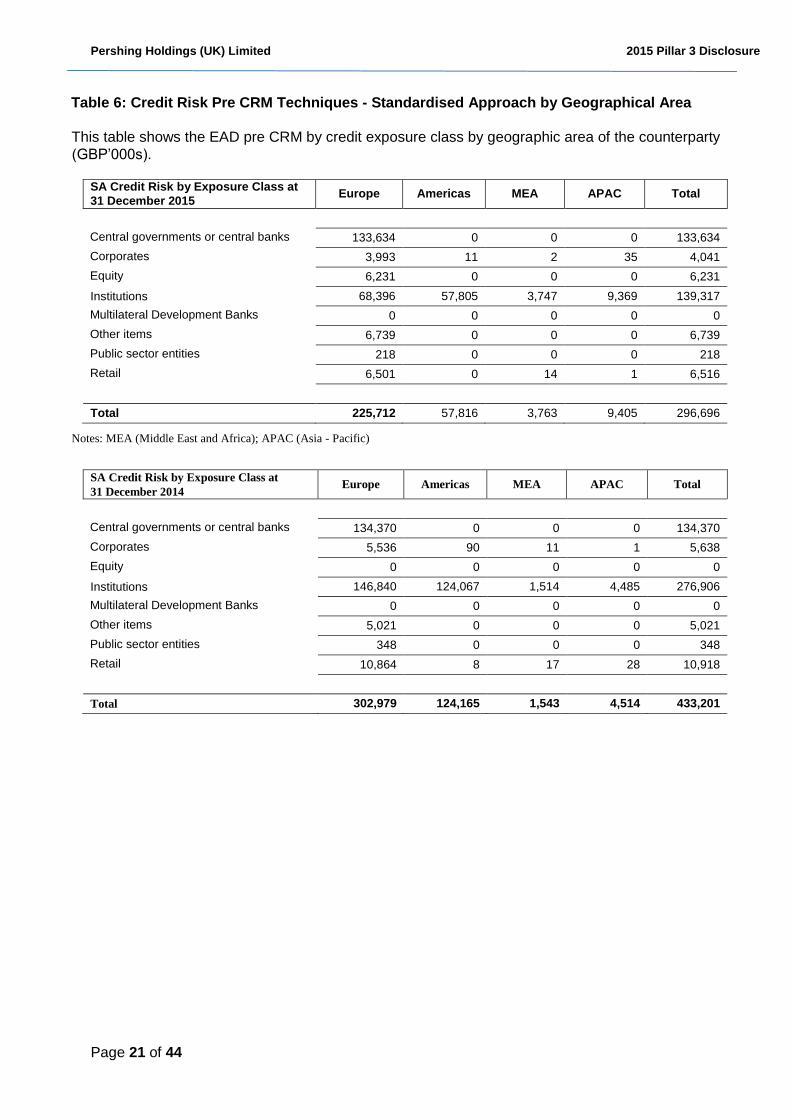
Table 6: Credit Risk Pre CRM Techniques - Standardised Approach by Geographical Area
This table shows the EAD pre CRM by credit exposure class by geographic area of the counterparty
(GBP’000s).
SA Credit Risk by Exposure Class at
31 December 2015 Europe Americas MEA APAC Total
Central governments or central banks 133,634 0 0 0 133,634
Corporates 3,993 11 2 35 4,041
Equity 6,231 0 0 0 6,231
Institutions 68,396 57,805 3,747 9,369 139,317
Multilateral Development Banks 0 0 0 0 0
Other items 6,739 0 0 0 6,739
Public sector entities 218 0 0 0 218
Retail 6,501 0 14 1 6,516
Total 225,712 57,816 3,763 9,405 296,696
Notes: MEA (Middle East and Africa); APAC (Asia - Pacific)
SA Credit Risk by Exposure Class at
31 December 2014 Europe Americas MEA APAC Total
Central governments or central banks 134,370 0 0 0 134,370
Corporates 5,536 90 11 1 5,638
Equity 0 0 0 0 0
Institutions 146,840 124,067 1,514 4,485 276,906
Multilateral Development Banks 0 0 0 0 0
Other items 5,021 0 0 0 5,021
Public sector entities 348 0 0 0 348
Retail 10,864 8 17 28 10,918
Total 302,979 124,165 1,543 4,514 433,201
Pershing Holdings (UK) Limited 2015 Pillar 3 Disclosure
Page 22 of 44
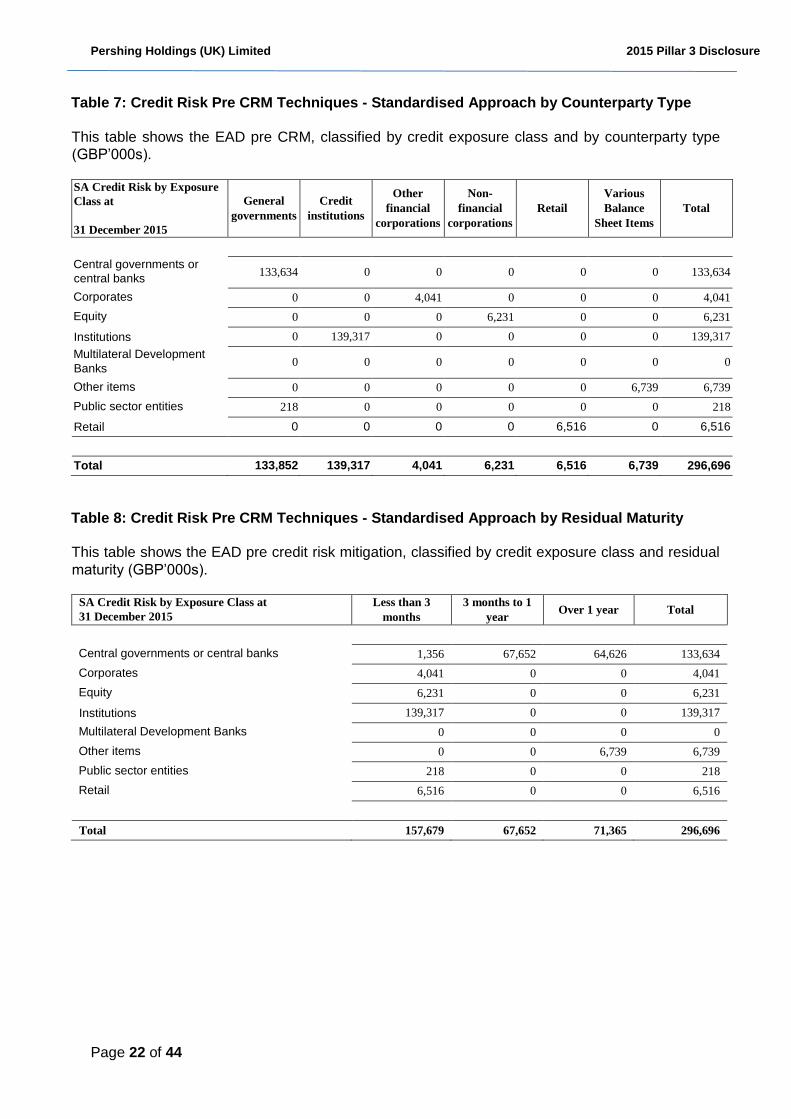
Table 7: Credit Risk Pre CRM Techniques - Standardised Approach by Counterparty Type
This table shows the EAD pre CRM, classified by credit exposure class and by counterparty type
(GBP’000s).
SA Credit Risk by Exposure
Class at
31 December 2015
General
governments Credit
institutions
Other
financial
corporations
Non-
financial
corporations Retail
Various Balance
Sheet Items Total
Central governments or
central banks 133,634 0 0 0 0 0 133,634
Corporates 0 0 4,041 0 0 0 4,041
Equity 0 0 0 6,231 0 0 6,231
Institutions 0 139,317 0 0 0 0 139,317
Multilateral Development
Banks 0 0 0 0 0 0 0
Other items 0 0 0 0 0 6,739 6,739
Public sector entities 218 0 0 0 0 0 218
Retail 0 0 0 0 6,516 0 6,516
Total 133,852 139,317 4,041 6,231 6,516 6,739 296,696
Table 8: Credit Risk Pre CRM Techniques - Standardised Approach by Residual Maturity
This table shows the EAD pre credit risk mitigation, classified by credit exposure class and residual
maturity (GBP’000s).
SA Credit Risk by Exposure Class at
31 December 2015 Less than 3
months 3 months to 1
year Over 1 year Total
Central governments or central banks 1,356 67,652 64,626 133,634
Corporates 4,041 0 0 4,041
Equity 6,231 0 0 6,231
Institutions 139,317 0 0 139,317
Multilateral Development Banks 0 0 0 0
Other items 0 0 6,739 6,739
Public sector entities 218 0 0 218
Retail 6,516 0 0 6,516
Total 157,679 67,652 71,365 296,696
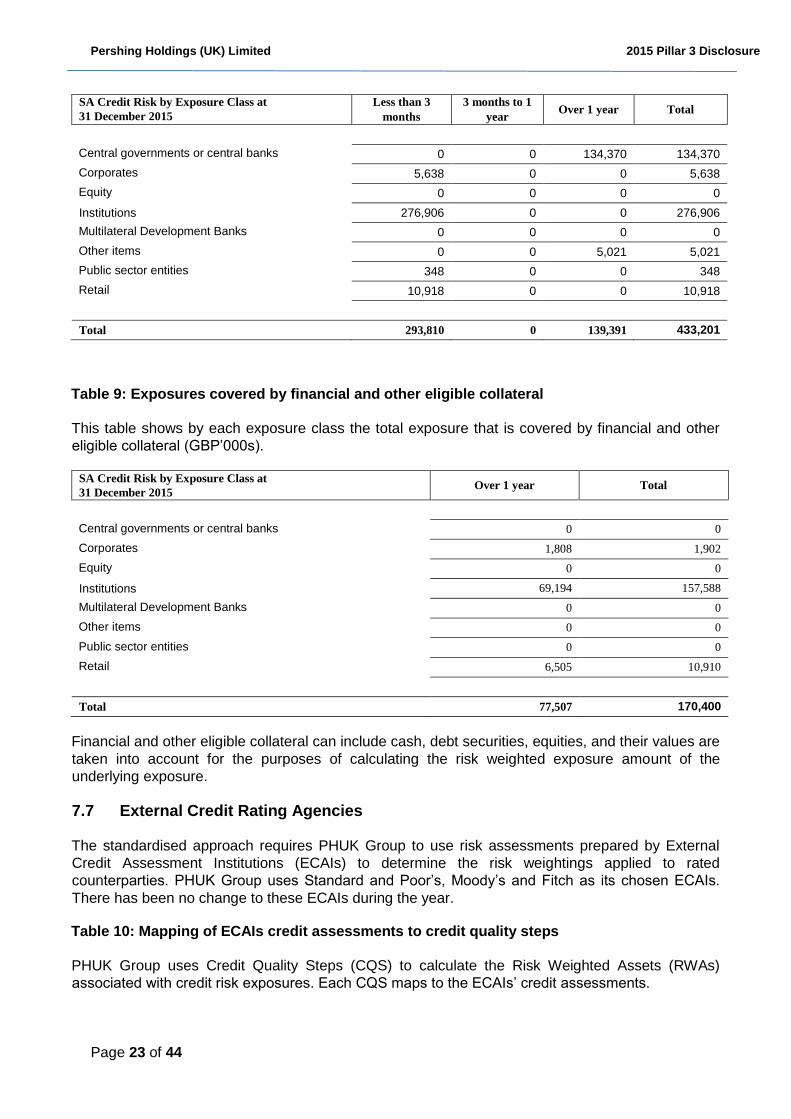
Pershing Holdings (UK) Limited 2015 Pillar 3 Disclosure
Page 23 of 44
SA Credit Risk by Exposure Class at
31 December 2015 Less than 3
months 3 months to 1
year Over 1 year Total
Central governments or central banks 0 0 134,370 134,370
Corporates 5,638 0 0 5,638
Equity 0 0 0 0
Institutions 276,906 0 0 276,906
Multilateral Development Banks 0 0 0 0
Other items 0 0 5,021 5,021
Public sector entities 348 0 0 348
Retail 10,918 0 0 10,918
Total 293,810 0 139,391 433,201
Table 9: Exposures covered by financial and other eligible collateral
This table shows by each exposure class the total exposure that is covered by financial and other
eligible collateral (GBP’000s).
SA Credit Risk by Exposure Class at
31 December 2015 Over 1 year Total
Central governments or central banks 0 0
Corporates 1,808 1,902
Equity 0 0
Institutions 69,194 157,588
Multilateral Development Banks 0 0
Other items 0 0
Public sector entities 0 0
Retail 6,505 10,910
Total 77,507 170,400
Financial and other eligible collateral can include cash, debt securities, equities, and their values are
taken into account for the purposes of calculating the risk weighted exposure amount of the
underlying exposure.
7.7 External Credit Rating Agencies
The standardised approach requires PHUK Group to use risk assessments prepared by External
Credit Assessment Institutions (ECAIs) to determine the risk weightings applied to rated
counterparties. PHUK Group uses Standard and Poor’s, Moody’s and Fitch as its chosen ECAIs.
There has been no change to these ECAIs during the year.
Table 10: Mapping of ECAIs credit assessments to credit quality steps
PHUK Group uses Credit Quality Steps (CQS) to calculate the Risk Weighted Assets (RWAs)
associated with credit risk exposures. Each CQS maps to the ECAIs’ credit assessments.
Pershing Holdings (UK) Limited 2015 Pillar 3 Disclosure
Page 24 of 44
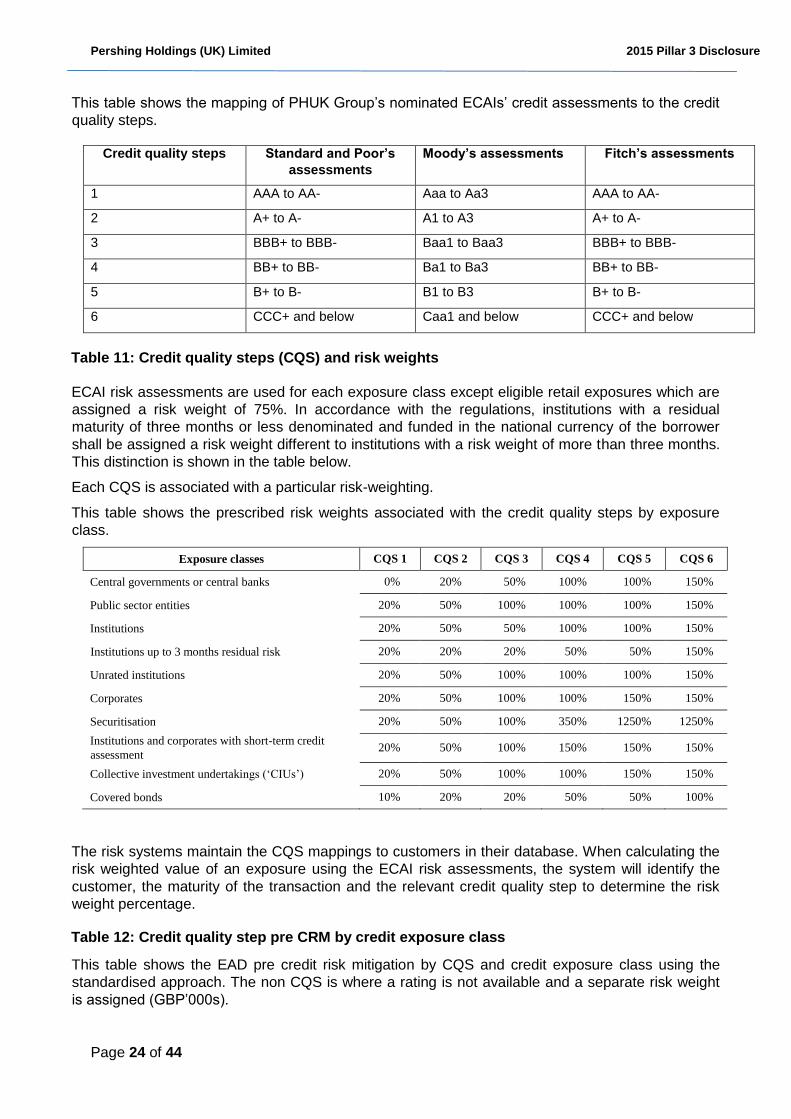
This table shows the mapping of PHUK Group’s nominated ECAIs’ credit assessments to the credit
quality steps.
Credit quality steps Standard and Poor’s
assessments Moody’s assessments Fitch’s assessments
1 AAA to AA- Aaa to Aa3 AAA to AA-
2 A+ to A- A1 to A3 A+ to A-
3 BBB+ to BBB- Baa1 to Baa3 BBB+ to BBB-
4 BB+ to BB- Ba1 to Ba3 BB+ to BB-
5 B+ to B- B1 to B3 B+ to B-
6 CCC+ and below Caa1 and below CCC+ and below
Table 11: Credit quality steps (CQS) and risk weights
ECAI risk assessments are used for each exposure class except eligible retail exposures which are
assigned a risk weight of 75%. In accordance with the regulations, institutions with a residual
maturity of three months or less denominated and funded in the national currency of the borrower
shall be assigned a risk weight different to institutions with a risk weight of more than three months.
This distinction is shown in the table below.
Each CQS is associated with a particular risk-weighting.
This table shows the prescribed risk weights associated with the credit quality steps by exposure
class.
Exposure classes CQS 1 CQS 2 CQS 3 CQS 4 CQS 5 CQS 6
Central governments or central banks 0% 20% 50% 100% 100% 150%
Public sector entities 20% 50% 100% 100% 100% 150%
Institutions 20% 50% 50% 100% 100% 150%
Institutions up to 3 months residual risk 20% 20% 20% 50% 50% 150%
Unrated institutions 20% 50% 100% 100% 100% 150%
Corporates 20% 50% 100% 100% 150% 150%
Securitisation 20% 50% 100% 350% 1250% 1250%
Institutions and corporates with short-term credit
assessment 20% 50% 100% 150% 150% 150%
Collective investment undertakings (‘CIUs’) 20% 50% 100% 100% 150% 150%
Covered bonds 10% 20% 20% 50% 50% 100%
The risk systems maintain the CQS mappings to customers in their database. When calculating the
risk weighted value of an exposure using the ECAI risk assessments, the system will identify the
customer, the maturity of the transaction and the relevant credit quality step to determine the risk
weight percentage.
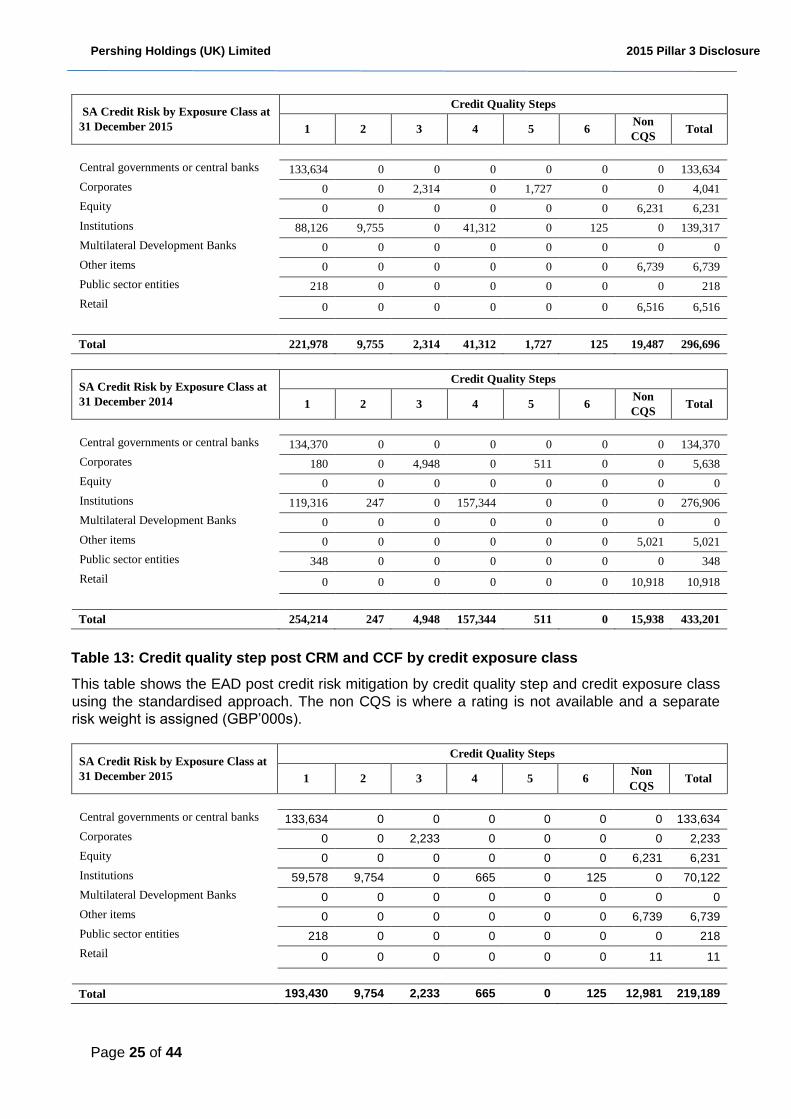
Table 12: Credit quality step pre CRM by credit exposure class
This table shows the EAD pre credit risk mitigation by CQS and credit exposure class using the
standardised approach. The non CQS is where a rating is not available and a separate risk weight
is assigned (GBP’000s).
Pershing Holdings (UK) Limited 2015 Pillar 3 Disclosure
Page 25 of 44
SA Credit Risk by Exposure Class at
31 December 2015
Credit Quality Steps
1 2 3 4 5 6 Non
CQS Total
Central governments or central banks 133,634 0 0 0 0 0 0 133,634
Corporates 0 0 2,314 0 1,727 0 0 4,041
Equity 0 0 0 0 0 0 6,231 6,231
Institutions 88,126 9,755 0 41,312 0 125 0 139,317
Multilateral Development Banks 0 0 0 0 0 0 0 0
Other items 0 0 0 0 0 0 6,739 6,739
Public sector entities 218 0 0 0 0 0 0 218
Retail 0 0 0 0 0 0 6,516 6,516
Total 221,978 9,755 2,314 41,312 1,727 125 19,487 296,696
SA Credit Risk by Exposure Class at
31 December 2014
Credit Quality Steps
1 2 3 4 5 6 Non
CQS Total
Central governments or central banks 134,370 0 0 0 0 0 0 134,370
Corporates 180 0 4,948 0 511 0 0 5,638
Equity 0 0 0 0 0 0 0 0
Institutions 119,316 247 0 157,344 0 0 0 276,906
Multilateral Development Banks 0 0 0 0 0 0 0 0
Other items 0 0 0 0 0 0 5,021 5,021
Public sector entities 348 0 0 0 0 0 0 348
Retail 0 0 0 0 0 0 10,918 10,918
Total 254,214 247 4,948 157,344 511 0 15,938 433,201
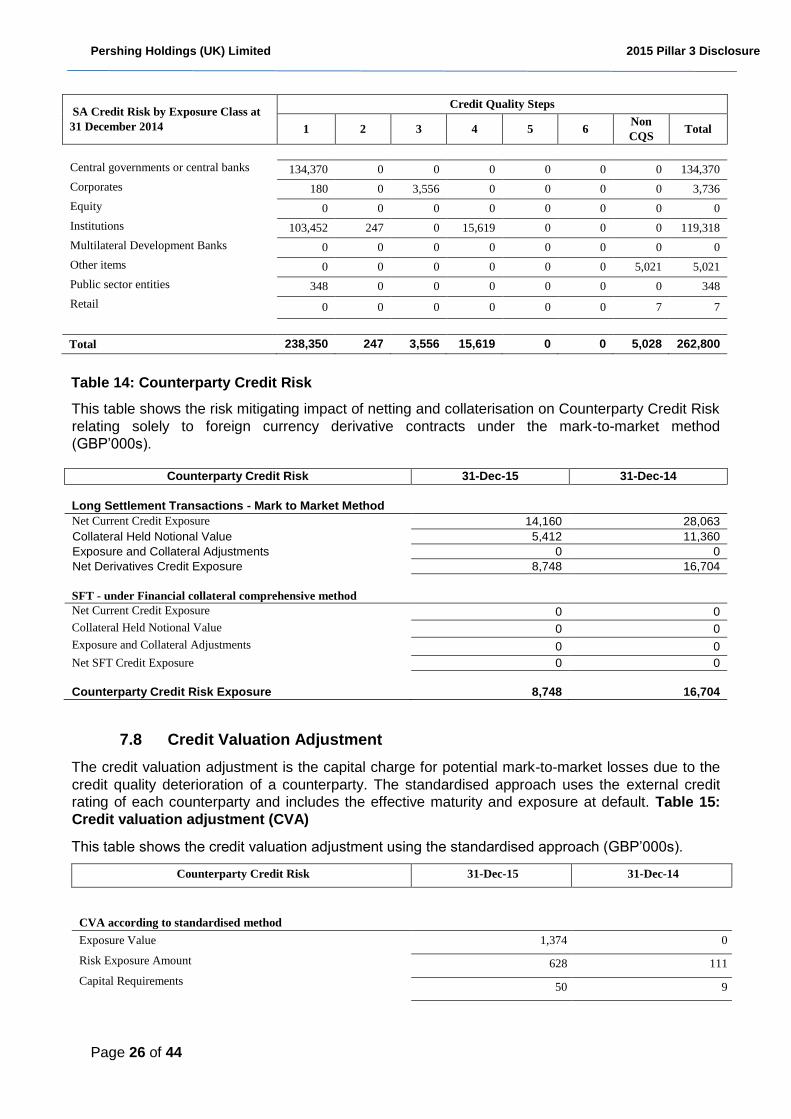
Table 13: Credit quality step post CRM and CCF by credit exposure class
This table shows the EAD post credit risk mitigation by credit quality step and credit exposure class
using the standardised approach. The non CQS is where a rating is not available and a separate
risk weight is assigned (GBP’000s).
SA Credit Risk by Exposure Class at
31 December 2015
Credit Quality Steps
1 2 3 4 5 6 Non
CQS Total
Central governments or central banks 133,634 0 0 0 0 0 0 133,634
Corporates 0 0 2,233 0 0 0 0 2,233
Equity 0 0 0 0 0 0 6,231 6,231
Institutions 59,578 9,754 0 665 0 125 0 70,122
Multilateral Development Banks 0 0 0 0 0 0 0 0
Other items 0 0 0 0 0 0 6,739 6,739
Public sector entities 218 0 0 0 0 0 0 218
Retail 0 0 0 0 0 0 11 11
Total 193,430 9,754 2,233 665 0 125 12,981 219,189
Pershing Holdings (UK) Limited 2015 Pillar 3 Disclosure
Page 26 of 44
SA Credit Risk by Exposure Class at
31 December 2014
Credit Quality Steps
1 2 3 4 5 6 Non
CQS Total
Central governments or central banks 134,370 0 0 0 0 0 0 134,370
Corporates 180 0 3,556 0 0 0 0 3,736
Equity 0 0 0 0 0 0 0 0
Institutions 103,452 247 0 15,619 0 0 0 119,318
Multilateral Development Banks 0 0 0 0 0 0 0 0
Other items 0 0 0 0 0 0 5,021 5,021
Public sector entities 348 0 0 0 0 0 0 348
Retail 0 0 0 0 0 0 7 7
Total 238,350 247 3,556 15,619 0 0 5,028 262,800
Table 14: Counterparty Credit Risk
This table shows the risk mitigating impact of netting and collaterisation on Counterparty Credit Risk
relating solely to foreign currency derivative contracts under the mark-to-market method
(GBP’000s).
Counterparty Credit Risk 31-Dec-15 31-Dec-14
Long Settlement Transactions - Mark to Market Method
Net Current Credit Exposure 14,160 28,063
Collateral Held Notional Value 5,412 11,360
Exposure and Collateral Adjustments 0 0
Net Derivatives Credit Exposure 8,748 16,704
SFT - under Financial collateral comprehensive method
Net Current Credit Exposure 0 0
Collateral Held Notional Value 0 0
Exposure and Collateral Adjustments 0 0
Net SFT Credit Exposure 0 0
Counterparty Credit Risk Exposure 8,748 16,704
7.8 Credit Valuation Adjustment
The credit valuation adjustment is the capital charge for potential mark-to-market losses due to the
credit quality deterioration of a counterparty. The standardised approach uses the external credit
rating of each counterparty and includes the effective maturity and exposure at default. Table 15:
Credit valuation adjustment (CVA)
This table shows the credit valuation adjustment using the standardised approach (GBP’000s).
Counterparty Credit Risk 31-Dec-15 31-Dec-14
CVA according to standardised method
Exposure Value
Risk Exposure Amount
Capital Requirements
1,374 0
628 111
50 9
Pershing Holdings (UK) Limited 2015 Pillar 3 Disclosure
Page 27 of 44
8 Market Risk
Market Risk is defined as the risk of adverse change to the economic condition of PHUK Group due
to variations in prices, rates, implied volatilities, or correlations of Market Risk factors. Market Risk
factors include but are not limited to interest rates, foreign exchange rates, market liquidity and
equity prices.
By simply executing orders on behalf of its clients, the PHUK Group business model does not result
in any proprietary trading or high risk investments. However it does act as a riskless principal
between its clients and the market which results from time to time in a small position, including in
foreign exchange, and which is traded out on an expedited basis. The PHUK Group Credit and
Market Risk Committee set small overall limits for foreign exchange positions resulting from client-
generated exposure. PHUK Group’s exposure to Market Risk mainly arises from Foreign Exchange
(FX) Risk arising from its Euro investment in PSIL, and non-traded Interest Rate Risk, arising from
its investment in Government securities held to satisfy FCA requirements in respect of the Liquid
Asset Buffer (LAB).
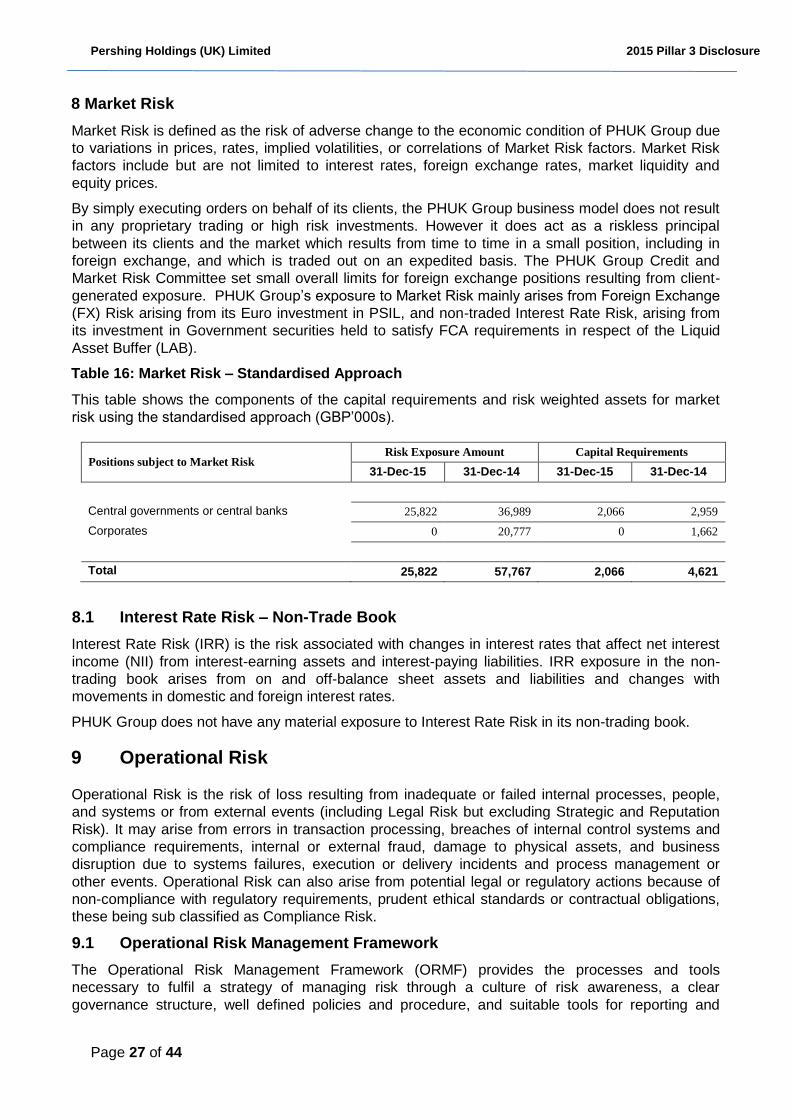
Table 16: Market Risk – Standardised Approach
This table shows the components of the capital requirements and risk weighted assets for market
risk using the standardised approach (GBP’000s).
Positions subject to Market Risk Risk Exposure Amount Capital Requirements
31-Dec-15 31-Dec-14 31-Dec-15 31-Dec-14
Central governments or central banks 25,822 36,989 2,066 2,959
Corporates 0 20,777 0 1,662
Total 25,822 57,767 2,066 4,621
8.1 Interest Rate Risk – Non-Trade Book
Interest Rate Risk (IRR) is the risk associated with changes in interest rates that affect net interest
income (NII) from interest-earning assets and interest-paying liabilities. IRR exposure in the non-
trading book arises from on and off-balance sheet assets and liabilities and changes with
movements in domestic and foreign interest rates.
PHUK Group does not have any material exposure to Interest Rate Risk in its non-trading book.
9 Operational Risk
Operational Risk is the risk of loss resulting from inadequate or failed internal processes, people,
and systems or from external events (including Legal Risk but excluding Strategic and Reputation
Risk). It may arise from errors in transaction processing, breaches of internal control systems and
compliance requirements, internal or external fraud, damage to physical assets, and business
disruption due to systems failures, execution or delivery incidents and process management or
other events. Operational Risk can also arise from potential legal or regulatory actions because of
non-compliance with regulatory requirements, prudent ethical standards or contractual obligations,
these being sub classified as Compliance Risk.
9.1 Operational Risk Management Framework
The Operational Risk Management Framework (ORMF) provides the processes and tools
necessary to fulfil a strategy of managing risk through a culture of risk awareness, a clear
governance structure, well defined policies and procedure, and suitable tools for reporting and
Pershing Holdings (UK) Limited 2015 Pillar 3 Disclosure
Page 28 of 44
monitoring to effectively identify, manage, mitigate, monitor and report the risks in an organised way
to the appropriate governance bodies. PHUK Group has set a risk appetite statement which
recognises the inherent nature of Operational Risk and the reliance on the ORMF to mitigate it.
The ORMF defines roles and responsibilities for managing risk, using the three lines of defence
model as a foundation. Thus, responsibility for the management of Operational Risk sits first and
foremost with the business and support functions as the first line of defence, where ownership and
accountability for the identification, assessment and management of risks that arise through the
course of its business and service provision reside.
The second line of defence, being the independent Operational Risk Management function, is
responsible for reviewing and challenging the risks identified, assessed and managed by the first
line of defence. The Operational Risk function is also responsible for building and maintaining the
ORMF framework and partnering the first line of defence to enable them to embed it within their
normal business processes.
The third line is Internal Audit, which is organizationally independent from both the first and second
line of defence. A key responsibility of the third line as it pertains to the ORMF is to opine on the
adequacy of the framework and governance process.
The mechanisms for identifying and managing operational risk include but are not limited to:
• Operational Risk Events (OREs) – A standard for the capture, notification and reporting of
OREs. The collection of internal loss data provides information for assessing the company’s
exposure to Operational Risk. Analysis of loss events provides insight into the root cause
and information on whether a control weakness is isolated or potentially more systemic.
• Risk & Control Self-Assessments – A comprehensive process for business groups and
select business partners to identify risks associated with key business processes, identifying
and assessing the quality of controls in place to mitigate risk and assigning accountability for
the effective operation of those controls in place to mitigate that risk.
• Key Risk Indicators (KRIs) – The use of key metrics designed to monitor risks which could
cause financial loss, adverse consequences or reputation damage to the Company. Periodic
and consistent monitoring of KRIs ensures that deviations from predetermined standards
can be identified, managed and mitigated.
• Operational Risk Scenario Analysis - Operational risk scenario analysis is used to forecast
the significant forward looking operational risks by combining operational risk data with
expert management judgement.
These risk management processes are mandated through individual Operational Risk Polices.
PHUK Group also uses the BNYMellon group system of record, the Risk Management Platform
(RMP), to facilitate many of these processes.
PHUK Group also maintains a risk register which captures the most material risks associated with
the business undertaken and the risk mitigations currently in place. The risk register is updated on a
monthly basis.
Current issues, emerging and top risks, adverse KRIs and OREs (>$10,000) are reported to the
PHUK Group Risk Committee
Risk managers are assigned to oversee the risk management activities undertaken in the business
of PHUK Group. Besides the operational risk function, other internal functions also ensure that
processes are in place to support the sound operational risk management of the business e.g.
Information Risk Management and Business Continuity Planning.
Pershing Holdings (UK) Limited 2015 Pillar 3 Disclosure
Page 29 of 44
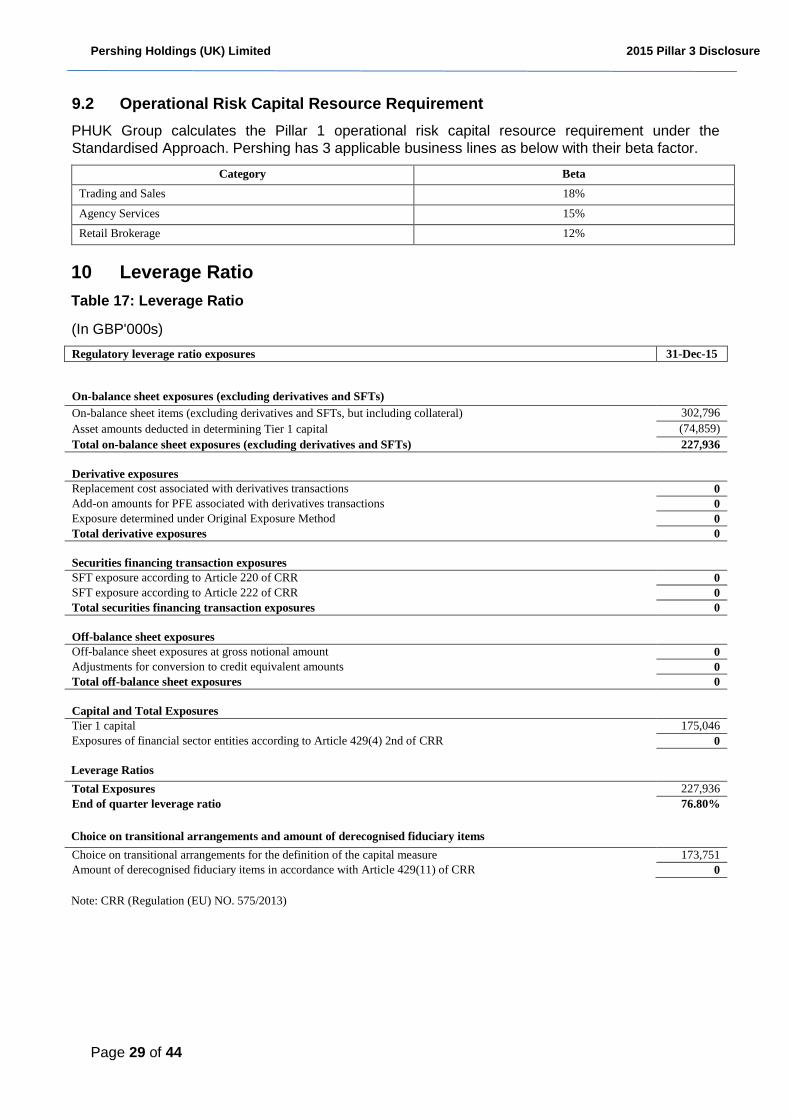
9.2 Operational Risk Capital Resource Requirement
PHUK Group calculates the Pillar 1 operational risk capital resource requirement under the
Standardised Approach. Pershing has 3 applicable business lines as below with their beta factor.
Category Beta
Trading and Sales 18%
Agency Services 15%
Retail Brokerage 12%
10 Leverage Ratio
Table 17: Leverage Ratio
(In GBP'000s)
Regulatory leverage ratio exposures 31-Dec-15
On-balance sheet exposures (excluding derivatives and SFTs) On-balance sheet items (excluding derivatives and SFTs, but including collateral) 302,796 Asset amounts deducted in determining Tier 1 capital (74,859) Total on-balance sheet exposures (excluding derivatives and SFTs) 227,936
Derivative exposures
Replacement cost associated with derivatives transactions 0
Add-on amounts for PFE associated with derivatives transactions 0
Exposure determined under Original Exposure Method 0
Total derivative exposures 0
Securities financing transaction exposures
SFT exposure according to Article 220 of CRR 0
SFT exposure according to Article 222 of CRR 0
Total securities financing transaction exposures 0
Off-balance sheet exposures
Off-balance sheet exposures at gross notional amount 0
Adjustments for conversion to credit equivalent amounts 0
Total off-balance sheet exposures 0
Capital and Total Exposures
Tier 1 capital 175,046
Exposures of financial sector entities according to Article 429(4) 2nd of CRR 0
Leverage Ratios
Total Exposures 227,936
End of quarter leverage ratio 76.80%
Choice on transitional arrangements and amount of derecognised fiduciary items
Choice on transitional arrangements for the definition of the capital measure 173,751
Amount of derecognised fiduciary items in accordance with Article 429(11) of CRR 0
Note: CRR (Regulation (EU) NO. 575/2013)
Pershing Holdings (UK) Limited 2015 Pillar 3 Disclosure
Page 30 of 44
11 Remuneration Disclosure
11.1 Governance
The Human Resources and Compensation Committee (HRCC) of The Bank of New York Mellon
Corporation (BNY Mellon) oversees Pershing’s enterprise-wide employee compensation, benefit
policies and programmes. It reviews and is responsible for other compensation plans, policies and
programmes in which the executive officers participate and the incentive, retirement, welfare and
equity plans in which all employees participate.
Members of the HRCC are non-executive board members, delegated by Pershing’s Board of
Directors to act on behalf of the Board on remuneration matters.
The company’s compensation plans are also monitored by a management-level Compensation
Oversight Committee (COC). The members are Pershing’s senior management include the Chief
Human Resources Officer, the Chief Risk Officer, the Chief Financial Officer and the Risk
Management and Compliance Chief Administrative Officer. An important responsibility of the COC is
to advise the HRCC on any remuneration risk-related issues.
To ensure alignment with local regulations in BNY Mellon’s EMEA (Europe, Middle-East and Africa)
region, the EMEA Remuneration Governance Committee (ERGC) was set up as a regional
governance committee that reviews and ensures compliance with local regulations affecting BNY
Mellon’s EMEA businesses.
11.2 Aligning Pay with Performance
Pershing’s compensation philosophy is to offer a total compensation scheme that supports its
values, client focus, integrity, teamwork and excellence. It pays for performance, both at the
individual and corporate level. It values individual and team contributions and rewards based on
how both contribute to business results. In support of this philosophy, variable compensation is
regularly used as a means of recognising performance.
Through its compensation philosophy and principles, it aligns the interests of its employees and
shareholders by encouraging actions that contribute to superior financial performance and long-term
shareholder value. Our compensation structure is comprised of an appropriate mix of fixed and
variable compensation that is paid over time. Pershing aims to ensure that both fixed and variable
compensation are consistent with business and market practice, fixed compensation is sufficient to
provide for a fully flexible variable compensation program, and variable compensation is in the form
of annual and/or long-term incentives, where appropriate.
11.3 Fixed Remuneration
Fixed remuneration is composed of (i) salary, (ii) any additional non-performance related amounts
paid as a result of contractual obligations or applicable law, or as a result of market practice,
including role based allowances, and (iii) any benefits in kind which are awarded as a result of the
job rather than the performance within the job.
The fixed remuneration of an employee is determined by the job performed, its level of complexity
and responsibility, and the remuneration paid in the market for that type of job. It is set, for all staff,
at a rate to be at all times sufficient to provide for full flexibility in the variable remuneration,
including a zero variable remuneration.
Employees who have been asked and been accepted to be a director of another of BNY Mellon’s
legal entities are not remunerated in their capacity as a director. Independent directors of Pershing
only receive fixed remuneration, as disclosed in the annual Proxy Statement to shareholders.
Pershing Holdings (UK) Limited 2015 Pillar 3 Disclosure
Page 31 of 44
11.4 Variable Compensation Funding and Risk Adjustment
The PHUK Group’s staff are eligible to be awarded variable compensation. Variable compensation
consists of both cash and deferred components and is determined by the functional hierarchy of the
business or business partner service to which the individual staff member belongs, and in
accordance with the terms and conditions of the incentive compensation plan that is applicable for
the business or business partner service. The incentive pool funding is based upon the risk-adjusted
performance of the business line, legal entity or company as appropriate.
The deferred component is intended to align a portion of the variable compensation award with the
management of longer-term business risk. The deferred compensation component is generally
awarded in the form of BNYMellon restricted stock units.
Furthermore, Pershing requires employees who receive awards to agree to clawback and/or
forfeiture provisions on such awards in the event of fraud, misconduct or actions contributing to
financial restatement or other irregularities. Where required by regulations, awards to Material Risk
Takers are subject to more stringent risk adjustment, potentially including forfeiture and / or
clawback in the case of misbehaviour, material error, material downturn in business unit
performance or a material failure of risk management.
11.5 Ratio between Fixed and Variable Pay
The HRCC approved an increase in the maximum ratio of variable to fixed pay (“Bonus Cap”) from
100% to 200% on 27 Jan 2014 on the basis that the increased cap would not affect the firm’s ability
to maintain a sound capital base, and allows for the appropriate incentivisation and reward in
accordance with the Pay for Performance philosophy.
11.6 Deferral Policy and Vesting Criteria
For more senior-level employees, a portion of variable compensation will be deferred, under
ordinary circumstances for a period of at least three years (albeit such compensation may be
deferred on a prorata basis for alternative periods), and will be subject to the performance of either
(or both) the company or the respective business. The deferred component of the variable
compensation award is usually delivered as restricted stock units whose value is linked to BNY
Mellon’s share price. The percentage of the variable compensation award to be deferred depends
on the level of the position, regulatory requirements and the amount of the award. For regulated
staff, the variable compensation portion of an award comprises four different parts: upfront cash,
upfront equity, deferred cash and deferred equity, in order to comply with local regulations. All such
deferred awards are subject to terms and conditions that provide for forfeiture or clawback in certain
circumstances.
11.7 Variable Remuneration of Control Function Staff
The variable compensation awarded to control function staff (for example: audit, legal and risk) is
dependent on performance that is assessed according to the achievement of objectives specific to
their functional role that is independent of the activities they oversee. Remuneration is benchmarked
against the market level and funded independently of individual business line results and adjusted
based on Pershing’s overall annual financial performance.
11.8 Quantitative Disclosures
The tables below provide details of the aggregate remuneration of senior management and Material
Risk Takers (MRT) for PHUK Group for the year ended 31 December 2015.
For completeness, this group of staff is limited to those considered to be primarily regulated due to their activities under PHUK Group. The remuneration amounts are presented on a gross basis,
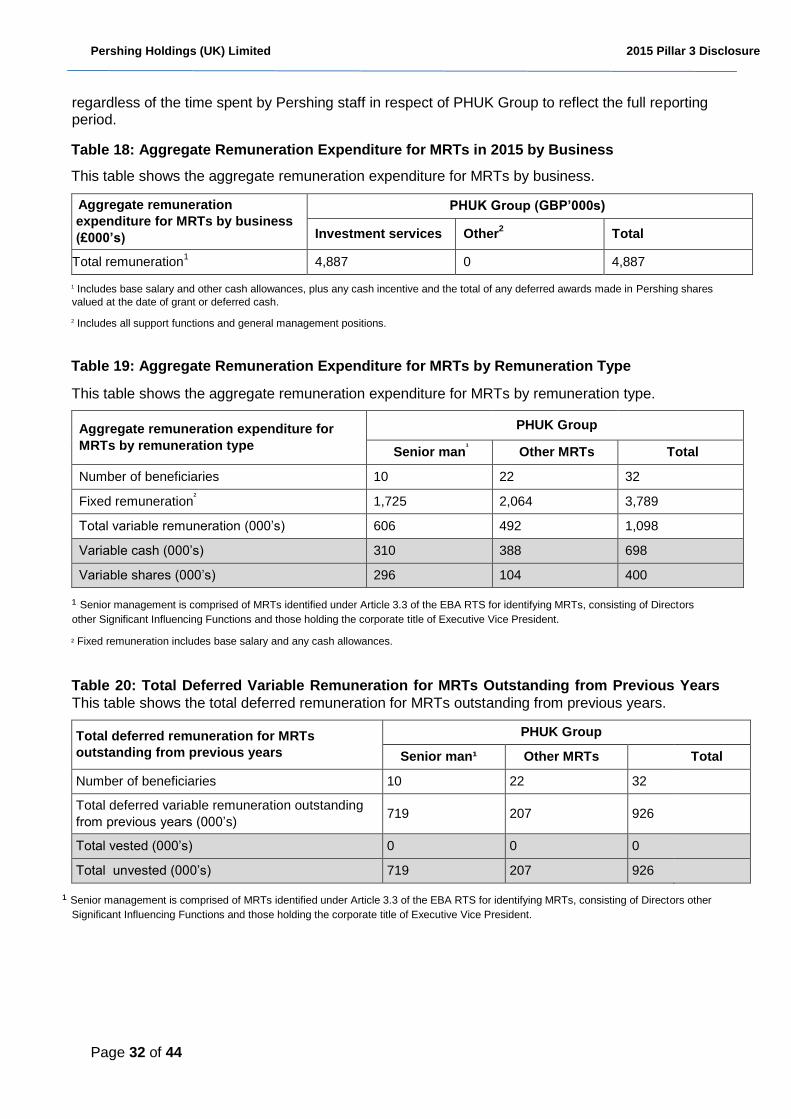
Pershing Holdings (UK) Limited 2015 Pillar 3 Disclosure
Page 32 of 44
regardless of the time spent by Pershing staff in respect of PHUK Group to reflect the full reporting period.
Table 18: Aggregate Remuneration Expenditure for MRTs in 2015 by Business
This table shows the aggregate remuneration expenditure for MRTs by business.
Aggregate remuneration
expenditure for MRTs by business
(£000’s)
PHUK Group (GBP’000s)
Investment services Other2 Total
Total remuneration1 4,887 0 4,887
1 Includes base salary and other cash allowances, plus any cash incentive and the total of any deferred awards made in Pershing shares
valued at the date of grant or deferred cash.
2 Includes all support functions and general management positions.
Table 19: Aggregate Remuneration Expenditure for MRTs by Remuneration Type
This table shows the aggregate remuneration expenditure for MRTs by remuneration type.
Aggregate remuneration expenditure for
MRTs by remuneration type
PHUK Group
Senior man¹ Other MRTs Total
Number of beneficiaries 10 22 32
Fixed remuneration² 1,725 2,064 3,789
Total variable remuneration (000’s) 606 492 1,098
Variable cash (000’s) 310 388 698
Variable shares (000’s) 296 104 400
¹ Senior management is comprised of MRTs identified under Article 3.3 of the EBA RTS for identifying MRTs, consisting of Directors
other Significant Influencing Functions and those holding the corporate title of Executive Vice President.
² Fixed remuneration includes base salary and any cash allowances.
Table 20: Total Deferred Variable Remuneration for MRTs Outstanding from Previous Years
This table shows the total deferred remuneration for MRTs outstanding from previous years.
Total deferred remuneration for MRTs
outstanding from previous years
PHUK Group
Senior man¹ Other MRTs Total
Number of beneficiaries 10 22 32
Total deferred variable remuneration outstanding
from previous years (000’s) 719 207 926
Total vested (000’s) 0 0 0
Total unvested (000’s) 719 207 926
¹ Senior management is comprised of MRTs identified under Article 3.3 of the EBA RTS for identifying MRTs, consisting of Directors other
Significant Influencing Functions and those holding the corporate title of Executive Vice President.
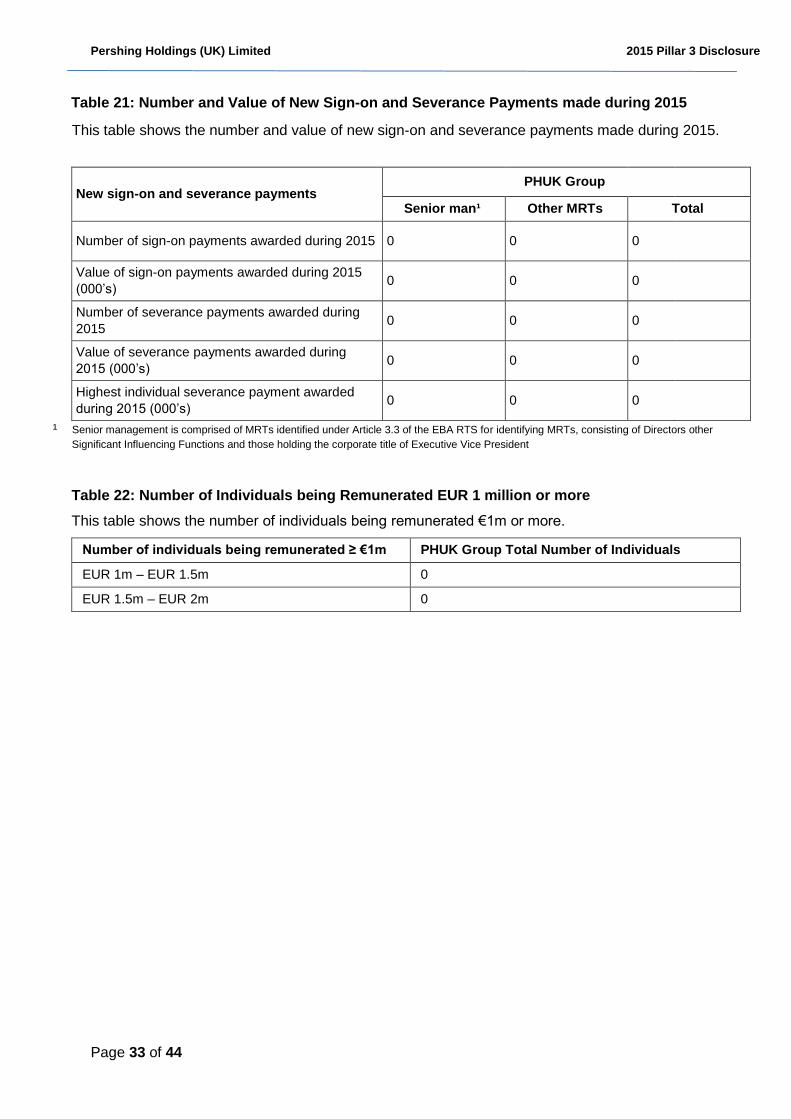
Pershing Holdings (UK) Limited 2015 Pillar 3 Disclosure
Page 33 of 44
Table 21: Number and Value of New Sign-on and Severance Payments made during 2015
This table shows the number and value of new sign-on and severance payments made during 2015.
New sign-on and severance payments PHUK Group
Senior man¹ Other MRTs Total
Number of sign-on payments awarded during 2015 0 0 0
Value of sign-on payments awarded during 2015
(000’s) 0 0 0
Number of severance payments awarded during
2015 0 0 0
Value of severance payments awarded during
2015 (000’s) 0 0 0
Highest individual severance payment awarded
during 2015 (000’s) 0 0 0
¹ Senior management is comprised of MRTs identified under Article 3.3 of the EBA RTS for identifying MRTs, consisting of Directors other
Significant Influencing Functions and those holding the corporate title of Executive Vice President
Table 22: Number of Individuals being Remunerated EUR 1 million or more
This table shows the number of individuals being remunerated €1m or more.
Number of individuals being remunerated ≥ €1m PHUK Group Total Number of Individuals
EUR 1m – EUR 1.5m 0
EUR 1.5m – EUR 2m 0
Pershing Holdings (UK) Limited 2015 Pillar 3 Disclosure
Page 34 of 44
Appendix 1 Liquidity and Other Risks
Liquidity Risk
Liquidity Risk is the risk that PHUK Group cannot meet its cash and collateral obligations without
significantly affecting daily operations or financial conditions. Liquidity risks can arise from funding
mismatches, market constraints from an inability to convert assets to cash, inability to raise cash in
the markets, deposit run-off, or contingent liquidity events. Changes in economic conditions or
exposure to credit, market, operational, legal, and reputational risks also can affect Pershing’s
liquidity risk profile and are considered in the liquidity risk management framework.
PHUK Group does not engage in proprietary trading activities or hold assets for resale on its
balance sheet, (excluding Gilts comprising the liquid assets buffer (LAB)) and so does not have
significant asset liquidity risk. PHUK Group’s business model is of a transaction processing nature
and PHUK Group maintains a prudent funding profile in order to supports its clients trading
activities. The availability of sufficient and appropriate credit lines is of paramount importance.
A liquidity risk management framework has been established which is maintained on a day to day
basis by the Treasury department. The ALCO provides oversight and ultimately the PRC and the
Board. PSL complies with FCA liquidity requirements at all times including the maintenance of a
LAB.
Regulatory and Compliance Risk
Regulatory and Compliance Risk is defined as sustaining loss arising from non-compliance with
laws, directives, regulations, reporting standards and lack of adequately documented and
understood processes.
Monitoring and Reporting Risk is the risk of loss arising from a failure to comply with financial
reporting standards, agreements or regulatory requirements. This includes risks resulting from
action taken by existing and new stockholders, regulators and investors who may have sustained
losses due to incomplete, inaccurate or untimely reporting of financial performance.
Existing and new directives and regulations are monitored and reviewed by Compliance and
Finance for finance regulatory reporting management and findings are reported to senior
management and the Board. Strategies and changes to comply with new regulations are put in
place when necessary.
Reputation Risk
Reputation Risk is the risk to the Pershing’s brand and relationships which does not arise out of any
one specific error. It can arise from all aspects of business activities, including but not limited to
operational failures in business practices, legal or regulatory sanctions, joint ventures with outside
firms, engagements with third party vendors, or off-balance sheet activities.
Pershing relies heavily on its reputation and standing in the market place to retain and attract
clients.
Legal Risk
Legal Risk is the risk of loss arising from claims, lawsuits (including costs of defence and/or adverse
judgments), and inability to enforce contracts.
Pershing’s legal risks fall into the following categories:
• Corporate
• Client
Pershing Holdings (UK) Limited 2015 Pillar 3 Disclosure
Page 35 of 44
• Employee
• Suppliers
These can occur as a result of non-payment / non-performance. They are mitigated using the legal
documents that specify the responsibilities of both parties and the procedures for resolving disputes.
Outsourcing Risk
Outsourcing Risk is the risk that failure in respect of the provision of services by third party
provider(s) could potentially damage PHUK Group’s operations, or if contracts with any of the third
party providers are terminated, that PHUK Group may not be able to find alternative providers on a
timely basis or on equivalent terms.
PHUK Group relies on internal and external outsourcing entities within and outside of the BNY
Mellon group to perform its core business activities. To date, PHUK Group has only outsourced
critical tasks to Pershing group entities that hold the required permissions in their jurisdiction to carry
out the respective delegated tasks. Currently there are no critical tasks outsourced to third parties
outside Pershing entities.
PHUK Group’s outsourcing policy describes minimum standards that should be adopted when
considering or dealing with a service and/or activity that is outsourced to another legal entity, either
within the Pershing group or to an external provider and establishes a framework for evaluating and
analysing outsourcing projects.
Business Risk
Business Risk is the risk of loss that the business environment poses to PHUK Group’s profitability.
It normally consists of items such as changes in the external macro environment or client behaviour,
inappropriate management actions and performance of competitors. The list is not exhaustive.
The principal business risk for PHUK Group is within the asset servicing and alternative investment
services businesses as this is mainly driven by the fact that fees are significantly based on the
client’s net asset value. As business risk is difficult to assess, it has been defined as the residual
risks that confronts PHUK Group after taking all known and quantifiable risks into consideration.
Concentration Risk
Concentration Risk is the risk of loss arising from significant interrelated asset or liability exposures,
which in cases of distress associated with markets, sectors, countries, or areas of activity, may
threaten the soundness of the institution.
Traditionally analysed in relation to credit activities, concentration risk arises from exposures that
may arise within or across different risk types, including intra-risk concentration where exposure
concentration exists within a single risk type, and inter-risk concentrations arising from interactions
between different risk exposures across different risk categories connected by a common risk factor
(e.g. counterparties, vendor, economic sector, geographic region, and/or financial
instrument/product type).
Group Risk
Group Risk is the risk that the financial position of PHUK Group may be adversely affected by its
relationships (financial and non-financial) with other entities within Pershing or by risks which may
affect the financial position of the whole Group, for example reputational contagion or Group default.
PHUK Group has a number of dependencies on the larger Pershing group. These range from
business leadership, dependency on certain IT systems and support services provided by central
functions.
Pershing Holdings (UK) Limited 2015 Pillar 3 Disclosure
Page 36 of 44
PHUK Group management has considered several possible scenarios where these services may be
affected, these include IT services outage and other business continuity issues. These stress
scenarios are included as part of the operational risk assessment, and in the liquidity stress testing.
Model Risk
Model Risk refers to the possibility of unintended business outcomes arising from the design,
implementation or use of models. Model risk includes the potential risk that management makes
incorrect decisions based either upon incorrect model results, or incorrect understanding and use of
model results.
PHUK Group uses models in its risk management framework. All models have been assessed in
line with the relevant corporate policies and model risk management framework wherein the
individual model is categorised into one of three tiers based on materiality, complexity, and level of
reliance.
Models that impact the capital assessment process are categorised as Tier 1 models and the
execution of the validation of Tier 1 models is done by a designated Independent model validation
function. Tier 1 models are required to be validated or reviewed, as per the validation standards, on
at least an annual basis.
Pershing internal audit provides independent reviews of compliance with the corporate model
validation policy.
Strategic Risk
Strategic Risk is defined as the risk of direct or indirect loss arising from the adverse effects or the
improper implementation of business decisions. It is a function of the compatibility of an
organisation’s strategic goals, the business strategies developed, the resources deployed to
achieve those goals and the quality of implementation. It can result from either a misalignment
between strategic decisions taken at the asset servicing and alternative investment services
business level which impact PHUK Group, or failure to deliver business value through new strategic
initiatives.
Country Risk
Country Risk is the risk of unfavourable evolution of operating profits and/or value of assets due to
changes in the business environment resulting from political or macroeconomic factors.
Pershing Holdings (UK) Limited 2015 Pillar 3 Disclosure
Page 37 of 44
Appendix 2 Glossary of Terms
The following terms are used in this document:
• ALCO: Asset and Liability Committee
• Basel III: The capital reforms and introduction of a global liquidity standard proposed by the Basel
Committee on Banking Supervision in 2010
• CRD IV: On 27 June 2013, the European Commission published, through the Official Journal of the
European Union, its legislation for a Capital Requirements Directive (CRD) and Capital
Requirements Regulation (CRR), which together form the CRD IV package. Amendments published
on 30 November 2013 were made to the Regulation. The package implements the Basel III reforms
in addition to the inclusion of new proposals on sanctions for non-compliance with prudential rules,
corporate governance and remuneration. CRD IV rules apply from 1 January 2014 onwards, with
certain requirements set to be phased in
• Capital Requirements Directive (CRD): A capital adequacy legislative package issued by the
European Commission and adopted by EU member states
• Capital Requirements Regulation (CRR): Regulation that is directly applicable to anyone in the
European Union and is not transposed into national law.
• Central Bank of Ireland (CBI): Responsible for the regulation of all financial services firms in
Ireland
• Common Equity Tier 1 capital: The highest quality form of regulatory capital under Basel III
comprising common shares issued and related share premium, retained earnings and other
reserves excluding the cash flow hedging reserve, less specified regulatory adjustments.
• Core Tier 1 capital: Called-up share capital and eligible reserves plus equity non-controlling
interests, less intangible assets and other regulatory deductions
• Credit risk mitigation (CRM): A technique to reduce the credit risk associated with an exposure by
application of credit risk mitigants such as collateral, guarantees and credit protection.
• Derivatives: A derivative is a financial instrument that derives its value from one or more underlying
assets, for example bonds or currencies.
• EMEA: Europe, Middle-East and Africa region
• Exposure: A claim, contingent claim or position which carries a risk of financial loss.
• Exposure at default (EAD): The amount expected to be outstanding, after any credit risk
mitigation, if and when counterparty defaults. EAD reflects drawn balances as well as allowance for
undrawn amounts of commitments and contingent exposures over a one-year time horizon.
• Financial Conduct Authority (FCA): The Financial Conduct Authority regulates the conduct of
financial firms and, for certain firms, prudential standards in the UK. It has a strategic objective to
ensure that the relevant markets function well
• High Level Assessment (HLA): An assessment of the quality of controls in place to mitigate risk
and residual risk. Residual risk is assessed as high, moderate to high, moderate, moderate to low
and low with direction anticipated.
• Institutions: Under the Standardised approach, Institutions are classified as credit institutions or
investment firms.
• Internal Capital Adequacy Assessment Process (ICAAP): The group’s own assessment of the
levels of capital that it needs to hold through an examination of its risk profile from regulatory and
economic capital viewpoints.
• ISDA Master Agreement: A document that outlines the terms applied to a derivatives transaction
between two parties. Once the two parties have agreed to the standard terms, they do not have to
renegotiate each time a new transaction is entered into.
Pershing Holdings (UK) Limited 2015 Pillar 3 Disclosure
Page 38 of 44
• Key Risk Indicator (KRI): Key Risk Indicators are used by business lines to evaluate control
effectiveness and residual risk within a business process.
• Master Netting Agreement: An agreement between two counterparties that have multiple contracts
with each other that provides for the net settlement of all contracts through a single payment in the
event of default or termination of any one contract.
• Pillar 3: The part of Basel III that sets out information banks must disclose about their risks, the
amount of capital required to absorb them and their approach to risk management. The aim is to
encourage market discipline and improve the information made available to the market.
• Prudential Regulation Authority (PRA): the statutory body responsible for the prudential
supervision of banks, building societies, credit unions insurers and major investment firms in the UK.
The PRA is a subsidiary of the Bank of England.
• Residual maturity: The period outstanding from the reporting date to the maturity or end date of an
exposure.
• Risk appetite: A definition of the types and quantum of risks to which the firm wishes to be
exposed.
• Risk and Control Self-Assessment (RCSA): Risk and Control Self-Assessment is used by
business lines to identify risks associated with their key business processes and to complete a
detailed assessment of the risk and associated controls.
• Risk Governance Framework: PHUK Group’s risk governance framework has been developed in
conjunction with Pershing requirements. Key elements of the framework are:
o Formal governance committees, with mandates and attendees defined
o Clearly defined escalation processes, both informally (management lines) and formally
(governance committees, board, etc.)
o A clear business as usual process for identification, management and control of risks
o Regular reporting of risk issues
• Risk Weighted Assets (RWAs): Assets that are adjusted for their associated risks using
weightings established in accordance with CRD IV requirements
• Standardised approach: Method used to calculate credit risk capital requirements using the Basel
III, CRD IV, CRR model supplied by the BCBS. All financial institutions must opt to either use the
Standard Approach (SA) specified by the regulator, or develop and use their own Internal Ratings
Model (IRM). The SA model uses external credit assessment institution ratings and supervisory risk
weights supplied by external credit assessment agencies
• Tier 2 capital: A component of regulatory capital under Basel III, mainly comprising qualifying
subordinated loan capital, related non-controlling interests and eligible collective impairment
allowances
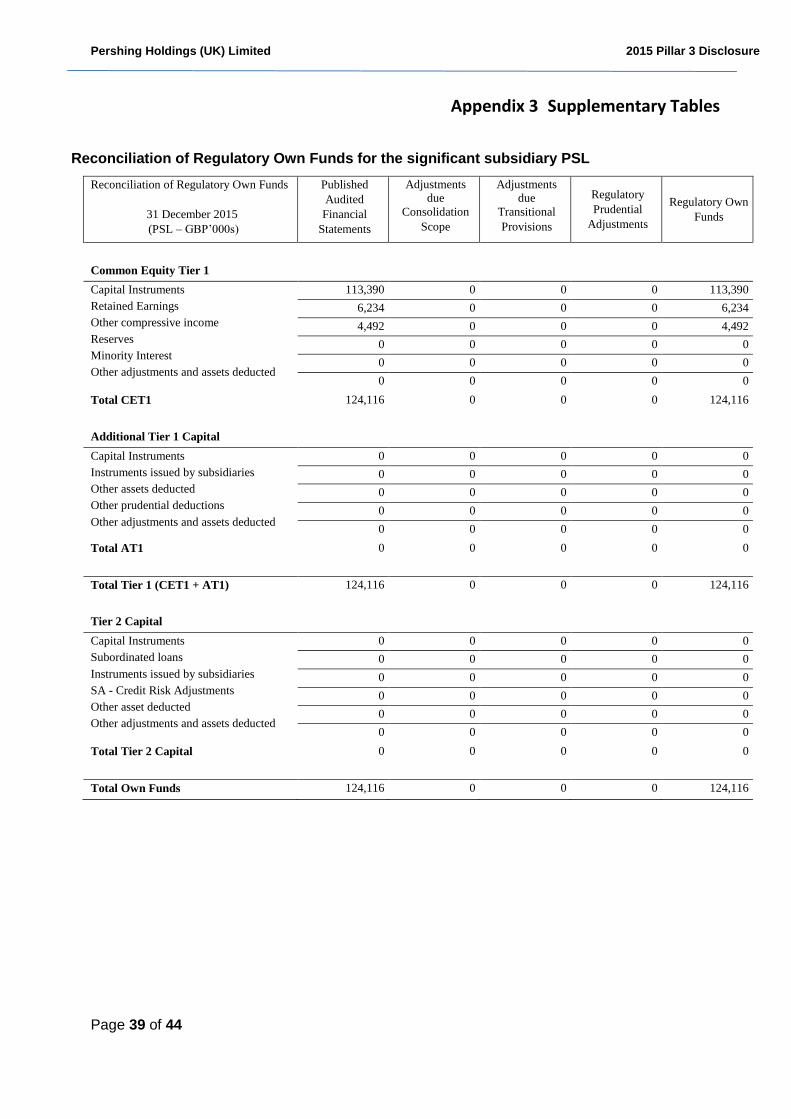
Pershing Holdings (UK) Limited 2015 Pillar 3 Disclosure
Page 39 of 44
Appendix 3 Supplementary Tables
Reconciliation of Regulatory Own Funds for the significant subsidiary PSL
Reconciliation of Regulatory Own Funds
31 December 2015 (PSL – GBP’000s)
Published Audited
Financial Statements
Adjustments due
Consolidation Scope
Adjustments due
Transitional Provisions
Regulatory Prudential
Adjustments
Regulatory Own
Funds
Common Equity Tier 1
Capital Instruments Retained Earnings Other compressive income Reserves Minority Interest Other adjustments and assets deducted
113,390 0 0 0 113,390
6,234 0 0 0 6,234
4,492 0 0 0 4,492
0 0 0 0 0
0 0 0 0 0
0 0 0 0 0
Total CET1
Additional Tier 1 Capital
124,116
0
0
0
124,116
Capital Instruments Instruments issued by subsidiaries Other assets deducted Other prudential deductions Other adjustments and assets deducted
0 0 0 0 0
0 0 0 0 0
0 0 0 0 0
0 0 0 0 0
0 0 0 0 0
Total AT1
0
0
0
0
0
Total Tier 1 (CET1 + AT1)
Tier 2 Capital
124,116
0
0
0
124,116
Capital Instruments Subordinated loans Instruments issued by subsidiaries SA - Credit Risk Adjustments Other asset deducted Other adjustments and assets deducted
0 0 0 0 0
0 0 0 0 0
0 0 0 0 0
0 0 0 0 0
0 0 0 0 0
0 0 0 0 0
Total Tier 2 Capital
0
0
0
0
0
Total Own Funds 124,116 0 0 0 124,116
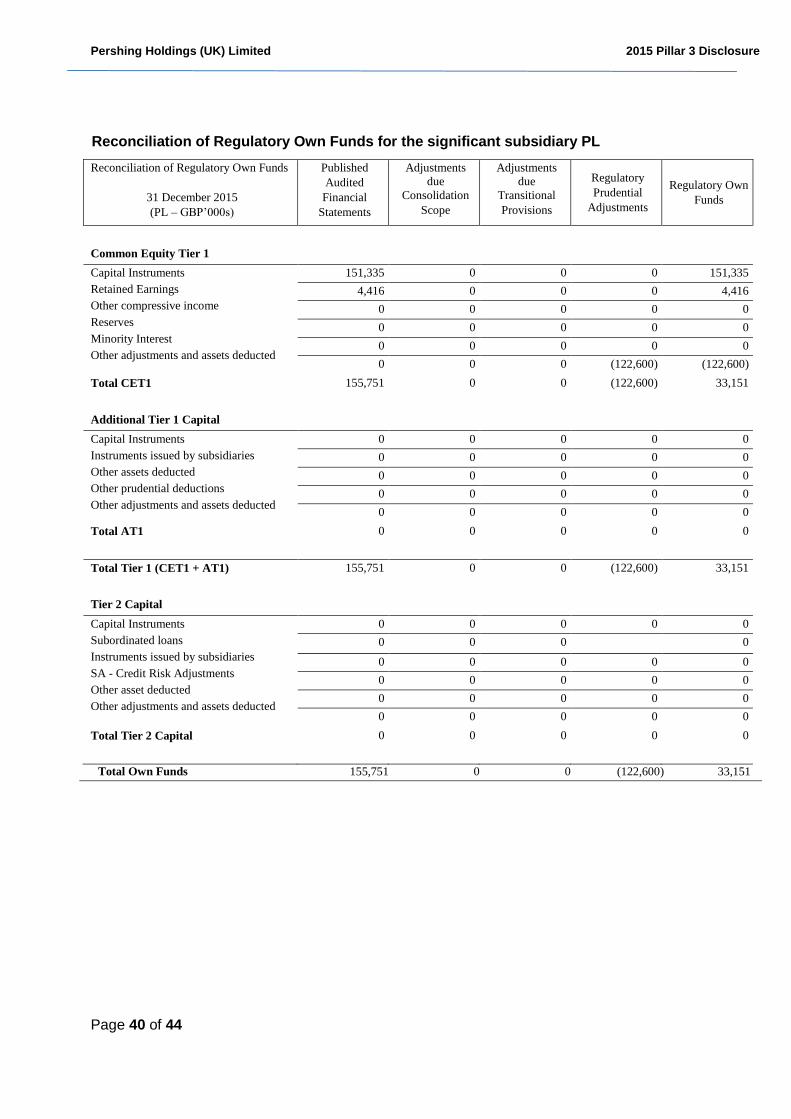
Pershing Holdings (UK) Limited 2015 Pillar 3 Disclosure
Page 40 of 44
Reconciliation of Regulatory Own Funds for the significant subsidiary PL
Reconciliation of Regulatory Own Funds
31 December 2015 (PL – GBP’000s)
Published Audited
Financial Statements
Adjustments
due Consolidation
Scope
Adjustments
due Transitional Provisions
Regulatory Prudential
Adjustments
Regulatory Own
Funds
Common Equity Tier 1
Capital Instruments Retained Earnings Other compressive income Reserves Minority Interest Other adjustments and assets deducted
151,335 0 0 0 151,335
4,416 0 0 0 4,416
0 0 0 0 0
0 0 0 0 0
0 0 0 0 0
0 0 0 (122,600) (122,600)
Total CET1
Additional Tier 1 Capital
155,751
0
0
(122,600)
33,151
Capital Instruments Instruments issued by subsidiaries Other assets deducted Other prudential deductions Other adjustments and assets deducted
0 0 0 0 0
0 0 0 0 0
0 0 0 0 0
0 0 0 0 0
0 0 0 0 0
Total AT1
0
0
0
0
0
Total Tier 1 (CET1 + AT1)
Tier 2 Capital
155,751
0
0
(122,600)
33,151
Capital Instruments Subordinated loans Instruments issued by subsidiaries SA - Credit Risk Adjustments Other asset deducted Other adjustments and assets deducted
0 0 0 0 0
0 0 0 0
0 0 0 0 0
0 0 0 0 0
0 0 0 0 0
0 0 0 0 0
Total Tier 2 Capital
0
0
0
0
0
Total Own Funds 155,751 0 0 (122,600) 33,151
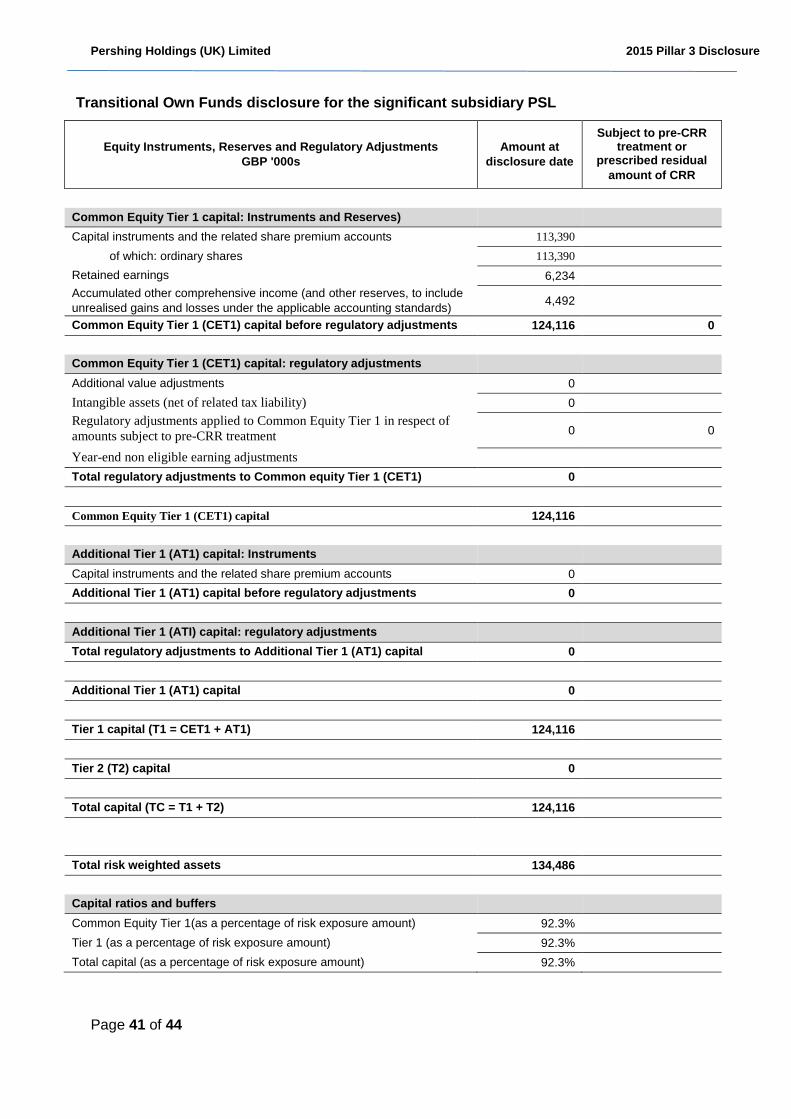
Pershing Holdings (UK) Limited 2015 Pillar 3 Disclosure
Page 41 of 44
Transitional Own Funds disclosure for the significant subsidiary PSL
Equity Instruments, Reserves and Regulatory Adjustments
GBP '000s
Amount at
disclosure date
Subject to pre-CRR treatment or
prescribed residual
amount of CRR
Common Equity Tier 1 capital: Instruments and Reserves)
Capital instruments and the related share premium accounts 113,390
of which: ordinary shares 113,390
Retained earnings 6,234
Accumulated other comprehensive income (and other reserves, to include
unrealised gains and losses under the applicable accounting standards) 4,492
Common Equity Tier 1 (CET1) capital before regulatory adjustments 124,116 0
Common Equity Tier 1 (CET1) capital: regulatory adjustments
Additional value adjustments 0
Intangible assets (net of related tax liability) 0
Regulatory adjustments applied to Common Equity Tier 1 in respect of
amounts subject to pre-CRR treatment 0 0
Year-end non eligible earning adjustments
Total regulatory adjustments to Common equity Tier 1 (CET1) 0
Common Equity Tier 1 (CET1) capital 124,116
Additional Tier 1 (AT1) capital: Instruments
Capital instruments and the related share premium accounts 0
Additional Tier 1 (AT1) capital before regulatory adjustments 0
Additional Tier 1 (ATI) capital: regulatory adjustments
Total regulatory adjustments to Additional Tier 1 (AT1) capital 0
Additional Tier 1 (AT1) capital 0
Tier 1 capital (T1 = CET1 + AT1) 124,116
Tier 2 (T2) capital 0
Total capital (TC = T1 + T2) 124,116
Total risk weighted assets 134,486
Capital ratios and buffers
Common Equity Tier 1(as a percentage of risk exposure amount) 92.3%
Tier 1 (as a percentage of risk exposure amount) 92.3%
Total capital (as a percentage of risk exposure amount) 92.3%
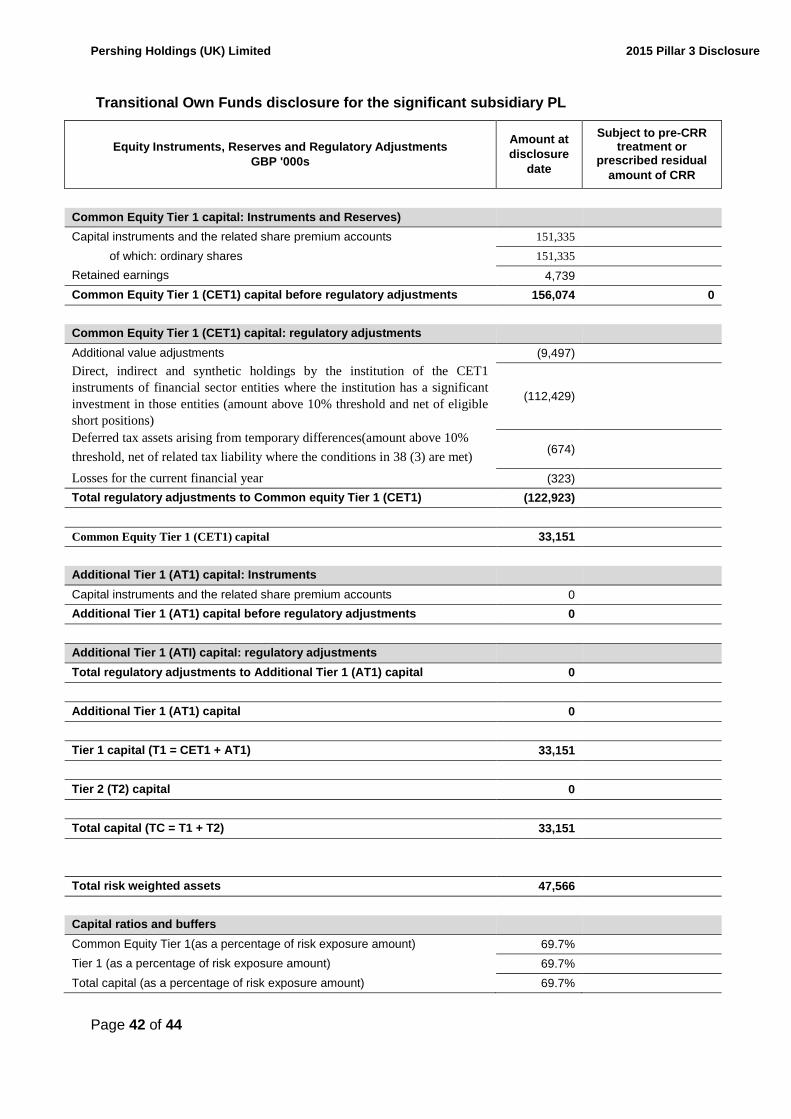
Pershing Holdings (UK) Limited 2015 Pillar 3 Disclosure
Page 42 of 44
Transitional Own Funds disclosure for the significant subsidiary PL
Equity Instruments, Reserves and Regulatory Adjustments
GBP '000s
Amount at
disclosure
date
Subject to pre-CRR treatment or
prescribed residual
amount of CRR
Common Equity Tier 1 capital: Instruments and Reserves)
Capital instruments and the related share premium accounts 151,335
of which: ordinary shares 151,335
Retained earnings 4,739
Common Equity Tier 1 (CET1) capital before regulatory adjustments 156,074 0
Common Equity Tier 1 (CET1) capital: regulatory adjustments
Additional value adjustments (9,497)
Direct, indirect and synthetic holdings by the institution of the CET1
instruments of financial sector entities where the institution has a significant
investment in those entities (amount above 10% threshold and net of eligible
short positions)
(112,429)
Deferred tax assets arising from temporary differences(amount above 10%
threshold, net of related tax liability where the conditions in 38 (3) are met) (674)
Losses for the current financial year (323)
Total regulatory adjustments to Common equity Tier 1 (CET1) (122,923)
Common Equity Tier 1 (CET1) capital 33,151
Additional Tier 1 (AT1) capital: Instruments
Capital instruments and the related share premium accounts 0
Additional Tier 1 (AT1) capital before regulatory adjustments 0
Additional Tier 1 (ATI) capital: regulatory adjustments
Total regulatory adjustments to Additional Tier 1 (AT1) capital 0
Additional Tier 1 (AT1) capital 0
Tier 1 capital (T1 = CET1 + AT1) 33,151
Tier 2 (T2) capital 0
Total capital (TC = T1 + T2) 33,151
Total risk weighted assets 47,566
Capital ratios and buffers
Common Equity Tier 1(as a percentage of risk exposure amount) 69.7%
Tier 1 (as a percentage of risk exposure amount) 69.7%
Total capital (as a percentage of risk exposure amount) 69.7%
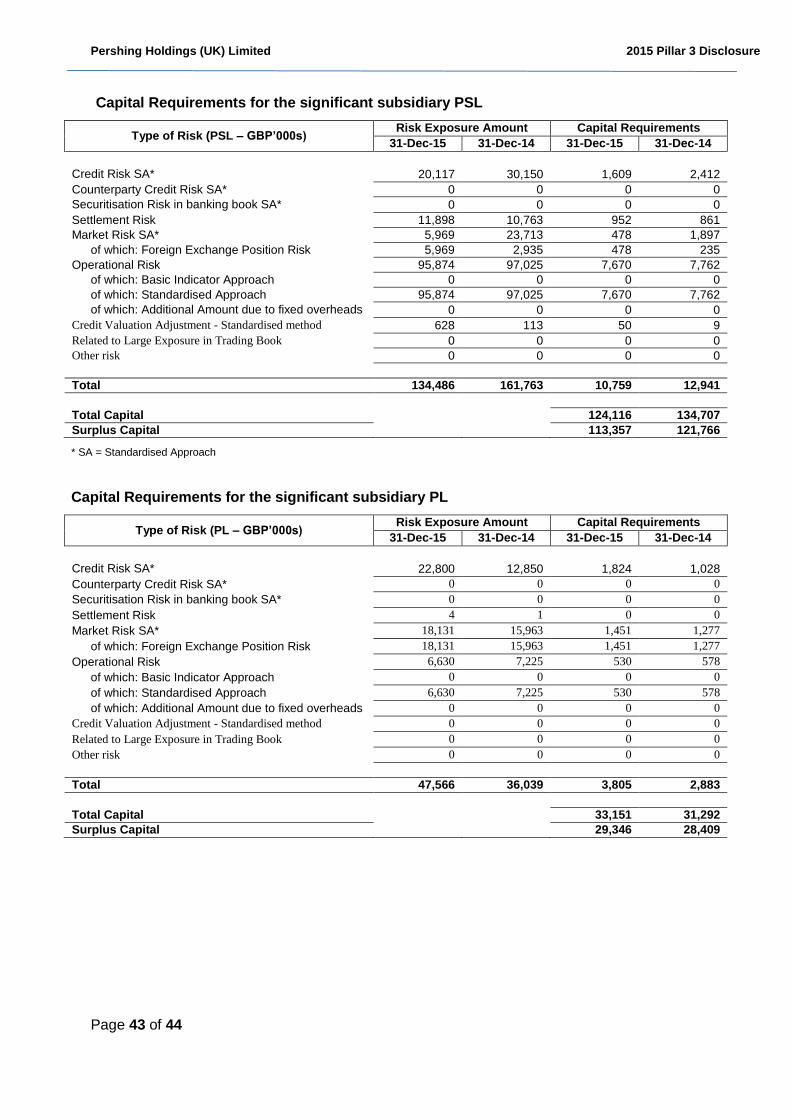
Pershing Holdings (UK) Limited 2015 Pillar 3 Disclosure
Page 43 of 44
Capital Requirements for the significant subsidiary PSL
Type of Risk (PSL – GBP’000s) Risk Exposure Amount Capital Requirements
31-Dec-15 31-Dec-14 31-Dec-15 31-Dec-14
Credit Risk SA* 20,117 30,150 1,609 2,412
Counterparty Credit Risk SA* 0 0 0 0
Securitisation Risk in banking book SA* 0 0 0 0
Settlement Risk 11,898 10,763 952 861
Market Risk SA* 5,969 23,713 478 1,897
of which: Foreign Exchange Position Risk 5,969 2,935 478 235
Operational Risk 95,874 97,025 7,670 7,762
of which: Basic Indicator Approach 0 0 0 0
of which: Standardised Approach 95,874 97,025 7,670 7,762
of which: Additional Amount due to fixed overheads 0 0 0 0
Credit Valuation Adjustment - Standardised method 628 113 50 9
Related to Large Exposure in Trading Book 0 0 0 0
Other risk 0 0 0 0
Total 134,486 161,763 10,759 12,941
Total Capital 124,116 134,707
Surplus Capital 113,357 121,766
* SA = Standardised Approach
Capital Requirements for the significant subsidiary PL
Type of Risk (PL – GBP’000s) Risk Exposure Amount Capital Requirements
31-Dec-15 31-Dec-14 31-Dec-15 31-Dec-14
Credit Risk SA* 22,800 12,850 1,824 1,028
Counterparty Credit Risk SA* 0 0 0 0 Securitisation Risk in banking book SA* 0 0 0 0 Settlement Risk 4 1 0 0 Market Risk SA* 18,131 15,963 1,451 1,277
of which: Foreign Exchange Position Risk 18,131 15,963 1,451 1,277 Operational Risk 6,630 7,225 530 578
of which: Basic Indicator Approach 0 0 0 0 of which: Standardised Approach 6,630 7,225 530 578 of which: Additional Amount due to fixed overheads 0 0 0 0
Credit Valuation Adjustment - Standardised method 0 0 0 0 Related to Large Exposure in Trading Book 0 0 0 0 Other risk 0 0 0 0
Total 47,566 36,039 3,805 2,883
Total Capital 33,151 31,292
Surplus Capital 29,346 28,409
Pershing Holdings (UK) Limited 2015 Pillar 3 Disclosure
Page 44 of 44
Contacts
Name: Kevin Cracknell, Chief Financial Officer
Department: Finance
Phone: +44 20 7163 3605
Email: [email protected]
Pershing Holdings (UK) Limited
One Canada Square
London E14 5AL