PERS Paper
10
Habitat Mapping in Rugged Terrain Using Multispectral Ikonos Images Janet Nichol and Man Sing Wong PHOTOGRAMMETRIC ENGINEERING & REMOTE SENSING November 2008 1325 Department of Land Surveying and GeoInformatics, The Hong Kong Polytechnic University, ([email protected]). Photogrammetric Engineering & Remote Sensing Vol. 74, No. 11, November 2008, pp. 1325–1334. 0099-1112/08/7411–1325/$3.00/0 © 2008 American Society for Photogrammetry and Remote Sensing Abstract Due to the significant time and cost requirements of traditional mapping techniques, accurate and detailed habitat maps for large areas are uncommon. This study investigates the application of Ikonos Very High Resolution ( VHR) images to habitat mapping in the rugged terrain of Hong Kong’s country parks. A required mapping scale of 1:10 000, a minimum map object size of 150 m 2 on the ground, and a minimum accuracy level of 80 percent were set as the mapping standards. Very high quality aerial photogra phs and digital topographic maps provided accurate reference data for the image processing and habitat classification. A comparison between manual stereoscopic aerial photographic interpretation and image classification using pixel-based and object-based classifiers was carried out. The Multi-level Object Oriented Segmenta- tion with Decision Tree Classification ( MOOSC ) was devised during this study using a suite of image processing tech- niques to integrate spectral, textural, and spatial criteria with ancillary data. Manual mapping from air photos combined with fieldwork obtained the best result, with 95 percent overa ll accuracy, but both t his and the MOOSC method, with 94 percent, easily met the 80 percent speci- fied accuracy standard. The MOOSC method was able to achieve similar accuracy aerial photographs, but at only one third of the cost. Introduction Biodiversity conservation strategies call for comprehensive information on the distribution of species and their habitats as well as their changes over time. However, wildlife habitat mapping, as a discipline has suffered from several major challenges including: 1. the need to map at detailed level, usually over large areas, 2. often indistin ct boundaries between relevant vegetation classes, requiring a large element of subjectivity (Green and Hartley, 2000; Alexander and Millington, 2000), 3. the requirement for high levels of accuracy du e to the slow rate of change, 4. many wildlife reserves occupy mountainous terrain, and 5. lack of readily applicable automated methodologies because, even within the same climatic zone, vegetation communities may be highly variable, thus mapping methodologies cannot be extrapolated outside a particular study area. Traditionally, manual air photo interpretation has been used to extrapolate field observations over large areas. Since stereo viewing is often necessary to identify habitat struc- ture, especially on steep slopes, it is time-consuming (Green et al ., 1993). Even with digital photography, large area coverage would require orthorectification of individual images, resulting in potentially prohibitive costs. The first ever habitat survey covering the whole 1,100 km 2 of Hong Kong at 1:20 000 scale was undertaken by the Worldwide Fund for Nature in 199 3 (Ashwort h et al ., 1993), using a combination of fieldwork and air photo interpretation. The resulting accuracy was low (R. Corlett, personal communication), and the maps were little used. Another such project, the 1:10 000 scale habitat survey of Northumberlan d National Pa rk, which was part of the Phase I national survey of Great Britain (Walton, 1993), was carried out by air photo interpretation and required a total of 717 people-days. The exercise was deemed too expensive to be repeated (Mehner et al ., 2004) given the low accuracy (Brookes et al ., 2000). Attempts to improve accuracy and costs using satellite images have been limited by insufficient spatial resolution of medium resolution sensors such as those on Landsat and SPOT1 through SPOT4. The low overall accuracy (approxi- mately 50 percent) obtained by a recent habitat survey covering the whole of Hong Kong using SPOT4 and Landsat images (Environmental Protection Department, 2003) appears to have been due to inadequate resolution, com- bined with differences in solar illumination on opposite slopes. For example, the accuracy of many cover types such as grassland, shrubby grassland and wetland, when referenced against field GPS data, was below 40 percent (Environmental Protection Department, 2003). Generally up to the present time, high accuracy in habitat mapping is difficult to achieve (Brookes et al ., 2000). If the problem of differential illumination in mountain- ous terrain can be solved, the new generation of VHR satellite sensors such as Ikonos with its 4 m multispectral resolution has greater potential (Slater and Brown, 2000). However, it is recognised that image processing techniques specific to these sensors are required. Mather (1999) recommends the addition of texture to pixel-based classifiers due to the detection of micro-sca le texture propert ies at high-resol ution (see for example, Keramitso glou et al . (2005)). Furthermore, since on VHR sensors, natural habitats are composed of many different reflectance surfaces, pixel-based classifiers are inappropriate. Thus, recent habitat mapping projects have used object-based classifiers with VHR airborne, (Ehlers et al ., 2003) and satellite sensors (Bock et al ., 2005; Kobler et al ., 2006). These have the ability to group pixels into discrete
-
Upload
candy-chin -
Category
Documents
-
view
217 -
download
0
Transcript of PERS Paper
8/3/2019 PERS Paper
http://slidepdf.com/reader/full/pers-paper 1/10
Habitat Mapping in Rugged Terrain UsingMultispectral Ikonos Images
Janet Nichol and Man Sing Wong
PHOTOGRAMMETR IC ENGINEER ING & REMOTE SENS ING November 2008 132
Department of Land Surveying and GeoInformatics, TheHong Kong Polytechnic University, ([email protected]).
Photogrammetric Engineering & Remote SensinVol. 74, No. 11, November 2008, pp. 1325–1334
0099-1112/08/7411–1325/$3.00© 2008 American Society for Photogrammetr
and Remote Sensin
AbstractDue to the significant time and cost requirements of traditional mapping techniques, accurate and detailed habitat maps for large areas are uncommon. This study investigates the application of Ikonos Very High Resolution( VHR) images to habitat mapping in the rugged terrain of Hong Kong’s country parks. A required mapping scale of 1:10 000, a minimum map object size of 150 m2 on theground, and a minimum accuracy level of 80 percent wereset as the mapping standards. Very high quality aerial
photographs and digital topographic maps provided accurate reference data for the image processing and habitat classification. A comparison between manual stereoscopic aerial photographic interpretation and imageclassification using pixel-based and object-based classifierswas carried out. The Multi-level Object Oriented Segmenta-tion with Decision Tree Classification ( MOOSC ) was devised during this study using a suite of image processing tech-niques to integrate spectral, textural, and spatial criteriawith ancillary data. Manual mapping from air photoscombined with fieldwork obtained the best result, with95 percent overall accuracy, but both this and the MOOSC
method, with 94 percent, easily met the 80 percent speci- fied accuracy standard. The MOOSC method was able toachieve similar accuracy aerial photographs, but at only
one third of the cost.
IntroductionBiodiversity conservation strategies call for comprehensiveinformation on the distribution of species and their habitatsas well as their changes over time. However, wildlife habitatmapping, as a discipline has suffered from several majorchallenges including:
1. the need to map at detailed level, usually over large areas,2. often indistinct boundaries between relevant vegetation
classes, requiring a large element of subjectivity (Green andHartley, 2000; Alexander and Millington, 2000),
3. the requirement for high levels of accuracy due to the slowrate of change,
4. many wildlife reserves occupy mountainous terrain, and5. lack of readily applicable automated methodologies because,even within the same climatic zone, vegetation communitiesmay be highly variable, thus mapping methodologies cannot
be extrapolated outside a particular study area.
Traditionally, manual air photo interpretation has beenused to extrapolate field observations over large areas. Sincestereo viewing is often necessary to identify habitat struc-ture, especially on steep slopes, it is time-consuming (Green
et al ., 1993). Even with digital photography, large areacoverage would require orthorectification of individualimages, resulting in potentially prohibitive costs.
The first ever habitat survey covering the whole 1,100km2 of Hong Kong at 1:20 000 scale was undertaken bythe Worldwide Fund for Nature in 1993 (Ashworth et al .,1993), using a combination of fieldwork and air photointerpretation. The resulting accuracy was low (R. Corlett,personal communication), and the maps were little used.Another such project, the 1:10 000 scale habitat survey
of Northumberland National Park, which was part of thePhase I national survey of Great Britain (Walton, 1993), wacarried out by air photo interpretation and required a totalof 717 people-days. The exercise was deemed too expensivto be repeated (Mehner et al ., 2004) given the low accuracy(Brookes et al ., 2000).
Attempts to improve accuracy and costs using satelliteimages have been limited by insufficient spatial resolutionof medium resolution sensors such as those on Landsat anSPOT1 through SPOT4. The low overall accuracy (approxi-mately 50 percent) obtained by a recent habitat surveycovering the whole of Hong Kong using SPOT4 and Landsatimages (Environmental Protection Department, 2003)appears to have been due to inadequate resolution, com-
bined with differences in solar illumination on opposite
slopes. For example, the accuracy of many cover typessuch as grassland, shrubby grassland and wetland, whenreferenced against field GPS data, was below 40 percent(Environmental Protection Department, 2003). Generally upto the present time, high accuracy in habitat mapping isdifficult to achieve (Brookes et al ., 2000).
If the problem of differential illumination in mountain-ous terrain can be solved, the new generation of VHR satellitsensors such as Ikonos with its 4 m multispectral resolutionhas greater potential (Slater and Brown, 2000). However, it irecognised that image processing techniques specific to thesesensors are required. Mather (1999) recommends the additioof texture to pixel-based classifiers due to the detectionof micro-scale texture properties at high-resolution (seefor example, Keramitsoglou et al . (2005)). Furthermore, since
on VHR sensors, natural habitats are composed of manydifferent reflectance surfaces, pixel-based classifiers areinappropriate. Thus, recent habitat mapping projects haveused object-based classifiers with VHR airborne, (Ehlers et al 2003) and satellite sensors (Bock et al ., 2005; Kobler et al .,2006). These have the ability to group pixels into discrete
8/3/2019 PERS Paper
http://slidepdf.com/reader/full/pers-paper 2/10
1326 November 2008 PHOTOGRAMMETRIC ENGINEERING & REMOTE SENSING
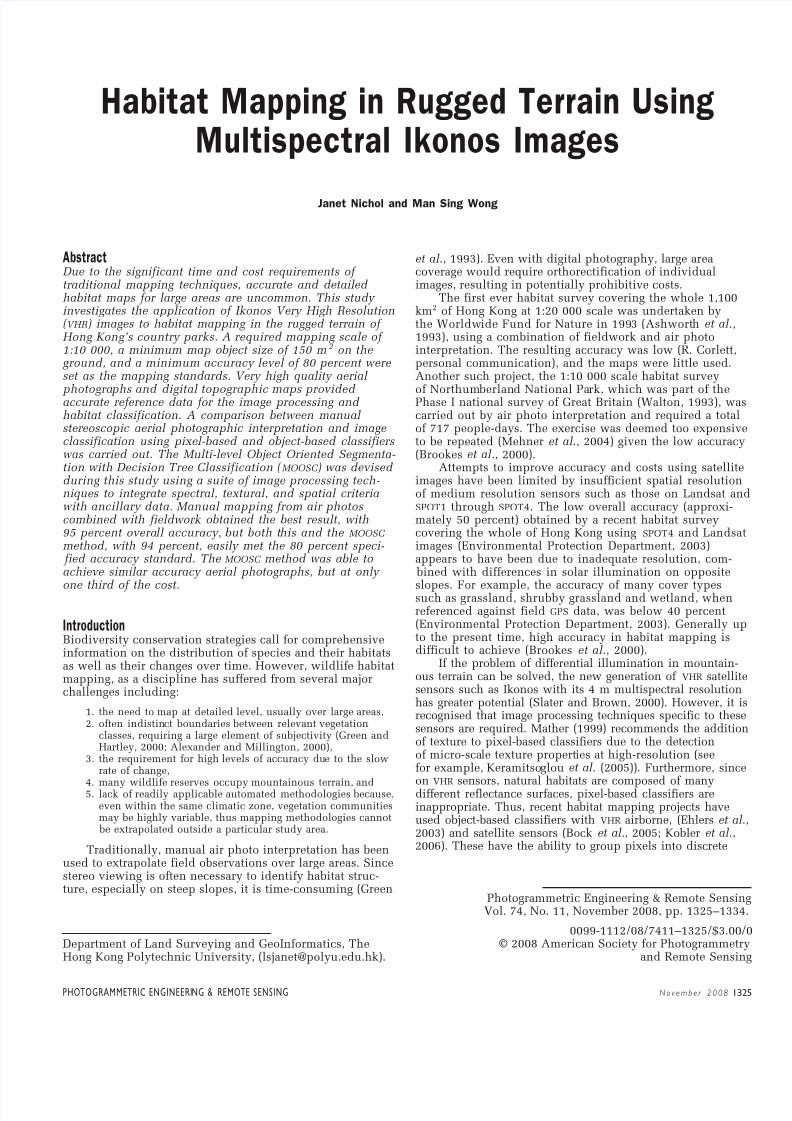
Figure 1. Location of Tai Mo Shan and Shing Muncountry parks in Hong Kong.
objects, or segments, based on both spectral details andspatial criteria such as size, shape, and local texture, andsegments may be defined at different scales (Baatz andSchäpe, 2000). The method of image segmentation has also
been applied successfully to stand level forest inventories(Pekkarinen, 2002; Wulder et al ., 2004).
Subsequently, segments may be allocated to classes usingan automated approach. For example, Kobler et al . (2006)devised a machine learning algorithm with a decision treestructure to allocate segments to habitat classes; and Bock
et al . (2005) used a nearest neighbor algorithm to allocatesegments derived from QuickBird images to habitat classes.Only low to moderate accuracy was achieved from these fullyautomated methods however, with Kappa classificationaccuracy of 0.6 by Kobler et al ., (2006) and 0.75 by Bock et al . (2005). A study by Ehlers et al . (2003) combining spatialand spectral image parameters with a semi-automated, rule-
based hierarchical procedure was able to achieve muchhigher accuracy, of well over 90 percent for some classes.However, the latter study was based on detailed airborne datawith 0.15 m ground resolution over flat terrain, and there isno indication that similar accuracy could be achieved usingsatellite images over large areas of rugged terrain as in thepresent study.
This study evaluates a semi-automated approach to
habitat mapping using Ikonos multispectral images in moun-tainous terrain by comparing the results with manual methodsusing high-resolution, stereo air photos and fieldwork. Thespecified mapping scale of 1:10 000 and a minimum objectsize of 100 m2 on the ground are initially set as attainablewith the 4 m spatial resolution of Ikonos. Thus, five Ikonospixels would comprise such an object. A minimum classaccuracy standard of 80 percent was also specified, followingthe recommendations of the USGS-NPS Vegetation MappingProgram for national scale mapping (USGS, 2006).
Three secondary objectives of the study include:
1. a comparison between pixel-based and object-basedclassifiers,
2. an assessment of the overall accuracy achievable from theimage processing approach, and
3. a cost benefit analysis comparing manual and digitaltechniques.
The Study Area and Images Used
The study area comprises an 11 km 11 km area of moun-tainous terrain containing the Tai Mo Shan and Shing Muncountry parks of the central New Territories, Hong Kong, at22°2N, 114°1E (Figure 1). Flat urban areas near the coastgive way to steep convex slopes rising to the mountain top of Tai Mo Shan at 900 m only 3 km from the coast and theShing Mun reservoir in the south-east occupies steep-sidedvalleys with slopes commonly 40° to 50°.
The climax vegetation of the south China region isevergreen broadleaf forest. Due to massive clearance during
WWII, Hong Kong’s forests are regenerating upslope fromlowland valleys (Dudgeon and Corlett, 2005). Shrub, whichis generally transitional to forest, and grasslands cover upperslopes and ridges (Dudgeon and Corlett, 2005), and both arefound at lower elevations following fire. In the study area,
both vertebrate and invertebrate fauna show distinct prefer-ences for either forest, grassland, or shrub habitats, whilethe invasion of shrubs into grassland is accompanied bya dramatic increase in fauna due to the patches of coveroffered by perennial shrubs within seasonal grassland. Thus,as habitat succession proceeds to increased shrub and treecover, the vertebrate community becomes more diverse andincludes more sensitive species such as thrushes, coucals,robins, and leaf warblers (Dudgeon and Corlett, 2005). Many
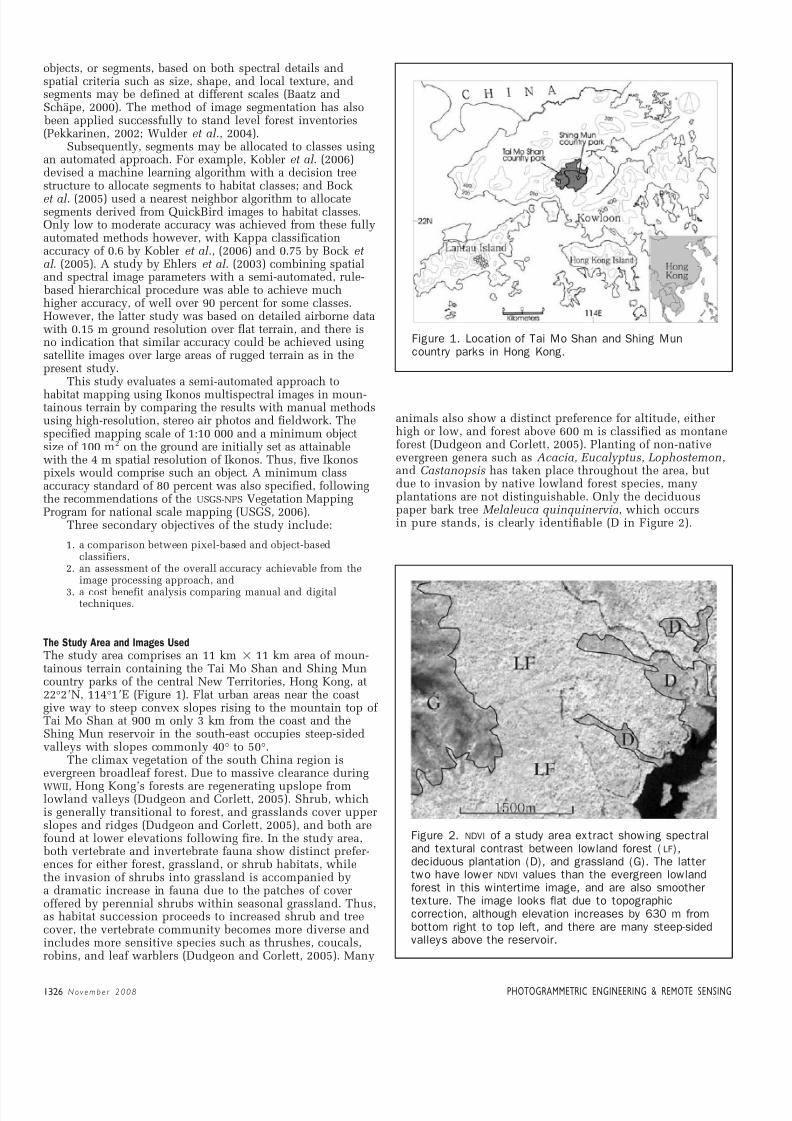
animals also show a distinct preference for altitude, eitherhigh or low, and forest above 600 m is classified as montaneforest (Dudgeon and Corlett, 2005). Planting of non-nativeevergreen genera such as Acacia, Eucalyptus, Lophostemon,and Castanopsis has taken place throughout the area, butdue to invasion by native lowland forest species, manyplantations are not distinguishable. Only the deciduouspaper bark tree Melaleuca quinquinervia, which occursin pure stands, is clearly identifiable (D in Figure 2).
Figure 2. NDVI of a study area extract showing spectraland textural contrast between lowland forest (LF),deciduous plantation (D), and grassland (G). The lattertwo have lower NDVI values than the evergreen lowlandforest in this wintertime image, and are also smoothertexture. The image looks flat due to topographiccorrection, although elevation increases by 630 m frombottom right to top left, and there are many steep-sidedvalleys above the reservoir.
8/3/2019 PERS Paper
http://slidepdf.com/reader/full/pers-paper 3/10
PHOTOGRAMMETR IC ENGINEER ING & REMOTE SENS ING November 2008 132
Wintertime images are considered more useful due to greatercontrast between the main structural cover types, broadleaf evergreen forest and plantations, deciduous plantations,shrub, and grassland. While forest maintains high photo-sysnthesis during the winter dry season, grassland, mainlyoccupying summits (G in Figure 2) dies back and exhibitslower Near Infra-Red (NIR) and green, and higher redreflectance. Shrublands also become semi-senescent duringthe winter dry season due to a less established root system,with reflectance values mid-way between that of grassland
and forest.A multispectral Ikonos image from 28 January 2003
having a sun elevation angle of 40° at the mid-morningimage collection time was used for the study. In orderto provide a frame of reference, the habitats were alsomanually interpreted using 38 true and false color stereophotographs, ranging in scales from 1:6 000 to 1:18 000(e.g., Plate 1c). The boundaries were delineated onto acolor digital orthophoto of 0.20 m resolution. This highquality aerial photographic resource, where individual treeand even shrub canopies could be identified (Plate 1d),compensated for the inaccessibility of many areas in thefield. At least two dates and times of photos were avail-able thus compensating for terrain shadows on someimages.
Methods
Image Preprocessing
Due to the relief of the study area, geometric and topo-graphic illumination corrections were undertaken prior tohabitat classification. Orthorectification of Ikonos imagerywas undertaken using Toutin and Cheng’s (2000) rigorousmodel with 61 GCPs from 1:1 000 scale digital maps from theHong Kong Lands Department with known accuracy within1 meter. Accuracy of the rectified image based on the meanaccuracy of 20 checkpoints at all elevations proved to bewithin half a pixel, i.e., 2 m.
The extremely low sun elevation angle in mid-January
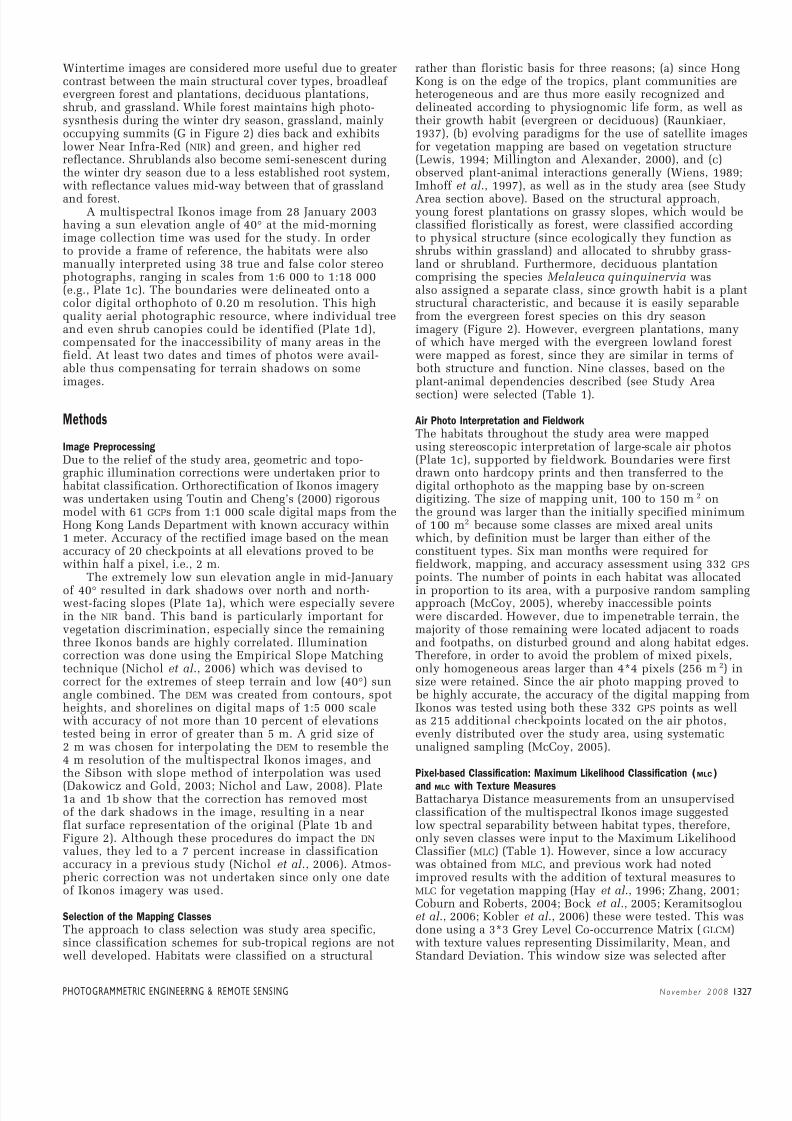
of 40° resulted in dark shadows over north and north-west-facing slopes (Plate 1a), which were especially severein the NIR band. This band is particularly important forvegetation discrimination, especially since the remainingthree Ikonos bands are highly correlated. Illuminationcorrection was done using the Empirical Slope Matchingtechnique (Nichol et al ., 2006) which was devised tocorrect for the extremes of steep terrain and low (40°) sunangle combined. The DEM was created from contours, spotheights, and shorelines on digital maps of 1:5 000 scalewith accuracy of not more than 10 percent of elevationstested being in error of greater than 5 m. A grid size of 2 m was chosen for interpolating the DEM to resemble the4 m resolution of the multispectral Ikonos images, andthe Sibson with slope method of interpolation was used
(Dakowicz and Gold, 2003; Nichol and Law, 2008). Plate1a and 1b show that the correction has removed mostof the dark shadows in the image, resulting in a nearflat surface representation of the original (Plate 1b andFigure 2). Although these procedures do impact the DN
values, they led to a 7 percent increase in classificationaccuracy in a previous study (Nichol et al ., 2006). Atmos-pheric correction was not undertaken since only one dateof Ikonos imagery was used.
Selection of the Mapping Classes
The approach to class selection was study area specific,since classification schemes for sub-tropical regions are notwell developed. Habitats were classified on a structural
rather than floristic basis for three reasons; (a) since HongKong is on the edge of the tropics, plant communities areheterogeneous and are thus more easily recognized anddelineated according to physiognomic life form, as well astheir growth habit (evergreen or deciduous) (Raunkiaer,1937), (b) evolving paradigms for the use of satellite imagefor vegetation mapping are based on vegetation structure(Lewis, 1994; Millington and Alexander, 2000), and (c)observed plant-animal interactions generally (Wiens, 1989;Imhoff et al ., 1997), as well as in the study area (see Study
Area section above). Based on the structural approach,young forest plantations on grassy slopes, which would beclassified floristically as forest, were classified accordingto physical structure (since ecologically they function asshrubs within grassland) and allocated to shrubby grass-land or shrubland. Furthermore, deciduous plantationcomprising the species Melaleuca quinquinervia wasalso assigned a separate class, since growth habit is a planstructural characteristic, and because it is easily separablefrom the evergreen forest species on this dry seasonimagery (Figure 2). However, evergreen plantations, manyof which have merged with the evergreen lowland forestwere mapped as forest, since they are similar in terms of
both structure and function. Nine classes, based on theplant-animal dependencies described (see Study Area
section) were selected (Table 1).
Air Photo Interpretation and Fieldwork
The habitats throughout the study area were mappedusing stereoscopic interpretation of large-scale air photos(Plate 1c), supported by fieldwork. Boundaries were firstdrawn onto hardcopy prints and then transferred to thedigital orthophoto as the mapping base by on-screendigitizing. The size of mapping unit, 100 to 150 m2 onthe ground was larger than the initially specified minimumof 100 m2 because some classes are mixed areal unitswhich, by definition must be larger than either of theconstituent types. Six man months were required forfieldwork, mapping, and accuracy assessment using 332 GP
points. The number of points in each habitat was allocated
in proportion to its area, with a purposive random samplinapproach (McCoy, 2005), whereby inaccessible pointswere discarded. However, due to impenetrable terrain, themajority of those remaining were located adjacent to roadsand footpaths, on disturbed ground and along habitat edgesTherefore, in order to avoid the problem of mixed pixels,only homogeneous areas larger than 4*4 pixels (256 m2) insize were retained. Since the air photo mapping proved to
be highly accurate, the accuracy of the digital mapping fromIkonos was tested using both these 332 GPS points as wellas 215 additional checkpoints located on the air photos,evenly distributed over the study area, using systematicunaligned sampling (McCoy, 2005).
Pixel-based Classification: Maximum Likelihood Classification (MLC)
and MLC with Texture MeasuresBattacharya Distance measurements from an unsupervisedclassification of the multispectral Ikonos image suggestedlow spectral separability between habitat types, therefore,only seven classes were input to the Maximum LikelihoodClassifier (MLC) (Table 1). However, since a low accuracywas obtained from MLC, and previous work had notedimproved results with the addition of textural measures toMLC for vegetation mapping (Hay et al ., 1996; Zhang, 2001;Coburn and Roberts, 2004; Bock et al ., 2005; Keramitsoglouet al ., 2006; Kobler et al ., 2006) these were tested. This wasdone using a 3*3 Grey Level Co-occurrence Matrix (GLCM)with texture values representing Dissimilarity, Mean, andStandard Deviation. This window size was selected after
8/3/2019 PERS Paper
http://slidepdf.com/reader/full/pers-paper 4/10
1328 November 2008 PHOTOGRAMMETRIC ENGINEERING & REMOTE SENSING
Plate 1. (a) Ikonos false color, 5 km2 extract of study area before illumination correction with linearcontrast stretch. From bottom right to top left, a distance of approximately 3 km, elevation rises from
170 m to 800 m. Many forested north-facing slopes (S) are in shadow; (b) Ikonos image extractfollowing illumination correction with linear contrast stretch. Shadows on north-facing slopes have beenremoved except for small areas in absolute shadow (S), and deciduous plantations of Melaleucaquinquinervia (D) are the only remaining extensive dark areas in the image.; (c) Color air photo of August 2002 at 1:8 000 scale, showing the high quality of air photos used. The area covered isoutlined on the Ikonos image (Plate 1b); and (d) Enlarged extract of Plate 1b, showing the grasslandto forest ecotone with a traverse across the habitat types, grassland (G), shrubby grassland (SG),shrubland (S) and lowland forest (LF). Traverse values represent the Chlorophyll Index values derivedfrom the Ikonos image; thin line represents pixel values and thick line represents segment values.
8/3/2019 PERS Paper
http://slidepdf.com/reader/full/pers-paper 5/10
PHOTOGRAMMETR IC ENGINEER ING & REMOTE SENS ING November 2008 132
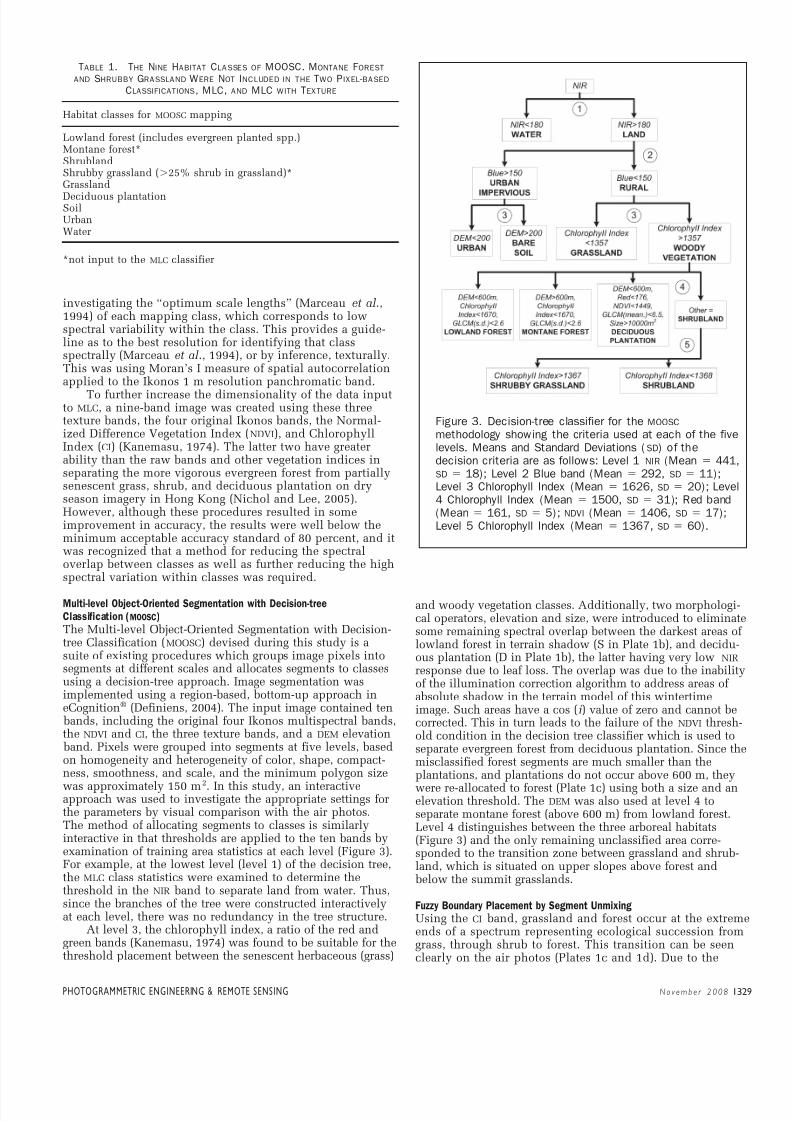
TABLE 1. THE NINE HABITAT CLASSES OF MOOSC. MONTANE FOREST
AND SHRUBBY GRASSLAND WERE NOT INCLUDED IN THE TWO PIXEL-BASED
CLASSIFICATIONS , MLC, AND MLC WITH TEXTURE
Habitat classes for MOOSC mapping
Lowland forest (includes evergreen planted spp.)Montane forest*ShrublandShrubby grassland (25% shrub in grassland)*Grassland
Deciduous plantationSoilUrbanWater
*not input to the MLC classifier
Figure 3. Decision-tree classifier for the MOOSC
methodology showing the criteria used at each of the fivelevels. Means and Standard Deviations (SD) of thedecision criteria are as follows: Level 1 NIR (Mean 441,SD 18); Level 2 Blue band (Mean 292, SD 11);Level 3 Chlorophyll Index (Mean 1626, SD 20); Level4 Chlorophyll Index (Mean 1500, SD 31); Red band(Mean 161, SD 5); NDVI (Mean 1406, SD 17);Level 5 Chlorophyll Index (Mean 1367, SD 60).
investigating the “optimum scale lengths” (Marceau et al .,1994) of each mapping class, which corresponds to lowspectral variability within the class. This provides a guide-line as to the best resolution for identifying that classspectrally (Marceau et al ., 1994), or by inference, texturally.This was using Moran’s I measure of spatial autocorrelationapplied to the Ikonos 1 m resolution panchromatic band.
To further increase the dimensionality of the data inputto MLC, a nine-band image was created using these threetexture bands, the four original Ikonos bands, the Normal-ized Difference Vegetation Index (NDVI), and ChlorophyllIndex (CI) (Kanemasu, 1974). The latter two have greaterability than the raw bands and other vegetation indices inseparating the more vigorous evergreen forest from partiallysenescent grass, shrub, and deciduous plantation on dryseason imagery in Hong Kong (Nichol and Lee, 2005).However, although these procedures resulted in someimprovement in accuracy, the results were well below theminimum acceptable accuracy standard of 80 percent, and itwas recognized that a method for reducing the spectraloverlap between classes as well as further reducing the highspectral variation within classes was required.
Multi-level Object-Oriented Segmentation with Decision-tree
Classification (MOOSC)
The Multi-level Object-Oriented Segmentation with Decision-tree Classification (MOOSC) devised during this study is asuite of existing procedures which groups image pixels intosegments at different scales and allocates segments to classesusing a decision-tree approach. Image segmentation wasimplemented using a region-based, bottom-up approach ineCognition® (Definiens, 2004). The input image contained ten
bands, including the original four Ikonos multispectral bands,the NDVI and CI, the three texture bands, and a DEM elevation
band. Pixels were grouped into segments at five levels, basedon homogeneity and heterogeneity of color, shape, compact-ness, smoothness, and scale, and the minimum polygon size
was approximately 150 m2
. In this study, an interactiveapproach was used to investigate the appropriate settings forthe parameters by visual comparison with the air photos.The method of allocating segments to classes is similarlyinteractive in that thresholds are applied to the ten bands byexamination of training area statistics at each level (Figure 3).For example, at the lowest level (level 1) of the decision tree,the MLC class statistics were examined to determine thethreshold in the NIR band to separate land from water. Thus,since the branches of the tree were constructed interactivelyat each level, there was no redundancy in the tree structure.
At level 3, the chlorophyll index, a ratio of the red andgreen bands (Kanemasu, 1974) was found to be suitable for thethreshold placement between the senescent herbaceous (grass)
and woody vegetation classes. Additionally, two morphologi-cal operators, elevation and size, were introduced to eliminatesome remaining spectral overlap between the darkest areas oflowland forest in terrain shadow (S in Plate 1b), and decidu-ous plantation (D in Plate 1b), the latter having very low NIR
response due to leaf loss. The overlap was due to the inabilityof the illumination correction algorithm to address areas of absolute shadow in the terrain model of this wintertimeimage. Such areas have a cos (i ) value of zero and cannot becorrected. This in turn leads to the failure of the NDVI thresh-old condition in the decision tree classifier which is used toseparate evergreen forest from deciduous plantation. Since themisclassified forest segments are much smaller than theplantations, and plantations do not occur above 600 m, they
were re-allocated to forest (Plate 1c) using both a size and anelevation threshold. The DEM was also used at level 4 toseparate montane forest (above 600 m) from lowland forest.Level 4 distinguishes between the three arboreal habitats(Figure 3) and the only remaining unclassified area corre-sponded to the transition zone between grassland and shrub-land, which is situated on upper slopes above forest and
below the summit grasslands.
Fuzzy Boundary Placement by Segment Unmixing
Using the CI band, grassland and forest occur at the extremends of a spectrum representing ecological succession fromgrass, through shrub to forest. This transition can be seenclearly on the air photos (Plates 1c and 1d). Due to the
8/3/2019 PERS Paper
http://slidepdf.com/reader/full/pers-paper 6/10
1330 November 2008 PHOTOGRAMMETRIC ENGINEERING & REMOTE SENSING
wildlife importance of shrub succession in grassland(Dudgeon and Corlett, 2004), it was decided to use this
band, to determine the thresholds for an additional class,shrubby grassland having a 25 percent proportion of shrubwithin grassland. The threshold between grassland andshrubby grassland was computed theoretically using pureforest and grassland endmembers taken from training areason the image. The 4 m pixel size of Ikonos facilitates this,as pure pixels representing the endmembers are available atthis resolution. Thus, for example, the CI value of a segment
containing 75 percent grass and 25 percent forest, computedfrom the weighted endmember mean values is 1,367, andvisual comparison with the air photos confirmed it to berealistic (Plate 1d).
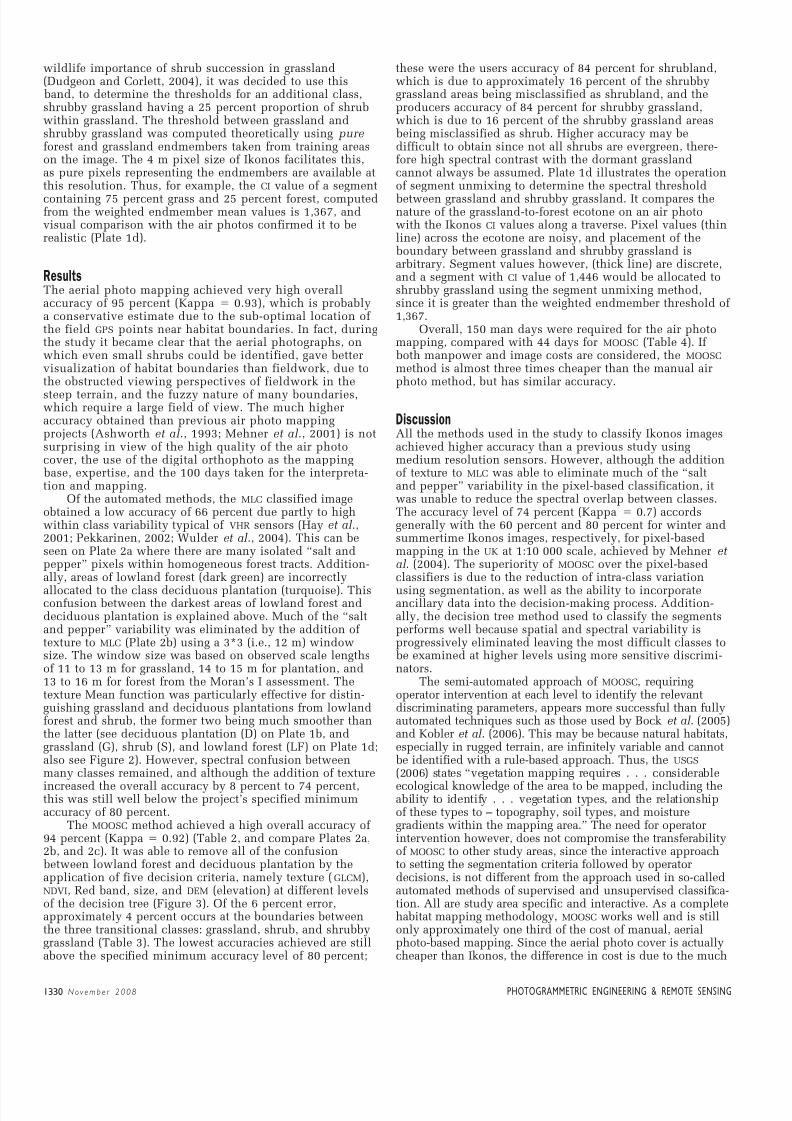
ResultsThe aerial photo mapping achieved very high overallaccuracy of 95 percent (Kappa 0.93), which is probablya conservative estimate due to the sub-optimal location of the field GPS points near habitat boundaries. In fact, duringthe study it became clear that the aerial photographs, onwhich even small shrubs could be identified, gave bettervisualization of habitat boundaries than fieldwork, due tothe obstructed viewing perspectives of fieldwork in the
steep terrain, and the fuzzy nature of many boundaries,which require a large field of view. The much higheraccuracy obtained than previous air photo mappingprojects (Ashworth et al ., 1993; Mehner et al ., 2001) is notsurprising in view of the high quality of the air photocover, the use of the digital orthophoto as the mapping
base, expertise, and the 100 days taken for the interpreta-tion and mapping.
Of the automated methods, the MLC classified imageobtained a low accuracy of 66 percent due partly to highwithin class variability typical of VHR sensors (Hay et al .,2001; Pekkarinen, 2002; Wulder et al ., 2004). This can beseen on Plate 2a where there are many isolated “salt andpepper” pixels within homogeneous forest tracts. Addition-ally, areas of lowland forest (dark green) are incorrectly
allocated to the class deciduous plantation (turquoise). Thisconfusion between the darkest areas of lowland forest anddeciduous plantation is explained above. Much of the “saltand pepper” variability was eliminated by the addition of texture to MLC (Plate 2b) using a 3*3 (i.e., 12 m) windowsize. The window size was based on observed scale lengthsof 11 to 13 m for grassland, 14 to 15 m for plantation, and13 to 16 m for forest from the Moran’s I assessment. Thetexture Mean function was particularly effective for distin-guishing grassland and deciduous plantations from lowlandforest and shrub, the former two being much smoother thanthe latter (see deciduous plantation (D) on Plate 1b, andgrassland (G), shrub (S), and lowland forest (LF) on Plate 1d;also see Figure 2). However, spectral confusion betweenmany classes remained, and although the addition of texture
increased the overall accuracy by 8 percent to 74 percent,this was still well below the project’s specified minimumaccuracy of 80 percent.
The MOOSC method achieved a high overall accuracy of 94 percent (Kappa 0.92) (Table 2, and compare Plates 2a,2b, and 2c). It was able to remove all of the confusion
between lowland forest and deciduous plantation by theapplication of five decision criteria, namely texture (GLCM),NDVI, Red band, size, and DEM (elevation) at different levelsof the decision tree (Figure 3). Of the 6 percent error,approximately 4 percent occurs at the boundaries betweenthe three transitional classes: grassland, shrub, and shrubbygrassland (Table 3). The lowest accuracies achieved are stillabove the specified minimum accuracy level of 80 percent;
these were the users accuracy of 84 percent for shrubland,which is due to approximately 16 percent of the shrubbygrassland areas being misclassified as shrubland, and theproducers accuracy of 84 percent for shrubby grassland,which is due to 16 percent of the shrubby grassland areas
being misclassified as shrub. Higher accuracy may bedifficult to obtain since not all shrubs are evergreen, there-fore high spectral contrast with the dormant grasslandcannot always be assumed. Plate 1d illustrates the operationof segment unmixing to determine the spectral threshold
between grassland and shrubby grassland. It compares thenature of the grassland-to-forest ecotone on an air photowith the Ikonos CI values along a traverse. Pixel values (thinline) across the ecotone are noisy, and placement of the
boundary between grassland and shrubby grassland isarbitrary. Segment values however, (thick line) are discrete,and a segment with CI value of 1,446 would be allocated toshrubby grassland using the segment unmixing method,since it is greater than the weighted endmember threshold of 1,367.
Overall, 150 man days were required for the air photomapping, compared with 44 days for MOOSC (Table 4). If
both manpower and image costs are considered, the MOOSC
method is almost three times cheaper than the manual airphoto method, but has similar accuracy.
DiscussionAll the methods used in the study to classify Ikonos imagesachieved higher accuracy than a previous study usingmedium resolution sensors. However, although the additionof texture to MLC was able to eliminate much of the “saltand pepper” variability in the pixel-based classification, itwas unable to reduce the spectral overlap between classes.The accuracy level of 74 percent (Kappa 0.7) accordsgenerally with the 60 percent and 80 percent for winter andsummertime Ikonos images, respectively, for pixel-basedmapping in the UK at 1:10 000 scale, achieved by Mehner et al . (2004). The superiority of MOOSC over the pixel-basedclassifiers is due to the reduction of intra-class variation
using segmentation, as well as the ability to incorporateancillary data into the decision-making process. Addition-ally, the decision tree method used to classify the segmentsperforms well because spatial and spectral variability isprogressively eliminated leaving the most difficult classes to
be examined at higher levels using more sensitive discrimi-nators.
The semi-automated approach of MOOSC, requiringoperator intervention at each level to identify the relevantdiscriminating parameters, appears more successful than fullyautomated techniques such as those used by Bock et al . (2005)and Kobler et al . (2006). This may be because natural habitats,especially in rugged terrain, are infinitely variable and cannot
be identified with a rule-based approach. Thus, the USGS
(2006) states “vegetation mapping requires . . . considerable
ecological knowledge of the area to be mapped, including theability to identify . . . vegetation types, and the relationshipof these types to – topography, soil types, and moisturegradients within the mapping area.” The need for operatorintervention however, does not compromise the transferabilityof MOOSC to other study areas, since the interactive approachto setting the segmentation criteria followed by operatordecisions, is not different from the approach used in so-calledautomated methods of supervised and unsupervised classifica-tion. All are study area specific and interactive. As a completehabitat mapping methodology, MOOSC works well and is stillonly approximately one third of the cost of manual, aerialphoto-based mapping. Since the aerial photo cover is actuallycheaper than Ikonos, the difference in cost is due to the much
8/3/2019 PERS Paper
http://slidepdf.com/reader/full/pers-paper 7/10
PHOTOGRAMMETR IC ENGINEER ING & REMOTE SENS ING November 2008 133
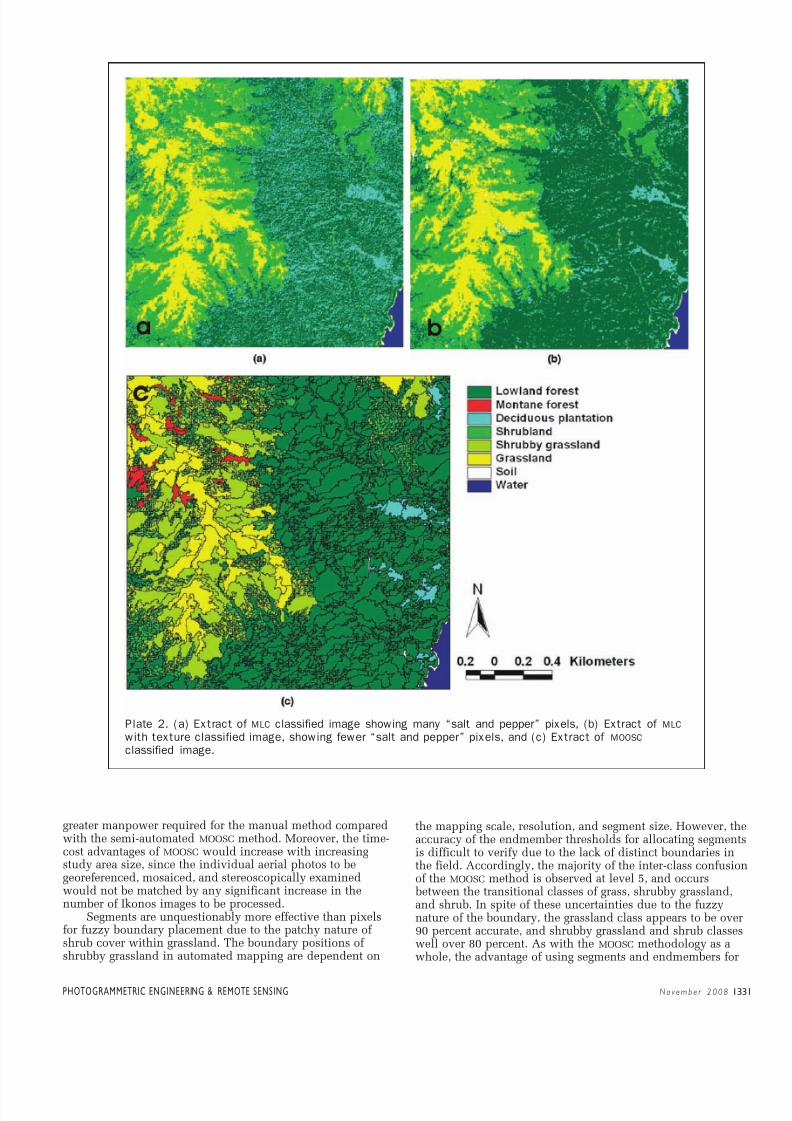
Plate 2. (a) Extract of MLC classified image showing many “salt and pepper” pixels, (b) Extract of MLC
with texture classified image, showing fewer “salt and pepper” pixels, and (c) Extract of MOOSC
classified image.
greater manpower required for the manual method comparedwith the semi-automated MOOSC method. Moreover, the time-cost advantages of MOOSC would increase with increasingstudy area size, since the individual aerial photos to begeoreferenced, mosaiced, and stereoscopically examinedwould not be matched by any significant increase in thenumber of Ikonos images to be processed.
Segments are unquestionably more effective than pixelsfor fuzzy boundary placement due to the patchy nature of shrub cover within grassland. The boundary positions of shrubby grassland in automated mapping are dependent on
the mapping scale, resolution, and segment size. However, theaccuracy of the endmember thresholds for allocating segmentis difficult to verify due to the lack of distinct boundaries inthe field. Accordingly, the majority of the inter-class confusioof the MOOSC method is observed at level 5, and occurs
between the transitional classes of grass, shrubby grassland,and shrub. In spite of these uncertainties due to the fuzzynature of the boundary, the grassland class appears to be over90 percent accurate, and shrubby grassland and shrub classeswell over 80 percent. As with the MOOSC methodology as awhole, the advantage of using segments and endmembers for

8/3/2019 PERS Paper
http://slidepdf.com/reader/full/pers-paper 8/10
1332 November 2008 PHOTOGRAMMETRIC ENGINEERING & REMOTE SENSING
TABLE 2. MOOSC ACCURACY ASSESSMENT
Lowland Shrub Shrubby Grass Montane Decid. Rock/ RowForest land Grassland land forest Plantation soil Urban Water Total
Lowlandforest 145 2 0 0 1 3 0 0 0 151
Shrubland 43 9 1 1 0 0 0 0 54Shrubby 0 1 69 3 0 0 0 0 0 73
grassland 0Grassland 0 3 4 104 0 0 3 0 0 114
Montane 0 0 0 0 26 0 0 0 0 26forest
Decid. 0 0 0 0 0 42 0 0 42plantation
Rock/Soil 0 0 0 0 0 0 20 0 0 20Urban 0 0 0 0 0 0 0 29 0 29Water 0 0 0 0 0 0 0 0 28 28Column 145 49 82 108 28 45 23 29 28 537
total
Class User’s Accuracy Producer’s accuracy
Lowland forest 95 100Shrubland 84 88Shrubby grassland 95 84
Grassland 91 96Montane forest 100 93Decid. plantation 100 93Rock/Soil 100 87Urban 100 100Water 100 100
NB. Overall accuracy 94%; Kappa 0.9
boundary placement lies in their objectivity, such that thesame criteria and spectral thresholds may be used in repeatstudies to identify ecosystem change.
ConclusionsThis study demonstrates improvements in both cost andaccuracy for habitat mapping which are an order of magni-tude higher than previous similar projects in Hong Kong,and reflects the state of the art in satellite image technologyand methodology. Mehner et al . (2004) conclude that VHR
sensors such as Ikonos can provide a useful tool, offeringthe potential for mapping upland vegetation in UK at thesame mapping scale as this project, i.e., 1:10 000. Theresults presented here suggest that the MOOSC method, basedon rigorous exploitation of the spatial and spectral character-istics of Ikonos multispectral imagery may be used toreplace traditional manual interpretation, at a level of accuracy far exceeding US vegetation mapping standards.This high level of accuracy has been achieved in a challeng-ing environment, namely using wintertime images in
mountainous terrain. The MOOSC method is flexible enoughto be applied to any study area, since it accommodates aninteractive approach to the placement of spatial and spectralthresholds. Moreover, MOOSC is more repeatable than manualtechniques, and the same image-based thresholds can beused at a future date.
TABLE 3. ACCURACY OF DIFFERENT MAPPING TECHNIQUES
Method No. of Reference Overall Kappa Coefficientpoints used Accuracy
API 322 95% 0.93
MLC 547 66% 0.58MLC withtexture 547 74% 0.7
MOOSC 547 94% 0.92
TABLE 4. RELATIVE COSTS ($US) OF DATA ACQUISITION AND PROCESSING
FOR HABITAT SURVEY FOR 100 KM2 at 1:10 000 SCALE
Color Aerial IkonosPhotographs
No. of images 70* 1 70**
Resolution (m) 0.2 4Material cost of 960 2,460images (US$)
Time (h)/cost*** 250/5,000 6/120geoferencing & mosaicing
Time/cost topographic NA 24/480correction
Time/cost interpretation 800/16,000 160/3,200and mapping
Time/cost fieldwork 160/3,200 160/3,200Total man days 150 44Total job cost 25,160 9,460Cost with image 33,160**** 12,460*****
acquisition added
*50 air photos for stereo viewing, and creation of DigitalOrthophoto as mapping base, and 20 additional prints of different
date, to compensate terrain shadow**one Ikonos image plus air photos to assist accuracy assessment***time in hours is costed at US $20 per hour****aircraft one day $6,475*****tasking of Ikonos $3,000

8/3/2019 PERS Paper
http://slidepdf.com/reader/full/pers-paper 9/10
PHOTOGRAMMETR IC ENGINEER ING & REMOTE SENS ING November 2008 133
In view of the greatly reduced cost, repeatability, andsimilar accuracy to manual techniques obtained from theMOOSC methodology, the results strongly recommend VHR
multispectral satellite imagery, such as Ikonos, as the bestchoice for habitat mapping at 1:10 000 scale.
AcknowledgmentsThe assistance and advice of Professor Richard Corlett of the
Department of Ecology and Biodiversity, the University of Hong Kong were invaluable in devising the field strategy forthis project, and Miss Tang Yuen-fun helped with the fieldmapping. The authors would also like to acknowledgefinancial support from Grant PolyU 5166/03E from the HongKong Research Grants Council.
ReferencesAshworth, J.M., R.T. Corlett, D. Dudgeon, D.S. Melville, and W.S.M.
Tang, 1993. Hong Kong Flora and Fauna: Computing Conserva-tion, World Wide Fund for Nature.
Baatz, M., and A. Schäpe, 2000. Multiresolution segmentation – Anoptimization approach for high quality multi-scale imagesegmentation, Angewandte Geographische Informationsverar-
beitung XII (T. Strobl, T. Blaschke, and G. Griesebner, editors),Beiträge zum, AGIT-Symposium Salzburg, Kerlsruhe: HerbertWichmann Verlag.
Barnsley, M.J., and S.L. Barr, 1996. Inferring urban land use fromsatellite sensor images using kernel-based spatial reclassifica-tion, Photogrammetric Engineering & Remote Sensing ,62(10):949–958.
Bock, M., P. Xofis, J. Mitchley, G. Rossner, and M. Wissen, 2005.Objected-oriented methods for habitat mapping at multiplescales-Case studies from Northern Germany and Wye Downs,UK, Journal for Nature Conservation, 13:75–89.
Brookes, A.M., Furse, M.T., and Fuller, R.M., 2000. An assessmentof the land cover map of Great Britain within headwater streamcatchments for four river systems in England and Wales(R. Alexander and A. Millington, editors), Vegetation Mapping ,Wiley, Chichester, UK, pp.177–192.
Coburn, C.A., and A.C.B. Roberts, 2004. A multiscale textureanalysis procedure for improved forest stand classification,International Journal of Remote Sensing , 25:4287–4308.
Corlett, R.T., 2000. Environmental heterogeneity and speciessurvival in degraded tropical landscapes, The Ecological Consequences of Environmental Heterogeneity (M.J. Hutchings,Elizabeth A. John, and Alan J.A. Stewart, editors), BlackwellScience, Oxford, 434 p.
Dakowicz, M., and C. Gold, 2003. Extracting meaningful slopes fromterrain contours, International Journal of Computational Geometric Applications, 13:339–357.
Definiens, 2004. eCognition User Guide 4, Definiens Imaging GmbH,Munich.
Dudgeon, D., and R.T. Corlett, 2004. The Ecology and Biodiversity of Hong Kong , Friends of the Country parks, 336 p.
Ehlers, M., M. Gähler, and R. Janowsky, 2003. Automated analysisof ultra high resolution remote sensing data for biotope typemapping: New possibilities and challenges, ISPRS Journal of Photogrammetry and Remote Sensing , 57:315–326.
Environmental Protection Department, 2003. Environmental Baseline Survey: Ranking Based on Conservation Value,URL: http://www.epd.gov.hk/epd/english/environmentinhk/eia_
planning/sea2005/terresthab.html , Environmental ProtectionDepartment, The Government of Hong Kong Special Adminis-tration Region (last date accessed: 04 July 2008).
Green, D.R., R. Cummins, R. Wright, and J. Miles, 1993. A method-ology for acquiring information on vegetation succession fromremotely sensed imagery, Landscape Ecology and GIS(R. Haines-Young, D.R. Green, and S. Cousins, editors), Taylor &Francis, London, pp. 111–128.
Green, D.R., and S. Hartley, 2000. Integrating photo-interpretationand GIS for vegetation mapping: Some issues of errorVegetation Mapping (R. Alexander and A. Millington, editors),Wiley, Chichester, pp.103–135.
Hay, G.J., K.O. Niemann, and G.F. McLean, 1996. An object-specificimage-texture analysis of H-resolution forest imagery, RemoteSensing of Environment , 55:108–122.
Hay, D.S., D.J. Marceau, P. Dube, and A. Boulard, 2001. A multi-scale framework for landscape analysis: Object specific analysiand upscaling, Landscape Ecology , 16:471–490.
Imhoff, M.L., T.D. Sisk, A. Milne, G. Morgan, and T. Orr, 1997.Remotely sensed indicators of habitat heterogeneity: Use of synthetic aperture radar in mapping vegetation structure and
bird habitat, Remote Sensing of Environment , 60:217–227.
Kanemasu, E.T., 1974. Seasonal canopy reflectance patterns of wheat, sorghum and soyabean, Remote Sensing of Environmen3:43–47.
Keramitsoglu, I., H. Sarimveis, C.T. Kiranoudis, C. Kontoes, N.Sifakis, and E. Fitoka, 2006. The performance of pixel windowalgorithms in the classification of habitats using VHSR imageryISPRS Journal of Photogrammetry and Remote Sensing ,60:225–238.
Kobler, A., S. Dzeroski, and I. Keramitsoglou, 2006. Habitatmapping using machine learning-extended kernel-basedreclassification of an Ikonos satellite image, Ecological Model-ling , 19:83–95.
Lewis, M.M., 1994. Species composition related to spectral classifi-cation in an Australian spinifex hummock grassland, Interna-tional Journal of Remote Sensing , 15:3223–3239.
Marceau, D.P., P.J. Howarth, and D. Gratton, 1994. Remote sensingand the measurement of geographical entities in a forestenvironment: 1. The scale and spatial aggregation problem,Remote Sensing of Environment , 49:93–104.
Mather, P.M., 1999. Computer Processing of Remotely Sensed Images: An Introduction, London: John Wiley & Sons, 292 p.
McCoy, R.M., 2005. Field Methods in Remote Sensing , The Guild-ford Press, New York, 159 p.
Mehner, H., M.E.J. Cutler, D. Fairbairn, and G. Thompson, 2004.Remote sensing of upland vegetation: The potential of highspatial resolution satellite sensors, Global Ecology and Biogeography , 13:359–369.
Millington, A., and R.W. Alexander, 2000. Vegetation mapping in
the last three decades of the twentieth century, VegetationMapping (R. Alexander and A. Millington, editors), Wiley,Chichester, UK, pp. 321–332.
Nichol, J.E., and C.M. Lee, 2005. Urban vegetation monitoring inHong Kong using high resolution multispectral images,International Journal of Remote Sensing , 26(5):903–919.
Nichol, J.E., K.H. Law, and M.S. Wong, 2006. Empirical correctionof low sun angle images in steeply sloping terrain: A slopematching technique, International Journal of Remote Sensing ,27:629–635.
Nichol, J.E., and K.H. Law, 2008 The influence of DEM accuracy ontopographic correction of Ikonos satellite images, Photogram-metric Engineering & Remote Sensing , 74(1):47–53.
Pekkarinen, A., 2002. A method for the segmentation of very highspatial resolution images of forested landscapes, International
Journal of Remote Sensing , 27:629–635.Raunkiaer, C., 1937. Plant Life Forms, Clarendon Press, Oxford, UK
Slater, J., and R. Brown, 2000. Changing landscapes:Monitoring environmentally sensitive areas using satelliteimagery, International Journal of Remote Sensing , 21:2753–2767
Toutin, T., and P. Cheng, 2000. Demystification of Ikonos, EarthObservation Magazine, 9, URL:http://www.eomonline.com/ Common/Archives/2000jul/00jul_touin.html , GITC America, InArticles, USA, (last date accessed: 04 July 2008).
USGS, 2006. USGS-NPS Vegetation Mapping Program, U.S.Geological Survey. URL: http://biology.usgs.gov/npsveg/ , USGS(last date accessed: 04 July 2008).
Walton, D.D., 1993. Northumberland National Park Phase OneHabitat Survey , Report of survey results presented to NNPA

8/3/2019 PERS Paper
http://slidepdf.com/reader/full/pers-paper 10/10
and English Nature, Northumberland National Park Report,Berwick-upon-Tweed.
Wiens, J.A., 1989. The Ecology of Bird Communities, CambridgeUniversity Press, New York.
Wulder, M.A., R.S. Skakun, W.A. Kurz, and J.C. White, 2004. Estimatingtime since forest harvest using segmented Landsat ETM1 imagery,Remote Sensing of Environment, 93:179–187.
1334 November 2008 PHOTOGRAMMETRIC ENGINEERING & REMOTE SENSING
Zhang, Y., 2001. Texture-integrated classification of urban treed areasin high-resolution color-infrared imagery, PhotogrammetricEngineering & Remote Sensing , 67(11):1359–1365.
(Received 04 August 2006; accepted 13 November 2006; revised20 February 2007)