Permeable Pavement Technical Standard - Rationale Behind ...
43
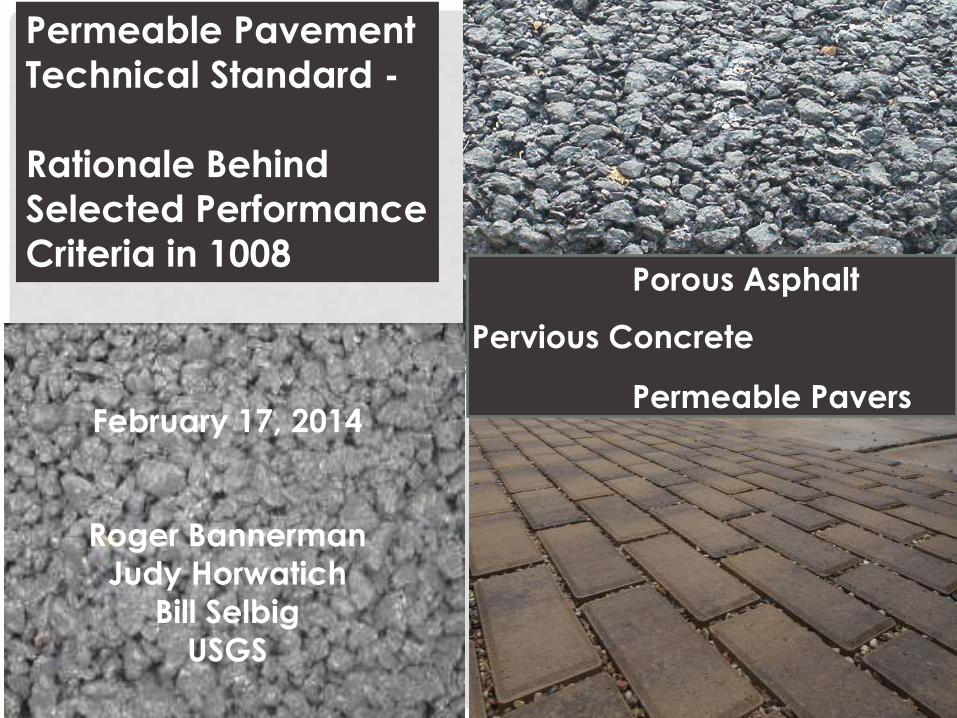
Permeable Pavement Technical Standard - Rationale Behind Selected Performance Criteria in 1008 Porous Asphalt Permeable Pavers Pervious Concrete February 17, 2014 Roger Bannerman Judy Horwatich Bill Selbig USGS
Transcript of Permeable Pavement Technical Standard - Rationale Behind ...
Permeable Pavement
Technical Standard -
Rationale Behind
Selected Performance
Criteria in 1008 Porous Asphalt
Permeable Pavers
Pervious Concrete
February 17, 2014
Roger Bannerman
Judy Horwatich
Bill Selbig
USGS
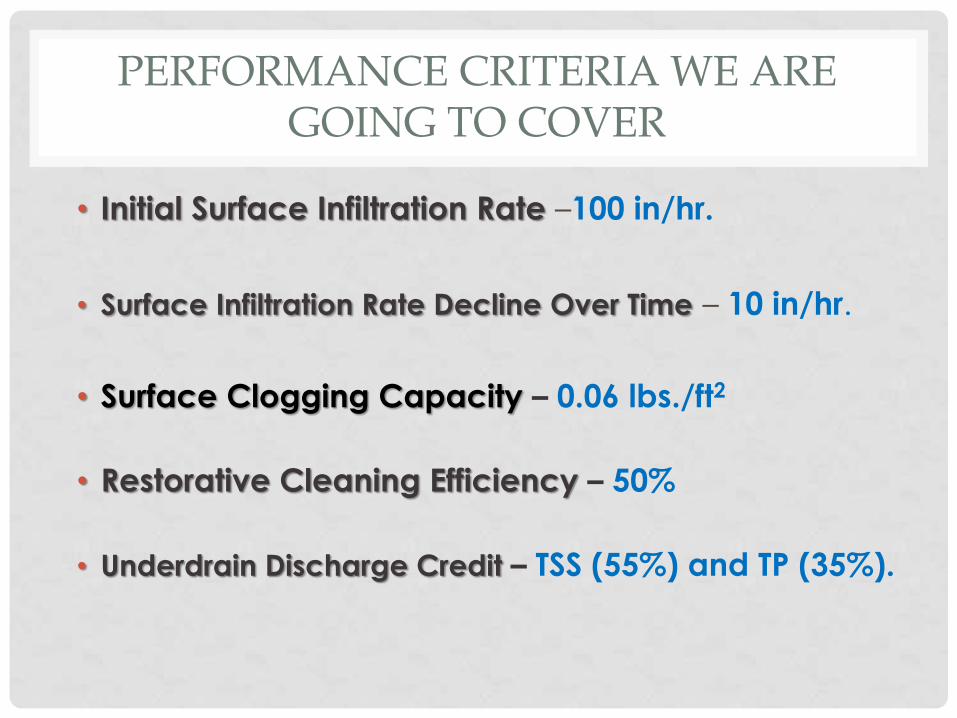
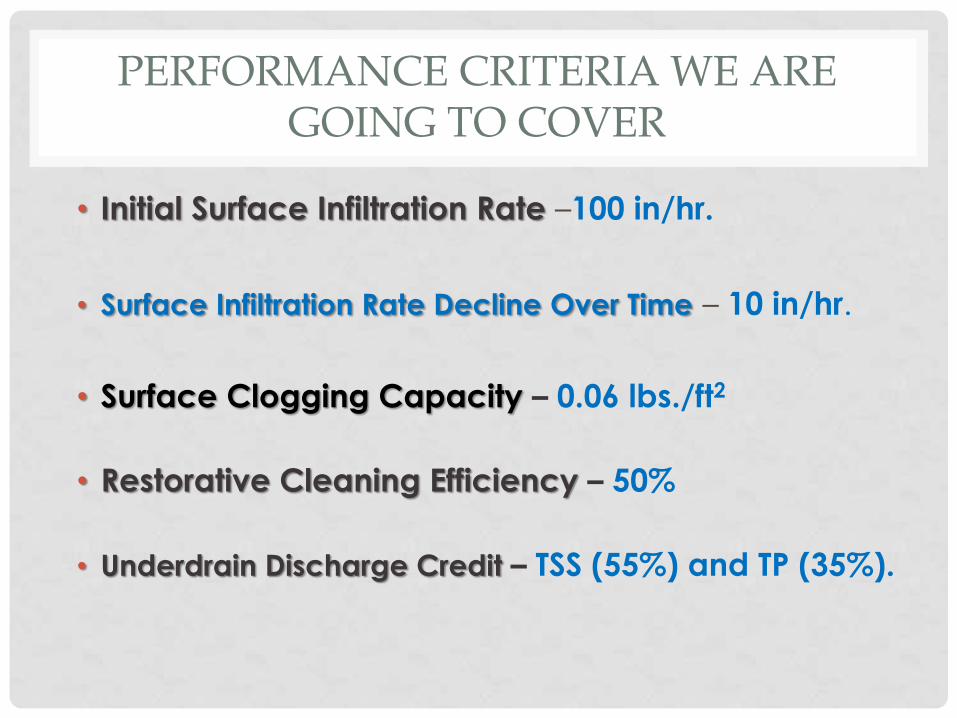
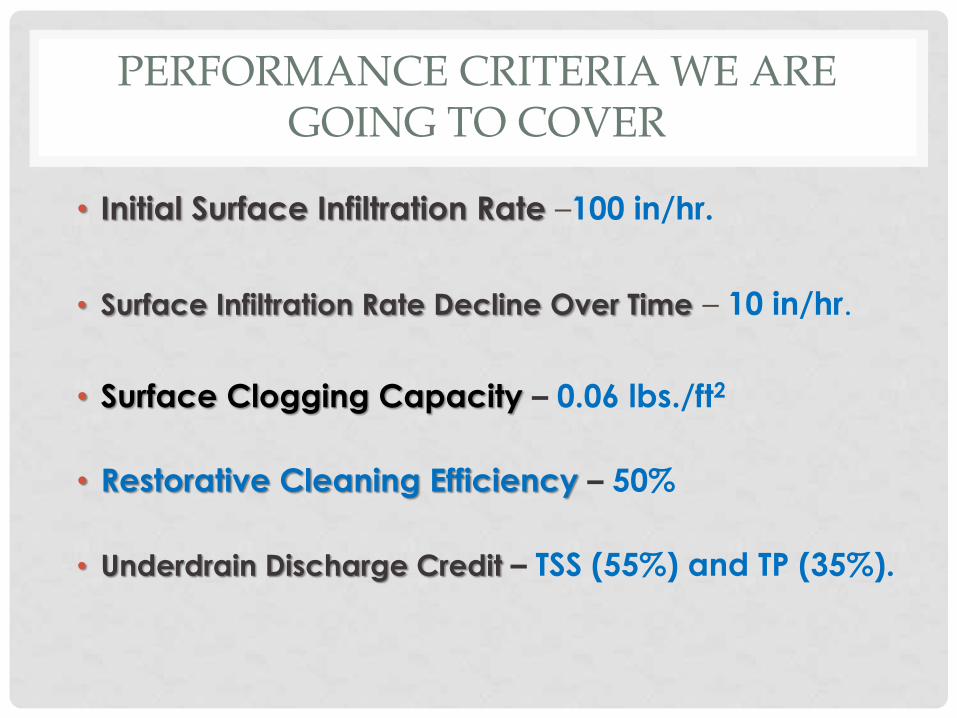
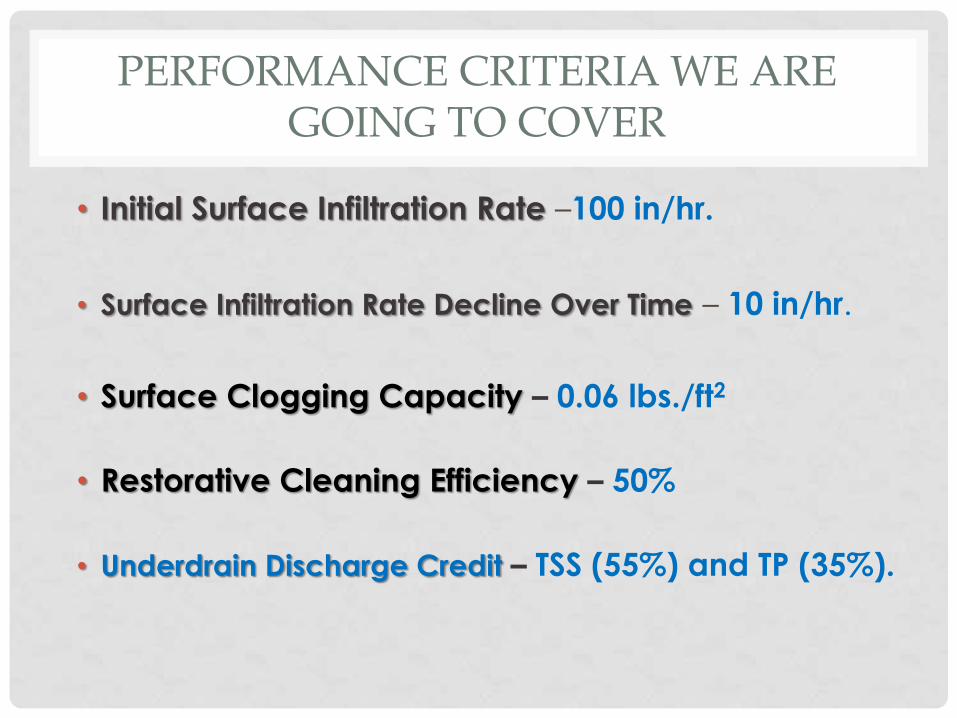
PERFORMANCE CRITERIA WE ARE GOING TO COVER
• Initial Surface Infiltration Rate –100 in/hr.
• Surface Infiltration Rate Decline Over Time – 10 in/hr.
• Surface Clogging Capacity – 0.06 lbs./ft2
• Restorative Cleaning Efficiency – 50%
• Underdrain Discharge Credit – TSS (55%) and TP (35%).
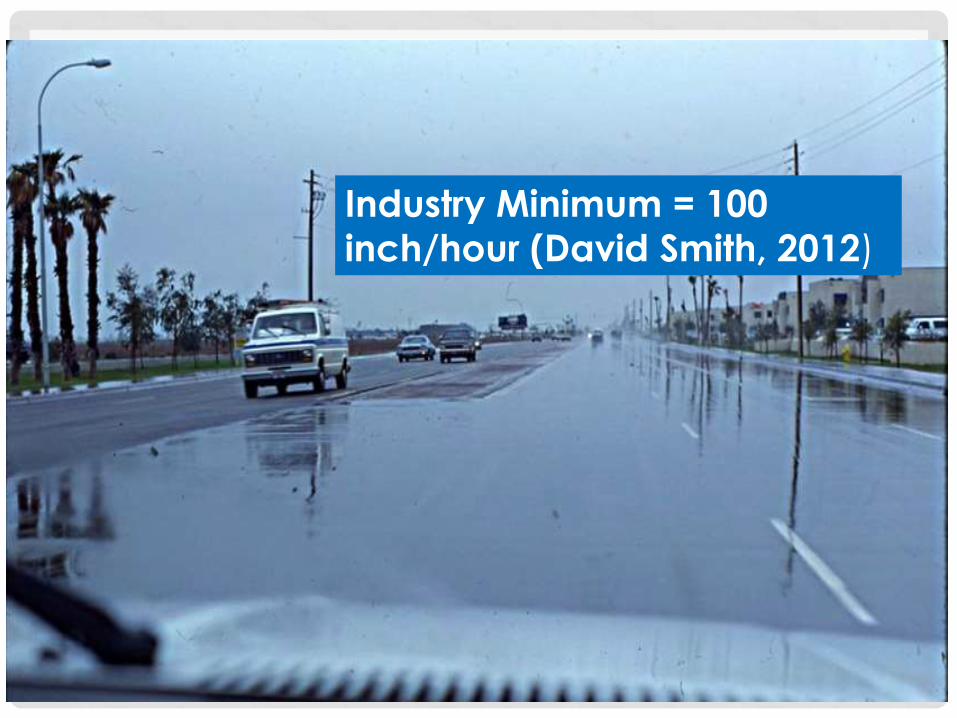
Industry Minimum = 100 inch/hour (David Smith, 2012)
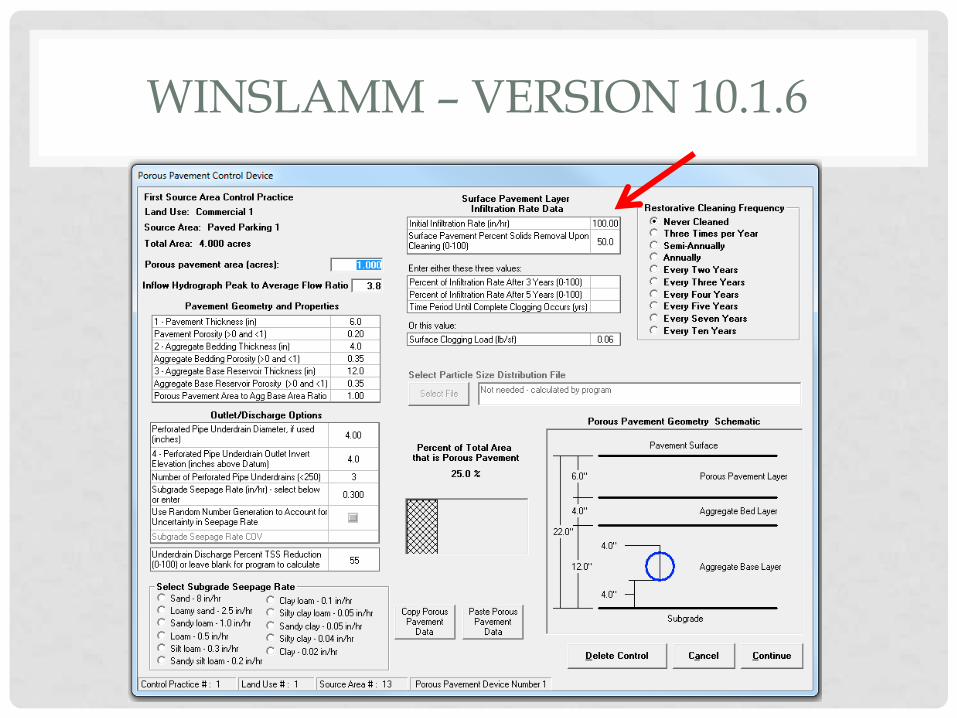
WINSLAMM – VERSION 10.1.6
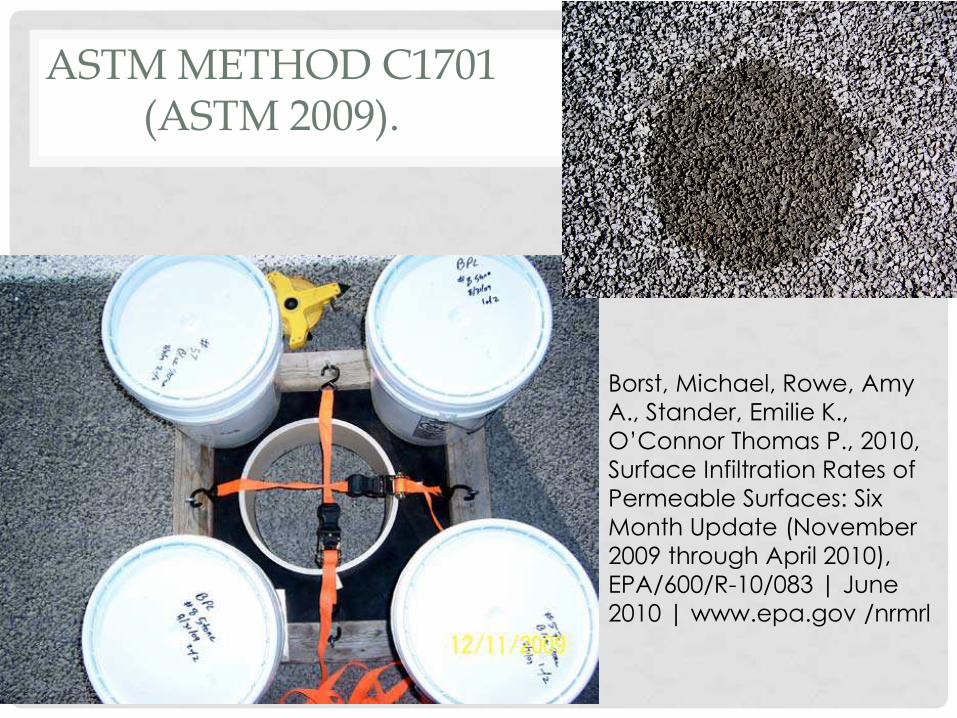
ASTM METHOD C1701 (ASTM 2009).
Borst, Michael, Rowe, Amy
A., Stander, Emilie K.,
O’Connor Thomas P., 2010,
Surface Infiltration Rates of
Permeable Surfaces: Six
Month Update (November
2009 through April 2010),
EPA/600/R-10/083 | June
2010 | www.epa.gov /nrmrl
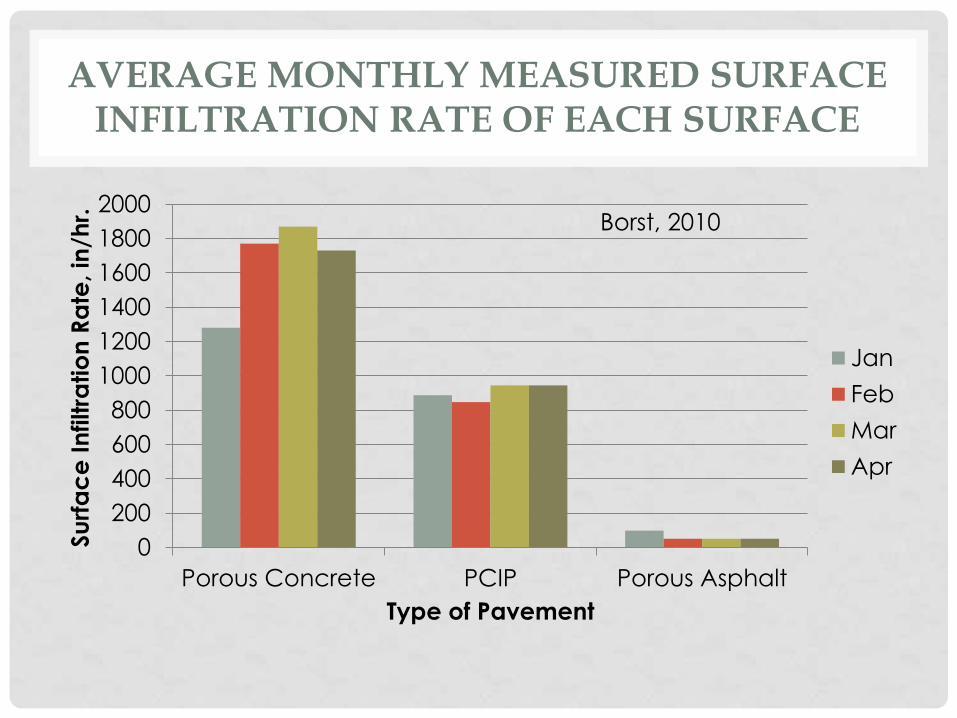
AVERAGE MONTHLY MEASURED SURFACE INFILTRATION RATE OF EACH SURFACE
0
200
400
600
800
1000
1200
1400
1600
1800
2000
Porous Concrete PCIP Porous Asphalt
Su
rfa
ce
In
filtra
tio
n R
ate
, in
/hr.
Type of Pavement
Jan
Feb
Mar
Apr
Borst, 2010
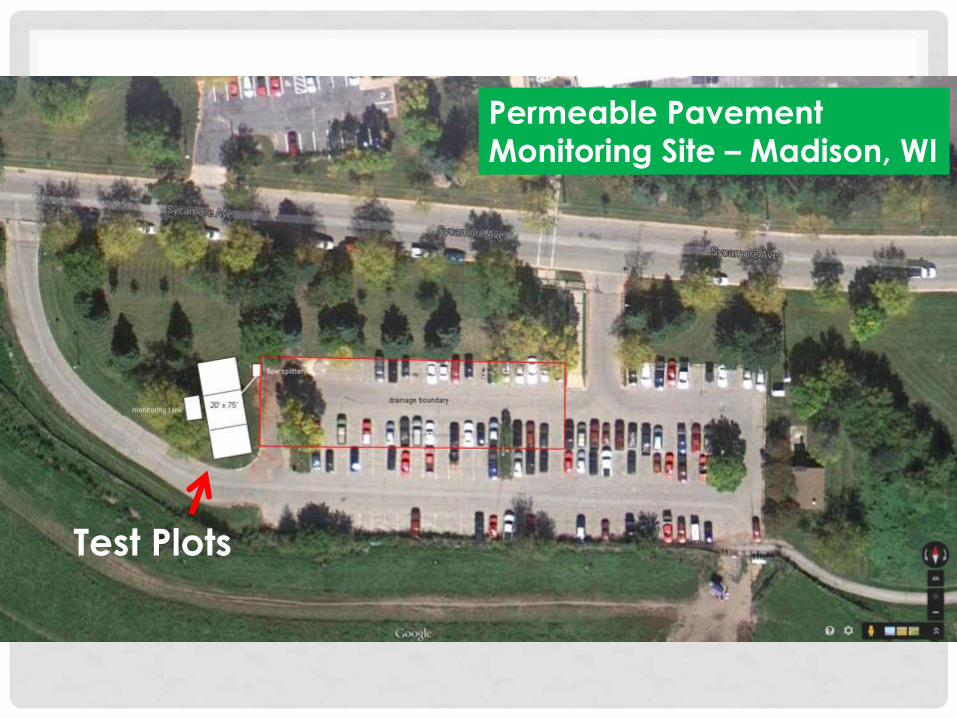
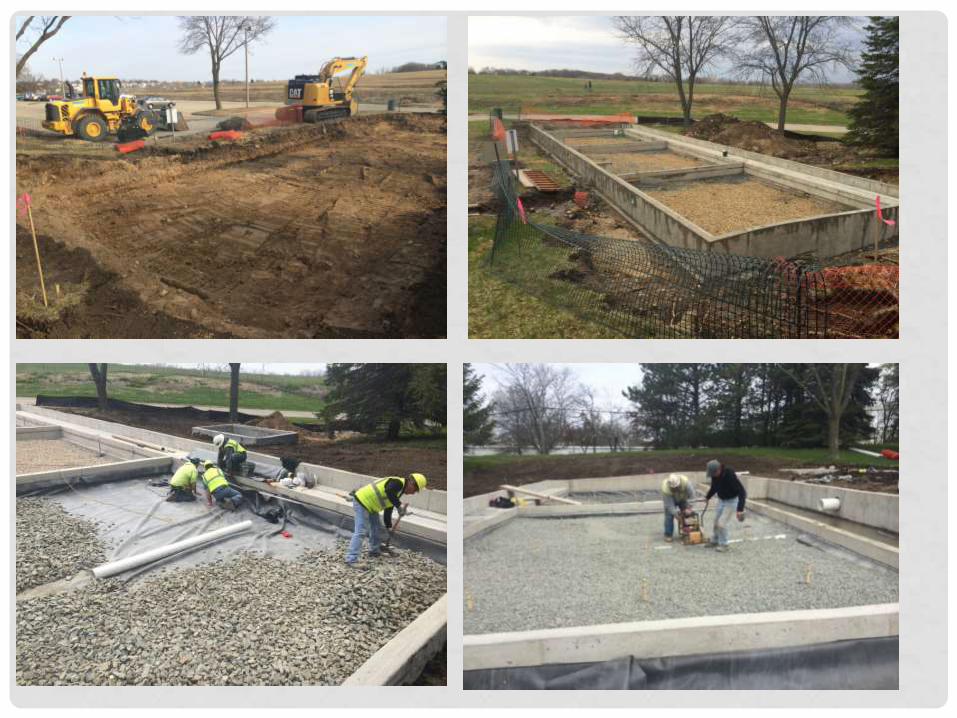
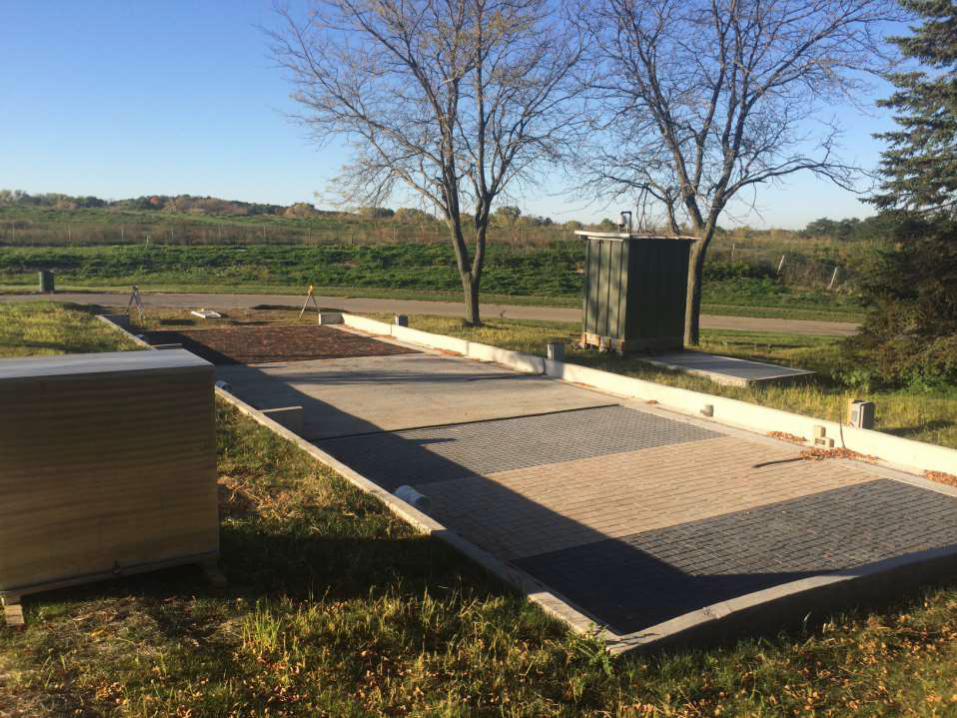
Permeable Pavement
Monitoring Site – Madison, WI
Test Plots
PERMEABLE PAVEMENT
MONITORING & STANDARDS
PARTNERS
Pete Wood - Team Leader WDNR Gini Knight – SOC Coordinator WLCA Roger Bannerman – WDNR Bob Givens – OMNI Associates Kate Gleason – WDNR Josh Harder – Dane County LCD Chris Homburg – Homburg Contractors Inc. Laura Fenley – DOT Jason Kruger – WI Ready Mixed Concrete Association David Liebl – UW Extension John McCarthy – Graef USA Tom Price – Conservation Design Forum Michelle Reynolds – DOT Bob Roehrig – County Materials Corporation Scot Schwandt – WI Asphalt Pavement Association Tim Troester – City of Madison
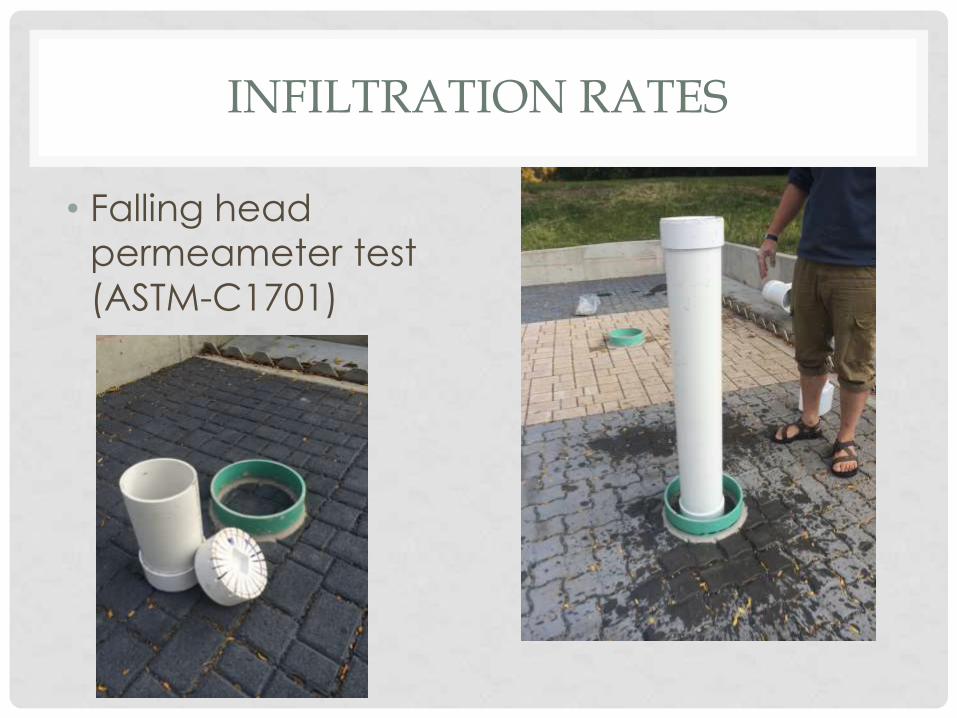
INFILTRATION RATES
• Falling head
permeameter test
(ASTM-C1701)
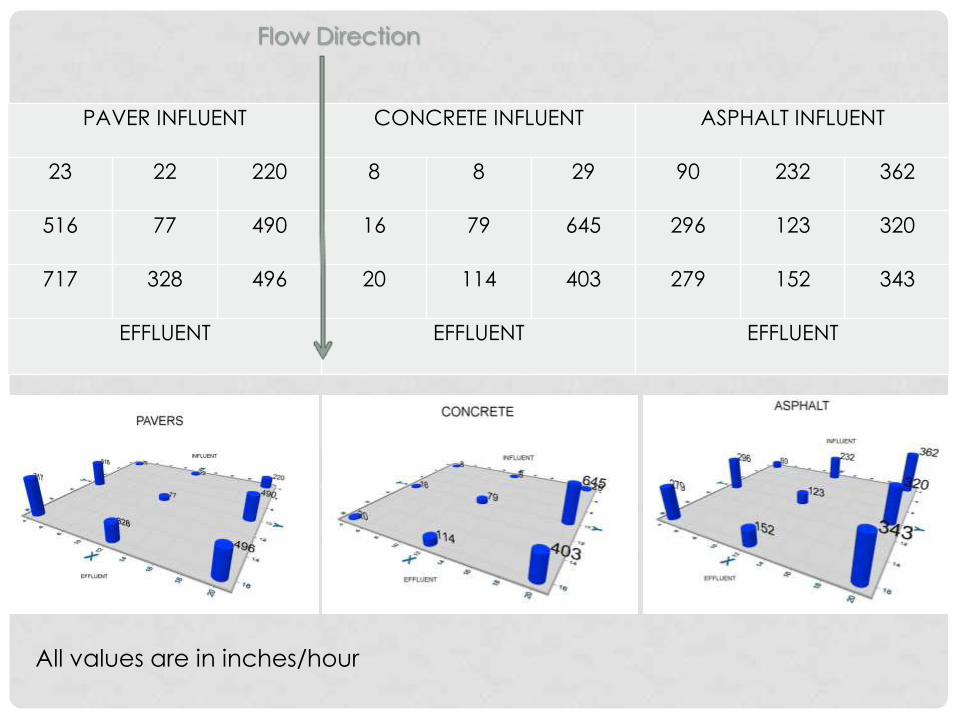
PAVER INFLUENT CONCRETE INFLUENT ASPHALT INFLUENT
23 22 220 8 8 29 90 232 362
516 77 490 16 79 645 296 123 320
717 328 496 20 114 403 279 152 343
EFFLUENT EFFLUENT EFFLUENT
Flow Direction
All values are in inches/hour
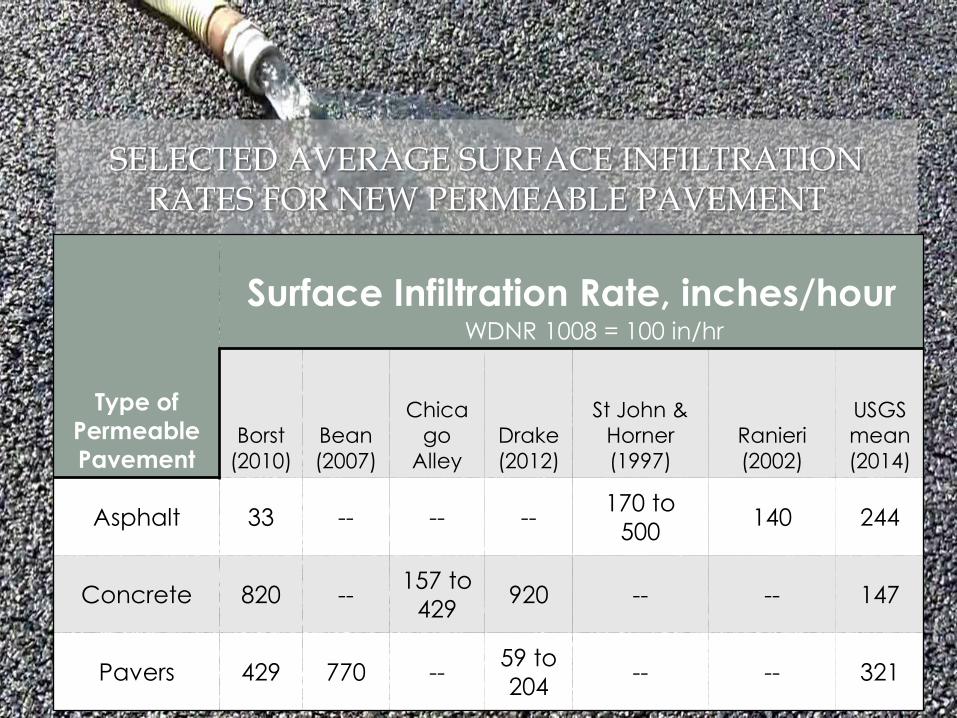
SELECTED AVERAGE SURFACE INFILTRATION RATES FOR NEW PERMEABLE PAVEMENT
Type of
Permeable
Pavement
Surface Infiltration Rate, inches/hour
Borst
(2010)
Bean
(2007)
Chica
go
Alley
Drake
(2012)
St John &
Horner
(1997)
Ranieri
(2002)
USGS
mean
(2014)
Asphalt 33 -- -- -- 170 to
500 140 244
Concrete 820 -- 157 to
429 920 -- -- 147
Pavers 429 770 -- 59 to
204 -- -- 321
WDNR 1008 = 100 in/hr
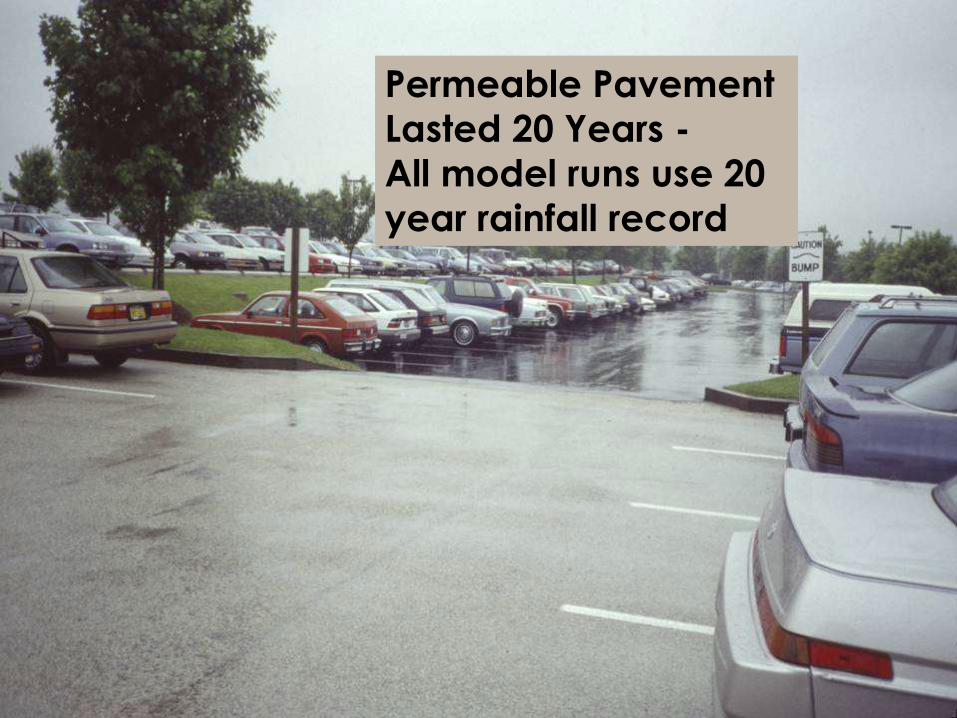
Permeable Pavement
Lasted 20 Years -
All model runs use 20
year rainfall record
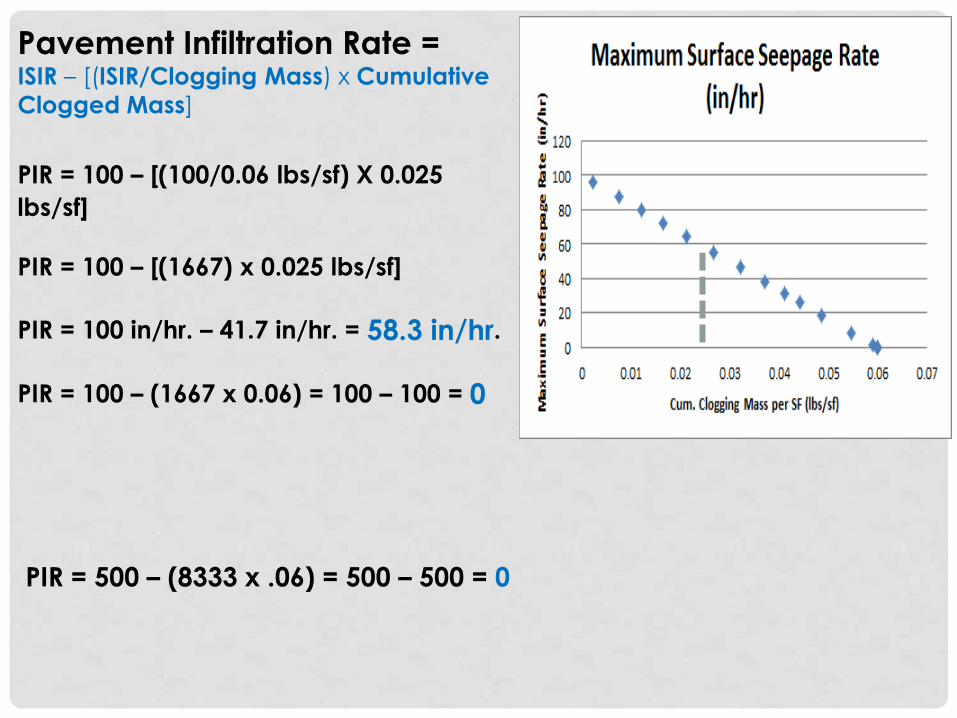
Pavement Infiltration Rate = ISIR – [(ISIR/Clogging Mass) x Cumulative
Clogged Mass]
PIR = 100 – [(100/0.06 lbs/sf) X 0.025 lbs/sf]
PIR = 100 – [(1667) x 0.025 lbs/sf]
PIR = 100 in/hr. – 41.7 in/hr. = 58.3 in/hr.
PIR = 100 – (1667 x 0.06) = 100 – 100 = 0
PIR = 500 – (8333 x .06) = 500 – 500 = 0
PERFORMANCE CRITERIA WE ARE GOING TO COVER
• Initial Surface Infiltration Rate –100 in/hr.
• Surface Infiltration Rate Decline Over Time – 10 in/hr.
• Surface Clogging Capacity – 0.06 lbs./ft2
• Restorative Cleaning Efficiency – 50%
• Underdrain Discharge Credit – TSS (55%) and TP (35%).
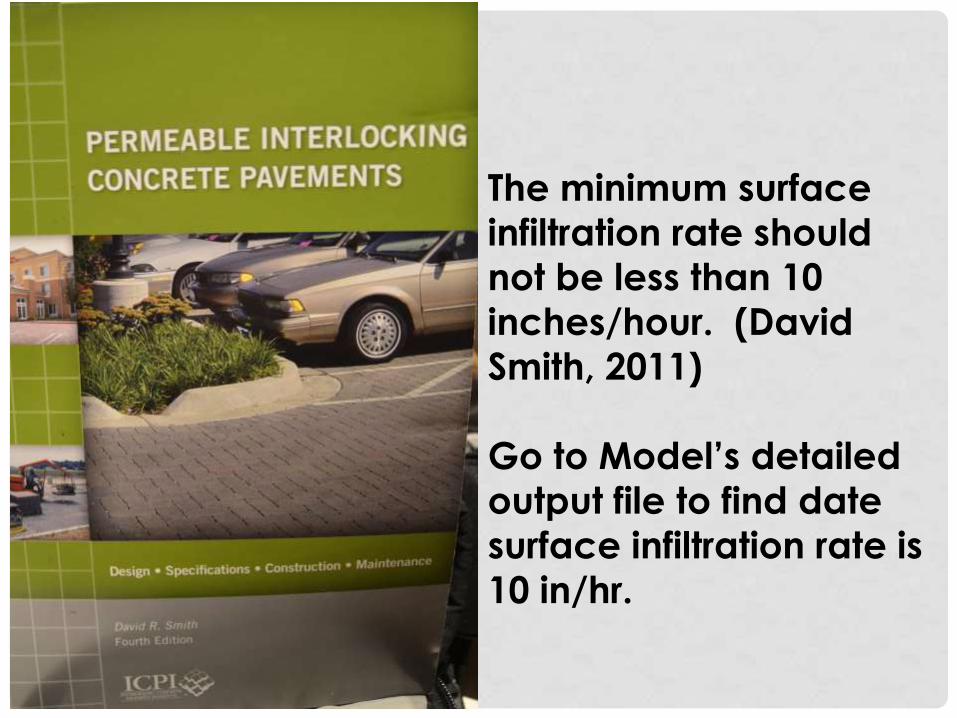
The minimum surface
infiltration rate should
not be less than 10
inches/hour. (David
Smith, 2011)
Go to Model’s detailed
output file to find date
surface infiltration rate is
10 in/hr.
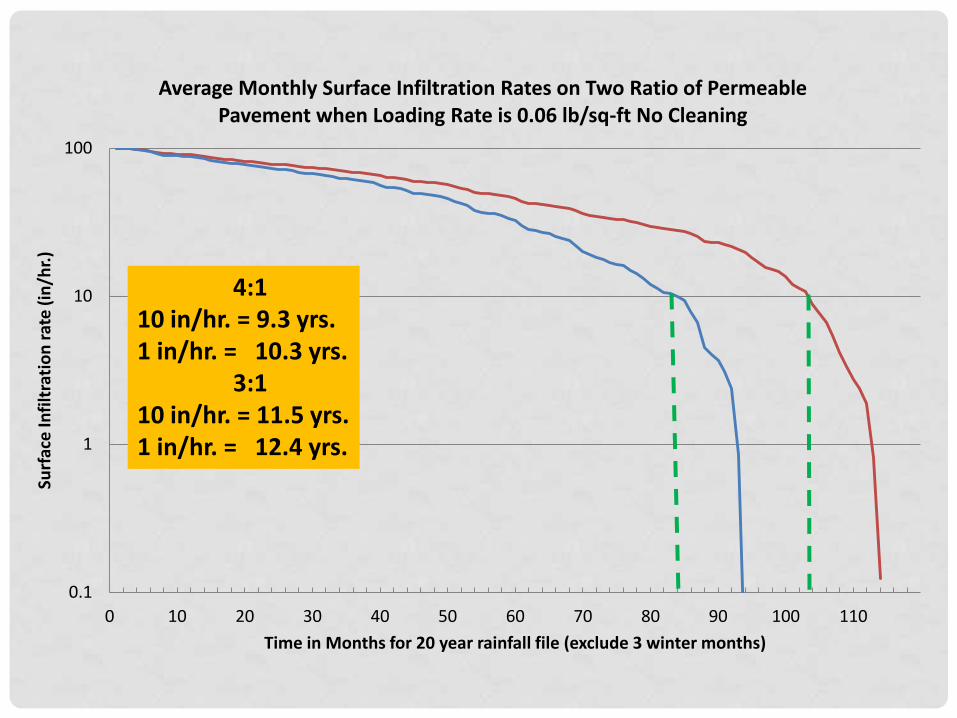
0.1
1
10
100
0 10 20 30 40 50 60 70 80 90 100 110
Surf
ace
Infi
ltra
tio
n r
ate
(in
/hr.
)
Time in Months for 20 year rainfall file (exclude 3 winter months)
Average Monthly Surface Infiltration Rates on Two Ratio of Permeable Pavement when Loading Rate is 0.06 lb/sq-ft No Cleaning
4:1 10 in/hr. = 9.3 yrs. 1 in/hr. = 10.3 yrs. 3:1 10 in/hr. = 11.5 yrs. 1 in/hr. = 12.4 yrs.
PERFORMANCE CRITERIA WE ARE GOING TO COVER
• Initial Surface Infiltration Rate –100 in/hr.
• Surface Infiltration Rate Decline Over Time – 10 in/hr.
• Surface Clogging Capacity – 0.06 lbs./ft2
• Restorative Cleaning Efficiency – 50%
• Underdrain Discharge Credit – TSS (55%) and TP (35%).
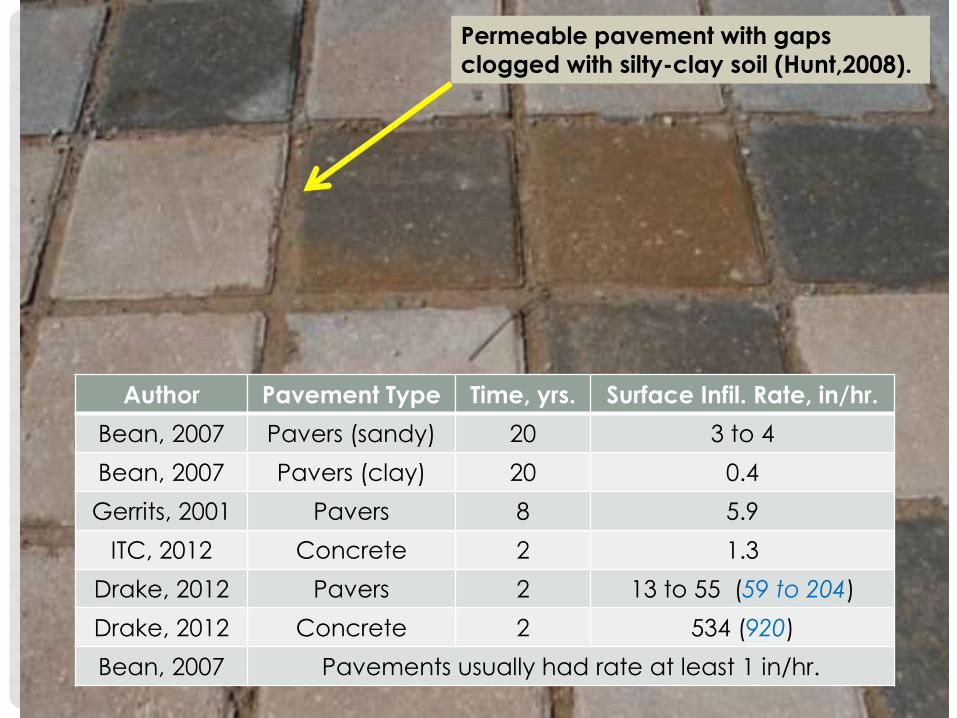
Author Pavement Type Time, yrs. Surface Infil. Rate, in/hr.
Bean, 2007 Pavers (sandy) 20 3 to 4
Bean, 2007 Pavers (clay) 20 0.4
Gerrits, 2001 Pavers 8 5.9
ITC, 2012 Concrete 2 1.3
Drake, 2012 Pavers 2 13 to 55 (59 to 204)
Drake, 2012 Concrete 2 534 (920)
Bean, 2007 Pavements usually had rate at least 1 in/hr.
Permeable pavement with gaps
clogged with silty-clay soil (Hunt,2008).
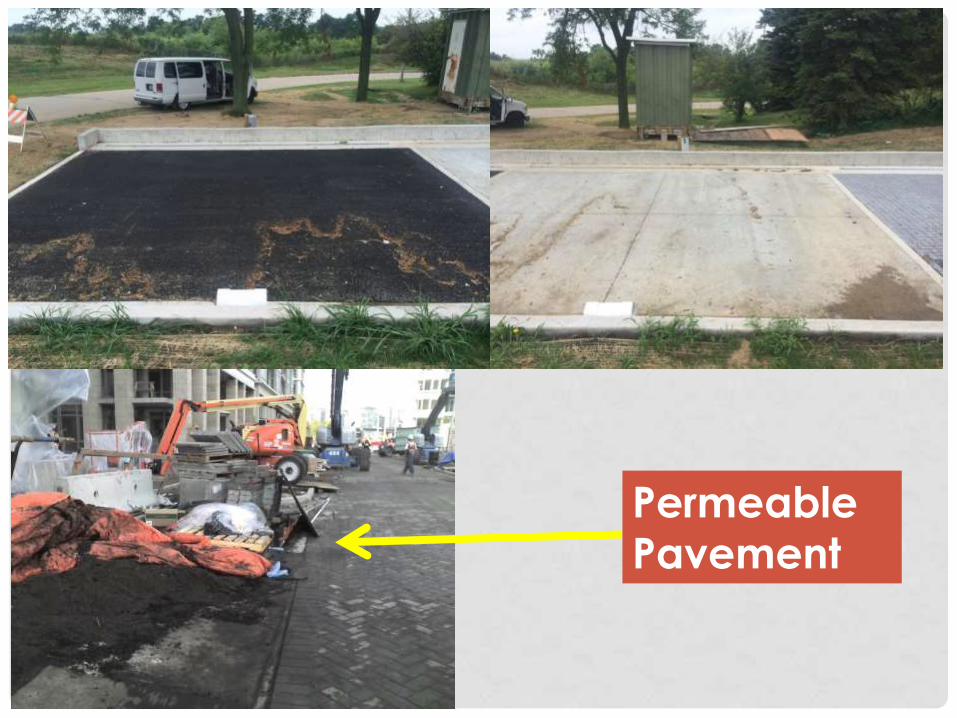
Permeable
Pavement
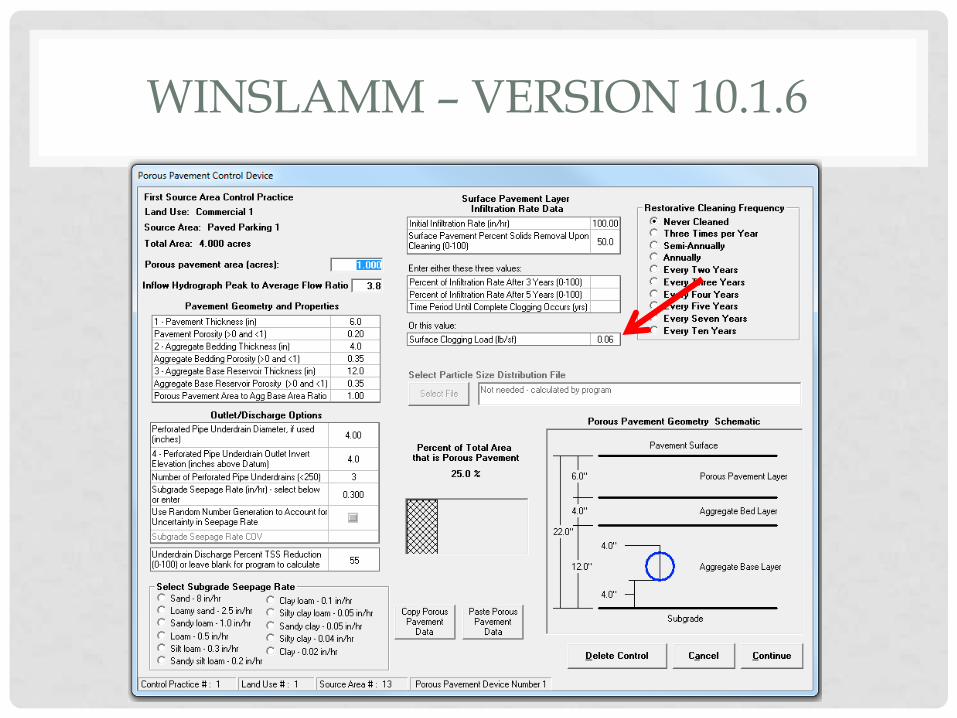
WINSLAMM – VERSION 10.1.6
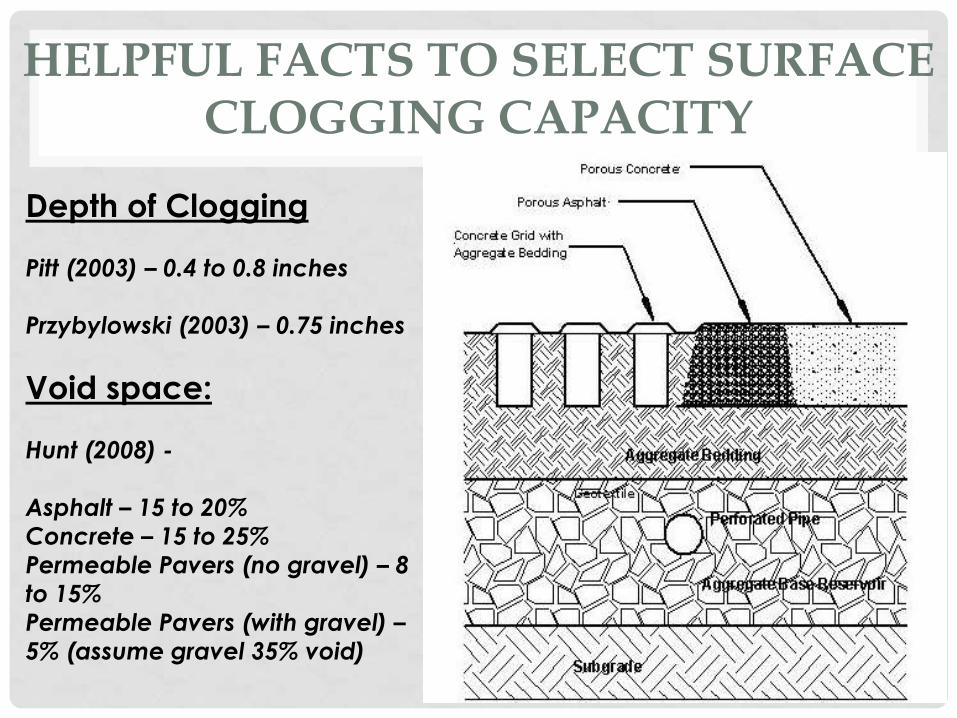
HELPFUL FACTS TO SELECT SURFACE CLOGGING CAPACITY
Depth of Clogging
Pitt (2003) – 0.4 to 0.8 inches
Przybylowski (2003) – 0.75 inches
Void space:
Hunt (2008) -
Asphalt – 15 to 20%
Concrete – 15 to 25%
Permeable Pavers (no gravel) – 8
to 15%
Permeable Pavers (with gravel) –
5% (assume gravel 35% void)
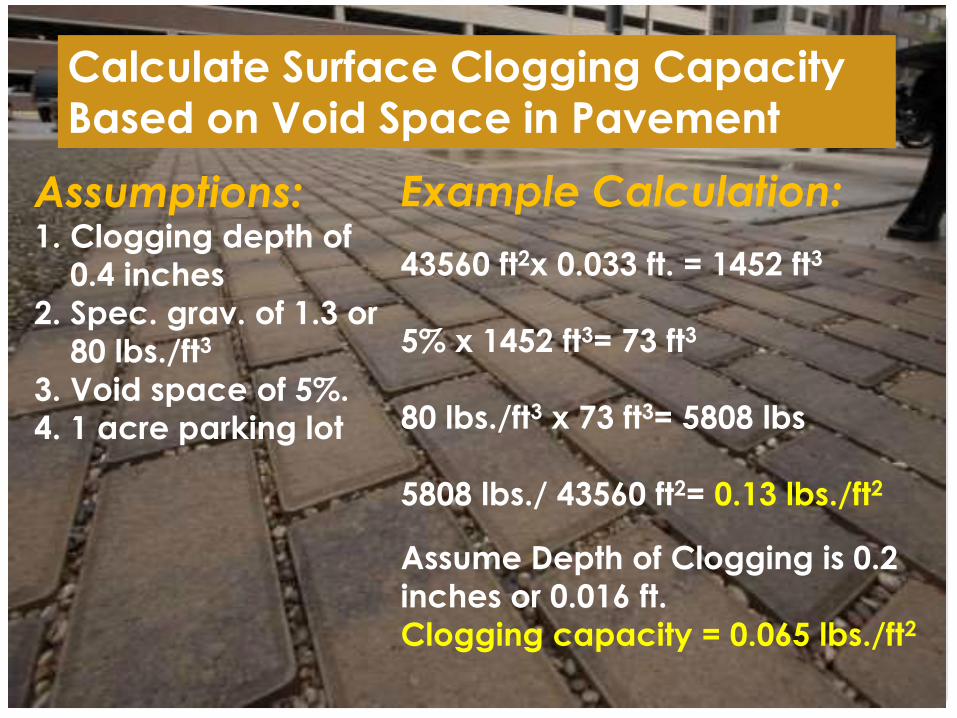
Calculate Surface Clogging Capacity
Based on Void Space in Pavement
Assumptions: 1. Clogging depth of
0.4 inches
2. Spec. grav. of 1.3 or
80 lbs./ft3
3. Void space of 5%.
4. 1 acre parking lot
Example Calculation:
43560 ft2x 0.033 ft. = 1452 ft3
5% x 1452 ft3= 73 ft3
80 lbs./ft3 x 73 ft3= 5808 lbs
5808 lbs./ 43560 ft2= 0.13 lbs./ft2
Assume Depth of Clogging is 0.2
inches or 0.016 ft.
Clogging capacity = 0.065 lbs./ft2
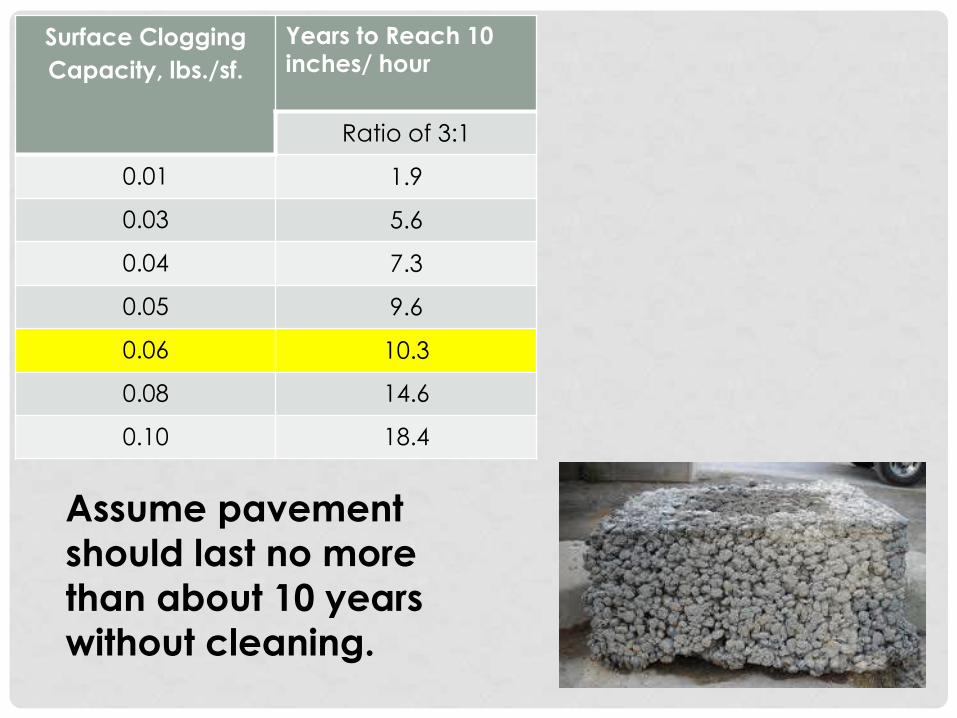
Assume pavement
should last no more
than about 10 years
without cleaning.
Surface Clogging
Capacity, lbs./sf.
Years to Reach 10 inches/ hour
Ratio of 3:1
0.01 1.9
0.03 5.6
0.04 7.3
0.05 9.6
0.06 10.3
0.08 14.6
0.10 18.4
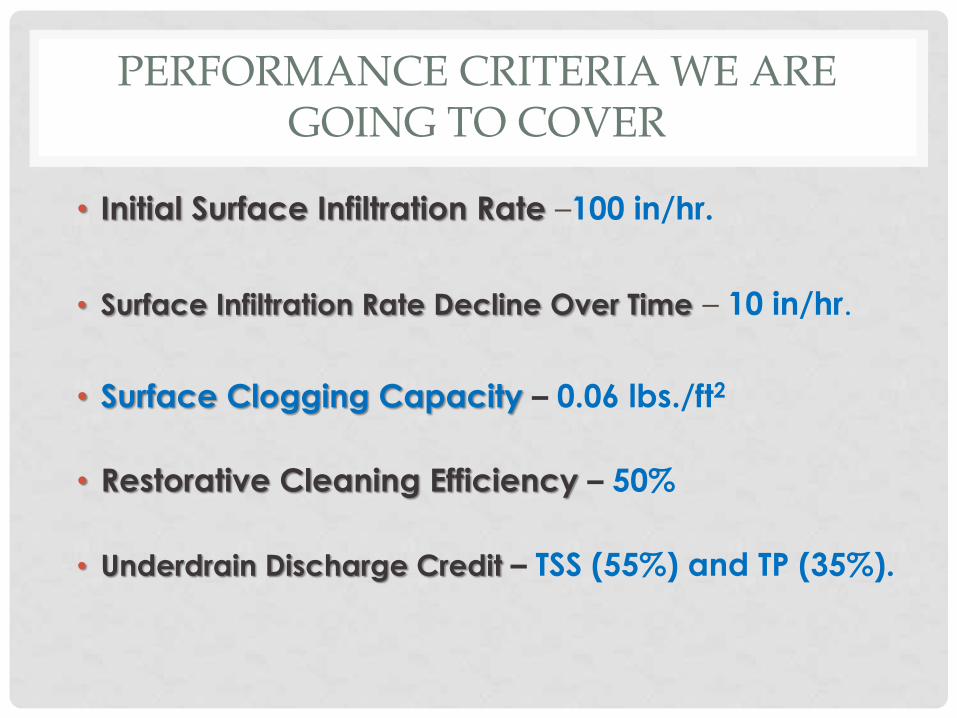
PERFORMANCE CRITERIA WE ARE GOING TO COVER
• Initial Surface Infiltration Rate –100 in/hr.
• Surface Infiltration Rate Decline Over Time – 10 in/hr.
• Surface Clogging Capacity – 0.06 lbs./ft2
• Restorative Cleaning Efficiency – 50%
• Underdrain Discharge Credit – TSS (55%) and TP (35%).
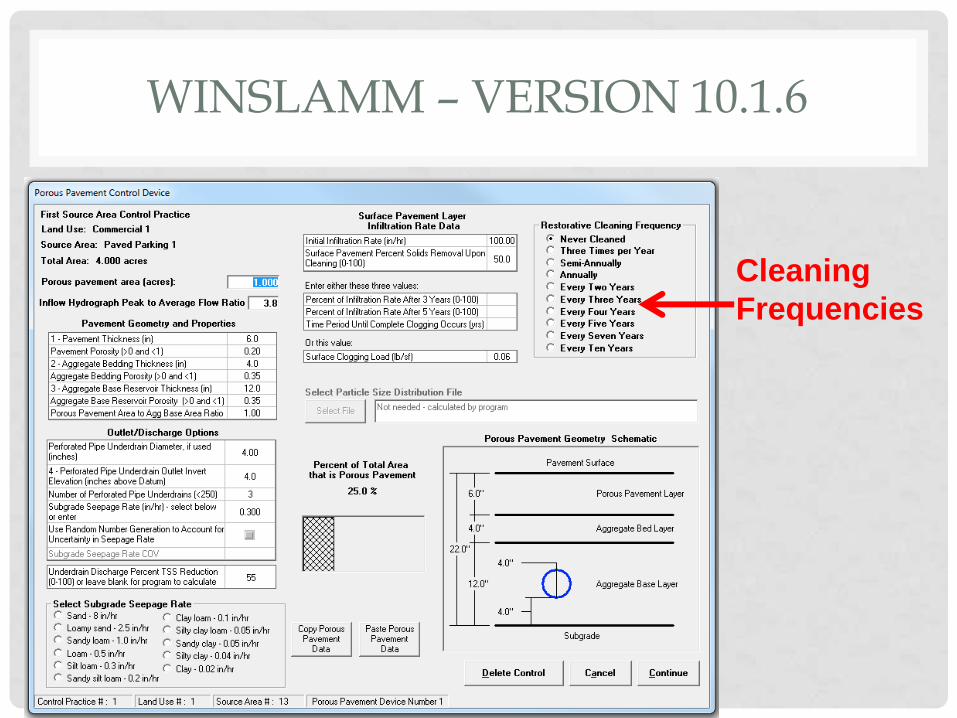
WINSLAMM – VERSION 10.1.6
Cleaning
Frequencies
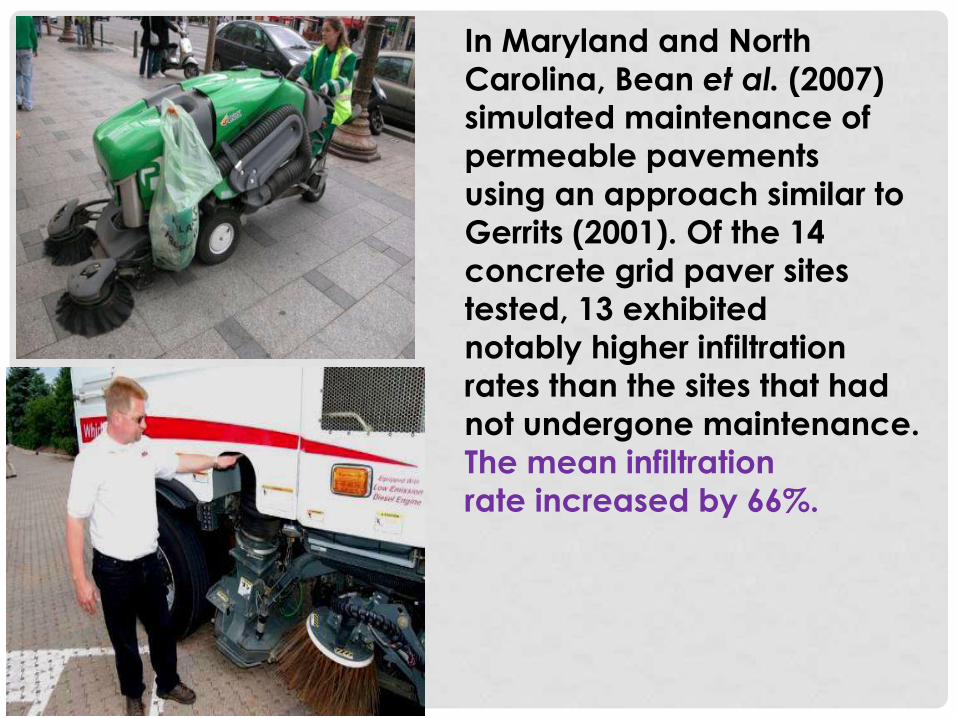
In Maryland and North
Carolina, Bean et al. (2007) simulated maintenance of
permeable pavements
using an approach similar to
Gerrits (2001). Of the 14
concrete grid paver sites
tested, 13 exhibited
notably higher infiltration
rates than the sites that had
not undergone maintenance.
The mean infiltration
rate increased by 66%.
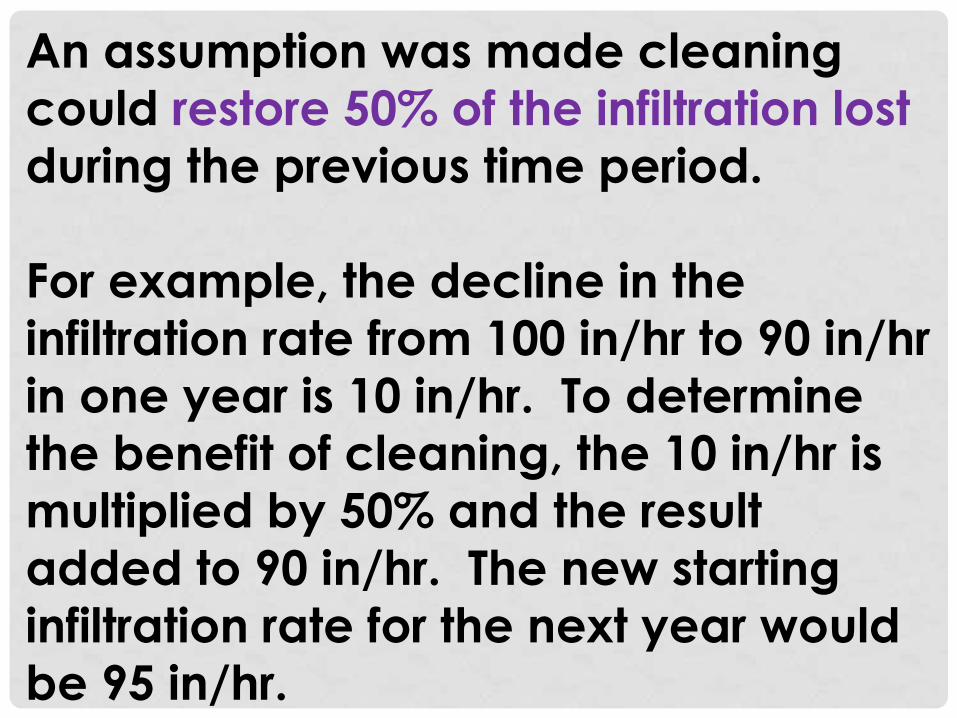
An assumption was made cleaning
could restore 50% of the infiltration lost
during the previous time period.
For example, the decline in the
infiltration rate from 100 in/hr to 90 in/hr
in one year is 10 in/hr. To determine
the benefit of cleaning, the 10 in/hr is
multiplied by 50% and the result
added to 90 in/hr. The new starting
infiltration rate for the next year would
be 95 in/hr.
0
10
20
30
40
50
60
70
80
90
100
0 20 40 60 80 100 120 140 160 180
Infiltra
tio
n r
ate
(in
/hr)
Number of months with rainfall (exclude 3 winter months)
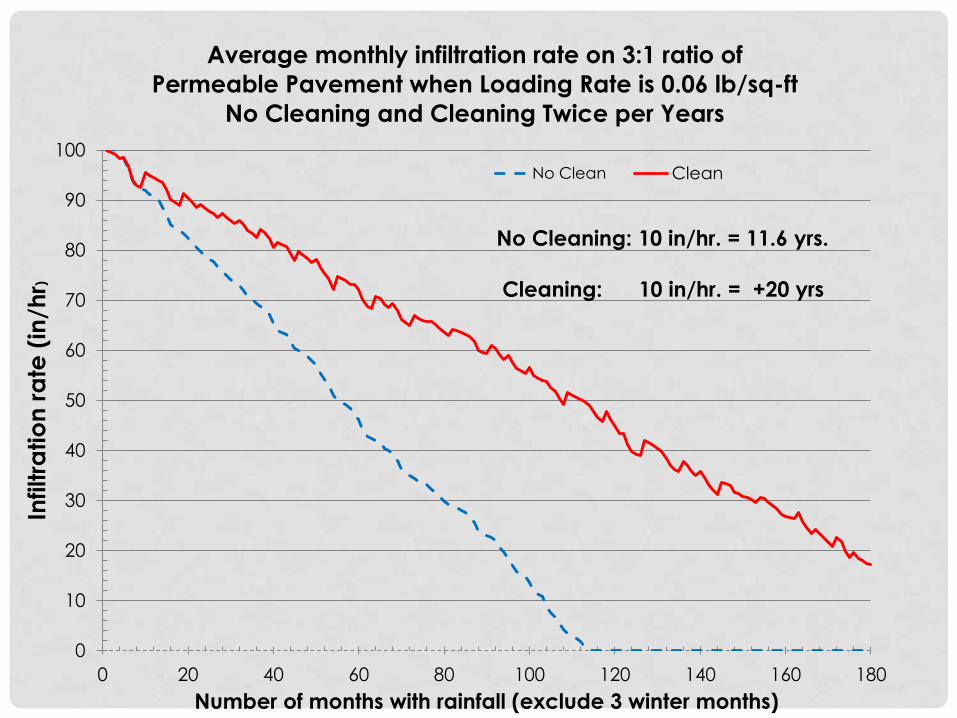
Average monthly infiltration rate on 3:1 ratio of
Permeable Pavement when Loading Rate is 0.06 lb/sq-ft
No Cleaning and Cleaning Twice per Years
No Clean Clean
No Cleaning: 10 in/hr. = 11.6 yrs.
Cleaning: 10 in/hr. = +20 yrs
PERFORMANCE CRITERIA WE ARE GOING TO COVER
• Initial Surface Infiltration Rate –100 in/hr.
• Surface Infiltration Rate Decline Over Time – 10 in/hr.
• Surface Clogging Capacity – 0.06 lbs./ft2
• Restorative Cleaning Efficiency – 50%
• Underdrain Discharge Credit – TSS (55%) and TP (35%).
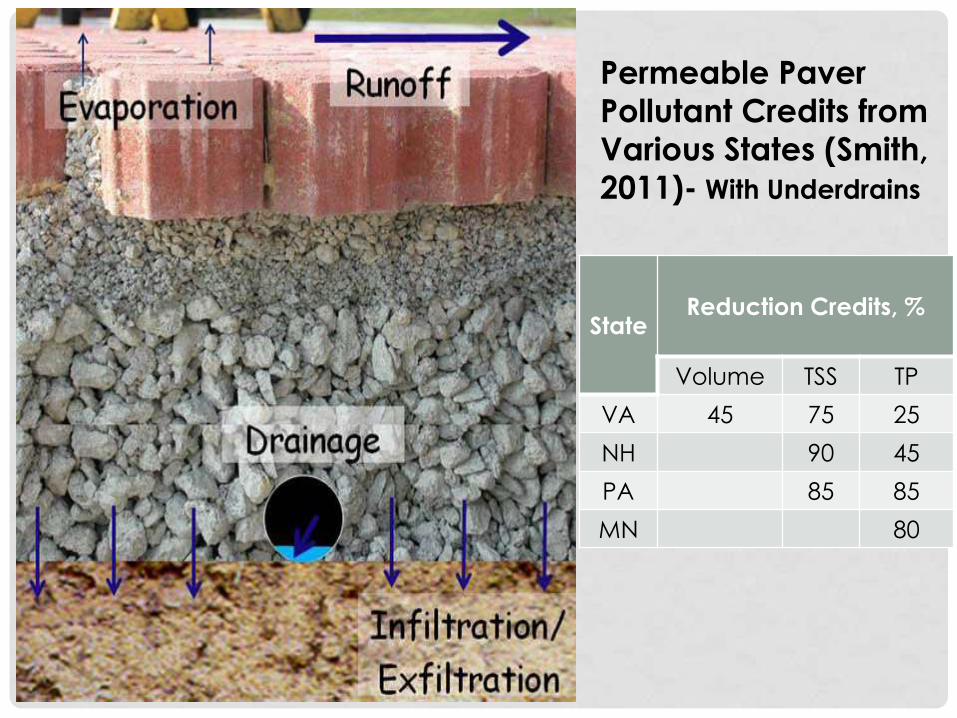
State Reduction Credits, %
Volume TSS TP
VA 45 75 25
NH 90 45
PA 85 85
MN 80
Permeable Paver
Pollutant Credits from
Various States (Smith,
2011)- With Underdrains
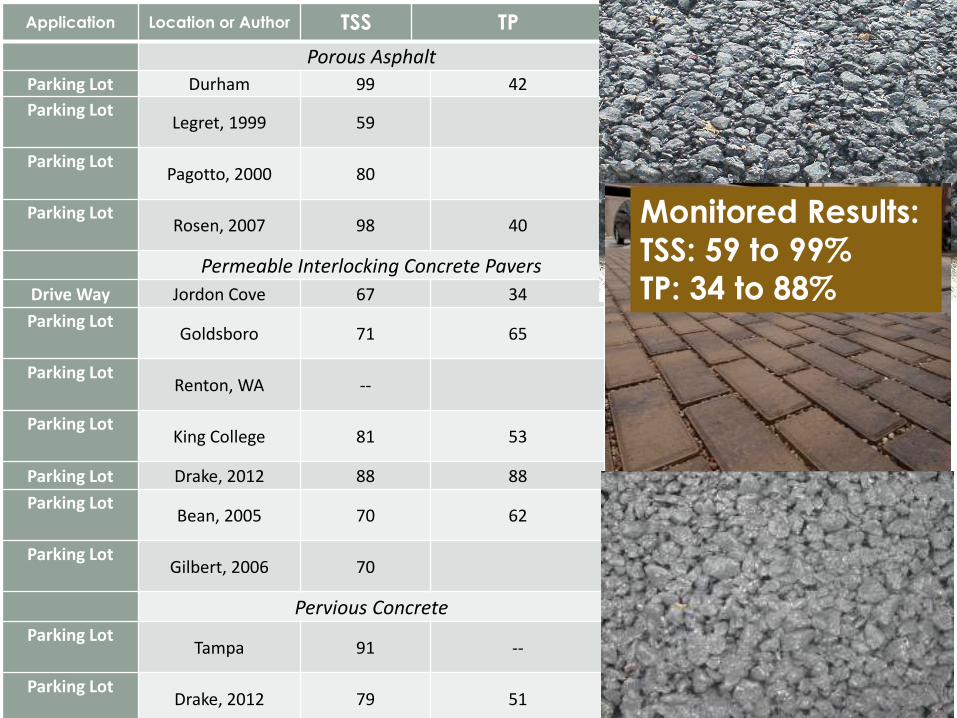
Application Location or Author TSS TP
Porous Asphalt
Parking Lot Durham 99 42
Parking Lot
Legret, 1999 59
Parking Lot
Pagotto, 2000 80
Parking Lot
Rosen, 2007 98 40
Permeable Interlocking Concrete Pavers
Drive Way Jordon Cove 67 34
Parking Lot
Goldsboro 71 65
Parking Lot
Renton, WA --
Parking Lot
King College 81 53
Parking Lot Drake, 2012 88 88
Parking Lot
Bean, 2005 70 62
Parking Lot
Gilbert, 2006 70
Pervious Concrete
Parking Lot
Tampa 91 --
Parking Lot
Drake, 2012 79 51
Monitored Results:
TSS: 59 to 99%
TP: 34 to 88%
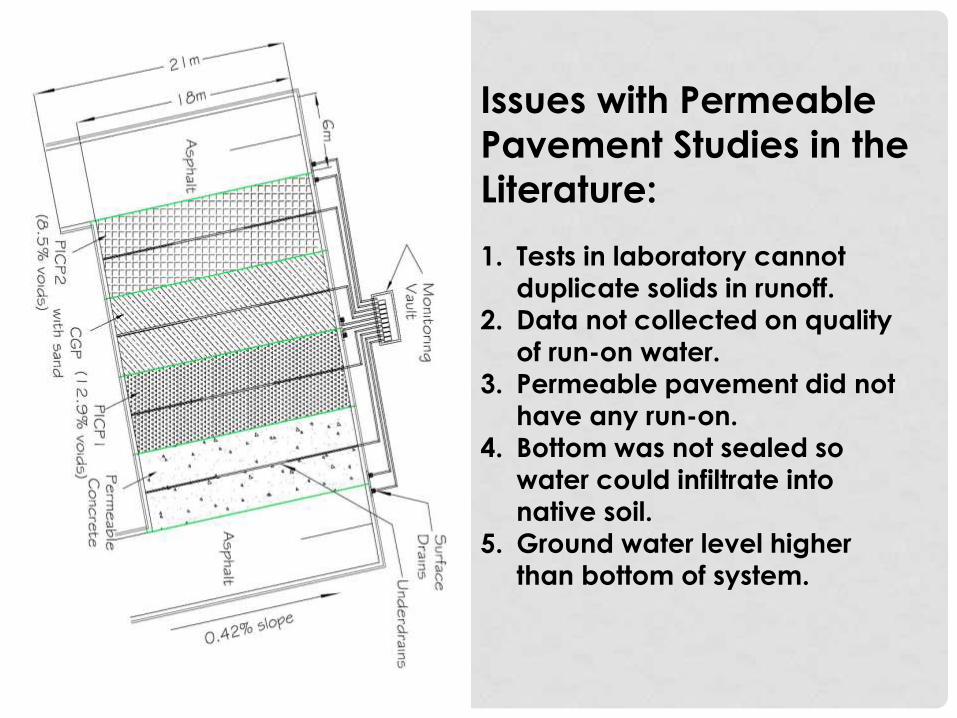
Issues with Permeable
Pavement Studies in the
Literature:
1. Tests in laboratory cannot
duplicate solids in runoff.
2. Data not collected on quality of run-on water.
3. Permeable pavement did not
have any run-on.
4. Bottom was not sealed so water could infiltrate into
native soil.
5. Ground water level higher
than bottom of system.
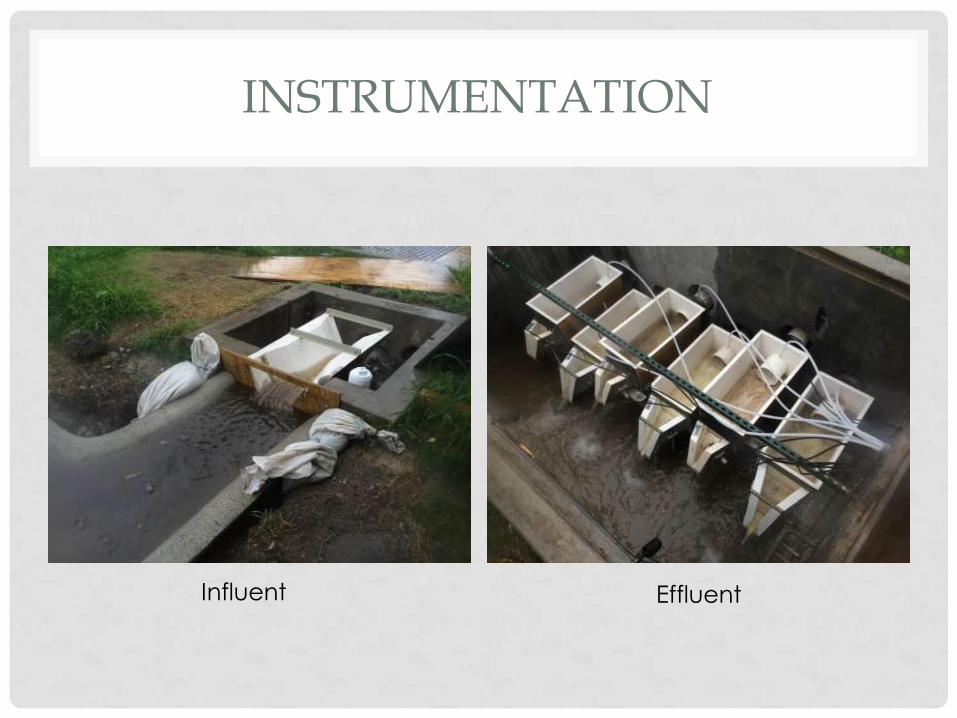
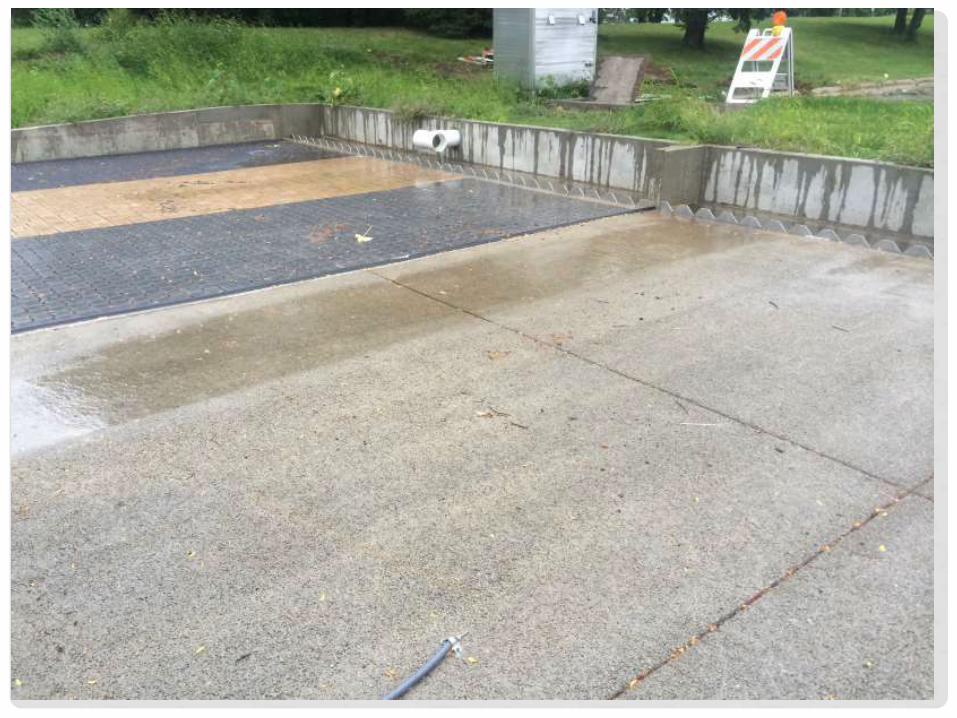
INSTRUMENTATION
Influent Effluent
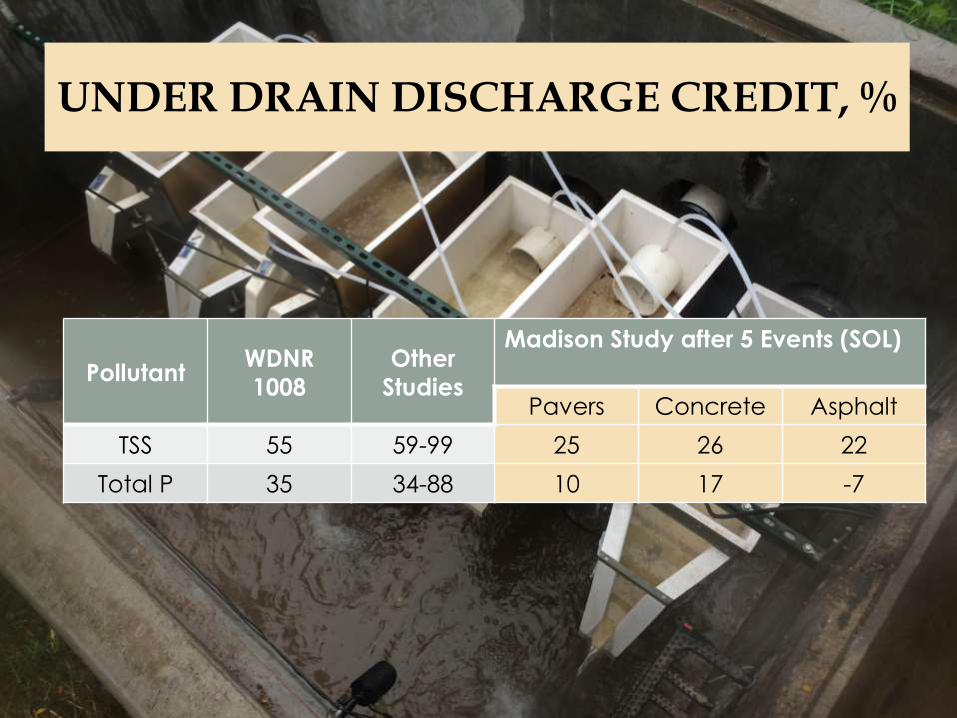
UNDER DRAIN DISCHARGE CREDIT, %
Pollutant WDNR
1008
Other
Studies
Madison Study after 5 Events (SOL)
Pavers Concrete Asphalt
TSS 55 59-99 25 26 22
Total P 35 34-88 10 17 -7
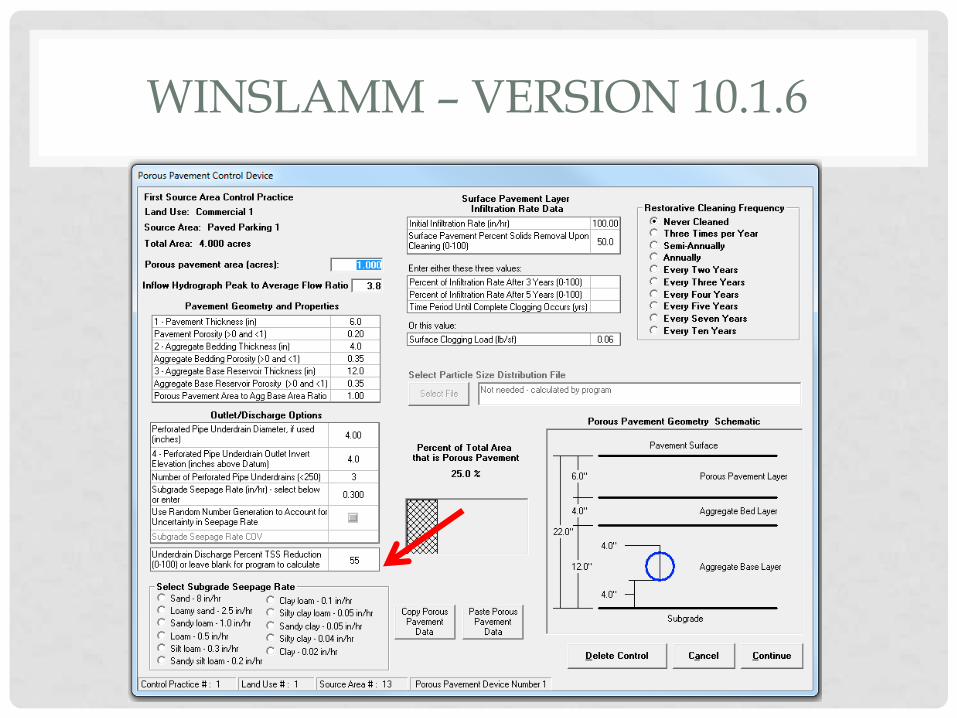
WINSLAMM – VERSION 10.1.6
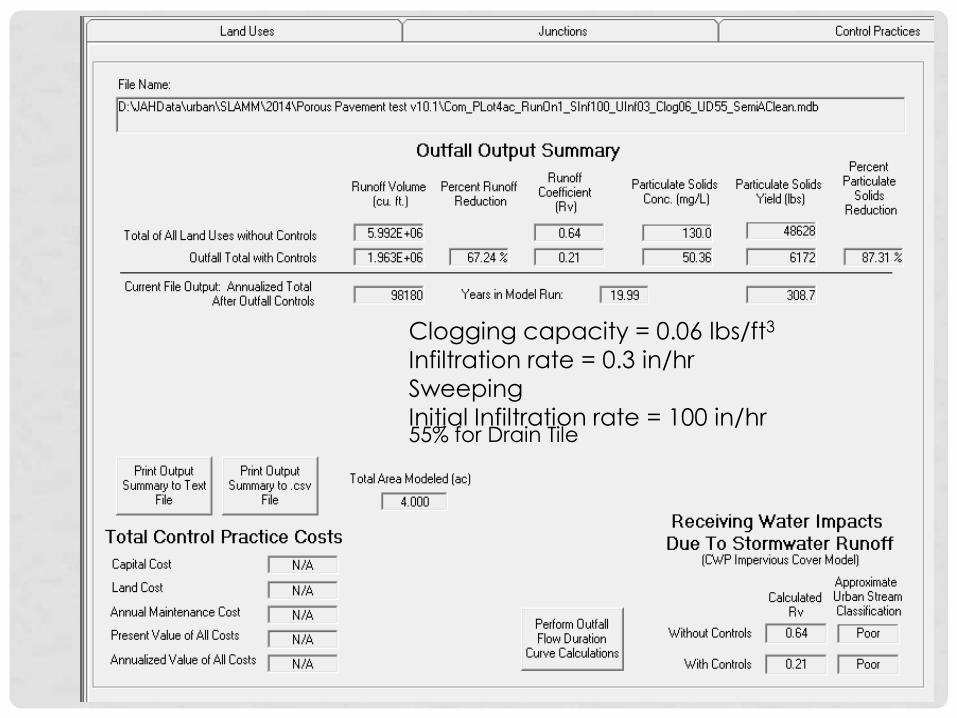
Clogging capacity = 0.06 lbs/ft3
Infiltration rate = 0.3 in/hr
Sweeping
Initial Infiltration rate = 100 in/hr 55% for Drain Tile
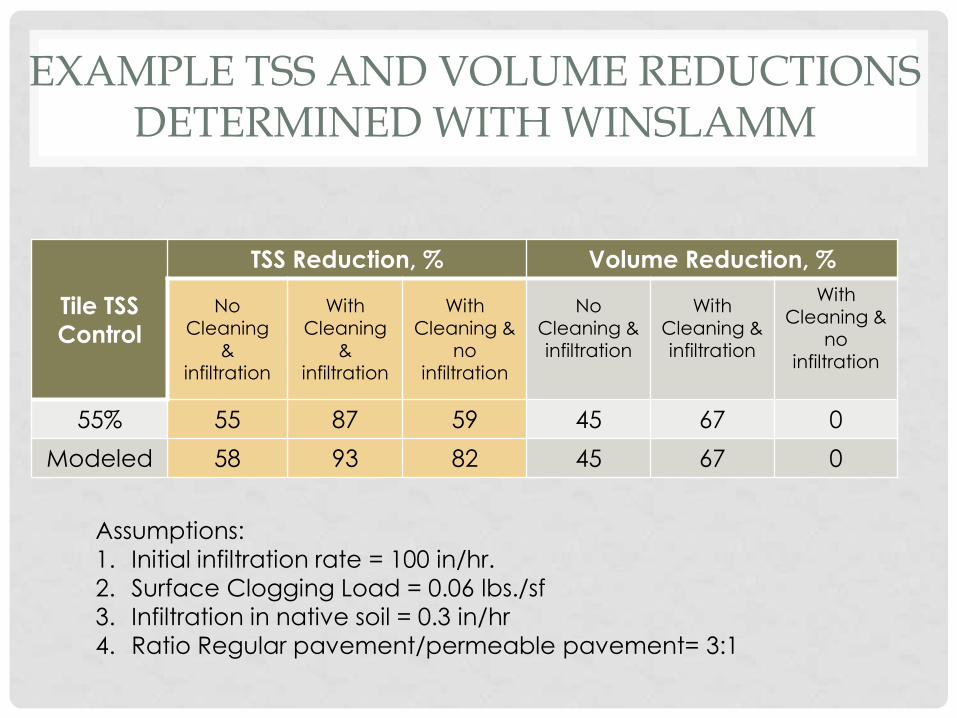
EXAMPLE TSS AND VOLUME REDUCTIONS DETERMINED WITH WINSLAMM
Tile TSS
Control
TSS Reduction, % Volume Reduction, %
No Cleaning
&
infiltration
With Cleaning
&
infiltration
With Cleaning &
no
infiltration
No Cleaning & infiltration
With Cleaning & infiltration
With Cleaning &
no
infiltration
55% 55 87 59 45 67 0
Modeled 58 93 82 45 67 0
Assumptions:
1. Initial infiltration rate = 100 in/hr.
2. Surface Clogging Load = 0.06 lbs./sf
3. Infiltration in native soil = 0.3 in/hr
4. Ratio Regular pavement/permeable pavement= 3:1
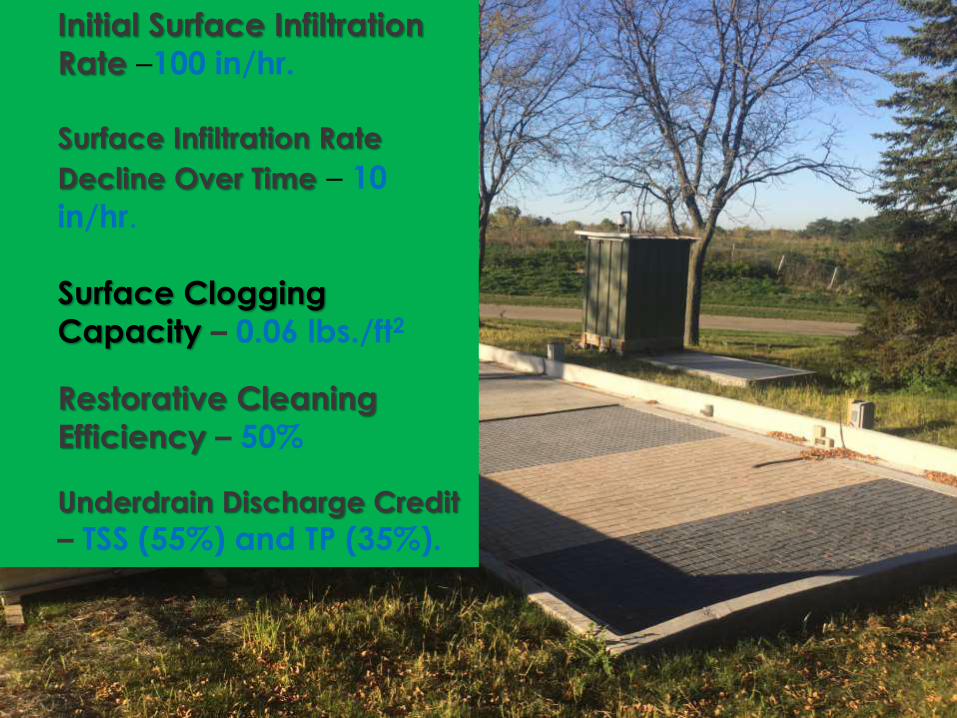
Initial Surface Infiltration
Rate –100 in/hr.
Surface Infiltration Rate
Decline Over Time – 10
in/hr.
Surface Clogging
Capacity – 0.06 lbs./ft2
Restorative Cleaning
Efficiency – 50%
Underdrain Discharge Credit
– TSS (55%) and TP (35%).
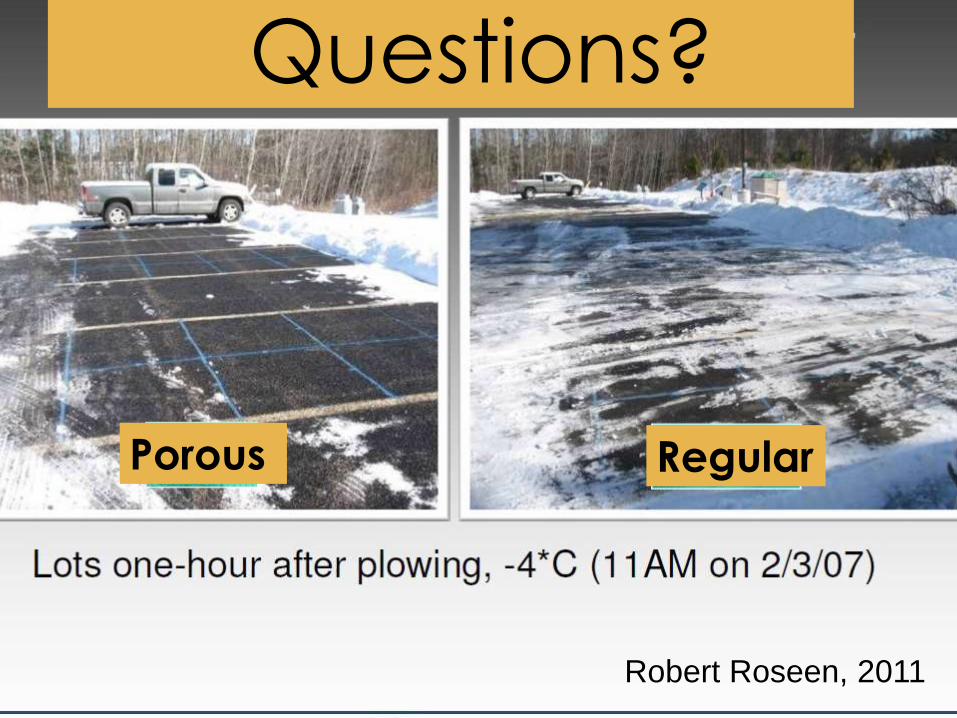
Robert Roseen, 2011
Questions?
Porous Regular


![4 Maintenance Landscape Professionals BLUE.pptx [Read-Only]...NON-PLANT BASED PRACTICES PERMEABLE PAVEMENT DRY WELLS RAIN BARREL. Permeable Pavement Maintenance. PERMEABLE PAVEMENT](https://static.fdocuments.in/doc/165x107/5f59581beea3a81dcc67a1d5/4-maintenance-landscape-professionals-bluepptx-read-only-non-plant-based.jpg)