PERMEABILITY OF SUPERPAVE MIXTURES: EVALUATION...
50
277 Technology Parkway • Auburn, AL 36830 NCAT Report 99-01 PERMEABILITY OF SUPERPAVE MIXTURES: EVALUATION OF FIELD PERMEAMETERS By L. Allen Cooley Jr. February 1999
Transcript of PERMEABILITY OF SUPERPAVE MIXTURES: EVALUATION...

277 Technology Parkway • Auburn, AL 36830
NCAT Report 99-01
PERMEABILITY OF SUPERPAVEMIXTURES: EVALUATION OF FIELDPERMEAMETERS
By
L. Allen Cooley Jr.
February 1999

PERMEABILITY OF SUPERPAVE MIXTURES: EVALUATION OFFIELD PERMEAMETERS
By
L. Allen Cooley Jr.Research Director
National Center for Asphalt TechnologyAuburn University, Alabama
NCAT Report 99-01
February 1999

i
DISCLAIMER
The contents of this report reflect the views of the authors who are solely responsible forthe facts and the accuracy of the data presented herein. The contents do not necessarily reflectthe official views and policies of the National Center for Asphalt Technology of AuburnUniversity. This report does not constitute a standard, specification, or regulation.

Cooley Jr.
1
PERMEABILITY OF SUPERPAVE MIXTURES: EVALUATION OF FIELDPERMEAMETERS
L. Allen Cooley Jr.
CHAPTER 1 - INTRODUCTION
BACKGROUND
Within the hot mix asphalt (HMA) community, it is a generally accepted notion that the propercompaction of HMA pavements is vital for a stable and durable pavement. For dense-gradedmixtures, numerous studies have shown that the initial in-place air void content should not bebelow approximately 3 percent or above approximately 8 percent (1). Low air voids have beenshown to lead to rutting and shoving while high void contents are believed to allow water and airto penetrate into the pavement resulting in an increased potential for water damage, oxidation,raveling, and cracking (1).
In the past it has been thought that for most conventional dense-graded HMA, increases in in-place air void contents have meant increases in permeability for pavements. Zube (2) performedan insightful study during the 1950s and early 1960s that indicated dense-graded HMApavements become excessively permeable to water at approximately 8 percent air voids. Thiswas later confirmed by Brown et. al. (3) during the 1980s. However, due to problems associatedwith Superpave designed mixtures in Florida, the size and interconnectivity of the air voidswithin the pavement have been shown to greatly influence the permeability of HMA pavements(4). A study conducted by the Florida Department of Transportation (FDOT) indicated thatSuperpave mixtures designed on the coarse side of the restricted zone can be permeable to waterat air void contents below 8 percent. As part of this study, the FDOT developed a laboratorypermeability device utilizing a falling head concept for cores cut from HMA pavements. FDOTalso developed a standard method of test for this laboratory permeameter (5).
The question that arises as a result of the experiences of FDOT is “Why are the coarse-gradedSuperpave mixtures more permeable than conventional dense-graded mixtures?” The probableanswer to this question is that the coarse-graded Superpave mixtures have a different voidstructure than the dense-graded mixtures used prior to Superpave. The 1990 Georgia Departmentof Transportation gradation band for an “E” mix had as the lower gradation control point on the2.36 mm (No. 8) sieve 44 percent passing (6). Under the Superpave definition of nominalmaximum aggregate size (NMAS), this particular mixture would have been either a 19.0 or 12.5mm NMAS depending on the exact gradation. The Superpave coarse-side control point for a 19mm nominal maximum aggregate size is 23 percent passing while for the 12.5 mm nominalmaximum aggregate size it is 28 percent passing. These values show how much coarserSuperpave mixtures can be than those used in the past.
Since the Superpave mixtures are typically coarser, it would be expected that the air voids withinthe Superpave mixtures are larger in size than the conventional dense-graded mixtures if both arecompacted to the same air void content. Since the voids are larger, the chance for interconnectedvoids is increased. Thus, it would be expected that the Superpave mixtures would have thepotential to be more permeable.
PROBLEM STATEMENT
During the last year all of the states within the southeast have placed Superpave designedmixtures. Most have been on the coarse side of the restricted zone. Several states have expressedconcerns that the Superpave designed pavements are more permeable than pavements previouslydesigned with the Marshall hammer.
Cooley Jr.
2
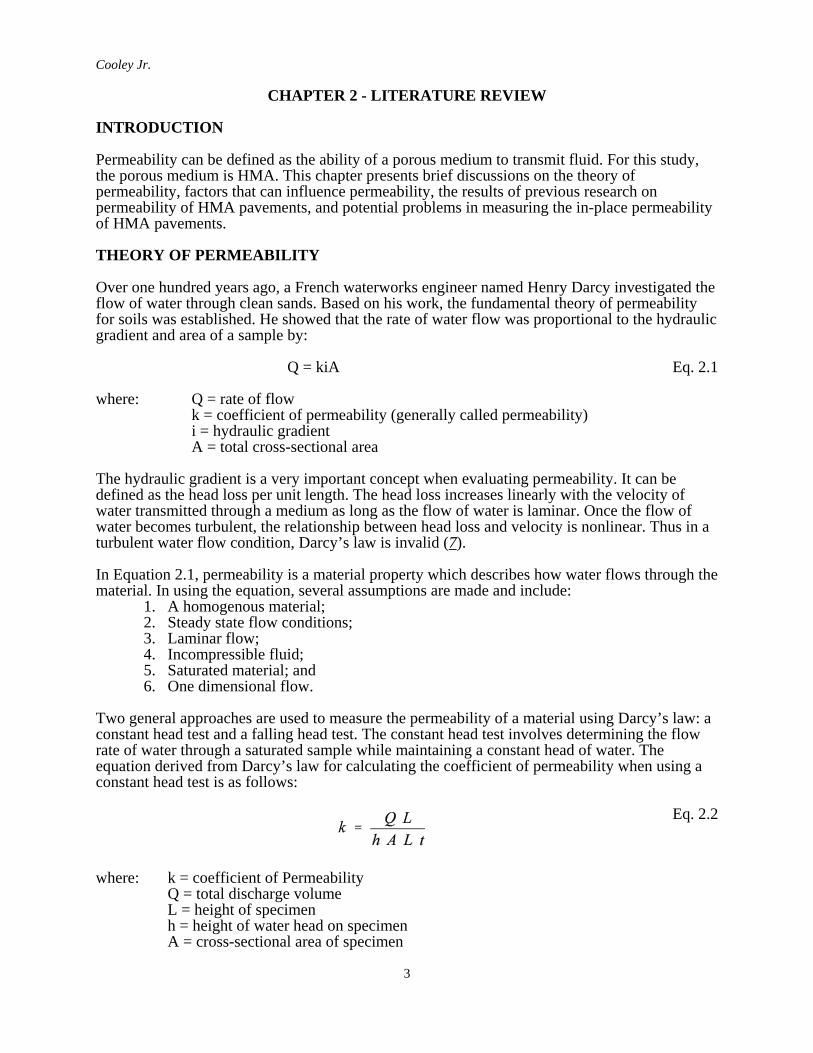
As a result of the work performed by the FDOT, a laboratory permeability device is nowavailable to evaluate the permeability of HMA pavements. However, this test is essentially adestructive test since cores must be cut from the roadway. If a field permeability device could befound that can provide accurate and repeatable results, it would negate the need for cutting cores.A device of this nature would also allow for corrections in pavement construction to be made inthe field if permeability values are too high. Therefore a study is needed to evaluate severaldifferent field permeameters and to select and standardize a field permeability device.
OBJECTIVE
The objective of this study was to evaluate four field permeameters and select the best devicebased on correlation with laboratory permeability test results, repeatability, and ease of use. Astandard test procedure associated with the selected permeameter should also be developed.
SCOPE
To accomplish the objective of this study, three construction projects were visited. At each of theprojects, field permeability tests were conducted on compacted HMA pavements using differentfield permeameters. Each of these projects was new construction. Also at each of the projects,cores were obtained from which the laboratory permeability was determined. In order to selectand standardize one field permeameter, the data from each project was analyzed to determinewhich permeameter correlated best with the accepted laboratory permeameter, which one wasthe most repeatable, and which one was easiest to use.
Cooley Jr.
3
CHAPTER 2 - LITERATURE REVIEW
INTRODUCTION
Permeability can be defined as the ability of a porous medium to transmit fluid. For this study,the porous medium is HMA. This chapter presents brief discussions on the theory ofpermeability, factors that can influence permeability, the results of previous research onpermeability of HMA pavements, and potential problems in measuring the in-place permeabilityof HMA pavements.
THEORY OF PERMEABILITY
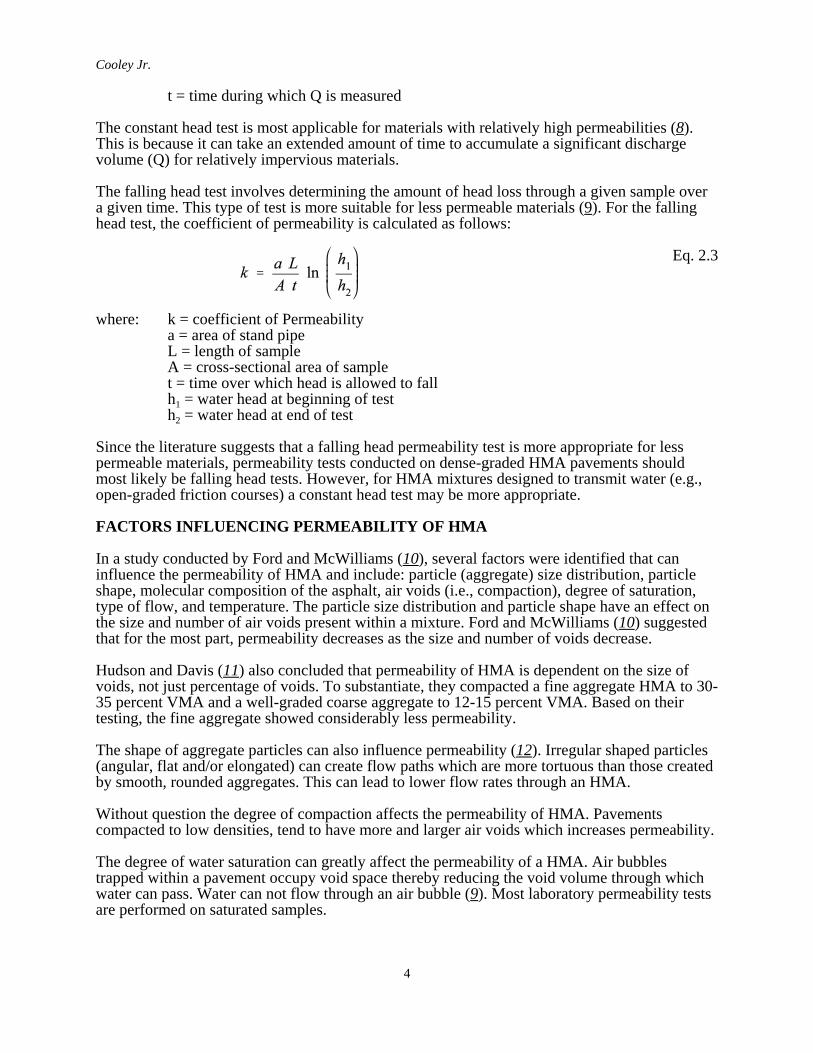
Over one hundred years ago, a French waterworks engineer named Henry Darcy investigated theflow of water through clean sands. Based on his work, the fundamental theory of permeabilityfor soils was established. He showed that the rate of water flow was proportional to the hydraulicgradient and area of a sample by:
Q = kiA Eq. 2.1
where: Q = rate of flowk = coefficient of permeability (generally called permeability)i = hydraulic gradientA = total cross-sectional area
The hydraulic gradient is a very important concept when evaluating permeability. It can bedefined as the head loss per unit length. The head loss increases linearly with the velocity ofwater transmitted through a medium as long as the flow of water is laminar. Once the flow ofwater becomes turbulent, the relationship between head loss and velocity is nonlinear. Thus in aturbulent water flow condition, Darcy’s law is invalid (7).
In Equation 2.1, permeability is a material property which describes how water flows through thematerial. In using the equation, several assumptions are made and include:
1. A homogenous material;2. Steady state flow conditions;3. Laminar flow;4. Incompressible fluid;5. Saturated material; and6. One dimensional flow.
Two general approaches are used to measure the permeability of a material using Darcy’s law: aconstant head test and a falling head test. The constant head test involves determining the flowrate of water through a saturated sample while maintaining a constant head of water. Theequation derived from Darcy’s law for calculating the coefficient of permeability when using aconstant head test is as follows:
Eq. 2.2
where: k = coefficient of PermeabilityQ = total discharge volumeL = height of specimenh = height of water head on specimenA = cross-sectional area of specimen
Cooley Jr.
4
t = time during which Q is measured
The constant head test is most applicable for materials with relatively high permeabilities (8).This is because it can take an extended amount of time to accumulate a significant dischargevolume (Q) for relatively impervious materials.
The falling head test involves determining the amount of head loss through a given sample overa given time. This type of test is more suitable for less permeable materials (9). For the fallinghead test, the coefficient of permeability is calculated as follows:
Eq. 2.3
where: k = coefficient of Permeabilitya = area of stand pipeL = length of sampleA = cross-sectional area of samplet = time over which head is allowed to fallh1 = water head at beginning of testh2 = water head at end of test
Since the literature suggests that a falling head permeability test is more appropriate for lesspermeable materials, permeability tests conducted on dense-graded HMA pavements shouldmost likely be falling head tests. However, for HMA mixtures designed to transmit water (e.g.,open-graded friction courses) a constant head test may be more appropriate.
FACTORS INFLUENCING PERMEABILITY OF HMA
In a study conducted by Ford and McWilliams (10), several factors were identified that caninfluence the permeability of HMA and include: particle (aggregate) size distribution, particleshape, molecular composition of the asphalt, air voids (i.e., compaction), degree of saturation,type of flow, and temperature. The particle size distribution and particle shape have an effect onthe size and number of air voids present within a mixture. Ford and McWilliams (10) suggestedthat for the most part, permeability decreases as the size and number of voids decrease.
Hudson and Davis (11) also concluded that permeability of HMA is dependent on the size ofvoids, not just percentage of voids. To substantiate, they compacted a fine aggregate HMA to 30-35 percent VMA and a well-graded coarse aggregate to 12-15 percent VMA. Based on theirtesting, the fine aggregate showed considerably less permeability.
The shape of aggregate particles can also influence permeability (12). Irregular shaped particles(angular, flat and/or elongated) can create flow paths which are more tortuous than those createdby smooth, rounded aggregates. This can lead to lower flow rates through an HMA.
Without question the degree of compaction affects the permeability of HMA. Pavementscompacted to low densities, tend to have more and larger air voids which increases permeability.
The degree of water saturation can greatly affect the permeability of a HMA. Air bubblestrapped within a pavement occupy void space thereby reducing the void volume through whichwater can pass. Water can not flow through an air bubble (9). Most laboratory permeability testsare performed on saturated samples.

Cooley Jr.
5
PREVIOUS RESEARCH
As mentioned previously, a significant study was conducted by Zube (2) that showed dense-graded HMA pavements become excessively permeable to water at approximately 8 percent in-place air voids. McLaughlin and Goetz (13), surmised that permeability actually gives a bettermeasure of a pavement’s durability than does density. Permeability provides an indication ofhow a HMA will transmit water (and therefore give access to air) through the pavement, whereasdensity is just an indirect measure of in-place air voids.
The most recent work performed that evaluated the permeability of HMA was the previouslymentioned work by FDOT (4). This study is significant because it evaluated coarse-gradedSuperpave designed mixes. Results of this study follow the same conclusions derived from thepreviously mentioned studies, in-place air voids do not specifically identify mixtures that areprone to being permeable. The size, orientation, and interconnectivity of the voids are moreimportant in producing a permeable pavement.
POTENTIAL PROBLEMS MEASURING IN-PLACE PERMEABILITY
The majority of previous work was conducted using cores cut from the roadway in a falling headtype permeameter. This is important because Darcy’s law is applicable for one dimensional flowas would be encountered in a laboratory test. Measuring the permeability of pavements in-placeis theoretically much more difficult, because water can flow in two dimensions. Other potentialproblems include degree of saturation, boundary conditions of flow, and type of flow.
As stated in a previous section, one of the assumptions in using Darcy’s law is that the materialbeing tested is saturated. As the degree of saturation decreases, so does the measuredpermeability. Unlike laboratory testing, the degree of saturation cannot be accurately determinedin the field.
When performing laboratory permeability tests, the sample dimensions are always known.Without cutting a core, the sample thickness has to be estimated when conducting field tests.Also, the effective area of the pavement through which the flow takes place has to be estimated.A typical field permeability test has some type of standpipe that is open on both ends. Water isintroduced into the standpipe and the water is allowed to flow into the pavement. Once the waterenters the pavement it can flow in any direction and most likely flows outside the area of thestandpipe; therefore, the effective area must be assumed.
Another potential boundary condition problem is the flow of water across (through) pavementlayers. Without some type of destructive test (e.g., cutting cores) there is no way of knowingwhether the water flows across layers.
Darcy’s law was based on testing conducted in clean sands. The flow of water was determined tobe laminar. Within a pavement, it can not be determined whether the flow of water is laminar orturbulent. Darcy’s law is invalid for calculating permeability if the flow of water is turbulent;therefore, water flow must be assumed laminar.
A problem that was experienced by NCAT during the conduct of National Cooperative HighwayResearch Program Study 9-8, “Designing Stone Matrix Asphalt Mixtures,” was that of sealingthe field permeameter to the pavement surface. The primary problem comes from the roughsurface texture of SMA. Because of the rough surface texture, it was difficult to completelypenetrate the surface voids for a water tight seal between the permeameter and pavement. Inorder to have reasonable repeatability in field permeability measurements, a repeatable methodof sealing the permeameter to the pavement must be found.
Cooley Jr.
6
CHAPTER 3 - RESEARCH APPROACH
The objective of this study was accomplished by evaluating four field permeability devices. Twoof these permeameters were developed by a commercial supplier, one was designed by NCATfor use during the NCHRP Study 9-8 “Designing Stone Matrix Asphalt Mixtures”, and the fourthwas designed by NCAT specifically for this study. Each of the field permeability devices aredescribed in detail in the next chapter.
Because of the nature of compacted HMA pavements, there may not be a method of determiningthe true permeability of a pavement (horizontal flow, vertical flow, flow across layers, etc.).Because of the problems measuring in-place permeability discussed in Chapter 2, a theoreticalapproach to calculating permeability is probably not accurate. However, if a device and testmethod can be developed that provides a good indication of permeability, is repeatable, and easyto use, it would be of lasting value. The “indication” of permeability should be based on soundengineering assumptions.
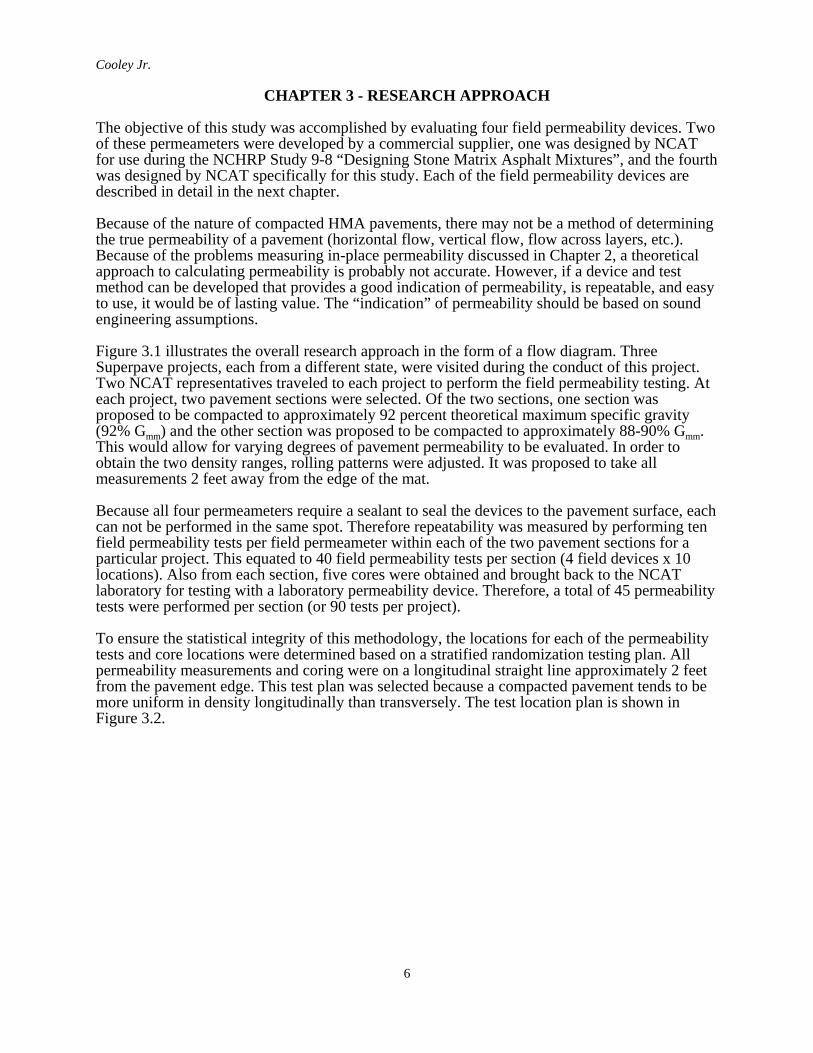
Figure 3.1 illustrates the overall research approach in the form of a flow diagram. ThreeSuperpave projects, each from a different state, were visited during the conduct of this project.Two NCAT representatives traveled to each project to perform the field permeability testing. Ateach project, two pavement sections were selected. Of the two sections, one section wasproposed to be compacted to approximately 92 percent theoretical maximum specific gravity(92% Gmm) and the other section was proposed to be compacted to approximately 88-90% Gmm.This would allow for varying degrees of pavement permeability to be evaluated. In order toobtain the two density ranges, rolling patterns were adjusted. It was proposed to take allmeasurements 2 feet away from the edge of the mat.
Because all four permeameters require a sealant to seal the devices to the pavement surface, eachcan not be performed in the same spot. Therefore repeatability was measured by performing tenfield permeability tests per field permeameter within each of the two pavement sections for aparticular project. This equated to 40 field permeability tests per section (4 field devices x 10locations). Also from each section, five cores were obtained and brought back to the NCATlaboratory for testing with a laboratory permeability device. Therefore, a total of 45 permeabilitytests were performed per section (or 90 tests per project).
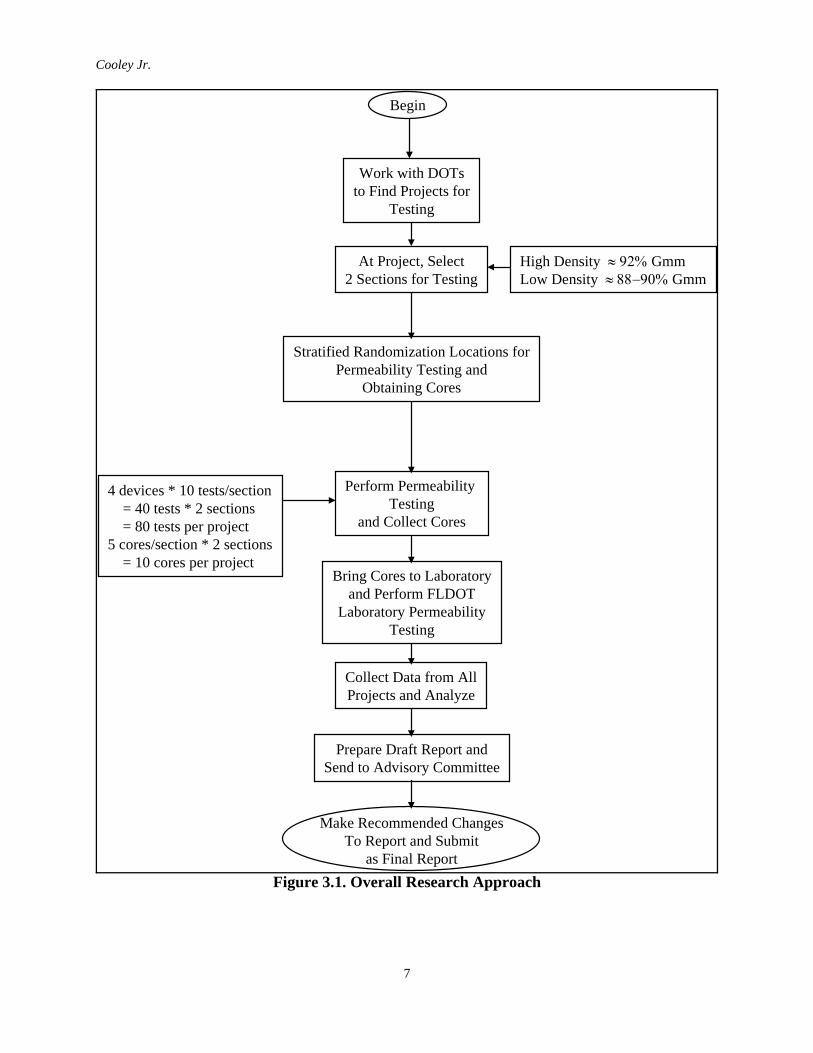
To ensure the statistical integrity of this methodology, the locations for each of the permeabilitytests and core locations were determined based on a stratified randomization testing plan. Allpermeability measurements and coring were on a longitudinal straight line approximately 2 feetfrom the pavement edge. This test plan was selected because a compacted pavement tends to bemore uniform in density longitudinally than transversely. The test location plan is shown inFigure 3.2.
Cooley Jr.
7
Work with DOTsto Find Projects for
Testing
At Project, Select2 Sections for Testing
High Density ≈ 92% GmmLow Density ≈ 88−90% Gmm
Stratified Randomization Locations forPermeability Testing and
Obtaining Cores
Perform Permeability Testing
and Collect Cores
Bring Cores to Laboratoryand Perform FLDOT
Laboratory PermeabilityTesting
Collect Data from AllProjects and Analyze
Prepare Draft Report andSend to Advisory Committee
Make Recommended ChangesTo Report and Submit
as Final Report
4 devices * 10 tests/section = 40 tests * 2 sections = 80 tests per project5 cores/section * 2 sections = 10 cores per project
Begin
Figure 3.1. Overall Research Approach
Cooley Jr.
8
Permeability TestingCore Locations
78 ft
2 ft
Pavement Edge
Pavement Edge
Note: Each of the sections were divided into ten subsections. Within each subsection,each field permeameter was randomized resulting in a stratified randomization.
Subsections
Figure 3.2. Test Location Plan for Each Section of Each Project
Cooley Jr.
9
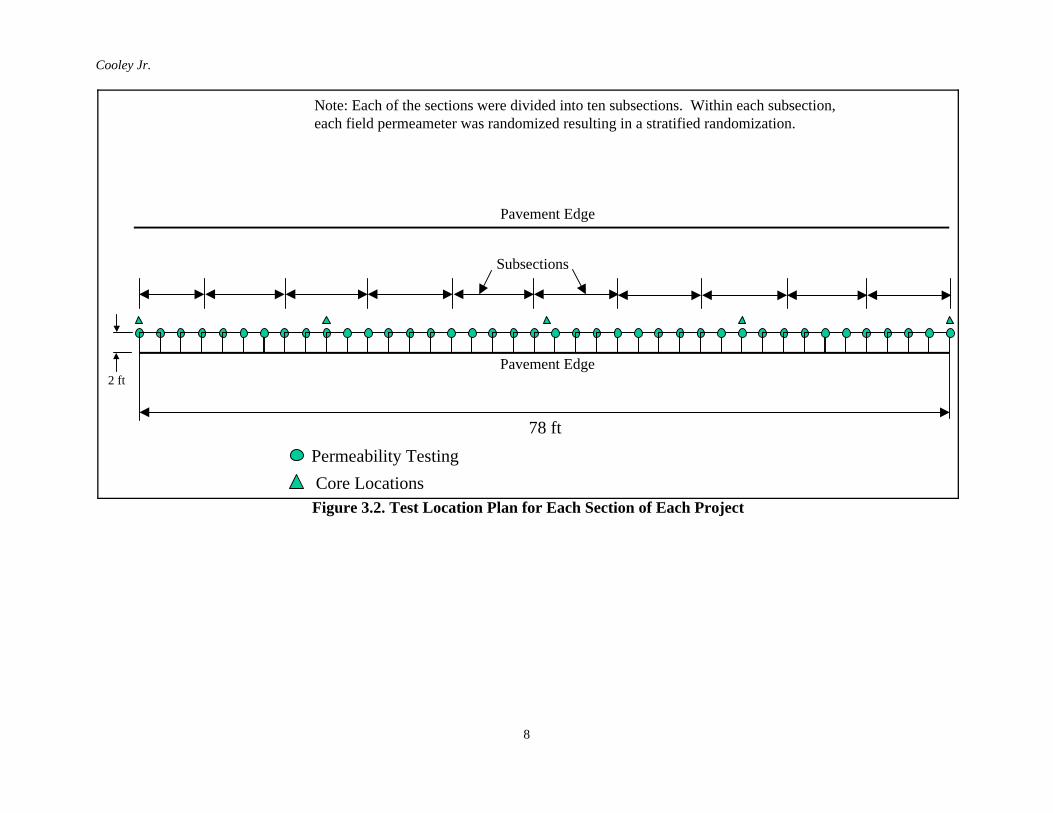
Figure 4.1. Field Permeameter No. 1
CHAPTER 4 - PERMEAMETERS
INTRODUCTION
Four field permeameters were used during the conduct of this study. Each of these permeameterswere of the falling head type. Two were provided by a commercial supplier while two weredesigned by NCAT. As mentioned previously, one major problem in performing fieldpermeability tests is the sealing of the permeameter to the pavement surface. All fourpermeameters used some type of sealant. Three used a silicone-rubber based caulk and the fourthused paraffin. The actual procedure for estimating permeability with the four devices was verysimilar. The primary difference was the method of sealing each to the pavement. A standardizedprocedure for each permeameter was developed and can be found in Appendix A. Thecoefficient permeability for each field device was calculated using Equation 2.3. This equation isused to calculate permeability based upon a falling head approach. Assumptions used for thesecalculations included (1): sample thickness was equal to the immediately underlying HMAcourse thickness; (2) the area of the tested sample was equal to the area of the permeameter fromwhich water was allowed to penetrate into the HMA; (3) one-dimensional flow; and (4) laminarflow of water. The following sections describe each of the four permeameters and the laboratorydevice used for this study.
Field Permeameter No. 1 (FP1)
FP1 is shown during use in Figure 4.1. This device is similar to the one used by NCAT duringNCHRP 9-8, with one modification. The diameter of the base plate located at the bottom of thepermeameter was increased in order to help provide a better seal with the pavement surface.
In order to seal FP1 to the pavement surface, a sealant (silicone-rubber caulk) is placed on thebottom of the base plate. The permeameter is then placed onto the pavement surface and pushed

Cooley Jr.
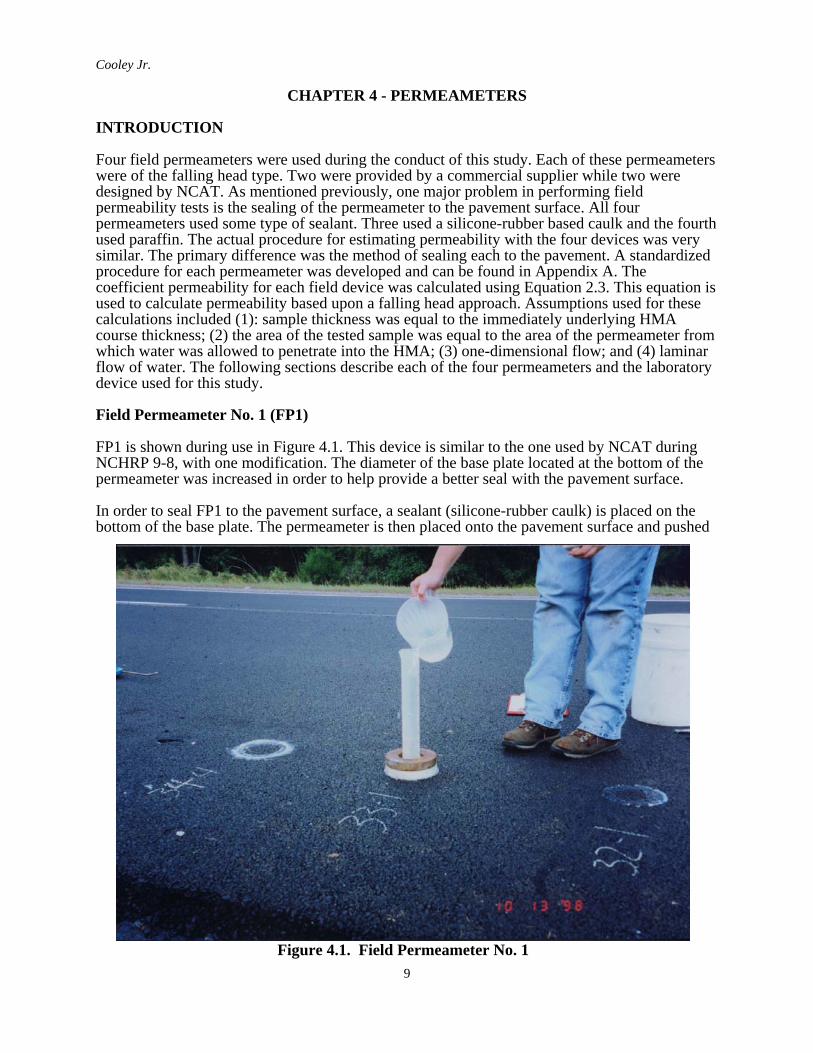
10Figure 4.2. Field Permeameter No. 2
down to try and distribute the sealant fully into the surface voids of the pavement. For pavementswith a very rough surface texture, it is sometimes necessary to also place some sealant directlyonto the pavement surface to ensure the surface voids are completely sealed. Once sealed, aweight was placed onto the base plate to resist the uplift of the device when water is introducedinto the standpipe.
Of the four permeameters studied, FP1 was probably the easiest to use. This is based upon theease of sealing, relative size of the device, and the simple design.
Field Permeameter No. 2. (FP2)
FP2 was one of the two permeameters provided by a commercial supplier. This device (shown inFigure 4.2) essentially consisted of a six-inch Marshall mold, onto which a plastic cap was fitted.The cap had a hole cut into the top for a standpipe to fit. Also shown in Figure 4.2 is a ring thatis approximately 50 mm larger in diameter than the Marshall mold. This ring was used whilesealing FP2 onto the pavement surface. Heated paraffin was poured between the permeameterand the ring for sealing. Paraffin was selected because in a liquid state it would flow into thesurface voids and seal the permeameter to the pavement upon hardening.
This device was probably the most labor intensive. A propane heater was needed in order to meltthe paraffin. Once heated to a liquid state, the paraffin had to cool for a period of time. If it wasnot allowed to cool, it would flow beneath the edges of the permeameter thus potentially closingflow paths. If the paraffin was allowed to cool to a point where it began to “skim over,” uponbeing introduced between the permeameter and ring it would harden quickly.

Cooley Jr.
11
Figure 4.3. Field Permeameter No. 3
Field Permeameter No. 3 (FP3)
FP3 is the second device that was designed and built by NCAT. This device (shown in Figure4.3) is unique from the other three permeameters because it uses a three tier standpipe. As shownin Figure 4.3, each tier consisted of a standpipe with a different diameter. The standpipe with thesmallest diameter is at the top and the largest diameter standpipe is at the bottom. Thisconfiguration was designed in an effort to make the permeameter more sensitive to the flow ofwater into the pavement. For pavements that are relatively impermeable, the water will fallwithin the top tier standpipe very slowly. Additionally, because of the small diameter of the toptier standpipe, FP3 is very sensitive to small amounts of water draining from the permeameter.
For pavements of “medium” permeability, the water should flow through the top-tier standpipequickly but slow down when it reaches the larger diameter middle tier standpipe. Likewise, for avery permeable pavement, the water should flow through the top and middle tier standpipesquickly but slow down in the larger diameter bottom tier standpipe.
Sealing FP3 to the pavement surface is similar to the procedure used for FP1. However, aflexible rubber base is used in conjunction with a metal base plate. The rubber base was selectedbecause, being flexible, it would push the sealant down into the surface voids.
FP3 is relatively easy to use. The particular standpipe from which head loss measurements aremade must be noted. Head loss measurements obtained across standpipe tiers make thecalculation of permeability more complicated. Additionally, sealant has to be applied in twolocations: between the steel base plate and the flexible rubber base and between the rubber baseand the pavement surface.
Cooley Jr.
12
Figure 4.4. Field Permeameter No. 4
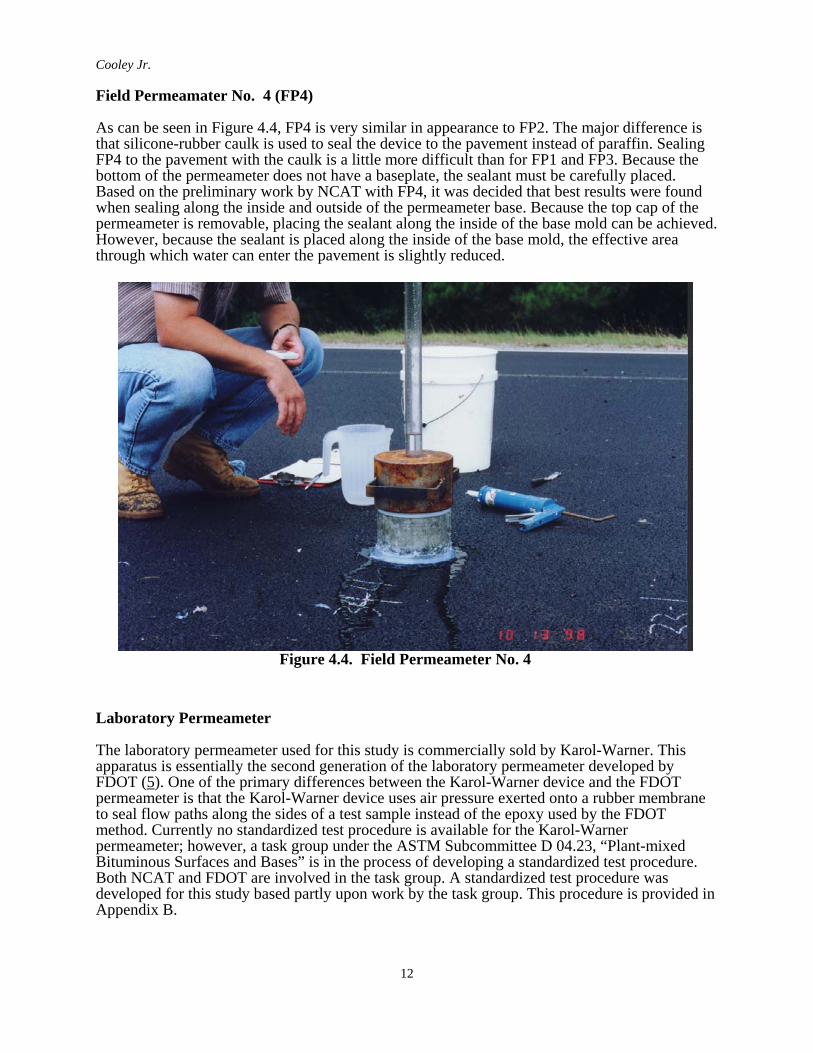
Field Permeamater No. 4 (FP4)
As can be seen in Figure 4.4, FP4 is very similar in appearance to FP2. The major difference isthat silicone-rubber caulk is used to seal the device to the pavement instead of paraffin. SealingFP4 to the pavement with the caulk is a little more difficult than for FP1 and FP3. Because thebottom of the permeameter does not have a baseplate, the sealant must be carefully placed.Based on the preliminary work by NCAT with FP4, it was decided that best results were foundwhen sealing along the inside and outside of the permeameter base. Because the top cap of thepermeameter is removable, placing the sealant along the inside of the base mold can be achieved.However, because the sealant is placed along the inside of the base mold, the effective areathrough which water can enter the pavement is slightly reduced.
Laboratory Permeameter
The laboratory permeameter used for this study is commercially sold by Karol-Warner. Thisapparatus is essentially the second generation of the laboratory permeameter developed byFDOT (5). One of the primary differences between the Karol-Warner device and the FDOTpermeameter is that the Karol-Warner device uses air pressure exerted onto a rubber membraneto seal flow paths along the sides of a test sample instead of the epoxy used by the FDOTmethod. Currently no standardized test procedure is available for the Karol-Warnerpermeameter; however, a task group under the ASTM Subcommittee D 04.23, “Plant-mixedBituminous Surfaces and Bases” is in the process of developing a standardized test procedure.Both NCAT and FDOT are involved in the task group. A standardized test procedure wasdeveloped for this study based partly upon work by the task group. This procedure is provided inAppendix B.
Cooley Jr.
13
CHAPTER 5 - TEST RESULTS AND ANALYSIS
INTRODUCTION
Field permeability tests were conducted in Mississippi, Virginia, and South Carolina. In each ofthese states, two separate sections were tested. This resulted in 20 field permeability tests witheach permeameter for each state. In addition, five cores were tested for laboratory permeabilityfor each section resulting in 10 laboratory permeability measurements per state. This chapterpresents the results of this testing and the analysis of that data.
TEST RESULTS
The first project in which testing was conducted was in Mississippi. Each of the fourpermeameters were brought for testing. However, it was quickly determined that FP2 could notbe used. Recall that FP2 was the device that used paraffin to seal the permeameter to thepavement surface. Apparently, during the heat of the day the pavement surface was hot enoughso that even though the paraffin seemed solid, next to the pavement surface the paraffin was stillin a semi-liquid state. This resulted in not being able to achieve an adequate seal. The water headwithin the permeameter would blow the seal. After these problems, FP2 was no longerinvestigated.
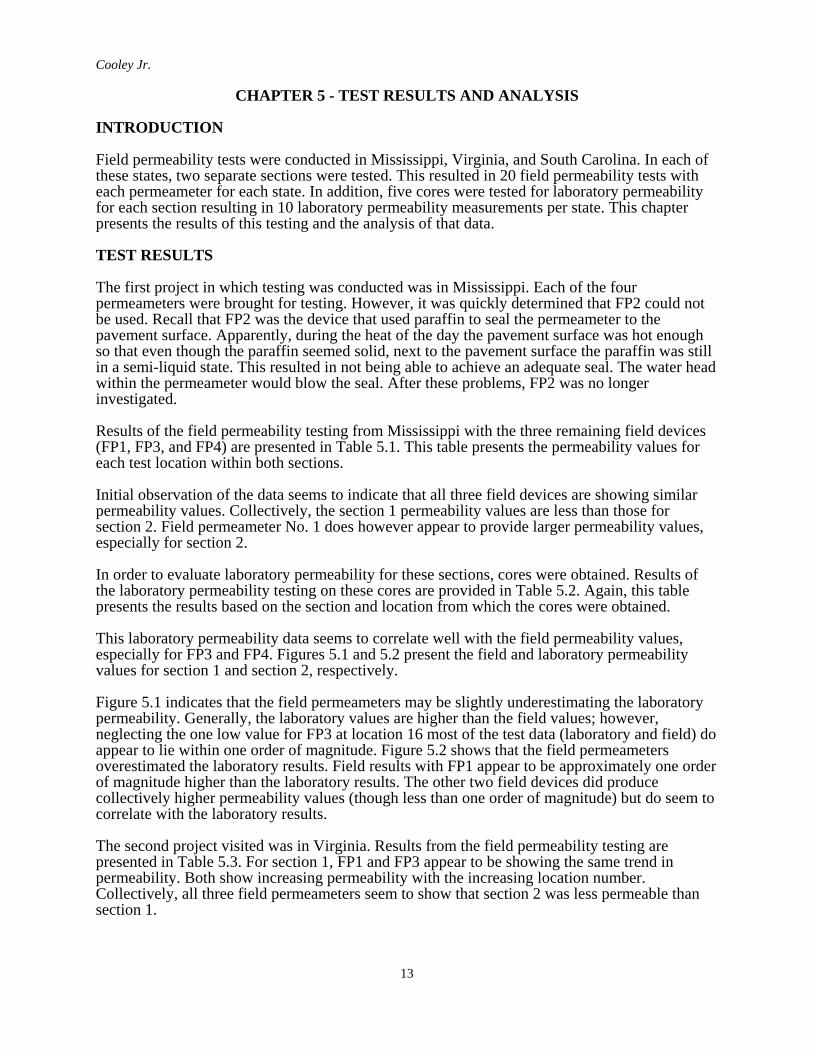
Results of the field permeability testing from Mississippi with the three remaining field devices(FP1, FP3, and FP4) are presented in Table 5.1. This table presents the permeability values foreach test location within both sections.
Initial observation of the data seems to indicate that all three field devices are showing similarpermeability values. Collectively, the section 1 permeability values are less than those forsection 2. Field permeameter No. 1 does however appear to provide larger permeability values,especially for section 2.
In order to evaluate laboratory permeability for these sections, cores were obtained. Results ofthe laboratory permeability testing on these cores are provided in Table 5.2. Again, this tablepresents the results based on the section and location from which the cores were obtained.
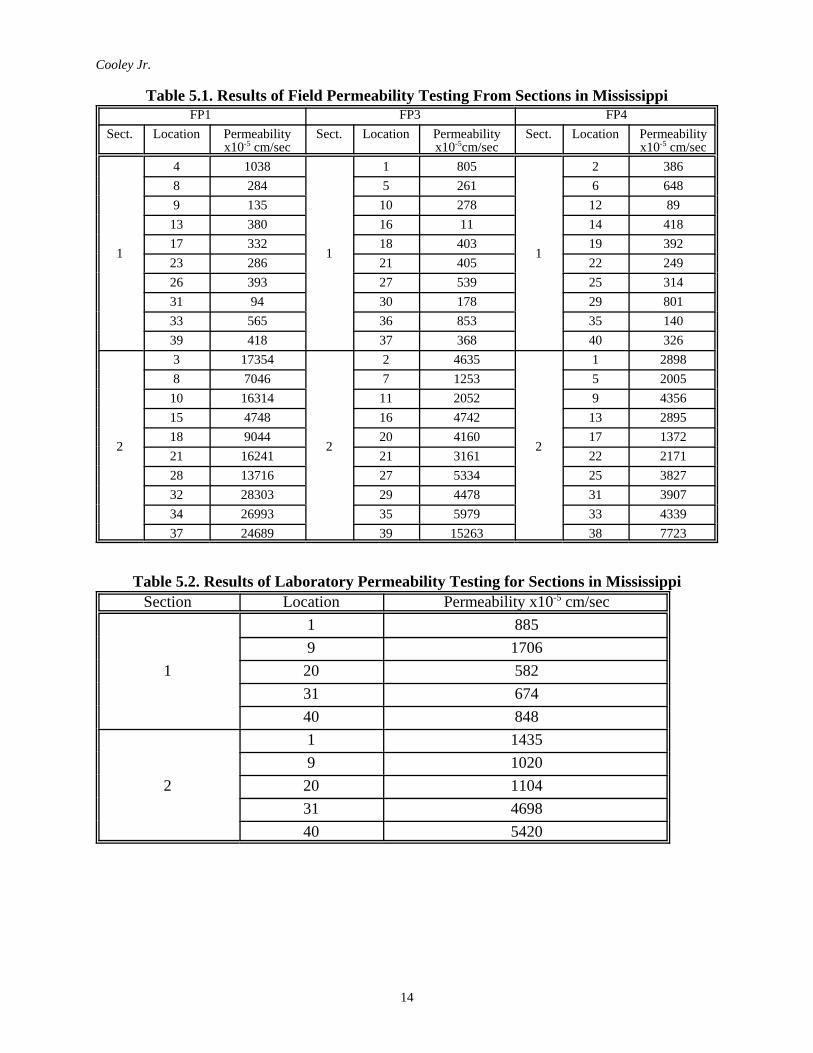
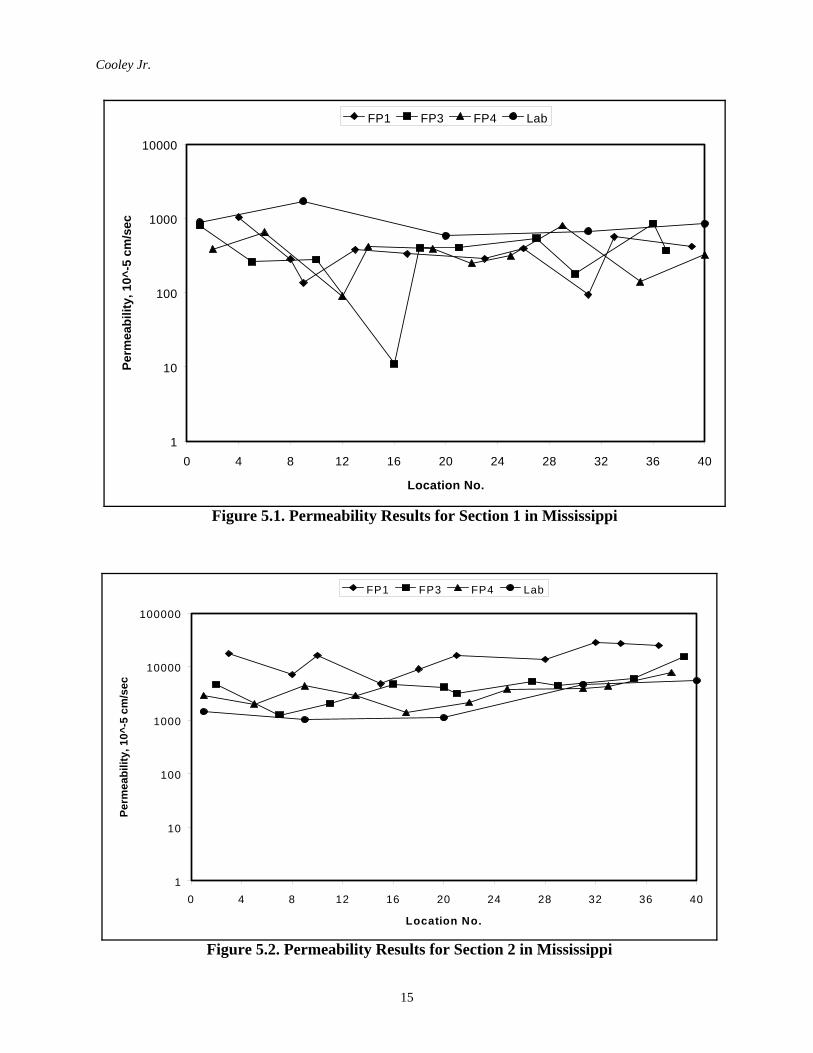
This laboratory permeability data seems to correlate well with the field permeability values,especially for FP3 and FP4. Figures 5.1 and 5.2 present the field and laboratory permeabilityvalues for section 1 and section 2, respectively.
Figure 5.1 indicates that the field permeameters may be slightly underestimating the laboratorypermeability. Generally, the laboratory values are higher than the field values; however,neglecting the one low value for FP3 at location 16 most of the test data (laboratory and field) doappear to lie within one order of magnitude. Figure 5.2 shows that the field permeametersoverestimated the laboratory results. Field results with FP1 appear to be approximately one orderof magnitude higher than the laboratory results. The other two field devices did producecollectively higher permeability values (though less than one order of magnitude) but do seem tocorrelate with the laboratory results.
The second project visited was in Virginia. Results from the field permeability testing arepresented in Table 5.3. For section 1, FP1 and FP3 appear to be showing the same trend inpermeability. Both show increasing permeability with the increasing location number.Collectively, all three field permeameters seem to show that section 2 was less permeable thansection 1.
Cooley Jr.
14
Table 5.1. Results of Field Permeability Testing From Sections in MississippiFP1 FP3 FP4
Sect. Location Permeabilityx10-5 cm/sec
Sect. Location Permeabilityx10-5cm/sec
Sect. Location Permeabilityx10-5 cm/sec
1
4 1038
1
1 805
1
2 3868 284 5 261 6 6489 135 10 278 12 89
13 380 16 11 14 41817 332 18 403 19 39223 286 21 405 22 24926 393 27 539 25 31431 94 30 178 29 80133 565 36 853 35 14039 418 37 368 40 326
2
3 17354
2
2 4635
2
1 28988 7046 7 1253 5 2005
10 16314 11 2052 9 435615 4748 16 4742 13 289518 9044 20 4160 17 137221 16241 21 3161 22 217128 13716 27 5334 25 382732 28303 29 4478 31 390734 26993 35 5979 33 433937 24689 39 15263 38 7723
Table 5.2. Results of Laboratory Permeability Testing for Sections in MississippiSection Location Permeability x10-5 cm/sec
1
1 8859 170620 58231 67440 848
2
1 14359 102020 110431 469840 5420
Cooley Jr.
15
1
10
100
1000
10000
100000
0 4 8 12 16 20 24 28 32 36 40
Location No.
Perm
eabi
lity,
10^
-5 c
m/s
ec
FP1 FP3 FP4 Lab
Figure 5.2. Permeability Results for Section 2 in Mississippi
1
10
100
1000
10000
0 4 8 12 16 20 24 28 32 36 40
Location No.
Perm
eabi
lity,
10^
-5 c
m/s
ecFP1 FP3 FP4 Lab
Figure 5.1. Permeability Results for Section 1 in Mississippi
Cooley Jr.
16
Table 5.3. Results of Field Permeability Testing From Sections in VirginiaFP1 FP3 FP4
Sect. Location Permeabilityx10-5 cm/sec
Sect. Location Permeabilityx10-5cm/sec
Sect. Location Permeabilityx10-5 cm/sec
1
3 599
1
4 848
1
2 10308 1101 7 672 6 5489 746 10 622 12 475
13 803 15 871 14 37019 1126 18 960 17 46724 5027 21 1764 23 76525 3096 26 2068 28 70630 2919 29 2750 32 65934 4099 36 2942 33 76539 1859 40 2974 38 533
2
2 499
2
4 54
2
1 5096 175 5 224 7 260
10 143 12 115 11 18913 582 16 239 15 20220 1083 17 259 19 23524 380 23 279 21 20026 507 28 694 27 49832 642 29 694 31 35533 1060 34 543 35 35338 816 40 442 39 918
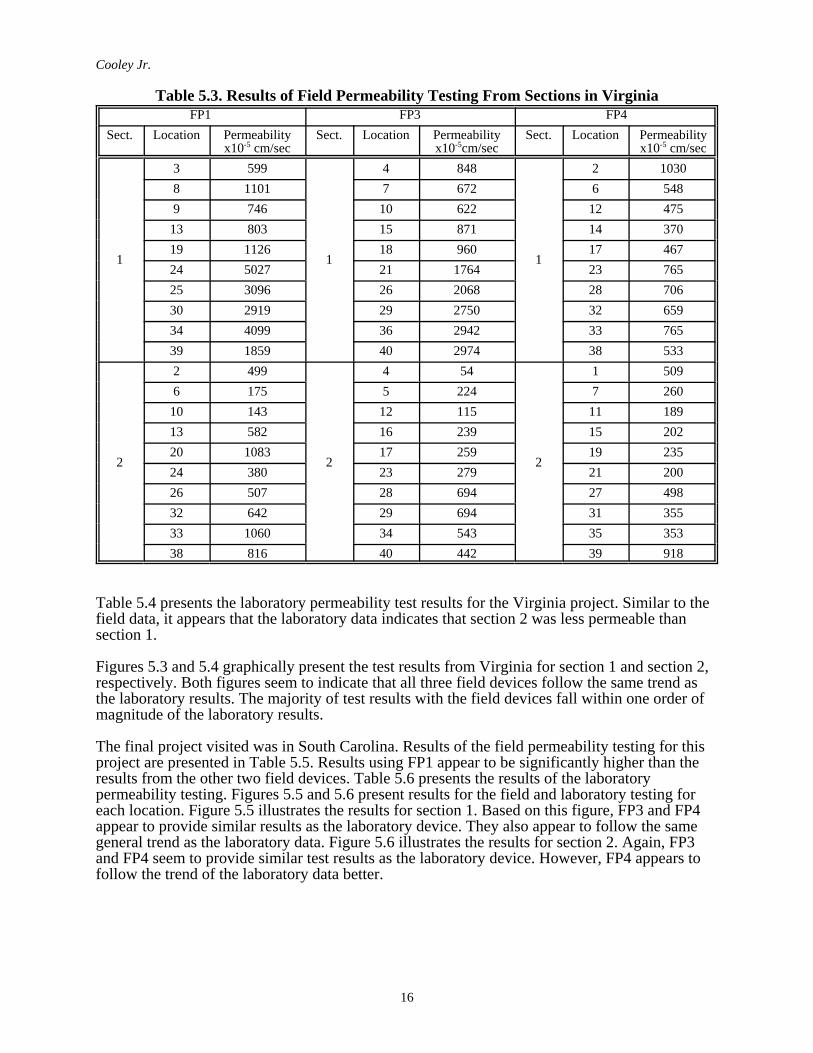
Table 5.4 presents the laboratory permeability test results for the Virginia project. Similar to thefield data, it appears that the laboratory data indicates that section 2 was less permeable thansection 1.
Figures 5.3 and 5.4 graphically present the test results from Virginia for section 1 and section 2,respectively. Both figures seem to indicate that all three field devices follow the same trend asthe laboratory results. The majority of test results with the field devices fall within one order ofmagnitude of the laboratory results.
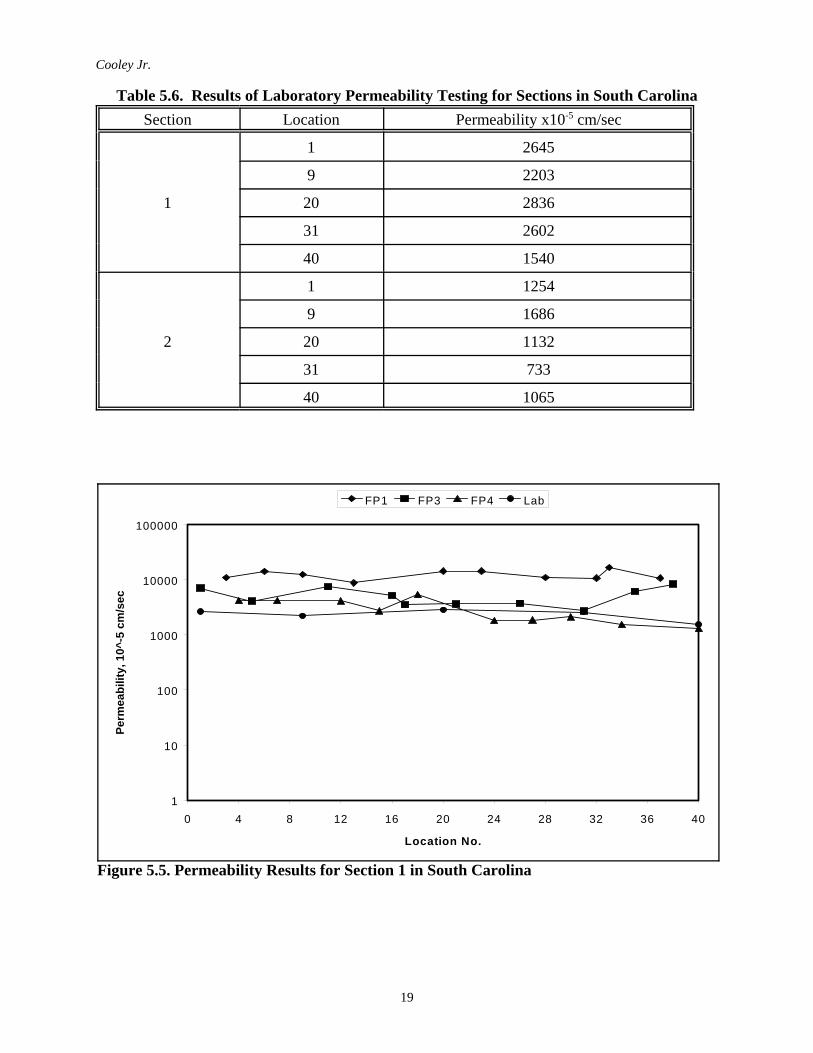
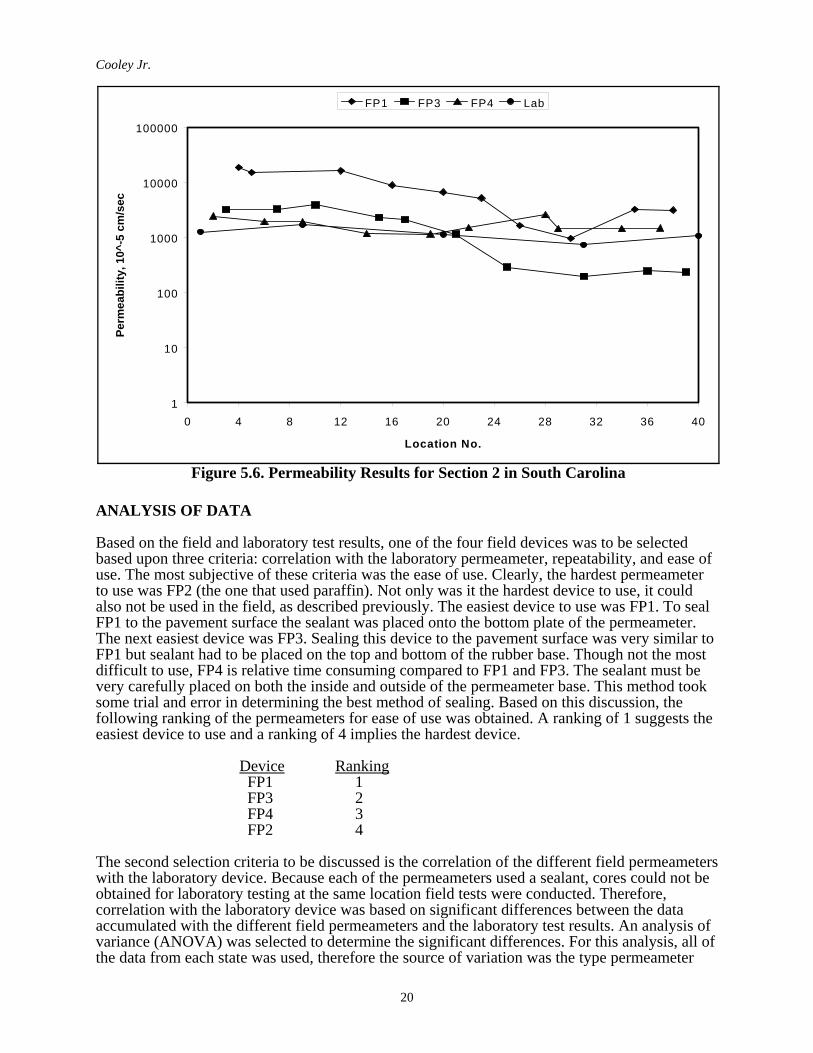
The final project visited was in South Carolina. Results of the field permeability testing for thisproject are presented in Table 5.5. Results using FP1 appear to be significantly higher than theresults from the other two field devices. Table 5.6 presents the results of the laboratorypermeability testing. Figures 5.5 and 5.6 present results for the field and laboratory testing foreach location. Figure 5.5 illustrates the results for section 1. Based on this figure, FP3 and FP4appear to provide similar results as the laboratory device. They also appear to follow the samegeneral trend as the laboratory data. Figure 5.6 illustrates the results for section 2. Again, FP3and FP4 seem to provide similar test results as the laboratory device. However, FP4 appears tofollow the trend of the laboratory data better.

Cooley Jr.
17
1
10
100
1000
10000
0 4 8 12 16 20 24 28 32 36 40
Location No.
Perm
eabi
lity,
10^
-5 c
m/s
ec
FP1 FP3 FP4 Lab
Figure 5.3. Permeability Results for Section 1 in Virginia
Table 5.4. Results of Laboratory Permeability Testing for Sections in VirginiaSection Location Permeability x10-5 cm/sec
1
1 15989 131620 106731 150140 1218
2
1 16649 52920 12031 25540 314

Cooley Jr.
18
1
10
100
1000
10000
0 4 8 12 16 20 24 28 32 36 40
Location No.
Perm
eabi
lity,
10^
-5 c
m/s
ecFP1 FP3 FP4 Lab
Figure 5.4. Permeability Results for Section 2 in Virginia
Table 5.5. Results of Field Permeability Testing From Sections in South CarolinaFP1 FP3 FP4
Sect. Location Permeabilityx10-5 cm/sec
Sect. Location Permeabilityx10-5cm/sec
Sect. Location Permeabilityx10-5 cm/sec
1
3 10839
1
1 7069
1
4 42226 14222 5 4077 7 42079 12425 11 7448 12 4127
13 8753 16 5183 15 272220 14394 17 3512 18 539623 14232 21 3632 24 182128 10886 26 3744 27 185732 10674 31 2712 30 212233 16583 35 6137 34 154837 10762 38 8354 40 1306
2
4 18660
2
3 3191
2
2 24405 15080 7 3278 6 1921
12 16221 10 3894 9 191016 8906 15 2313 14 116920 6635 17 2107 19 114823 5188 21 1150 22 151126 1636 25 290 28 257530 966 31 198 29 144135 3253 36 246 34 144738 3129 39 236 37 1473
Cooley Jr.
19
1
10
100
1000
10000
100000
0 4 8 12 16 20 24 28 32 36 40
Location No.
Perm
eabi
lity,
10^
-5 c
m/s
ec
FP1 FP3 FP4 Lab
Figure 5.5. Permeability Results for Section 1 in South Carolina
Table 5.6. Results of Laboratory Permeability Testing for Sections in South CarolinaSection Location Permeability x10-5 cm/sec
1
1 2645
9 2203
20 2836
31 2602
40 1540
2
1 1254
9 1686
20 1132
31 733
40 1065
Cooley Jr.
20
1
10
100
1000
10000
100000
0 4 8 12 16 20 24 28 32 36 40
Location No.
Perm
eabi
lity,
10^
-5 c
m/s
ecFP1 FP3 FP4 Lab
Figure 5.6. Permeability Results for Section 2 in South Carolina
ANALYSIS OF DATA
Based on the field and laboratory test results, one of the four field devices was to be selectedbased upon three criteria: correlation with the laboratory permeameter, repeatability, and ease ofuse. The most subjective of these criteria was the ease of use. Clearly, the hardest permeameterto use was FP2 (the one that used paraffin). Not only was it the hardest device to use, it couldalso not be used in the field, as described previously. The easiest device to use was FP1. To sealFP1 to the pavement surface the sealant was placed onto the bottom plate of the permeameter.The next easiest device was FP3. Sealing this device to the pavement surface was very similar toFP1 but sealant had to be placed on the top and bottom of the rubber base. Though not the mostdifficult to use, FP4 is relative time consuming compared to FP1 and FP3. The sealant must bevery carefully placed on both the inside and outside of the permeameter base. This method tooksome trial and error in determining the best method of sealing. Based on this discussion, thefollowing ranking of the permeameters for ease of use was obtained. A ranking of 1 suggests theeasiest device to use and a ranking of 4 implies the hardest device.
Device Ranking FP1 1 FP3 2 FP4 3 FP2 4
The second selection criteria to be discussed is the correlation of the different field permeameterswith the laboratory device. Because each of the permeameters used a sealant, cores could not beobtained for laboratory testing at the same location field tests were conducted. Therefore,correlation with the laboratory device was based on significant differences between the dataaccumulated with the different field permeameters and the laboratory test results. An analysis ofvariance (ANOVA) was selected to determine the significant differences. For this analysis, all ofthe data from each state was used, therefore the source of variation was the type permeameter
Cooley Jr.
21
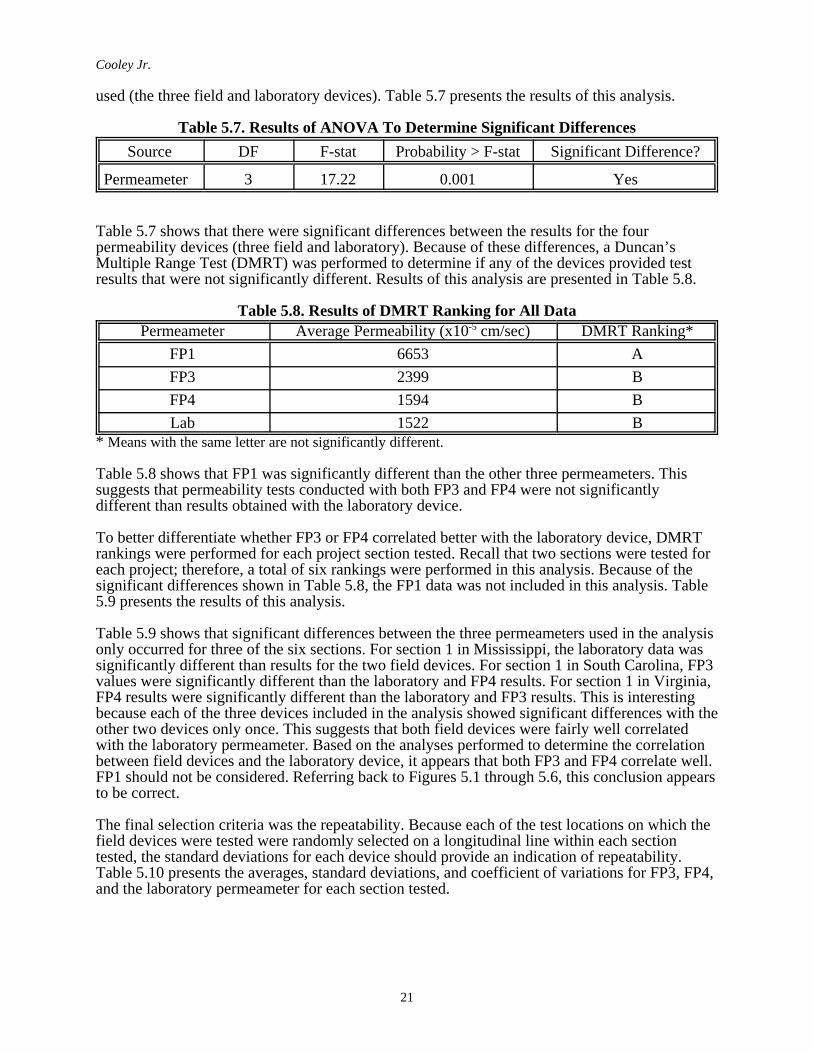
used (the three field and laboratory devices). Table 5.7 presents the results of this analysis.
Table 5.7. Results of ANOVA To Determine Significant DifferencesSource DF F-stat Probability > F-stat Significant Difference?
Permeameter 3 17.22 0.001 Yes
Table 5.7 shows that there were significant differences between the results for the fourpermeability devices (three field and laboratory). Because of these differences, a Duncan’sMultiple Range Test (DMRT) was performed to determine if any of the devices provided testresults that were not significantly different. Results of this analysis are presented in Table 5.8.
Table 5.8. Results of DMRT Ranking for All DataPermeameter Average Permeability (x10-5 cm/sec) DMRT Ranking*
FP1 6653 AFP3 2399 BFP4 1594 BLab 1522 B
* Means with the same letter are not significantly different.
Table 5.8 shows that FP1 was significantly different than the other three permeameters. Thissuggests that permeability tests conducted with both FP3 and FP4 were not significantlydifferent than results obtained with the laboratory device.
To better differentiate whether FP3 or FP4 correlated better with the laboratory device, DMRTrankings were performed for each project section tested. Recall that two sections were tested foreach project; therefore, a total of six rankings were performed in this analysis. Because of thesignificant differences shown in Table 5.8, the FP1 data was not included in this analysis. Table5.9 presents the results of this analysis.
Table 5.9 shows that significant differences between the three permeameters used in the analysisonly occurred for three of the six sections. For section 1 in Mississippi, the laboratory data wassignificantly different than results for the two field devices. For section 1 in South Carolina, FP3values were significantly different than the laboratory and FP4 results. For section 1 in Virginia,FP4 results were significantly different than the laboratory and FP3 results. This is interestingbecause each of the three devices included in the analysis showed significant differences with theother two devices only once. This suggests that both field devices were fairly well correlatedwith the laboratory permeameter. Based on the analyses performed to determine the correlationbetween field devices and the laboratory device, it appears that both FP3 and FP4 correlate well.FP1 should not be considered. Referring back to Figures 5.1 through 5.6, this conclusion appearsto be correct.
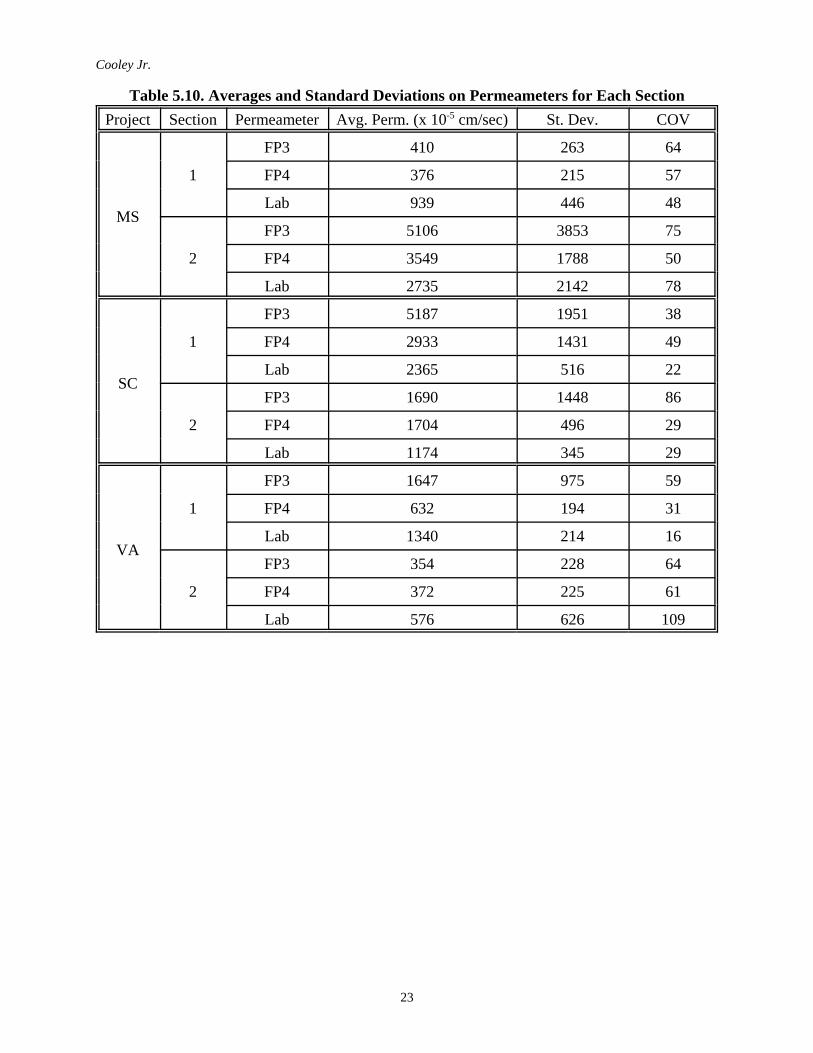
The final selection criteria was the repeatability. Because each of the test locations on which thefield devices were tested were randomly selected on a longitudinal line within each sectiontested, the standard deviations for each device should provide an indication of repeatability.Table 5.10 presents the averages, standard deviations, and coefficient of variations for FP3, FP4,and the laboratory permeameter for each section tested.

Cooley Jr.
22
Table 5.9. DMRT Rankings for Each Section Using FP3, FP4, and Laboratory DataProject Section Permeameter Avg. Permeability (x 10-5
cm/sec)Ranking*
MS
1Lab 939 AFP3 410 BFP4 376 B
2FP3 5106 AFP4 3549 ALab 2735 A
SC
1FP3 5186 AFP4 2932 BLab 2365 B
2FP4 1703 AFP3 1690 ALab 1174 A
VA
1FP3 1647 ALab 1340 AFP4 631 B
2Lab 576 AFP4 372 AFP3 354 A
* Means with the same letter are not significantly different.
When evaluating the repeatability of the different field devices, the standard deviation of thelaboratory permeability test results must be considered. Ideally, the standard deviation of thefield devices would be identical to the lab device. The COV was included in Table 5.10 tonormalize the standard deviations. Coefficient of variation is defined as the standard deviationdivided by the average and expressed as a percentage. Based on the COVs presented in Table5.10, it is unclear which field permeameter shows similar repeatability to the laboratory testresults. For some sections the COV for FP3 is closer to the laboratory COV while for some FP4is closer. Therefore, it appears that FP3 and FP4 have approximately the same repeatability.
Cooley Jr.
23
Table 5.10. Averages and Standard Deviations on Permeameters for Each SectionProject Section Permeameter Avg. Perm. (x 10-5 cm/sec) St. Dev. COV
MS
1
FP3 410 263 64
FP4 376 215 57
Lab 939 446 48
2
FP3 5106 3853 75
FP4 3549 1788 50
Lab 2735 2142 78
SC
1
FP3 5187 1951 38
FP4 2933 1431 49
Lab 2365 516 22
2
FP3 1690 1448 86
FP4 1704 496 29
Lab 1174 345 29
VA
1
FP3 1647 975 59
FP4 632 194 31
Lab 1340 214 16
2
FP3 354 228 64
FP4 372 225 61
Lab 576 626 109

Cooley Jr.
24
CHAPTER 6 - CONCLUSIONS AND RECOMMENDATIONS
CONCLUSIONS
Based on the analysis of the data accumulated during the conduct of this study, the selection of afield permeameter that correlates best to the laboratory permeability device, is repeatable, and iseasy to use basically comes down to FP3 and FP4. Neither of these permeameters showedsignificant differences with the laboratory device and both had approximately the samerepeatability. Therefore, the selection criteria that must be used for the selection of a fieldpermeameter is ease of use. Based on this criteria, FP3 is selected. Based on the experiences withthe three field permeameters, FP3 was the second easiest to use. FP1 was the easiest but did notcorrelate with the laboratory device. A standard procedure for using FP3 is provided inAppendix A.
RECOMMENDATIONS
Based upon the results of this study a field permeameter was selected that was correlated tolaboratory test results, repeatable, and easy to use. It is recommended that several minormodifications be made to the selected permeameter and another field study be performed todetermine what factors influence the permeability of Superpave designed pavements. Onemodification envisioned is to make the rubber base plate permanent on the bottom of thepermeameter. This would negate the need for applying sealant in two places. Another possiblemodification would be to increase the mass of the weight used with this device. Because of therubber base plate utilized with this device, the added mass would better push the sealant into thepavement surface voids leading to a more repeatable seal.
The field study should have two main objectives. First, factors should be identified that influencethe permeability of Superpave designed pavements. Tentatively, factors such as gradation type(above, below, or through the restricted zone), nominal maximum aggregate size, air voidcontent, roller type (static steel wheel, vibratory, or pneumatic tire), lift thickness, etc. should beevaluated. Secondly, using the information obtained from the field study, it should be determinedat what air void content Superpave designed pavements become excessively permeable. Thistype of information would be valuable in evaluating current density requirements.
At the conclusion of the field study, each participating state should receive the final version ofthe selected field permeameter. This will allow each state to evaluate particular points of interestconcerning the permeability of pavements. In addition, a set of detailed blue prints of theselected field device should be included in the final report. This will allow commercial vendorsto build the device.
ACKNOWLEDGMENTS
The author would like to thank the member states of the Southeastern Superpave Center. Without their participation, this study could not have been accomplished.

Cooley Jr.
25
REFERENCES
1. Roberts et.al, Hot Mix Asphalt Materials, Mixture Design, and Construction, NAPAEducation Foundation, Lanham, Maryland, Second Edition, 1996.
2. Zube, E., “Compaction Studies of Asphalt Concrete Pavements as Related to the WaterPermeability Test,” Highway Research Board, Bulletin 358, 1962.
3. Brown, E.R., R. Collins, and J.R. Brownfield, “Investigation of Segregation of AsphaltMixtures in the State of Georgia,” Transportation Research Record 1217, 1989.
4. Choubane, B., G.C. Page, and J.A. Musselman, “ Investigation of Water Permeability ofCoarse Graded Superpave Pavements,” Preprint, Annual Meeting and Technical Sessionsof the American Association of Asphalt Paving Technologists, March 16-18, 1998.
5. Florida Department of Transportation, “Florida Method of Test for Water Permeability ofCompacted Asphalt Paving Mixtures,” February 1997.
6. Georgia Department of Transportation, Standard Specifications for Road and BridgeConstruction, 1993 Edition.
7. Holtz, R.D. and W.D. Kovacs, An Introduction to Geotechnical Engineering, PrenticeHall, Englewood Cliffs, New Jersey, 1981.
8. Das, B.M., Advance Soil Mechanics, Hemisphere Publishing Corporation, 1983.9. Olson, R.E. and D.E. Daniel, “Measurement of the Hydraulic Conductivity of Fine-
Grained Soils,” Permeability and Groundwater Containment Transport, ASTM STP 746,T.F. Zimmie and C.O. Riggs, Eds., American Society for Testing and Materials, 1981.
10. Ford, M.C. and C.E. McWilliams, “Asphalt Mix Permeability,” University of Arkansas,Fayetteville, Arkansas, 1988.
11. Hudson, S.B. and R.L. Davis, “Relationship of Aggregate Voidage to Gradation,”Association of Asphalt Paving Technologists, Volume 34, 1965.
12. James, J.M., “Asphalt Mix Permeability,” FHWA/AR-88/003, September 1965.13. McLaughlin, J.F. and W.H. Goetz, “Permeability, Void Content, and Durability of
Bituminous Concrete,” Proceedings, Highway Research Board, Volume 34, 1955.

Cooley Jr.
26
APPENDIX A

Cooley Jr.
27
Field Estimation of Water Permeability of Compacted Asphalt Paving Mixtures
Field Permeameter No. 1
1. Scope
1.1 This test method covers the in-place estimation of the water permeability of acompacted hot mix asphalt (HMA) pavement. The estimate provides an indicationof water permeability of a pavement location as compared to those of otherpavement locations.
1.2 The values stated in metric (SI) unit are regarded as standard. Values given inparenthesis are for information and reference purposes only.
1.3 This standard does not purport to address all of the safety problems associated withits use. It is the responsibility of the user of this standard to establish appropriatesafety and health practices and determine the applicability of regulatory limitationsprior to use.
2. Summary of Test Method
2.1 A falling head permeability test, as shown in Figure 1, is used to estimate the rate atwhich water flows into a compacted HMA pavement. Water from a graduatedstandpipe is allowed to flow into a compacted HMA pavement and the interval oftime taken to reach a known change in head loss is recorded. The coefficient ofpermeability of a compacted HMA pavement is then estimated based on Darcy’sLaw.
3. Significance and Use
3.1 This test method provides a means of estimating water permeability of compactedHMA pavements. The estimation of water permeability is based upon assumptionsthat the sample thickness is equal to the immediately underlying HMA pavementcourse thickness; the area of the tested sample is equal to the area of thepermeameter from which water is allowed to penetrate the HMA pavement; one-dimensional flow; and laminar flow of the water. It is assumed that Darcy’s law isvalid.
4. Apparatus
4.1 Hand broom - A broom of sufficient stiffness to sweep a test location free of debris.
4.2 Timing Device - A stopwatch or other timing device graduated in divisions of 1.0seconds.
4.3 Sealant - A silicone-rubber caulk to seal the permeameter to the pavement surface.
4.4 Field Permeameter - A field permeameter made to the dimensions andspecifications shown in Figure A.1.
5. Preparation of Pavement Surface
5.1 Prior to conducting the test, a broom should be used to remove all debris from thepavement surface. Debris left on the pavement surface can hinder the sealing of thepermeameter to the pavement surface.

Cooley Jr.
28
6. Test Procedure
6.1 Permeameter Setup
6.1.1 Turn the permeameter upside down so that the bottom of the plastic, circularbase plate is facing upwards. Place sealant onto the bottom plastic, circularbaseplate.
6.1.2 Invert the permeameter and place onto the pavement surface. Push thepermeameter onto the pavement surface in order for the sealant to penetratethe surface voids of the pavement.
6.1.3 Place the weight over the standpipe onto the plastic, circular base plate.
6.1.4 Allow one minute for the sealant to partially set up.
6.2 Pavement Saturation
6.2.1 Fill the standpipe approximately half full with water.
6.2.2 Allow the water to remain in the standpipe for not less than one minute. Itmay be necessary to add water to keep the water leel approximately half fullwithin the standpipe.
6.3 To start the test, introduce water into the standpipe to just above the desired initialhead.
6.4 When the water level is at the desired initial head, start the timing device. Stop thetiming device when the water level within the standpipe reaches the desired finalhead. Record the initial head, final head, and time interval between the initial andfinal head.
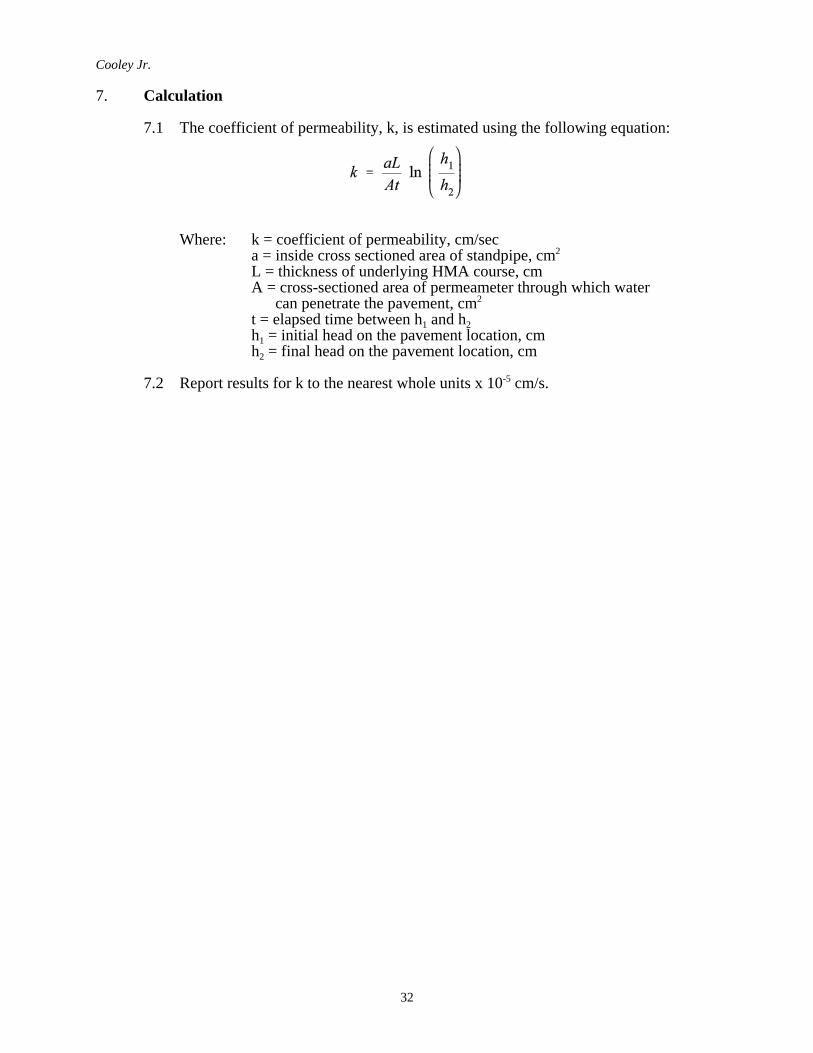
7. Calculation
7.1 The coefficient of permeability, k, is estimated using the following equation:
Where: k = coefficient of permeability, cm/seca = inside cross sectioned area of standpipe, cm2
L = thickness of underlying HMA course, cmA = cross-sectioned area of permeameter through which water can penetrate the pavement, cm2
t = elapsed time between h1 and h2h1 = initial head on the pavement location, cmh2 = final head on the pavement location, cm
7.2 Report results for k to the nearest whole units x 10-5 cm/s.

Cooley Jr.
29
Figure A.1: Field Permeameter No. 1
Cooley Jr.
30
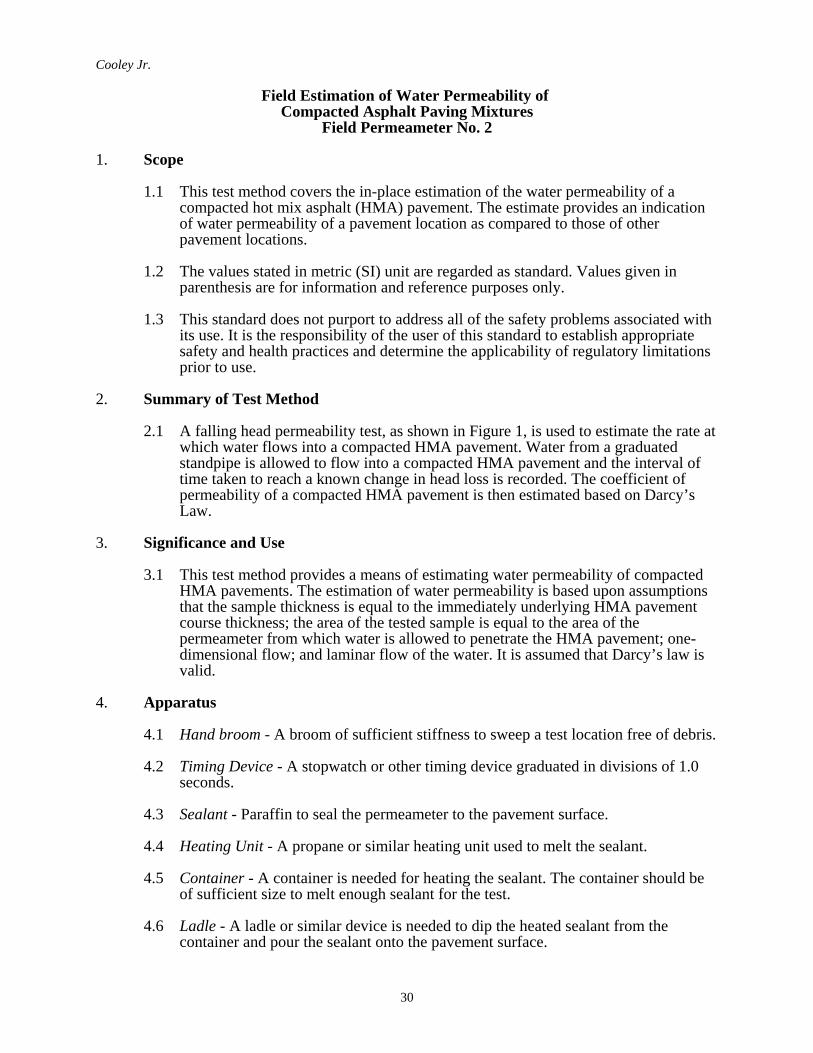
Field Estimation of Water Permeability of Compacted Asphalt Paving Mixtures
Field Permeameter No. 2
1. Scope
1.1 This test method covers the in-place estimation of the water permeability of acompacted hot mix asphalt (HMA) pavement. The estimate provides an indicationof water permeability of a pavement location as compared to those of otherpavement locations.
1.2 The values stated in metric (SI) unit are regarded as standard. Values given inparenthesis are for information and reference purposes only.
1.3 This standard does not purport to address all of the safety problems associated withits use. It is the responsibility of the user of this standard to establish appropriatesafety and health practices and determine the applicability of regulatory limitationsprior to use.
2. Summary of Test Method
2.1 A falling head permeability test, as shown in Figure 1, is used to estimate the rate atwhich water flows into a compacted HMA pavement. Water from a graduatedstandpipe is allowed to flow into a compacted HMA pavement and the interval oftime taken to reach a known change in head loss is recorded. The coefficient ofpermeability of a compacted HMA pavement is then estimated based on Darcy’sLaw.
3. Significance and Use
3.1 This test method provides a means of estimating water permeability of compactedHMA pavements. The estimation of water permeability is based upon assumptionsthat the sample thickness is equal to the immediately underlying HMA pavementcourse thickness; the area of the tested sample is equal to the area of thepermeameter from which water is allowed to penetrate the HMA pavement; one-dimensional flow; and laminar flow of the water. It is assumed that Darcy’s law isvalid.
4. Apparatus
4.1 Hand broom - A broom of sufficient stiffness to sweep a test location free of debris.
4.2 Timing Device - A stopwatch or other timing device graduated in divisions of 1.0seconds.
4.3 Sealant - Paraffin to seal the permeameter to the pavement surface.
4.4 Heating Unit - A propane or similar heating unit used to melt the sealant.
4.5 Container - A container is needed for heating the sealant. The container should beof sufficient size to melt enough sealant for the test.
4.6 Ladle - A ladle or similar device is needed to dip the heated sealant from thecontainer and pour the sealant onto the pavement surface.

Cooley Jr.
31
4.7 Field Permeameter - A field permeameter made to the dimensions andspecifications shown in Figure A.2.
5. Preparation of Pavement Surface
5.1 Prior to conducting the test, a broom should be used to remove all debris from thepavement surface. Debris left on the pavement surface can hinder the sealing of thepermeameter to the pavement surface.
6. Test Procedure
6.1 Permeameter Set Up
6.1.1 Ensure the base mold is free from debris
6.1.2 Place the base mold onto the pavement surface.
6.1.3 Place the outside ring onto the pavement surface around the base mold. Careshould be taken to center the base mold within the outside ting.
6.1.4 Heat the paraffin wax to a liquid state and pour between the base mold andoutside ring. (See Note 1) The paraffin should be placed in at least threelayers (See Note 2).
Note 1:For best results allow the paraffin to cool prior to pouring between the basemold and outside ring. The paraffin has sufficiently cooled when it begins toskim over at the top.
Note 2:The first layer of paraffin should be placed around the entire circumferencebetween the base mold and outside ring. This layer should be just thickenough to cover the surface voids of the pavement. Subsequent layers ofparaffin should be placed in approximately equal lifts.
6.1.5 Place weight over the standpipe onto the top cap.
6.1.6 Allow the paraffin to cool for not less than one minute. The paraffin shouldbe stiff with a touch of the finger.
6.2 Pavement Saturation
6.2.1 Assemble the permeameter including, top cap, and standpipe.
6.2.2 Fill the standpipe to just above the top cap of the permeameter.
6.2.3 Allow the water to remain in the standpipe for not less than one minute. Itmay be necessary to add water to keep the water level above the top cap ofthe permeameter.
6.3 To start the test, introduce water into the standpipe to just above the desired initialhead.
6.4 When the water level is at the desired initial head, start the timing device. Stop thetiming device when the water level within the standpipe reaches the desired finalhead. Record the initial head, final head, and time interval between the initial andfinal head.
Cooley Jr.
32
7. Calculation
7.1 The coefficient of permeability, k, is estimated using the following equation:
Where: k = coefficient of permeability, cm/seca = inside cross sectioned area of standpipe, cm2
L = thickness of underlying HMA course, cmA = cross-sectioned area of permeameter through which water can penetrate the pavement, cm2
t = elapsed time between h1 and h2h1 = initial head on the pavement location, cmh2 = final head on the pavement location, cm
7.2 Report results for k to the nearest whole units x 10-5 cm/s.

Cooley Jr.
33
Figure A.2: Field Permeameter No. 2
Cooley Jr.
34
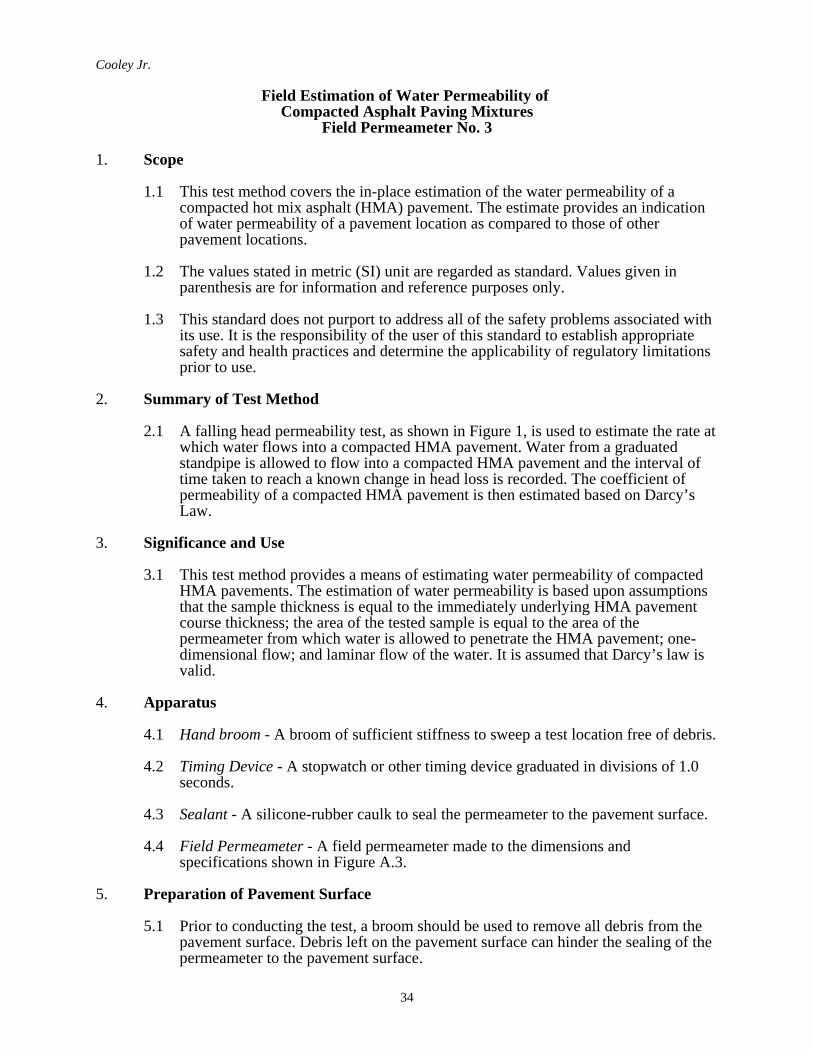
Field Estimation of Water Permeability of Compacted Asphalt Paving Mixtures
Field Permeameter No. 3
1. Scope
1.1 This test method covers the in-place estimation of the water permeability of acompacted hot mix asphalt (HMA) pavement. The estimate provides an indicationof water permeability of a pavement location as compared to those of otherpavement locations.
1.2 The values stated in metric (SI) unit are regarded as standard. Values given inparenthesis are for information and reference purposes only.
1.3 This standard does not purport to address all of the safety problems associated withits use. It is the responsibility of the user of this standard to establish appropriatesafety and health practices and determine the applicability of regulatory limitationsprior to use.
2. Summary of Test Method
2.1 A falling head permeability test, as shown in Figure 1, is used to estimate the rate atwhich water flows into a compacted HMA pavement. Water from a graduatedstandpipe is allowed to flow into a compacted HMA pavement and the interval oftime taken to reach a known change in head loss is recorded. The coefficient ofpermeability of a compacted HMA pavement is then estimated based on Darcy’sLaw.
3. Significance and Use
3.1 This test method provides a means of estimating water permeability of compactedHMA pavements. The estimation of water permeability is based upon assumptionsthat the sample thickness is equal to the immediately underlying HMA pavementcourse thickness; the area of the tested sample is equal to the area of thepermeameter from which water is allowed to penetrate the HMA pavement; one-dimensional flow; and laminar flow of the water. It is assumed that Darcy’s law isvalid.
4. Apparatus
4.1 Hand broom - A broom of sufficient stiffness to sweep a test location free of debris.
4.2 Timing Device - A stopwatch or other timing device graduated in divisions of 1.0seconds.
4.3 Sealant - A silicone-rubber caulk to seal the permeameter to the pavement surface.
4.4 Field Permeameter - A field permeameter made to the dimensions andspecifications shown in Figure A.3.
5. Preparation of Pavement Surface
5.1 Prior to conducting the test, a broom should be used to remove all debris from thepavement surface. Debris left on the pavement surface can hinder the sealing of thepermeameter to the pavement surface.
Cooley Jr.
35
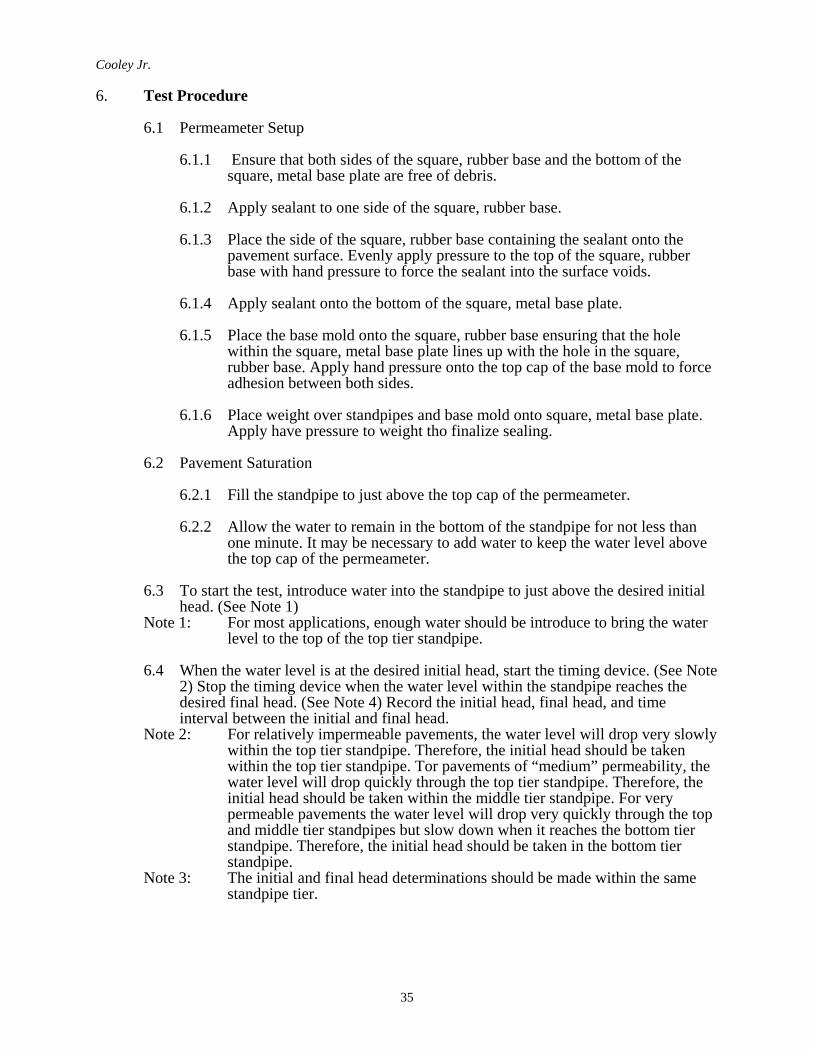
6. Test Procedure
6.1 Permeameter Setup
6.1.1 Ensure that both sides of the square, rubber base and the bottom of thesquare, metal base plate are free of debris.
6.1.2 Apply sealant to one side of the square, rubber base.
6.1.3 Place the side of the square, rubber base containing the sealant onto thepavement surface. Evenly apply pressure to the top of the square, rubberbase with hand pressure to force the sealant into the surface voids.
6.1.4 Apply sealant onto the bottom of the square, metal base plate.
6.1.5 Place the base mold onto the square, rubber base ensuring that the holewithin the square, metal base plate lines up with the hole in the square,rubber base. Apply hand pressure onto the top cap of the base mold to forceadhesion between both sides.
6.1.6 Place weight over standpipes and base mold onto square, metal base plate.Apply have pressure to weight tho finalize sealing.
6.2 Pavement Saturation
6.2.1 Fill the standpipe to just above the top cap of the permeameter.
6.2.2 Allow the water to remain in the bottom of the standpipe for not less thanone minute. It may be necessary to add water to keep the water level abovethe top cap of the permeameter.
6.3 To start the test, introduce water into the standpipe to just above the desired initialhead. (See Note 1)
Note 1: For most applications, enough water should be introduce to bring the waterlevel to the top of the top tier standpipe.
6.4 When the water level is at the desired initial head, start the timing device. (See Note2) Stop the timing device when the water level within the standpipe reaches thedesired final head. (See Note 4) Record the initial head, final head, and timeinterval between the initial and final head.
Note 2: For relatively impermeable pavements, the water level will drop very slowlywithin the top tier standpipe. Therefore, the initial head should be takenwithin the top tier standpipe. Tor pavements of “medium” permeability, thewater level will drop quickly through the top tier standpipe. Therefore, theinitial head should be taken within the middle tier standpipe. For verypermeable pavements the water level will drop very quickly through the topand middle tier standpipes but slow down when it reaches the bottom tierstandpipe. Therefore, the initial head should be taken in the bottom tierstandpipe.
Note 3: The initial and final head determinations should be made within the samestandpipe tier.

Cooley Jr.
36
7. Calculation
7.1 The coefficient of permeability, k, is estimated using the following equation:
Where: k = coefficient of permeability, cm/seca = inside cross sectioned area of standpipe, cm2
L = thickness of underlying HMA course, cmA = cross-sectioned area of permeameter through which water can penetrate the pavement, cm2
t = elapsed time between h1 and h2h1 = initial head on the pavement location, cmh2 = final head on the pavement location, cm
7.2 Report results for k to the nearest whole units x 10-5 cm/s.
Cooley Jr.
37
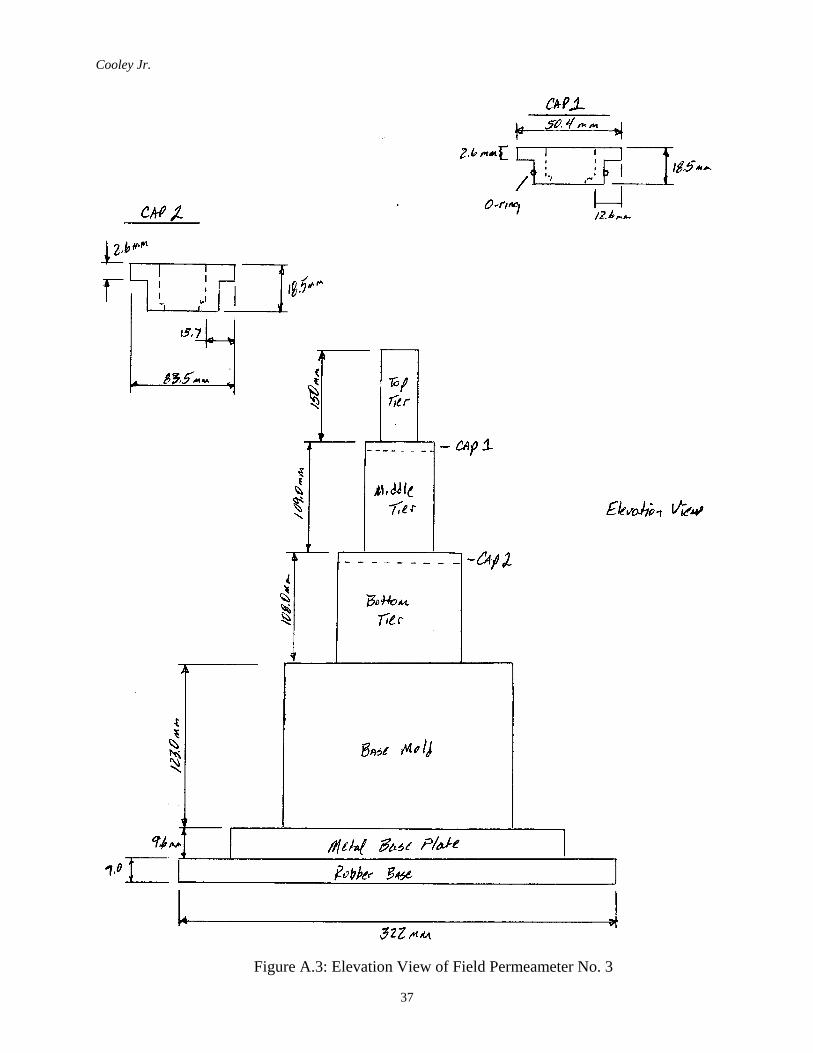
Figure A.3: Elevation View of Field Permeameter No. 3

Cooley Jr.
38
Figure A.3 (cont.): Plan View of Field Permeameter No. 3
Cooley Jr.
39
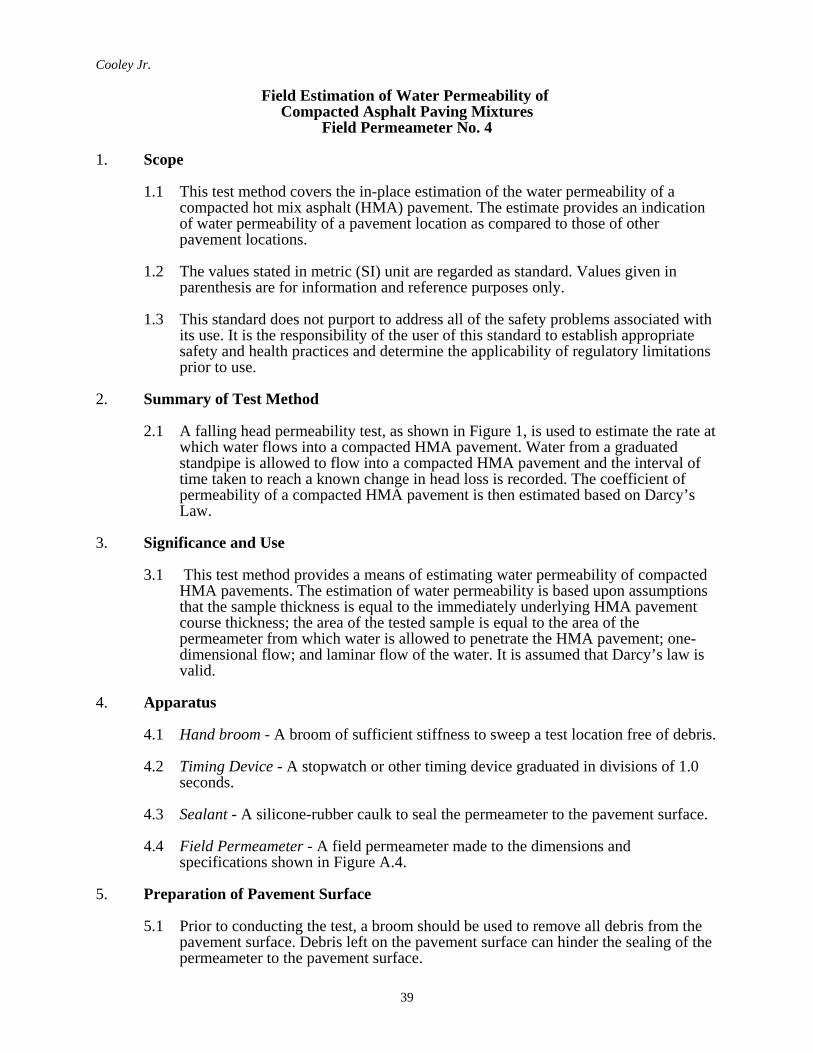
Field Estimation of Water Permeability of Compacted Asphalt Paving Mixtures
Field Permeameter No. 4
1. Scope
1.1 This test method covers the in-place estimation of the water permeability of acompacted hot mix asphalt (HMA) pavement. The estimate provides an indicationof water permeability of a pavement location as compared to those of otherpavement locations.
1.2 The values stated in metric (SI) unit are regarded as standard. Values given inparenthesis are for information and reference purposes only.
1.3 This standard does not purport to address all of the safety problems associated withits use. It is the responsibility of the user of this standard to establish appropriatesafety and health practices and determine the applicability of regulatory limitationsprior to use.
2. Summary of Test Method
2.1 A falling head permeability test, as shown in Figure 1, is used to estimate the rate atwhich water flows into a compacted HMA pavement. Water from a graduatedstandpipe is allowed to flow into a compacted HMA pavement and the interval oftime taken to reach a known change in head loss is recorded. The coefficient ofpermeability of a compacted HMA pavement is then estimated based on Darcy’sLaw.
3. Significance and Use
3.1 This test method provides a means of estimating water permeability of compactedHMA pavements. The estimation of water permeability is based upon assumptionsthat the sample thickness is equal to the immediately underlying HMA pavementcourse thickness; the area of the tested sample is equal to the area of thepermeameter from which water is allowed to penetrate the HMA pavement; one-dimensional flow; and laminar flow of the water. It is assumed that Darcy’s law isvalid.
4. Apparatus
4.1 Hand broom - A broom of sufficient stiffness to sweep a test location free of debris.
4.2 Timing Device - A stopwatch or other timing device graduated in divisions of 1.0seconds.
4.3 Sealant - A silicone-rubber caulk to seal the permeameter to the pavement surface.
4.4 Field Permeameter - A field permeameter made to the dimensions andspecifications shown in Figure A.4.
5. Preparation of Pavement Surface
5.1 Prior to conducting the test, a broom should be used to remove all debris from thepavement surface. Debris left on the pavement surface can hinder the sealing of thepermeameter to the pavement surface.

Cooley Jr.
40
6. Test Procedure
6.1 Permeameter Setup
6.1.1 Ensure the sides of the base mold are free from debris.
6.1.2 Remove the top cap from the base mold and p;ace the base mold onto thepavement surface.
6.1.3 Place a thin bead of sealant along the inside edge of base mold at thepavement surface. Use a finger to push the sealant into the surface voids ofthe pavement and to evenly distribute the sealant along the bottom of thebase mold. (See Note 1)
Note 1: Care should be taken not to apply too much sealant along the inside ofthe base mold. Any sealant along the inside edges of the base moldreduces the effective area through which water can penetrate theunderlying pavement.
6.1.4 Reassemble permeameter including the top cap and the standpipe.
6.2 Pavement Saturation
6.2.1 Fill the standpipe with water till the water level is just above the top cap.
6.2.2 Allow the water to remain in the standpipe for not less than one minute. Itmay be necessary to add water to keep the water level above the top cap.
6.3 To start the test, introduce water into the standpipe to just above the desired initialhead.
6.4 When the water level falls to the desired initial head, start the timing device. Stopthe timing device when the water level within the standpipe reaches the desiredfinal head. Record the initial head, final head, and time interval between the initialand final head.
7. Calculation
7.1 The coefficient of permeability, k, is estimated using the following equation:
Where: k = coefficient of permeability, cm/seca = inside cross sectioned area of standpipe, cm2
L = thickness of underlying HMA course, cmA = cross-sectioned area of permeameter through which water can penetrate the pavement, cm2
t = elapsed time between h1 and h2h1 = initial head on the pavement location, cmh2 = final head on the pavement location, cm
7.2 Report results for k to the nearest whole units x 10-5 cm/s.
Cooley Jr.
41
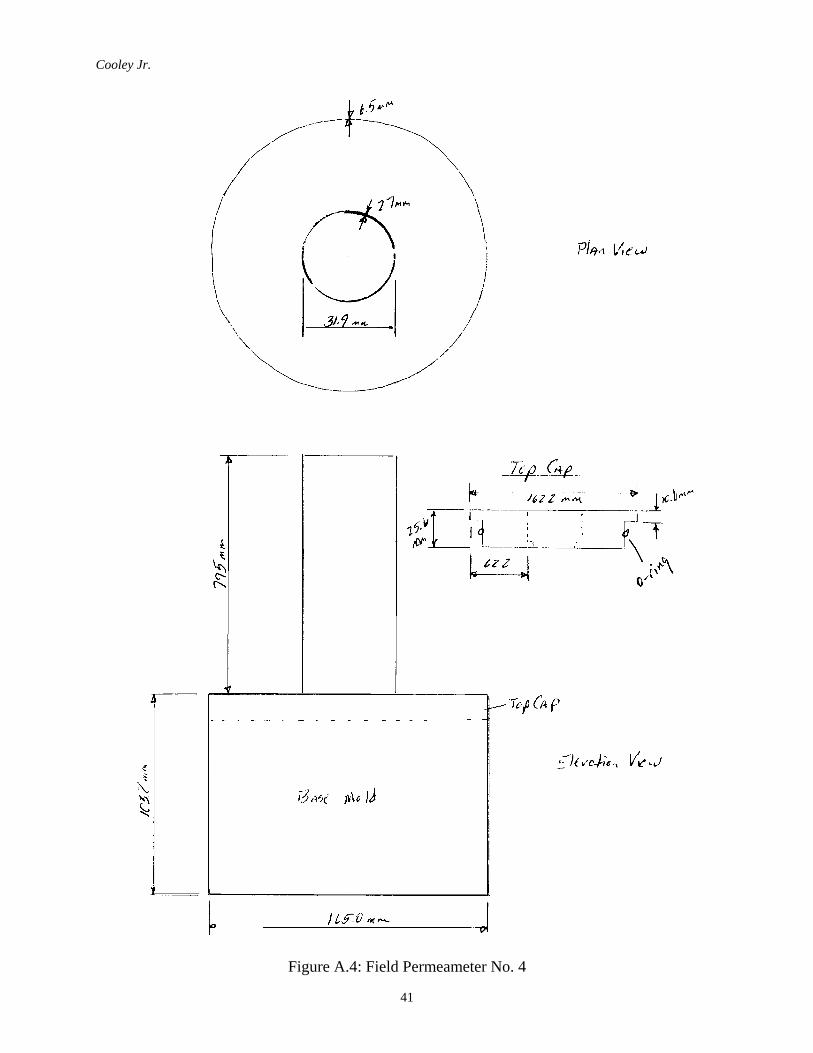
Figure A.4: Field Permeameter No. 4

Cooley Jr.
42
Appendix B
Cooley Jr.
43
Measurement of Water Permeability of Compacted Asphalt Paving Mixtures
Using the Karol-Warner Flexible Wall Permeameter
1. Scope
1.1 This test method covers the laboratory determination of water permeability of acompacted asphalt paving mixture sample. The measurement provides an indicationof water permeability of that sample as compared to those of other asphalt pavingsamples tested in the same manner.
1.2 The procedure uses either laboratory compacted or field cut core cylindricalspecimens.
1.3 The values stated in metric (SI) units are regarded as standard. Values given inparentheses are for information and reference purposes only.
1.4 This standard does not purport to address all of the safety problems associated withits use. It is the responsibility of the user of this standard to establish appropriatesafety and health practices and determine the applicability of regulatory limitationsprior to use.
2. Reference Documents
2.1 AASHTO StandardsT166 Bulk Specific Gravity of Compacted Bituminous MixturesT209 Maximum Specific Gravity of Bituminous Paving MixturesT283 Resistance of Compacted Bituminous Mixtures to Moisture Induced
Damage
3. Summary of Test Method
3.1 A falling head permeability test is used to determine the rate of flow of waterthrough a saturated specimen. Water from a graduated standpipe is allowed to flowthrough the saturated asphalt paving mixture sample and the time interval to reach aknown change in head is recorded. The coefficient of permeability of thecompacted paving mixture is then determined based on Darcy’s Law.
4. Significance and Use
4.1 This test method provides a means for determining the water permeability of water-saturated samples. It applies to one-dimensional, laminar flow of water. It isassumed that Darcy’s Law is valid.
5. Apparatus
5.1 Vacuum container, Type E from T209, and vacuum pump, from T209 includingmanometer.
5.2 Spacer - A specimen spacer similar to that used in T283.
5.3 Balance from T166.
5.4 Supply of distilled water at 23 ± 2° C.

Cooley Jr.
44
5.5 Sealant - petroleum jelly.
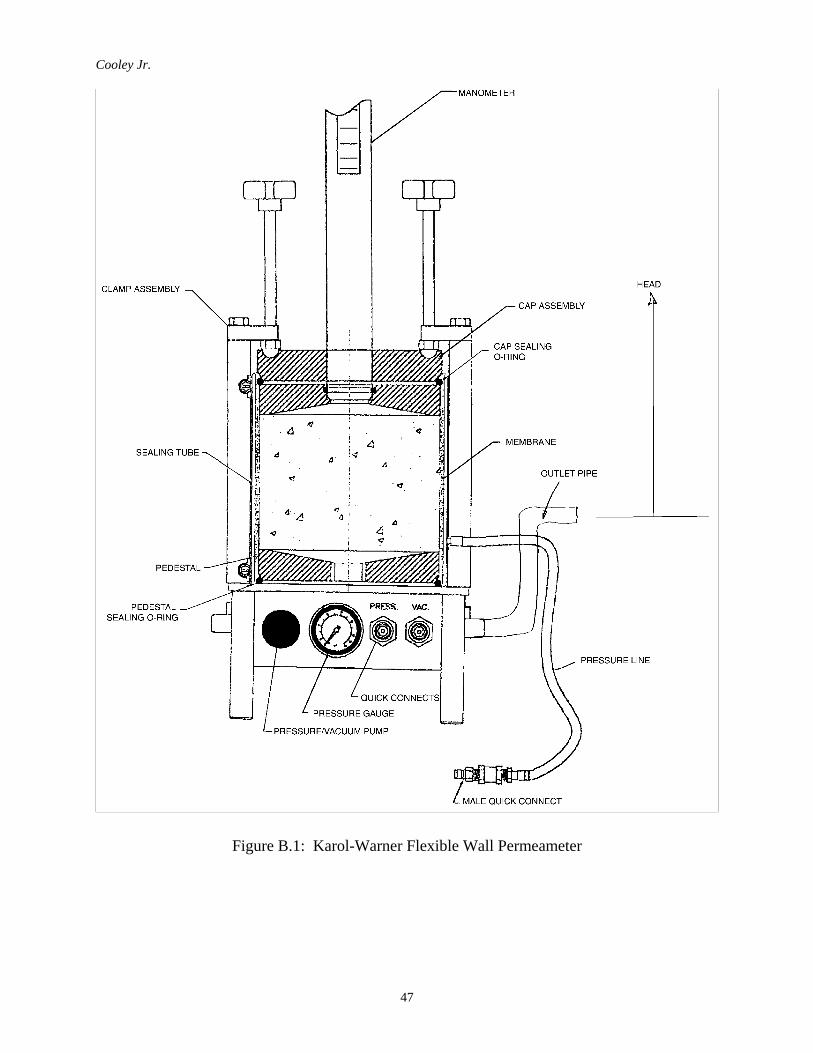
5.6 Karol-Warner laboratory permeameter shown in Figure B.1.
5.7 Timing device - A stopwatch of other timing device graduated in divisions of 1.0seconds.
5.8 Meterstick - A measuring device graduated in 0.1 centimeters.
6. Saturation of Test Specimens
6.1 Determine the bulk specific gravity of the sample in accordance with T166.
6.2 Place the specimen in a horizontal position in the vacuum container supportedabove the container bottom by the spacer. Fill the vacuum container with distilledwater so that the specimen is covered by at least 25 mm (1 inch) of water.
6.3 Remove trapped air and saturate the specimen by applying a gradually increasedvacuum until the residual pressure manometer reads 28 ± 2 mm of Hg. Maintain theresidual pressure for 15± 2 minutes. Manually agitate the container holding thespecimen during the vacuum period by applying 12 taps of a rubber mallet (3 tapsat each of 4 different location around the perimeter of the container) at 2 minuteintervals.
6.4 At the end of the vacuum period, release the vacuum by slowly increasing thepressure.
6.5 Allow the specimen to stand within the vacuum container, still covered with water,for 5 to 10 minutes.
6.6 Determine and record the saturated surface dry (SSD) mass of the specimenaccording to T166.
6.7 After determining the SSD mass, return the specimen to the vacuum containersimilar to that described in 6.2.
6.8 Calculate the degree of saturation for the specimen as follows:
Where: SSD = SSD mass of sample after vacuum conditioning, gramsM = dry mass of sample, gramsGmb = bulk specific gravity of compacted specimensGmm = maximum theoretical specific gravity of specimen (T209).
6.9 If the degree of saturation is not greater than or equal to 95 percent, repeat 6.2through 6.8 except maintain the residual pressure for 7 ± 2 minutes. Repeat thesesteps until 95 percent saturation is achieved
Note 1: Because of potential problems with measuring the SSD mass of coarsegraded mixtures, step 6.9 should only be performed a maximum of twotimes.
Cooley Jr.
45
7. Permeameter Calibration/Verification
7.1 With the permeameter completely assembled as shown in Figure 1, use themeterstick to measure a distance of 10 cm from the bottom of the outlet pipe andplace a mark onto the standpipe. This mark will be designated as the lower timingmark.
7.2 Establish an upper timing mark by using the meterstick to measure a distance of 30cm from the bottom of the outlet pipe. Place a mark at 30 cm on the standpipe.
8. Testing Procedure
8.1 Disassemble the permeameter by removing the clamp assembly and cap assembly.
8.2 Connect the pressure line on the permeameter to the vacuum quick connect. Usingthe pressure/vacuum pump, apply a vacuum to the sealing tube to remove entrappedair and collapse the membrane to the inside diameter of the cylinder.
8.3 Remove the specimen to be tested from the vacuum container filled with water andquickly apply a light coating of sealant to the perimeter of the specimen. Careshould be exercised so that no sealant gets onto the top or bottom of the specimen.
8.4 Place the specimen onto the pedestal at the bottom of the permeameter.
8.5 Expeditiously reassemble the permeameter making sure all connections are tight.
8.6 Disconnect the pressure line from the vacuum quick-connector and connect to thepressure quick connect.
8.7 Apply a confining pressure of 117 ± 13.8 kPa (17 ± 2 psi).
8.8 Place a tared pan or measure having a minimum capacity of 1000 ml underneath theoutlet pipe in order to catch the water exiting the outlet pipe.
8.9 Fill the permeameter standpipe to the upper timing mark with distilled water.Exercise care when filling to minimize the incorporation of air bubbles. Use ofrubber tubing and a clamp will facilitate the filling operation.
8.10 Carefully lean the permeameter from side to side to allow the escape of anyentrapped air from underneath the cap assembly. Continue this operation until allentrapped air has been removed.
8.11 Commence the water flow by opening the valve on the base of the outlet pipe.Allow water to flow until it begins to exit the outlet pipe. Once the water begins toexit the outlet pipe, close the valve on the base of the outlet pipe.
8.12 Refill the standpipe to the upper timing mark. Remove water from tared pan ormeasure and replace.
8.13 Commence the flow of water by opening the valve on the base of the outlet pipe.Simultaneously start the timing device.
8.14 Observe the water flow through the standpipe and record the time needed for thewater level to fall from the upper timing mark to the lower timing mark. Once the
Cooley Jr.
46
water reaches the lower timing mark immediately close the valve at the base of theoutlet pipe.
8.15 Determine the mass of water captured in the tared pan or measure. Determine thevolume of water flowing through the sample as follows:
Where: d = diameter of standpipe, cmD = distance between upper and lower timing mark, cm
8.16 Determine the beta factor by determining the percent of water flowing through thesample that was captured in the tared pan or measure as follows:
Where: Wt = water captured in the tared pan or measure, gramWf = water flowing through sample, cm3
8.17 If the beta factor is below 95 percent, the specimen is not saturated sufficiently. Ifbelow 95 percent repeat 8.12 through 8.16. If the beta factor is below 95 percentagain, go back to section 6 and repeat through 8.16.
8.18 If the beta factor is 95 percent or above, repeat 8.12 through 8.14 three additionaltimes. Use the average time of three consecutive tests to compute permeability.
9. Calculation
9.1 The water coefficient of permeability, k, is determined using the followingequation:
Where: k = coefficient of permeability, cm/sa = inside cross-sectional area of standpipe, cm2
L = thickness of test specimen, cmA = cross-sectioned area of test specimen, cm2
t = average elapsed time water flowed between timing marks, sh1 = initial head at upper timing mark, cmh2 = final head at lower timing mark, cm
10. Report
10.1 For each sample, the coefficient of permeability is reported in whole units x 10-5
cm/s.
Cooley Jr.
47
Figure B.1: Karol-Warner Flexible Wall Permeameter