Permeability Field Investigation - Potomac River
9
11/17/2015 Permeability Field Investigation Interstate Commission on the Potomac River Basin 1 TEACHER INSTRUCTIONS Use: This activity works well after the Watershed Connections presentation and watershed model activities or doing a different lesson that provides the necessary background for a hypothesis and discussion. Time: 60-90 minutes, depending on the number of sites tested and extensions. Students also can be involved in drawing a campus map, which requires additional time. Grades: Grades 5-10 Skills & Standards -- MD Environmental Literacy Standards 1A, 1B, and 5B; Core Curriculum grades 5 and 6 math: Using the Scientific Method Using results to make recommendations for campus Stormwater Sustainable Practices Recording and organizing data using a map and tables Making measurements, basic math and averaging (with extensions for volume and unit conversion) Concepts Developed Permeability, infiltration, and surface water runoff on different surfaces The use of sustainable practices to reduce storm water runoff on the school grounds Reliability in scientific research Supplies for Each Team 6-inch PVC pipe 3-in diameter (can be cut with a hacksaw). Draw a line .25 inches (.6 cm) from the bottom on this cylinder with a Sharpie. Option: coffee cans with both ends removed. Make sure the cans are the same size and that sharp ends are covered with duct tape. 1000 ml-measuring cup Stop watch Small map of school grounds Clear ruler with metric marks Red, green, and yellow markers and pencil Directions for Permeability Field Test Field Observation Sheet Container of water for multiple sites (could be 2-liter soda bottle) Supplies For Whole Class Large map of school yard on large paper Large pad of paper, easel, markers, pencil for class data table Extra water Permeability Field Investigation Using the scientific method to guide this outdoor investigation, students test the permeability of different school-ground areas, record and organize the results with maps and tables, and make recommendations for sustainable stormwater practices. The following are included: Teachers Instructions: Pages 1-3 Student Directions for Permeability Field Test: Page 4 Extensions for math, soil exploration, stormwater solution preplanning: page 5-6 Student Observation Sheet: Page A Sample Group Table: Pages B & C
Transcript of Permeability Field Investigation - Potomac River

11/17/2015 Permeability Field Investigation
Interstate Commission on the Potomac River Basin 1
TEACHER INSTRUCTIONS
Use: This activity works well after the Watershed Connections presentation and watershed model activities or doing a
different lesson that provides the necessary background for a hypothesis and discussion.
Time: 60-90 minutes, depending on the number of sites tested and extensions. Students also can be involved in drawing
a campus map, which requires additional time.
Grades: Grades 5-10
Skills & Standards -- MD Environmental Literacy Standards 1A, 1B, and 5B; Core Curriculum grades 5 and 6 math:
Using the Scientific Method
Using results to make recommendations for campus Stormwater Sustainable Practices
Recording and organizing data using a map and tables
Making measurements, basic math and averaging (with extensions for volume and unit conversion)
Concepts Developed
Permeability, infiltration, and surface water runoff on different surfaces
The use of sustainable practices to reduce storm water runoff on the school grounds
Reliability in scientific research
Supplies for Each Team
6-inch PVC pipe 3-in diameter (can be cut with a hacksaw). Draw a line .25 inches (.6 cm) from the bottom
on this cylinder with a Sharpie. Option: coffee cans with both ends removed. Make sure the cans are the
same size and that sharp ends are covered with duct tape.
1000 ml-measuring cup
Stop watch
Small map of school grounds
Clear ruler with metric marks
Red, green, and yellow markers and pencil
Directions for Permeability Field Test
Field Observation Sheet
Container of water for multiple sites (could be 2-liter soda bottle)
Supplies For Whole Class
Large map of school yard on large paper
Large pad of paper, easel, markers, pencil for class data table
Extra water
Permeability Field Investigation Using the scientific method to guide this outdoor investigation, students test the permeability of different school-ground
areas, record and organize the results with maps and tables, and make recommendations for sustainable stormwater
practices. The following are included:
Teachers Instructions: Pages 1-3
Student Directions for Permeability Field Test: Page 4
Extensions for math, soil exploration, stormwater solution preplanning: page 5-6
Student Observation Sheet: Page A
Sample Group Table: Pages B & C
11/17/2015 Permeability Field Investigation
Interstate Commission on the Potomac River Basin 2
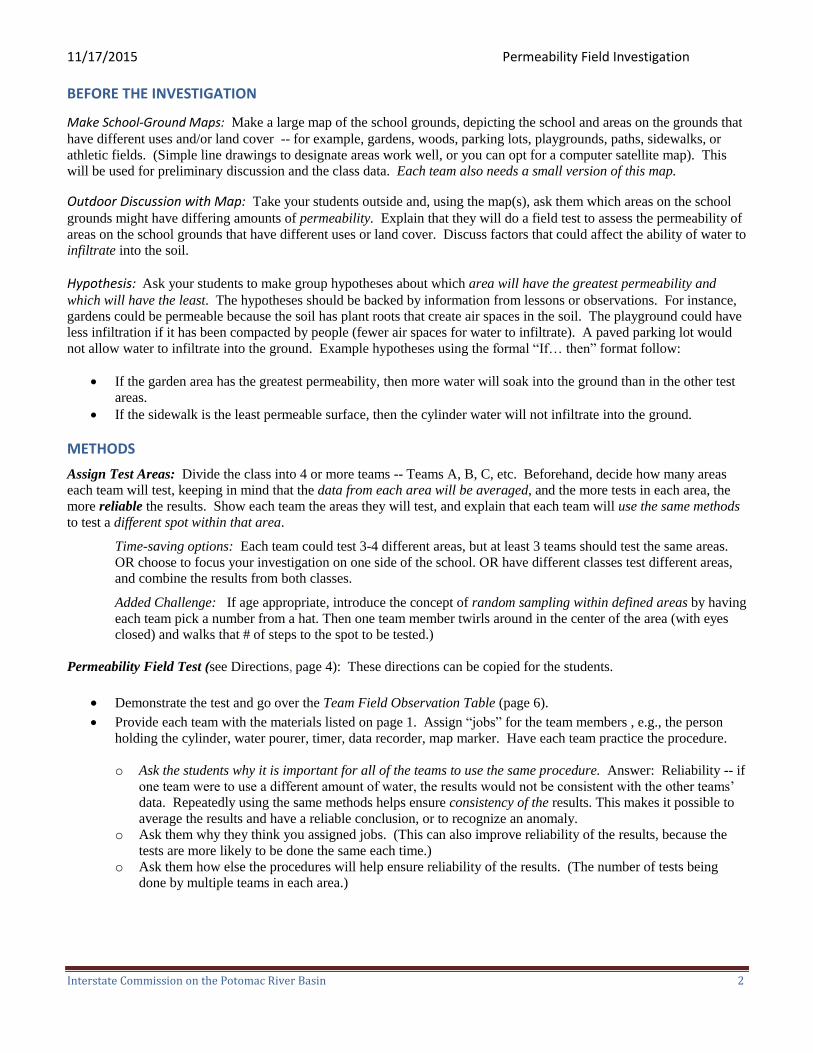
BEFORE THE INVESTIGATION
Make School-Ground Maps: Make a large map of the school grounds, depicting the school and areas on the grounds that
have different uses and/or land cover -- for example, gardens, woods, parking lots, playgrounds, paths, sidewalks, or
athletic fields. (Simple line drawings to designate areas work well, or you can opt for a computer satellite map). This
will be used for preliminary discussion and the class data. Each team also needs a small version of this map.
Outdoor Discussion with Map: Take your students outside and, using the map(s), ask them which areas on the school
grounds might have differing amounts of permeability. Explain that they will do a field test to assess the permeability of
areas on the school grounds that have different uses or land cover. Discuss factors that could affect the ability of water to
infiltrate into the soil.
Hypothesis: Ask your students to make group hypotheses about which area will have the greatest permeability and
which will have the least. The hypotheses should be backed by information from lessons or observations. For instance,
gardens could be permeable because the soil has plant roots that create air spaces in the soil. The playground could have
less infiltration if it has been compacted by people (fewer air spaces for water to infiltrate). A paved parking lot would
not allow water to infiltrate into the ground. Example hypotheses using the formal “If… then” format follow:
If the garden area has the greatest permeability, then more water will soak into the ground than in the other test
areas.
If the sidewalk is the least permeable surface, then the cylinder water will not infiltrate into the ground.
METHODS
Assign Test Areas: Divide the class into 4 or more teams -- Teams A, B, C, etc. Beforehand, decide how many areas
each team will test, keeping in mind that the data from each area will be averaged, and the more tests in each area, the
more reliable the results. Show each team the areas they will test, and explain that each team will use the same methods
to test a different spot within that area.
Time-saving options: Each team could test 3-4 different areas, but at least 3 teams should test the same areas.
OR choose to focus your investigation on one side of the school. OR have different classes test different areas,
and combine the results from both classes.
Added Challenge: If age appropriate, introduce the concept of random sampling within defined areas by having
each team pick a number from a hat. Then one team member twirls around in the center of the area (with eyes
closed) and walks that # of steps to the spot to be tested.)
Permeability Field Test (see Directions, page 4): These directions can be copied for the students.
Demonstrate the test and go over the Team Field Observation Table (page 6).
Provide each team with the materials listed on page 1. Assign “jobs” for the team members , e.g., the person
holding the cylinder, water pourer, timer, data recorder, map marker. Have each team practice the procedure.
o Ask the students why it is important for all of the teams to use the same procedure. Answer: Reliability -- if
one team were to use a different amount of water, the results would not be consistent with the other teams’
data. Repeatedly using the same methods helps ensure consistency of the results. This makes it possible to
average the results and have a reliable conclusion, or to recognize an anomaly.
o Ask them why they think you assigned jobs. (This can also improve reliability of the results, because the
tests are more likely to be done the same each time.)
o Ask them how else the procedures will help ensure reliability of the results. (The number of tests being
done by multiple teams in each area.)

11/17/2015 Permeability Field Investigation
Interstate Commission on the Potomac River Basin 3
Recording the Results
Each team records their data and observations on the Team Map and Team Field Observation Table. When the field tests
are done, the class gathers to record the results on the group map and a group table.
Group Map: Each team marks their sites on the large map according to the following:
If all the water seeped into the ground within 3 minutes, put a GREEN dot on the test site. Draw an arrow
showing the direction of flow.
If less than 2 cm infiltrated into the ground, mark the test site with a RED arrow, showing the direction of
water flow.
If some water remained in the cylinder, but greater than 2 cm infiltrated into the ground, put a YELLOW
dot on the test site. Draw an arrow showing the direction of flow.
Extrapolate the results: If all the test sites in a designated area have the same color of dots, mark the entire area
with that color (or stripes of that color).
Make a map key. Have the students define what the colors and symbols represent – permeable, semi-permeable,
or impermeable.
Group Table: Have the group make a table to record their results, or use the one provided on page A. The students
will average their results.
Conclusions and Recommendations
Sample class discussion questions
Which areas are the most permeable and impermeable? Was the group hypothesis correct? Why or why not?
What direction would runoff flow in different areas of the school yard?
Which areas would have the most stormwater runoff? (What other information might be needed to quantify this
question? Answer: size of the area or the roof; slope.)
Which areas might have puddles?
Why does the water infiltrate at different speeds in different areas? Possible answers:
o The area is compacted by people walking or playing on it.
o Heavy lawn mowers frequently run over it.
o There is clay underneath the top soil or near the surface.
o There is mulch and dried leaves on top of the ground.
o There are plants with roots in the soil.
o There is more sand or loam or organic material in the soil.
How does these findings relate to stream water quality in their watershed?
PRACTICAL APPLICATION: Where could sustainable stormwater practices, such as gardens or rain barrels,
be installed to reduce stormwater runoff? (See the rain garden resource booklets on your CD for more
information on this.)
o Have students suggest best management practice and discuss the pros and cons of each type.
o Students can discuss what else they would need to know before deciding what practices would be most
effective.

11/17/2015 Permeability Field Investigation
Interstate Commission on the Potomac River Basin 4
Student Directions for the Permeability Field Test
As you complete each test, mark the site on your map, and record your observations on the Team Field Observation Sheet. Label the sites according to your team’s letter and the number of the test. (If you are team A, your first site will be labeled A1, your second site, A2, and so on.)
Each team member should do his or her assigned task throughout the investigation (Reader, Recorder(s), Holder, Timer, Pourer). Read and practice these instructions before you start.
PROCEDURE
1. Fill your cup or bottle with 650 ml of water.
2. Push the cylinder into the ground to the black line on the cylinder. (For areas where the pipe cannot be
put in the ground, go to Step 3.) Do the following steps:
o One person applies constant pressure to the top of the container to prevent water from leaking out
around the bottom.
o The Timer starts the stopwatch at the same time the Pourer begins to pour water into the cylinder.
o If the water infiltrates before 3 minutes, the Timer stops the watch at that point. The Data
Recorder writes the length of time on the Team Field Observation Sheet.
o Stop the watch at 3 minutes. If water remains in the cylinder, measure from the cylinder rim to the
water level (in centimeters). Record on the Observation Sheet.
o Lastly, pour 1 liter of water on the ground near your test site and observe whether it flows in one
direction or pools. If it flows in one direction, draw an arrow on your map, indicating the
direction of the flow. If it pools, write the word pooled on your map.
3. If the cylinder cannot be put into the ground, you will pour the water on the surface and record
answers to the following on your table and map.
Does it pool? Note this on the Observation Table and Map
Does it flow in a certain direction? Make a red arrow on your map that shows which direction
the water flows.

11/17/2015 Permeability Field Investigation
Interstate Commission on the Potomac River Basin 5
Extensions
Finding the volume of a cylinder:
The volume is found by multiplying the area of one end of the cylinder
(base) by its height.
Since the end (base) of a cylinder is a circle, the area of that circle is given
by the formula: area = π r2
Extension 1 Volume: What volume of water is needed to fill the cylinder?
Have the students use the metric system to measure the cylinder’s height (from the marked line) and diameter.
They will determine the radius by dividing the diameter in half.
Our cylinder: Diameter = 7.7 cm. Height = 14.6
= 3.14 x (7.7 cm ÷2)2 x 14.6 = 679.8 ml
Extension 2 Volume: Students can determine the volume of water that percolated, rather than centimeters of water that
percolated.
Extension 3 – Rate of Infiltration and Conversions: Although most sciences use the metric system, interestingly, the
science of hydrology often uses English units. The rate of infiltration is measured in either mm/hour or inches/hour.
Have them convert their measurements (cm/#minutes) to mm/hour or inches/hour. Naturally, if the test was done for 24
hours, as it is by soil conservation scientists, this rate could differ, another point of discussion about the accuracy of the
results.
Extension 4: Discussion of Precision and Reliability: It is likely the students might have slightly different
measurements, depending on the preciseness of the cylinder and bottle lines and their measurements. This can be
discussed. This is fine for this field test, which does not require fine precision; rather, it requires reliable results –
several tests done on the same surface by different teams following the same methods as carefully as possible.
Discussion question: What types of research could precise measurements make a huge difference?
where:
π is Pi, approximately 3.142
r is the radius of the circular end of the cylinder
h height of the cylinder

11/17/2015 Permeability Field Investigation
Interstate Commission on the Potomac River Basin 6
Other Extensions
Have students hypothesize what variable might be included in a roof runoff formula and then research the
formula on the internet. The students could then calculate how much runoff would be expected on the school
grounds from the school roof. (Many reliable internet sites on rain barrels and rain gardens include formulas.
Good sources include county environmental departments. Also see the rain garden booklets provided on the
Google drive.)
o Follow-up to this. Students can determine how large a rain garden would need to be to accommodate the
runoff, or how many rain barrels.
Discuss in detail variables that would affect the rate of infiltration (e.g., types of vegetation, recent rain activity,
soil types.) The National Soil Conservation Service website provides lessons and videos.

Inte
rsta
te C
om
mis
sio
n o
n t
he
Po
tom
ac R
iver
Bas
in
TEA
M F
IELD
OB
SER
VA
TIO
N S
HEE
T
Wea
ther
: D
id it
rai
n y
este
rday
? _
___
___
___
___
TEST
SIT
E N
UM
BER
(F
or
exam
ple
, A1
, A
2, A
3…
TEST
SIT
E D
ESC
RIP
TIO
N
(Exa
mp
les:
gar
den
, fo
ot
pat
h, p
layg
rou
nd
, par
kin
g lo
t)
TIM
E FO
R W
AT
ER T
O
INFI
LTR
ATE
(se
c.)
(If
the
wat
er w
ou
ld
no
t in
filt
rate
, wri
te
imp
erm
eab
le.)
Dis
tan
ce f
rom
ri
m t
o t
he
w
ate
r le
vel (
cm)
(Th
e am
ou
nt
that
infi
ltra
ted
.)
OB
SER
VA
TIO
NS
No
te t
hin
gs t
hat
co
uld
hav
e in
flu
ence
d y
ou
r re
sult
s, f
or
inst
ance
: W
as t
he
gro
un
d w
et?
Did
wat
er s
eep
ou
t yo
ur
cylin
der
?
A.

Inte
rsta
te C
om
mis
sio
n o
n t
he
Po
tom
ac R
iver
Bas
in
EXA
MP
LE C
LASS
TA
BLE
Dir
ecti
on
s:
Tim
e to
infi
ltra
te:
Wri
te t
he
tim
e in
sec
on
ds.
If
the
wat
er
did
no
t in
filt
rate
wit
hin
18
0 s
eco
nd
s, w
rite
>1
80
sec
. If
it d
id n
ot
infi
ltra
te a
t al
l, w
rite
Imp
erm
eab
le.
NO
TE:
Wh
en t
he
wat
er d
oes
no
t in
filt
rate
wit
hin
18
0 s
eco
nd
s, it
will
tak
e c
reat
ive
thin
kin
g to
“av
erag
e” t
he
Tim
e-t
o-I
nfi
ltra
te r
esu
lts.
Yo
ur
clas
s ca
n
dec
ide
the
app
rop
riat
e va
lue
to u
se, o
r w
het
her
to
just
to
co
nsi
der
th
e av
erag
e am
ou
nt
of
wat
er
that
infi
ltra
ted
fo
r th
at s
ite
.
Dis
tan
ce f
rom
rim
: If
th
e w
ater
did
no
t in
filt
rate
into
th
e gr
ou
nd
at
all,
wri
te z
ero
.
Te
st S
ite
1
Test
Sit
e 2
Te
st S
ite
3
Test
Sit
e 4
Ti
me
to
Infi
ltra
te
(se
c.)
Dis
tan
ce f
rom
R
im t
o W
ater
Le
vel (
cm)
Tim
e to
In
filt
rate
(se
c.)
Dis
tan
ce f
rom
Rim
to
Wat
er L
evel
(c
m)
Tim
e to
In
filt
rate
(se
c.)
Dis
tan
ce f
rom
Rim
to
Wat
er L
evel
(c
m)
Tim
e to
In
filt
rate
(se
c.)
Dis
tan
ce f
rom
R
im t
o W
ater
Le
vel (
cm)
Team
A
Team
B
Team
C
Team
D
Team
E
Ave
rage
Is it
Per
me
able
o
r
Sem
i-p
erm
eab
le
or
Imp
erm
eab
le?
B.

Inte
rsta
te C
om
mis
sio
n o
n t
he
Po
tom
ac R
iver
Bas
in
Te
st S
ite
5
Test
Sit
e 6
Te
st S
ite
7
Test
Sit
e 7
Ti
me
to
Infi
ltra
te
(se
c.)
Dis
tan
ce f
rom
Rim
to
Wat
er L
evel
(c
m)*
Tim
e to
In
filt
rate
(se
c.)
Dis
tan
ce f
rom
Rim
to
Wat
er L
evel
(c
m)
Tim
e to
In
filt
rate
(se
c.)
Dis
tan
ce f
rom
Rim
to
Wat
er L
evel
(c
m)
Tim
e to
In
filt
rate
(se
c.)
Dis
tan
ce f
rom
R
im t
o W
ater
Le
vel (
cm)
Team
A
Team
B
Team
C
Team
D
Team
E
Ave
rage
Tim
e
to In
filt
rate
Is it
Per
me
able
o
r
Sem
i-p
erm
eab
le
or
Imp
erm
eab
le?
C.