Peripheral Dual-Energy X-ray Absorptiometry in the ... · PositionStatement Peripheral Dual-Energy...
19
Position Statement Peripheral Dual-Energy X-ray Absorptiometry in the Management of Osteoporosis: The 2007 ISCD Official Positions Didier B. Hans, * ,1,c John A. Shepherd, 2,b Elliott N. Schwartz, 3,a David M. Reid, 4,a Glen M. Blake, 5,b John N. Fordham, 6,b Thomas Fuerst, 7,b Peyman Hadji, 8,b Akira Itabashi, 9,b Marc-Antoine Krieg, 10,b and E. Michael Lewiecki 11,c 1 Geneva University Hospital, Geneva, Switzerland; 2 University of California at San Francisco, San Francisco, CA, USA; 3 Northern California Institute for Bone Health, Oakland, CA, USA; 4 University of Aberdeen, Aberdeen, UK; 5 Guy’s Hospital, London, UK; 6 The James Cook University Hospital, Middleborough, UK; 7 Synarc, Inc., San Francisco, CA, USA; 8 Phillipps-Universitat Marburg, Marburg, Germany; 9 Saitama Medical School, Moroyama, Saitama, Japan; 10 University Hospital, Lausanne, Switzerland; and 11 New Mexico Clinical Research & Osteoporosis Center, Albuquerque, NM, USA Abstract Peripheral assessment of bone density using photon absorptiometry techniques has been available for over 40 yr. The initial use of radio-isotopes as the photon source has been replaced by the use of X-ray technology. A wide variety of models of single- or dual-energy X-ray measurement tools have been made available for purchase, al- though not all are still commercially available. The Official Positions of the International Society for Clinical Den- sitometry (ISCD) have been developed following a systematic review of the literature by an ISCD task force and a subsequent Position Development Conference. These cover the technological diversity among peripheral dual- energy X-ray absorptiometry (pDXA) devices; define whether pDXA can be used for fracture risk assessment and/or to diagnose osteoporosis; examine whether pDXA can be used to initiate treatment and/or monitor treatment; provide recommendations for pDXA reporting; and review quality assurance and quality control necessary for effective use of pDXA. Key Words: Diagnosis; finger BMD; forearm BMD; fractures; heel BMD; osteoporosis; pDXA. Introduction In 1963, Cameron and Sorensen developed a new method for testing bone density in vivo by passing a monochromatic one single energy phantom beam through bone and soft tissue (1) at a peripheral skeletal site. Since that time, approximately 20,000 central and 15,000 peripheral densitometers have been sold (K. Faulkner, personal communication) and utilized to measure human bone density both clinically and in research studies. Since 2001, the International Society for Clinical Densitometry (ISCD) has reviewed various aspects of peripheral densitometry (2,3) including the use of forearm dual-energy X-ray absorptiometry (DXA) for diagnosis of osteoporosis and for serial monitoring (4). The proliferation of bone densitometers using different tech- nologies for measuring BMD at different skeletal sites, along with the absence of technology-specific guidelines, has created great uncertainty in applying the results to the management of patients in clinical practice. The acronym pDXA (peripheral dual-energy X-ray absorptiometry) is used to describe dedi- cated devices that are specifically designed to measure the BMD of peripheral skeletal sites using DXA. There is no fun- damental difference in technology between peripheral and Received 12/05/07; Accepted 12/05/07. *Address correspondence to: Didier B. Hans, Lausanne University Hospital, Center for Bone Diseases e DAL 1011 Lausanne, Switzer- land. E-mail: [email protected] a Task Force Chair. b Task Force Member. c Task Force Liaison. 188 Journal of Clinical Densitometry: Assessment of Skeletal Health, vol. 11, no. 1, 188e206, 2008 Ó Copyright 2008 by The International Society for Clinical Densitometry 1094-6950/08/11:188e206/$34.00 DOI: 10.1016/j.jocd.2007.12.012
Transcript of Peripheral Dual-Energy X-ray Absorptiometry in the ... · PositionStatement Peripheral Dual-Energy...
Journal of Clinical Densitometry: Assessment of Skeletal Health, vol. 11, no. 1, 188e206, 2008� Copyright 2008 by The International Society for Clinical Densitometry1094-6950/08/11:188e206/$34.00DOI: 10.1016/j.jocd.2007.12.012
Position Statement
Peripheral Dual-Energy X-ray Absorptiometry in the Managementof Osteoporosis: The 2007 ISCD Official Positions
Didier B. Hans,*,1,c John A. Shepherd,2,b Elliott N. Schwartz,3,a David M. Reid,4,a
Glen M. Blake,5,b John N. Fordham,6,b Thomas Fuerst,7,b Peyman Hadji,8,b
Akira Itabashi,9,b Marc-Antoine Krieg,10,b and E. Michael Lewiecki11,c
1Geneva University Hospital, Geneva, Switzerland; 2University of California at San Francisco, San Francisco, CA, USA;3Northern California Institute for Bone Health, Oakland, CA, USA; 4University of Aberdeen, Aberdeen, UK; 5Guy’s
Hospital, London, UK; 6The James Cook University Hospital, Middleborough, UK; 7Synarc, Inc., San Francisco,CA, USA; 8Phillipps-Universitat Marburg, Marburg, Germany; 9Saitama Medical School, Moroyama, Saitama,
Japan; 10University Hospital, Lausanne, Switzerland; and 11New Mexico ClinicalResearch & Osteoporosis Center, Albuquerque, NM, USA
Abstract
Peripheral assessment of bone density using photon absorptiometry techniques has been available for over 40 yr.The initial use of radio-isotopes as the photon source has been replaced by the use of X-ray technology. A widevariety of models of single- or dual-energy X-ray measurement tools have been made available for purchase, al-though not all are still commercially available. The Official Positions of the International Society for Clinical Den-sitometry (ISCD) have been developed following a systematic review of the literature by an ISCD task force anda subsequent Position Development Conference. These cover the technological diversity among peripheral dual-energy X-ray absorptiometry (pDXA) devices; define whether pDXA can be used for fracture risk assessmentand/or to diagnose osteoporosis; examine whether pDXA can be used to initiate treatment and/or monitor treatment;provide recommendations for pDXA reporting; and review quality assurance and quality control necessary foreffective use of pDXA.
Key Words: Diagnosis; finger BMD; forearm BMD; fractures; heel BMD; osteoporosis; pDXA.
Introduction
In 1963, Cameron and Sorensen developed a new methodfor testing bone density in vivo by passing a monochromaticone single energy phantom beam through bone and soft tissue(1) at a peripheral skeletal site. Since that time, approximately20,000 central and 15,000 peripheral densitometers have beensold (K. Faulkner, personal communication) and utilized to
Received 12/05/07; Accepted 12/05/07.*Address correspondence to: Didier B. Hans, Lausanne University
Hospital, Center for Bone Diseases e DAL 1011 Lausanne, Switzer-land. E-mail: [email protected]
aTask Force Chair.bTask Force Member.cTask Force Liaison.
18
measure human bone density both clinically and in researchstudies. Since 2001, the International Society for ClinicalDensitometry (ISCD) has reviewed various aspects ofperipheral densitometry (2,3) including the use of forearmdual-energy X-ray absorptiometry (DXA) for diagnosis ofosteoporosis and for serial monitoring (4).
The proliferation of bone densitometers using different tech-nologies for measuring BMD at different skeletal sites, alongwith the absence of technology-specific guidelines, has createdgreat uncertainty in applying the results to the management ofpatients in clinical practice. The acronym pDXA (peripheraldual-energy X-ray absorptiometry) is used to describe dedi-cated devices that are specifically designed to measure theBMD of peripheral skeletal sites using DXA. There is no fun-damental difference in technology between peripheral and
8

2007 ISCD Official Positions 189
central DXA. pDXA is used to measure bone mineral density(BMD) at the forearm, finger phalanges and calcaneus. Radio-graphic absorptiometry (RA) and quantitative ultrasound(QUS) are other technologies for assessing skeletal health atperipheral skeletal sites. Radiographic absorptiometry andQUS will not be considered in this document.
Some advantages of pDXA compared to central DXA arethat the instruments are smaller and more portable, requiringminimal space to operate, and they are less expensive. Also,since the measurement sites are a significant distance from ra-diation-sensitive organs, radiation doses are extremely smalland even lower than the doses associated with central DXAof the hip and spine. Nevertheless, pDXA may be subject toradiation protection regulation in many countries.
Various pDXA devices have been shown to predict fore-arm, spine, hip and any osteoporotic fractures in elderlywomen. However, the body of evidence evaluating the abilityof pDXA (or its precursors single-energy photon absorptiom-etry [SPA] in 1963, single-energy X-ray absorptiometry[SXA], and peripheral dual-energy photon absorptiometry[pDPA]) to predict fracture risk is not as substantial as mightbe expected for a methodology older than central DXA. Theuse of pDXA in clinical practice continues to be poorly de-fined. Peripheral BMD measurement technologies were ex-tensively studied at the beginning of the era of quantitativeevaluation of BMD, but their evaluation has diminished overthe last 20 yr with the rise of central DXA measurements.Furthermore, many devices that were used in the past areno longer commercially available and those that remain havenot been evaluated by well standardized methods (e.g., popu-lation based, cross-sectional studies, prospective studies).
The role of peripheral densitometry in clinical practice re-mains poorly defined. The ISCD pDXA Task Force reviewedthe medical literature and proposed a set of operational rec-ommendations for the clinical use of pDXA for the followingfive major topics:
1 pDXA and fracture risk assessment2 pDXA and diagnosis of osteoporosis3 pDXA and treatment initiation4 pDXA and treatment monitoring5 pDXA and quality assurance/quality control (QA/QC)
The task force did not consider other peripheral X-raytechnologies such as RA and radiogrammetry to avoid anyconfusion with forearm, heel, or finger measurementsassessed by pDXA.
Methodology
The ISCD pDXA Task Force reviewed the peer-reviewedmedical literature using Medline and PubMed from 1960 todate. A bibliography of 174 papers was initially preparedby the pDXA Task Force and papers were added as requiredto enable review of specific topics. Only bibliographies inEnglish language were considered.
The methods used to develop, and grading system appliedto the ISCD Official Positions, are presented in the Executive
Journal of Clinical Densitometry: Assessment of Skeletal Health
Summary that accompanies this paper. In brief, all OfficialPositions were rated by the Expert Panel in four categories:
Quality of evidence (Good, Fair, Poor), where Good is evi-dence that includes results from well-designed, well-conductedstudies in representative populations; Fair is evidence sufficientto determine effects on outcomes, but the strength of theevidence is limited by the number, quality, or consistency ofthe individual studies; and Poor is evidence that is insufficientto assess the effects on outcomes because of limited numberor power of studies, important flaws in their design or conduct,gaps in the chain of evidence, or information.
Strength of the recommendation (A, B, or C), where A isa strong recommendation supported by the evidence; B isa recommendation supported by the evidence; and C is arecommendation supported primarily by expert opinion).
Applicability (worldwide 5 W or variable, according tolocal requirements 5 L); and Necessity, where ‘‘was Neces-sary’’ indicates that the indication or procedure is necessarybecause the health benefits of using the technique outweighthe risks to such an extent that it can be offered to all appro-priate patients and the magnitude of the expected benefit isnot small.
Technological Diversity Among pDXA Devices
ISCD Official Position
� For pDXA, bone density measurements from differentdevices cannot be directly compared.
Grade: Good-A-W-Necessary
RationaleThere are multiple manufacturers that currently make
pDXA systems, including Cooper Surgical, Osteometer Med-itech, Schick Technologies, GE Medical Systems, Demetech,Osteosys, and Aloka. Table 1 lists the manufacturers andmodels of the devices that were evaluated by virtue of beingavailable for purchase, or being in widespread use. Peripheraldual-energy X-ray absorptiometry instruments from differentmanufacturers have significant differences, particularly intheir calibration methods, skeletal sites of measurement andanalysis, acquisition technique, analysis software and scannerdesigns (5), and therefore do not currently lend themselves tosimple categorization. The X-ray geometry ranges from pen-cil beam (Cooper Surgical Company) and fan beam (Osteom-eter MediTech), to cone beam (Schick Technologiers and GEMedical). The measured skeletal sites and region of interest(ROI) vary dramatically sometimes, from heel to forearm tofingers (Table 1). Therefore, direct comparison of the pDXAdevices cannot be performed without significant bias, i.e.,results from one pDXA device cannot be extrapolated to an-other one that is technologically different or that has differentROI (5). Subsequently, clinical recommendations for pDXAsystems must be device- and ROI-specific until further stan-dardization occurs. Subsequently, for clarification purposes,in these Official Positions the Expert Panel defined two skel-etal sites of the forearm. The proximal forearm (radius and
Volume 11, 2008

190 Hans et al.
Table 1Current pDXA Systems
Manufacturer ModelSkeletal
site ROIClaimed
precision (%) Comments
Aloka DCS-600EX III Forearm RadiusþUlna distal(1/10), mid region (1/6)and proximal radius
!1.0
CooperSurgical(Norland)
ApollopDEXA
Heel Posterior calcaneusDistal & proximal radius
!1.8Forearm !2.0
GE MedicalSystems (Lunar)
Pixi* Heel Posterior calcaneusRadiusþ ulna distal
!1.5 *Currently out of productionbut in wide clinical useForearm !1.5
Scanflex Int. AB(Demetch AB)
DXL Calscan Heel Mid posterior calcaneus !1.2 Tissue and fatty tissue areexcluded from the bonemineralization
Schick Technologies AccuDEXA Finger Long finger middle phalanx !1.0
OsteometerMediTech
DTX 200Dexacare G4
Forearm Radiusþ ulna mid regionRadiusþ ulna mid region
!1.0Forearm !1.0
Osteosys EXA-3000 Heel Posterior calcaneusRadiusþ ulna Distal
!1.0 Very much like the Pixidevice from GE MedicalSystems
Forearm !1.0
ulna) is primarily cortical bone whereas the distal forearm (ra-dius and ulna) is primarily trabecular bone. The proximalforearm, for example, will include the one-third (33%) radiuspDEXA Norland (Cooper Surgical), one-third (33%) radiusand ulna DCS-600EX Aloka. The distal forearm will include,for example, the ultradistal PIXI GE Lunar, 1/10th distal ra-dius and ulna DCS-600EX Aloka, and the distal pDEXA Nor-land. Furthermore, the proximal radius and distal radius ROImust be considered independently, since they give differentinformation on fracture risk status.
Discussion
Grigorian et al reviewed the agreement of heel pDXA sys-tems (6). It is generally accepted that different peripheral den-sitometers for a given skeletal site from a single manufacturertend to agree well by design, with a unity regression slope, non-significant mean value offsets, and a small amount of scatteraround the fit line (7,8). However when different manufacturersare compared for the same skeletal site, although a high corre-lation can be observed, a significant offset is usually reported(5,9). Moreover, even for a given skeletal site, since no stan-dardization exists among manufacturers, the ROI may varyquite significantly even when the name of the ROI is thesame. Such difference is not only related to bone-soft tissuealgorithm and other technological differences but also becauseof heterogeneity of the considered bone (10). Shepherd et al re-viewed the agreement of six forearm systems and derived uni-versal standardized BMD values even though there were nocommon ROI (See Fig. 1) (5). He found that there was poor cor-relation and calibration between forearm devices due primarily
Journal of Clinical Densitometry: Assessment of Skeletal Health
to the lack of standardization in the ROI placements. Prevrhalet al showed, using the same scan dataset, that substantial im-provements can be made in correlation between these devices ifa common ROI is defined (11). In addition, there may be geo-graphical differences, as well as differences in prevalence oflow BMD, which are dependent on the reference range usedto calculate T-scores at the forearm, i.e. whether locally derivedor manufacturer provided (12) (Fig. 1).
Additional Questions for Future Research
� For a given skeletal site, would it be of added value tostandardize the ROI?� Should ROI be different in men and non-Caucasian
women, compared to those used in postmenopausal Cau-casian women?
Can pDXA be Used for Fracture FiskAssessment?
ISCD Official Positions
� Measurement by validated pDXA devices can be used toassess vertebral and global fragility fracture risk in post-menopausal women, however its vertebral fracture pre-dictive ability is weaker than central DXA and heelQUS. There is a lack of sufficient evidence to supportthis position for men.
Grade: Fair-B-W-Necessary� For pDXA, different devices should be independently vali-
dated for fracture risk prediction by prospective trials or by
Volume 11, 2008

2007 ISCD Official Positions 191
demonstration of equivalence to a clinically validated device.Grade: Good-B-W-Necessary
RationalePeripheral skeletal sites were the first to be evaluated when
absorptiometry techniques were introduced in the 1960s. Assuch, there is a long history of prospective as well as cross-sectional clinical studies that have looked at the relationshipbetween peripheral BMD and fracture risk.. This advantageis tempered by the heterogeneity of study designs, the focuson Caucasian women as the primary population of interest,the diversity of pDXA devices, and the fact that many ofthe devices with strong evidence for predicting fracture riskare no longer manufactured.
The current body of literature suggests that there is a strongcorrelation between measurements of BMD by pDXA and therisk of future fragility fractures of any location including hip,vertebrae, and wrist in elderly Caucasian women (13). Thepredictive value of forearm BMD was reported from theStudy of Osteoporotic Fractures (SOF). Both distal and prox-imal radial BMD measured by SPA predicted future fractureat each of the major fracture sites (hip, spine, and wrist) aswell as other bones, with the distal measurement performingslightly more strongly than the proximal measurement.Through continuing follow-up of the SOF cohort, researchers
Distal
UD
MID
1/3
QDR-4500A
pDEXA
1/3
1/6
1/10
DCS-600EX
Proximal
PIXI
Fig. 1. Graphical representation of the ROI for devices inShepherd et al (5). Only the Aloka DCS-600EX, GE LunarPIXI, the Norland pDEXA, and the Osteometer DTX- 200are dedicated pDXA systems. Note that all use differentplacement criteria for all ROI.
Journal of Clinical Densitometry: Assessment of Skeletal Health
have shown that forearm BMD predicts incident fracture inthe short term (2.2 yr) (14) as well as long term (10.4 yr)(15). Nevertheless, the magnitude of the relative risk per stan-dard deviation decrease for forearm BMD for all the major frac-ture sites (RR: 1.3e2.0) is small in comparison to the riskassociation of total hip or femoral neck BMD for hip fracture(RR: 2.2e2.4). The vast majority of fracture studies were re-stricted to women over age 65 yr (16), but there is evidence ofthe fracture risk prediction of the distal and proximal radiuspDXA measurements in younger women (50 yr and older) aswell (17e19). Thus, BMD of the distal and proximal radius pro-vide useful information for assessing fracture risk in Caucasianwomen over the age of 50 yr. The value of distal and proximalradius BMD for long-term fracture risk assessment has beendemonstrated by a small number of studies, with longitudinalfracture data of 10e15 yr post BMD measurements (17,20e22).
A similar, but slightly less comprehensive body of literature,exists for the ability to assess fracture risk using BMD of thecalcaneus. Results from SOF suggest that heel BMD predictship, wrist and vertebral fracture as well as other fractures(site specific fracture risk), and the comprehensive collectionof ‘any’ osteoporotic fracture (global fracture risk). HeelBMD predicts incident fracture in the short-term (14) as wellas long-term (15). The Hawaii Osteoporosis Study showedthat heel BMD predicted vertebral fracture risk (23,24). Barret al studied heel BMD measurement with the GE Lunar PIXIdevice and showed that it could measure global fracture riskin a community-based sample (25). Similar results for all oste-oporotic fractures as well as hip fractures alone were reportedfrom the National Osteoporosis Risk Assessment (NORA)study using the Norland Apollo heel scanner (18).
In the NORA study, finger BMD measured by DXA withthe AccuDEXA device (Schick Technologies) was found tobe associated with an increased risk for any osteoporotic frac-ture and wrist fractures, but not hip or spine fractures. Womenwith ‘‘osteopenia’’ and ‘‘osteoporosis’’ had risk ratios thatwere significantly increased compared with women with nor-mal BMD for any fracture, by 1.8 and 2.2 respectively, and2.1 and 2.7 for fractures of the wrist (18,19).
Since the level of evidence varies according to the manu-facturer and the model of pDXA device, results cannot beextrapolated from one device to another that is technologi-cally different. Ideally, the best way to verify the ability ofa technique to predict osteoporotic fracture would be to con-duct prospective studies. However, the cost and logistics ofsuch studies has been, and most likely will be, prohibitivefor pDXA manufacturers. Therefore, it is proposed to usea method called ‘‘equivalence studies’’ to evaluate new densi-tometers (26). According to this concept, if a prospectivestudy is not available for a given device, then an acceptablealternative with a compromised level of confidence will bea population-based cross-sectional study with the followingthree performance characteristics:
� High level of correlation (coefficient of correlation morethan 0.8) with a well-established and prospectively vali-dated device.
Volume 11, 2008

192 Hans et al.
� Good standardized precision (standardized coefficient ofvariation [SCV] within the 95% confidence interval (CI)of the well established device).� At least two independent cross-sectional studies per type
of fracture (hip, vertebral and all fractures) showing sig-nificant discrimination between fractured and not frac-tured age matched controls.B N should be at least 70 per group.B Claims are fracture dependent.B One of the already established devices should be
included in such studies for comparison.B No significant difference should be found when comparing
the area under the receiver operating characteristics curve(AUROC) of the new device to the established device.
As mentioned, our recommendations are device-and ROIspecific and the level of evidence from one device to another,in terms of fracture prediction, will vary quite significantly asshown in Table 2 below.
Discussion
The most frequent reason for performing a BMD examina-tion is to establish the patient’s risk of suffering a low traumafracture (27). The relative ability of different types of BMD
Journal of Clinical Densitometry: Assessment of Skeletal Health
measuring devices to discriminate between individuals athigh or low risk of suffering a future fracture is, therefore,a key factor in comparing the clinical utility of different tech-niques (28). Techniques with better fracture discriminationlead to better targeting of patients for fracture preventiontreatment, and improved cost effectiveness of osteoporosistherapies. The most reliable way of verifying and comparingfracture discrimination is through prospective observationalstudies of incident fractures.
Very little data exist for the prediction of fracture risk innon-Caucasian females or in males utilizing pDXA. Twostudies using SPA technology to measure forearm BMDfound conflicting results. Gardsell et al showed utility of fore-arm BMD in men for assessment of risk of all osteoporoticfractures in a group of 654 men followed for 11 yr (29). Incontrast, a more recent publication (30) showed that SPA ofthe forearm was not associated with vertebral fracture al-though this cross-sectional study was complicated by thefact that the BMD was measured nearly 4 yr prior to the col-lection of spine radiographs for prevalent vertebral fractureevaluation. Data on fracture risk assessment in non-Caucasianwomen were reported in the NORA study (31). The authorsshowed that the rate of all incident osteoporotic fractures in-creased with decreasing BMD, in a similar manner for all
Table 2pDXA and Fracture Prediction, by Devices and by Types of Fractures Based on Available English Literature
Manufacturer Model Skeletal site
Risk assessment: level of evidence
Female Male
Caucasian Asian Caucasian Asian
H/V/ALL H/V/ALL H/V/ALL H/V/ALL
Aloka DCS-600EX III Forearm (proximal radius) ukn/ukn/ukn ukn/ukn/ukn ukn/ukn/ukn ukn/ukn/ukn-/-/- -/-/- -/-/- -/-/-
CooperSurgical(Norland)
Apollo pDEXA Heel yes/ukn/yes yes/ukn/yes ukn/ukn/ukn ukn/ukn/uknForearm (proximal radius A/-/A A/-/A -/-/- -/-/-
GE Medical Systems(Lunar)
Pixi* Heel yes/yes/yes yes/ukn/yes ukn/ukn/ukn ukn/ukn/uknForearm (proximal radius) A/A/A A/-/A -/-/- -/-/-
Scanflex Int. AB(Demetch AB)
DXL Calscan Heel yes/ukn/yes ukn/ukn/ukn ukn/ukn/ukn ukn/ukn/uknC/-/C -/-/- -/-/- -/-/-
Schick Technologies AccuDEXA Finger no/ukn/yes no/ukn/yes ukn/ukn/ukn ukn/ukn/uknA/-/A A/-/A -/-/- -/-/-
Osteometer MediTech DTX 200Dexacare G4
Forearm (proximal radius) yes/yes/yes ukn/ukn/ukn ukn/ukn/ukn ukn/ukn/uknForearm (proximal radius) B/B/B -/-/- -/-/- -/-/-
Osteosys EXA-3000 Heel ukn/ukn/ukn ukn/ukn/ukn ukn/ukn/ukn ukn/ukn/uknForearm (proximal radius) -/-/- -/-/- -/-/- -/-/-
Abbr: H, Hip fractures; V, Vertebral fractures; ALL, Osteoporotic fractures/non vertebral fractures; Ukn, unknown statusdno availablestudy published in peer reviewed journal; Id, Insufficient data.
Level A: Prospective study; Level B: Population based Cross-sectional study; Level C: Expert opinion or non population based cross-sectional study.
Volume 11, 2008

2007 ISCD Official Positions 193
ethnic groups (Caucasian, African-American, Hispanic,Asian, and Native American). Unfortunately, a rigorous anal-ysis of these data have not yet been reported.
Several of the largest and longest follow up studies thathave estimated fracture risk with pDXA were conductedwith pDXA devices that are no longer available. The highdegree of technological diversity among pDXA deviceslimits our ability to compare the results from differentdevices and studies. Nevertheless, the body of publishedevidence indicates a consistent pattern which supports theuse of peripheral measurements for fracture risk assessment.A summary of most of these prospective studies can befound in Table 3.
Additional Questions for Future Research
� Can pDXA be used to assess future fracture risk inCaucasian and non-Caucasian men?� Can pDXA be used to assess fracture risk in non-Caucasian
women?
Can pDXA be Used to Diagnose Osteoporosis?
ISCD Official Position
� The WHO diagnostic classification can only be applied toDXA at the femur neck, total femur, lumbar spine, andthe one-third (33%) radius region of interest measured byDXA or pDXA devices utilizing a validated young-adultreference database.
Grade: Good-A-W-Necessary
RationaleThe conventional definition of osteoporosis used in bone
densitometry is from the report of the WHO study group(41), e.g., a postmenopausal woman with a lumbar spine,hip, or forearm T-score of �2.5 or less. The hip ROI site re-ferred to in the WHO report is the femoral neck, and the fore-arm ROI should be the proximal (one-third) radius (2,42)although this latter point has never been definitely confirmed.The difficulty in extending the WHO definition of osteoporo-sis to include other peripheral skeletal sites (e.g., pDXA mea-surements) or other measuring devices (e.g. QCT, pQCT,QUS) is due to the problem of T-score discordance. Thisproblem was first discussed by Faulkner et al (43), and itmay be explained as follows: when BMD reference data areplotted as graphs of mean T-score versus age, the curves fordifferent bone densitometry measurement sites decreasewith age at different rates (Fig. 2). As a result, they crossthe T 5�2.5 threshold (at which 50% of patients nominallyhave osteoporosis) at different ages varying from age 60 forspine QCT and lateral spine DXA to over 100 yr for sometypes of heel quantitative ultrasound (QUS) measurement.As a consequence of these different T-score versus agecurves, the percentage of postmenopausal women in the pop-ulation with apparent osteoporosis (e.g., a T-score of �2.5 orless) can vary from 3% to 60% ,depending on the type ofdevice used (44).
Journal of Clinical Densitometry: Assessment of Skeletal Health
The application of the WHO definition of osteoporosis toBMD measurements of the lumbar spine, hip, or one-third(33%) radius is appropriate because the T-score versus agecurves for these three sites all decrease in a similar way, cross-ing the T 5�2.5 threshold between age 75e87 yr (Fig. 2).
Discussion
It is not surprising that the WHO T-score definition of os-teoporosis cannot be applied to all types of measurement. Onereason is that bone loss with aging occurs at different rates atdifferent skeletal sites (e.g., the relatively rapid losses foundfor vertebral trabecular bone with QCT measurements). How-ever, it is also notable that even when T-score versus age plotsare compared for ostensibly similar measurement regions ofinterest (ROI) on different manufacturers’ pDXA devices,surprisingly large differences can be seen (26). This may bebecause insufficient care has been taken in generating theyoung-adult reference population (e.g., too few subjects, useof inappropriate subjects, differences in the age range usedfor young normal subjects, or in the method of curve fittingused for interpreting the data). A final factor is that T-scoresare derived by normalizing BMD measurements to the young-adult population standard deviation (SD). The population SDincludes both the inherent biological variation among subjectsand the substantial BMD measurement errors due to varia-tions in the composition of bone marrow and soft tissue(45). Even if the true BMD losses with age were similar attwo skeletal sites, there is no reason to think that normaliza-tion by the population SD would result in similar curves ofT-score versus age. For the reasons given above, it is impor-tant that the WHO T-score definition of osteoporosis is ap-plied only to the recognized skeletal sites of the lumbarspine, femoral neck, and one-third (33%) radius and to resistattempts to apply the T 5�2.5 threshold uncritically to otherskeletal sites.
Therefore, in order for the WHO criteria to be applied inconjunction with peripheral devices for the diagnosis of oste-oporosis, the followingshould be required:
� Mean T-score with age follows the pattern of spine, fem-oral neck or one-third radius measured by central DXA.� Proportion of subjects with osteoporosis is similar to that
found for spine, femoral neck or the one-third (33%) ra-dius BMD measured by central DXA in the same cohortof subjects.� Future fracture risk is similar between pDXA and spine,
femoral neck or one-third (33%) radius measured by cen-tral DXA at a given T-score.� Reported relative risk (RR) per standard deviation de-
crease should be at least 1.5 (46). There is an unfortunatetendency in the bone densitometry literature to regard anytechnique with an RR figure statistically significantlygreater than 1.0 as clinically useful without regard tohow low the RR value is, or how closely the lower boundof the 95% confidence limit approaches 1.0. In general,techniques with RR values between 1.0 and 1.5 shouldprobably be rejected as insufficiently effective (26).
Volume 11, 2008

eletal Sites
RR/OR Comment
1.3 (1.0e1.7)1.7 (1.2e2.3)2.0 (1.1e3.4)
ns
ns Vertebral fractureassessed 4 yrafter SPA
1.5e2.21.5e3.11.6e2.9
2.42.6
1.5 pDXA diagnosisfollowed bytreatment did notreduce fractureincidence
1.65
2 Distal region1.6 Proximal region1.91.81.8nsnsns
1.5/1.4/1.71.9/1.6/1.71.7/1.5/1.82.0/1.6/1.81.4/1.3/1.61.6/1.4/2.02.4/2.0/2.01.6/1.6/1.61.6/1.4/2.0
194
Hans
etal.
J
Table 3Summary of Relevant Cross-Sectional and Prospective Studies Using pDXA at Peripheral Sk
Author Year SexAge
(mean) Ethnicity NFracture
Type
StudyDesign(time of
follow-up) Device ROI
Krieg (inhouse data)
2007 F 76 C 949 Non vertebral Prospective (3.2 y) pDXA ProximalDistal
Hip ProximalDistal
Hongsdusit (30) 2006 M 45e92(70)
C 402 Vertebral Cross-sectional SPA Wrist
Clowes (32) 2005 F 68 C 779 Hip/Vert/Wrist Cross-sectional DTX nROIDTX PR
Hologic Wrist
Sornay-Rendu (17) 2005 F 64 C 288 Vert/Non-vert Prospective (11 yr) Hologic UDHologic Proximal
Barr (25) 2005 F 68 C 5630 ANY Prospective (18e20 mo) PIXI HeelHip/Vert/Wrist PIXI Heel
Hip PIXI Heel
Holmberg (20) 2004 F 54 C 1294 ANY Prospective (9 yr) SPA BMD1SPA BMD6
Wrist SPA BMD1SPA BMD6
Vertebral SPA BMD1SPA BMD6
Ankle SPA BMD1SPA BMD6
Stone (15) 2003 F 65e99(72)
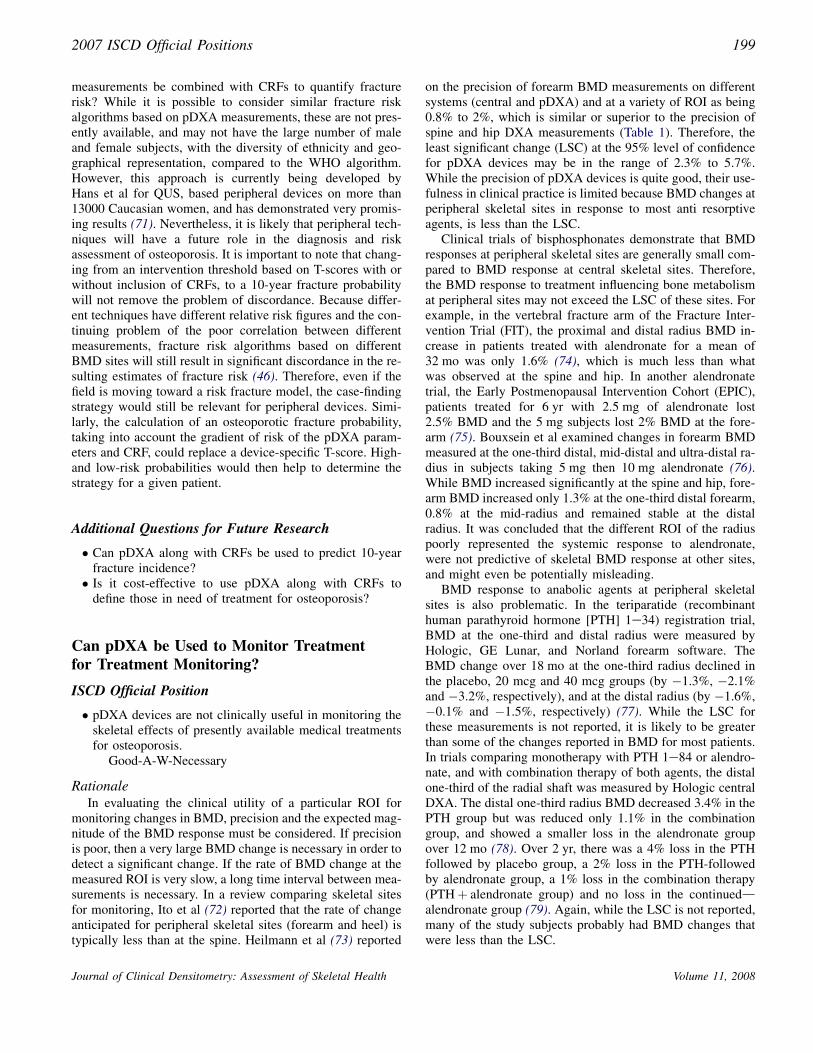
C 9600 Hip Prospective (10.4 yr) SPA DR/PR/CAWrist SPA DR/PR/CASpine SPA DR/PR/CA
Humerus SPA DR/PR/CARib SPA DR/PR/CA
Pelvis SPA DR/PR/CALower leg SPA DR/PR/CAClavicle SPA DR/PR/CAPatella SPA DR/PR/CA
ou
rna
lo
fC
linica
lD
ensito
metry:
Assessm
ent
of
Skeleta
lH
ealth
Vo
lum
e1
1,
20
08

1.4/1.4/1.61.4/1.2/1.31.8/1.6/2.21.8/1.7/2.22.0/1.6/1.91.5/1.2/1.31.4/1.3/1.21.3/1.2/1.2
ns/ns/ns1.4/1.3/1.4
1.41.61.8
1.71.61.4
1.6 ns in the full cohort1.7
1.61.91.51.41.3ns
only report a higherincidence withlower T-score
2.13.4
1.8 QDR-1000; 25%had a incidentfracture
1.8 RR significant inmen alone
ns 31 hip fractures;70% intertrochanter
ns 31 hip fractures
(Continued)
2007
ISC
DO
fficia
lP
ositio
ns
195
Elbow SPA DR/PR/CAFoot SPA DR/PR/CAHeel SPA DR/PR/CA
Femur SPA DR/PR/CAHand SPA DR/PR/CAToe SPA DR/PR/CA
Finger SPA DR/PR/CAAnkle SPA DR/PR/CAFace SPA DR/PR/CAANY SPA DR/PR/CA
Black (33) 1992 F O65 C 8134 Non-vert. Prospective (0.7 yr) SPA DR/PR/CAWrist Prospective (0.7 yr) SPA PRWrist Prospective (0.7 yr) SPA Calcaneus
Cummings (34) 1990 F O65 C 9702 Hip Prospective (1.6 yr) SPA DRProspective (1.6 yr) SPA PRProspective (1.6 yr) SPA Calcaneus
Nevitt (35) 1994 F O80 C 1005 Non-vert. Prospective (4.9 yr) SPA DRWrist DR
Miller (18) 2002 F O50 C 79,185 ANY Prospective (1 yr) SXA CalcaneusHip Prospective (1 yr) SXA Calcaneus
51,941 ANY Prospective (1 yr) pDEXA WristHip Prospective (1 yr) pDEXA Wrist
10,836 ANY Prospective (1 yr) DXA FingerHip Prospective (1 yr) DXA Finger
Barrett-Connor (31) 2005 F O50 mixed 197,848 ANY Prospective (1 yr) pDXA All
All excl wrist Prospective (1 yr) pDXA All
Saleh (36) 2002 F 70 C 354 Wrist Cross-sectional DTX nROIHip Cross-sectional DTX nROI
Broe (37) 2000 F/M 88 C 252(186/66) Non-vert. Prospective (2.3 yr) DXA UD
Non-vert. Prospective (2.3 yr) Proximal
Hip Prospective (2.3 yr) UD
Hip Prospective (2.3 yr) Proximal
Jou
rna
lo
fC
linica
lD
ensito
metry:
Assessm
ent
of
Skeleta
lH
ealth
Vo
lum
e1
1,
20
08

196 Hans et al.
Tab
le3
(Co
nti
nu
ed)
Au
tho
rY
ear
Sex
Ag
e(m
ean
)E
thn
icit
yN
Fra
ctu
reT
yp
e
Stu
dy
Des
ign
(tim
eo
ffo
llow
-up
)D
evic
eR
OI
RR
/OR
Co
mm
ent
Hu
i(3
8)
19
89
FC
38
6N
on
-ver
t.P
rosp
ecti
ve(6
.7y
r)S
PAR
adiu
s2
.2fr
ee-l
ivin
gin
div
idu
als
13
5N
on
-ver
t.P
rosp
ecti
ve(5
.5y
r)S
PAR
adiu
s1
.5n
urs
ing
ho
me
resi
den
ts1
35
Hip
Pro
spec
tive
(5.5
yr)
SPA
Rad
ius
1.9
nu
rsin
gh
om
ere
sid
ents
38
6W
rist
Pro
spec
tive
(6.7
yr)
SPA
Rad
ius
3.6
free
-liv
ing
ind
ivid
ual
s
Rii
s(2
1)
19
96
FC
18
2W
rist
Pro
spec
tive
(15
yr)
SPA
Wri
st2
Ove
rgaa
rd(3
9)
19
92
FC
38
7A
NY
Cro
ss-s
ecti
on
alS
PAW
rist
t-te
st,
RO
C
Gar
dse
ll(4
0)
19
93
FC
10
76
Pro
spec
tive
(15
yr)
SPA
Wri
st
Gar
dse
ll(2
9)
19
90
MC
65
4P
rosp
ecti
ve(1
1y
r)S
PAW
rist
Ab
br:
BM
D1
,d
ista
lre
gio
n;
BM
D6
,p
rox
imal
reg
ion
;D
R,
dis
tal
rad
ius;
PR
,p
rox
imal
rad
ius;
CA
,ca
lcan
eus;
F,fe
mal
e;M
,m
ale;
C,
Cau
casi
an;
S,
spin
e,T
H,
tota
lh
ip,
FN
,fe
mo
ral
nec
k;
RO
I,re
gio
no
fin
tere
st,
UD
,u
ltra
-dis
tal;
RR
,re
lati
veri
sk,
OR
,o
dd
’sra
tio
,n
s,n
ot
sig
nifi
can
t.
Journal of Clinical Densitometry: Assessment of Skeletal Health
If these requirements cannot be fulfilled, then one possibleanswer to the problem of T-score discordance (illustrated inFig. 2) is to define so called ‘‘equivalent T-scores’’ for non-WHO measurement sites such that the same percentage ofwomen fall below the equivalent T-score threshold as foundwith spine, hip, and forearm BMD (e.g., around 15% of allpostmenopausal women). Similarly, we could define upperand lower values for pDXA parameters with 90% sensitivityand 90% specificity for identifying patients with osteoporosisat the hip or spine (3). Using these standards, only 10% ofpatients with a pDXA value above the upper threshold havea T-score of �2.5 or below, at either hip or spine, and 10%of patients with a pDXA value below the lower thresholdhave a T-score greater than �2.5 at both central sites. A sim-ilar approach has been recommended by the UK National Os-teoporosis Society for the use of peripheral X-ray techniques(26). Using such an approach device specific thresholds havebeen published for the Osteometer DTX-200, Schick Accu-DEXA, GE Lunar PIXI (heel) device, ALARA Metriscan,Demtech DXL Calscan, and the Norland Apollo Heel device(26,47) (Table 4).
T-score thresholds and the corresponding BMD values arerelated to the young-adult reference ranges. Because it is possiblethat changes may occur in manufacturers’ reference data andscan analysis software, we have listed the young-adult BMDand population SD used in the present study (26) together withthe values of the upper and lower triage thresholds expressedin BMD units and the system software version (Table 5).
Fig. 2. Age related decline in mean Caucasian female T-scores for different BMD technologies based on manufacturerreference ranges. The hip DXA reference data are taken fromthe NHANES study. The DXA normative data for the PAspine (L1-L4), lateral spine (L2-L4), and forearm (one-thirdradius) were obtained from the Hologic reference ranges.Heel data were taken from the estimated BMD for the Holo-gic Sahara ultrasound unit. Spinal QCT is that used by the Im-age Analysis reference system. Filled triangles: heel; Opendiamonds: total hip; Open squares: PA spine; Filled circles:one-third radius; Filled diamonds: lateral spine; Open circles:QCT spine (Reproduced from Ref (43)).
Volume 11, 2008

2007 ISCD Official Positions 197
Table 4Summary of Upper and Lower National Osteoporosis Society Triage Thresholds Derived From the Clinical Study
(BMD Bone Mineral Density, DXA Dual X-ray Absorptiometry)
Peripheraldevice
BMDsite
Number ofosteoporotic
women(mean age)
Number ofnonosteoporotic
women(mean age)
Upper triageT-score
(95% CI)
Lower triageT-score
(95% CI)
CentralDXAdevice
Percentagereferred for
central DXA(95% CI)
OsteometerDTX-200
Forearm 113 (63.8 yr) 280 (62.0 yr) �1.4 �2.6 Hologic 39%(�0.9 to �1.6) (�2.5 to �3.0) (34e44%)
Schick AccuDEXA
Hand 80 (63.5 yr) 220 (62.2 yr) þ0.1 �1.6 Hologic 44%(þ0.9 to �0.2) (�1.4 to �2.0) (38e50%)
GE LunarPIXI
Heel 98 (64.2 yars) 115 (61.7 yr) �0.4 �2.0 Lunar 49%(þ0.2 to �0.7) (�1.6 to �2.3) (42e56%)
Alara MetriScan Hand 70 (62.8 yr) 100 (61.9 yr) �0.6 �2.4 Lunar 48%(þ0.1 to �1.1) (�2.1 to �2.7) (40e56%)
DemetechDXL Calscan
Heel 70 (63.1 yr) 70 (62.1 yr) �1.4 �2.7 Lunar 50%(�0.9 to �1.6) (�2.5 to �3.5) (41e59%)
Results of the theoretical calculations of the device-spe-cific thresholds for women aged 62.5 yr, based on the manu-facturers’ reference data, were compared with the results ofthe clinical study. The difference in T-scores between the up-per and lower thresholds obtained in the clinical and theoret-ical studies tests the agreement between the clinical data andthe manufacturers’ population standard deviations. The re-sults were as follows: DTX-200: 1.2 vs. 1.2; AccuDEXA:1.7 vs. 1.7; PIXI: 1.6 vs. 1.2; MetriScan: 1.8 vs. 1.7; Calscan:1.3 vs. 1.2 (26).
Using a more conservative 95% sensitivity and specificitythreshold, Clowes et al (48), not surprisingly, produced morestringent T-score thresholds for the Osteometer DTX 200 de-vice compared with the Blake et al 90% threshold approach(high-risk T �3.2 vs �2.6; low-risk T �1.52 vs -1.4).
For a clinical approach, we recommend that a WHO diag-nosis of osteoporosis can be predicted with a high probabilityof occurrence when the heel/forearm/finger pDXA BMDvalue is below the lower diagnostic threshold according to90% specificity. When the pDXA BMD value exceeds the up-per threshold, then the probability of osteoporosis is very low.With the threshold of 90% sensitivity, the risk of having oste-oporosis would be very low with only 10% of subjects being
Journal of Clinical Densitometry: Assessment of Skeletal Health
rated as false-negative. On the other hand, a specificity of90% could be used to define subjects as having osteoporosis.This leads to a low rate (10%) of false-positive subjects. Table6 summarizes the results of numerous studies that have inves-tigated possible upper diagnostic thresholds (i.e., reassure orrefer) and lower diagnostic thresholds (i.e., treat or refer)for various pDXA devices.
Based on these studies, it appears that roughly 50%�65% ofsubjects can be classified with certainty as either osteoporotic(below lower threshold), or not osteoporotic (above upperthreshold), leaving 40e50% between the thresholds where re-ferral for additional follow-up with central DXAwould be war-ranted. The results of these studies are very specific to thepatient population studied. Sex and ethnicity are critical param-eters and most of the studies have been done in women, and allof them in Caucasians. Additional studies are needed to estab-lish appropriate action thresholds for men and other ethnicgroups. Other important factors in making the decision to treator not to treat are age and medical history. Data suggest thatboth the upper and lower thresholds should be reduced withage (26). In addition, customized thresholds would be neededfor screening thegeneral populationversus pDXA measurementsin women referred for densitometry based on medical history.
Table 5Listing of Manufacturers’ Young-Adult Reference Ranges Used in the Present Study and the Values of the Triage Thresholds
Expressed in Bone Mineral Density (BMD) Units (26)
Peripheral device -manufacturers’software version
Young-adult BMD(population SD)
Upper triage BMDthreshold
Lower triage BMDthreshold
Osteometer DTX-200 (g/cm2) - v 1.63 0.488 (0.058) 0.407 0.337Schick AccuDEXA (g/cm2) - v1.50 0.513 (0.053) 0.518 0.428GE-Lunar PIXI (g/cm2) - v1.44 0.500 (0.080) 0.468 0.340Alara MetriScan (MetriScan units) - v2.03 56.89 (4.16) 54.3 46.9DXL Calscan (g/cm2) - v1.31 0.485 (0.066) 0.393 0.307
Volume 11, 2008

198 Hans et al.
While it is always possible with any type of measuring de-vice to define a subset of patients with the lowest results thatform an ostensibly ‘‘high-risk’’ group, this does not guaranteethat all types of measurement are equally effective at select-ing patients suitable for antifracture treatment. In order toapply such methodology, there are several mandatory require-ments that need to be validated. These prerequisites are adap-ted from (59) and (46) are described in the ‘‘equivalencestudy’’ of the fracture prediction session of this manuscript.
Additional Questions for Future Research
� Can pDXA be used to diagnose osteoporosis in Caucasianand non-Caucasian men?� Can pDXA be used to diagnose osteoporosis in non-
Caucasian women?
Can pDXA be Used to Initiate Treatment?
ISCD Official Positions
� Central DXA measurements at the spine and femur arethe preferred method for making therapeutic decisionsand should be used if possible. However, if centralDXA cannot be done, pharmacologic treatment can beinitiated if the fracture probability, as assessed by radiuspDXA (or DXA) using device specific thresholds and inconjunction with clinical risk factors, is sufficiently high.
Grade: Fair-B-W-Necessary� Radius pDXA in conjunction with clinical risk factors can
be used to identify a population at very low fracture prob-ability in which no further diagnostic evaluation may benecessary.
Grade: Fair-B-W-Necessary
RationaleThe use of peripheral BMD measurements to initiate a ther-
apy in osteoporotic patients in a stand-alone capacity withoutconfirmation by hip or spine BMD assessment is generally in-appropriate. Indeed, the majority of published evidence show-ing pharmacological therapy being effective in reducingfractures comes from subjects recruited on the basis of lowcentral BMD at either the hip or spine.
However, as defined previously, the use of device specificupper and lower thresholds with 90% sensitivity and 90%specificity for identifying patients with osteoporosis at thespine or hip, may be an acceptable alternative to centralDXA, for the diagnosis of osteoporosis (26,48). Hence, pa-tients below the lower thresholds should theoretically benefitfrom effective anti-fracture therapy. Nevertheless, given thefact that correlations between central and peripheral BMDare not very high, we recommend that at least one majorclinical risk factor (CRF) be present in addition to having a pe-ripheral BMD below the lower threshold. This approach hasalso been suggested for QUS, and has proven to be moreeffective than just using the technique as a stand alonemeasurement (60).
Journal of Clinical Densitometry: Assessment of Skeletal Health
Discussion
We recommend requiring the presence of major CRFs inconjunction with low pDXA parameters to make treatmentdecisions. From meta-analyses and reviews published by Ka-nis et al (61) and Durosier et al (62) we have identified thefollowing CRFs to be used in the decision model: age over75 yr; low Body Mass Index (BMI, where BMI 5 weight inkg divided by height squared in meters squared !20 kg/m2); previous fracture after the age of 50; maternal historyof hip fracture; current cigarette smoking; diabetes mellitus;history of glucocorticoids use; fall within the last 12 mo;and use of arms to stand up from a chair (namely ‘‘missedchair test’’). It is to be noted that we have not included rheu-matoid arthritis as one of the major risk factors due to theadverse effect of disease activity alone on radius BMD (63).
As mentioned previously, treatment initiation and diagno-sis of osteoporosis may be possible if device- and ROI- spe-cific thresholds are utilized in conjunction with relevantCRFs. However, when a patient has a BMD value that liesbetween the upper and lower thresholds, an additional BMDexamination would be needed in order to properly evaluateher. We recommend using a case finding strategy (or triageapproach) that integrates peripheral BMD measurementswith CRFs and, in a case of equivocal findings, hip and/orspine BMD measurements by DXA. Such an approach hasalready been suggested for peripheral measurements andhas proven to be more effective in the diagnosis of osteoporo-sis than just using a peripheral measurement alone (60,64).While such a case-finding approach with peripheral BMDand CRFs has scientific merit and reduces the need for centralBMD assessment, a preliminary cost-effectiveness analysisled to conflicting results, both positive (65) and negative(66). However, the assumptions made in these studies mayvary from one country to another and the thresholds and strat-egy used differ from what we are proposing. Further cost-ef-fective analyses should be performed.
The difficulties of CRF assessment is the absence of quan-titative values. Indeed, these parameters are usually categori-cal, and the weight for each of them may vary and has notbeen taken into account in most models. To overcome thesedifficulties, a task force of the WHO, led by Kanis, is devel-oping a ‘‘10-year probability of osteoporotic fracture’’ model,which will combine femoral neck BMD and CRFs to opti-mize the relationship between sensitivity and specificity, asdescribed in the usual way by maximizing the AUROC curve(67e69). The approach of the new WHO algorithm givesa strong foundation on which to build the future clinical ap-plication of bone densitometry. In this new paradigm, the pre-vention of osteoporotic fractures is similar to the currentapproach to prevent cardiovascular disease (CVD), in whicha series of simple risk factors (age, gender, blood pressure)are combined with a measurement of serum cholesterol toestimate the individual’s 10-year risk of CVD (70). Fromthis point of view, the question under discussion here (CanpDXA techniques be used to diagnose osteoporosis?) be-comes less important. A better question is: Can pDXA
Volume 11, 2008
2007 ISCD Official Positions 199
measurements be combined with CRFs to quantify fracturerisk? While it is possible to consider similar fracture riskalgorithms based on pDXA measurements, these are not pres-ently available, and may not have the large number of maleand female subjects, with the diversity of ethnicity and geo-graphical representation, compared to the WHO algorithm.However, this approach is currently being developed byHans et al for QUS, based peripheral devices on more than13000 Caucasian women, and has demonstrated very promis-ing results (71). Nevertheless, it is likely that peripheral tech-niques will have a future role in the diagnosis and riskassessment of osteoporosis. It is important to note that chang-ing from an intervention threshold based on T-scores with orwithout inclusion of CRFs, to a 10-year fracture probabilitywill not remove the problem of discordance. Because differ-ent techniques have different relative risk figures and the con-tinuing problem of the poor correlation between differentmeasurements, fracture risk algorithms based on differentBMD sites will still result in significant discordance in the re-sulting estimates of fracture risk (46). Therefore, even if thefield is moving toward a risk fracture model, the case-findingstrategy would still be relevant for peripheral devices. Simi-larly, the calculation of an osteoporotic fracture probability,taking into account the gradient of risk of the pDXA param-eters and CRF, could replace a device-specific T-score. High-and low-risk probabilities would then help to determine thestrategy for a given patient.
Additional Questions for Future Research
� Can pDXA along with CRFs be used to predict 10-yearfracture incidence?� Is it cost-effective to use pDXA along with CRFs to
define those in need of treatment for osteoporosis?
Can pDXA be Used to Monitor Treatmentfor Treatment Monitoring?
ISCD Official Position
� pDXA devices are not clinically useful in monitoring theskeletal effects of presently available medical treatmentsfor osteoporosis.
Good-A-W-Necessary
RationaleIn evaluating the clinical utility of a particular ROI for
monitoring changes in BMD, precision and the expected mag-nitude of the BMD response must be considered. If precisionis poor, then a very large BMD change is necessary in order todetect a significant change. If the rate of BMD change at themeasured ROI is very slow, a long time interval between mea-surements is necessary. In a review comparing skeletal sitesfor monitoring, Ito et al (72) reported that the rate of changeanticipated for peripheral skeletal sites (forearm and heel) istypically less than at the spine. Heilmann et al (73) reported
Journal of Clinical Densitometry: Assessment of Skeletal Health
on the precision of forearm BMD measurements on differentsystems (central and pDXA) and at a variety of ROI as being0.8% to 2%, which is similar or superior to the precision ofspine and hip DXA measurements (Table 1). Therefore, theleast significant change (LSC) at the 95% level of confidencefor pDXA devices may be in the range of 2.3% to 5.7%.While the precision of pDXA devices is quite good, their use-fulness in clinical practice is limited because BMD changes atperipheral skeletal sites in response to most anti resorptiveagents, is less than the LSC.
Clinical trials of bisphosphonates demonstrate that BMDresponses at peripheral skeletal sites are generally small com-pared to BMD response at central skeletal sites. Therefore,the BMD response to treatment influencing bone metabolismat peripheral sites may not exceed the LSC of these sites. Forexample, in the vertebral fracture arm of the Fracture Inter-vention Trial (FIT), the proximal and distal radius BMD in-crease in patients treated with alendronate for a mean of32 mo was only 1.6% (74), which is much less than whatwas observed at the spine and hip. In another alendronatetrial, the Early Postmenopausal Intervention Cohort (EPIC),patients treated for 6 yr with 2.5 mg of alendronate lost2.5% BMD and the 5 mg subjects lost 2% BMD at the fore-arm (75). Bouxsein et al examined changes in forearm BMDmeasured at the one-third distal, mid-distal and ultra-distal ra-dius in subjects taking 5 mg then 10 mg alendronate (76).While BMD increased significantly at the spine and hip, fore-arm BMD increased only 1.3% at the one-third distal forearm,0.8% at the mid-radius and remained stable at the distalradius. It was concluded that the different ROI of the radiuspoorly represented the systemic response to alendronate,were not predictive of skeletal BMD response at other sites,and might even be potentially misleading.
BMD response to anabolic agents at peripheral skeletalsites is also problematic. In the teriparatide (recombinanthuman parathyroid hormone [PTH] 1e34) registration trial,BMD at the one-third and distal radius were measured byHologic, GE Lunar, and Norland forearm software. TheBMD change over 18 mo at the one-third radius declined inthe placebo, 20 mcg and 40 mcg groups (by �1.3%, �2.1%and �3.2%, respectively), and at the distal radius (by �1.6%,�0.1% and �1.5%, respectively) (77). While the LSC forthese measurements is not reported, it is likely to be greaterthan some of the changes reported in BMD for most patients.In trials comparing monotherapy with PTH 1e84 or alendro-nate, and with combination therapy of both agents, the distalone-third of the radial shaft was measured by Hologic centralDXA. The distal one-third radius BMD decreased 3.4% in thePTH group but was reduced only 1.1% in the combinationgroup, and showed a smaller loss in the alendronate groupover 12 mo (78). Over 2 yr, there was a 4% loss in the PTHfollowed by placebo group, a 2% loss in the PTH-followedby alendronate group, a 1% loss in the combination therapy(PTHþ alendronate group) and no loss in the continueddalendronate group (79). Again, while the LSC is not reported,many of the study subjects probably had BMD changes thatwere less than the LSC.
Volume 11, 2008

UL LL
CommentBMD BMD
0.407 0.337 40e50% ofwomen referredfor central DXA
0.518 0.4280.468 0.340 Fordham 2000
republished54.3 46.9 MetriScan units
0.393 0.307 Thorpe 2006republished
0.4100.3400.3900.3200.2840.310
0.388 0.286 95% certainty;Sheffield
reference data0.371 0.283 95% certainty;
manufacturer’sref. data
0.629 0.4950.561 0.4570.426 0.3450.526 0.441
T 5�1.3(0.390);
70% sens, 86%spec
T 5�1.9(0.445);
77% sens, 77%spec
200
Hans
etal.
J
Table 6Summary of Studies Investigating T-score Equivalent Thresholds for pDXA
Author Year Yr SexAge
(Mean) Ethnicity NOsteoporosis
Definition Device ROI
UL LL
T-score T-score
Blake (26) 2005 F 55e70 C 393 S or TH DTX-200 Radius �1.4 �2.6
300 S or TH accuDEXA Finger 0.1 �1.6213 S or TH PIXI Heel �0.4 �2.0
170 S or TH MetriScan Finger �0.6 �2.4140 S or TH Calscan Heel �1.4 �2.7
Boyanov (49) 2005 F 50e81 (60) C 402 S DTX-100 proximal402 TH DTX-100 proximal402 FN DTX-100 proximal402 S DTX-100 Distal �1.2402 TH DTX-100 Distal �2.3402 FN DTX-100 Distal �1.8
Clowes (48) 2006 F 55e80 (68) C 796 TH DTX-200 Distal (?) �1.5 �3.2
DTX-200 Distal (?) �2.1 �3.6
Damilakis (50) 2003 F 25e82 (59) C 524 S or FN QDR-1000 Proximal �1.1 �3.3QDR-1000 Mid �0.9 �2.7QDR-1000 UD �0.3 �1.7QDR-1000 Total �1 �2.6
Fordham (51) 2000 F 25e93 (60) C 443 S or FN PIXI Heel
Goemaere (52) 2002 M 72e87 (76) C 235 TH PIXI Heel
McCauley (47) 2006 F 50e75 (65) C 215 S or TH Apollo Heel �1.2 �2.2
Mulder (53) 2000 F 42e82 (65) C 123 FN accuDEXA Finger �0.2 �2.6
ou
rna
lo
fC
linica
lD
ensito
metry:
Assessm
ent
of
Skeleta
lH
ealth
Vo
lum
e1
1,
20
08
2007 ISCD Official Positions 201
Pea
rso
n(5
4)
20
03
F3
3e
86
(69
)C
99
So
rT
Ho
rF
NP
IXI
Hee
lT
5�
1.7
;6
8%
sen
s,6
5%
spec
Th
orp
e(5
5)
20
06
F5
5e
70
(63
)C
14
0S
or
TH
Cal
scan
Hee
l�
1.4
�2
.70
.39
10
.30
6
Po
uil
les
(56
)2
00
1F
45
e6
0C
23
4S
or
FN
pD
EX
AD
ist
FA�
0.7
0.3
10
95
%se
ns
23
4S
or
FN
pD
EX
AP
rox
FA�
0.7
0.7
72
95
%se
ns
Pic
ard
(57
)2
00
4F
20
e8
5(5
4)
C8
35
So
rF
Nac
cuD
EX
AF
ing
er�
0.7
0.4
75
90
%se
ns
So
rF
Np
DE
XA
Dis
tFA
�1
.50
.28
09
0%
sen
sS
or
FN
pD
EX
AP
rox
FA�
1.6
0.7
18
90
%se
ns
Lan
gto
n(5
8)
20
00
F3
1e
84
(57
)C
91
Lo
rF
NP
IXI
Hee
l0
.48
00
.37
0
Ab
br:
F,fe
mal
e,M
,m
ale;
C,
Cau
casi
an;
S,
spin
e,T
H,
tota
lh
ip,
FN
,fe
mo
ral
nec
k;
RO
I,re
gio
no
fin
tere
st;
UD
,u
ltra
-dis
tal;
UL
,u
pp
erli
mit
;L
L,
low
erli
mit
;se
ns,
sen
siti
vit
y;
spec
,sp
ecifi
city
.
Journal of Clinical Densitometry: Assessment of Skeletal Health
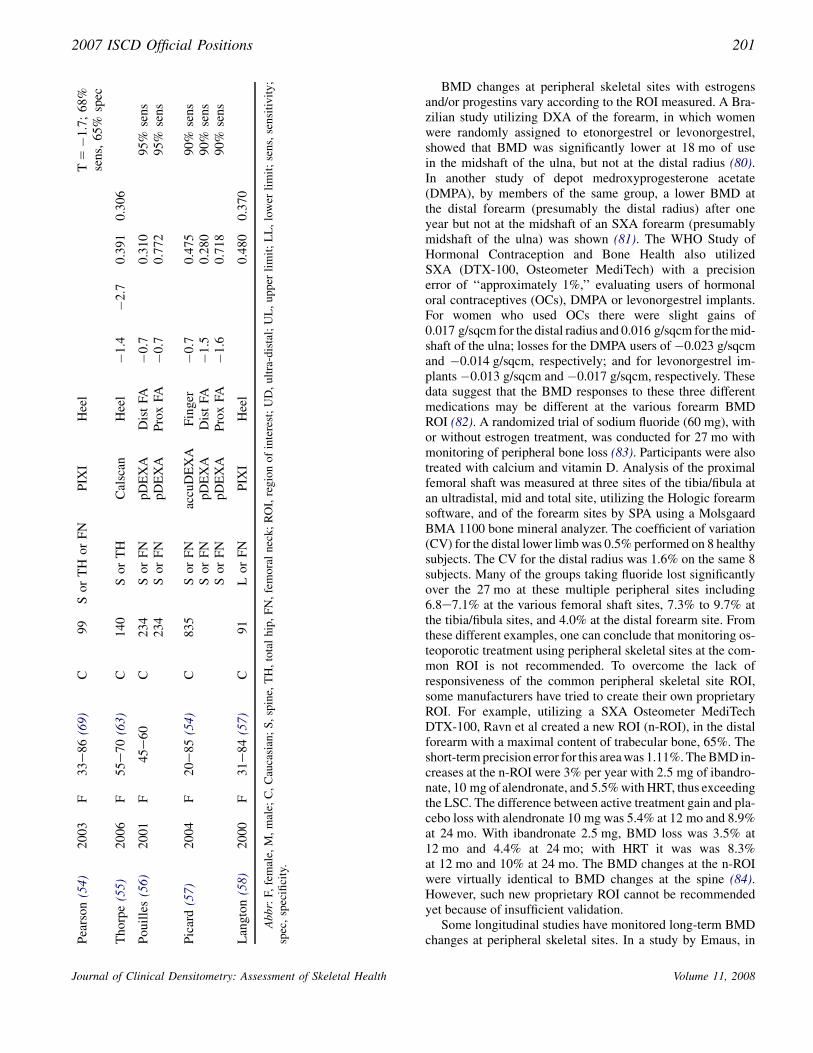
BMD changes at peripheral skeletal sites with estrogensand/or progestins vary according to the ROI measured. A Bra-zilian study utilizing DXA of the forearm, in which womenwere randomly assigned to etonorgestrel or levonorgestrel,showed that BMD was significantly lower at 18 mo of usein the midshaft of the ulna, but not at the distal radius (80).In another study of depot medroxyprogesterone acetate(DMPA), by members of the same group, a lower BMD atthe distal forearm (presumably the distal radius) after oneyear but not at the midshaft of an SXA forearm (presumablymidshaft of the ulna) was shown (81). The WHO Study ofHormonal Contraception and Bone Health also utilizedSXA (DTX-100, Osteometer MediTech) with a precisionerror of ‘‘approximately 1%,’’ evaluating users of hormonaloral contraceptives (OCs), DMPA or levonorgestrel implants.For women who used OCs there were slight gains of0.017 g/sqcm for the distal radius and 0.016 g/sqcm for the mid-shaft of the ulna; losses for the DMPA users of �0.023 g/sqcmand �0.014 g/sqcm, respectively; and for levonorgestrel im-plants �0.013 g/sqcm and �0.017 g/sqcm, respectively. Thesedata suggest that the BMD responses to these three differentmedications may be different at the various forearm BMDROI (82). A randomized trial of sodium fluoride (60 mg), withor without estrogen treatment, was conducted for 27 mo withmonitoring of peripheral bone loss (83). Participants were alsotreated with calcium and vitamin D. Analysis of the proximalfemoral shaft was measured at three sites of the tibia/fibula atan ultradistal, mid and total site, utilizing the Hologic forearmsoftware, and of the forearm sites by SPA using a MolsgaardBMA 1100 bone mineral analyzer. The coefficient of variation(CV) for the distal lower limb was 0.5% performed on 8 healthysubjects. The CV for the distal radius was 1.6% on the same 8subjects. Many of the groups taking fluoride lost significantlyover the 27 mo at these multiple peripheral sites including6.8e7.1% at the various femoral shaft sites, 7.3% to 9.7% atthe tibia/fibula sites, and 4.0% at the distal forearm site. Fromthese different examples, one can conclude that monitoring os-teoporotic treatment using peripheral skeletal sites at the com-mon ROI is not recommended. To overcome the lack ofresponsiveness of the common peripheral skeletal site ROI,some manufacturers have tried to create their own proprietaryROI. For example, utilizing a SXA Osteometer MediTechDTX-100, Ravn et al created a new ROI (n-ROI), in the distalforearm with a maximal content of trabecular bone, 65%. Theshort-term precision error for this area was 1.11%. The BMD in-creases at the n-ROI were 3% per year with 2.5 mg of ibandro-nate, 10 mg of alendronate, and 5.5% with HRT, thus exceedingthe LSC. The difference between active treatment gain and pla-cebo loss with alendronate 10 mg was 5.4% at 12 mo and 8.9%at 24 mo. With ibandronate 2.5 mg, BMD loss was 3.5% at12 mo and 4.4% at 24 mo; with HRT it was was 8.3%at 12 mo and 10% at 24 mo. The BMD changes at the n-ROIwere virtually identical to BMD changes at the spine (84).However, such new proprietary ROI cannot be recommendedyet because of insufficient validation.
Some longitudinal studies have monitored long-term BMDchanges at peripheral skeletal sites. In a study by Emaus, in
Volume 11, 2008
202 Hans et al.
Tromsø, 3169 women and 2197 men had distal and proximalradius BMD measured with SXA between 1994 and1995, andagain in 2001. The precision (coefficient of variation) for twoscans, done 1 wk apart by different operators, was 0.79 and0.98% at distal and ultradistal sites, respectively. Therefore,the Least significant Change (LSC) was 2.2% and 2.7% atthese sites respectively (85). Calculations of the 6e7 yearBMD change at the distal radius showed that women not tak-ing hormonal replacement therapy had bone loss of 3.6%,which exceeded the LSC (86). In another study, by Emaus,again performed in Tromsø, in an un-treated younger groupof women and men (age 25e44 yr), utilizing the same tech-niques and densitometer as in the previous study, where indi-viduals were followed for 6.4 yr, more than 6% of subjectshad BMD losses at the distal and ultra-distal radius greaterthan 3.46% and 5.14%, respectively (87). In a different, 2-year study of healthy young women tested with a DXA heelbone scanner from 1999 to 2001, 62% were found to have de-creased or unchanged bone density, while 38% had increasedBMD (88). Thus, in long-term (2 or more yr) longitudinalpopulation studies, BMD changes that exceed the LSC ofsome pDXA devices have been reported.
Discussion
Different medications and even different doses of the samemedications result in BMD changes that vary by skeletal siteand ROI. Variations in BMD responses are particularly greatat the forearm, where the proportion of trabecular and corticalbone is very different at different ROI . Although the preci-sion of pDXA devices at peripheral skeletal sites may be sim-ilar or even superior to that of DXA at central skeletal sites,the magnitude of the treatment response at peripheral skeletalsites is usually small compared to the spine. Therefore, itseems logical to conclude that either a general statementcan be made that monitoring of drug responses via forearmor other peripheral sites cannot be made, or specific rulesmay be needed for specific drugs, dosages, and ages (youngerin EPIC, older in FIT etc). Unfortunately, we are unable to ex-trapolate other drug responses at the forearm or other periph-eral sites if they have not been investigated in a prospectiveclinical trial.
As previously discussed, there is considerable variation inthe ROI of the forearm, heel, and fingers with different pDXAmeasuring devices. Although it has been suggested that creat-ing common ROI would improve comparability, no seriouseffort to converge to standard ROI has been undertaken. Thelack of standardization of ROI has implications of particularimportance in the radius, where the proportions of trabecularand cortical bone vary greatly depending on ROI location.Thus, it is difficult to make recommendations on monitoringthat apply to all devices.
Additional Questions for Future Research
� Can new ROI be developed that will enable monitoring ofBMD changes using pDXA, such that they show equiva-lence to BMD changes occurring at central sites?
Journal of Clinical Densitometry: Assessment of Skeletal Health
pDXA Reporting
ISCD Official Positions
� For pDXA, the report should combine the following stan-dard elements:B Date of testB Demographics (name, date of birth or age, sex, race or
ethnicity)B Requesting providerB Names of those receiving a copy of reportB Indications for testB Manufacturer, and model of instrument and software
versionB Measurement value(s)B Reference databaseB Skeletal site/region of interestB Quality of testB Limitations of the test including a statement that the
WHO diagnostic classification cannot be applied to T-scores obtained from pDXA measurements other thanone-third (33%) radius.
B Clinical risk factorsB Fracture risk estimationB A general statement that a medical evaluation for sec-
ondary causes of low BMD may be appropriateB Recommendations for follow up imaging
Grade: Fair-C-W-Necessary
� For pDXA, the report may include the following optionalitem:B Recommendations for pharmacological and non phar-
macological interventions.Grade: Fair-C-W
RationaleAn appropriate pDXA report should include information
that identifies the patient, conveys the validity of the study,and provides clear exam interpretation and recommendations,where appropriate. In addition, clear rationale of what shouldbe included in a DXA report has been nicely described ina previous ISCD Position PDC publication (4). As a pDXAdevice is a bone measurement tool that is being used in themanagement of osteoporosis, reporting should be as consis-tent as possible with central DXA reporting (89). However,some reporting information must be adapted to the pDXAtechnologies (e.g., limitation of the WHO classification).
Discussion
A standard approach to reporting has the advantage of cap-turing all the necessary elements for interpretation and assess-ment and, depending on local requirements, may permitreporting to be undertaken by a paramedical professionalrather than a physician (90), although a physician reportwill be required if specific treatment advice is to be given.
Information required for central DXA examinations is rela-tively similar to that needed for pDXA examinations, with
Volume 11, 2008

2007 ISCD Official Positions 203
some exceptions. For example, it is in the area of interpretationthat both the greatest controversy and the greatest opportunityfor explaining the results of bone testing exist (see currentquestions of this PDC). It is crucial to mention that the WHOdiagnostic classification for osteoporosis measured on centralDXA cannot be applied to all pDXA ROI. However, an alterna-tive interpretation has been highlighted in this document.
Additional Questions for Future Research
� Is there value in adding WHO 10-year risk prediction topDXA reports?
What are the Quality Assurance and QualityControl (QA/QC) Criteria for pDXA?
ISCD Official Positions
� For pDXA, device-specific education and training should begiven to the operators and interpreters prior to clinical use.
Grade: Good-A-W-Necessary� Quality control procedures should be performed regularly.
Grade: Good-A-W-Necessary
RationaleAlthough peripheral densitometry machines are generally
believed to be simple to use, straightforward and quick to pro-duce a result for physician and individual tested, a suboptimalperformance of the device, the operator and/or the subject, sim-ilar to that seen with central DXA, may cause artifacts. In a fur-ther analysis of the Tromsø study (91), significant artifacts in
Journal of Clinical Densitometry: Assessment of Skeletal Health
peripheral forearm densitometry using an SXA (DTX-100, Os-teometer) device were found. Fourteen percent of subjects hada movement artifact at either the distal or proximal site. Amovement artifact led to variability in BMD that was twice aslarge as the variability of normal scans. The radial endplatewas inaccurately detected in 74% of the scans. Corrections ofthese analyses led to changes in BMD. Artifacts were mostcommon at the distal site. Some artifacts were correctableand others not (distal site 12.9% un-correctable and the proximalsite 5.4% were uncorrectable).
pDXA systems are a similar technology to central DXA,and thus system calibrations can shift during shipping, andover time. Phantoms have the potential to monitor the calibra-tion and provide calibration correction factors. There has beenlittle evaluation and development of phantoms for central den-sitometry and even less for pDXA systems. A phantom mustfirst be shown to have calibration characteristics similar toclinical patients. For example, Grigorian et al scanned twodifferent phantoms at the same time as scanning the heels of100 women, in a cross-calibration study between the Apolloand PIXI pDXA systems (6). The phantoms were the PIXIheel phantom, a simple phantom of uniform acrylic thicknessand uniform aluminum thickness as the bone equivalentmaterial, as well as the CIRS anthropomorphic heel phantomwith adjustable heel densities. It was found that the PIXIphantom showed a similar calibration difference between thetwo systems as the in vivo population. However, the CIRSphantom showed an entirely different relationship. This wasattributed to soft tissue composition in the CIRS phantomthat was not realistic and caused calibration shifts in the
Fig. 3. Phantom BMD correlations between PIXI and Apollo plotted over the in vivo regression graph. Reproduced fromGrigorian et al (6).
Volume 11, 2008

204 Hans et al.
Apollo but only for the phantom scans. Thus, the PIXI phan-tom would be useful for monitoring the calibration of eithersystem as well as cross-calibration between the two, but theCIRS phantom cannot be used with the Apollo system (Fig. 3).
Discussion
The previously reported studies lead us to three major con-clusions: 1) It is becoming crucial to standardize the ROI atdifferent skeletal sites, and efforts along that line are under-way (5,11); 2) Because of the diversity of ROI and underlyingtechnologies, a subject measured on one machine is not com-parable to the measurement performed on another peripheraltechnology device made by a different manufacturer; and 3)Before the use of pDXA in the clinical setting, the technicianand clinician should participate in a device specific educationand training course. Thus, training on peripheral densitometryshould be focused on improving QA/QC handling; under-standing the importance of standardized, universal ROI; andthe use of the devices for diagnosis, fracture risk assessment,and monitoring so that both research and clinical programscan generate relevant data for patients.
Additional Questions for Future Research
� Can standardized ROI and phantoms be developed toenable different pDXA devices to be cross-calibrated?
Summary
Although pDXA technology was developed many yearsago, its use in the clinical setting is confused and discordant.The ISCD Official Positions described herein reflects thecurrent state of knowledge regarding pDXA.
The clinical use and utility of pDXA to diagnose osteoporo-sis is justified particularly in situations where central DXA isunavailable. Peripheral DXA measures are related to globalfracture risk with similar relative risk as other central bonedensity ROI for postmenopausal women. Peripheral DXA mea-surement of the one-third radius ROI using the WHO criteria,or use of T-score thresholds specific to the ROI, make, andmodel of pDXA device permits a high sensitivity and specific-ity identification of individuals at high-risk of fracture. Thus, inthese situations, the initiation of treatment is also justified.
However, in its current state, pDXA has not been shown tobe an effective technique for monitoring treatment efficacy.Further standardization, especially of the ROI, could improvethe utility and acceptance of these devices.
References
1. Cameron JR, Sorenson J. 1963 Measurement of Bone Mineral inVivo: an Improved Method. Science 142:230e232.
2. Hamdy RC, Petak SM, Lenchik L. 2002 Which central dualX-ray absorptiometry skeletal sites and regions of interest shouldbe used to determine the diagnosis of osteoporosis? J ClinDensitom 5 Suppl:S11eS18.
3. Miller PD, Njeh CF, Jankowski LG, et al. 2002 What are thestandards by which bone mass measurement at peripheral
Journal of Clinical Densitometry: Assessment of Skeletal Health
skeletal sites should be used in the diagnosis of osteoporosis?J Clin Densitom 5 Suppl:S39eS45.
4. Binkley N, Bilezikian JP, Kendler DL, et al. 2006 Official posi-tions of the International Society for Clinical Densitometry andExecutive Summary of the 2005 Position Development Confer-ence. J Clin Densitom 9(1):4e14.
5. Shepherd JA, Cheng XG, Lu Y, et al. 2002 Universal standard-ization of forearm bone densitometry. J Bone Miner Res 17(4):734e745.
6. Grigorian M, Shepherd JA, Cheng XG, et al. 2002 Does osteo-porosis classification using heel BMD agree across manufac-turers? Osteoporos Int 13(8):613e617.
7. Bouyoucef SE, Cullum ID, Ell PJ. 1996 Cross-calibration ofa fan-beam X-ray densitometer with a pencil-beam system. BrJ Radiol 69(822):522e531.
8. Hagiwara S, Engelke K, Yang SO, et al. 1994 Dual x-ray absorp-tiometry forearm software: accuracy and intermachine relation-ship. J Bone Miner Res 9(9):1425e1427.
9. Faulkner KG, McClung MR, Schmeer MS, et al. 1994 Densi-tometry of the radius using single and dual energy absorptiom-etry. Calcif Tissue Int 54(3):208e211.
10. Nilas L, Norgaard H, Podenphant J, et al. 1987 Bone composi-tion in the distal forearm. Scand J Clin Lab Invest 47(1):41e46.
11. Prevrhal S, Lu Y, Genant HK, et al. 2005 Towards standardiza-tion of dual X-ray absorptiometry (DXA) at the forearm: a com-mon region of interest (ROI) improves the comparability amongDXA devices. Calcif Tissue Int 76(5):348e354.
12. Meszaros S, Berko P, Genti G, et al. 2006 Comparative evalua-tion of local and international reference databases for forearmdensitometry: different impacts on diagnostic decisions. J ClinDensitom 9(4):445e453.
13. Marshall D, Johnell O, Wedel H. 1996 Meta-analysis of howwell measures of bone mineral density predict occurrence ofosteoporotic fractures. BMJ 312(7041):1254e1259.
14. Seeley DG, Browner WS, Nevitt MC, et al. 1991 Which frac-tures are associated with low appendicular bone mass in elderlywomen? The Study of Osteoporotic Fractures Research Group.Ann Intern Med 115(11):837e842.
15. Stone KL, Seeley DG, Lui LY, et al. 2003 BMD at multiple sitesand risk of fracture of multiple types: long-term results from theStudy of Osteoporotic Fractures. J Bone Miner Res 18(11):1947e1954.
16. Cummings SR, Black DM, Nevitt MC, et al. 1993 Bone den-sity at various sites for prediction of hip fractures. The Studyof Osteoporotic Fractures Research Group. Lancet 341(8837):72e75.
17. Sornay-Rendu E, Munoz F, Duboeuf F, et al. 2005 Rate of fore-arm bone loss is associated with an increased risk of fracture in-dependently of bone mass in postmenopausal women: theOFELY study. J Bone Miner Res 20(11):1929e1935.
18. Miller PD, Siris ES, Barrett-Connor E, et al. 2002 Prediction offracture risk in postmenopausal white women with peripheralbone densitometry: evidence from the National OsteoporosisRisk Assessment. J Bone Miner Res 17(12):2222e2230.
19. Siris ES, Brenneman SK, Barrett-Connor E, et al. 2006 The ef-fect of age and bone mineral density on the absolute, excess, andrelative risk of fracture in postmenopausal women aged 50-99:results from the National Osteoporosis Risk Assessment(NORA). Osteoporos Int 17(4):565e574.
20. Holmberg A, Johnell O, Akesson K, et al. 2004 Forearm bone min-eral density in 1294 middle-aged women: a strong predictor of fra-gility fractures. J Clin Densitom 7(4):419e423.
21. Riis BJ, Hansen MA, Jensen AM, et al. 1996 Low bone massand fast rate of bone loss at menopause: equal risk factors forfuture fracture: a 15-year follow-up study. Bone 19(1):9e12.
Volume 11, 2008

2007 ISCD Official Positions 205
22. Gardsell P, Johnell O, Nilsson BE. 1991 The predictive value ofbone loss for fragility fractures in women: a longitudinal studyover 15 years. Calcif Tissue Int 49(2):90e94.
23. Ross PD, Kress BC, Parson RE, et al. 2000 Serum bone alkalinephosphatase and calcaneus bone density predict fractures: a pro-spective study. Osteoporos Int 11(1):76e82.
24. Huang C, Ross PD, Wasnich RD. 1998 Short-term and long-termfracture prediction by bone mass measurements: a prospectivestudy. J Bone Miner Res 13(1):107e113.
25. Barr RJ, Adebajo A, Fraser WD, et al. 2005 Can peripheral DXAmeasurements be used to predict fractures in elderly women livingin the community? Osteoporos Int 16(10):1177e1183.
26. Blake GM, Chinn DJ, Steel SA, et al. 2005 A list of device-specificthresholds for the clinical interpretation of peripheral x-rayabsorptiometry examinations. Osteoporos Int 16(12):2149e2156.
27. Kanis JA. 2002 Diagnosis of osteoporosis and assessment offracture risk. Lancet 359(9321):1929e1936.
28. Blake GM, Fogelman I. 2001 Peripheral or central densitometry:does it matter which techniqueweuse? J ClinDensitom 4(2):83e96.
29. Gardsell P, Johnell O, Nilsson BE. 1990 The predictive value offorearm bone mineral content measurements in men. Bone11(4):229e232.
30. Hongsdusit N, von Muhlen D, Barrett-Connor E. 2006 A com-parison between peripheral BMD and central BMD measure-ments in the prediction of spine fractures in men. OsteoporosInt 17(6):872e877.
31. Barrett-Connor E, Siris ES, Wehren LE, et al. 2005 Osteoporosisand fracture risk in women of different ethnic groups. J BoneMiner Res 20(2):185e194.
32. Clowes JA, Eastell R, Peel NF. 2005 The discriminative abilityof peripheral and axial bone measurements to identify proximalfemoral, vertebral, distal forearm and proximal humeral frac-tures: a case control study. Osteoporos Int 16(12):1794e1802.
33. Black DM, Cummings SR, Genant HK, et al. 1992 Axial and ap-pendicular bone density predict fractures in older women. JBone Miner Res 7(6):633e638.
34. Cummings SR, Black DM, Nevitt MC, et al. 1990 Appendicularbone density and age predict hip fracture in women. The Study ofOsteoporotic Fractures Research Group. JAMA 263(5):665e668.
35. Nevitt MC, Johnell O, Black DM, et al. 1994 Bone mineral densitypredicts non-spine fractures in very elderly women. Study of Oste-oporotic Fractures Research Group. Osteoporos Int 4(6):325e331.
36. Saleh MM, Jorgensen HL, Lauritzen JB. 2002 Odds ratios for hip-and lower forearm fracture using peripheral bone densitometry;a case-control study of postmenopausal women. Clin PhysiolFunct Imaging 22(1):58e63.
37. Broe KE, Hannan MT, Kiely DK, et al. 2000 Predicting fracturesusing bone mineral density: a prospective study of long-termcare residents. Osteoporos Int 11(9):765e771.
38. Hui SL, Slemenda CW, Johnston CC Jr. 1989 Baseline measure-ment of bone mass predicts fracture in white women. Ann InternMed 111(5):355e361.
39. Overgaard K, Hansen MA, Riis BJ, et al. 1992 Discriminatoryability of bone mass measurements (SPA and DEXA) for fracturesin elderly postmenopausal women. Calcif Tissue Int 50(1):30e35.
40. Gardsell P, Johnell O, Nilsson BE, et al. 1993 Predicting variousfragility fractures in women by forearm bone densitometry: a fol-low-up study. Calcif Tissue Int 52(5):348e353.
41. Kanis JA, Melton LJ 3rd, Christiansen C, et al. 1994 The diag-nosis of osteoporosis. J Bone Miner Res 9(8):1137e1141.
42. Hans D, Downs RW Jr, Duboeuf F, et al. 2006 Skeletal sites forosteoporosis diagnosis: the 2005 ISCD Official Positions. J ClinDensitom 9(1):15e21.
43. Faulkner KG, von Stetten E, Miller P. 1999 Discordance in patientclassification using T-scores. J Clin Densitom 2(3):343e350.
Journal of Clinical Densitometry: Assessment of Skeletal Health
44. Lu Y, Genant HK, Shepherd J, et al. 2001 Classification of oste-oporosis based on bone mineral densities. J Bone Miner Res16(5):901e910.
45. Svendsen OL, Hassager C, Skodt V, et al. 1995 Impact of softtissue on in vivo accuracy of bone mineral measurements inthe spine, hip, and forearm: a human cadaver study. J BoneMiner Res 10(6):868e873.
46. Blake GM, Knapp KM, Fogelman I. 2002 Absolute fracture riskvaries with bone densitometry technique used. A theoretical andin vivo study of fracture cases. J Clin Densitom 5(2):109e116.
47. McCauley E, Mackie A, Elliott D, et al. 2006 Heel bone densi-tometry: device specific thresholds for the assessment of osteo-porosis. Br J Radiol 79(942):464e467.
48. Clowes JA, Peel NF, Eastell R. 2006 Device-specific thresholdsto diagnose osteoporosis at the proximal femur: an approach tointerpreting peripheral bone measurements in clinical practice.Osteoporos Int 17(9):1293e1302.
49. Boyanov M. 2005 Forearm single X-ray absorptiometry in theidentification of postmenopausal women with osteoporosis atthe hip and spine: a correlation study. J Clin Densitom 8(4):423e429.
50. Damilakis J, Papadokostakis G, Perisinakis K, et al. 2003 Canradial bone mineral density and quantitative ultrasound measure-ments reduce the number of women who need axial density skel-etal assessment? Osteoporos Int 14(8):688e693.
51. Fordham JN, Chinn DJ, Kumar N. 2000 Identification of womenwith reduced bone density at the lumbar spine and femoral neckusing BMD at the os calcis. Osteoporos Int 11(9):797e802.
52. Goemaere S, Zmierczak H, Van Pottelbergh I, et al. 2002 Abilityof peripheral bone assessments to predict areal bone mineraldensity at hip in community-dwelling elderly men. J Clin Den-sitom 5(3):219e228.
53. Mulder JE, Michaeli D, Flaster ER, et al. 2000 Comparison ofbone mineral density of the phalanges, lumbar spine, hip, andforearm for the assessment of osteoporosis in postmenopausalwomen. J Clin Densitom 3(4):373e381.
54. Pearson D, Masud T, Sahota O, et al. 2003 A comparison ofcalcaneal dual-energy X-ray absorptiometry and calcaneal ultra-sound for predicting the diagnosis of osteoporosis from hip andspine bone densitometry. J Clin Densitom 6(4):345e352.
55. Thorpe JA, Steel SA. 2006 The DXL Calscan heel densitometer:evaluation and diagnostic thresholds. Br J Radiol 79(940):336e341.
56. Pouilles JM, Tremollieres FA, Martinez S, et al. 2001 Ability ofperipheral DXA measurements of the forearm to predict low axialbone mineral density at menopause. Osteoporos Int 12(1):71e76.
57. Picard D, Brown JP, Rosenthall L, et al. 2004 Ability of periph-eral DXA measurement to diagnose osteoporosis as assessed bycentral DXA measurement. J Clin Densitom 7(1):111e118.
58. Langton CM, Langton DK. 2000 Comparison of bone mineraldensity and quantitative ultrasound of the calcaneus: site-matched correlation and discrimination of axial BMD status.Br J Radiol 73(865):31e35.
59. Patel R, Blake GM, Fogelman I. 2004 An evaluation of theUnited Kingdom National Osteoporosis Society position state-ment on the use of peripheral dual-energy X-ray absorptiometry.Osteoporos Int 15(6):497e504.
60. Durosier C, Hans D, Krieg MA, et al. 2007 Combining clinicalfactors and quantitative ultrasound improves the detection ofwomen both at low and high risk for hip fracture. OsteoporosInt 18(12):1651e1659.
61. Kanis JA, Oden A, Johnell O, et al. 2007 The use of clinical riskfactors enhances the performance of BMD in the prediction ofhip and osteoporotic fractures in men and women. OsteoporosInt 18(8):1033e1046.
Volume 11, 2008
206 Hans et al.
62. Durosier C, Hans D, Krieg MA, et al. 2006 Prediction and dis-crimination of osteoporotic hip fracture in postmenopausalwomen. J Clin Densitom 9(4):475e495.
63. Martin JC, Munro R, Campbell MK, et al. 1997 Effects of dis-ease and corticosteroids on appendicular bone mass in postmen-opausal women with rheumatoid arthritis: comparison with axialmeasurements. Br J Rheumatol 36(1):43e49.
64. Chen YT, Miller PD, Barrett-Connor E, et al. 2007 An approachfor identifying postmenopausal women age 50-64 years at in-creased short-term risk for osteoporotic fracture. OsteoporosInt 18(9):1287e1296.
65. Abbott TA 3rd, Mucha L, Manfredonia D, et al. 1999 Efficientpatient identification strategies for women with osteoporosis. JClin Densitom 2(3):223e230.
66. Harrison EJ, Adams JE. 2006 Application of a triage approach toperipheral bone densitometry reduces the requirement for centralDXA but is not cost effective. Calcif Tissue Int 79(4):199e206.
67. Kanis JA, Borgstrom F, De Laet C, et al. 2005 Assessment offracture risk. Osteoporos Int 16(6):581e589.
68. De Laet C, Oden A, Johansson H, et al. 2005 The impact of theuse of multiple risk indicators for fracture on case-finding strat-egies: a mathematical approach. Osteoporos Int 16(3):313e318.
69. Johnell O, Kanis JA, Oden A, et al. 2005 Predictive value of BMDfor hip and other fractures. J Bone Miner Res 20(7):1185e1194.
70. Wilson PW, D’Agostino RB, Levy D, et al. 1998 Prediction ofcoronary heart disease using risk factor categories. Circulation97(18):1837e1847.
71. Hans D, Schott AM, Durosier C, et al. 2006 Ten-year probabilityof osteoporotic hip fracture in 12958 elderly women combiningclinical factors and heel bone ultrasound: The combined ‘‘SEM-OFþ EPIDOS’’ prospective cohort. ASBMR 28th Annual meet-ing, vol. 21. J Bone Miner Res Philadelphia, USA, 2006, pp 1297.
72. Ito M, Nishida A, Kono J, et al. 2003 Which bone densitometryand which skeletal site are clinically useful for monitoring bonemass? Osteoporos Int 14(12):959e964.
73. Heilmann P, Wuster C, Prolingheuer C, et al. 1998 Measurementof forearm bone mineral density: comparison of precision of fivedifferent instruments. Calcif Tissue Int 62(5):383e387.
74. Black DM, Cummings SR, Karpf DB, et al. 1996 Randomisedtrial of effect of alendronate on risk of fracture in women withexisting vertebral fractures. Fracture Intervention Trial ResearchGroup. Lancet 348(9041):1535e1541.
75. McClung MR, Wasnich RD, Hosking DJ, et al. 2004 Preventionof postmenopausal bone loss: six-year results from the EarlyPostmenopausal Intervention Cohort Study. J Clin EndocrinolMetab 89(10):4879e4885.
76. Bouxsein ML, Parker RA, Greenspan SL. 1999 Forearm bonemineral densitometry cannot be used to monitor response toalendronate therapy in postmenopausal women. Osteoporos Int10(6):505e509.
77. Neer RM, Arnaud CD, Zanchetta JR, et al. 2001 Effect of para-thyroid hormone (1-34) on fractures and bone mineral density in
Journal of Clinical Densitometry: Assessment of Skeletal Health
postmenopausal women with osteoporosis. N Engl J Med344(19):1434e1441.
78. Black DM, Greenspan SL, Ensrud KE, et al. 2003 The effects ofparathyroid hormone and alendronate alone or in combination inpostmenopausal osteoporosis. N Engl J Med 349(13):1207e1215.
79. Black DM, Bilezikian JP, Ensrud KE, et al. 2005 One year ofalendronate after one year of parathyroid hormone (1-84) forosteoporosis. N Engl J Med 353(6):555e565.
80. Bahamondes L, Monteiro-Dantas C, Espejo-Arce X, et al. 2006A prospective study of the forearm bone density of users of eto-norgestrel- and levonorgestrel-releasing contraceptive implants.Humanit Rep 21(2):466e470.
81. Bahamondes L, Perrotti M, Castro S, et al. 1999 Forearm bonedensity in users of Depo-Provera as a contraceptive method. Fer-til Steril 71(5):849e852.
82. Petitti DB, Piaggio G, Mehta S, et al. 2000 Steroid hormonecontraception and bone mineral density: a cross-sectional studyin an international population. The WHO Study of HormonalContraception and Bone Health. Obstet Gynecol 95(5):736e744.
83. Gutteridge DH, Stewart GO, Prince RL, et al. 2002 A random-ized trial of sodium fluoride (60 mg) þ/- estrogen in postmeno-pausal osteoporotic vertebral fractures: increased vertebralfractures and peripheral bone loss with sodium fluoride; concur-rent estrogen prevents peripheral loss, but not vertebral fractures.Osteoporos Int 13(2):158e170.
84. Ravn P, Alexandersen P, Mollgaard A. 1999 Bone densitometry:a new, highly responsive region of interest in the distal forearmto monitor the effect of osteoporosis treatment. Osteoporos Int9(4):277e283.
85. Rosvold Berntsen GK, Fonnebo V, Tollan A, et al. 2000 TheTromso study: determinants of precision in bone densitometry.J Clin Epidemiol 53(11):1104e1112.
86. Emaus N, Berntsen GK, Joakimsen R, et al. 2006 Longitudinalchanges in forearm bone mineral density in women and menaged 45-84 years: the Tromso Study, a population-based study.Am J Epidemiol 163(5):441e449.
87. Emaus N, Berntsen GK, Joakimsen RM, et al. 2005 Longitudinalchanges in forearm bone mineral density in women and menaged 25-44 years: the Tromso study: a population-based study.Am J Epidemiol 162(7):633e643.
88. Elgan C, Dykes AK, Samsioe G. 2004 Bone mineral densitychanges in young women: a two year study. Gynecol Endocrinol19(4):169e177.
89. The writing Group for the ISCD Position Development Confer-ence. 2004 Indications and reporting for dual-energy x-rayabsorptiometry. J Clin Densitom 7(1):37e44.
90. Adebajo A, Campbell L, Hitchcock J. 2006 Evaluating a nurse-ledDXA scanning service. Nurs Stand 20(51):35e39.
91. Berntsen GK, Tollan A, Magnus JH, et al. 1999 The Tromso Study:artifacts in forearm bone densitometryeprevalence and effect. Os-teoporos Int 10(5):425e432.
Volume 11, 2008