Periodic Patterns and Energy States of Buckled Films on ...
50
1 Periodic Patterns and Energy States of Buckled Films on Compliant Substrates S. Cai*, D. Breid**, A. J. Crosby**, Z. Suo* and J.W. Hutchinson* School of Engineering and Applied Sciences* Harvard University, Cambridge, MA 02138 Polymer Science and Engineering** University of Massachusetts, Amherst, MA Abstract. Thin stiff films on compliant elastic substrates subject to equi-biaxial compressive stress states are observed to buckle into various periodic mode patterns including checkerboard, hexagonal and herringbone. An experimental setting in which these modes are observed and evolve is described. The modes are characterized and ranked by the extent to which they reduce the elastic energy of the film-substrate system relative to that of the unbuckled state over a wide range of overstress. A new mode is identified and analyzed having nodal lines coincident with an equilateral triangular pattern. Two methods are employed to ascertain the energy in the buckled state: an analytical upper-bound method and a full numerical analysis. The upper-bound is shown to be reasonably accurate to large levels of overstress. For flat films, except at small states of overstress where the checkerboard is preferred, the herringbone mode has the lowest energy, followed by the checkerboard, with the hexagonal, triangular and one- dimensional modes lowering the energy the least. At low overstress, the hexagonal mode is observed in the experiments not the square mode. It is proposed that a slight initial curvature of the film may play role in selecting the hexagonal pattern accompanied by a detailed analysis. An intriguing finding is that the hexagonal and triangular modes have the same energy in the buckled state and, moreover, a continuous transition between these modes exists involving a linear combination of the two modes with no change in energy. Experimental observations of various periodic modes are discussed with reference to the energy landscape. Discrepancies between observations and theory are identified and open issues are highlighted. Keywords: Thin films, compliant substrates, buckling, wrinkling, mode transitions
Transcript of Periodic Patterns and Energy States of Buckled Films on ...

1
Periodic Patterns and Energy States of Buckled Films on Compliant Substrates
S. Cai*, D. Breid**, A. J. Crosby**, Z. Suo* and J.W. Hutchinson*
School of Engineering and Applied Sciences* Harvard University, Cambridge, MA 02138
Polymer Science and Engineering** University of Massachusetts, Amherst, MA
Abstract. Thin stiff films on compliant elastic substrates subject to equi-biaxial
compressive stress states are observed to buckle into various periodic mode patterns
including checkerboard, hexagonal and herringbone. An experimental setting in which
these modes are observed and evolve is described. The modes are characterized and
ranked by the extent to which they reduce the elastic energy of the film-substrate system
relative to that of the unbuckled state over a wide range of overstress. A new mode is
identified and analyzed having nodal lines coincident with an equilateral triangular
pattern. Two methods are employed to ascertain the energy in the buckled state: an
analytical upper-bound method and a full numerical analysis. The upper-bound is shown
to be reasonably accurate to large levels of overstress. For flat films, except at small
states of overstress where the checkerboard is preferred, the herringbone mode has the
lowest energy, followed by the checkerboard, with the hexagonal, triangular and one-
dimensional modes lowering the energy the least. At low overstress, the hexagonal mode
is observed in the experiments not the square mode. It is proposed that a slight initial
curvature of the film may play role in selecting the hexagonal pattern accompanied by a
detailed analysis. An intriguing finding is that the hexagonal and triangular modes have
the same energy in the buckled state and, moreover, a continuous transition between
these modes exists involving a linear combination of the two modes with no change in
energy. Experimental observations of various periodic modes are discussed with
reference to the energy landscape. Discrepancies between observations and theory are
identified and open issues are highlighted.
Keywords: Thin films, compliant substrates, buckling, wrinkling, mode transitions
2
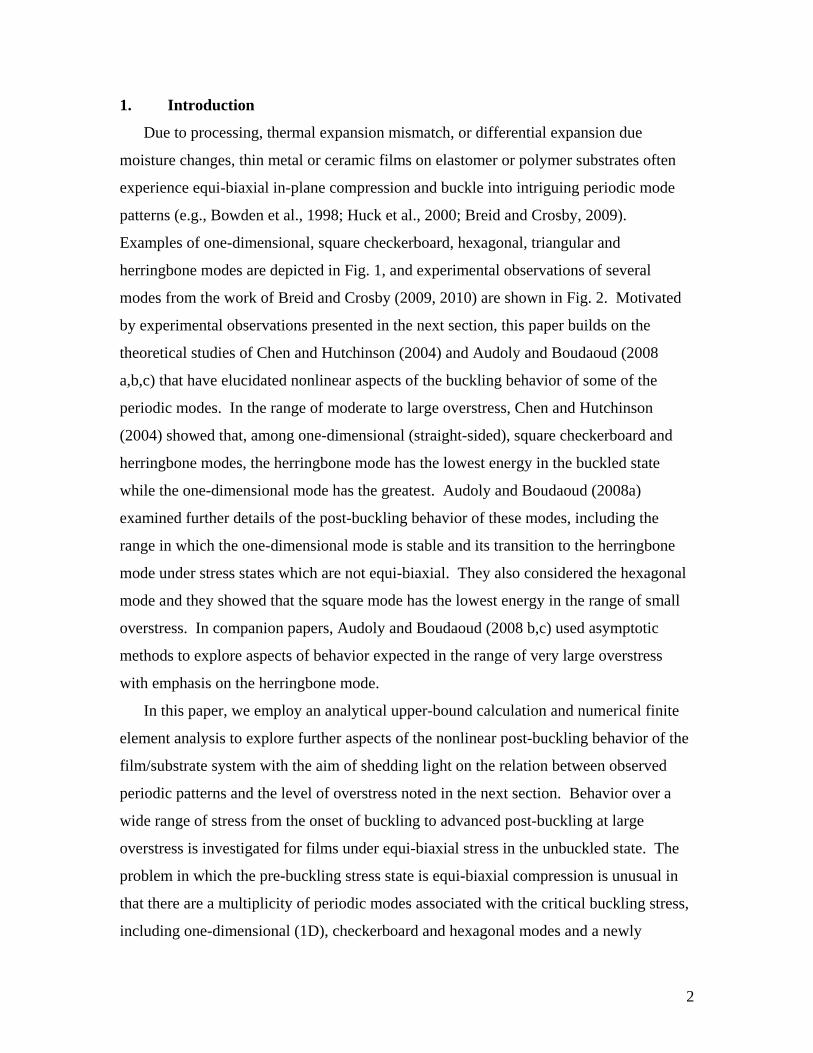
1. Introduction
Due to processing, thermal expansion mismatch, or differential expansion due
moisture changes, thin metal or ceramic films on elastomer or polymer substrates often
experience equi-biaxial in-plane compression and buckle into intriguing periodic mode
patterns (e.g., Bowden et al., 1998; Huck et al., 2000; Breid and Crosby, 2009).
Examples of one-dimensional, square checkerboard, hexagonal, triangular and
herringbone modes are depicted in Fig. 1, and experimental observations of several
modes from the work of Breid and Crosby (2009, 2010) are shown in Fig. 2. Motivated
by experimental observations presented in the next section, this paper builds on the
theoretical studies of Chen and Hutchinson (2004) and Audoly and Boudaoud (2008
a,b,c) that have elucidated nonlinear aspects of the buckling behavior of some of the
periodic modes. In the range of moderate to large overstress, Chen and Hutchinson
(2004) showed that, among one-dimensional (straight-sided), square checkerboard and
herringbone modes, the herringbone mode has the lowest energy in the buckled state
while the one-dimensional mode has the greatest. Audoly and Boudaoud (2008a)
examined further details of the post-buckling behavior of these modes, including the
range in which the one-dimensional mode is stable and its transition to the herringbone
mode under stress states which are not equi-biaxial. They also considered the hexagonal
mode and they showed that the square mode has the lowest energy in the range of small
overstress. In companion papers, Audoly and Boudaoud (2008 b,c) used asymptotic
methods to explore aspects of behavior expected in the range of very large overstress
with emphasis on the herringbone mode.
In this paper, we employ an analytical upper-bound calculation and numerical finite
element analysis to explore further aspects of the nonlinear post-buckling behavior of the
film/substrate system with the aim of shedding light on the relation between observed
periodic patterns and the level of overstress noted in the next section. Behavior over a
wide range of stress from the onset of buckling to advanced post-buckling at large
overstress is investigated for films under equi-biaxial stress in the unbuckled state. The
problem in which the pre-buckling stress state is equi-biaxial compression is unusual in
that there are a multiplicity of periodic modes associated with the critical buckling stress,
including one-dimensional (1D), checkerboard and hexagonal modes and a newly

3
identified triangular mode. The initial and advanced post-buckling behavior of all these
modes and the relations among them are studied here. In addition, results are obtained
for a herringbone mode which has the lowest energy of all the modes considered at
sufficiently large overstress. Because the herringbone mode is not one of the modes
associated with the onset of buckling, it is not favored at small overstress.
The model investigated analytically is a nonlinear von Karman plate bonded to a
linear elastic foundation; it is introduced in Section 3. A three-dimensional model of the
film and the substrate is employed in the numerical finite element simulations. For the
analytical model, the issue of the most appropriate traction conditions linking the plate to
the foundation, which was addressed by Audoly and Boudaoud (2008a), is considered
here in more detail. The various modes are introduced in Section 4. Upper-bounds to the
energy states are obtained in Section 5, supplemented by results from a finite element
analysis of the three-dimensional model given in Section 7. The role of an initial
spherical curvature of the film is addressed in Section 6 in an effort to explain some of
the apparent conflicts between theory and experimental observation identified in the next
section.
2. Experimental observations of mode patterns motivating theoretical issues
The relation between the buckling modes and overstress has been studied
experimentally for crosslinked polydimethylsiloxane (PDMS) substrates ( 1SE MPa ,
0.5S , thickness ~ 3mm) whose surfaces have been modified using an ultraviolet-
ozone (UVO) oxidation process to produce surface layers, or films, with increased
stiffness relative to the underlying non-modified elastomer substrate (Breid and Crosby,
2009; Breid and Crosby, 2010). Although the film modulus and thickness are not known
precisely, approximate values have been estimated by wrinkle wavelength measurements
(Chan and Crosby, 2006) and compared with published reflectivity measurements on
similar materials (Efimenko et al 2002; Mills et al 2008). The film thickness lies in the
range from 100 to 200 nm (Efimenko et al 2002, Mills et al 2008), while its modulus is
of order 10GPa (Chan and Crosby, 2006).
To induce wrinkling, the PDMS samples are placed in a sealed chamber
containing a reservoir of ethanol, which does not contact the samples. The ethanol vapor

4
is absorbed into the oxidized film to a greater extent than the underlying non-modified
elastomer, thus differential swelling between the two layers leads to the development of
an equi-biaxial compressive stress in the film. An increase in the UVO exposure time
results in a thicker oxide layer with a greater swelling extent, effectively increasing the
applied overstress. The applied swelling stress can be controlled alternatively by
changing the vapor pressure of ethanol (Breid and Crosby, 2010). For both cases, the
magnitude of the applied overstress is determined by measuring the curvature of
cantilever beams of the same composition exposed to the same vapor swelling conditions.
Conventional bi-layer beam bending mechanical models provide the values of the
average overstress in the film by relating the measured curvature of the beams to the
curvature measured at the critical buckling point. The magnitude of the applied strains
can be estimated by measuring the applied strain at the critical buckling point for
uniaxially compressed samples. Using these measurements, we estimate the total strains
to range from 0-10%, with a critical strain around 2-3%.
Fig. 3 collects observations from several experiments displaying the progression
of observed patterns for increasing levels of overstress. Throughout the paper, 0
denotes the equi-biaxial stress in the film in the unbuckled state, C is the critical value
of this stress at the onset of buckling, and the extent to which 0 / C exceeds unity is
referred to as the overstress. A pattern emerges in Fig. 3 at 0 / 1C with an almost
random array of low-amplitude undulations. We identify the lowest ethanol vapor
fraction at which these undulations are observed for a given UVO treatment time as the
critical buckling point, from which the following overstress values are calculated. At
slightly larger overstress, 0 / 1.3C , a distinct hexagonal pattern is evident with
central regions of all the hexagons deflected into the substrate. For 0 / 1.7C the
herringbone pattern is dominant with occasional defects. An exceptionally well
organized herringbone pattern is observed for the highest overstress shown, 0 / 4.1C ,
corresponding to the longest UVO treatment of 60 minutes.
The preference of our experimental system to assume the hexagonal mode at low
overstress is overwhelming, despite the fact that the square mode has been shown here
and previously to have lower energy in this range when the film/substrate system is flat.

5
Furthermore, we have only observed hexagonal patterns for which the regions inside the
hexagons buckle into the substrate (e.g. Figs. 2-4), while the theory developed later in the
paper for flat films/substrate systems predicts that buckling of the hexagonal regions into
or out of the substrate should be equally likely. One possible artifact of our experimental
system is the presence of low amplitude, laterally extensive curvature of the surface of
the system that exists initially or develops upon swelling in the “flat” UVO-PDMS
samples. This clue has been pursued theoretically in the paper. It will be seen that initial
spherical curvature of the film is likely to explain the two experimental observations cited
above that are otherwise inexplicable when the films are taken to be flat.
As the applied overstress increases beyond the formation of the hexagonal mode,
a transition point to more energetically favorable herringbone patterns is observed.
However, experimentally there is a tendency to maintain the hexagonal lattice of the
original pattern, perhaps due to kinetic considerations of forming an entirely new pattern
with different periodic wavelengths. The mechanism by which the hexagonal mode
transitions to a more energy-minimizing pattern is seen in Fig. 4. Starting from a pure
hexagonal pattern, slight increases in the overstress cause isolated hexagons to coalesce
with neighbors producing an extended local groove. The coalescing of a pair of hexagons
tends to also trigger the coalescing of a neighboring pair. These triggered pairs are
usually situated along a lattice line that is not parallel to that of the original pair, in order
to accommodate the local stress in an equi-biaxial manner. In some cases, these
coalesced grooves link to form even longer grooves, but in general they tend to remain
the product of just two or three hexagons. The overall result is a pattern that locally
resembles a “segmented labyrinth”, or a herringbone pattern with no global orientation,
analogous to the labyrinth pattern reported for homogeneously initiated wrinkling at high
overstress (Huang, Hong and Suo, 2005; Lin and Yang, 2007). In contrast, well-ordered
herringbone patterns develop for systems that bypass the lower energy buckling modes or
“jump” to high overstress values.
The experimental observations noted here have motivated us to look for a
theoretical explanation of why the square mode is never observed for our experimental
system even though under equi-biaxial stressing it has lower energy than the hexagonal
mode, assuming flat films. Moreover, a new triangular mode will be identified that has

6
precisely the same energy in the buckled state as the hexagonal mode, and this mode has
not been observed either. We also wish to explain why the hexagonal mode has always
been observed to buckle with the hexagonal regions directed into the substrate, while the
theory suggests there should be no such preference. These discrepancies between theory
and experiment have motivated other avenues of exploration in the theory, including the
roles of initial film curvature and nonlinearity of the substrate. Embedded within the
paper are several auxiliary findings: (i) The only modes whose nodal lines coincide with
a pattern formed by regular polygons are the equilateral triangle mode and square
mode—the so called “hexagonal mode” is formed from a mixture of hexagons and
triangles in the manner of a Kagome pattern. (ii) Among all rectangular checkerboard
modes, the square mode has the lowest energy. (iii) The hexagonal mode and triangular
mode have identical energy in the buckled state, to the order obtained here, and a
continuous transition exists from one to the other at constant energy. (iv) Within the
range of overstress considered in this paper, nonlinearity of the substrate has essentially
no influence on the buckling patterns. (v) A slight curvature of the film is likely to be
playing a critical role in the mode selection observed experimentally and in determining
the sign of the hexagonal deflection.
3. The analytical model
The film is described by the von Karman plate equations, and the infinitely deep
substrate under the film is characterized by linear elasticity. Both the film and the
substrate are taken to be isotropic and homogeneous. The process that produces the stiff
film in our experimental system almost certainly results in a modulus variation through
its thickness, maintaining in-plane isotropy. An inhomogeneous film of this type can be
replaced by a homogeneous film whose modulus and thickness are chosen to reproduce
the bending and stretching stiffness of the inhomogeneous film. This section begins by
listing the governing equations and by recording what are now well known results for the
critical stress and associated eigenmodes associated with the onset of buckling for
conditions in which the film is stressed in equi-biaxial compression. Such conditions
would arise, for example, if the substrates coefficient of thermal expansion were greater
than that of the film and a reduction in temperature took place or if the film were to

7
attempt to swell relative to the substrate under ingress of moisture or solvent, as in the
case of the experiments discussed in Section 2. There is some latitude in the formulation
of the model in the choice of conditions used to attach the film to the substrate and this
issue is investigated.
(3.1) The governing equations
Let t be the thickness of the film with fE and f as its modulus and Poisson’s
ratio. The substrate is taken to be infinitely deep with modulus and Poisson’s ratio,
SE and S . In Cartesian coordinates, 1 2( , )x x , the von Karman plate equations
representing the film are
411 ,11 22 ,22 12 ,12( 2 )f SD w N w N w N w p (3.1)
4 2,12 ,11 ,22
1
f
F w w wE t
(3.2)
Here, 3 2/ [12(1 )]f f fD E t is the film bending stiffness, 1 2( , )w x x is the vertical
displacement of the film middle surface, and 4 ( ) is the bi-harmonic operator. The
resultant in-plane stresses in the film are given in terms of the airy stress function, F , by
11 ,22N F , 22 ,11N F and 12 ,12N F .
The downward vertical traction exerted by the substrate on the deflected film
is Sp . As is customary in this model, horizontal tractions exerted on the film by the
substrate are neglected. For vertical deflections, 1 1 2 2ˆ cos( ) cos( )w w k x k x ,
1 1 2 2ˆ cos( ) cos( )Sp p k x k x with * 2 21 2ˆ ˆ / 2 Sp w E k k . Within the framework
described by (3.1) and (3.2), two choices of *SE have been made in nearly all earlier
studies: *S SE E (with 2/ (1 )S S SE E ) if tangential tractions on the substrate
interface are taken to be zero (Allen (1969) and many others following his work), while
* 2[4(1 ) / (3 4 )]S S S SE E if tangential displacements at the substrate interface are
taken to be zero (Huang, 2005; Audoly & Boudaoud, 2008). The actual conditions (i.e.
continuity of both tangential tractions and displacements across the film/substrate
interface) require tangential tractions to be taken into account in the film which leads to a

8
more complex formulation than that described by (3.1) and (3.2). This issue was
addressed by Audoly & Boudaoud (2008a) and will be discussed and further clarified at
the end of this section. As noted by Chen and Hutchinson (2004), the spread between
these two estimates vanishes if the substrate is incompressible (i.e.,
2[4(1 ) / (3 4 )] 1S S , if 1/ 2S ) and is still very small if 1/ 3S (i.e.,
2[4(1 ) / (3 4 )] 16 /15S S ). For the analytic upper-bound results presented later in
Section 4, the choice for *SE is left open. A three dimensional formulation is adopted for
the numerical calculations and full continuity will be imposed across the film/substrate
interface.
Denote the equi-biaxial compressive stress in the unbuckled film by 0 such that
2 20 1 2 / 2F t x x . With 1L and 2L as the periodicity lengths in the 1x and 2x
directions, supplementary compatibility conditions that ensure that the average
displacements tangent to the film are the same as those in the unbuckled state are
1 1
2 2
2,1
11 22 1 0 1 10 0
2,2
22 11 2 0 2 20 0
(1 )1
2
(1 )1
2
L Lff
f f
L Lff
f f
wN N dx L dx
E t E
wN N dx L dx
E t E
(3.3)
(3.2) The critical stress and associated buckling modes
The critical film stress, C , characterizing the onset of buckling is (Allen, 1969)
2/3*
34
f SC
f
E E
E
(3.4)
where 2/ (1 )f f fE E and *SE was introduced above. All modes satisfying
1 1 2 2
1 1 2 2
sin( ) sin( )
cos( ) cos( )
k x k xw
k x k x
with 1/32 2 1 *1 2 3 /S fk k k t E E (3.5)
are eigenmodes associated with C (Chen and Hutchinson, 2004).
(3.3) The critical buckling stress and the choice of *SE

9
We digress to present other estimates of C , including results of an exact
calculation, with the purpose of guiding the choice of *SE for the formulation laid out in
Section (3.1). For plane strain buckling in the 1 2( , )x x plane, three results are presented:
Case (I) Full continuity of tractions and displacements applied at the mid-plane of
the von Karman plate.
Case (II) Full continuity of tractions and displacements applied at the bottom
surface of the von Karman plate.
Case (III) The exact plane strain solution in which the film is treated as a pre-
stressed elastic layer of finite thickness with full continuity of tractions and displacements
applied at the interface between the film layer and the substrate.
Selected details underlying the calculations in these cases are presented in the Appendix.
The two possible choices of *SE noted Section (3.1), one based on zero tangential
tractions acting on the substrate and the other based on zero tangential displacements
imposed on the substrate, might be expected to predict critical stresses that bracket the
actual critical stress. This would indeed be true if Case (I) were a correct description.
This is seen in Fig. 5 for 1/ 3S where C from Case (I) falls just below the estimate
based on * 2[4(1 ) / (3 4 )]S S S SE E . However, Case (II) provides a more realistic
description, and the critical stress based on Case (II) lies above the estimate based on
* 2[4(1 ) / (3 4 )]S S S SE E . The result of the exact calculation, Case (III), is the
uppermost curve in Fig. 5.
Case (III), detailed in the Appendix, makes use of the exact formulation of Biot
(1965) and Hill and Hutchinson (1975) for the plane strain bifurcation analysis for an
incompressible pre-stressed layer of finite thickness which is coupled to the compliant
linear substrate through continuity of tractions and displacements. The exact results are
limited to 1/ 2f for the film, but this restriction should not be significant for the
comparisons in Fig. 5 because f does not play a role in any of the other estimates other
than through 2/ (1 )f f fE E . Fig. 6 displays the dependence of the exact predictions
for various substrate Poisson ratios. As 1/ 2S , all the estimates based on the plate

10
model approach 2/3( / 4)(3 / )C f S fE E E , and the exact result is only slightly greater.
Many recent experiments employ elastomeric substrates which are nearly incompressible.
For such systems the issue of the choice of *SE vanishes. Otherwise, within the
framework of the model Section (3.1) wherein only the normal traction exerted on the
film by the substrate is taken into account, it is clearly best to choose
* 2[4(1 ) / (3 4 )]S S S SE E , as concluded by Audoly and Boudaoud (2008a). As seen
in Fig. 5, this approximation will only underestimate the critical stress by several percent
for compliant substrates with 1/ 3S and / 0.001S fE E . These conclusions apply to
all of the critical modes satisfying (3.5) because each of them can be expressed as a
superposition of 1D plane strain modes.
4. The buckling modes
This paper will focus on four modes associated with the critical stress:
1D mode: 1cos( )w t kx (4.1)
Square checkerboard mode: 1 2
1 1cos( ) cos( )
2 2w t kx kx (4.2)
Hexagonal mode: 1 1 2
1 3cos( ) 2cos( ) cos( )
2 2w t kx kx kx
(4.3)
Equilateral triangular mode: 1 1 2
1 3sin( ) 2sin( ) cos( )
2 2w t kx kx kx
(4.4)
Aspects of the last three modes are depicted in Fig. 7. Each of these modes can be
expressed as a superposition of critical 1D modes. In coordinates 1 2( , )x x rotated 45o
from 1 2( , )x x , the checkerboard mode (4.2) can be re-expressed as
1 1 2cos( ) cos( ) / 2w t kx kx .1 With 1 2( 3 ) / 2x x x and 1 2( 3 ) / 2x x x , the
hexagonal mode (4.3) is 1(cos( ) cos( ) cos( ))w t kx kx kx . As noted in Fig. 7, the so-
1 Audoly and Boudaoud (2008a) use the superposition of the two 1D modes in their analysis of the square checkerboard mode. They incorrectly assert that Chen and Hutchinson (2004) did not consider the critical checkerboard mode, evidently due to the difference in the periodicity wavelengths in the two sets of axes.

11
called “hexagonal mode” is a periodic mix of hexagons and triangles in the form of a
Kagome pattern.
An alternative expression for (4.4) that more clearly reveals the triangular pattern is
1
1 1 14 sin sin sin
2 2 2w t kx kx kx
(4.5)
with 1 2( 3 ) / 2x x x and 1 2( 3 ) / 2x x x . The three sets of nodal lines in (4.5)
form the triangular grid in Fig. 7. Eq. (4.5) and (4.4) are identical, as readily shown by
trigonometric identities. Furthermore, they can be expressed as the sum of three critical
1D modes as 1( sin( ) sin( ) sin( ))w t kx kx kx .
When a flat film forms a pattern of wrinkles, a network of lines exists separating
regions where the film deflects up or down. These lines are known as the nodal lines. In
passing, it can be noted that the only periodic patterns of same-sized, regular polygons
that can form the nodal lines for periodic buckle modes are squares and equilateral
triangles. This assertion follows from the fact that these two shapes and the hexagon are
the only same-sized regular polygons that can tessellate a plane. Note from Fig. 7 that
the square and the triangular modes have alternating signs in neighboring cells, consistent
with the pattern edges being nodal lines. This is not possible for a pattern made up
entirely of hexagons because three hexagons come together at each corner. The
deflection in the “hexagonal” pattern (4.3) depicted in Fig. 7 has the same sign at the
center of all the hexagons and the opposite sign in all the triangles. The nodal lines are
closed loops within each of the hexagons. The importance of the asymmetry in the
deflection of the hexagonal mode (4.3) was noted in connection with the experiments.
A herringbone, or zigzag, mode will also be considered here. This pattern is not
associated with the critical stress. To motivate the mode shape employed, consider
vertical deflections of the film in a herringbone pattern having a wavy ridgeline with
uniform height, t , and wavelength, 22 / k , in the 2x direction:
1 1 2 2
1 1 2 2 1 1 2 2
cos cos( )
( / 2) cos cos cos( ) sin sin cos( )
w t kx a kx
t kx a kx kx a kx
(4.6)
For 1a , this deflection is well approximated by
12
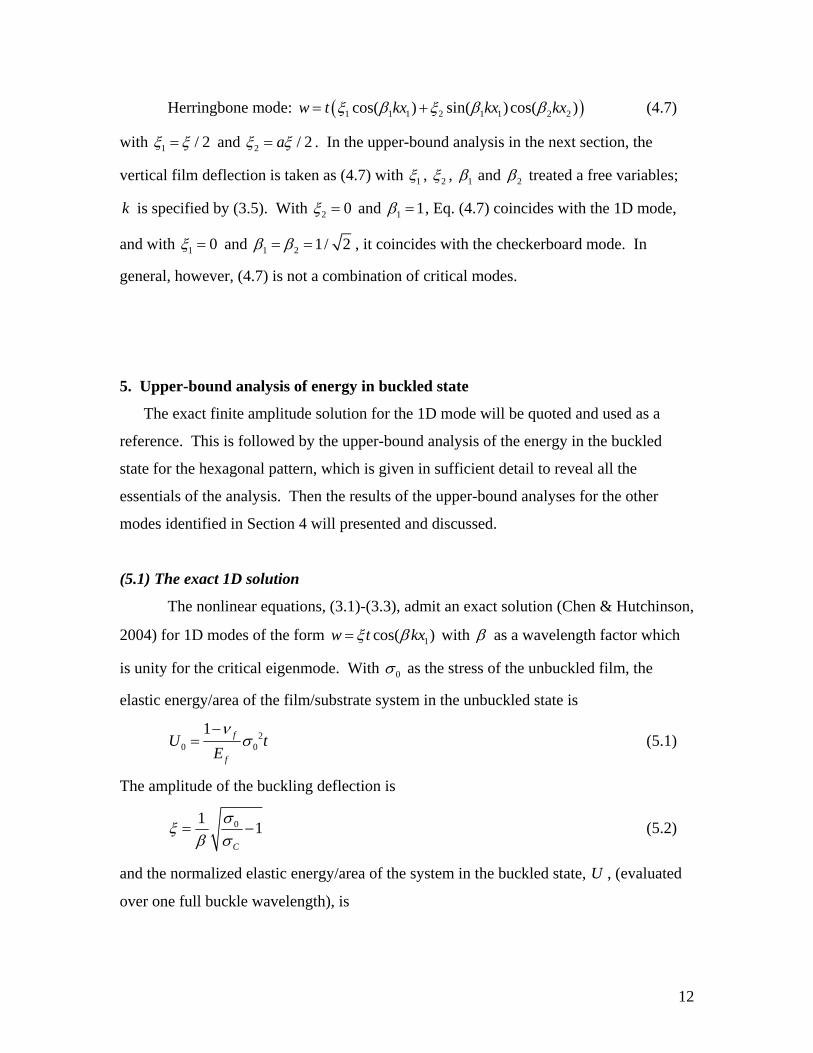
Herringbone mode: 1 1 1 2 1 1 2 2cos( ) sin( )cos( )w t kx kx kx (4.7)
with 1 / 2 and 2 / 2a . In the upper-bound analysis in the next section, the
vertical film deflection is taken as (4.7) with 1 , 2 , 1 and 2 treated a free variables;
k is specified by (3.5). With 2 0 and 1 1 , Eq. (4.7) coincides with the 1D mode,
and with 1 0 and 1 2 1/ 2 , it coincides with the checkerboard mode. In
general, however, (4.7) is not a combination of critical modes.
5. Upper-bound analysis of energy in buckled state
The exact finite amplitude solution for the 1D mode will be quoted and used as a
reference. This is followed by the upper-bound analysis of the energy in the buckled
state for the hexagonal pattern, which is given in sufficient detail to reveal all the
essentials of the analysis. Then the results of the upper-bound analyses for the other
modes identified in Section 4 will presented and discussed.
(5.1) The exact 1D solution
The nonlinear equations, (3.1)-(3.3), admit an exact solution (Chen & Hutchinson,
2004) for 1D modes of the form 1cos( )w t kx with as a wavelength factor which
is unity for the critical eigenmode. With 0 as the stress of the unbuckled film, the
elastic energy/area of the film/substrate system in the unbuckled state is
20 0
1 f
f
U tE
(5.1)
The amplitude of the buckling deflection is
011
C
(5.2)
and the normalized elastic energy/area of the system in the buckled state, U , (evaluated
over one full buckle wavelength), is

13
2
2 1 0
0 0
1 1 21 2 1
2 1 3f f C
f C
U
U
(5.3)2
As can be seen immediately, the minimum energy in the buckled state for the 1D mode is
given by 1 , corresponding to the critical mode at the onset of buckling, at all values
of overstress, 0 / 1C . The normalized energy with 1 is plotted in Figs. 8 and 9.
(5.2) Upper-bound analysis for the hexagonal mode
The analysis of the energy in the buckled state will be presented in enough detail
to bring out the essential analytical features. The approach was first used by von Karman
and Tsien (1941) in their attempt to expose the nonlinear buckling behavior of cylindrical
shells under axial compression. The analysis is similar in some respects to that employed
by Audoly & Boudaoud (2009a) but differs in that it makes no truncation in the
evaluation of energy. In particular, emphasis here is placed on the upper-bound character
of the results, and it will be shown that these estimates can be accurate to surprisingly
large overstress.
As the starting point, consider the generalization of the hexagonal mode (4.3):
1 1 2 1 2cos( ) cos( / 2)cos( 3 / 2)w t kx kx kx (5.4)
where 1 and 2 are independent amplitude factors and scales the size of the pattern.
(It will be seen that minimizing the energy of the system gives 2 12 and 1 for all
0 , thereby establishing that the critical hexagonal mode (4.3) is indeed preferred among
all modes of the form (5.4).) The first step is to solve the compatibility equation (3.2) for
F exactly in terms of w in (5.4).3 This ensures that in-plane displacements exist
associated with the resultant in-plane stresses, and it provides the basis for arguing that
the elastic energy of the system will be an upper-bound, i.e., the energy is computed from
admissible displacement fields. The result is
2 This equation is obtained from Eq. (12) of Chen and Hutchinson (2004). Eq. (13) of that paper, which
has been specialized to 1 , has a misprint: (1 )f in the last term should be (1 )f . 3 Audoly and Boudaoud (2008a) work directly with the in-plane displacements of the plate rather than the stress function. By doing so, they do not need to enforce the compatibility conditions on the average in-plane displacements (3.3). However, use of the stress function significantly simplifies the calculations by reducing algebraic complication especially when all the contributions are retained in evaluating the energy.

14
2 2 3 2
0 1 2 0 2 1 2 1 2
31 2 1 2 1 2
1 1 3 1cos( ) cos( 3 )
2 2 32 9
3 1cos( / 2)cos( 3 / 2) cos(3 / 2)cos( 3 / 2)
8 9
f
f
F tx tx E t kx kx
E t kx kx kx kx
(5.5)
The terms 1 and 2 are the reduction in the average in-plane stresses in the buckled
state; they are obtained from conditions (3.3) as
2 2
2 2 21 1 2 2 2
( ) 3 ( )1,
4(1 ) 8 32(1 )f f
f f
E t k E t k
(5.6)
The three contributions to the average energy/area of the system (plate bending
and stretching, and substrate deformation, respectively) are
2 2 2,12 ,11 ,22
2 2 2,12 ,11 ,22
*2 ( )2 ( )2 2 ( ) 2 ( )
1 2 1 1 2 2
( ) 2(1 )( )2
1( ) 2(1 )( )
2
cos ( )cos ( )4
ff
S
ffS
i i i iSi
iS
DU S w w w w dS
F F F F dSE t
Ek k k x k x dS
(5.7)
where S is the area of the periodic cell. The contribution from the substrate is valid for
any combination of modes of the form ( ) ( )1 1 2 2cos( ) cos( )i i
iw k x k x . For the results in
(5.4)-(5.6), the energy/area can be evaluated without approximation as
2
0 0 01 2 1 22
2 1 21 2 2 1 2
12 2(1 )
/ 2
1 1 52 8
3 2 128
fC f C C C C C C C
U
t E
(5.8)
Here, 2 2 21 1(1 )f , 2 2 2
2 2(1 )f , 1 1 2/ ( / 8) / (1 )C f and
2 2/ 3 / [8(1 )]C f . Minimizing the energy with respect to 1 2( , , ) is
equivalent to minimizing with respect to 1 2( , , ) . One sees immediately that the
minimum of U requires 1 for all 0 . It is then straightforward to show that the
equations for the minimum of U with respect to 1 and 2 are linear with solution
2 14 and 01 21
51
4C C C
(5.9)

15
It follows from (5.6) (with 1 ) that
01 2 2
1 21
2 11 6 5 Cf f
(5.10)
The normalized energy/area evaluated using (5.9) and (5.10) with 1 is
2 2
0 0
0 0
5(1 )1 2 1 1
11 5fC
C f C
U
U
(5.11)
As emphasized previously, (5.11) provides an upper-bound to the energy in the buckled
state for all hexagonal patterns by virtue of the fact that the energy is evaluated without
approximation using admissible displacement fields. Among the hexagonal modes, the
critical mode with 1 gives the minimum energy at all overstresses (Figs. 8 and 9).
(5.3) Upper-bound for the checkerboard mode
The upper-bound to the energy/area for any rectangular checkerboard modes of
the form (3.5) is a special case of the analysis of the herringbone mode given in the next
subsection. The following findings emerge. First, among all the critical rectangular
modes of the form (3.5) the square checkerboard mode has the lowest energy in the
buckled state. Secondly, among all sizes of square checkerboard patterns, the critical
mode (4.2) is found to give the lowest energy/area for all 0 . For this mode,
022 1
(3 )(1 )f f C
(5.12)
and
2 2
0 0
0 0
(1 )1 2 1 1
3fC
C f C
U
U
(5.13)
with the latter included in Figs. 8 and 9.
(5.4) Upper-bound for equilateral triangular modes
The upper-bound analysis carried out using (4.4) for the critical triangular mode
gives precisely the same result for the energy in the buckled state, (5.11), as for the
hexagonal mode. The buckling amplitude is related to the overstress by

16
0
2
21
11 6 5 Cf f
(5.14)
In addition, one can extend the analysis by considering equilateral triangular patterns of
any size and show that the upper-bound analysis predicts that the critical mode (4.4)
gives the lowest energy in the buckled state. Interaction of triangular and hexagonal
modes will be discussed in Section 6.
(5.5) Behavior of critical modes at small overstress
It is useful to compare the expansion of 0/U U for each the four critical modes for
small overstress with 0 / C slightly above 1:
2
0
0
1 1 ...C
Uq
U
(5.15)
1
2fq
(1D mode)
2
3 f
q
(square checkerboard mode)
6
11 5 f
q
(hexagonal and triangular modes)
To order 20( / 1)C , these results are exact for the model. This follows for the 1D
mode because (5.3) is exact for the entire range of overstress. For the other modes, the
exactness of these expansions to this order follows from the fact that the upper-bound
solution procedure is equivalent to a rigorous initial post-buckling analysis to this order
as laid out by Koiter (1945, 2009). We have independently verified that Koiter’s initial
post-buckling analysis yields the above results.
As established by Audoly and Boudaoud (2008a), the checkerboard mode has the
lowest energy in the range of small overstress. The other three modes having nearly
equal energies—the 1D mode has slightly lower energy than the hexagonal and triangular
modes if 1/ 5f and vise versa. Fig. 8 suggests that the same ordering of the energies
in the buckled state persists to large overstresses. The full numerical simulations in

17
Section 8 bear this out with the exception that the 1D mode has the highest energy for
0 / 3C .
Accompanying the asymptotic expression for the energy in the buckled state is the
asymptotic relation between the mode amplitude and 0 / C :
20 / 1Cb (5.16)
where b can be identified from (5.2), (5.10), (5.12) and (5.14):
1b (1D mode)
(3 )(1 )
8f fb
(square checkerboard mode)
211 6 5
4f fb
(hexagonal and triangular modes)
(5.6) Upper-bound for herringbone modes
The solution procedure based on the herringbone mode (4.7) is the same as that
presented for the hexagonal mode. The stress function is obtained exactly from (3.2) in
terms of (4.7) as
2 20 1 2 0 2 1
2 2
3 2 2 12 1 1 2 2
1 2
231 2
1 2 1 1 2 222 21 2
1 1
2 2
1cos(2 ) cos(2 )
32
( )sin(2 )cos( )
2 (2 )
f
f
F tx tx
E t kx kx
E t kx kx
(5.17)
Conditions (3.3) give
2
2 2 2 2 2 2 2 2 2 21 2 1 1 2 2 2 1 1 2 2 22
( ), 2 , 2
8(1 )f
f ff
E kt
(5.18)
The elastic energy in the buckled state is evaluated without approximation using w and
F with the result
18
2
0 0 01 2 1 22
24 2 2 2 21 1 1 2 2 1 1 1 2 2
44 4 2 1 2
1 2 2 1 222 21 2
12 2(1 )
/ 2
1 1 2 1
3 2 3 2
8( )1
16 (2 ) ( )
fC f C C C C C C C
U
t E
(5.19)
now with 2 21 1(1 )f , 2 2
2 2(1 )f and
2 2 2 21 21 1 2 2 2 1 1 2 2 22
1, 2 , 2
2(1 ) f fC C f
As remarked earlier, this result specializes to the exact 1D solution (5.3) when
minimized with respect to 1 and 1 with 2 0 . It has been used to generate the upper-
bound (5.10) for the square checkerboard mode by taking 1 0 and 2 1
followed by minimization of U with respect to 2 and . While U is quadratic in 1
and 2 , its dependence on 1 and 2 is too complicated to facilitate a closed form
solution for the minimum of U when both 1 and 2 are permitted to be nonzero.
Nevertheless, it is straightforward to generate a minimum for specified values of 0 / C
using standard numerical minimization algorithms, as has been done for the upper-
bounds to 0/U U for the herringbone mode plotted in Figs. 8 and 9.
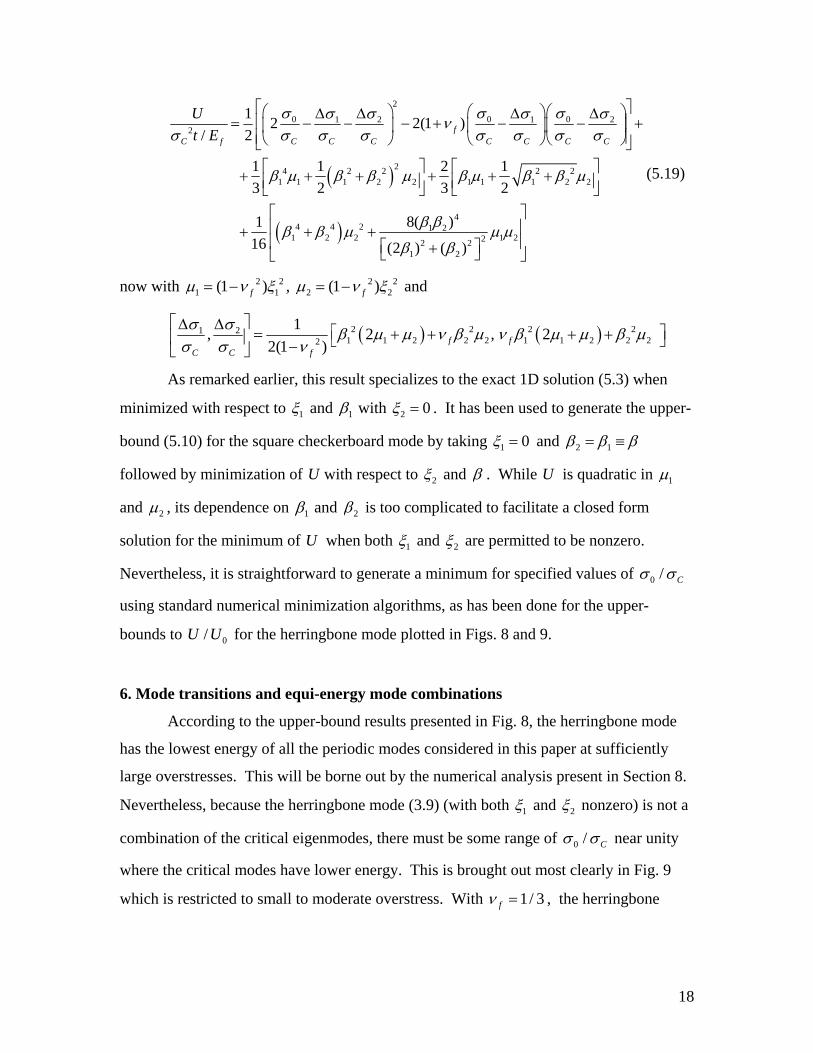
6. Mode transitions and equi-energy mode combinations
According to the upper-bound results presented in Fig. 8, the herringbone mode
has the lowest energy of all the periodic modes considered in this paper at sufficiently
large overstresses. This will be borne out by the numerical analysis present in Section 8.
Nevertheless, because the herringbone mode (3.9) (with both 1 and 2 nonzero) is not a
combination of the critical eigenmodes, there must be some range of 0 / C near unity
where the critical modes have lower energy. This is brought out most clearly in Fig. 9
which is restricted to small to moderate overstress. With 1/ 3f , the herringbone

19
mode has the lowest energy when 0 / 1.476C but in the range, 01 / 1.476C ,
the square checkerboard mode has the lowest energy of all the modes considered.
The herringbone mode arises as a bifurcation from the square checkerboard mode.
With 1 2 1/ 2 and minimizing the energy in (5.19) with respect to 1 and 2 , one
finds that bifurcation from the square mode ( 1 0 and 22 0 / 1Cb from (5.16))
into the herringbone mode with 1 0 occurs when
025(3 ) 2(26 )1
1 4 223(1 ) 6 25(3 )
f f
C f f
(6.1)
which gives 0 / 1.357C for 0fv ; 0 / 1.476C for 1/ 3fv ; and
0 / 1.595C for 1/ 2fv . This bifurcation stress is not exact because the solution for
the square mode is only exact to order 21 . However, it should be reasonably accurate
because the upper-bound analysis for the square mode is accurate to relatively large
values of the buckling amplitude, as the numerical analysis in Section 8 reveals.
An exact bifurcation analysis from the 1D mode was presented by Audoly and
Boudaoud (2008 a). The 1D mode is never the mode with the lowest energy when the
fundamental stress state is equi-biaxial compression. However, for fundamental stress
states that are not equi-biaxial, Audoly and Boudaoud present a map that defines the
domain of states wherein the 1D mode is the preferred mode with stress limits defining
the bifurcation transitions to other modes including the herringbone mode.
It has been noted in the previous section that the triangular mode and the
hexagonal mode have precisely the same energy in the buckled state at all values of
0 / C , according to the upper-bound analysis. With this in mind, we have investigated
whether linear combinations of these two critical modes exist, i.e.
1 1 2
1 1 2
sin( ) 2cos( / 2)cos( 3 / 2)
cos( ) 2cos( / 2)cos( 3 / 2) ,
T
H
w t kx kx kx
t kx kx kx
(6.2)
with the same energy. Here, to produce the correct coupling between the modes, the 1x
coordinate in the triangular mode in (4.4) has been shifted: 1 1 /x x k . The upper-
bound analysis can be carried out exactly with only slightly more algebraic complication

20
than that for the individual modes; the details will not be presented here. Remarkably,
one finds that all mode combinations satisfying
2 2 02
41
11 6 5T Hf f C
(6.3)
have the same energy, (5.11), while all other combinations have higher energy.
According to the upper-bound analysis, at all levels of overstress, there exists a
continuous mode transition connecting the triangular and hexagonal modes along which
the energy is constant. The transitional mode shapes along this path are displayed in Fig.
10 plotted as contour plots using (6.2) for pairs ( , )T H satisfying (6.3). Another
example of a continuous mode transition under increasing overstress will be presented in
Section 8.
7. Role of initial film curvature on the sign of the deflection and mode selection
As anticipated earlier, several aspects of the results obtained so far appear to be at
odds with the experimental observations in Section 2. In particular, the hexagonal pattern
is much more likely to be observed than the square checkerboard pattern in the range of
low overstress even though the square pattern has a lower energy. To our knowledge, the
triangular pattern has never been observed even though it has identical energy to the
hexagonal pattern, to the accuracy determined in this paper. In addition, in all instances
in which the hexagonal pattern has been observed by us, the regions interior to the
hexagons always deflect into the substrate (i.e. 0 in (4.3)).
It is straightforward to show that model specified in Section 3 implies that the
solutions are independent of the sign of the normal deflection. That is, if ( , )w F is a
solution to the governing equations, then so is ( , )w F . The numerical finite element
results of the 3D model with full coupling to the substrate presented in the next section
also reflect this symmetry, if not exactly, at least to high approximation. As described in
Section 2, the swelling of the film/substrate system produces a slight initial curvature of
the film such that the substrate is on the concave side of the surface. In this section, the
analysis presented in Section 5 will be extended to account for an initial curvature of the
film by modeling it as a shallow spherical shell.

21
Let R be the radius of curvature of the shallow spherical shell segment
representing the film defined positive with the concave side down. The model in Section
3 is modified by accounting for the curvature of the film. The effect of the curvature of
the substrate on the restoring force on the film, Sp , is ignored under the assumption that
the shell effect is dominant. The modified nonlinear equations are known as the Donnell-
Mushtari-Vlassov shell equations and are equivalent to the shallow shell equations; they
reduce to the Karman plate equations as R . The equations are modified as follows:
1 2R F is added to the left hand side of Eq. (3.1), 1 2R w is added to the right hand
side of Eq. (3.2), and 1R w is added to the integrand of the integral on right hand side of
both equations of (3.3). The expression for the energy of the system in (5.7) still holds.
Consider modes of the form
1 1 2 2cos cosw t kx kx (7.1)
with 1 and 2 as free variables and 1/31 *3 /Sk t E E as before. These modes are
restricted to a shallow segment of the shell, consistent with the fact that the wavelengths
are very small compared to R . The coordinates 1 2( , )x x are local orthogonal coordinates
in the middle surface of the shallow shell segment.
The bifurcation analysis gives the following equations for the critical stress, RC :
2 1 2 212 3
3
RC
C
f
with 4 23 0 (7.2)
and 2 21 2 .4 Here, C is still (3.4), and the dimensionless curvature parameter
is
2/3
2*
2 (1 )3
ff
S
Et
R E
(7.3)
4 A nonlinear analysis of buckling of an unsupported spherical shell subject to external pressure was carried out by Hutchinson (1967) based on the same equations. The normalizations in (7.1) and (7.2) break
down in the limit when * 0SE , but one finds the critical stress 2( / [ 3(1 ) ])RC f fE t R
associated with a similar family of short wavelength modes. The hexagonal pattern is the most unstable. A recent review of buckle patterns on curved compliant substrates of various shapes has been given by Chen and Yin (2010).

22
As in the case of the flat film, all modes of the form (7.1) with 2 21 2 are
associated with the critical stress. For 1 , as is the case for the experiments in
Section 2, the above equations give 2/ 1RC C and 21 to order 2 .
In the remainder of this section, the upper-bound analysis for the hexagonal mode,
1 1 2
1 3cos 2cos cos
2 2w t kx kx kx
, (7.4)
is presented based on an analysis similar to that in Section 5. In this analysis, is fixed
at the value given in (7.2). The stress function is
2 2 3 20 1 2 1 1 2
2 1 2
2
1 1 22 2
3 3cos( ) cos( / 2)cos( 3 )
2 8 41 1
cos( 3 / 2) cos(3 / 2)cos( 3 / 2)24 12
cos( ) 2cos( / 2)cos( 3 )
)
(f
f
tF x x E t kx kx kx
kx kx kx
E tkx kx kx
R k
(7.5)
with 2 2(3 / 2)(1 )f C . The strain energy from (5.7) is
2
2 1 2 2 2 2 202
2 3/2 2 3 2 2 4 4
3(1 ) (1 ) 3(1 )
/ 2
9 15(1 ) (1 )
2 8
f f fRC f C
f f
Uf f f
t E
(7.6)
As in the upper-bound analysis of the flat films, no approximation has been made in
arriving at (7.6) given (7.4) as the starting point.
Minimizing U with respect to gives
2 2
2 209 (1 ) 11 6 5
14 4
f f f
RC f f
(7.7)
which coincides with (5.10) when the curvature vanishes. The curvature introduces
asymmetry in the buckling response as is evident in the plot of (7.7) in Fig. 11. With
0 , the applied stress, 0 , initially diminishes after bifurcation when the buckling
mode amplitude, , is negative. The bifurcation point is unstable, and the system is
highly sensitive to imperfections that “push” it towards negative (Koiter, 1945; 2009).
This asymmetry is due to shell curvature not the placement of the substrate. The

23
implication of (7.7) is that there is a preference for hexagonal regions to buckle towards
the concave side of the film—“inward” as opposed to “outward” in the following
discussion. According to the model, this would still be true if the substrate were attached
to the convex side of the film.
The normalized energy in the buckled state, 0/U U , computed as function of
overstress, 0 / RC , using (7.6) and (7.7), is plotted in Fig. 12. The energy associated
with inward buckling of the hexagonal regions is significantly lower than that associated
with outward buckling. It should be noted that the plot in Fig. 12 has been limited to
states with 0 / 1RC . The energy for 0 / 1R
C when 0 is only very slightly
below unity for the values of considered in Fig. 12, as can be inferred from the
intercepts at 0 / 1RC .
The asymmetry in buckling response with respect to the amplitude of the
hexagonal mode does not occur for either the triangular mode or the square checkerboard
mode because the opposite-signed regions of these bifurcation modes are identical. More
importantly, the upper-bound calculation for the square mode (details omitted) reveals
that the normalized relationship, 0/U U versus 0 / RC , is independent of . For the
square mode, 1 2cos( / 2) cos( / 2)w t kx kx , (7.2) applies and 0/U U is given by
(5.13) with 0 / C replaced by 0 / RC .
The question of whether a slight curvature can account for the preference for the
hexagonal mode over the square mode in the range of small overstress can now be
addressed based on the assumption that the mode with the lowest energy is the most
likely to be observed. For specified a value of 0 / RC , Fig. 13 plots the value of for
which the energy of the hexagonal mode (buckling inward) equals that of the square
mode. For to the left of the curve the square mode is preferred while to the right of
the curve the hexagonal mode is preferred. The value of required to favor the
hexagonal mode over the square mode is very small for very small overstress,
approaching zero in the limit of zero overstress. Thus, any initial curvature would tend to
select the hexagonal mode for a perfect system subject to increasing stress such that
0 / RC exceeds unity from below. Initial imperfections will play some role in promoting

24
individual modes. Imperfections are also likely to favor hexagonal over square patterns
in the presence of curvature because buckling inward in the hexagonal mode is unstable
and strongly imperfection-sensitive, whereas the square mode is not imperfection-
sensitive. Imperfection-sensitivity causes the amplitude of the hexagonal mode to be
amplified more than the others, assuming there exists an imperfection component in the
shape of the mode.
The observed hexagonal mode in Fig. 3 is fully developed at 0 / 1.3RC . It is
reasonable to assume that this mode has been “selected” for 0 / 1.1RC . Based on Fig.
13, curvature would ensure the selection of the hexagonal mode under this circumstance
if 0.025 . To estimate the implication for the experimental system described in
Section 2, re-express using the wavelength of the hexagonal mode, 4 / ( 3 )L k :
2 22 2
2 2
3 1 3 1
8 8f fL L
RtR t
(7.8)
With 0.025 , 50L m (c.f. Fig. 2) and 100t nm , one finds 40R mm . For a
specimen width 10mm , this curvature would imply a rise of 0.3mm at the center of the
specimen relative to its edges. If, instead, one assumed the hexagonal mode was selected
at 0 / 1.01RC such that 0.01 , then (7.8) gives 100R mm and the relative rise at
the center of the specimen would be 0.13mm . Direct measurements of the initial
curvature of the specimens have not been made, however, the above curvature estimates
are not inconsistent with observations made by eye. Thus, tentatively, we have
concluded that curvature is the source of the preference for the hexagonal mode to buckle
inward and for the hexagonal mode to be favored over the square mode. Initial curvature
of the system would also explain why the triangular mode has not been observed.
8. Numerical analysis of nonlinear buckling of periodic patterns
The finite element code, ABAQUS (www.simulia.com), has been used to carry out
three dimensional analyses for all the patterns described in the Section 4 for films that are
flat in the unbuckled state. For each of the patterns, a periodic cell is identified. Both the
film and the substrate are meshed with 8 node linear block elements with reduced
integration. The film is represented by 8 layers of elements with approximately 1,500

25
elements in each layer of the cell. The substrate has depth d which is taken to be five
times the largest periodicity wavelength and its bottom surface is prescribed to have zero
displacement. The substrate is represented by approximately 120,000 elements uniformly
distributed in 100 layers. The material for film and substrate are taken to be described
by linear isotropic elasticity, except for a few simulations for the hexagonal pattern where
a neo-Hookean substrate has been assumed to explore whether substrate nonlinearity is
important. The nonlinear geometric updating option of ABAQUS is employed. Stress in
the film is induced by a thermal expansion mismatch with the substrate by imposing a
temperature drop T starting from the unstressed state. For this purpose, the film is
assigned a thermal expansion coefficient while the substrate is assumed to have zero
thermal expansion. For all calculations, / 3465f SE E with 1/ 3f and 0.48S .
For each mode, periodic boundary conditions are imposed on the edges of the
film/substrate cell. In all cases, the cell dimensions are set by the wavelengths associated
with the critical modes introduced in Section 4, consistent with the fact that the upper-
bound analysis suggests these produce the lowest energy states even at finite deflection.
A very small initial geometric imperfection in the form of a stress-free out-of-flatness in
the shape of the buckling mode is used to promote the mode. Specifically, with any
mode in Section 4 denoted by 1 2( , )w t f x x , the initial imperfection for that mode is
taken as 1 2( , )w t f x x with set at 0.01.
The 1D mode was simulated as a check on accuracy given the availability of the
exact solution of the model problem for this case. A rectangular parallelepiped unit cell
of dimension L L d was employed with 2 /L k and 5d L . As the initial
imperfection has variation in only one direction, the induced mode varies only in that
direction. The mode shape is projected over many cells and plotted in Fig. 1a. The
normalized energy in the buckled state is plotted in Fig. 14. It agrees with the exact
solution for the model in (5.3) (with 1 ) to within one or, at most, two percent over
the entire range plotted.
The square checkerboard mode uses the same unit cell as the 1D mode except
that 2 2 /L k and the imperfection is in the shape of the square mode. In this case
the square mode is generated (Fig. 1b) and the normalized energy is plotted in Fig. 14.

26
The numerical result is very close to the upper-bound prediction for 0/U U in Fig. 8 for
0 / 4C and falls no more than 3% below the upper-bound for 0 / C as large as 10.
The unit cells for the hexagonal mode and the equilateral triangular mode are
hexagonal prisms as depicted in outline in Fig. 7. For the hexagonal mode the distance
across the cell from face to face is 4 / 3k while the face to face distance of the cell for
the triangular mode is 4 / k . An imperfection in the shape of the mode is introduced for
each calculation as described above. In addition, for the hexagonal mode, calculations
with both positive (hexagon centers deflecting outwards, 0 ) and negative ( 0 )
imperfections are preformed. The mode shapes are shown in Fig. 1 and the results for
0/U U are plotted in Fig. 14. There is virtually no difference between the energy in the
buckled state for inward and outward deflections of the hexagons, although there are
slight differences in the deflections themselves when 0 / C is large. Unlike the plate
model, the 3D model of the system is not strictly independent of the sign of the normal
deflection of the film, but it is evident from Fig. 14 that the difference is extremely small
for the overstress range considered. Similarly, as the upper-bounds for the plate model
predict, Fig. 14 reveals that there is virtually no difference between 0/U U for the
triangular and hexagonal modes. The upper-bound is quite accurate for 0 / 3C and
then begins to diverge for larger overstress; it becomes increasingly inaccurate for larger
overstress with 0/ 0.40U U from the numerical analysis and 0/ 0.48U U from the
bound at 0 / 10C . Nevertheless, it is quite remarkable that the bound is highly
accurate to overstresses as large as three times the critical stress.
An intriguing mode transition occurred in the numerical simulation for the
triangular mode which is displayed in Fig. 15. As expected, the deflection initially
assumes the shape of the triangular pattern as the overstress is increased due to the
assumed initial imperfection, but at a certain level of overstress ( 0 / 2.4C in Fig. 15)
the mode begins to develop an asymmetry not present in the initial mode. When
0 / 3.4C the transition to a three-lobed asymmetric pattern is fully developed, and
new mode persists as the overstress is further increased. A transition from the triangular
mode to the hexagonal mode did not occur in these simulations because the size of the

27
computational cell for the triangular mode was larger by a factor 3 than that for the
hexagonal cell.
One other set of finite element calculations for the hexagonal mode was carried
out to gain further insight into the observed preference for this mode to buckle into the
substrate at the centers of the hexagons. Recent work (Brau et al., 2010; Sun et al., 2010)
has shown that the nonlinearity of the substrate affects the mode shape at very large
overstress when the slopes of the film become large. In the present calculations, the neo-
Hookean material is used to represent the substrate. Positive and negative imperfections
were considered so as to promote both inward and outward deflections of the hexagonal
model. The substrate material (the neo-Hookean option in ABAQUS) was taken to have
the same slight compressibility ( 0.48S ) and modulus ( / 3465f SE E ) in the ground
state as the linear material used in all the other calculations. The results of these
calculations are shown in Fig. 16 where it is seen that they are essentially
indistinguishable from the predictions based on the linear substrate. Even at 0 / 10C
the deflection of the film is still too small to push the substrate into the nonlinear range.
If / 1000f SE E , it is easy to show that the maximum slopes of the film are only on the
order of 1/10 for 0 / 10C . Thus, the period doubling seen by Brau et al. (2010) and
Sun et al. (2010) and the hierarchical wrinkling seen by Efimenko et al. (2005) are not
expected in the range of overstress considered in this paper.
An extensive numerical analysis of the herringbone mode for a 3D model which
uses plate theory to model the film was conducted by Chen and Hutchinson (2004). The
reader is referred to that study for details of the cell geometry and how that geometry was
varied to produce herringbone modes with minimum energy in the buckled state. Here
we have employed the parameters of the cell found by Chen and Hutchinson to give the
minimum, or near-minimum, energy—a cell with width 2 /L k perpendicular to the
ridge lines and with a ridge kink angle of 90o . The pattern is displayed in Fig. 1e, and
0/U U is plotted in Fig. 14. As the upper-bound analysis had predicted, the herringbone
mode has the lowest energy in the buckled state among all the modes considered for all
0 / C greater than about 1.5. The upper-bound is less accurate for the herringbone

28
mode than the other modes, no doubt due to the fact that the assumed deflection in (4.7)
is itself an approximation to a herringbone mode. Thus, at 0 / 3C the bound is about
10% higher than the numerical result and at 0 / 10C it is more than 30% too high.
In summary, the numerical analysis of the 3D model of the film/substrate system
indicates: (i) The present results for the square and herringbone modes are almost
identical as those found by Chen and Hutchinson (2004) for a 3D model in which the film
is modeled by plate theory. (ii) With the exception of the herringbone mode, the upper-
bound results in Section 4 are reasonably accurate to surprisingly large overstresses as
large as three or four times C . (iii) The models for initially flat films, including the
incorporation of nonlinearity in the substrate, do not indicate any appreciable difference
between inward and outward buckling of the hexagonal mode, nor is substrate
nonlinearity important for the range of overstress considered in this paper.
9. Concluding remarks
Many details of the energy landscape in the buckled state of the periodic modes
considered here have been revealed by making use of the analytical upper-bound method
in combination with the 3D finite element analysis for systems that are flat in the
unbuckled state. The upper-bound retains its accuracy to surprisingly large overstresses
for the critical modes. Based on the notion that the mode with the minimum energy is the
most likely to be observed, the square mode should be the dominant mode for
overstresses, 0 / C , below about 1.5 and the herringbone mode should emerge at
overstresses above that. The herringbone mode does begin to emerge in our experiments
for 0 / 1.5C , but the observed mode below this is the hexagonal mode not the square
mode. Moreover, in all cases in which we have observed the hexagonal mode, it buckles
with the hexagonal regions pushing into the substrate whereas theory suggests there
should be no preference. We have established that a slight initial curvature of the film
could explain the two discrepancies just noted and the fact that the triangular mode has
not been observed in our experiments even though it has the same energy as the
hexagonal mode when the system is initially flat. The magnitude of the initial curvature
observed in our system appears to be consistent with the curvature level needed to

29
explain the discrepancies but quantitative measurements necessary to establish this as a
certainty have not been made.
As just noted, for flat film/substrate systems, theory suggests that the square mode
should be observed in the range of low overstress and it should give way to the
herringbone mode with increasing overstress. However, in the range of low overstress
there is a rich array of competing modes with energies that are only slightly separated.
Mode selection based on minimum energy considerations has its limitations. The attempt
initiated by von Karman and Tsien (1941) to understand the post-buckling and collapse
of cylindrical shells under axial compression provides an illustration of the limitations.
Following the work of von Karman and Tsien, many papers were written aimed at more
and more accurate evaluation of the energy in the collapsed state. Nevertheless, no clear
understanding emerged as to the relevance of minimum energy states to the load carrying
capacity and collapse behavior of the shell. It was not until Koiter (1945) emphasized the
importance of initial imperfections and included them in his approach that the highly
unstable buckling behavior of cylindrical shells under axial compression was related to
the strong imperfection-sensitivity of the maximum load carrying capacity. Unlike
cylindrical shells, the film wrinkling problem for flat films has a stable buckling behavior
and is not imperfection-sensitive in the way the shell is. Nevertheless, initial
imperfections may be playing a role in mode selection given the small difference in
energy between the modes when the overstress is small. If imperfections are included in
the analysis, as Koiter (1945, 2009) has done in his general theory, the development of a
specific mode is promoted by imperfections in the shape of that mode.
Once a periodic mode pattern develops there is a barrier to its evolving to another
periodic mode with different wavelengths even if the other mode has lower energy.
Several examples where transitions from one mode to another occur continuously without
a “jump” in wavelengths were presented in the paper, including the transition from the
triangular to the hexagonal mode and the experimental observation of the hexagonal
mode evolving into a herringbone mode. Bifurcation from the square mode into the
herringbone mode is another example. In conclusion, this paper has shed further light on
the wrinkling behavior of films under equal biaxial stress states. It has also exposed a
number of open questions highlighting the richness of the nonlinear buckling phenomena.

30
Acknowledgements
S. Cai, Z. Suo and J.W. Hutchinson acknowledge the support of the MRSEC at Harvard.
S. Cai and Z. Suo also acknowledge the support of National Science Foundation on Soft
Active Materials (CMMI-0800161). D. Breid and A. Crosby acknowledge the financial
support of the National Science Foundation Materials Research Science and Engineering
Center (MRSEC) on Polymers at the University of Massachusetts Amherst (NSF-DMR
0820506 ).

31
References
Allen, H. G., 1969, Analysis and design of sandwich panels. Pergamon Press, New York. Audoly, B, Boudaoud, A., 2008a, Buckling of a thin film bound to a compliant substrate—Part I: Formulation, linear stability of cylindrical patterns, secondary bifurcations. J. Mech. Phys. Solids 56, 2401-2421. Audoly, B, Boudaoud, A., 2008b, Buckling of a thin film bound to a compliant substrate—Part II: A global scenario for the formation of herringbone pattern. J. Mech. Phys. Solids 56, 2422-2443. Audoly, B, Boudaoud, A., 2008c, Buckling of a thin film bound to a compliant substrate—Part III: Herringbone solutions at large buckling parameter. J. Mech. Phys. Solids 56, 2444-2458. Biot, M.A., 1965, Mechanics of incremental deformation. Wiley, New York. Bowden, N., Brittain, S., Evans, A.G., Hutchinson, J.W., Whitesides, G.M., 1988. Spontaneous formation of ordered structures in thin films of metals supported on an elastomeric polymer. Nature 393, 146-149. Brau, F., Vandeparre, H., Sabbah, A., Poulard, C., Boudaoud, A., Damman, P., 2010. Multiple-length-scale elastic instability mimics parametric resonance of nonlinear oscillators. To be published in Nature Materials. Breid, D., Crosby, A.J., 2009. Surface wrinkling behavior of finite circular plates. Soft Matter 5, 425-431. Breid, D., Crosby, A.J. 2010. in preparation for publication. Chan, E.P., Crosby, A.J., 2006. Spontaneous formation of stable aligned wrinkling patterns. Soft Matter, 2, 324-328. Chen, X., Hutchinson, J.W., 2004. Herringbone buckling patterns of compressed thin films on compliant substrates. J. Appl. Mech. 71, 597-603. Chen, X., Yin, J., 2010. Buckling patterns of thin films on curved compliant substrates with applications to morphogenesis and three-dimensional micro-fabrication. Soft Matter, 6, 5667-5680. Efimenko, K., Wallace, W.E., Genzer, J., 2002. Surface modification of sylgard-184 poly(dimethyl siloxane) network by ultraviolet and ultraviolet/ozone treatment. J. Colloid Interface Sci. 254, 306-315.

32
Efimenko, K., Rackaitis, M., Manias, E., Vaziri, A., Mahadevan, L., Genzer, J., 2005. Nested self-similar wrinkling patterns in skins. Nature Materials, 4, 293-297. Hill, R., Hutchinson, J. W., 1975. Bifurcation phenomena in the plane tension test. J. Mech. Phys. Solids 23, 239-264. Huang, Z.Y. Hong, W., Suo, Z., 2005. Nonlinear analyses of wrinkles in a film bonded to a compliant substrate. J. Mech. Phys. Solids 53, 2101-2118.
Huang, R., 2005. Kinetic wrinkling of an elastic film on a viscoelastic substrate. J. Mech. Phys. Solids 53, 63-89. Huck, W., Bowden, N., Onck, P., Pardoen, T., Hutchinson, J.W., Whitesides, G.M., 2000. Ordering of spontaneously formed buckles on planar surfaces. Langmuir 16, 3497-3501. Hutchinson, J.W., 1967. Imperfection sensitivity of externally pressurized spherical shells. J. Appl. Mech. 48-55. Koiter, W.T., 1945. On the stability of elastic equilibrium (in Dutch with English summary). Thesis Delft, H.J. Paris, Amsterdam. An English translation is available online: http://imechanica.org/node/1400 . Koiter, W.T., 2009. Elastic stability of solids and structures. A.M. van der Heijden (Ed.), Cambridge University Press, Cambridge. Lin, P.-C., Yang, S., 2007. Spontaneous formation of one-dimensional ripples in transit to highly ordered two-dimensional herringbone structures through sequential and unequal biaxial mechanical stretching. Appl. Phys. Lett. 90, 241903. Mills, K.L., Zhu, X., Takayama, S., Thouless, M.D., 2008. The mechanical properties of a surface-modified layer on poly(dimethylsiloxane). J. Mater. Res. 23, 37-48. Sun, J-Y., Xia, S., Moon, M-Y., Oh, K.H., Kim, K-S., 2010. Folding wrinkles of a thin stiff layer on a soft substrate. submitted for publication. Von Karman, T., Tsien, H.S., 1941. The buckling of cylindrical shells under axial compression. J. Aero. Sci. 8, 303-312.
33
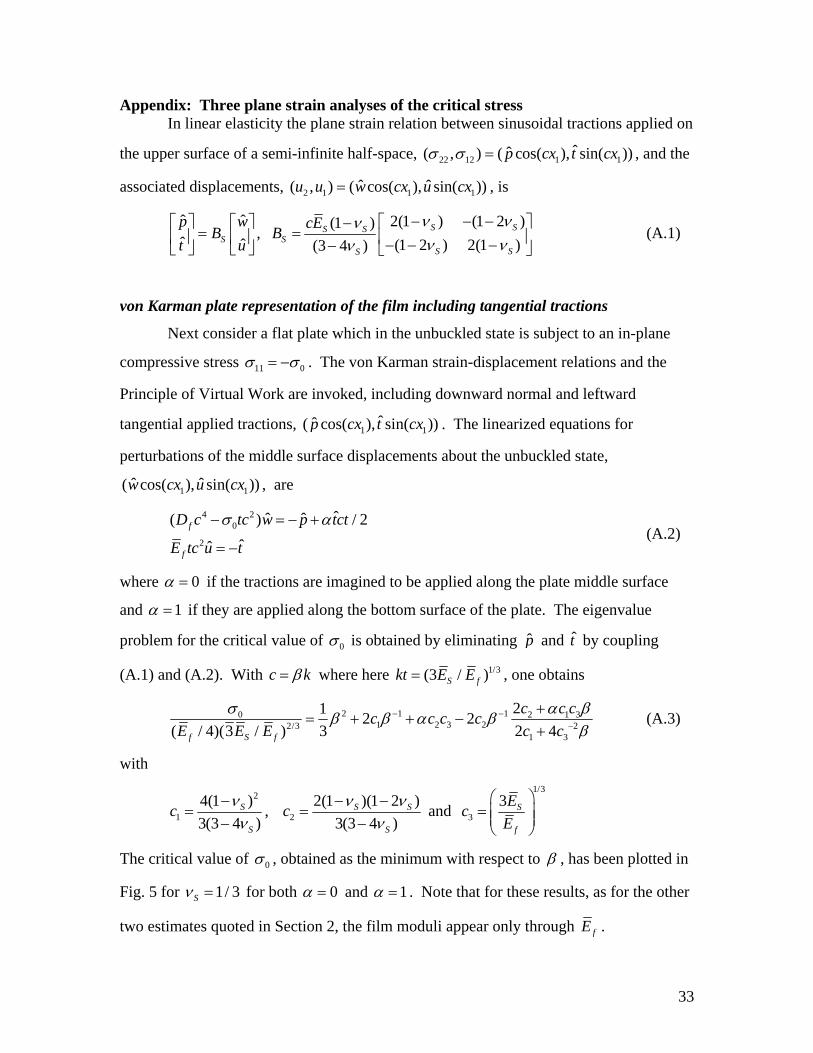
Appendix: Three plane strain analyses of the critical stress In linear elasticity the plane strain relation between sinusoidal tractions applied on
the upper surface of a semi-infinite half-space, 22 12 1 1ˆˆ( , ) ( cos( ), sin( ))p cx t cx , and the
associated displacements, 2 1 1 1ˆ ˆ( , ) ( cos( ), sin( ))u u w cx u cx , is
ˆ ˆ 2(1 ) (1 2 )(1 )
,ˆ ˆ (1 2 ) 2(1 )(3 4 )
S SS SS S
S SS
p w cEB B
t u
(A.1)
von Karman plate representation of the film including tangential tractions
Next consider a flat plate which in the unbuckled state is subject to an in-plane
compressive stress 11 0 . The von Karman strain-displacement relations and the
Principle of Virtual Work are invoked, including downward normal and leftward
tangential applied tractions, 1 1ˆˆ( cos( ), sin( ))p cx t cx . The linearized equations for
perturbations of the middle surface displacements about the unbuckled state,
1 1ˆ ˆ( cos( ), sin( ))w cx u cx , are
4 2
0
2
ˆˆ ˆ( ) / 2
ˆˆ
f
f
D c tc w p tct
E tc u t
(A.2)
where 0 if the tractions are imagined to be applied along the plate middle surface
and 1 if they are applied along the bottom surface of the plate. The eigenvalue
problem for the critical value of 0 is obtained by eliminating p̂ and t̂ by coupling
(A.1) and (A.2). With c k where here 1/3(3 / )S fkt E E , one obtains
2 1 10 2 1 31 2 3 22/3 2
1 3
212 2
( / 4)(3 / ) 3 2 4f S f
c c cc c c c
E E E c c
(A.3)
with
2
1
4(1 )
3(3 4 )S
S
c
, 2
2(1 )(1 2 )
3(3 4 )S S
S
c
and
1/3
3
3 S
f
Ec
E
The critical value of 0 , obtained as the minimum with respect to , has been plotted in
Fig. 5 for 1/ 3S for both 0 and 1 . Note that for these results, as for the other
two estimates quoted in Section 2, the film moduli appear only through fE .

34
The exact solution for the critical stress
In this analysis, the film is taken to be a uniformly pre-stressed layer of thickness
t that is attached along its bottom surface to the compliant substrate along the interface at
2 0x . The film layer is taken to be incompressible and undergoes incremental plane
strain deformations. Incompressibility facilitates the exact bifurcation analysis of the
system using the formulation of Biot (1965) and Hill and Hutchinson (1975). As noted
earlier, the assumption of an incompressible film layer is not expected to reduce the
applicability of the results since for all the other estimates only the plane strain modulus
of the film, fE , appears in the results. The film layer is coupled to the substrate which
has no pre-stress and is governed by (A.1). The reader is referred to Hill and Hutchinson
(1975) for the general formulation. Here only an outline of the results will be presented.
A displacement potential, 1 2 2 1( , ) (1/ ) ( )sin( )x x c W x cx is used to represent the
perturbations of the displacements from the uniform pre-buckling state within the layer
1 2 1 2 1(1/ ) / sin( ), cos( )u c dW dx cx u W cx (A.4)
The general solution to the governing field equation for is
2 2 2 22 1 2 3 4( ) cx cx dcx dcxW x a e a e a e a e (A.5)
with 0 01 2 / / 1 2 /f fd E E . The perturbed tractions vanish on the upper
surface of the layer at 2x t if
( 1) ( 1)
1 3
( 1) ( 1)2 4
,d ct d ct
B Ad ct d ct
A B
a a c e c eM M
a a c e c e
(A.6)
where
3 20 0
3 20 0
11 2 3 2 1
4
11 2 3 2 1
4
Af f
Bf f
c d d dE E
c d d dE E
Both (A.6) and 2 1 1 1ˆ ˆ( , ) ( cos( ), sin( ))u u w cx u cx along 2 0x will be satisfied if
( 1) ( 1) ( 1) ( 1)
3
( 1) ( 1) ( 1) ( 1)4
ˆ 1 1,
ˆ
d ct d ct d ct d ctB A A B
d ct d ct d ct d ctB A A B
a w c e c e c e c eA A
a u c e c e d c e c e d
(A.7)
35
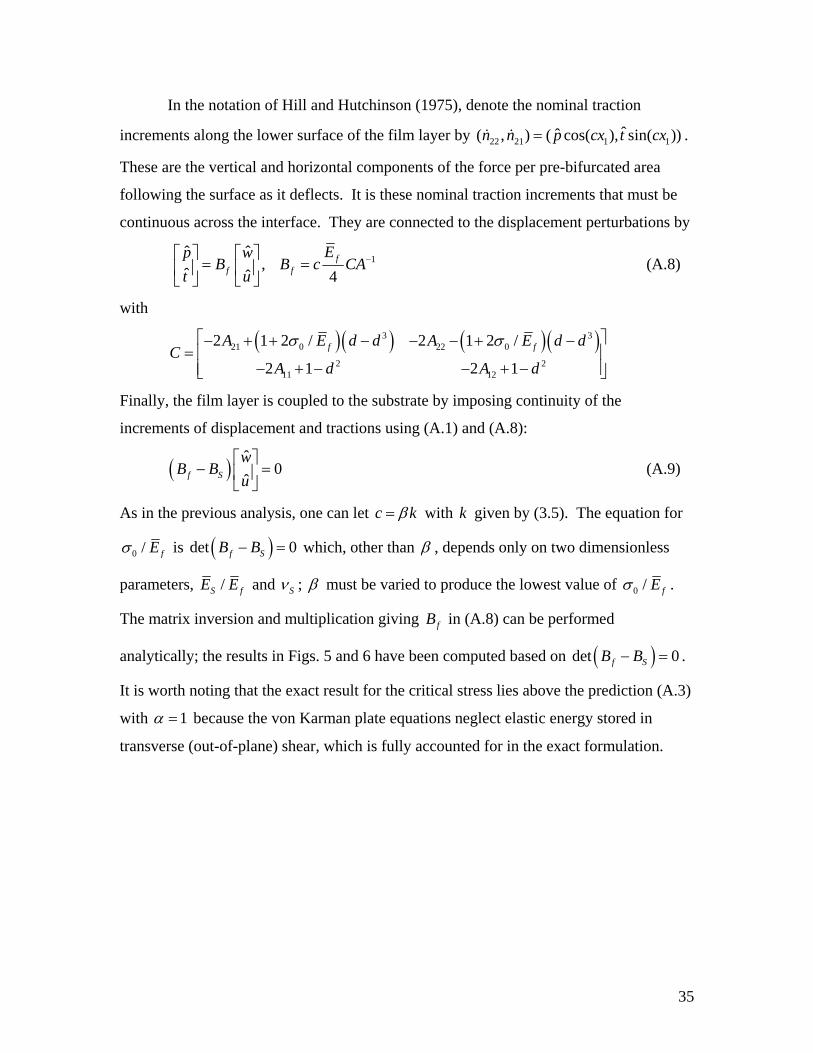
In the notation of Hill and Hutchinson (1975), denote the nominal traction
increments along the lower surface of the film layer by 22 21 1 1ˆˆ( , ) ( cos( ), sin( ))n n p cx t cx .
These are the vertical and horizontal components of the force per pre-bifurcated area
following the surface as it deflects. It is these nominal traction increments that must be
continuous across the interface. They are connected to the displacement perturbations by
1ˆ ˆ
,ˆ ˆ 4
ff f
Ep wB B c CA
t u
(A.8)
with
3 3
21 0 22 0
2 211 12
2 1 2 / 2 1 2 /
2 1 2 1
f fA E d d A E d dC
A d A d
Finally, the film layer is coupled to the substrate by imposing continuity of the
increments of displacement and tractions using (A.1) and (A.8):
ˆ0
ˆf S
wB B
u
(A.9)
As in the previous analysis, one can let c k with k given by (3.5). The equation for
0 / fE is det 0f SB B which, other than , depends only on two dimensionless
parameters, /S fE E and S ; must be varied to produce the lowest value of 0 / fE .
The matrix inversion and multiplication giving fB in (A.8) can be performed
analytically; the results in Figs. 5 and 6 have been computed based on det 0f SB B .
It is worth noting that the exact result for the critical stress lies above the prediction (A.3)
with 1 because the von Karman plate equations neglect elastic energy stored in
transverse (out-of-plane) shear, which is fully accounted for in the exact formulation.

36
(a) (b)
(c) (d)
(e) Fig.1 Schematics of mode shapes: (a) 1 D mode, (b) Square checkerboard mode, (c) Hexagonal mode, (d) Triangular mode, (e) Herringbone mode.

37
Fig. 2 Experimental observations of four buckling modes of films on PDMS substrates: a)
1D mode, observed when one principal in-plane stress dominates; b) square checkerboard
mode; c) hexagonal mode (inset: fast Fourier transform of a selected "grain" of
depressions, showing the hexagonal ordering); and d) herringbone mode. Images a, c,
and d are optical micrographs of wrinkles generated via the swelling process outlined in
Section 2. Image b depicts the surface profile of a flat polystyrene film on a PDMS
substrate, wrinkled due to thermal mismatch stresses. The checkerboard pattern in image
b is not readily observed. In this case it occured within a relatively small region
surrounded by other wrinkle patterns.
a)
c)
b)
d)

38
Fig. 3 Progression of modes observed experimentally for the UVO-treated PDMS system
with increasing overstress as described in the text. The UVO treatment times from left to
right are 10, 15, 20, 30, 45, and 60 minutes.
Fig. 4 A sequence of pictures depicting the transition of the hexagonal mode to a
“segmented labyrinth” (disorganized herringbone) pattern with increasing overstress.

39
Fig. 5 Critical stress for plane strain deformation of the film/substrate system with
1/ 3S . The reference is 2/3( ) ( / 4)(3 / )C A f S fE E E ; * 2/3( ) ( / 4)(3 / )C B f S fE E E
with * 24(1 ) / (3 4 )S S S SE E . Cases (I), (II) and (III) are described in the text;
( )C III is exact.

40
Fig. 6 The exact critical stress, ( )C III for plane strain deformation of the film/substrate
system for various Poisson ratios of the substrate with 2/3( ) ( / 4)(3 / )C A f S fE E E . The
film layer is incompressible.

41
Fig. 7 Three of the four critical buckling modes as defined in (4.2)-(4.4). The top view
of the computational cell for the hexagonal and triangular modes is outlined by heavy
dashed lines.

42
Fig. 8 Normalized energies for the various modes in the buckled state according to the
upper-bound analysis with 1/ 3f .

43
Fig. 9 Normalized energies in the buckled state in the range of small to moderate
overstress according the upper-bound analysis with 1/ 3f .
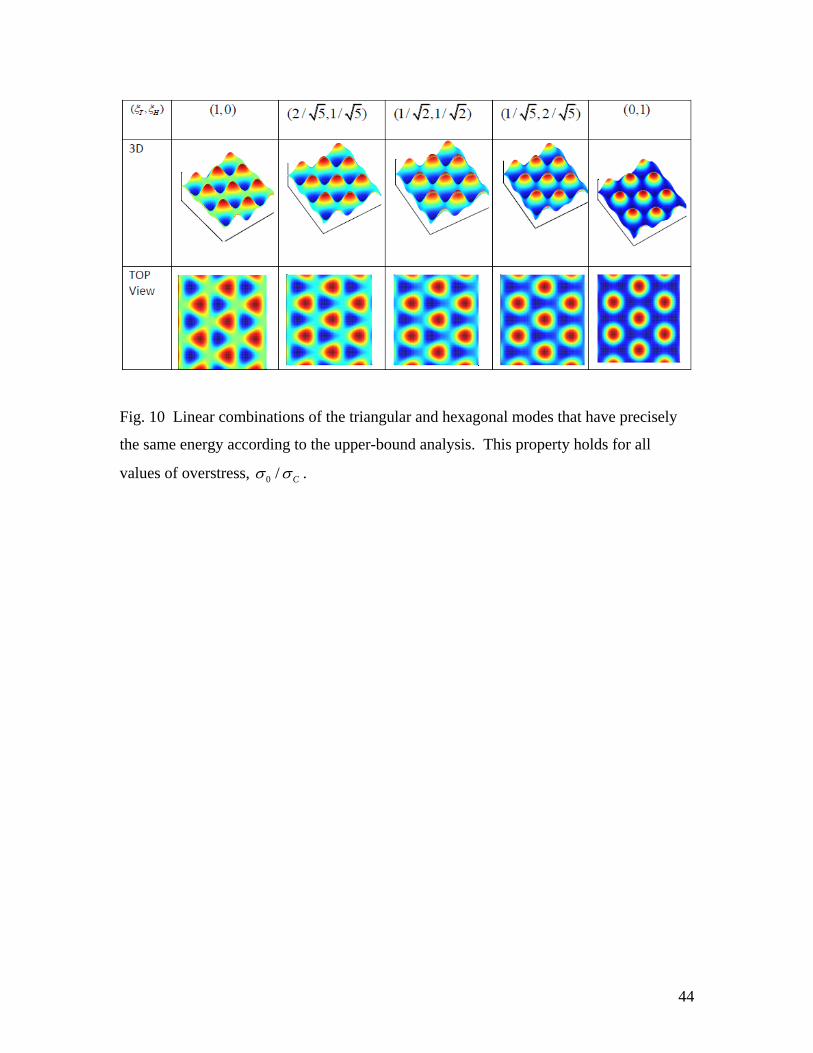
44
Fig. 10 Linear combinations of the triangular and hexagonal modes that have precisely
the same energy according to the upper-bound analysis. This property holds for all
values of overstress, 0 / C .

45
Fig. 11 Effect of spherical curvature on the relation between the applied stress and the
buckling amplitude for the hexagonal mode. The centers of the hexagon prefer to buckle
towards the concave (inward) side of the curved film.

46
Fig. 12 Effect of curvature on the energy in the buckled states of the hexagonal mode.

47
Fig. 13 For a given f the curve gives the value of for which the energy of the
hexagonal mode (buckling inward) equals that of the square mode. A mode-selection
criterion based on minimum energy favors the hexagonal mode to the right of the curve
and the square mode to the left of the curve.

48
Fig. 14 Normalized energy in the buckled state for the various modes as determined from
the numerical analysis of the 3D models.

49
Fig. 15 Transition from a triangular mode to a asymmetric three lobed mode under
increasing overstress. The result was computed with the three-dimensional finite element
model using the computational cell for the triangular mode.

50
2 4 6 8 100.2
0.3
0.4
0.5
0.6
0.7
0.8
0.9
1
Fig. 16 Demonstration that the energy states of the full 3D model are independent of the buckling deflection of the hexagonal mode, to a very good approximation. This is true for the linear substrate and for the neo-Hookean substrate. Moreover, over the range of overstress plotted, these results demonstrate that the nonlinearity of the neo-Hookean substrate has essentially no influence on the behavior.
0 / C
0U
UHexagon into linear substrate
Hexagon out of linear substrate
Hexagon into and out of neo-Hookean substrate