
Period January hugh - NASA Density (PSD) and certain spectral phases. This year, we have been...
21
f I t TELESCOPE SCIENLlST ON THE ADVANCE3 X-RAY ASTROPHYSICS OBSERVATORY NASA Grant NAG&-1607 Finat Report For Period 21 January 1999 hugh 30 September 2003 Principal Investigator Dr. Leon Van Speybroeck April 2004 Prepared for: National Aeronautics and Space Administration George C. Marshall Space Flight Center Marshall Space flight Center. Alabama 35812 Smithsonian Institution Astrophysical Observatory Cambridge, Massachusetts 021 38 The Smithsonian Astrophysical Observatory is a member of the Harvard-Smithsonian Center for Astrophysics The NASA TechnicaI Officer for this Grant is Carl M. Smith, Code FDO3, MASA, George C. Marshall Space Flight Center, Marshall Space Flight Center, Alabama 35812 https://ntrs.nasa.gov/search.jsp?R=20040053334 2018-07-01T00:01:20+00:00Z
Transcript of Period January hugh - NASA Density (PSD) and certain spectral phases. This year, we have been...

f
I
t
TELESCOPE SCIENLlST ON THE ADVANCE3 X-RAY ASTROPHYSICS OBSERVATORY
NASA Grant NAG&-1607
Finat Report
For Period 21 January 1999 h u g h 30 September 2003
Principal Investigator Dr. Leon Van Speybroeck
April 2004
Prepared for:
National Aeronautics and Space Administration George C. Marshall Space Flight Center
Marshall Space flight Center. Alabama 35812
Smithsonian Institution Astrophysical Observatory
Cambridge, Massachusetts 021 38
The Smithsonian Astrophysical Observatory is a member of the
Harvard-Smithsonian Center for Astrophysics
The NASA TechnicaI Officer for this Grant is Carl M. Smith, Code FDO3, MASA, George C. Marshall Space Flight Center, Marshall Space Flight Center, Alabama 35812
https://ntrs.nasa.gov/search.jsp?R=20040053334 2018-07-01T00:01:20+00:00Z

The Principal Investigator, Dr. Leon P. Van Speybroeck, passed away on December 25, 2002. Dr. Harvey D. Tananbaum assumed PI position for this grant.
1 Introduction
In this period, the Chandra X-ray Observatory continued to perform exceptionally well, with many scientific observations and spectacular results. The HRMA performance continues to be essentially identical to that predicted from ground calibration data. The Telescope Scientist Team has improved the mirror model to provide a more accurate description to the Chandra observers, enabling them to reduce the systematic errors and uncertainties in their data reduction.
There also has been good progress in the scientific program. Using the Telescope Scientist GTO time, we carried out an extensive Chandra program to observe distant clusters of galaxies. The goals of this program were to use clusters to derive cosmological constraints and to investigate the physics and evolution of clusters. A total of 71 clusters were observed with ACIS-I; the last observations were completed in December 2003.
2 Chandra Mirror Activities
2.1 Monitoring and Program Support
We continued to monitor the HRMA performance in flight; during this period we did not find it necessary to update the basic mirror parameters or ray tracing models as a result of changes in flight performance. However, there is a pending issue of the effective area at the Ir edge (see Section 2.3). We worked with the CXC optical group to perform the ray-trace analysis, and we provided information to the Chandra users and to the CIAO database.
2.2 Scattering
We continued our work on X-ray scattering from random rough surfaces. In the current raytrace simulation for the Chandra mirrors, scattering is treated, based on Beckmann’s classic book “The Scattering of Electromagnetic Waves From Rough Surfaces” , with small angle approximation and symmetry around the specular direction. This treatment doesn’t give a sufficiently accurate description of the mirror performance, especially for the wings of the point spread function (PSF). In 2002, we developed a new method to model the X-ray scattering directly from first principles. An actual rough surface is described by its Power
1

Spectral Density (PSD) and certain spectral phases. This year, we have been working to generate scattering tables, which are the tabulations of the scattering function S in this new method. We have been working with the CXC optical group to apply these scattering tables in the SAOsac raytrace model to simulate the Chandra X-ray Observatory performance and compare it with real results, from both on-orbit observations and ground calibrations.
We have been working on issues to refine this new method, such as the off-plane scattering. In our SPIE’02 paper, we gave the solution of in-plane scattering, i.e. the scattering inside the incident plane, which accounts for the major part of the scattering. We were working to derive an analytic solution for the off-plane scattering, just like for the in-plane scattering. This work is still in progress.
This new method treats the reflection and scattering together, and consequently both depend upon the surface roughness. This method is generally applicable. We have applied this method to the mirrors of the Chandra X-ray Observatory and have shown that the calculated scattering profile is as expected, including the Fraunhofer scattering patterns which result from the finite length of the mirror surfaces.
2.3 Effective Area
We continued the study of the HRMA absolute effective area (EA), which is one of the most important parameters of the Chandra X-ray Observatory. We gathered all the Effective Area measurement data obtained at the MSFC/XRCF during the HRMA ground calibration, re- analyzed them, and derived the results for the Chandra on-orbit effective area prediction, which are used by Chandra users through the Chandra Interactive Analysis of Observations (CIAO) software. We presented this study at the SPIE’03 meeting (see Appendix) and the Chandra Calibration Workshop held in Cambridge, MA. We also addressed the still unresolved issues on this subject - 1) the small discrepancies between the XRCF Solid State Detector and Flow Proportional Counter measurements; 2) the large discrepancies between measurements and raytrace simulation for shell 1; 3) the discontinuity at Ir edge ( 2 keV) observed with HETG, which could be due to the mirror surface contamination. Several special meetings were called to understand the Ir edge issue. Its solution is still pending.
2.4 HRMAPSF
We worked on the Chandra on orbit calibration data related to the scattering in the wings of the PSF. We analyzed the HETG image of the bright point source Her X-1. Part of this work was presented at SPIE’03 by T. Gaetz.
3 Science Program
The Telescope Scientist guaranteed time observation (GTO) is devoted to observe distant galaxy clusters to study their evolution and to determine cosmological quantities using the Sunyaev Zel’dovich effect. The cluster observations comprise three primary samples. The
.
2

largest of these are clusters with known microwave decrements that were selected to derive cosmological parameters. Two additional cluster samples were selected from the 160 degree ROSAT survey (Vihklinin et al. 1998) and from the Massive Cluster Survey (Ebeling, Edge
Although much work is still underway on clusters from this program, important new con- straints on cosmological parameters have already been derived that are independent of those determined for observations of type Ia supernovae or from the cosmic microwave background (WMAP).
Three papers that use significant subsets of these observations either to derive important new constraints on the values for R,, A and the equation of state for the dark energy or to measure the evolution in cluster temperature, luminosity and gas mass over cosmological epochs have been published or submitted for publication. These papers are:
“Cosmological Constraints from the Evolution of the Cluster Baryon Mass Function at z N 0.5”, Vikhlinin, A., Voevodkin, A., Mullis, C. R., VanSpeybroeck, L. et al., 2003, Astrophysical Journal 590, 15.
“Evolution of the Cluster X-Ray Scaling Relations since z > 0.4” , Vikhlinin, A., VanSpey- broeck, L., Markevitch, M., Forman, W. R., Grego, L, 2002, Astrophysical Journal 2002 Astrophysical Journal (Letters) 578, 107.
“Constraints on Dark Energy from Chandra Observations of the Largest Relaxed Galaxy Clusters”, Allen, S., Schmidt, R., Ebeling, H., Fabian, A.C., & VanSpeybroeck, L., submitted to Monthly Notices of the Royal Astronomical Society.
Analysis has also been carried out on individual clusters that showed unique features in their X-ray emission. The following papers have been published or submitted for publication:
“Chandra Observation of RXJ1720.1+2638:A Nearly Relaxed Cluster with a Fast-moving Core?”, Mazzotta, P., Markevitch, M., Vikhlinin, A., Forman, W., David, L., and VanSpey- broeck, L., 2001, Astrophysical Journal 555,205.
“Chandra Observation of MS 1455.0+2232: cold fronts in a massive cooling flow cluster?” , Mazzotta, P., Markevitch, M., Forman, W., Jones, C., Vikhlinin, A. and VanSpeybroeck, L., submitted to the Astrophysical Journal (astro-ph/0108476)
“Chandra Temperature Maps for Galaxy Clusters with Radio Halos” , Govoni, F., Marke- vitch, M., Vikhlinin, A., VanSpeybroeck, L., Feretti, L., Giovannini, G., 2004, Astrophysical Journal in press.
“A Deep Chandra Observation of the Distant Galaxy Cluster MS1137.5+6625” , Grego, L., Vrtilek, J., VanSpeybroeck, L., David, L., Forman, W., Carlstrom, J., Reese, E., and Joy, M., 2004, Astrophysical Journal in press.
Many invited and contributed talks at conferences and meetings of the American Astro-
. & Henry 2001).
. nomical Society, as well as the science article in the 2003 Chandra newsletter, also have been presented based on clusters observed in this program.
Dr. Ping Zhao continued to participate in Chandra Multiwavelength Plane Survey Project (ChaMPlane), which is a project to identify a large sample of serendipitous X-
3

ray sources in the galactic plane Chandra fields, in order to determine the populations of accretion-powered binaries in the Galaxy. ChaMPlane consists of an X-ray survey (supported by NASA through Chandra archival proposals) and optical survey (supported by NOAO as a Long Term Survey Project). Ping and his colleagues have successfully conducted these sur- veys which include: 1) selecting Chandra archival fields in the Galactic Plane, 2) detecting serendipitous X-ray sources, 3) conducting photometry using CTIO and KPNO 4m/Mosaic, 4) analyzing all the data to identify the X-ray optical counterparts and H a emission sources, and 5) conducting spectroscopic observations of the identified sources using Magellan 6.5m and MMT 6.5m for classification. So far the optical survey has been conducted in 41 fields covering -14 square degrees in the galactic plane. Many optical counterparts of the Chan- dra sources and H a emission objects are identified. A number of new CV candidates are discovered.
Dr. Zhao continued his study of stellar black holes. He used the FLWO 1.2-m telescope to monitor quiescent black hole X-ray novae (BHXN). He has expanded this successful program to include 5 northern BHXN, to systematically study the BHXN in their quiescent state. Because the optical variability is most likely due to variations in the accretion flow in the disk, this study provides a unique opportunity to test the reality of ADAF-based model for BH event horizons. He also continued the search for black holes from new X-ray novae. He conducted photometric observations at FLWO 1.2m to search for the optical counterparts of the new X-ray nova XTE J1901+014 and conducted spectroscopy follow up at Magellan 6.5m. He continued to search for quiescent X-ray novae (without using an X-ray telescope). The goal of this study is to discover new black-hole candidates. This research will increase our knowledge of the galactic black hole population and evolution.
.
Dr. Zhao presented three papers at the AAS meetings as first author. He presented one talk at the SPIE’OS as the first author and published a paper in 2003 SPIE Proceedings 5165- 47 (see Appendix). He also published one scientific paper in Astronomische Nachrichten. He was also co-author of a number of other astrophysical publications (IAUC and ApJ).
Dr. Leon P. Van Speybroeck received the 2002 Rossi Prize of the High Energy Astrophysics Division of the American Astronomical Society “for his singular contribution to high energy astrophysics leading to the exquisite image quality produced by the X-ray optics and telescope of the Chandra X-ray Observatory.” Dr. Harvey Tananbaum delivered the prize lecture for Leon at the 201st AAS meeting.

4 Appendix: Publication related to Chandra Mirror
"Chandra X-ray Observatory Mirror Eflective Ama ", published in 2003 SPIE Proceedings 51 65-4 7 *
5
Chandra X-ray Observatory Mirror Effective Area
Ping Zhaoa, Diab JeriusO, Richard J. Edgara, Terrance J. Gaetza, Leon P. Van Speybroecka, Beth Billera, Eli BeckermanO and Herman L. Marshallb
aHarvard-Smithsonian Center for Astrophysics, Cambridge, MA 02138 U.S.A. bMassachusetts Institute of Technology, Cambridge, MA 02139 U.S.A.
ABSTRACT Chandra X-ray Observatory (CXO) - the third of NASA’s Great Observatories - has now been successfully operated for four years and has brought us fruitful scientific results with many exciting discoveries. The major achievement comparing to previous X-ray missions lies in the heart of the CXO - the High Resolution Mirror Assembly. Its unprecedented spatial resolution and well calibrated performing characteristics are the keys for its success. We discuss the effective area of the CXO mirrors, based on the ground calibration measurements made at the X-Ray Calibration Facility in Marshall Space Flight Center before launch. We present the derivations of both on-axis and off-axis effective areas, which are currently used by Chandra observers.
Keywords: Chandra X-ray Observatory, HRMA, X-ray telescopes, X-ray mirrors, calibration, effective area
1. INTRODUCTION NASA’s Chandra X-ray Observatory (CXO) is the most powerful X-ray telescope ever built to-date. Its launch in 1999 was a major milestone in the field of high energy astrophysics and the world of science. In the past four years, it has brought many new discoveries to the general public as well as the scientific community, and opened a new window t o part of the Universe of which we have never seen before. CXO has unprecedented capabilities of high resolution imaging and spectroscopy over the X-ray band of 0.1 keV - 10 keV. The success of CXO is mainly due to the design and manufacture of its X-ray mirrors - the High Resolution Mirror Assembly (HRMA). At 0.84-m long and 0.6 - 1.2-m in diameters, the surface area of each mirror ranging from 1.6 to 3.2 square meters. They are the largest and the most precise grazing incidence optics ever built. The success of CXO is also due to the extensive ground calibration for the HRMA and science instruments, carried out at NASA’s Marshall Space Flight Center before launch. The Effective Area (EA) is one of the most important characteristics of the CXO. It was determined that the CXO effective area should be calibrated to a precision that no X-ray telescopes have ever achieved before, so it can provide accurate measurement of the flux from X-ray source^.^-^
This paper explain the calibration and derivations of both on-axis and off-axis effective areas, which are currently used by Chandra observers.
2. GROUND CALIBRATION The HRMA ground calibration was carried out at the X-Ray Calibration Facility (XRCF) in Marshall Space Flight Center (MSFC), Huntsville, AL, from September 1996 through May 1997. An extensive effort was devoted to calibrate the the HRMA on-axis effective area. Figure 1 illustrates the Calibration configuration at the XRCF. The experiment was setup in three buildings (Bldgs 600, 500, and 4718) and connected by a 524.7 meter long vacuum pipe. The X-ray Source System (XSS) was in building 600. The HRMA was in a vacuum chamber located in Building 4718, 524.7 m from Building 600. In Building 500, which was 37.4 m from the XSS, there were Beam Normalization Detectors (BND).
Three types of X-ray source were used for the calibration:
0 X-ray line source: Characteristic X-ray lines generated by an Electron Impact Point Source (EIPS) with
Further author information: (Send correspondence to Ping Zhao) Ping Zhao: Email: [email protected] various anodes.

XRCF EXPERIMENTAL SETUP (SCHEMATIC)
Too FOCALPUNEMTECTORS:
2 FPC
1SSD 1 HIGH SPEED IMAGER
( H X W
X M Y SOURCE SYSTEM
I - - - -
AXAF MIRROR ASSEMBLY -500
t-- --i VM*nnChmbcr(Bldg.rn8)
k-. 524.7m -4 +-lorn+
Figure 1. HRMA Calibration configuration at the XRCF.
0 C-continuum source: Continuum X-ray radiation generated by EIPS with a carbon anode at kV an using a beryllium (Be) filter to attenuate the lowest energies including the C-Ka line (0.277 keV).
0 W-continuum DCM source: k g s t e n Rotating Anode source, behind a Double Crystal Monochromator (DCM), which produces narrow band tunable X-rays.
Two types detectors were used for the effective area calibration:
High-Purity-Germanium Solid State Detector (SSD). Two nearly identical SSDs were used:
- One located in the HRMA focal plane, named SSD-X. - One located in the Bldg 500 for beam normalization, named SSD-5.
0 Methane or P10 (90% argon, 10% methane) gas Flow Proportional Counter (FPC). There were total of 7 FPCs:
- Two located in the HRMA focal plane, named F P E X l and FPC-X2. - One located in the Bldg 500 for beam normalization, named FPC-5. - Four located in the HRMA entrance plane for beam normalization (see Figure l), named FPC-
HT,HB,HN,HS.
For calibration purposes, shutters were placed behind the HRMA to block the X-rays from shells and quad- rants of choice. So each measurement could be done with either the full HRMA or individual shells. Apertures of different sizes were available in front of each detector.
Following measurements were made for the HRMA on-axis effective area:
0 SSD C-continuum Measurements:

- X-ray source: C-continuum (0.5 - 10 keV) - Focal plane detector: SSD-X - Beam normalization detector: SSD-5 - Apertures: 5 mm for SSD-X, 2 mm for SSD-5 - Measurements: individual shells 1, 3, 4, 6
0 SSD Spectral line Measurements
- X-ray source: Nb-La (2.17 keV), Ag-La (2.98 keV), Sn-La (3.44 keV) - Focal plane detector: SSD-X - Beam normalization detector: SSD-5 - Apertures: 5 mm for SSD-X, 2 mm for SSD-5 - Measurements: Full HRMA
0 FPC Spectral line Measurements
- X-ray source: C-Ka (0.277 keV), Cu-La (0.9297 keV), Al-Ka (1.486 keV), Ti-Ka (4.51 keV),
- Focal plane detector: FPC-X2 - Beam normalization detector: FPC-Hs - Apertures: 2 mm and 35 mm for FPC-X2, 35 mm for FPC-Hs - Measurements: individual shells and full HRMA
Cr-Ka (5.41 keV), Fe-Ka (6.4 keV), Cu-Ka (8.03 keV)
0 DCM W-continuum Measurements
- X-ray source: W-continuum DCM source (2 - 10 keV) - Focal plane detector: FPC-X2 - Beam normalization detector: FPC-Hs - Apertures: 35 mm for FPC-X2, 35 mm for FPC-Hs - Measurements: Full HRMA
We now discuss each measurement in the following sections.
3. SSD C-CONTINUUM MEASUREMENTS For the SSD C-continuum Measurements, only the effective area of individual shells (instead of the full HRMA) were measured. The measurements were done by comparing the spectra detected simultaneously by the SSD-5 and SSD-X - two nearly identical high-purity-germanium solid state detectors. SSD-5 was located in Building 500 at 38.199 meters from the X-ray source. It is, of course, not directly in the line between the sources and the HRMA, but to one side of it. SSD-X was located at the HRMA focus, 537.778 meters from the source. An aperture wheel was mounted in front of each SSD. The on-axis effective area measurements were done with a 2 mm diameter aperture in front of the SSD-5 and a 5 mm diameter apertures in front of the SSD-X. The integration time was 1000 seconds for each shell.
Figure 2 shows the SSD-X and SSD-5 spectra of these four measurements. The profiles show the C-continuum spectra with several spectral peaks on top. The largest Gaussian-like peak at around channels 2400-2500 is the injected pulser spectrum to be used for the pileup and deadtime corrections (see below). Other peaks are characteristic X-ray lines due to contaminations to the carbon anode. It was good to have these contamination peaks, as they were to be used to determine the energy scale of the spectra (see below).

SSX Spectum nrl10539i000.pbs 10s
SSX Spectum s i r 1 10540iWO.pha 10s . . . . I ' I , . . , - . . , . . , . .
- -- I . . * . . . I . . . I . . . . , . . . , . . 0 sm l o m l s m z m o ~ ~
C-
SSD-X and SSD-5 spectra: Shell 3.
- I . . . . I . . . * . . . . I . . . I . . . , . . . 0 so0 l o o o 1 ~ r m o r s o o s D D D
cL..nrl
SSD-X and SSD-5 spectra: Shell 1.
.. - .
11 . . . . 1 . . . . , . . . . , . . . . , . . . , , . . , 1 0 500 1 w O l s m p o w w w ~
cL.ucl SSD-X and SSD-5 spectra: Shell 4.
I l . . . . l . . . . , . . . . r . . . . , . . . . l . . . .
SSD-X and SSD-5 spectra: Shell 6. 0 sm I o m l 5 w ~ w w J o D D
C h n a C l
Figure 2. C-continuum SSD-X and SSD-5 spectra of four HRMA shells. Integration time: 1000 seconds. The profiles show the C-continuum spectra with several spectral peaks on top. The largest Gaussian-like peak at around channels 2400- 2500 is the injected pulser spectrum to be used for the pileup and deadtime corrections. Other peaks are characteristic X-ray lines due to contaminations to the carbon anode. These peaks are used to determine the spectra energy scale.

The C-continuum measurements have the advantage of providing the effective area for nearly the entire Chandra energy band. But extreme care has to be taken for the data analysis and results evaluation details. Following issues has to be resolved and calculated correctly:
Pileup: Pileups occur when more than one photon enter the detector within a small time window (a few psec). Instead of recording each photon event, the detector registers only one event with the summed energy of all photons. The pileup can also occur for a real photon with a pulser event. The SSD has pileup rejection electronics to reduce the pileup. However, the rejection does not work well if one of the photons has energy below 2 keV, corresponding to a pre-amplifier output signal of 4 mV. Thus each spectrum needs to be corrected for pileups of any photon with a low energy (< 2 keV) photon.
Deadtime Correction: In the raw data, the deadtime correction was automatically estimated, using a built-in circuitry and algorithms, and entered in the pha file header for each spectrum. However, for the SSDs, this formalism does not provide an accurate estimation because of low-level noise; the lower level discriminators were set very low to extend the SSDs' energy coverage as low as possible. A more accurate way to calculate the deadtime correction is to use the pulser method, in which artificial pulses are injected into the detector preamplifier to mimic real x-ray events.
Beam Uniformity: Beam uniformity was measured by scan the SSD-5. The Flux Ratio (FR) of SSD-5 home position vs. the optical axis was fit as a function of X-ray energy in E, in unit of keV as:
F R = 1.01341 - 0.00512E + 0.000567E2 (1)
with a relative error of 0.0034.
SSD Icing Effect: Because SSD was cooled to the liquid nitrogen temperature, even in its vacuum container, there was still a small amount of trapped water which condensed on the surface of the SSD to form a very thin layer of ice. This thin ice layer decreases the transmission of low energy X-rays. In order to monitor the ice build up, a radioactive isotope 2$$m excited Fe source was placed on the aperture wheel and rotated in front of the SSD-5 from time to time. The data analysis show that icing have < 0.7% effect for energies over 3 keV, - 2% at 2 keV and very severe effect for energies below 2 keV. Therefore, due to different icing build up on the two SSDs and we don't know the exact thinkness if the ice during the measurement, we decide not to use the SSD data below 2 keV.
Background: During the HRMA calibration, background runs were taken almost every day when the source valve was closed and all the detectors were turned on. For all the background spectra, the average counting rate was 2 - 9 x
The relative quantum efficiency (QE) of SSD-5/SSD-X was measured, by swapping the two SSDs, to be R(E) = 1.0141 f 0.0089.
SSD Energy Scale: Using the characteristic X-ray lines atop the continuum spectra for a linear fit:
Energy = a + b . Channel
c/s/ch, which is negligible in our data analysis.
Table 1. X-ray Lines atop the C-continuum
X-ray Line Energy Si-Ka, W-Ma and W-MP 1.77525 keV Ca-Ka Ti-Ka V-Ka Fe-Ka W-La
3.69048 keV 4.50885 keV 4.94968 keV 6.39951 keV 8.37680 keV
Figure 3 show the SSD-X and SSD-5 energy scales fitted with the six X-ray line energies.

0 500 1000 1500 2000 Channel
Figure 3. SSD-X and SSD-5 energy scales for the flat field test, fitted with six X-ray line energies.
For detailed data analysis and discussion of above issues, please see the paper by Zhao et al., SPIE '98.'
The HRMA effective area at the XRCF is defined to be the photon collecting area in the plane of the HRMA pre-collimater entrance, which is 1491.64 nun forward from CAP Datum-A (the front surface of the Central Aperture Plate), i.e. 526.01236 meters from the source.

For the C-continuum SSD measurements, the HRMA mirror effective area, A e 8 ( E ) , is:
where
0 Cssd-z(E) and Css,j-5(E) are the SSD-X and SSD-5 spectra with the correct energy scale and equal energy bins (in units of counts/second/keV).
0 PDcssd-, and PDcs,d-5 are the pulser deadtime corrections for the SSD-X and SSD-5.
0 Dhrma = 526.01236 meter is the distance from the source to the HRMA pre-collimater entrance, where the effective area is defined.
0 Dssd-5 = 38.199 meters is the distance from the source to SSD-5.
0 Assd-5 is the SSD-5 aperture area. A 2 mm aperture was used for all the measurements. Its actual equivalent diameter is 1.9990 f 0.0073 mm. so Assd-5 = 0.031385 f 0.00023 cm2
0 R(E) = 1.0141 f 0.0089 is the relative SSD-S/SSD-X quantum efficiency from the flat field test.
4. SSD AND FPC SPECTRAL LINE MEASUREMENTS Sources of characteristic X-ray lines generated by EIPS with various anodes was used to measure the effective area with both SSD and FPC detectors. The measured effective area was obtained by comparing the spectra detected simultaneously by the focal plane and BND detectors. Spectral line fitting method was used to determine the total photon counts in each detector. For detailed data analysis and discussion of spectral line measurements, please see the paper by Edgar et al., SPIE '97.4
5. RAYTRACE SIMULATIONS The HRMA effective area can be calculated based on the HRMA model raytrace simulation and appropriate o p tical constants, independently from the XRCF measurements. For detailed discussion of the raytrace simulation, please see the paper by Jerius et al., SPIE '03.5
6. OPTICAL CONSTANTS The complex index of refraction used in the Fresnel Equation of the reflecting medium is defined as: ii G n - ik G
1 - 6 - ip. The optical constants 6 and /3 of the HRMA coating iridium (Ir) were derived from the synchrotron measurements of the Chandra mirror witness flats at the Brookhaven National Laboratory (BNL). Figure 4 shows the Ir optical constants from the synchrotron measurements and from the table by Henke and Gullikson.' For detailed discussion of the the synchrotron measurements, please see the paper by Graessle et al., SPIE '03.7
7. HRMA ON-AXIS EFFECTIVE AREA In the raytrace simulation, we used Ir optical constants from Gullikson'95 table6 for 0.10 - 0.94 keV, and from the synchrotron measurements for 0.94 - 10 keV. The reflectivity were calculated from 328A Ir coating with 97A Cr undercoating on a Zerodur base.
Figures 5 and 6 show the measured Effective Area comparing with the raytrace simulation. There are some discrepancies between the measurements and the raytrace for individual shells, especially for shell 1. But the agreement is reasonably good for the full HRMA (Figure 6).
To calibrate the HRMA Effective Area, A 4th order polynomial was fit to each of the effective area ratios of SSD-data/raytrace for E > 2keV. An average ratio of FPC-data/raytrace was used for E < 2keV. Then the raytrace Effective Area was scaled by the above ratios and polynomials.

Synchrotron Optical constant: Beta 10-2 - I I I 1 1 I I I , , , , I , , , , , , , ~,
But the FPC measurements were still a few percent lower than the SSD measurements. To give equal weights for both SSD and FPC measurements, the EA was further lowered by half the average difference between the SSD and FPC measurements. The final XRCF EA is show in Figure 7. It has an error envelop of - 2%. This Figure appears in the Chandra Proposers' Observatory Guide (POG),8 Chapter 4, Figure 4.5.
Use the polynomial curve in Figure 7, we can calibration the HRMA on orbit effective area by scaling the raytrace on-orbit prediction the same way. The predicted on-orbit on-axis (2x) effective area of the HRMA as well as the HRMA times the ACIS or HRC QE are shown in Figure 8. This figure appears in POG , Chapter 4, Figure 4.2. Table 2 lists the values in the figure for every 0.5 keV.

XRCF Shell 1 Effective Area within 2 mm Aperture sw
400 - -g
300 - 2 D = n n , p IW
0 0 2 4 e 0 10
Energy (Lev)
XRCF Shell I Effective Area Ratio within 2 mm Aperture
0 2 4 8 10 Energy (Lev)
Shell 1.
XRCF Shell 4 Effective Area within 2 mm Aperlure - RaJtrmca Predichon
__ Raytrace .I PolpOmld Sealing
250- ' ' ' ' ' ' I ' ' ' " ' ' " _ SSD C-I: Conbnuum Dah
. 0 ?PC Una D.L.
XRCF Shell 4 Effective Area Ratio within 2 mm Aperture
_ . - Seallng Funebon 1 2 0 ' ' ' ' . ' I ' ' ' ' ' ' ' ' ' ' ' - SSD D.L./R.ytrace Rnbo
0 ?PC D*L./R.ylr.ct Reba
Jw
-6 XRCF Shell 3 Effective Area within 2 mm Aperture
SSD C-Y Continuum D a h - R.*ec w Po1,m-mt.I Sfdlly 0 m Llne 0.h
oo LO
Enern (Lev)
XRCF Shell 3 Effeclve Area Ratio within 2 mm Aperture
0 2 4 s 10 Energy (Lev)
Shell 3.
XRCF Shell 6 Effective Area within 2 mm Aperture Raflrnee Predrction SSD C-K C a n b n u u m Dah R a y h c c w Polpoml.1 SoaUng
0 I P C Line Dab
O . . . . . . ~ . . . ~ . . . ' . . . 0 2 4 Energy (Lev) s a 10
XRCF Shell 6 Effective Area Ratio within 2 mm Aperture Senling Function
1.20 ' ' ' ' ' ' ' ' ' ' ' ' ' ' " ' '
. . . . SSD D.L./Raytr.ee Ratio 0 ?PC D.L./R.ytr.cc Ratio
-
O . W . . . . . I . . . , . . I . .
0 2 4 s 8 10 Energy (Lev)
Shell 4.
Figure 5. Calibration data vs. raytrace prediction. Top panel of each quadrant plot shows the XRCF effective area within 2 mm aperture. Bottom panel shows the effective area ratio of data/raytrace.

h
-E
$
V Y
m W
W
3 400 V W rr c w
XRCF HRMA Effective Area within 2 mm Aperture 1000
......._. _.. Raytrace w Polynomial Scaling
800 o FPC Line Data A SSD Line data
XRCF HRMA Effective Area Ratio within 2 mm Aperture 1.20
Scaling Function . . . . . . - . . - - . SSD Data/Raytrace Ratio
o FPC Data/Raytrace Ratio A SSD Data/Raytrace Ratio
h
0 m 4 &
p:
W
3 1.10
2 4 m n
'S 1.00
v
0
m p: m 0,
2 .; 0.90 3 v W c rr w
0 2 4 6 8 10 Energy (keV)
Figure 6. Calibration data vs. raytrace prediction. Top panel shows the XRCF HRMA effective area within 2 mm aperture. Bottom panel shows the effective area ratio of data/raytrace.

XRCF HRMA Effective Area within 2 mm Aperture 1000
inuum Data ............
Raytrace w Polynomial Scaling 800 OFPC Line Data
A SSD Line d a t a h
-E u v
600 m al h 4
0 2 4 6 Energy (keV)
8 10
XRCF HRMA Effective Area Ratio within 2 mm Aperture 1.20
h al 0 d 4
4 1.10 2 nz 4 d n
5 1.00
v
0
d nz m 0,
2 .2 0.90 u 4 0
c CI
w
0.80 0 2 4 6 8 10
Energy (keV)
Figure 7. The HRMA effective area measured at the XRCF. In the upper panel: the solid line is the raytrace simulation of the HRMA effective area within a 2 mm diameter aperture at the focus; the dashed line with error bars shows the SSD data with a C-K continuum source; the diamonds and triangles show the FPC and SSD data with spectral line sources. The lower panel shows deviation of data from the raytrace: the dashed line with error bars is the ratio of SSD C-K continuum data vs. the raytrace; the diamonds and triangles show the ratio of FPC and SSD spectral line data vs. the raytrace; the solid line is a polynomial function, which gives equal weight to the deviations of the continuum and line measurements, for scaling the raytrace simulation to provide the predicted HRMA effective area.

HRMA, HRMA/ACIS & HRMA/HRC On-axis Effective A r e a 1000 I I I I I I I I ' I I I I I I I I I
800
0
HRMA __..__._._.._ HRMA/ACIS-13, FI - - - - - HRMA/ACIS-S3, BI
- - - - - - - - . HRMA/HRC-S - - - - - - - - HRMA/HRC-I -
4 6 Energy (keV)
8 10
Zhao/SAO Z5SepOl
Figure 8. The HRMA, HRMA/ACIS and HRMA/HRC effective areas versus X-ray energy in linear scale. The structure near 2 keV is due to the iridium M-edge. The HRMA effective area is calculated by the raytrace simulation based on the HRMA model and scaled by the XRCF calibration data. The HRMA/ACIS effective areas are the products of HRMA effective area and the Quantum Efficiency (QE) of ACIS-I3 (front illuminated) or ACISS3 (back illuminated). The HRMA/HRC effective areas are the products of HRMA effective area and the QE of HRC-I or HRC-S at their aimpoints, including the effect of UV/Ion Shields (UVIS).
8. HRMA OFF-AXIS EFFECTIVE AFtEA The HRMA effective area decreases as the source off-axis angle increases. So the count rate for the same source depends on its off-axis angle. Figure 9 shows the HRMA on-orbit off-axis effective area as a fraction of the on-axis effective area for selected energies, calculated by raytrace simulation. This Figure appears in POG , Chapter 4, Figure 4.4. Table 3 lists the values in the figure.

Table 2. HRMA, HRMA/ACIS HRMA/HRC On-axis Effective Area (on2)
Energy HRMA HRMA HRMA HRMA HRMA
0.5 785.85 108.81 292.81 76.22 119.58 1.0 785.19 445.67 622.57 222.36 239.32 1.5 793.54 654.74 728.65 222.22 220.76 2.0 716.65 440.96 615.51 156.52 142.03 2.5 404.05 305.51 369.63 71.83 59.74 3.0 413.13 347.46 391.08 62.06 49.23 3.5 424.36 378.58 407.96 54.10 42.09 4.0 422.93 390.67 406.28 45.78 34.99 4.5 408.15 382.54 381.81 37.59 27.71 5.0 374.31 349.05 331.11 43.70 41.55 5.5 321.61 291.56 261.86 50.32 46.51 6.0 271.23 233.55 199.28 41.91 37.42 6.5 227.56 182.35 148.81 34.68 29.58 7.0 174.47 128.30 100.55 26.24 21.68 7.5 126.43 84.38 63.99 18.76 15.64 8.0 87.72 52.64 38.87 12.83 10.69 8.5 70.32 37.80 27.28 10.14 8.18 9.0 61.23 29.40 20.81 8.70 6.74 9.5 51.91 22.24 15.50 7.27 5.40 10.0 33.69 12.87 8.85 4.65 3.30
w/ACIS-I3 w/ACIS-S3 w/HRC-I w/HRC-S
Table 3. HRMA On-orbit Off-axis Effective Area as a fraction of the On-axis Effective Area
Offaxis Angle Energy (keV) (arcmin) 1.4967 4.5108 6.4038 8.6388 9.7000
0.0 1.0000 1.0000 1.0000 1.0000 1.0000 0.5 0.9998 0.9994 0.9985 0.9996 0.9905 1 .o 0.9979 0.9969 0.9930 0.9944 0.9612 2.0 0.9912 0.9877 0.9718 0.9719 0.8576 3.0 0.9786 0.9716 0.9385 0.9341 0.7225 5.0 0.9462 0.9296 0.8535 0.8258 0.5096 7.0 0.9115 0.8813 0.7600 0.6712 0.3957 10.0 0.8569 0.8022 0.6255 0.4847 0.2899 15.0 0.7696 0.6708 0.4616 0.3263 0.1928 20.0 0.6901 0.5534 0.3435 0.2348 0.1336
9. DCM W-CONTINUUM MEASUREMENTS Tungsten Rotating Anode source, behind a Double Crystal Monochromator (DCM), produces narrow band tunable X-rays. It was used to measure the effective area with the FPC detectors. Its spectral analysis was simplified due to the lack of continuum. However, its beam uniformity was a problem, especially near strong W lines (1.7J.8 keV). Therefore it was not reliable as an absolute EA calibration. SO we only used the data from the DCM measurements for a cross check. The results are comparable to the SSD continuum and FPC line measurements. Figure 10 shows the results of the DCM W-continuum Measurements.

C
HRMA Off-axis Effective Area (Averaged over Four Directions)
'. . . '. . '.
\. . . - '. . . '.
\. . '. . . '. '.. . . . . - . .
.. ._ ._ .. \.. '. '..
._ \.. ..._ .-._ - ._ .. - -.
'.. '..
'. ..
-.__ --__ -.__ .._ - -... -... '. ..
4.510 keV 6.403 keV 8.638 keV
. . . . . . . . . . . . . .
0 . 0 1 , I , l , , , l , ~ , l , , , l , , , ~ , , , ~ , , , ~ ,
0 2 4 6 8 10 12 14 Source Off-aria Angle (ucmin)
XaMmAO Zllobm
Figure 9. The HRMA effective area versus off-axis angle, averaged over azimuth, for selected energies, n o r m a l i i t o the on-axis area for that energy.
DCM effective areas 35 rnrn operture; BGdrOE corr; hn ignored
I I 1 I I
C C
0
0 0 m
- N O s z v .. - a-
0 0 -t
0 0 N
0
+ D-IXF-EA-22.001 .corr -t D-IXF-EA-23.001 .corr - D-IXF-EA-24.001 .corr
xrcf-xss-05 roytroce - 0 ElPS line measurements
- 0 2 4 6 8 10
E (keV) Figure 10. DCM Effective Area Measurements. The results are comparable to SSD continuum and FPC line measure- ments. The Ir edge structure in the 2-3 keV range is resolved. the jump near 3 keV is almost certainly the Ar edge in the FPC response.
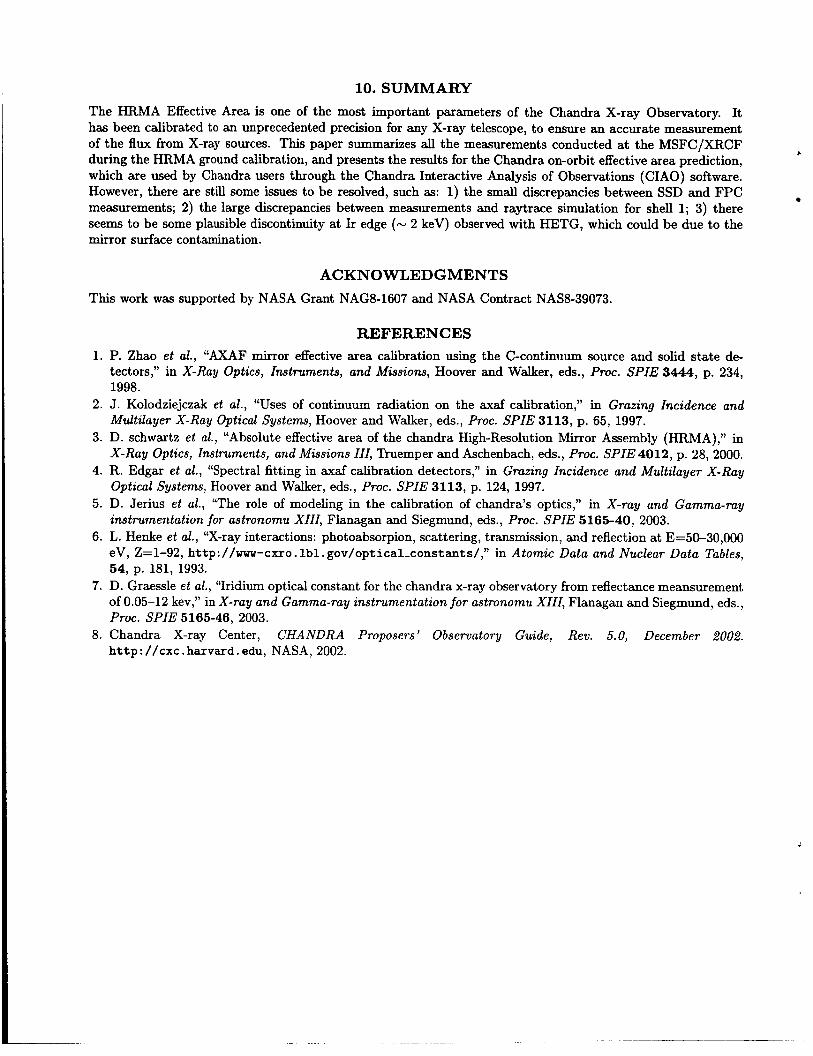
10. SUMMARY The HRMA Effective Area is one of the most important parameters of the Chandra X-ray Observatory. It has been calibrated to an unprecedented precision for any X-ray telescope, to ensure an accurate measurement of the flux from X-ray sources. This paper summarizes all the measurements conducted at the MSFC/XRCF during the HRMA ground calibration, and presents the results for the Chandra on-orbit effective area prediction, which are used by Chandra users through the Chandra Interactive Analysis of Observations (CIAO) software. However, there are still some issues to be resolved, such as: 1) the small discrepancies between SSD and FPC measurements; 2) the large discrepancies between measurements and raytrace simulation for shell 1; 3) there seems to be some plausible discontinuity at Ir edge (- 2 keV) observed with HETG, which could be due to the mirror surface contamination.
L
ACKNOWLEDGMENTS This work was supported by NASA Grant NAG8-1607 and NASA Contract NAS8-39073.
REFERENCES 1. P. Zhao et al., “AXAF mirror effective area calibration using the C-continuum source and solid state de-
tectors,” in X-Ray Optics, Instruments, and Missions, Hoover and Walker, eds., Proc. SPIE 3444, p. 234, 1998.
2. J. Kolodziejczak et al., “Uses of continuum radiation on the axaf calibration,” in Grazing Incidence and Multilayer X-Ray Optical Systems, Hoover and Walker, eds., Proc. SPIE 3113, p. 65, 1997.
3. D. schwartz et al., “Absolute effective area of the chandra High-Resolution Mirror Assembly (HRMA),” in X-Ray Optics, Instruments, and Missions 111, Truemper and Aschenbach, eds., Proc. SPIE 4012, p. 28, 2000.
4. R. Edgar et al., “Spectral fitting in axaf calibration detectors,” in Gmzing Incidence and Multilayer X-Ray Optical Systems, Hoover and Walker, eds., Proc. SPIE 3113, p. 124, 1997.
5. D. Jerius et al., “The role of modeling in the calibration of chandra’s optics,” in X-ray and Gamma-ray instrumentation for astronomu XIII, Flanagan and Siegmund, eds., Proc. SPIE 5165-40, 2003.
6. L. Henke et al., “X-ray interactions: photoabsorpion, scattering, transmission, and reflection at E=50-30,000 eV, Z=1-92, http://uwu-cxro. lbl. gov/optical-constants/,” in Atomic Data and Nuclear Data Tables, 54, p. 181, 1993.
7. D. Graessle et al., “Iridium optical constant for the chandra x-ray observatory from reflectance meansurement of 0.05-12 kev,” in X-ray and Gamma-ray instrumentation for astronomu XIII, Flanagan and Siegmund, eds.,
8. Chandra X-ray Center, CHANDRA Proposers’ Observatory Guide, Rev. 5.0, December 2002. PTOC. SPIE 5165-46, 2003.
h t tp : //cxc . harvard. edu, NASA, 2002.