Performics Social Media (S-Net) Category Report
30
S-Net: A Study in Social Media Usage & Behavior Category Reports AUGUST 2011
-
Upload
performics -
Category
Technology
-
view
3.325 -
download
2
description
Social networks are changing the way people participate with brands, resulting in new opportunities for companies. The S-Net social study category reports highlight findings specific to 18 different industries: alcoholic beverages, apparel, appliances, automotive, education, electronics, entertainment, financial services, food, healthcare/pharma, household, magazines/newspapers, non-alcoholic beverages, personal care, restaurants, sports related, telecommunications and travel.
Transcript of Performics Social Media (S-Net) Category Report
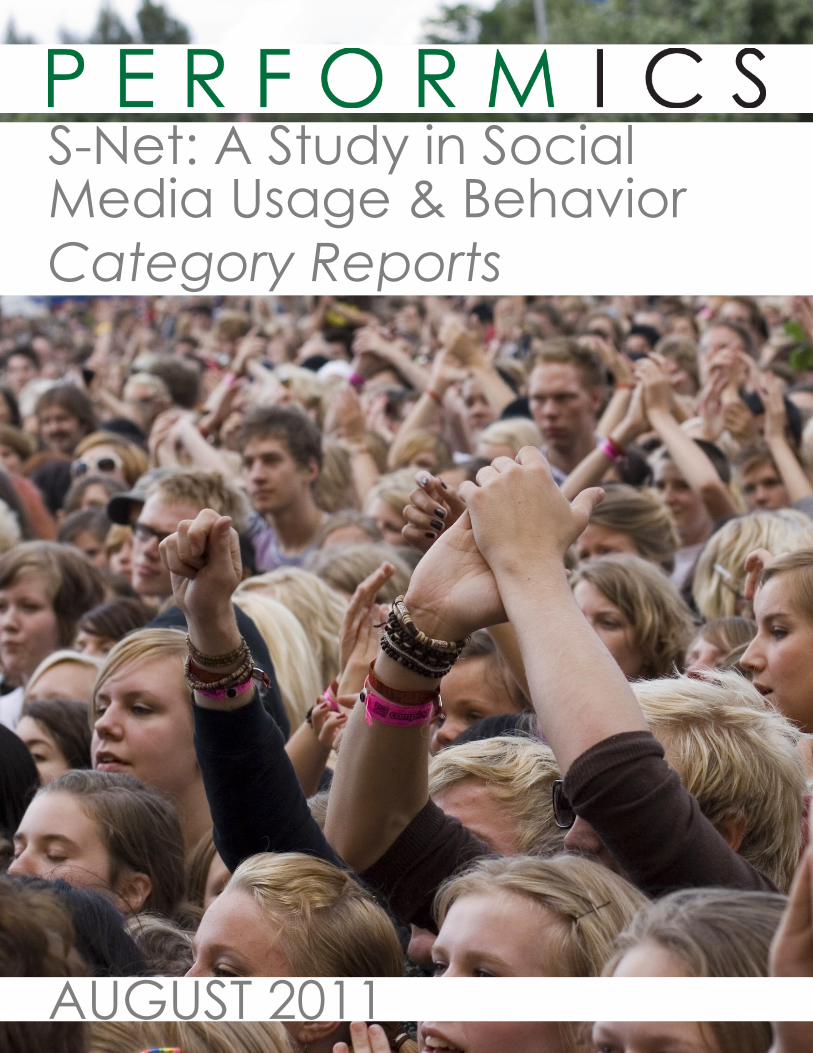
S-Net: A Study in Social Media Usage & Behavior Category Reports
AUGUST 2011

Table of ContentsMarketing Implications
Alcoholic Beverages
Apparel
Appliances
Automotive
Education
Electronics
Entertainment
Financial Services
Food
Household
Magazines/Newspapers
Non-Alcoholic Beverages
Personal Care
Healthcare/Pharmaceutical
Restaurants
Sports-Related
Telecommunications
Travel
About Performics
1345789
11121315161719202123242527
© 2011 All rights reserved. Performics. Proprietary and Confidential.
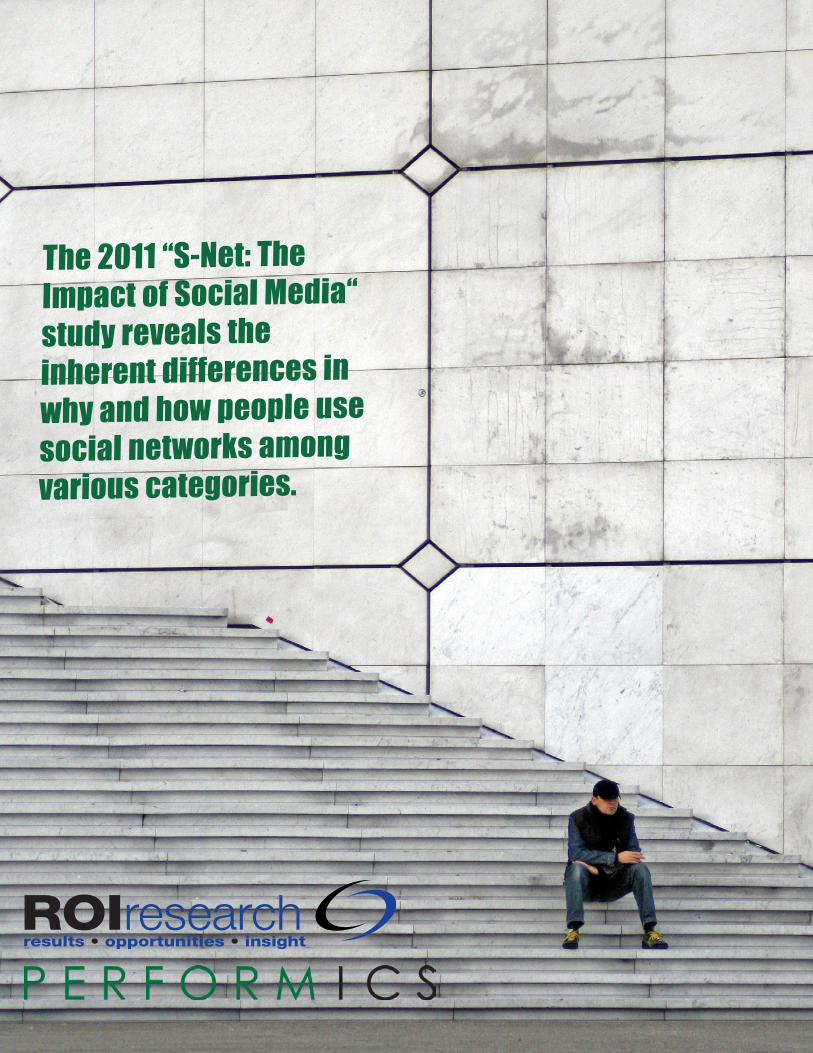
The 2011 “S-Net: The Impact of Social Media“ study reveals the inherent differences in why and how people use social networks among various categories.
Categories Studied: Alcoholic Beverages Entertainment Non-Alcoholic BeveragesApparel Financial Services Personal CareAppliances Food RestaurantsAutomotive Healthcare/Pharmaceutical Sports-RelatedEducation Household TelecommunicationsElectronics Magazines/Newspapers Travel
What this Means for Marketers:Social networkers crave participation with the companies or brands they like/follow so it’s important to adoptperformance marketing strategies that engage participants in every channel of your media mix – across all platforms, devices, and screens.
However, because the desired involvement differs in each product category, you must develop a social media strategy tailored specifically to your audience. Strategies and tactics can be experimental and updated quickly because of the fluid nature of social networking.
Best practices for marketers looking to make the most of social networks include:• Understand your customer base and their desired levels of brand interaction• Create and adapt strategies to meet participation expectations • Allocate time and resources to the most relevant and appropriate social networks• Regularly monitor and measure social network activity• Adjust strategies and tactics as necessary to optimize engagement
Social networks are changing the way people behave, resulting in new opportunities for companies and brands. The S-Net (The Impact of Social Media) study, from ROI Research Inc. sponsored by Performics, was conducted to better understand how marketers can capitalize on emerging opportunities in the social media space. The results of this research show how participants use social networks in their daily lives and how participants utilize social networks in each product category.
Social Media: Marketing Implications
1
To learn how Performics performance marketing solutions will increase participant engagement with your brand, contact your Performics account team or email us at: [email protected]

52% strongly or somewhat agree that voicing opinions on social networking sites can influence business decisions of companies/brands

I am loyal customer of the brand
Coupons/discounts
I really identify with the brand/retailer
Makes me feel like a valued customer
My friends are fans
New product announcements
A friend recommended I become a fan
Sales announcements
Makes me feel connected to others
with similar interests
Reas
ons f
or Li
king
/Fol
lowi
ng an
Alco
holic
Beve
rage
Bran
d
13%
16%
15%
15%
18%
18%
23%
26%
49%
Discussion topics:• 36% - express satisfaction with a purchase
• 25% - compare prices
• 18% - give advice
Reasons for liking/following:• 49% - loyal customers of the brand
• 26% - coupons/discounts
• 23% - identify with the brand
Desired brand interaction:• 34% - coupons
• 29% - notifications of sales or deals
• 26% - information about contests or sweepstakes
Alcoholic Beverage Brands Draw in Loyal Customers
3
Social Chatter: Customers Talk, Do You Listen?
43% who purchase alcoholic beverages discuss them on social networks
15% have purchased as a result of content on a social network

To compare prices
To compare products
To express satisfaction with a purchase, brand
or retailer
To talk about salesor specials
To get advice on what to purchase
To give advice
To provide feedback to a company/brand
To talk about where to purchase online
To express disappointment about a
purchase or company/brand
To talk about where to purchase offline
To connect with customer service
Disc
ussi
on To
pics
on Ap
pare
l Bra
nds S
ocia
l Net
work
s
11%
16%
18%
20%
21%
21%
23%
36%
40%
42%
45%
Discussion topics:• 45% - compare prices
• 42% - compare products
• 40% - express satisfaction with a purchase
Reasons for liking/following:• 53% - coupons/discounts
• 48% - sales announcement
• 45% - loyal customers of the brand
Desired brand interaction:• 43% - coupons
• 41% - notifications of sales or deals
• 26% - offers to win “points” or online currency redeemable for products
Apparel Brand Social Networkers Want the Best Deals
4
Social Chatter: Customers Talk, Do You Listen?
43% who purchase apparel discuss them on social networks
17% have purchased as a result of content on a social network
42%
39%
34%
33%
33%
31%
30%
28%
28%
26%
25%
24%
23%
22%
21%
19%
17%
Alcoholic Be
vera
ges
Non-Alcoholic
Beve
rages
Food Br
andsApparel
Ente
rtainment
Magazines/N
ewspapers
Sports
-RelatedResta
urant
Household Products
Educatio
nal Inst.
CPGTra
vel
Auto
Telecommunicatio
ns
Healthcare/P
harma
Financial S
ervicesEle
ctronics
Appliances 46%
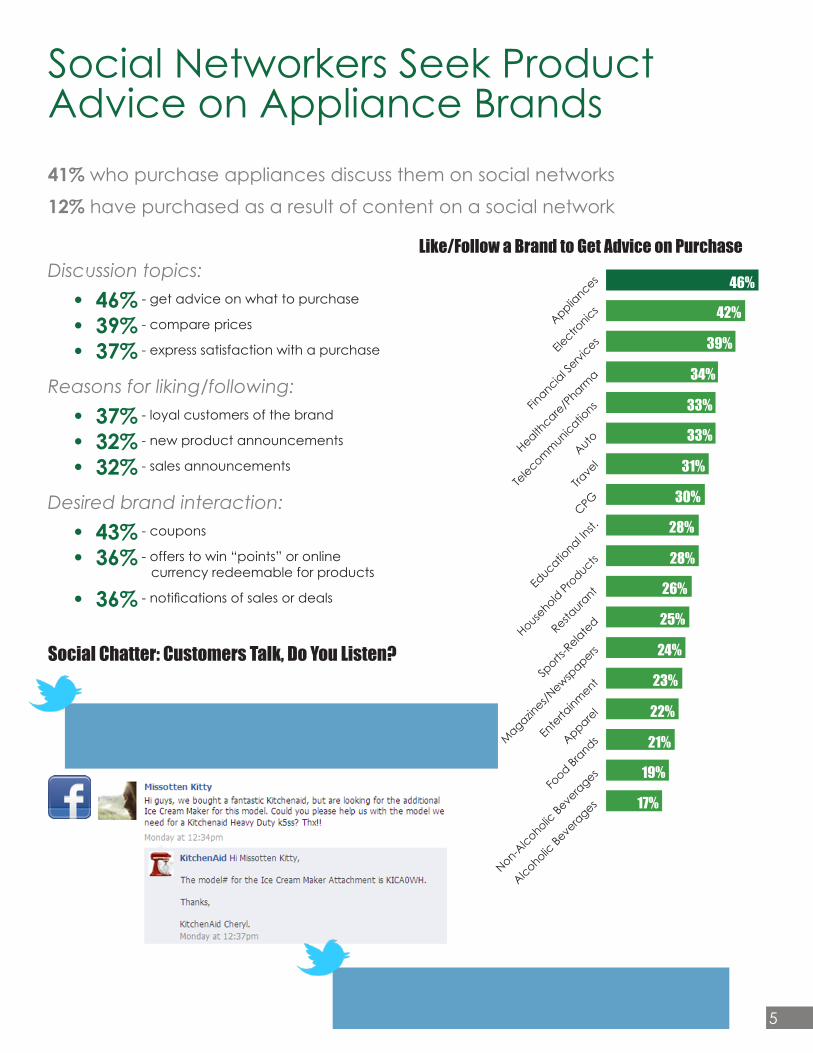
Discussion topics:• 46% - get advice on what to purchase
• 39% - compare prices
• 37% - express satisfaction with a purchase
Reasons for liking/following:• 37% - loyal customers of the brand
• 32% - new product announcements
• 32% - sales announcements
Desired brand interaction:• 43% - coupons
• 36% - offers to win “points” or online currency redeemable for products
• 36% - notifications of sales or deals
Social Networkers Seek Product Advice on Appliance Brands
Like/Follow a Brand to Get Advice on Purchase
5
Social Chatter: Customers Talk, Do You Listen?
41% who purchase appliances discuss them on social networks
12% have purchased as a result of content on a social network

53% said products, services or companies should communicate with fans on social networking sites at least once per week

9%
9%
13%
13%
13%
13%
13%
13%
15%
16%
17%
17%
20%
20%
21%
25%
27%
28%
Alcoholic Be
vera
ges
Non-Alcoholic
Beve
rages
FoodApparel
Ente
rtainment
Magazines/N
ewspapers
Sports
-Related
Restaura
nts
Household
Educatio
n
CPG/Perso
nal Care
Trave
l
Auto
Telecommunicatio
ns
Healthcare/P
harma
Financial S
ervices
Electro
nics
Appliances
Discussion topics:• 42% - compare prices
• 38% - express satisfaction with a purchase
• 33% - get advice on what to purchase
Reasons for liking/following:• 42% - loyal customers of the brand
• 35% - coupons/discounts
• 32% - identify with the brand
Desired brand interaction:• 48% - coupons
• 43% - notifications of sales or deals
• 42% - information about contests or sweepstakes
Automobile Brands Feel Connected to Each Other
Like/Follow Because They Feel Connected to Others with Similar Interests
7
Social Chatter: Customers Talk, Do You Listen?
67% who purchase automobiles discuss them on social networks
21% have purchased as a result of content on a social network

Alcoholic Be
vera
ges
Non-Alcoholic
Beve
rages
Food
Apparel
Ente
rtainment
Magazines/N
ewspapers
Sports
-Related
Restaura
nts
Household
Educatio
n
CPG/Perso
nal Care
Trave
l
Auto
Telecommunicatio
ns
Healthcare/P
harma
Financial S
ervices
Electro
nics
Appliances
16%
18%
19%
20%
20%
21%
21%
22%
23%
24%
25%
26%
26%
28%
34%
39%
39%
45%
Discussion topics:• 33% - give advice
• 28% - get advice
• 26% - compare prices
Reasons for liking/following:• 34% - loyal customers of the brand
• 29% - friends are fans
• 28% - identify with the brand
Desired brand interaction:• 56% - coupons
• 48% - information about contests or sweepstakes
• 48% - notifications of sales or special deals
Education Brand Social Networkers Want Lifestyle Information
Like/Follow Because They Want Information Relevant to Lifestyle
8
Social Chatter: Customers Talk, Do You Listen?
71% who purchase educational products discuss them on social networks
29% have purchased as a result of content on a social network

Alcoholic Be
vera
ges
Non-Alcoholic
Beve
rages
Food Br
ands
Apparel
Ente
rtainment
Magazines/N
ewspapers
Sports
-Related
Restaura
ntsHouse
hold Products
Educatio
nal Inst.
CPG/Perso
nal Care
Trave
l
Auto
Telecommunicatio
ns
Healthcare/P
harmaFin
ancial Servi
ces
Electro
nics
Appliances
14%
18%
21%
23%
23%
24%
24%
25%
25%
26%
27%
28%
29%
31%
31%
32%
33%
39%Discussion topics:• 46% - compare prices
• 46% - express satisfaction with a purchase, brand or retailer
• 26% - get advice on what to purchase
Reasons for liking/following:• 47% - loyal customers of the brand
• 42% - coupons/discounts
• 39% - sales announcements
Desired brand interaction:• 48% - coupons
• 43% - offers to win “points” or online currency redeemable for products
• 43% - notifications of sales or special deals
Electronic Brand Social Networkers Give Out Most Advice
Give Advice on Social Networks
9
Social Chatter: Customers Talk, Do You Listen?
63% who purchase electronic products discuss them on social networks
22% have purchased as a result of content on a social network

31% purchase more from companies/brands that they like/follow over other brands/companies

Food
Food
Apparel
Apparel
Ente
rtainment
Ente
rtainment
Restaura
nts
Restaura
nts
Electro
nics
Electro
nics
35%
46%
41%
40%
35%
29%
35%
36%
37%
46%
Food
Food
Apparel
Apparel
Ente
rtainment
Ente
rtainment
Restaura
nts
Restaura
nts
Electro
nics
Electro
nics
35%
46%
41%
40%
35%
29%
35%
36%
37%
46%
Discussion topics:• 48% - express satisfaction with a purchase,
brand or retailer
• 26% - compare prices
• 26% - sales or specials
Reasons for liking/following:• 42% - coupons/discounts
• 33% - loyal customer of the brand
• 33% - new product announcements
Desired brand interaction:• 36% - coupons
• 35% - notifications of sales or special deals
• 34% - information about contests or sweepstakes
Facebook Fans & Twitter Followers Most Drawn to Entertainment Brands
Brands Followed on Twitter
Brands Liked on Facebook
11
Social Chatter: Customers Talk, Do You Listen?
74% who purchase entertainment products discuss them on social networks
22% have purchased as a result of content on a social network
Alcoholic Be
vera
ges
Non-Alcoholic
Beve
rages
Food Br
ands
Apparel
Ente
rtainment
Magazines/N
ewspapers
Sports
-Related
Restaura
nts
Household Products
Educatio
nal Inst.
CPG/Perso
nal Care
Trave
l
Auto
Telecommunicatio
ns
Healthcare/P
harma
Financial S
ervices
Electro
nics
Appliances
6%
6%
9%
9%
9%
9%
9%
10%
11%
11%
11%
13%
15%
16%
17%
22%
26%
30%
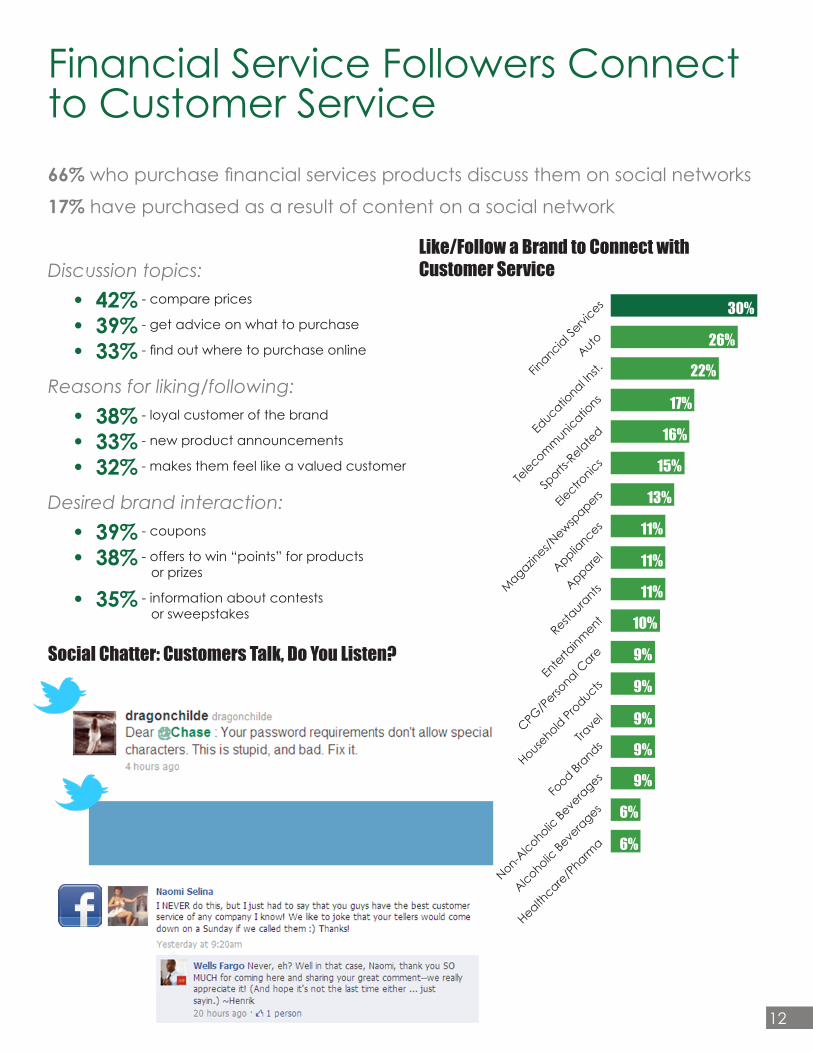
Discussion topics:• 42% - compare prices
• 39% - get advice on what to purchase
• 33% - find out where to purchase online
Reasons for liking/following: • 38% - loyal customer of the brand
• 33% - new product announcements
• 32% - makes them feel like a valued customer
Desired brand interaction:• 39% - coupons
• 38% - offers to win “points” for products or prizes
• 35% - information about contests or sweepstakes
Financial Service Followers Connect to Customer Service
Like/Follow a Brand to Connect with Customer Service
12
Social Chatter: Customers Talk, Do You Listen?
66% who purchase financial services products discuss them on social networks
17% have purchased as a result of content on a social network
Coupons/discounts Reas
ons f
or Li
king
/Fol
lowi
ng Fo
od Br
and
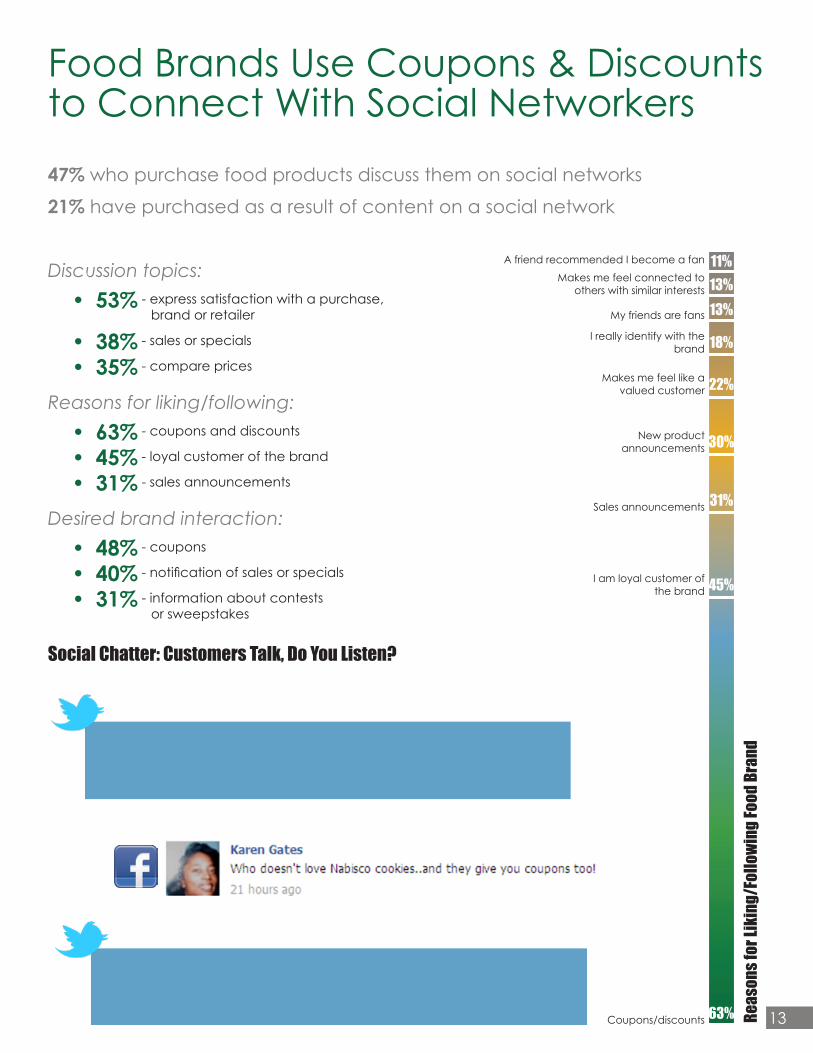
63%
I am loyal customer of the brand 45%
Sales announcements 31%
New product announcements 30%
Makes me feel like a valued customer 22%
I really identify with the brand 18%
My friends are fans 13%
Makes me feel connected to others with similar interests 13%
A friend recommended I become a fan 11%Discussion topics:• 53% - express satisfaction with a purchase,
brand or retailer
• 38% - sales or specials
• 35% - compare prices
Reasons for liking/following:• 63% - coupons and discounts
• 45% - loyal customer of the brand
• 31% - sales announcements
Desired brand interaction:• 48% - coupons
• 40% - notification of sales or specials
• 31% - information about contests or sweepstakes
Food Brands Use Coupons & Discounts to Connect With Social Networkers
13
Social Chatter: Customers Talk, Do You Listen?
47% who purchase food products discuss them on social networks
21% have purchased as a result of content on a social network

50% get and
50% give advice about products/services, companies or brands on social networking sites

Coupons/discounts Reas
ons f
or Li
king
/Fol
lowi
ng a
Hous
ehol
d Bra
nd
65%
New product announcements 38%
I am loyal customer of the brand 35%
Sales announcements 30%
Makes me feel like a valued customer 26%
I really identify with the brand 22%
A friend recommended I become a fan 14%
My friends are fans 13%
Makes me feel connected to others with similar interest 13%Discussion topics:
• 53% - express satisfaction with a purchase, brand or retailer
• 40% - talk about sales or specials
• 35% - compare prices
Reasons for liking/following:• 65% - coupons
• 38% - new product announcements
• 35% - loyal customer of the brand
Desired brand interaction:• 46% - coupons
• 39% - notification of sales or specials
• 31% - offers to win “points” or online currency redeemable for products or prizes
Coupons & Discounts Draw People to Household Brands’ Social Networks
15
Social Chatter: Customers Talk, Do You Listen?
28% who purchase household products discuss them on social networks
13% have purchased as a result of content on a social network

Alcoholic Be
vera
ges
Non-Alcoholic
Beve
rages
Food
ApparelEnte
rtainment
Magazines/N
ewspapers
Sports
-Related
Restaura
nts
Household
Educatio
n
CPG
Trave
lAuto
Telecommunicatio
ns
Healthcare/P
harma
Financial S
ervices
Electro
nicsApplia
nces
13%
18%
22%
22%
22%
23%
24%
24%
25%
25%
26%
26%
28%
28%
29%
32%
36%
37%
Discussion topics:• 28% - sales or specials
• 28% - express satisfaction with a purchase, brand, or retailer
• 27% - provide feedback to a company
Reasons for liking/following:• 44% - loyal customers of the brand
• 37% - identify with the brand
• 34% - coupons/discounts
Desired brand interaction:• 46% - coupons
• 39% - notification of sales or specials
• 31% - offers to win “points” or online currency redeemable for products or prizes
Social Networkers Personally Identify with Magazine/Newspaper Brands
Like/Follow a Brand Because They Identify with Brand
16
Social Chatter: Customers Talk, Do You Listen?
48% who purchase magazines/newspapers products discuss them on social networks
17% have purchased as a result of content on a social network

To express satisfaction with a purchase, brand
or retailer Disc
ussi
on To
pics
on No
n-Al
coho
lic Be
vera
ges S
ocia
l Net
work
s
48%
To compare prices 30%
To talk about sales or specials 24%
To provide feedback to a company/brand 23%
To get advice on what to purchase 19%
To express disappointment about a purchase or
company/brand 18%
To give advice 14%
To talk about where to purchase offline 12%
To connect with customer service 9%To talk about where to purchase online 5%
Discussion topics:• 48% - express satisfaction with a purchase,
brand or retailer
• 30% - compare prices
• 24% - sales or specials
Reasons for liking/following: • 55% - loyal customers of the brand
• 51% - coupons/discounts
• 29% - sales announcements
Desired brand interaction:• 38% - coupons
• 32% - notification of sales or specials
• 27% - offers to win “points” or online currency redeemable for products or prizes
Loyal Customers Express Satisfaction to Non-Alcoholic Beverage Brands
17
Social Chatter: Customers Talk, Do You Listen?
27% who purchase non-alcoholic beverages products discuss them on social networks
8% have purchased as a result of content on a social network
24% have made a purchase directly as a result of something posted on a social network

Alcoholic Be
vera
ges
Non-Alcoholic
Beve
rages
Food
Apparel
Ente
rtainment
Magazines/N
ewspapers
Sports
-Related
Restaura
nts
Household
Educatio
n
CPG/Perso
nal Care
Trave
l
Auto
Telecommunicatio
ns
Healthcare/P
harma
Financial S
ervices
Electro
nics
Appliances
18%
24%
26%
31%
33%
34%
35%
37%
42%
42%
50%
53%
53%
55%
58%
63%
65%
67%
Discussion topics:• 48% - express satisfaction with a purchase,
brand or retailer
• 45% - sales or specials
• 43% - compare prices
Reasons for liking/following:• 67% - coupons/discounts
• 43% - sales announcements
• 41% - new products announcements
Desired brand interaction:• 43% - coupons
• 36% - notification of sales or specials
• 31% - offers to win “points” or online currency redeemable for products or prizes
Personal Care Product Brands Entice with Coupons & Discounts
Like/Follow Because They Want Coupons/Discounts
19
Social Chatter: Customers Talk, Do You Listen?
31% who purchase personal care products discuss them on social networks
13% have purchased as a result of content on a social network

Coupons/discounts Reas
ons f
or Fo
llowi
ng/L
ikin
g Pha
rmac
eutic
al Co
mpa
nies
58%
Sales announcements 30%
New product announcements 27%
My friends are fans 24%
I am loyal customer of the brand 22%
Makes me feel like a valued customer 22%
A friend recommended I become a fan 18%
I really identify with the brand 13%
Makes me feel connected to others with similar interests 9%Discussion topics:
• 38% - express satisfaction with a purchase, brand or retailer
• 34% - get advice about what to purchase
• 32% - compare prices
Reasons for liking/following:• 58% - coupons/discounts
• 30% - sales announcements
• 27% - new products announcements
Desired brand interaction:• 35% - coupons
• 30% - offers to win “points” or online currency redeemable for products or prizes
• 30% - information about contests or sweepstakes
Pharmaceutical Brands Use Coupons & Discounts to Connect
20
Social Chatter: Customers Talk, Do You Listen?
32% who purchase pharmaceutical products discuss them on social networks
10% have purchased as a result of content on a social network

To express satisfaction with a purchase, brand
or retailer Disc
uss T
opic
s on R
esta
uran
t Bra
nd So
cial
Netw
orks
60%
To compare prices 32%
To talk about sales or specials 32%
To get advice on what to purchase 26%
To provide feedback to a company/brand 26%
To express disappointment about a purchase or
company/brand 25%
To give advice 23%
To talk about where to purchase offline 15%To connect with customer service 11%
To talk about where to purchase online 10%Discussion topics:• 60% - express satisfaction with a purchase,
brand or retailer
• 32% - compare prices
• 32% - sales or specials
Reasons for liking/following: • 55% - coupons/discounts
• 52% - loyal customer of the brand
• 32% - sales announcements
Desired brand interaction:• 49% - coupons
• 42% - getting notification of sales or special deals
• 38% - offers to win “points” or online currency redeemable for products or prizes
Restaurant Goers Express Brand & Experience Satisfaction
21
Social Chatter: Customers Talk, Do You Listen?
57% who purchase from restaurants discuss them on social networks
30% have purchased as a result of content on a social network

60% are at least somewhat likely to take action when a friend posts something about a product/service, company or brand

Alcoholic Be
vera
ges
Non-Alcoholic
Beve
rages
Food
Apparel
Ente
rtainment
Magazines/N
ewspapers
Sports
-Related
Restaura
nts
Household
Educatio
n
CPG/Perso
nal Care
Trave
l
Auto
Telecommunicatio
ns
Healthcare/P
harma
Financial S
ervices
Electro
nics
Appliances
8%
10%
12%
13%
13%
15%
17%
17%
17%
17%
21%
21%
21%
22%
22%
29%
30%
32%
Discussion topics:• 33% - compare prices
• 32% - express satisfaction with a purchase
• 32% - give advice
Reasons for liking/following:• 42% - loyal customer of the brand
• 37% - coupons/discounts
• 32% - new product announcements
Desired brand interaction:• 42% - loyal customer of the brand
• 37% - coupons/discounts
• 32% - new product announcements
Sports-Related Social Networks Influence Product Purchases
Buy Because of Something Posted on a Social Network
23
Social Chatter: Customers Talk, Do You Listen?
79% who purchase sports-related products discuss them on social networks
32% have purchased as a result of content on a social network

To express satisfaction with a purchase, brand
or retailer Disc
ussi
on To
pics
on Te
leco
mm
unic
atio
n Bra
nd So
cial
Netw
orks
50%
To compare prices 39%
To talk about sales or specials 35%
To get advice on what to purchase 33%
To express disappointment about a purchase or
company/brand 28%
To provide feedback to a company/brand 25%
To give advice 24%
To talk about where to purchase offline 18%
To talk about where to purchase online 17%
To connect with customer service 17%Discussion topics:
• 50% - express satisfaction with a purchase
• 39% - compare prices
• 35% - sales or specials
Reasons for liking/following:• 51% - loyal customer of the brand
• 40% - new product announcements
• 36% - sales announcements
Desired brand interaction:• 43% - coupons
• 38% - notification of sales or special deals
• 37% - offers to win “points” or online currency redeemable for products or prizes
Telecommunication Brands Draw in Customers Who Express Satisfaction
24
Social Chatter: Customers Talk, Do You Listen?
57% who purchase telecom products discuss them on social networks
21% have purchased as a result of content on a social network
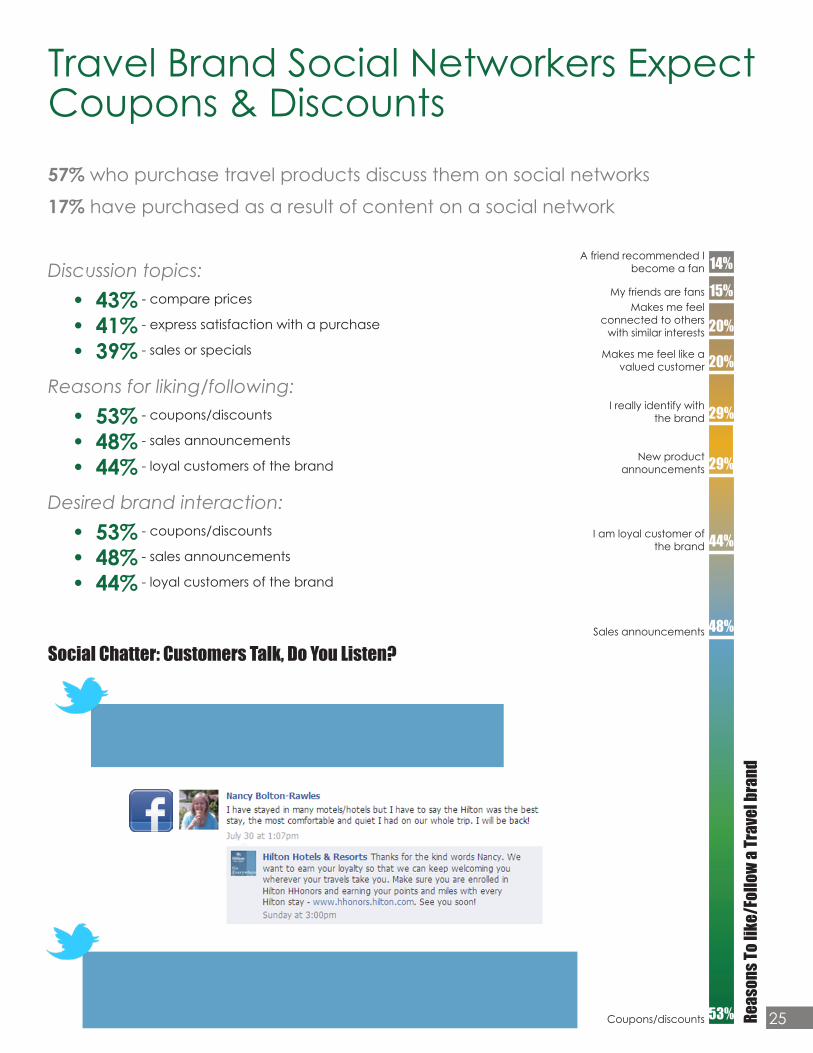
Coupons/discounts Reas
ons T
o lik
e/Fo
llow
a Tra
vel b
rand
53%
Sales announcements 48%
I am loyal customer of the brand 44%
New product announcements 29%
I really identify with the brand 29%
Makes me feel like a valued customer 20%
Makes me feel connected to others
with similar interests 20%
My friends are fans 15%
A friend recommended I become a fan 14%Discussion topics:
• 43% - compare prices
• 41% - express satisfaction with a purchase
• 39% - sales or specials
Reasons for liking/following:• 53% - coupons/discounts
• 48% - sales announcements
• 44% - loyal customers of the brand
Desired brand interaction:• 53% - coupons/discounts
• 48% - sales announcements
• 44% - loyal customers of the brand
Travel Brand Social Networkers Expect Coupons & Discounts
25
Social Chatter: Customers Talk, Do You Listen?
57% who purchase travel products discuss them on social networks
17% have purchased as a result of content on a social network
59% use social networks to compare prices
56% do so to talk about sales or specials

About the Study
S-Net (The Impact of Social Media), a report from ROI Research Inc., sponsored by Performics, used a 30-min-ute online survey to collect responses in April 2011 from 2,997 people who access at least one social network regularly. The objective of this study was to determine how various segments of people use social networks in their daily lives, specifically with regard to the purchase process for different types of products and in relation to other media channels.
About Performics
Performics is the first global performance marketing company partnering with marketers to make smart marketing decisions that improve ROI. Founded in 1998, our performance specialists are certified experts in search, affiliate & feeds, and social & display channels across all screens. Performics, headquartered in Chicago with presence in 14 countries and regional hubs in London, Paris, and Singapore, is part of Publicis Groupe -- the world’s third largest communications group and top global search spender.
Connect with us: www.performics.com | blog.performics.com | facebook | @performics
About ROI Research
ROI Research Inc. is a leader in consumer insights and multi-channel consumer behaviors. Since 2002, ROI has provided its clients with data-driven marketing strategies that optimize marketers’ ability to communicate with consumers for acquisition targeting, viral propagation and to drive consumers deeper into the engagement funnel. ROI leverages a number of proprietary tools and technologies to gain an in-depth understanding of consumer attitudes and behaviors, then works closely with its clients to develop, implement and measure the effect of strategic marketing initiatives. Top businesses that rely on ROI Research for marketing insights include: Microsoft, Google, Epsilon and Genentech. For more information, please visit www.roiresearch.com.
27