Performance Study of Block ACK and Reverse Direction in ...
31
Performance Study of Block ACK and Reverse Direction in IEEE 802.11n using a Markov Chain Model Md. Akbar Hossain, Nurul I Sarkar, Jairo Gutierrez, William Liu School of Computer and Mathematical Sciences Auckland University of Technology Auckland 1010, New Zealand Abstract IEEE 802.11n networks are widely used in home and corporate network en- vironments because they offer high-speed wireless Internet access at relatively low-cost. The 802.11n standard introduced several key features including Block acknowledgement (ACK) and reverse direction (RD) data transmission for en- hanced system performance. An in-depth study of 802.11n system capacity for Block ACK mechanisms (both protected and unprotected) and RD data flows is required to assist optimum planning and design of such systems in view of the limited wireless channel capacity. In this paper we study the interdependencies of Block ACK and RD mechanisms using a discrete bi-directional Markov chain model under non-saturated traffic loads. We present a mathematical model to derive throughput, delay, and packet loss probability for both protected and unprotected Block ACKs under varying loads. We validate the model using MATLAB based numerical studies. Results obtained show that the combined effect of protected Block ACK and RD flows has a positive impact on system per- formance. However, unprotected Block ACK wastes transmission opportunity (TXOP) especially in collisions and therefore degrades the system performance. Our findings reported in this paper provide some insights into the performance of 802.11n with respect to Block ACK and RD methods. This study may help network researchers and engineers in their contribution to the development of next generation wireless LANs such as IEEE 802.11ac.
Transcript of Performance Study of Block ACK and Reverse Direction in ...

Performance Study of Block ACK and ReverseDirection in IEEE 802.11n using a Markov Chain Model
Md. Akbar Hossain, Nurul I Sarkar, Jairo Gutierrez, William Liu
School of Computer and Mathematical Sciences
Auckland University of Technology
Auckland 1010, New Zealand
Abstract
IEEE 802.11n networks are widely used in home and corporate network en-
vironments because they offer high-speed wireless Internet access at relatively
low-cost. The 802.11n standard introduced several key features including Block
acknowledgement (ACK) and reverse direction (RD) data transmission for en-
hanced system performance. An in-depth study of 802.11n system capacity for
Block ACK mechanisms (both protected and unprotected) and RD data flows
is required to assist optimum planning and design of such systems in view of the
limited wireless channel capacity. In this paper we study the interdependencies
of Block ACK and RD mechanisms using a discrete bi-directional Markov chain
model under non-saturated traffic loads. We present a mathematical model to
derive throughput, delay, and packet loss probability for both protected and
unprotected Block ACKs under varying loads. We validate the model using
MATLAB based numerical studies. Results obtained show that the combined
effect of protected Block ACK and RD flows has a positive impact on system per-
formance. However, unprotected Block ACK wastes transmission opportunity
(TXOP) especially in collisions and therefore degrades the system performance.
Our findings reported in this paper provide some insights into the performance
of 802.11n with respect to Block ACK and RD methods. This study may help
network researchers and engineers in their contribution to the development of
next generation wireless LANs such as IEEE 802.11ac.
Keywords: Medium Access Control; Block ACK; Markov Chain; Reverse
Direction; Distributed Coordination Function
1. Introduction
IEEE 802.11-based wireless local area networks (WLANs) are widely adopted
in home and corporate networking environments due to their simplicity in oper-
ation, robustness, low cost, well-defined standards (e.g. 802.11a/b/g/n) and the
user mobility offered by the technology. In the 802.11 standard, the distributed
coordination function (DCF) is defined as a mandatory medium access control
(MAC) protocol and the point coordination function(PCF) is optional [1]. The
performance of DCF has been analyzed extensively using mathematical mod-
eling and simulation [2][3][4]. In [2], Bianchi proposed a Markov chain model
for a backoff mechanism to evaluate the throughput under saturated traffic and
error free channel condition. Bianchi’s work assume that packets will eventually
transmitted regardless of the no. of retransmissions. However, a station (STA)
will increase its contention window size after each failed transmission until it
reaches the maximum backoff stage. Since the maximum backoff stage and retry
limit are not equal, the contention window size remains the same and STA will
continue retransmitting until it reaches a retry limit. If the subsequent trans-
mission is not successful, the packet is discarded. The authors in [5], developed
a Markov model which considers a finite retry limit for the transmission control
protocol (TCP) over WLANs. They considered saturated traffic loads under
ideal channel conditions. The extension of Bianchi’s model was reported in [6]
for finite load analysis. However, the maximum capacity of a wireless node is
bounded by queue delays [7]. A finite load Markov model is presented in [7] by
integrating a queue model as a new state with a Bianchi model assuming the
STA queue is empty after successful transmission. All of these models are well
studied for 802.11(a/b/g) networks. The fundamental goal of these models is to
study the DCF protocol behavior under different channel and load conditions.
The common thread of these studies is that the system performance can be
2

enhanced by reducing MAC overheads.
The 802.11e standard [1] published in 2005, proposed a new MAC method
called hybrid access method(HCF). A new ACK scheme is being introduced
in the 802.11e standard known as BA. Unlike the traditional ACK scheme, an
ACK is transmitted to reply to multiple data frames rather than per frame as in
BA. Hence, the Markov model that has been developed for the traditional DCF
protocol does not fit well with the BA scheme used to investigate the system
throughput performance. Authors in [8] developed a Markov model for the BA
and showed that a block with multiple frames can offers higher throughput than
the traditional ACK based two-way or four-way transmission under saturated
load and infinite retransmission conditions. But, when the frame consists of only
one data frame it suffers from severe throughput degradation due to a couple of
additional frames (e.g.BA request and BA). Moreover, it is assumed that data
frames received with errors are considered a successful transmission, thus the
contention window is reset. Unfortunately, according to the standard, receivers
will not acknowledge the error data frame. Consequently, the sender has to
retransmit the frame and increase the contention window if it does not reach
a maximum contention value. Further enhancement of [8] is reported in [4] by
introducing a protected BA mechanism. The work reported in [4] inspired by
further extensions of finite load conditions and integrating the RD features of
802.11n. Beside the BA scheme, frame aggregation mechanism is widely stud-
ied in recent literature to enhance the performance of 802.11n networks. In [9]
discrete time Markov chain model is used to analyse the post backoff behavior
due to frame aggregation under an error free environment. The performance
study shows that, MAC service data unit (MSDU) outperforms the MAC proto-
col data unit (MPDU) as frame aggregation size becomes larger. An empirical
study performs in [10] also confirms that a significant performance enhance-
ment can be achieved when the frame aggregation and BA schemes are utilized.
However, under an error prone channel frame aggregation mechanism experience
severe throughput degradation and higher access delay due subframes size [11].
So far, we only consider the unidirectional data transmission. A bi-dimensional
3

Markovian model presented in [12] shows that, bidirectional data transmission
significantly enhance the overall network performance. Most of the previous
studies on performance enhancement of 802.11n have focused on frame aggrega-
tion mechanisms. Very limited studies have actually analyzed the throughput
performance of 802.11n under non-ideal channel conditions using Markov chains.
The main contribution of this paper is three fold. First, we present a sim-
ple Markov model to study the performance of 802.11n standard under non-
saturated traffic load. A detailed Markov chain model is developed by consid-
ering all possible constrains including load conditions, retry limits and channel
state information. Second, we derived both Throughput and Packet delay for
both the protected BA and non-protected BA schemes. Third, the effect of
load conditions is analyzed in terms of packet loss probability. Moreover, an
extensive MATLAB based numerical studies is presented to validate analytical
model.
The rest of the paper is organized as follows: We describe the BA and RD
mechanisms in Section 2. Section 3 presents a detailed discrete Markov model for
802.11n with a protected BA mechanism followed by three different subsections
throughput, packet delay probability and mean delay (including MAC delay and
Queue delay in consecutive subsections) analysis. A detailed numerical study
including a comparative study of various mechanisms is presented in Section 4.
A brief discussion in Section 5 ends the paper.
2. Preliminaries
2.1. Block ACK Mechanism
The Block ACK mechanism was first introduced in [1] to reduce the MAC
overhead of 802.11e and later in 802.11n. The basic idea of the BA mecha-
nism is to aggregate several ACK frames into a single frame. There are two
different types of Block ACK mechanisms: Immediate (Im) and Delayed (D)
Block ACK. A further extension of 802.11n for High Throughput(HT) opera-
tions classifies each of these Block ACK schemes in two subclasses: Protected
4

and non-protected Block ACKs. The scope of this paper is limited to the Im-
Block ACK scheme for both protected and non-Protected modes. In the Im-
Block ACK scheme, transmitters and receivers are known as originators and
recipients, respectively. To initialize the new acknowledgement policy, the orig-
inator and the recipient will exchange Add Block Acknowledgement(ADDBA)
Request/Response frames. Afterwards, a data block with multiple data frames is
transmitted from the originator to the recipient with Block ACK Request(BAR)
at the end. The number of data frames in one data block is bounded by the
receiver buffer size. The recipient sends a Block Acknowledgement (BA) frame
for the the entire data block. Figure1(a) shows the protected Block ACK chan-
nel access mechanism. In protected Block ACK, before transmitting an entire
data burst, the originator will transmit a single data frame and wait for an ACK
from the recipient. After the successful reception of an ACK frame, the origina-
tor initiates the transmission opportunity (TXOP) period to transmit the data
burst. Therefore, if there is an error or channel collision,this problem would
only be experienced by the first data frame or ACK frame. This concept is
most likely an RTS/CTS based four-way handshake (shown in Fig. 1(c)) mech-
anism except when using a special RTS/CTS frame where as the non-protected
Block ACK mechanism is based on a two-way handshake mechanism. The time
diagram of the non-protected Block ACK mechanism is depicted in Fig.1. In
terms of throughput as a performance metric, protected Block ACK should out-
perform the non-protected Block ACK scheme by reducing the wasted time due
to collision or channel errors.
2.2. Reverse Direction
We propose an efficient reverse direction (RD) data exchange protocol to im-
prove QoS support and overall efficiency of the IEEE 802.11n standard for high
rate physical layer. The RD protocol provides mechanisms that significantly re-
duce the MAC-overhead while retaining full compatibility with legacy systems.
Figure 1(c) illustrates the RD scheme with a block ACK mechanism. In this
specified transmission, the receiver may request a reverse data transmission in
5

Figure 1: Various Block ACK mechanisms with Reverse Direction
the CTS control frame. This allows the transportation of data frames and also
aggregates frames, in both directions, in one Transmission Opportunity (TXOP)
period. Until now, when the sender STA is allocated with a TXOP, it informs
surrounding STAs about how long the wireless medium will be engaged. Hence,
RD achieves better results by supporting ”on-demand” bi-directional data flows
using the existing handshake protocol without any additional control frames.
Furthermore, it reduces block transmission overhead by eliminating the short
interframe space(SIFS) for transmission in both directions and relies on a single
block acknowledgement frame. Previously, for each uni-directional data trans-
fer, the initiating station needed to contend for the channel in a contention-based
wireless medium. With RD, the other stations are essentially allowed to send
information back once the transmitting station has attained a TXOP. There-
fore, two roles need to be identified: RD initiator and RD responder. The RD
initiator sends its permission to the RD responder due to a Reverse Direction
6

Grant (RDG) in the RDG/More physical layer convergence protocol (PLCP)
protocol data unit (PPDU) field of the high throughput (HT) control field. The
RD mechanism facilitates the data transmission from both sides (sender and
receiver) without further contending for the medium and reducing the number
of contentions by a factor of 1.5 to 2 [13]. Moreover, the proposed RD mecha-
nism reduces the overall MAC overhead associated with collision detection and
medium protection. A similar concept for a RD mechanism was presented in
[14],where receiver data is piggybacked with a Block ACK to the sender. Obvi-
ously this modification increases the throughput for the system but, as far as we
can ascertain, an overall performance analysis including error and MAC delay
analysis are still not found in the recent literature.
3. Markov Model for IEEE 802.11n with Protected BLOCK ACK
In this section, an analytical model is proposed to evaluate the performance
of 802.11n under non-saturated load conditions. A two dimensional Markov
model is developed to derive the channel throughput and end-to-end delay of
successful data transmissions. To simplify the mathematical model we made
the following assumptions.
(i) Finite number of stations
(ii) Unsaturated load i.e. there is a certain probability that the transmission
queue is empty
(iii) Channel is prone to errors
(iv) No hidden terminals
(v) Packets are destroyed only through collisions exceeding the retry limit
(vi) Packets are of equal length
The proposed model also takes into consideration both basic handshake (two-
way) and RTS/CTS handshake (four-way)-based channel access schemes. De-
veloping a Markov model to evaluate the DCF performance of WLANs was first
shown by using the Bianchi Model [2] under saturated loads with ideal channel
7

conditions. Unfortunately Markov Models developed for 802.11a/b/g are not
substantial enough to explain the 802.11n behavior which has distinct features
such as Protected Block ACK and Reverse Direction Data flows. In our model,
we derive both the throughput and end-to-end delays by taking into account
protected Block ACKs and Reverse Direction data flows in non-saturated load
conditions.
The fundamental access method of 802.11 is called distributed coordination
function (DCF) which is based on carrier sense multiple access with collision
avoidance (CSMA/CA). For a STA to transmit, it senses the medium to deter-
mine if another STA is in transmission. According to DCF distributed protocol
there must be a minimum time gap to identify contiguous frame sequences.
Therefore, a transmitting STA must ensure that the medium is idle for this
period before attempting to transmit. If the medium continues to be busy, the
STA defers until the end of the current transmission. After deferral, or prior
to attempting to transmit again immediately after a successful transmission,
the STA selects a random backoff interval and decrements the backoff interval
counter while the medium is idle. A transmission is successful if an acknowl-
edgement (ACK) frame is received from the targeted STA (unicast) or when a
multicast frame is sent completely. A refinement method may be used to further
reduce collisions: the transmitting and receiving STAs exchange short control
frames, request to send (RTS) and clear to send (CTS). Let n be the number
of stations (STAs)in a WLAN contending for channel access. Let b(t) and s(t)
be the stochastic processes representing the backoff counter and backoff stages
at time t respectively. Hence according to DCF, the b(t) value is decremented
at the start of every idle slot and a contending station wins the channel when
it reaches to zero. After successful transmissions if the STA has more data to
send a new value would be set for b(t). As the counter value of k = b(t) is
chosen to be uniformly distributed over k ∈ [0, CWi], where CWi stands for
the contention window size, there is a chance that two STAs end up with the
same b(t) values and transmit data simultaneously. This is called a collision. In
order to avoid further collisions, the collided STAs will generate new b(t) values
8

determined by:
CWi =
2iCWmin; i ≤ m′,
2m′CWmin = CWm; i > m′
(1)
Where CWi is an initial size for the contention window and m′ is a maximum
number by which the contention window can be doubled. In this model, m is
used to resemble the maximum backoff stage. According to the IEEE 802.11
standard, the value m could be larger than m′, while the CW will hold after
that. Therefore, every STA is modeled by a pair of integers (i, k). At the
very first time, the backoff stage i = s(t) starts at 0 and is increased by 1
everytime transmissions collide. Once the CW reaches CWm,it will remain at
this value until it is reset. That means STA will keep transmitting the packet till
it reaches the retry limit. If the transmission is still unsuccessful the packet will200
be dropped. The two-dimensional process (s(t), b(t)) will be analyzed with an
embedded Markov chain (in steady state) at time instants at which the channel
state changes. Let (i,k) denote the state of this process. At each stage the
STA is described by i, k where i stands for the backoff stage and k stands for
the backoff delay which takes any value in the range of [0, CWi − 1]. Let, pf
denote the frame failure transition probability from one stage to another (e.g.
from row i − 1 to row i in Fig.2). It is also the probability of an unsuccessful
(re)transmission attempt seen by a STA as its frame is being transmitted on
the channel. The unsuccessful (re)transmission attempt can happen due to
the collision of this station with at least one of the n − 1 remaining stations,
occurring with probability pcoll, where pcoll is
pcoll = 1− (1− τ)n−1 (2)
and/or by having a frame with errors, occurring with probability perr(due to
channel fading and/or noise). Since both events are independent, the probability
p can be expressed as:
pf = 1− (1− pcoll)(1− perr) = pcoll + perr − pcollperr (3)
9

Figure 2: Two Dimensional Markov Chain Model for 802.11n backoff
In case of an unsuccessful transmission attempt, after the backoff timer expires
in state (i, 0), the station moves to any state on row i(i, k) with probability
pf/CWi. Following a successful transmission (occurring with conditional prob-
ability pf ) while the observed station is in stage i ∈ (0,m), a new packet is
admitted in the queue, the station returns to backoff stage 0, and its backoff
timer uniformly selects any integer value in the range (0, CW0− 1) with proba-
bility (1− pf )/W0 . If the station reaches backoff stage m, and once its backoff
timer reaches 0, its frame can be successfully or unsuccessfully transmitted. In
both cases, a new frame is admitted in the queue and the station returns to back-
off stage 0,and its backoff timer is uniformly chosen in the range (0, CW0 − 1)
with probability 1/CW0. After a successful transmission or after mth failed
retransmissions, it is assumed that the buffer of the transmitting station is not
empty with probability q and empty with probability 1− q.
10

Based on the above discussion the transition probabilities of the Markov
process are determined as follows:
1. P (i, k|i, k + 1) = 1; k ∈ [0, CWi − 2], i ∈ [0,m]
The station’s backoff timer is decremented from k+1 to k at fixed i backoff
stages, i.e. the station has detected an idle slot, so the channel is idle.
2. P (0, k|i, 0) = q(1− pf )/CW0; k ∈ [0, CW0 − 1], i ∈ [0,m]
After a successful transmission with probability 1− pf , it is assumed that
there is a new packet in the transmitting STA buffer with probability q to
start a new transmission at backoff stage 0.
3. P (i, k|i− 1) = pf/CWi; k ∈ [0, CWi − 1], i ∈ [1,m]
The station’s backoff timer is changed from 0 to k and the backoff stage is
changed from i−1 to i. The probability of this event equals: Pr(transmission
is unsuccessful and number k was randomly chosen to initiate the backoff
timer at stage i)= Pr(transmission is unsuccessful) · Pr(number k was
randomly chosen to initiate the backoff timer at stage i). The probability
of unsuccessful transmission equals pf and the probability that number k
was randomly chosen to initiate the backoff timer at stage i equals 1/CWi.
4. P (m, k|m′, 0) = pf/CWm; k ∈ [0, CWm − 1]
The probability of unsuccessful transmission equals pf . The probability
that number k was randomly chosen to initiate the backoff timer at stage
m (maximum backoff stage) equals 1/CWm till reaching the retry limit.
5. P (I|i, 0) = (1− q)(1− pf ); i ∈ [0,m]
This equation represents the practical scenario i.e. unsaturated traffic
condition where the transmitting STA’s buffer is empty with probability
1 − q after a successful transmission. Hence the station will not contend
for a channel till the new packet has arrived.
6. P (I|I) = 1− q
This stage is known as the Idle stage, when STA doesn’t have any packet
in its buffer to transmit.
7. P (0, k|I) = q/CW0; k ∈ [0, CW0 − 1]
This means a new packet arrives at the buffer with probability q and
11

starts a new transmission by using a randomly chosen delay k to initiate
the backoff counter at stage 0 with probability 1/CW0
8. P (0, k|m, 0) = q/CW0; k ∈ [0, CW0 − 1]
The transition probability mentioned in the previous equation could hap-
pen when a packet is discarded due to a failure to transmit within the
retry limit. Here it is assumed that there is at least a packet in the buffer.
9. P (I|m, 0) = 1− q
If the buffer is empty with probability 1− q after the retry limit.
Let the stationary distribution of the chain be bi,k = limt→∞ P{s(t) =
i, b(t) = k}, i ∈ (0,m), k ∈ (0, CWi− 1), denoting the probability of the station
to be in state(i, k). The probability of the station to be in state (i, 0) can be
expressed as a n stage transition probability as follows:
bi−1,0 ∗ pf = bi,0 0 < i ≤ m (4)
bi,0 = pifb0,0 0 ≤ i ≤ m (5)
Since the chain is regular, for each k ∈ [0, CWi − 1]
bi,k =CWi − kCWi
q(1− pf )·
m−1∑i=0
bi,0 + bm,0 + q· bI i = 0
pfbi−1,0 0 < i ≤ m(6)
Now
bI = (1− q)(1− pf )
m∑i=0
bi,0 + (1− q)· bIbI − (1− q)bI = (1− q)(1− pf )
m∑i=0
bi,0
bI =(1− q)(1− pf )
q
m∑i=0
bi,0 (7)
12

Now from equations 6 and 7
q(1− pf )·m−1∑i=0
bi,0 + q· bI + bm,0
= q(1− pf )·m−1∑i=0
bi,0 + q· bI + bm,0
= (1− pf )[q
m−1∑i=0
bi,0 + (1− q)·m∑i=0
bi,0] + bm,0
(8)
Utilizing the relation established in Eq.(4) and make use ofm∑i=0
bi,0 =b0,01−pf ,
Eq.(6) can be written as
bi,k =CWi − kCWi
bi,0i ∈ (0,m), k ∈ (0, CWi − 1) (9)
Now by using the normalization condition for stationary distribution equa-
tion:
1 =
m∑i=0
m−1∑i=0
bi,0bi,k + bI
=
m∑i=0
bi,0
m−1∑i=0
bi,0bi,kCWi − kCWi
+ bI
=
m∑i=0
pifb0,0CWi − k
2+ bI
=b0,02
m∑i=0
pif (2iCW + 1) + bI
=b0,02
(m∑i=0
(2pf )i +
m∑i=0
pif
)+ bI
Now for m ≤ m′ (i.e the retry limit is within the range of the maximum backoff
stage)
=b0,02
((CW (1− (2pf )m+1))
1− 2pf+
1− pm+1f
1− pf
)+
(1− q)(1− pf )
q
m∑i=0
bi,0
=b0,02
((CW (1− (2pf )m+1))
1− 2pf+
1− pm+1f
1− pf
)+
(1− q)(1− pm+1f )
qb0,0
1 =b0,02
((CW (1− (2pf )m+1))
1− 2pf+
1− pm+1f
1− pf
)+
2(1− q)(1− pm+1f )
q
=b0,02
(A
q(1− 2pf )(1− pf )
)
13
where A = q(1− pf )CW (1− (2pf )m+1) + q(1− 2pf )(1− pm+1f ) + 2(1− 2pf )(1−
pf )(1− q)(1− pm+1f )
b0,0 =2q(1− 2pf )(1− pf )
A(10)
Now the probability of transmission at any random slot can be written as
τ =
m∑i=0
bi,0
=1− pm+1
f
1− pf· b0,0
τ =2q(1− 2pf )(1− pm+1
f )
A; m ≤ m′
(11)
For m ≥ m′ (i.e retry limit is greater than maximum backoff stage)
=b0,02
(
m′∑i=0
CWi +
m∑i=m′+1
pifCWi +
m∑i=0
pif ) + bI
=b0,02
(CW (1− 2pm
′+1f )(1− pf ) + (1− 2pf )(1− pm+1
f ) + 2m′CWpm
′+1f (1− 2pf )(1− pm−m
′
f )
(1− 2pf )(1− pf ))+
+(1− q)(1− pm+1
f )
qb0,0
b0,0 =2q(1− pf )(1− 2pf )
B(12)
B = q[CW (1− (2pf )mprime+1)(1− pf ) + (1− 2pf )(1− pm+1
f )+
+ 2m′CWpm
′+1f (1− 2pf )(1− pm−m
′
f )] + 2(1− q)(1− pm+1f )(1− 2pf )(1− pf )
Thus
τ =
m∑i=0
bi,0
=1− pm+1
f
1− pf· b0,0
τ =2q(1− 2pf )(1− pm+1
f )
B; m ≥ m′
(13)
So far, pf is still unknown but can be solved by using Eq.(3), where pcoll =
1− (1− τ)n−1. perr in Eq.(3), stands for the frame error probability(FER)of a
14

MAC data frame or an ACK frame for the given STA which can be expressed
as an independent events as follows:
perr = 1− (1− FERdata)(1− FERack)
= FERdata + FERack − FERdata·FERack(14)
We can rewrite FER with respect to STA’s mobility, receiver fading margin,
transmission carrier frequency, and frame duration [15].
FER = 1− exp(−ρ− fd√
2πρTp)
Where ρ is the fading margin decided by the receiver structure,fd is the max-
imum doppler frequency calculated from the STA speed and the carrier fre-
quency,and Tp represents frame duration. Hence, Eq.(3) becomes:
pf = 1− (1− τ)n−1(1− FERdata)(1− FERack) (15)
In this analysis, the unsaturated traffic behavior is characterized by defining
a MAC queue(q) in equations 11 and 13. q can be defined as the probability
that there is at least one packet to be transmitted in the STA queue. Assume,
the packet arrival rate at each STA buffer from upper layer is λ pkt/sec and µ
represent the packet processing rate assuming that the queue has a length of
K. By using a M/M/1/K queueing model[15], the probability q, that there is
at least one packet in the queue is:
q = 1−1− λ
µ
1− (λµ )K+1(16)
Here µ = τs(1−τs)n−1
σs. τs and σs are packet transmission probabilities at any
random slot and average slot times at saturated load conditions. Equations
15,11, and 13 represent a non-linear system with two unknown parameters τ
and pf having single solution which can be solved numerically.
3.1. Throughput Analysis
Let Ptr be the probability that at least one station transmits a packet in a
randomly selected slot time with probability τ and Ps is the conditional proba-
bility that an occurring packet transmission is successful. For a WLAN with n
15

contending stations, the probabilities Ptr and Ps can be written as
Ptr = 1− (1− τ)n;
Ps =nτ(1− τ)n−1
1− (1− τ)n
(17)
Considering that a random slot is empty with probability (1 − Ptr) and that
it contains a successful transmission with probability PtrPs, a collision with
probability Ptr(1 − Ps) and Perr in 14 is the probability of a channel access
failure due to channel error. According to [3], the throughput S is defined as
a ratio of successfully transmitted payload size over a randomly chosen slot
duration:
S =Ptr·Ps· (1− Perr)E[PT ]
(1− ptr)σ + PtrPs(1− Perr)Ts + Ptr(1− Ps)Tc + PtrPsPerrTe(18)
where σ is the backoff slot duration, Ts is the average time that the channel is
captured with successful transmission, Tc is the average time that the channel
is captured by stations which collide and Te is the average wasted time due
to a channel access failure caused by channel error due to mobility and fading
effects. Hence the duration of a channel slot is the period of time the channel
stays in one state:idle, fail including collision and error and finally success. Let
Tdata,Tack,Trts,Tcts,Tbar, Tba, Thob and Thack be the transmission times (mea-
sured in microseconds) of an MPDU, an ACK frame, a RTS frame, a CTS frame,
a BlockAckReq (BAR) frame, a BlockAck (BA), a Head of Brust(HOB) and a
Head of ACK(HACK) frame, respectively. As in [4] it is also assumed that the
frame could be corrupted due to either collision or channel error that leads to
retransmission and increment of the backoff stage. When using the protected
block ack mechanism, a data burst transmission cannot be initiated at TXOP
if there is an error or collision in the HOB or HACK frames [1]. Hence, a data
16

burst duration Ts,Te,Tc is given by
Ts =
Tack + Tsifs + (Tdata + Tsifs)·B + Tbar + Tsifs + Tba + TRD;
Protected Block ACK Scheme
Tdata + TTsifs)·B + Tbar + Tsifs + Tba + TRD + Tdifs;
Unprotected Block ACK Scheme
Trts + Tcts + 2Tsifs + (Tdata + Tsifs)·B + Tbar + Tsifs + Tba + TRD + Tdifs;
RTS/CTS scheme
(19)
Te =
Thob + Teifs + (Tsifs + Thack)× 1−FERhob
FERhob+FERhack−FERhobFERhack
Protected Block ACK Scheme
(Tdata + TTsifs)·B + Tbar + Tsifs + Tba + TRD + +Tdifs
Unprotected Block ACK Scheme
Trts + Teifs + (Tsifs + Tcts)× 1−FERrts
FERrts+FERcts−FERrtsFERcts
RTS/CTS scheme
(20)
Tc =
Thob + Teifs
Protected Block ACK Scheme
(Tdata + TTsifs)·B + Tbar + Tsifs + Tba + TRD + +Tdifs
Unprotected Block ACK Scheme
Trts + Teifs
RTS/CTS scheme
(21)
TRD = Tsifs+(Tdata+Tsifs)·BRD+Tbar+Tsifs+Tba (ReverseDirection) (22)
All of the above mentioned time equations consider RD transmissions which can
easily be unplugged to calculate the throughput without RD. According to [4],
17

it is also assumed that the HOB frame is always successful to gain the TXOP.
Thus E[PT ] is given by
E[PT ] =
L· (E[B]− 1)(1− FERdata) + L· (E[BRD])(1− FERdata) + L;
Protected Block ACK with RD,
L· (E[B]− 1)(1− FERdata) + L;
Protected Block ACK without RD,
L· (E[B])(1− FERdata);
RTS/CTS Method and Unprotected Block ACK.
(23)
3.2. Packet Drop Probability
The packet drop probability is the probability that a packet is dropped when
the retry limit is reached. Moreover, a packet may be dropped when the sending
queue is full. Hence the total packet drop probability is the sum of both of these
events.
3.2.1. Packet Drop Due to Retry Limit
A packet is found in the last backoff stage m if it encounters m collisions in
the previous stages and it is eventually discarded or dropped. Thus, the packet
drop probability due to reaching the retry limit can be written as a function of
the last backoff stage:
Pdrop =bm,0b0,0
pf
= pmf .pf
= pm+1f
= [1− (1− pf )(1− τ)n−1]m+1
(24)
3.2.2. Packet Drop Due to Queue
Let us consider the M/M/1/K queue system, where there are K frames in
the system shown in Fig. 3. Now, by using one of the balanced equations, the
steady state probability can be written as
18

Figure 3: M/M/1/K Queue Model
λ(1− pdrop)p0 = µp1
p1 =λ(1− pdrop)
µp0
p1 = ρp0; where, ρ =λ(1− pdrop)
µ
Similarly it can be shown that
pn = ρnp0; n = 0, 1, 2, .....K
K∑n=0
pn = 1⇒ p0 =1− λ(1−pdrop)
µ
1−(λ(1−pdrop)
µ
)K+1
Note that not all the frames arriving at the queue enter the queue because
frames are not allowed into the queue when there are already K frames in the
queue. Therefore, the frames are dropped with probability
Pk = ρkp0
=
(λ(1− pdrop)
µ
)K·
1− λ(1−pdrop)µ
1−(λ(1−pdrop)
µ
)K+1
(25)
Thus, the total probability of packet loss is
Ploss = Pdrop + PK
= [1− (1− pf )(1− τ)n−1]m+1 +
(λ(1− Pdrop)
µ
)K·
1− λ(1−Pdrop)µ
1−(λ(1−Pdrop)
µ
)K+1
(26)
19

3.3. Mean Delay
The delay D can be defined as the time elapsing from the instant the frame is
inserted in the MAC buffer to the time in which it is successfully transmitted by
receiving an acknowledgement for this frame. From this definition it is obvious
that delay is associated with two factors: a medium access delay due to the
number of contending stations and a queueing delay for load conditions and
frame processing rates at the queue. So, the average delay is
Davg = DMAC +DQ
3.3.1. MAC Delay
The MAC delay for a successfully transmitted packet is defined to be the
time interval from the time the frame is at the head of the MAC queue ready
for transmission until an acknowledgement for this packet is received. As per
[16], the average MAC delay is given by
E[DMAC ] = E[X]E[slot]
Here E[X] is the average number of slots spent for a successful transmission.
Let STA be in the i backoff stage and get the channel access with probability
ci. The average number of slots utilized by the STA in the i backoff stage is
(CWi + 1)/2, i ∈ (0,m) and the probability that the frame reaches the backoff
stage i and it is not discarded ispif−p
m+1f
1−pm+1f
, i ∈ (0,m). Hence,
E[X] =
m∑n=0
[(pif − p
m+1f )((CWi + 1)/2)
1− pm+1f
]E[slot] = (1− ptr)σ + PtrPs(1− Perr)Ts + Ptr(1− Ps)Tc + PtrPsPerrTe
E[D] =
m∑n=0
[(pif − p
m+1f )((CWi + 1)/2)
1− pm+1f
]· (1− ptr)σ + +PtrPs(1− Perr)Ts+
+ Ptr(1− Ps)Tc + PtrPsPerrTe(27)
20

3.3.2. Queueing Delay
By using Little’s formula [15], the expected time spent (i.e.queuing delay)
in the queue can be calculated as
DQ =E[N ]
λ(1− Pdrop)(28)
Here E[N ] is the expected number of packets in the queue given by
E[N ] =
K∑n=0
nPn =
K∑n=0
nρnP0
= ρP0d
dρ
(1− ρK+1
1− ρ
)= ρP0
(1− ρK+1 − (1− ρ)(K + 1)ρK
(1− ρ)2
)=
(ρ(1− ρK+1)− (1− ρ)(K + 1)ρK+1
(1− ρ)(1− ρK+1)
)E[N ] =
(ρ(1− (K + 1)ρK +KρK+1)
(1− ρ)(1− ρK+1)
)Now using equation 28, DQ becomes
DQ =
(ρ(1− (K + 1)ρK +KρK+1)
(1− ρ)(1− ρK+1)
)× 1
λ(1− Pdrop)(29)
Therefore the mean delay is given by
D =
m∑n=0
[(pif − p
m+1f )((CWi + 1)/2)
1− pm+1f
]· ((1− ptr)σ + PtrPs(1− Perr)Ts + Ptr(1− Ps)Tc+
+PtrPsPerrTe) +
(ρ(1− (K + 1)ρK +KρK+1)
(1− ρ)(1− ρK+1)
)× 1
λ(1− Pdrop)(30)
4. Numerical Studies
We study the characteristics of various IEEE 802.11n Block ACK schemes
and to validate analytical model using MATLAB based numerical studies. Table
1 lists the parameters used in the numerical study. The protected Block ACK
with and without reverse direction and non-protected Block ACK with and
without RD are considered for comparison purposes.
21

Table 1: Summary of IEEE 802.11n parameters
Payload 1500 bytes r 2 Mbps
T-PHY 192 r* 1 Mbps
T-DATA 192+(224+Payload)/r Data Rate 11 Mbps
T-ACK 192+112/r* Block Size 5
T-RTS 192+160/r* Block Size RD 3
T-CTS 192+112/r* Fading Margin 0.05
T-BAR 192+192/r Velocity 5m/s
T-BA 192+1216/r Queue Length 50
Figure 4 shows the increasing the number of STAs on channel throughput
performance for a packet arrival rate of 8pkts/sec.One can observe that in all
cases throughput initially increases with the number of STAs but further incre-
ments of network size significantly reduce the throughput. This is very obvious
in traditional WLANs due to collisions as the number of STAs increases in the
network. Moreover, it is observed that the slope of the throughput degradation
is stiffer in the case of Block ACK with RD as compared to protected Block
ACK RD and in average the protection with the Block ACK mechanism provides
32.54% higher throughput. Collisions and FER rates are the dominating factors
that make this difference in performance. As discussed in earlier, collisions and
errors are only experienced by the initial data frames in the protected Block
ACK mode. If the initial data frame is correctly transmitted then the STA will
initiate the rest of the data burst where as in an unprotected scenario, (which
used the Block ACK mode) there is no such protection mechanism (RTS/CTS
is not considered in two way handshake scheme) resulting in a full data burst
experiencing the collisions and errors (resulting in higher collision and error
times). Hence, to fully utilize the RD feature of 802.11n, it should be integrated
with the protected block ACK mechanism to achieve higher throughput. An-
other special observation is that, the protected block ACK scheme outperforms
the RTS/CTS scheme as RTS/CTS has extra overheads.
Figure 5 shows the packet delay increases when the network size grows in
22

0 10 20 30 40 50 60 70 80 90 1004.5
5
5.5
6
6.5
7
7.5
8
8.5x 10
6
No. of STAs
Th
rou
gh
pu
t(b
ps)
Protected Block ACK RDProtected Block ACK Without RDNon−protected Block ACK RDNon−protected Block ACK without RD
Arrival Rate = 8pkts/sec
Figure 4: Channel throughput of protected Block ACK with and without RD and non-
protected block with and without RD.
all cases due to a higher number of collisions. As a large number of stations at-
tempt to access the channel, more collisions occur, the number of retransmission
increases and stations suffer longer delays. The protected Block ACK results
in delays lower than that of the non-protected Block ACK scheme for both RD
and without RD cases, since collisions only experienced by the first data frame
in case of the protected Block ACK scheme where as the whole data burst expe-
rienced collisions in the non-protected Block ACK. However, the overhead is a
little bit higher in the protected Block ACK scheme due to an additional ACK
frame for the first data frame. This additional ACK frame eventually is more
important to reduce the wasted time in terms of collisions or channel errors
for higher data transmissions. Moreover, Fig.6 shows the variation of packet
23
delay with respect to packet arrival rates. The difference of packet delay mostly
remains constant between protected and non-protected Block ACK, since the
packet delay contributions come from packet arrival rates and queue length as
shown in Eq.(29). However packet delay is highly impacted by the number of
stations given that the MAC delay’s contribution become dominant.
0 10 20 30 40 50 60 70 80 90 1000
0.2
0.4
0.6
0.8
1
1.2
1.4
No. of STAs
Pa
ck
et D
ela
y (
Se
c)
Protected Block ACK RDProtected Block ACK without RD
NonP-Block ACK RDNonP-Block ACK without RDD
Arrival Rate = 8pkts/sec
Figure 5: Packet delay versus number of stations
. The efficiency of the set of parameters used on the packet loss probability is
explored in Fig.7 for protected Block ACK scheme. one can observe that shows
that the choice of higher values for the contention window improve the packet
loss probability by reducing the number of collisions. When W = 32,m =
6,m′ = 5 are used, the packet loss probability increases rapidly and is mostly
exponential in nature. Now, using the same settings except a retry limit fixed
to 7, the packet drop probability decreases about 48%. This is also true for
24

0 5 10 15 20 25 30 35 40 45 500.08
0.1
0.12
0.14
0.16
0.18
0.2
0.22
0.24
0.26
0.28
Arrival Rate (pkts/sec)
Pa
ck
et
De
lay
(S
ec
)
Protected Block ACK RD,STA = 10
NonP-Block ACK RD, STA = 10Protected Block ACK RD, STA = 20
NonP-Block ACK RD,STA = 20
Figure 6: Packet delay versus Arrival rate.
maximum backoff stage. The packet loss probability can further be reduced by
increasing contention window size from 4 to 5. This is because the station will
get more transmission opportunity according to Eq.(24). However, we observe
that the packet loss for the exponential backoff mechanism is smaller than the
packet loss as a result of queueing mechanism (Fig.8). The probability of packet
loss is almost zero for the arrival rate of 8pkts/sec in case of the protected Block
ACK with 10 stations and dramatically increases due to queue overflows. We
observe similar trend for various access schemes despite of their early queue
saturation.
. Figure 9 shows the probability of packet loss versus the number of stations.
We observe that, the transmission probability, τ ’s decreases with the number
of STAs, hence increasing the probability of collisions. However, at the initial
stage (for N < 5) τ is increased a bit and starts decreasing. Interestingly the
quantity of τ increments at the initial stage can be characterized by the packet
arrival rate. It is shown that for lower packet rates (e.g. λ = 10pkts/sec) τ
25
0 10 20 30 40 50 60 70 80 90 1000
0.01
0.02
0.03
0.04
0.05
0.06
0.07
No. of STAs
Pro
ba
bil
ity
of
Pa
ck
et L
oss
s
w = 32,m=6,m’ = 5
w = 64,m=7,m’ =5
w = 64,m=7,m’ =4
w = 32,m=7,m’ =5
Arrival Rate = 8pkts/sec
Figure 7: Probability of packet loss against the number of stations
0 5 10 15 20 25 30 35 40 45 500
0.1
0.2
0.3
0.4
0.5
0.6
0.7
0.8
0.9
1
Arrival Rate (pkts/sec)
Pro
ba
bil
ity
of
Pa
ck
et
Lo
sss
Protected RD, STA = 10NonP-Block ACK RD, STA = 10
Protected RD, STA = 20NonP-Block ACK, STA = 20
Figure 8: Probability of packet loss versus arrival rates for N = 10 and 20 stations. Compar-
ison of various access methods.
increases by 0.015 whereas it is only 0.005 for λ = 30pkts/sec.
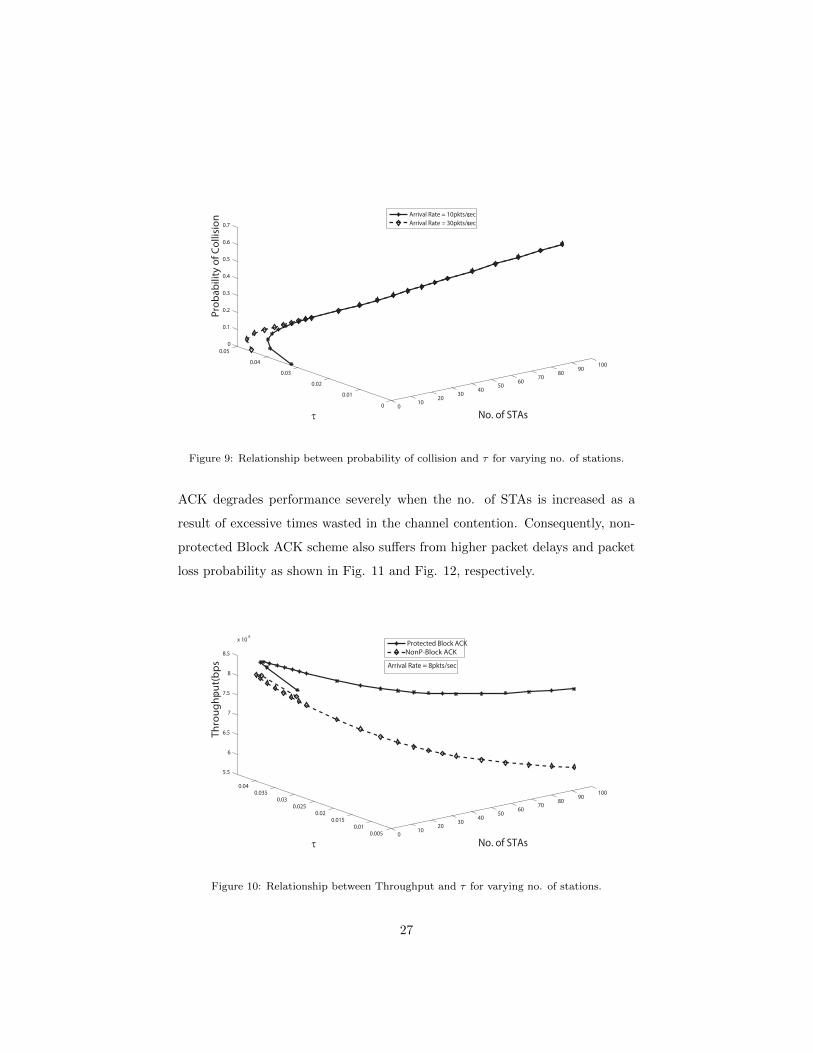
. Figure 10 illustrates the variation of throughput with τ for both protected
and non-protected Block ACK schemes. We observed that non-protected Block
26
010
2030
4050
6070
8090
100
0
0.01
0.02
0.03
0.04
0.05
0
0.1
0.2
0.3
0.4
0.5
0.6
0.7
No. of STAsτ
Pro
ba
bil
ity
of
Co
llis
ion
Arrival Rate = 10pkts/secc
Arrival Rate = 30pkts/secc
Figure 9: Relationship between probability of collision and τ for varying no. of stations.
ACK degrades performance severely when the no. of STAs is increased as a
result of excessive times wasted in the channel contention. Consequently, non-
protected Block ACK scheme also suffers from higher packet delays and packet
loss probability as shown in Fig. 11 and Fig. 12, respectively.
010
2030
4050
6070
8090
100
0.0050.01
0.0150.02
0.0250.03
0.0350.04
5.5
6
6.5
7
7.5
8
8.5
x 106
No. of STAsτ
Th
rou
gh
pu
t(b
ps
)
Protected Block ACKNonP-Block ACK
Arrival Rate = 8pkts/sec
Figure 10: Relationship between Throughput and τ for varying no. of stations.
27

010
2030
4050
6070
8090
100
0.0050.01
0.0150.02
0.0250.03
0.0350.04
0
1
2
3
4
5
6
7
8
No. of STAsτ
Pa
ck
et
De
lay
(se
c)
Protected Block ACK
NonP-Block ACK
Arrival Rate = 8pkts/sec
Figure 11: Relationship between packet delay and τ for varying no. of stations.
010
2030
4050
6070
8090
100
0.0050.01
0.0150.02
0.0250.03
0.0350.04
0
0.2
0.4
0.6
0.8
1
No. of STAsτ
Pro
ba
bil
ity
of
Pa
ck
et
Lo
sss
Protected Block ACK
NonP-Block ACK
Arrival Rat = 8pkts/sec
Figure 12: Relationship between probability of packet loss and τ for varying no. of stations.
28

5. Conclusion
In this paper, we investigated the interdependencies of Block ACK and RD
mechanisms for 802.11n using a discrete bi-directional Markov chain model un-
der non-saturated traffic loads. We developed a mathematical model to derive
system throughput, delay, and packet loss probability for both protected and un-
protected Block ACK methods under various loading. The model is validated by
MATLAB-based numerical studies. Results obtained have shown that the bet-
ter system performance (i.e. up to 33% higher throughput and 48% less packet
dropping) can be achieved using protected Block ACK in conjunction with RD
data transmission. We found that ’unprotected Block ACK’ wastes TXOP espe-
cially during collisions and degrades system performance significantly. To fully
utilize the system performance, 802.11n stations should employ protected Block
ACK mechanism with RD flows. The work reported can help network planners
to deploy high-speed 802.11-based networks and to contribute in the develop-
ment of next generation wireless local area network 802.11ac amendment. Our
future work will report on the design and performance evaluation of a cross-
layer MAC protocol design supporting multimedia applications over 802.11ac.
Development of an extensive simulation model to validate our numerical results
presented here is also our ongoing work.
References
[1] S. Committee, “Wireless lan medium access control (mac) and physical
layer (phy) specifications: Amendment 8: Medium access control (mac)
quality of service enhancements,” IEEE Computer Society, 2005.
[2] G. Bianchi, “Performance analysis of the ieee 802.11 distributed coordi-
nation function,” IEEE Journal on Selected Areas in Communications,,
vol. 18, no. 3, pp. 535–547, March 2000.
[3] F. Daneshgaran, M. Laddomada, F. Mesiti, and M. Mondin, “Unsaturated
throughput analysis of ieee 802.11 in presence of non ideal transmission
29

channel and capture effects,” IEEE Transactions on Wireless Communica-
tions, vol. 7, no. 4, pp. 1276–1286, 2008.
[4] H. Lee, I. Tinnirello, J. Yu, and S. Choi, “Throughput and delay analysis
of ieee 802.1 le block ack with channel errors,” in 2nd IEEE International
Conference on Communication Systems Software and Middleware. IEEE,
2007, pp. 1–7.
[5] H. Wu, Y. Peng, K. Long, S. Cheng, and J. Ma, “Performance of reliable
transport protocol over ieee 802.11 wireless lan: analysis and enhance-
ment,” in proc Twenty-First Annual Joint Conference of the IEEE Com-
puter and Communications Societies,, vol. 2. IEEE, 2002, pp. 599–607.
[6] F. Alizadeh-Shabdiz and S. Subramaniam, “A Finite Load Analytical
Model for the IEEE 802.11 Distributed Coordination Function MAC,”
WiOpt’03: Modeling and Optimization in Mobile, Ad Hoc and
Wireless Networks, p. 2 pages, Mar. 2003. [Online]. Available:
https://hal.inria.fr/inria-00465993400
[7] Y. S. Liaw, A. Dadej, and A. Jayasuriya, “Performance analysis of ieee
802.11 dcf under limited load,” in proc. IEEE Asia-Pacific Conference on
Communications. IEEE, 2005, pp. 759–763.
[8] T. Li, Q. Ni, T. Turletti, and Y. Xiao, “Performance analysis of the ieee
802.11 e block ack scheme in a noisy channel,” in 2nd IEEE International
Conference on Broadband Networks. IEEE, 2005, pp. 511–517.
[9] B. S. Kim, H. Hwang, and D. K. Sung, “Effect of frame aggregation on the
throughput performance of ieee 802.11n,” in IEEE Wireless Communica-
tions and Networking Conference, March 2008, pp. 1740–1744.
[10] V. Visoottiviseth, T. Piroonsith, and S. Siwamogsatham, “An empirical
study on achievable throughputs of ieee 802.11n devices,” in 7th Interna-
tional Symposium on Modeling and Optimization in Mobile, Ad Hoc, and
Wireless Networks, 2009. WiOPT 2009., June 2009, pp. 1–6.
30

[11] N. Hajlaoui, I. Jabri, and M. Ben Jemaa, “Analytical study of frame ag-
gregation in error-prone channels,” in 9th International Wireless Commu-
nications and Mobile Computing Conference, July 2013, pp. 237–242.
[12] N. Mohammad and S. Muhammad, “Modeling and analyzing mac frame
aggregation techniques in 802.11 n using bi-dimensional markovian model,”
in Networked Digital Technologies. Springer, 2012, pp. 408–419.
[13] D. Akhmetov, “802.11n: Performance results of reverse direction data
flow,” in IEEE 17th International Symposium on Personal, Indoor and
Mobile Radio Communications,, Sept 2006, pp. 1–3.
[14] A. Milad, Z. Bin Muhamad Noh, A. Shibghatullah, and M. Algaet, “Design
a novel reverse direction transmission using piggyback and piggyback with
block ack to improving the performance of mac layer based on very high
speed wireless lans,” in proc. IEEE Conference on Information Communi-
cation Technologies (ICT), April 2013, pp. 263–266.
[15] L. Kleinrock, “Queueing systems, volume 1: theory,” 1975.
[16] P. Chatzimisios, A. C. Boucouvalas, and V. Vitsas, “IEEE 802.11 wireless
lans: performance analysis and protocol refinement,” EURASIP Journal
on Wireless Communications and Networking, vol. 2005, no. 1, pp. 67–78,
1900.
31