Performance studies of a rapid charging Protocol for Li-ion Cells by Godfrey Sikha, P.Ramadass, Bala...
23
Performance studies of Performance studies of a rapid charging a rapid charging Protocol for Li-ion Protocol for Li-ion Cells Cells by Godfrey Sikha, P.Ramadass, Bala S. Haran, Ralph E. White, Branko N. Popov Center for Electrochemical Engineering, Department of Chemical Engineering, University of South Carolina Columbia, SC 29208
-
date post
22-Dec-2015 -
Category
Documents
-
view
216 -
download
3
Transcript of Performance studies of a rapid charging Protocol for Li-ion Cells by Godfrey Sikha, P.Ramadass, Bala...

Performance studies of a rapid Performance studies of a rapid charging Protocol for Li-ion Cellscharging Protocol for Li-ion Cells
byGodfrey Sikha, P.Ramadass,
Bala S. Haran, Ralph E. White, Branko N. Popov
Center for Electrochemical Engineering,
Department of Chemical Engineering,
University of South Carolina Columbia, SC 29208

ObjectivesObjectives
To develop a new protocol for charging Li-ion cells.
To reduce the total charging time.
To reduce capacity fade due to over-charging.
To develop a smart charger after optimizing the cell
capacity, charging time and capacity decay.

Need for a New Protocol…Need for a New Protocol… The charging time for CC-CV protocol is higher.
Using higher DC currents during CC charge keeps the cell during most
part of the time in CV mode, but still there is no considerable decrease
in total charging time.
Usage of CV mode for the entire charging time could decrease the
total charging time.
But the CV charging needs a very high current during the earlier
stages of charging that makes the cost of the charger high.In addition
its capacity fade is more
Thus, a new protocol that may be similar to CV charging, but not
using very high currents, could be ideal for a smart charger and could
reduce the charging time to a great extent.

Development of Current Decay Protocol Development of Current Decay Protocol Our Approach..Our Approach..
Charging the Li-ion cell with linearly descending current with time reduces the charging time as compared to constant current charging*.
Similar mode of charging was tested with commercial Sony 18650 cells.
Based on the preliminary results of LCD charging, the protocol was modified to avoid over charging and to decrease the charging time further.
A new protocol was developed that consists of initial high current DC charging (~3C rate) followed by a current decay with the fixed total charging time.
Cycling studies were carried out with the new protocol and the performance was compared with conventional CC-CV and CV mode of charging.
*S.K. Chang, A.A. Andriiko, A.P. Monko and S.H. Lee, Journal of Power Sources 79 (1999) 205-211.

Development of New protocolDevelopment of New protocol
0 1I I k t
Linear Current Decay Protocol (LCD)
0 1 2I I k t k t Modified Linear Current Decay Protocol (MLCD)
The New ProtocolHigh Current DC charging followed by
a current decay

LCD & MLCD Protocols…LCD & MLCD Protocols…
-200 300 800 1300 1800 2300
Charging T ime (sec)
0.0
0.7
1.4
2.1
2.8
3.5
Cha
rgin
g C
urre
nt (A
)
Cel
l Vol
tage
(V)
3.1
3.3
3.5
3.7
3.9
4.1
4.3
0 1I I k t
LCD-Protocol
MLCD-Protocol0 600 1200 1800 2400 3000
Charging T ime (sec)
0
1
2
3
4
5
Cha
rgin
g C
urre
nt (A
)
Cel
l Vol
tage
(V)
3.2
3.3
3.4
3.5
3.6
3.7
3.8
3.9
4.0
4.1
4.2
4.3
voltage
current
0 1 2I I k t k t

Variation of Charging Current and Cell Variation of Charging Current and Cell Voltage for the New ProtocolVoltage for the New Protocol
0 1000 2000 3000 4000 5000 6000
charging time (sec)
0
1
2
3
4
5
6
Cur
rent
(A)
Vol
atge
(V)
2.40
2.78
3.16
3.54
3.92
4.30
Currentvoltage
voltage
current

ExperimentalExperimentalCycling Studies:
For the comparison of performance of the New Protocol the following cycling studies were done.
CC-CV Protocol 0.9 A charging until 4.2V and a float at 4.2 V until the utilization reached 98% for the first cycle(the corresponding time was kept as a time limit for further cycling)and 1A discharge until the potential drops to 2.5V.
CV Protocol Potentiostatically controlled at 4.2V until the utilization reached 98% for the first cycle(the corresponding time was kept as a time limit for further cycling) and 1A discharge until the potential drops to 2.5 V
New Protocol A short 5A pulse until the potential reaches 4.2 V followed by the current decay profile for a total time of 5400 seconds which yielded an utilization ca 98 % and 1A discharge until the potential drops to 2.5 V

Post Cycling studies Rate Capability Studies were done after 150 cycles, where all
cells are charged using CC-CV protocol with 1A DC and discharged at
different rates namely C/8, C/4, C, 3/2C and 2C.
CV's were obtained at the scan rate of 0.05 mV/s within the
voltage range of 2.5-4.2 V at the end of 150cycles.
Impedance measurements were done at fully charged and fully
discharged states. (100 SOC & 0 SOC)for fresh and cycled full cells
T-cell studies: The cycled cells were cut open and individual
electrodes were cycled against excess lithium as counter and capacity of
individual electrodes were measured.
The individual half-cells were subjected to cyclic
voltammogram and ac-impedance studies

Comparison of Utilization of CV-charging, Comparison of Utilization of CV-charging,
CC-CV charging and new protocol (cycle 1)CC-CV charging and new protocol (cycle 1)
0 900 1800 2700 3600 4500 5400
Time(sec)
0
20
40
60
80
100
Uti
liza
tion
(%)
CC-CV ProtocolCV ProtocolNew Protocol
2125
sec 24
61 s
ec
4476
sec

Charge Curves of the CC-CV Protocol Charge Curves of the CC-CV Protocol and CV Protocoland CV Protocol
0 1000 2000 3000 4000 5000 6000 7000
Time(sec)
0.2
0.4
0.6
0.8
1.0
Cur
rent
(A
)
cycle1cycle 50cycle 100cycle 150
0 1000 2000 3000 4000 5000 6000
Time(sec)
0
5
10
15
Cur
rent
(A)
cycle 1cycle 50cycle 100cycle 150
CC-CV Protocol CV Protocol

0 1000 2000 3000 4000 5000 6000
Time(sec)
0
1
2
3
4
5
6
Cur
rent
(A)
cycle 1cycle 50cycle 100cycle 150
0 50 100 150 200 250 300Time(sec)
3.0
3.5
4.0
4.5
5.0
5.5
6.0
Cur
rent
(A)
cycle 1cycle 50cycle 100cycle 150
Charge Curves of the New ProtocolCharge Curves of the New Protocol

Charge Utilization CurvesCharge Utilization Curves
0 1000 2000 3000 4000 5000 6000 7000
Time(sec)
0
20
40
60
80
100
% U
tili
zati
on
cycle1cycle50cycle100cycle150
0 1000 2000 3000 4000 5000 6000
Time (sec)
0
20
40
60
80
100
% U
tili
zati
on
cycle1cycle50cycle100cycle150
0 1000 2000 3000 4000 5000 6000
Time(sec)
0
20
40
60
80
100
% U
tili
zati
on
cycle 1cycle 50cycle 100cycle 150
CC-CV CV
New Protocol
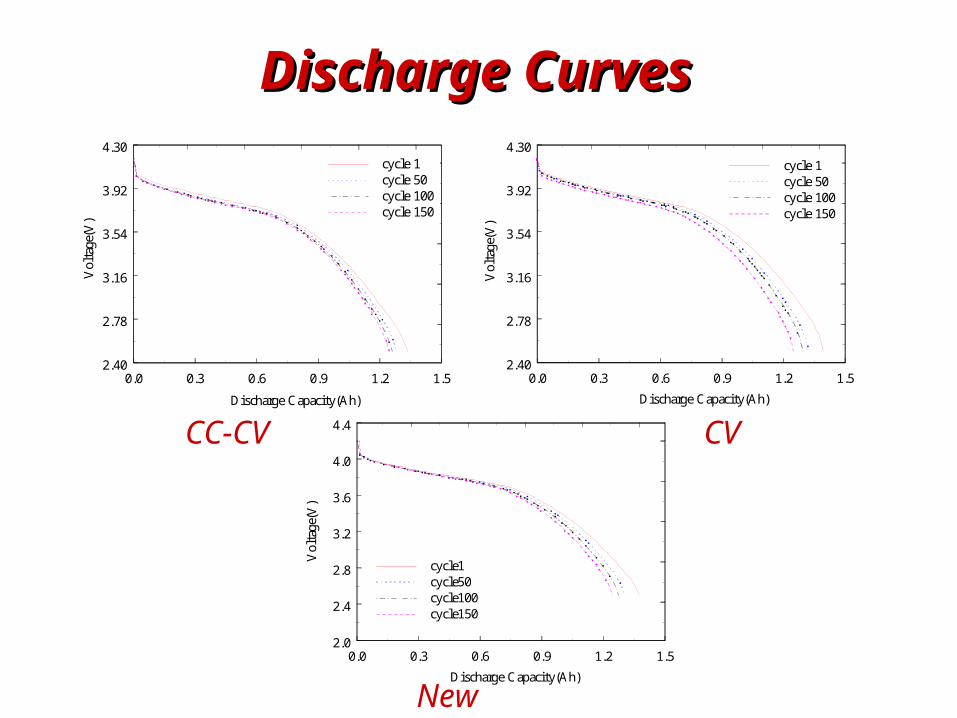
Discharge Curves Discharge Curves
0.0 0.3 0.6 0.9 1.2 1.5
Discharge Capacity(Ah)
2.40
2.78
3.16
3.54
3.92
4.30
Vol
tage
(V)
cycle 1cycle 50cycle 100cycle 150
0.0 0.3 0.6 0.9 1.2 1.5
Discharge Capacity(Ah)
2.40
2.78
3.16
3.54
3.92
4.30
Vol
tage
(V)
cycle 1cycle 50cycle 100cycle 150
0.0 0.3 0.6 0.9 1.2 1.5
Discharge Capacity(Ah)
2.0
2.4
2.8
3.2
3.6
4.0
4.4
Vol
tage
(V)
cycle1cycle50cycle100cycle150
CC-CV
New protocol
CV

Variation of Discharge Capacity with CyclingVariation of Discharge Capacity with Cycling
0 50 100 150 200
Cycle Number
86
88
90
92
94
96
98
100
Cap
acit
y Fa
de(%
)
CC-CV protocolNew ProtocolCV Protocol

Capacity Fade Comparison after Capacity Fade Comparison after 150 Cycles150 Cycles
Mode of Charging
% Capacity Fade after…
50 cycles 100 cycles 150 cycles
CC-CV 4.06 5.61 6.64
CV 5.24 7.51 10.42
New Protocol
5.37 7.54 9.506
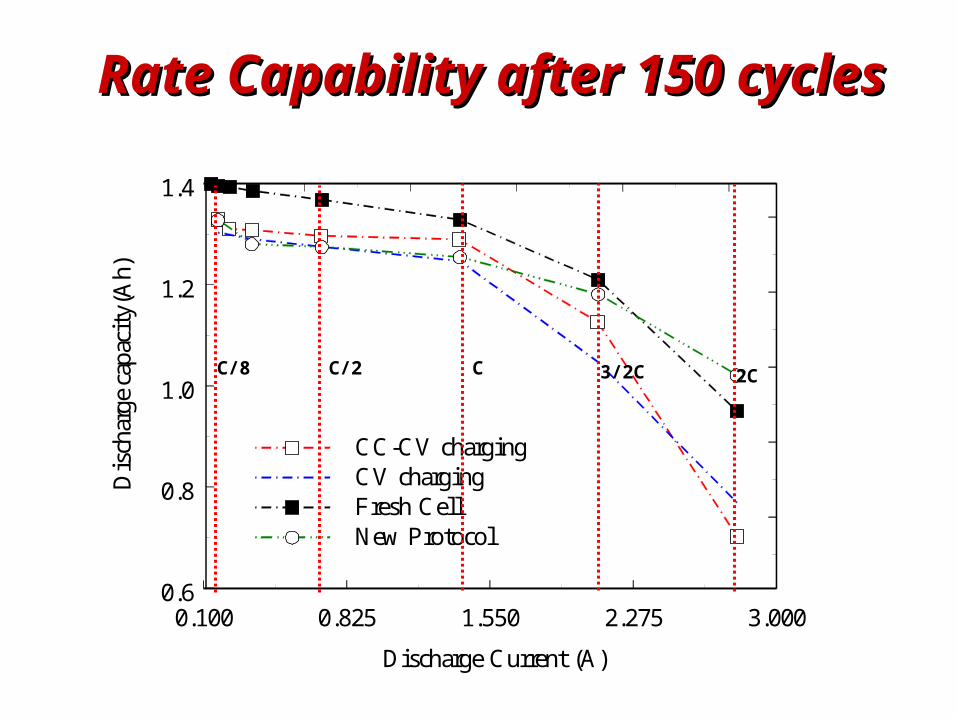
0.100 0.825 1.550 2.275 3.000
Discharge Current (A)
0.6
0.8
1.0
1.2
1.4
Dis
char
ge c
apac
ity(
Ah)
CC-CV chargingCV chargingFresh CellNew Protocol
Rate Capability after 150 cycles Rate Capability after 150 cycles
C/2C/8 C 3/2C 2C

Nyquist Plots for LiCoONyquist Plots for LiCoO22 half half
cell(fully Lithiated and delithiated)cell(fully Lithiated and delithiated)
0 300 600 900 1200 1500
ZRe(cm)
0
200
400
600
800
1000
ZIm
( c
m2)
Fresh CellCC-CVCVNew Protocol
0 200 400 600 800 1000
ZRe cm2)
0
120
240
360
480
600
ZIm
( c
m2)
FreshCC-CVCVNewProtocol
lithiated delithiated

Nyquist Plots for Carbon half Nyquist Plots for Carbon half cell(fully Lithiated and delithiated)cell(fully Lithiated and delithiated)
0 80 160 240 320 400
ZRe(cm)
0
40
80
120
160
200
ZIm
( c
m2)
FreshCC-CVCVNew Protocol
0 200 400 600 800 1000
ZRe cm2)
0
120
240
360
480
600
ZIm
( c
m2)
FreshCC-CVCVNewProtocol
lithiated delithiated

The overall capacity fade (Q) is the result of two major contributions one from the rate capability (Q1) and other from the secondary material losses (Q2), either carbon on LiCoO2
A very low rate discharge(C/8) at the end of cycling will give the maximum available capacity on the full cell. The difference between this capacity and the measured capacity will account for the rate capability losses.(Q1)
The T-cells(both LiCoO2 and Carbon) made from cycled full cells are lithiated against excess Lithium as counter electrode to check the maximum available capacity in the respective secondary material.
The same procedure is done for fresh cell and the degradation of secondary material that is limiting can be found(Carbon showed more degradation as compared to Lithium in all the three protocols)
A capacity balance is performed to find Q3 which is categorized as other losses
Quantitative analysis of Capacity fade from half cell measurements
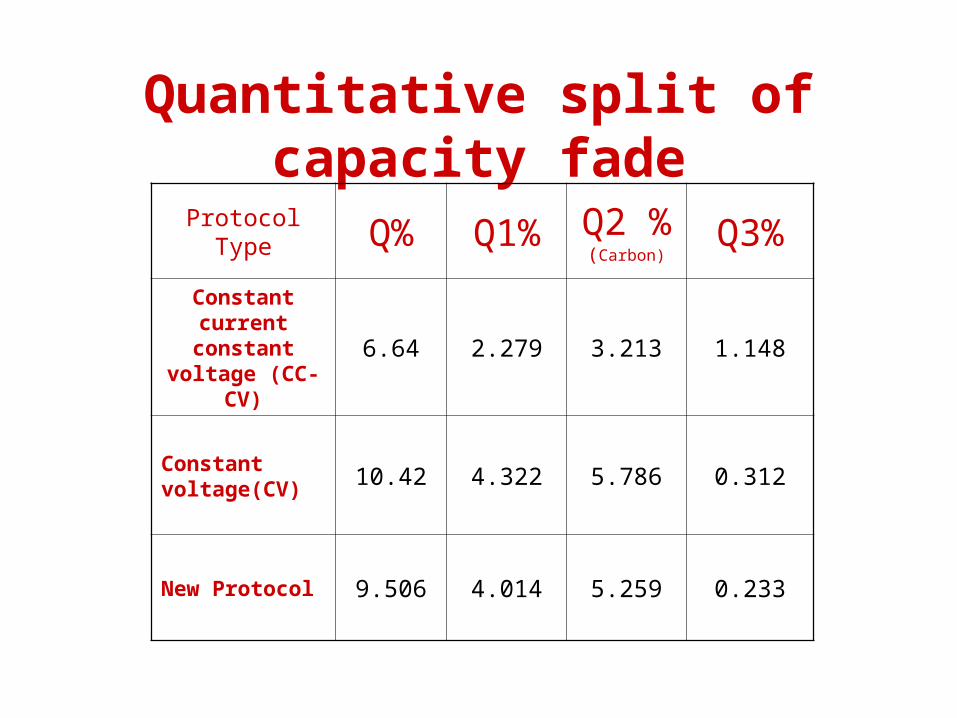
Quantitative split of capacity fade
Protocol Type Q% Q1% Q2 % (Carbon)
Q3%
Constant current constant voltage
(CC-CV)6.64 2.279 3.213 1.148
Constant voltage(CV) 10.42 4.322 5.786 0.312
New Protocol 9.506 4.014 5.259 0.233

Conclusions
New charging protocol was developed for charging commercial 18650
Li-ion cells.
High utilizations can be achieved at short periods of time which is useful
for many applications
New protocol shows better performance when compared with CV
mode ,gains a lot of time despite a poor performance when compared to
CC-CV mode of charging.
Effective control of overcharging can be ensured when much better
current profiles are chosen.

Acknowledgements
This work was carried out under a contract with the National Reconnaissance Office
for Hybrid Advanced Power Sources # NRO-00-C-1034.
Center for Electrochemical EngineeringUniversity of South Carolina
Center for Electrochemical EngineeringUniversity of South Carolina