Performance Retail Handbook
24
performance retail handbook
-
Upload
performics -
Category
Retail
-
view
629 -
download
3
Transcript of Performance Retail Handbook

performanceretail
handbook

i n t r o d u c t i o n

Retailers around the globe keenly understand the intensity, fervor, insight, and data necessary to stay ahead of the competition. However, in the last decade, the retail landscape has evolved significantly. Unlimited shelf actions, revolutions in order and delivery infrastructure, “e”, “m”, and “f” commerce, have all propelled the channel into a turbulent state, with retailers struggling to keep pace with shifting ex-pectations and product or service demands.
Retail customers (Participants) have high expectations and demand unprecedented transparency as they actively seek out dynamic, personalized experiences.
Fortunately, Performics has extensive experience in the retail space and we have an opportunity to cap-italize on this to become the global premiere retail performance agency. By analyzing historical cam-paign case studies and success, we have developed a consistent and repeatable framework for achiev-ing marketing performance.
Driving performance in this new retail world means identifying, planning for, and optimizing against what motivates Participants to choose. It is about matching-and-pacing to their needs—increasing the relevancy and perception of personal “fit.” We believe the brands that truly inspire participation will, in turn, be rewarded with incremental performance conversions and loyalty.
This handbook is intended to provide you with a foundation of ideas, tools, and methodologies to win in today’s complex marketplace by building a differentiated participant-based approach.
At Performics, our goal is to be your trusted partner and to bring our expertise, ideas, and passion to help you exceed your business goals.
Thank You.
Daina Middleton, Performics Global CEO
For us, Performance Marketing is about discovery, empowerment, and connection.
f o r e w o r d
Performance
Participation

Performance RetailMoving at the speed of retail is a challenge for even the savviest of marketers. With such pronounced changes in customer behavior, shopping habits, technology, and commerce capability—it feels as though we are reinventing retail every new season. We have put together this handbook to provide you with a framework to tackle today’s biggest retail challenges.
With all it’s complexity—it is critical to not become overwhelmed, and to remember that success for tomorrow is based off the decisions that we make today. As Performance Marketers, we have created four simple pillars to capture the fundamental elements of Retail Success and to form the “chapters” of this handbook.
Visibility
Integrated MediaIntegrated, participant-centered mar-keting that moves at the speed of Retail, taking into account dynamic market forces.
Optimization
Actionable AnalyticsIntegrated business intelligence and customized dashboards that integrate your entire data set to make more informed, holistic decisions.
Relevancy
Engaging ExperiencesParticipant-optimized seamless
experiences across multi-screensto drive shopping, buying
and sharing.
Conversion
Dynamic MerchandisingAgility to maximize profitability and
match pricing, marketing, and inventory tailored to evolving
participant behaviorsm e t h o d o l o g y

2012: B2C eCommerce sales topped $1 trillion for the first time. Growth was at 21.1%, with expected 18.3% growth in 2013.1
This figure does not completely capture the impact of the internet on retail. As numbers continue to climb year after year, both “showrooming” (in-store viewing with offline purchase) and ROPO (Research Online, Pur-chase Offline) trends continue to have significant business impacts that remain difficult to measure.2 Global markets are also in different phases of eCommerce growth. Therefore, marketing strategies for retailers will need to be tailored nation by nation, as the impact of different channels on business goals will differ.
Within the US, online retail has enormous potential for growth, capturing only 8% of total retail sales, but growing faster compared to overall retail. In 2013, the National Retail Foundation expects sales to increase 3.4% (slowest growth since 2010), while online growth is expected at 14.8%. At the same time, digital buyer penetration at 73% is leading saturation levels. 3
With high online retail penetration in northernEurope (foremost UK and Germany), eCom-merce is projected to still outpace physical retail with greater emphasis on multiple channels. The southern European markets are to have the fastest growth rates as they mature to adopt online shopping into the norm. 4
Digital buyer penetration in LATAM is one third of total Internet users, but Argentina and Brazil are pulling up quickly (with levels at 45.6% and 36% re-spectively) with the rising middle classes focusing on price savings. 5
This year marks a turning point where theAsia-Pacific region will surpass North Ameri-ca as world’s No. 1 market for B2C eCommerce sales at 33.4%, with North America at 31.5%. 6
1. “Ecommerce Sales Topped $1 Trillion for First Time in 2012” (eMarketer, Feb. 2013)2. “Pre-Holiday 2012 Consumer Intentions” (Google/Ipsos OTX, Oct 2012)3. ”Retail Tech Sector Bulletin” (Marcum Cronus, Feb.2013)
4. “Brazil Ecommerce: Sports, Travel and Cheap Retail Maintain the Market’sMomentum” (eMarketer, March 2013)5. “European Online Retail Forecast, 2012 to 2017” (Forrester, March 2013)6. “2013 Digital Trends in Latin America” (Digital Media Bloggers, June 2013)
G L O B A L S N A P S H O T S

With the explosion of mobile devices and the ubiquitous usage of social networks, brand retail strate-gies have become increasingly focused on connecting to and inspiring participant behavior. Business success in retail is largely dependent on brands providing relevant, personalized experiences to help participants throughout their shopping journeys. Given this, we believe the following are some key market realities that brands should be mindful of when crafting their business and marketing strategies.
Mobile is the First Online Channel• Participants are accessing the Internet through a
mobile device first• Get the most out of every pixel• Integrate strategies across devices
Collaborative Content is King• Participants driven to content creation and shar-
ing through social media• Brands need to join in the conversation as pub-
lishers of sharable content to gain access to trust-ed networks
RISE OF P-COMMERCE• The funnel has been replaced with a non-linear,
multi-touchpoint process• Increased consumption of media across channels• Need for visibility across a multitude of media• Experience directly personalized to participant
Data is the Marketing Currency• Data allows brands to navigate fragmented media chan-
nels, touchpoints and evolving participant behavior• Need for integrated analytics across your business, web
analytics and cross-channel performance strategies
r e t a i lr e a l i t i e s

I N T E G R A T E d M E D I AKEEPING THE STOREFRONT CONSISTENT ACROSS ALL CHANNELS

t h e n e w c u s t o m e r j o u r n e ya f r a c t u r e d d i g i t a l r e t a i l j o u r n e y
1
Sees a fun spring outfit on Pinterest.
2
Sees a print ad in InStyle.
3
Googles “spring dresses”.
Clicks on a paid search ad for Loft.
4
5
Sees a good sale on Facebook.
6
Checks nearest store hours.
7
Buys dress.
m a p p i n g y o u r o w np a r t i c i p a n t j o u r n e y
Chances are your participant’s journey looks nothing like the above. In fact, it’s likely that no one shopper finds their way to the checkout counter the same way as her neighbor. Although each journey is unique, in aggregate they offer insight into audience needs, behaviors and pain points. The trick is understanding what and where to focus your attention. Here are three key areas to help you follow alongside your participants’ fractured journeys. 1
m a p p i n g y o u r o w np a r t i c i p a n t j o u r n e y
12
3
build a participant persona• Who is your target participant?• Hone in on their background and needs.
DOCUMENT THE SURROUNDING CUSTOMER JOURNEY• What is the thought process at each
step and touchpoint?
FIND CRITICAL POINTS• Where are participants entering or exiting?• Identify pain points as well as times of po-
tential changes in shopping preferences.
1. “How To Map Your Customer Experience Ecosystem” (Forrester, Feb-May 2013)

Multi-channel, cross-screen, omnichannel. What is the difference and how is this convergence of chan-nels significant for retailers and marketers? This expansion of channels maintains a participant-centric focus that more fully encompasses the participant’s digitally-integrated world. This participant-centric focus also places greater emphasis on demand forecasting, as brands will need to be proactive in their planning efforts. As price-focused online retailers (e.g. Amazon) continue their growth, maintaining a competitive edge will require retailers to provide an integrated experience that offers more value at all levels of the participant journey, not solely through pricing.
+ + + + +
CROSS-SCREENThe digital jump from device to device (e.g. tablet to desktop to mobile). Cross-screen brows-ing is a norm, according to a study done jointly by Google and ISPOS,1 which defined two modes of multi-screening, both connected by search: sequential and simultaneous.
multi-channel retailingThe integration of retail opera-tions that allow a shopper to car-ry out transactions across many connected channels, including brick-and-mortar stores, online stores, mobile stores, mobile app stores, telephone, email, television and catalog.
omnichannel retailingOmnichannel retailing can be viewed as the end goal of multi-channel retailing, centered around a completely fluid partic-ipant experience through every possible shopping channel.
multi-channel impact in action
Online Only RetailerEbay found that 21% of their customers shopped
cross-screen, and that same 21% accounted for 45% of Ebay purchasers. 2
Multi-Channel RetailerWalgreens found that the ratio of spend from in-store only customers to in-store and web to be 1:3.5; while
the ratio from in-store only customers to shoppers using in-store, web and mobile channels was 1:6.3
In-store
In-store + web
In-store + web + mobile
Single screen
Cross screen
1. Results included that 90% of our media interactions are screen based, spending 4.4 hours in front of screens each day.2. “eBay’s CEO: Retailers Finally are Responding to the Commerce Revolution” (Internet Retailer, April 2013)3. “The Walgreens Path to Omnichannel Success” (Shop.org, Feb 2013)
M U L T I - C H A N N E LI M P A C T

T H E P O W E R O F T H I R D P A R T I E SAs these marketplaces continue their growth, the use of affiliates and feeds will help brands expand their product reach and connect with participants in real time. Product Listing Ads, Comparison Shopping En-gines, marketplaces, and affiliates provide powerful retail support.
PRODUCT LISTING ADS COMPARISON SHOPPING ENGINES MARKETPLACES
feedsWhat is a feed?A Product Feed is a data file of product information attached to attributes such as product as-sortment, product info, promo offers, and bids.
How are they used/experienced by the participant?Product Feeds stock the virtu-al aisles of product listing ads, affiliate networks, comparison shopping engines, and market-places. Participants will arrive looking for the best value and price across brands.
What value do they offer the brand?Feeds help harness the massive reach of shopping engines, maxi-mize visibility and influence partic-ipants otherwise removed from the brand. The customizable feeds lend the flexibility needed to lower costs, increase conversions, and maximize revenue online. Feeds make for eas-ier data integration, deep reporting and product level insights.
affiliatesWhat is an affiliate?An Affiliate is a third party mar-keter that drives sales to the merchant. A plethora of affili-ates exist in eCommerce and are typically compensated based on performance, such as per sale or lead. This creates direct accountability for the perfor-mance of the media.
How are they used/experienced by the participant?Affiliates help retailers extend their reach across the SERP, con-nect with shoppers looking for promotional offers, deals and for specific items in real-time. More than three quarters of online buyers additionally research two to three non-retailer websites, with 65% also preferring sites featuring multiple retailers. 1
What value do they offer the brand?An affiliate will likely be the one driving traffic to your products. With participants increasingly moving to vertical sites for discovery, shoppers are also using affiliate sites as evalu-ative tools, with 57% of online shop-pers more likely to buy a product they’ve seen displayed on multiple websites, than one solely on retailer or brand sites.2
1. “Product Feed Best Practices Guide Retail” (IAB Affiliate Marketing, Nov. 2011)2. “Affiliate Marketing – The Direct and Indirect Value That Affiliates Deliver to Advertisers” (Forrester Research , June 2012)
f e e d s a n da f f i l i a t e s

e n g a g i n g e x p e r i e n c e screating meaning along the touchpoints
e n g a g i n g e x p e r i e n c e screating meaning along the touchpoints

Questioned in its initially touted potential as a “direct sell” channel, social media has altered the relation-ship between participants and brands by facilitating open dynamic interactions and creating networks of feedback and opinion. Though it currently only counts for 2.4% of all total referral traffic to retail web-sites,1 a recent KPMG survey showed that 71% of retailers believed that social media was having a signif-icant impact on their business.2 In fact, just over half of retail respondents to a Forrester survey said they will spend more on Facebook in the coming year, with 31% spending more on Pinterest, 25% on Twitter, 25% on YouTube and 23% on Instagram.3 For retailers, social media functions on three important levels.
crm & relationship buildingThe social network space is ideal for transparency and to engage participants to demonstrate imme-diate attention to their needs. Social Media also provides brands an opportunity to build and grow through direct participant interactions, as well as connecting participants to other branded assets in their paid, earned, and owned media eco-system.
peer influenced researchParticipants are moving beyond traditional search results to discover alternative (human!) authority for crowd-sourced decision making. Today, participants are increasingly dependent on people-powered search results and answer platforms that feature context-rich human opinions—Amazon, TripAdvisor, Yelp, Quora, Twitter and Facebook.
direct action salesConsider the context when placing sales-focused content on your social network page. On Facebook and Twitter, advertising is often considered an invasion. The visually-oriented nature of Pinterest encourages users to directly engage with retailers and their products. Shoppers who come to your site from Pinterest are 10% more likely to make a purchase compared to those who arrive from oth-er social sites. More than 40% of shoppers have made purchases on social media sites and 76% even want brands to advertise through social media more 4 – signaling a desire for the personalized, partici-pant-focused engagement promised through social media.
in action: store pinsNordstrom has incorporated Pinterest into in-store displays to engage its large fanbase of 4.5 million followers. The initiative is meant to touch upon both CRM and sales. According to a Nordstrom spokesperson, “We hope it adds to our engagement with thecommunity and ultimately enables us to sell more as well.”5
1. “Digital IQ Index: Specialty Retail,” (L2 Think Tank, June 2013)2. ”2013 Retail Outlook Survey” (KPMG, June 2013)3. “The State Of Retailing Online 2013: Marketing & Merchandising,”(Shop.org/Forrester Research, Inc. July, 2013)4. “The Rise of ‘The Human Algorithm’: A New Approach to Search Marketing” (Performics, April, 2013)5. Nordstrom Takes Pinterest Engagement To New Level, Turns Most Pinned Items Into In-Store Displays (Marketing Land July 2013)
s o c i a li m p l i c a t i o n s

As online mobile usage continues its growth both globally and stateside, brands need to grow and develop their planning and mobile strategies alongside. Planning for a mobile strategy is more than just responsive design or having a mobile website. It requires brands to be broader in vision to plan for experiences. Mobile planning demands that brands think meaningfully about the ways in which their audiences use and benefit from mobile technologies in their lives. Part of this understanding comes from identifying your audience’s mobile needs and demands. Furthermore, mobile planning requires understanding how those needs and demands may be content- or context-driven and to strategize accordingly. Content-driven mobile planning is focused on ensuring that all relevant paid, earned, and owned content is accessible, designed, and usable via a mobile device.
Content DrivenKey Elements:Mobile SERPs
Gateways:Search Engines, PPC, Product Ads, Click
to Call, Downloads, Site Links
Networks:Affiliate, Display, In-Application
Devices: Smartphones, Tablets, Basic Phone
Context DrivenKey Elements:Mobile Data Feeds
Gateways:Voice, QRC, Scanning, SMS, App Stores, Search Engines, Product Ads, PPC, Lo-cal Offers, OOH
Networks:Affiliate, Display, Local Directories,Social Networks, Third Party Apps, UGC
Devices: Cars, M2M, Any Screen
now mobile search
next mobile search
Mobile VariablesHighly Personal
Device FragmentationLocation / Geo Aware
Website & App UsabilitySocial & Local Profiles
Data / Media Rich
m o b i l ee x p e r i e n c e s

p e r s o n a l i z e dd i g i t a l s t r a t e g i e s
Participants are not only demanding their interactions with branded content and digital properties to be optimized and designed for their devices and multi-channel surfing habits, they are raising their ex-pectations for personalized digital experiences. They are searching for experiences that enhance their lives in big and small ways, such as saving time, helping them make the right choices, and getting where they’re going faster—gestures that demonstrate that the brand understands its audience and is com-mitted to finding ways to optimize and improve their shopping experience.
But digital experiences don’t just have to live online—in fact, it’s better that they cross over and bridge online and offline experiences for participants (40% of retailers expect to increase IT spend within the next year.)1 Whether it’s employees using iPhones to create “mobile” checkout lanes, or apps designed to help people visualize a new couch in their home, personalized digital experiences can create delightful touchpoints along a participant’s purchase path.
engage participant imaginationEngage the participant by helping them imagine using your brand.Intel partnered with Adidas, HSN, and Macy’s to develop virtual interactive screens. Adidas launched its Virtual Footwear Walls in 2013. Macy’s Beauty Spot kiosk aimed to similarly provide an “endless aisle” enhanced personalized shopping experience. HSN installed a digital pizza-making game that gave the online retailer offline presence for the first time.2
enhance in-store experienceMake the shopper more personalized and efficient.
Neiman Marcus partnered with Signature to create NM Service, an app that syncs shoppers and sales staff. Shoppers can browse deals, request advanced pickup, and even leave messages for
associates.3
ENABLE LOYAL CUSTOMERSRethink the loyalty card by personalizing the experience through devices, digital tech.Safeway’s “Just For U” Clubcard program provides individualized offers in addition to their usual discounts, actually saving the retailer costs on promotions. 5.4 million house-holds (45% of its sales base) signed up for the program within the first year. 4
1. ”2013 Retail Outlook Survey” (KPMG, June 2013)2. “StoresTurn Shopping Into a Virtual Reality” (VR News, February 2012)3. “In-Store App Smartly Syncs Shoppers And Sales Staff” (Mashable, July 2012)4. “Just U Could End Print Ads Safeway Says” (Supermarketing News, Feb 2013)5. Safeway Image Source: http://www.eastvalleytribune.com/money/article_4d1566bd-cea2-540d-88d1-617b3bda3496.html?mode=image-&photo=0

d y n a m i c m e r c h a n d i s i n gstocking the store shelf in real t ime

IT departments are being introduced to lots of new tech products and data integration capabilities, some of which have little to no history of success. Retailers have to weigh the costs and benefits of these offerings against their businesses, audiences, and technology needs. Typically, these offerings fall into two groups: Converged Infrastructure (aka Unified Stacks) or The Best of Breed Approach (aka Mix and Match). Each ap-proach comes with its own lists of pros and cons. Unified Stacks use a single vendor, providing more consis-tent, unified automation across platforms, but may sacrifice flexibility as users wait for maturation of stack integration. Conversely, a Best of Breed Approach offers greater leverage and dynamic performance, but not all architectures are easily stitched together and may require bigger budgets.
CONVERGED INFRASTRUCTURE BEST OF BREED APPROACH
Pros• Much faster, less risky• Adds efficiency by decreasing processing time• Integrated data flow and systems interoperability
Cons• Minimal marketable product at launch Not all features immediately available• Less flexible; closed system Takes longer to integrate 3rd parties if/when possible
Pre-Configured Solutions1
Pros• Choose your dance partner• Provides maximum performance and competitive advantage
Cons• Not all architectures play nice• Requires specialized resources for multivendor systems integration
mix and match1
1. Image Source: Google
t e c h n o l o g yi n t e g r a t i o n

b i g d a t am a n a g e m e n t
“Big Data” is a new spin on an old concept—we’re producing more data than ever before, leaving com-panies to struggle with the technical and analytical realities of managing and acting on meaningful data. To help navigate this Big Data deluge, it’s key to understand what’s driving it and what trends demand response. Although the apparent unwieldiness of big data appears to disguise the payoffs to retailers, those who invest in developing analytical tools, infrastructure, IT, and processes will see the impact on the quality of their participant experiences and bottom lines.
what’s driving big data?An Unstructured WorldUnstructured data does not have a predefined data model and/or does not fit well into rela-tional tables like text, sensor data, audio, video, click streams, and log files. Structured data comprises only 10% of Big Data, while unstructured data takes up 90%.1
A Connected WorldDigital worlds are converging beyond the screen thanks to increased connection points,
networks, and lines of communication.
A Scaling WorldIn addition to the proliferation of sensors and their data, people are more capable of repli-cating and distributing data across various platforms and social media channels.
in-action store pins
VarietyThe usability of data depends on estab-lishing data sources, consistency, com-pleteness and sorting through model accuracies.
VolumeIncreases in data require strong IT infra-structure and storage capabilities.
VelocityReal-time data, near-time, and batch and stream processing push the speed of information production and processing even further.
VeracityUncertainty of data is a common chal-lenge today. One in three business leaders don’t trust the data they have to make decisions, causing the decision making process to be more complex.2
the four v’s of big data
(1)(2)“The 4 Vs of Big Data,” IBM Big Data & Analytics Hub

Shopper - RetailerShoppers are still looking for local, offline retail experiences. Retailers now have more accessible options for meeting participants halfway with information on location, hours, inventory, and pro-motions. With increasing features in vari-ous search engines—Google, Yahoo! and Bing all include geo-targeting and inven-tory listings—local shopping is making it easier for retailers seeking to operate on-
line and offline.
it’s a two-way streetRetailer - ShopperAs increasing numbers of shoppers are “showrooming” (resulting in lost reve-nue), the use of mobile also becomes an important strategy for bridging online and offline channels for participants. The showrooming trend itself points to in-store value for shoppers in terms of prod-uct information, experience and service. With local targeting, retailers are able to add additional value for shoppers with promotions and remain competitive.
developing a local shopping plan
Can you be found? Goo-gle reported in 2011 that 20% of its searches were local. In 2012, it reported 50% of those local search-es were on mobile.1 What content or queries do you want to serve when customers are on the go? This requires alignment with local pages, feeds, content and incorpora-tion into your mobile site design.
discoverCapitalize on the evolv-ing cross screen shopping habits. Drive customers in-store to connect on-line influence with offline conversion. Push promo-tions for underperform-ing stores and encourage participation with online reviews from a loyal cus-tomer base.
empowerCreate a seamless expe-rience. Participants will look for retailers via mul-tiple devices. Retail local data needs distribution all the way down, from search engine platforms to data providers to direc-tories. Once retailers have directed traffic in-store, does your mobile experi-ence stop?
connect
1. “Google: 50% of Mobile Search Is Local” (Screenwerk, October 2012)
l o c a l s h o p p i n gw i t h s e a r c h

a c t i o n a b l e a n a l y t i c sbig data to big insights
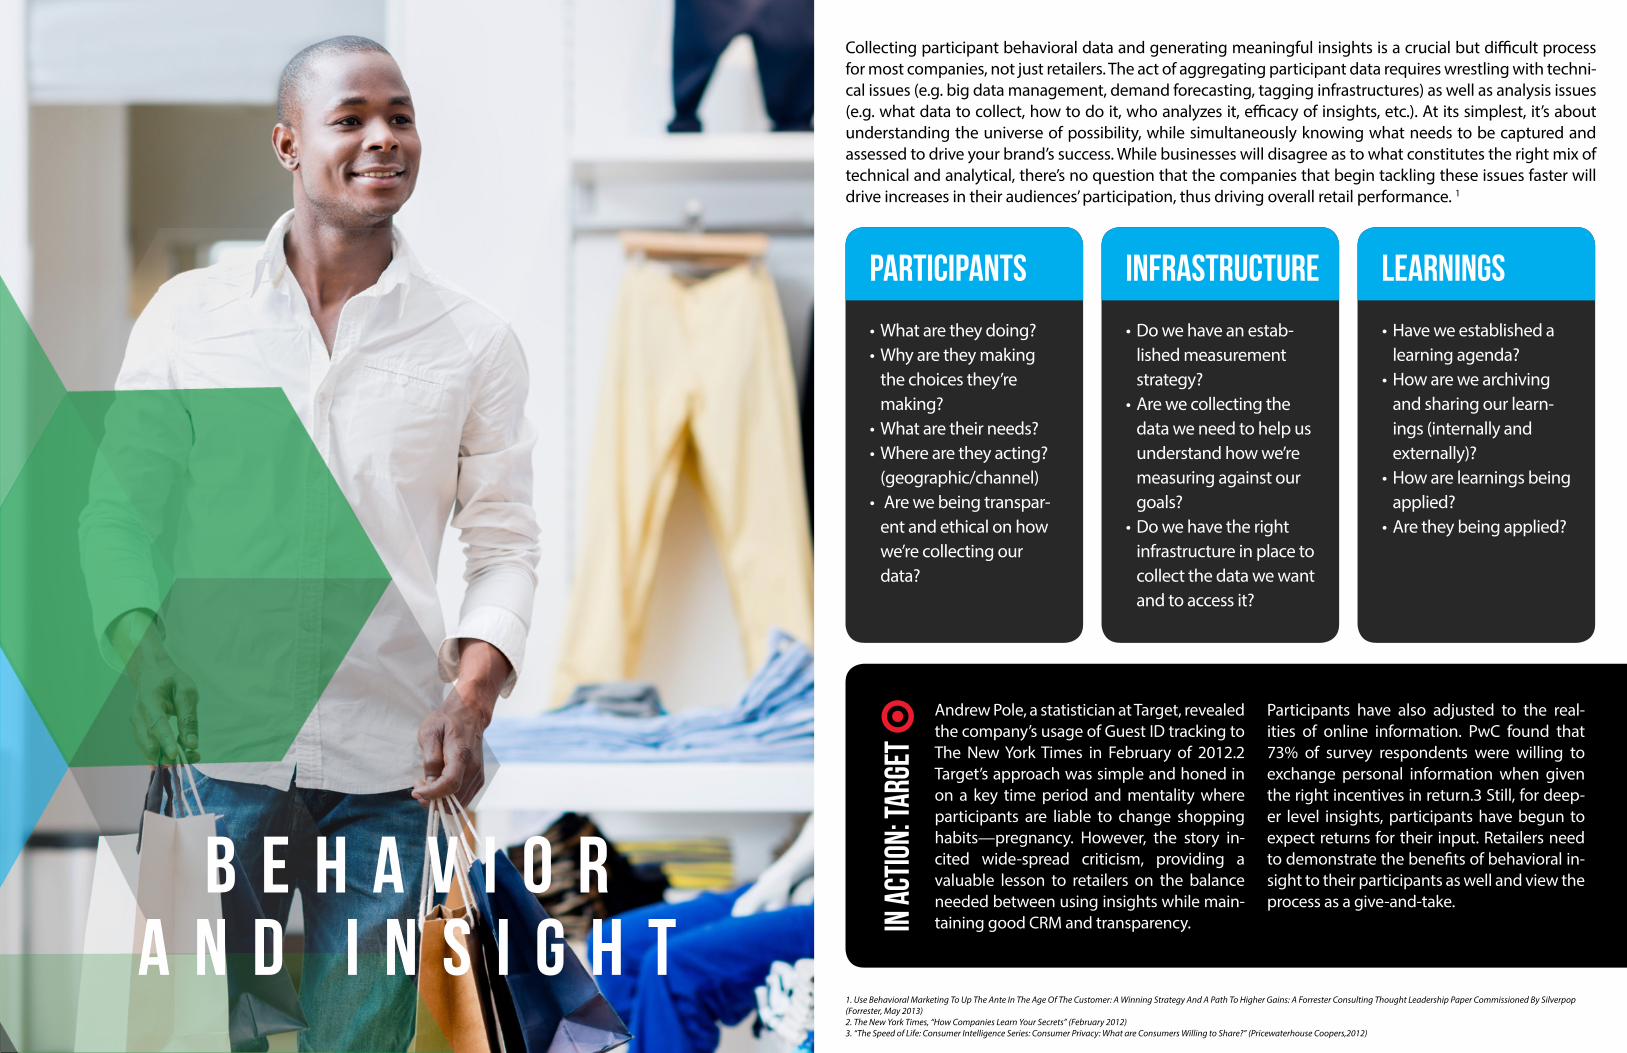
Collecting participant behavioral data and generating meaningful insights is a crucial but difficult process for most companies, not just retailers. The act of aggregating participant data requires wrestling with techni-cal issues (e.g. big data management, demand forecasting, tagging infrastructures) as well as analysis issues (e.g. what data to collect, how to do it, who analyzes it, efficacy of insights, etc.). At its simplest, it’s about understanding the universe of possibility, while simultaneously knowing what needs to be captured and assessed to drive your brand’s success. While businesses will disagree as to what constitutes the right mix of technical and analytical, there’s no question that the companies that begin tackling these issues faster will drive increases in their audiences’ participation, thus driving overall retail performance. 1
• What are they doing?• Why are they making
the choices they’re making?
• What are their needs?• Where are they acting?
(geographic/channel)• Are we being transpar-
ent and ethical on how we’re collecting our data?
PARTICIPANTS INFRASTRUCTURE LEARNINGS
• Do we have an estab-lished measurement strategy?
• Are we collecting the data we need to help us understand how we’re measuring against our goals?
• Do we have the right infrastructure in place to collect the data we want and to access it?
• Have we established a learning agenda?
• How are we archiving and sharing our learn-ings (internally and externally)?
• How are learnings being applied?
• Are they being applied?
Andrew Pole, a statistician at Target, revealed the company’s usage of Guest ID tracking to The New York Times in February of 2012.2 Target’s approach was simple and honed in on a key time period and mentality where participants are liable to change shopping habits—pregnancy. However, the story in-cited wide-spread criticism, providing a valuable lesson to retailers on the balance needed between using insights while main-taining good CRM and transparency.
Participants have also adjusted to the real-ities of online information. PwC found that 73% of survey respondents were willing to exchange personal information when given the right incentives in return.3 Still, for deep-er level insights, participants have begun to expect returns for their input. Retailers need to demonstrate the benefits of behavioral in-sight to their participants as well and view the process as a give-and-take.
in a
ctio
n: ta
rget
1. Use Behavioral Marketing To Up The Ante In The Age Of The Customer: A Winning Strategy And A Path To Higher Gains: A Forrester Consulting Thought Leadership Paper Commissioned By Silverpop (Forrester, May 2013)2. The New York Times, “How Companies Learn Your Secrets” (February 2012)3. “The Speed of Life: Consumer Intelligence Series: Consumer Privacy: What are Consumers Willing to Share?” (Pricewaterhouse Coopers,2012)
b e h a v i o ra n d i n s i g h t

a t t r i b u t i o n
While attribution means different things to different people, outcomes and methods are beginning to converge as more marketers seek to deploy omnichannel strategies. Currently, many marketing man-agers deploy improved measurement and optimization within and across digital channels and are in-terested in methods that account for digital and traditional paid, owned, and earned media. For CMOs and Brand Managers, attribution is about constructing a singular view of the customer, online to offline. Under each definition, all marketing touchpoints are linked. While each person will approach the topic of attribution differently, attribution analysis can help your company make sense of the nonlinear ways participants are moving fluidly across various media touchpoints in their purchase processes.
cmo’s &brand managers
• Connect online activity to
offline sales
• Econometric modeling,
database analytics, and
matched-market testing
performancemarketers
technologymanagers
• Identify the impact that
digital media makes across
all channels through
cross-channel attribution
• Make dynamic decisions
around budget allocation
and optimization
• Plot intersections between
paid, owned, and earned
channels
• Exploit synergies by shift-
ing budgets from chan-
nel-to-channel, in real-time,
based on ROI
• Integrate offline and online
data to deliver engaging
experiences based on mer-
chandise optimizations and
participant behaviors
• Content management sys-
tems to deliver relevant con-
tent that reflect participant
needs and business goals
ChallengeMeasure the impact of paid search on in-store sales to influ-ence budgeting and mix models
SolutionDatabase Analytics & TestingMatching transaction data from the client’s in-store credit card purchasers (who match the panel) to identify the offline lift from digital media channels including search, display and social.
in action: Online-Offline Attribution for a Multi-Channel RetailerOutcomeInvestment in digital channels increased significantly to drive of-fline sales. The multipliers helped drive a 176% YoY increase in in-vestment for paid search during the holidays, which helped gen-erate +98% YoY increase in offline sales influenced by digital media.

Imagine your shoppers walking through your doors, loading up a cart, waiting in line, only to then turn and walk out of the store. Though conversion rates vary by vertical, the average for retailers is 4–8%. Half of online participants drop off between cart and checkout.1 Just as a storefronts needs constant attention to layout and design, your online storefront will need to be optimized for your target participants to make more purchases online. Here are the three steps to conversion optimization.
1Conversion Strategy and Planning:building SUCCESSFUL FOUNDATIONS
1. “Ecommerce conversion rates” (Smart Insights, June 2013)
Opportunityaudit
Conversionpath audit
Competitivereview
Recommendation & prioritization
Optimization/testing roadmap
2Conversion IMPLEMENTATION:Testing for Success Also Reveals Shopper Behaviors
VS.A BA/B and multivariate testing is a tactic for refining conversion theo-ries and recommendations. These tools enable retailers to leverage landing pages more efficiently and/or lower funnel conversion pro-cesses (like shopping cart, registration forms, quote tools).
3Conversion ANALYSIS:Findings Lead to Greater Insights and ROI Benefits
Savings and value propositions
Cleanup andplacement
Hero imagesand color
Customize basedupon audience
COPY LAYOUT IMAGES TARGETING
The road to conversion optimization is not fast and often takes at least 6–12 months. Longer term testing is often necessary to address improvements to conversions, user engagement, and behavior. c o n v e r s i o n
o p t i m i z a t i o n

for more information
Lindsay LandsbergSVP, Business Development
David BabstVice President, Business Development
www.performics.comtwitter.com/performics
facebook.com/performics

2014