Performance Report, by CCO -...
11
HEALTH POLICY & ANALYTICS Office of Health Analytics Performance Report, by CCO September 6, 2016 This document displays each CCO’s performance on each of the measures available in the August 2016 dashboard (posted September 2 nd ). These results reflect a claims window from May 1, 2015 through April 30, 2016.
Transcript of Performance Report, by CCO -...
HEALTH POLICY & ANALYTICS
Office of Health Analytics
Performance Report, by CCOSeptember 6, 2016
This document displays each CCO’s performance on each of the measures available in the August 2016
dashboard (posted September 2nd).
These results reflect a claims window from May 1, 2015 through April 30, 2016.
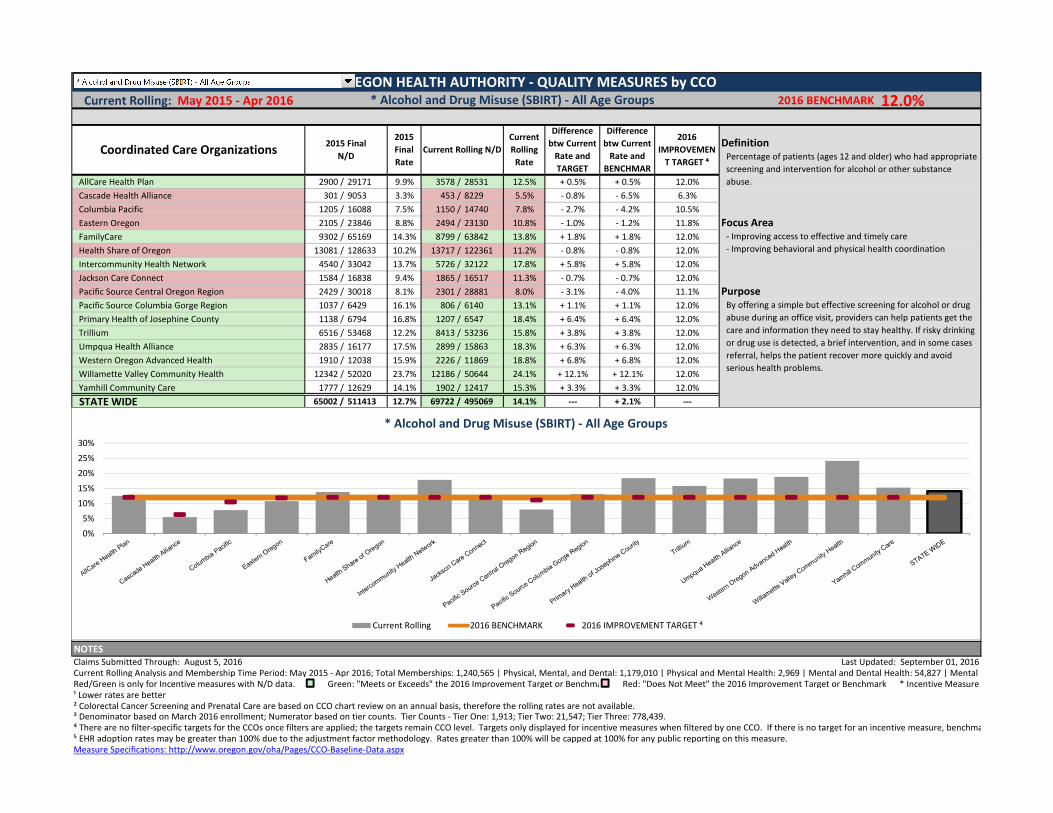
Current Rolling: May 2015 - Apr 2016 2016 BENCHMARK 12.0%
Definition
AllCare Health Plan 2900 / 29171 9.9% 3578 / 28531 12.5% + 0.5% + 0.5% 12.0%
Cascade Health Alliance 301 / 9053 3.3% 453 / 8229 5.5% - 0.8% - 6.5% 6.3%
Columbia Pacific 1205 / 16088 7.5% 1150 / 14740 7.8% - 2.7% - 4.2% 10.5%
Eastern Oregon 2105 / 23846 8.8% 2494 / 23130 10.8% - 1.0% - 1.2% 11.8% Focus Area
FamilyCare 9302 / 65169 14.3% 8799 / 63842 13.8% + 1.8% + 1.8% 12.0%
Health Share of Oregon 13081 / 128633 10.2% 13717 / 122361 11.2% - 0.8% - 0.8% 12.0%
Intercommunity Health Network 4540 / 33042 13.7% 5726 / 32122 17.8% + 5.8% + 5.8% 12.0%
Jackson Care Connect 1584 / 16838 9.4% 1865 / 16517 11.3% - 0.7% - 0.7% 12.0%
Pacific Source Central Oregon Region 2429 / 30018 8.1% 2301 / 28881 8.0% - 3.1% - 4.0% 11.1% Purpose
Pacific Source Columbia Gorge Region 1037 / 6429 16.1% 806 / 6140 13.1% + 1.1% + 1.1% 12.0%
Primary Health of Josephine County 1138 / 6794 16.8% 1207 / 6547 18.4% + 6.4% + 6.4% 12.0%
Trillium 6516 / 53468 12.2% 8413 / 53236 15.8% + 3.8% + 3.8% 12.0%
Umpqua Health Alliance 2835 / 16177 17.5% 2899 / 15863 18.3% + 6.3% + 6.3% 12.0%
Western Oregon Advanced Health 1910 / 12038 15.9% 2226 / 11869 18.8% + 6.8% + 6.8% 12.0%
Willamette Valley Community Health 12342 / 52020 23.7% 12186 / 50644 24.1% + 12.1% + 12.1% 12.0%
Yamhill Community Care 1777 / 12629 14.1% 1902 / 12417 15.3% + 3.3% + 3.3% 12.0%
STATE WIDE 65002 / 511413 12.7% 69722 / 495069 14.1% --- + 2.1% ---
NOTES
Claims Submitted Through: August 5, 2016 Last Updated: September 01, 2016
Current Rolling Analysis and Membership Time Period: May 2015 - Apr 2016; Total Memberships: 1,240,565 | Physical, Mental, and Dental: 1,179,010 | Physical and Mental Health: 2,969 | Mental and Dental Health: 54,827 | Mental Health Only: 3,759
Red/Green is only for Incentive measures with N/D data. Green: "Meets or Exceeds" the 2016 Improvement Target or Benchmark Red: "Does Not Meet" the 2016 Improvement Target or Benchmark * Incentive Measure
¹ Lower rates are better
² Colorectal Cancer Screening and Prenatal Care are based on CCO chart review on an annual basis, therefore the rolling rates are not available.³ Denominator based on March 2016 enrollment; Numerator based on tier counts. Tier Counts - Tier One: 1,913; Tier Two: 21,547; Tier Three: 778,439.
⁴ There are no filter-specific targets for the CCOs once filters are applied; the targets remain CCO level. Targets only displayed for incentive measures when filtered by one CCO. If there is no target for an incentive measure, benchmark is displayed.
⁵ EHR adoption rates may be greater than 100% due to the adjustment factor methodology. Rates greater than 100% will be capped at 100% for any public reporting on this measure.
Measure Specifications: http://www.oregon.gov/oha/Pages/CCO-Baseline-Data.aspx
Current Rolling N/D
2015
Final
Rate
2015 Final
N/D
By offering a simple but effective screening for alcohol or drug
abuse during an office visit, providers can help patients get the
care and information they need to stay healthy. If risky drinking
or drug use is detected, a brief intervention, and in some cases
referral, helps the patient recover more quickly and avoid
serious health problems.
- Improving access to effective and timely care
- Improving behavioral and physical health coordination
Percentage of patients (ages 12 and older) who had appropriate
screening and intervention for alcohol or other substance
abuse.
OREGON HEALTH AUTHORITY - QUALITY MEASURES by CCO* Alcohol and Drug Misuse (SBIRT) - All Age Groups
Coordinated Care Organizations2016
IMPROVEMEN
T TARGET ⁴
Difference
btw Current
Rate and
BENCHMAR
Difference
btw Current
Rate and
TARGET
Current
Rolling
Rate
0%
5%
10%
15%
20%
25%
30%
* Alcohol and Drug Misuse (SBIRT) - All Age Groups
Current Rolling 2016 BENCHMARK 2016 IMPROVEMENT TARGET ⁴
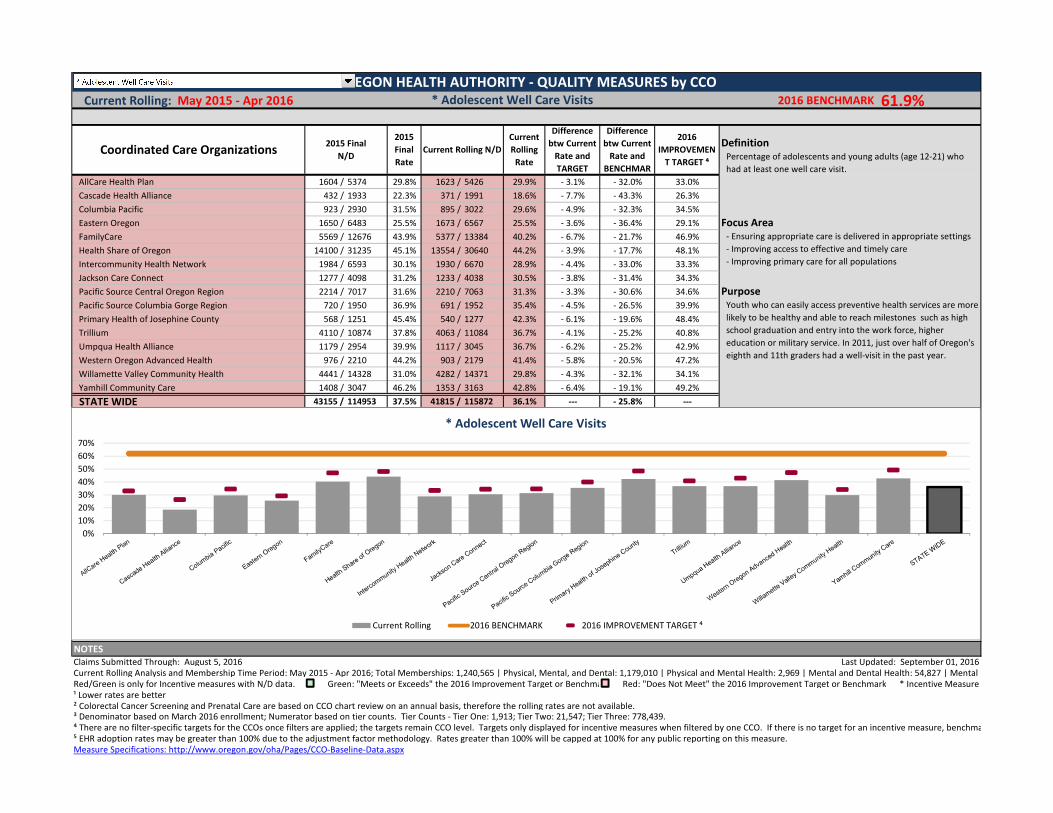
Current Rolling: May 2015 - Apr 2016 2016 BENCHMARK 61.9%
Definition
AllCare Health Plan 1604 / 5374 29.8% 1623 / 5426 29.9% - 3.1% - 32.0% 33.0%
Cascade Health Alliance 432 / 1933 22.3% 371 / 1991 18.6% - 7.7% - 43.3% 26.3%
Columbia Pacific 923 / 2930 31.5% 895 / 3022 29.6% - 4.9% - 32.3% 34.5%
Eastern Oregon 1650 / 6483 25.5% 1673 / 6567 25.5% - 3.6% - 36.4% 29.1% Focus Area
FamilyCare 5569 / 12676 43.9% 5377 / 13384 40.2% - 6.7% - 21.7% 46.9%
Health Share of Oregon 14100 / 31235 45.1% 13554 / 30640 44.2% - 3.9% - 17.7% 48.1%
Intercommunity Health Network 1984 / 6593 30.1% 1930 / 6670 28.9% - 4.4% - 33.0% 33.3%
Jackson Care Connect 1277 / 4098 31.2% 1233 / 4038 30.5% - 3.8% - 31.4% 34.3%
Pacific Source Central Oregon Region 2214 / 7017 31.6% 2210 / 7063 31.3% - 3.3% - 30.6% 34.6% Purpose
Pacific Source Columbia Gorge Region 720 / 1950 36.9% 691 / 1952 35.4% - 4.5% - 26.5% 39.9%
Primary Health of Josephine County 568 / 1251 45.4% 540 / 1277 42.3% - 6.1% - 19.6% 48.4%
Trillium 4110 / 10874 37.8% 4063 / 11084 36.7% - 4.1% - 25.2% 40.8%
Umpqua Health Alliance 1179 / 2954 39.9% 1117 / 3045 36.7% - 6.2% - 25.2% 42.9%
Western Oregon Advanced Health 976 / 2210 44.2% 903 / 2179 41.4% - 5.8% - 20.5% 47.2%
Willamette Valley Community Health 4441 / 14328 31.0% 4282 / 14371 29.8% - 4.3% - 32.1% 34.1%
Yamhill Community Care 1408 / 3047 46.2% 1353 / 3163 42.8% - 6.4% - 19.1% 49.2%
STATE WIDE 43155 / 114953 37.5% 41815 / 115872 36.1% --- - 25.8% ---
NOTES
Claims Submitted Through: August 5, 2016 Last Updated: September 01, 2016
Current Rolling Analysis and Membership Time Period: May 2015 - Apr 2016; Total Memberships: 1,240,565 | Physical, Mental, and Dental: 1,179,010 | Physical and Mental Health: 2,969 | Mental and Dental Health: 54,827 | Mental Health Only: 3,759
Red/Green is only for Incentive measures with N/D data. Green: "Meets or Exceeds" the 2016 Improvement Target or Benchmark Red: "Does Not Meet" the 2016 Improvement Target or Benchmark * Incentive Measure
¹ Lower rates are better
² Colorectal Cancer Screening and Prenatal Care are based on CCO chart review on an annual basis, therefore the rolling rates are not available.³ Denominator based on March 2016 enrollment; Numerator based on tier counts. Tier Counts - Tier One: 1,913; Tier Two: 21,547; Tier Three: 778,439.
⁴ There are no filter-specific targets for the CCOs once filters are applied; the targets remain CCO level. Targets only displayed for incentive measures when filtered by one CCO. If there is no target for an incentive measure, benchmark is displayed.
⁵ EHR adoption rates may be greater than 100% due to the adjustment factor methodology. Rates greater than 100% will be capped at 100% for any public reporting on this measure.
Measure Specifications: http://www.oregon.gov/oha/Pages/CCO-Baseline-Data.aspx
Current Rolling N/D
2015
Final
Rate
2015 Final
N/D
Youth who can easily access preventive health services are more
likely to be healthy and able to reach milestones such as high
school graduation and entry into the work force, higher
education or military service. In 2011, just over half of Oregon's
eighth and 11th graders had a well-visit in the past year.
- Ensuring appropriate care is delivered in appropriate settings
- Improving access to effective and timely care
- Improving primary care for all populations
Percentage of adolescents and young adults (age 12-21) who
had at least one well care visit.
OREGON HEALTH AUTHORITY - QUALITY MEASURES by CCO* Adolescent Well Care Visits
Coordinated Care Organizations2016
IMPROVEMEN
T TARGET ⁴
Difference
btw Current
Rate and
BENCHMAR
Difference
btw Current
Rate and
TARGET
Current
Rolling
Rate
0%
10%
20%
30%
40%
50%
60%
70%
* Adolescent Well Care Visits
Current Rolling 2016 BENCHMARK 2016 IMPROVEMENT TARGET ⁴
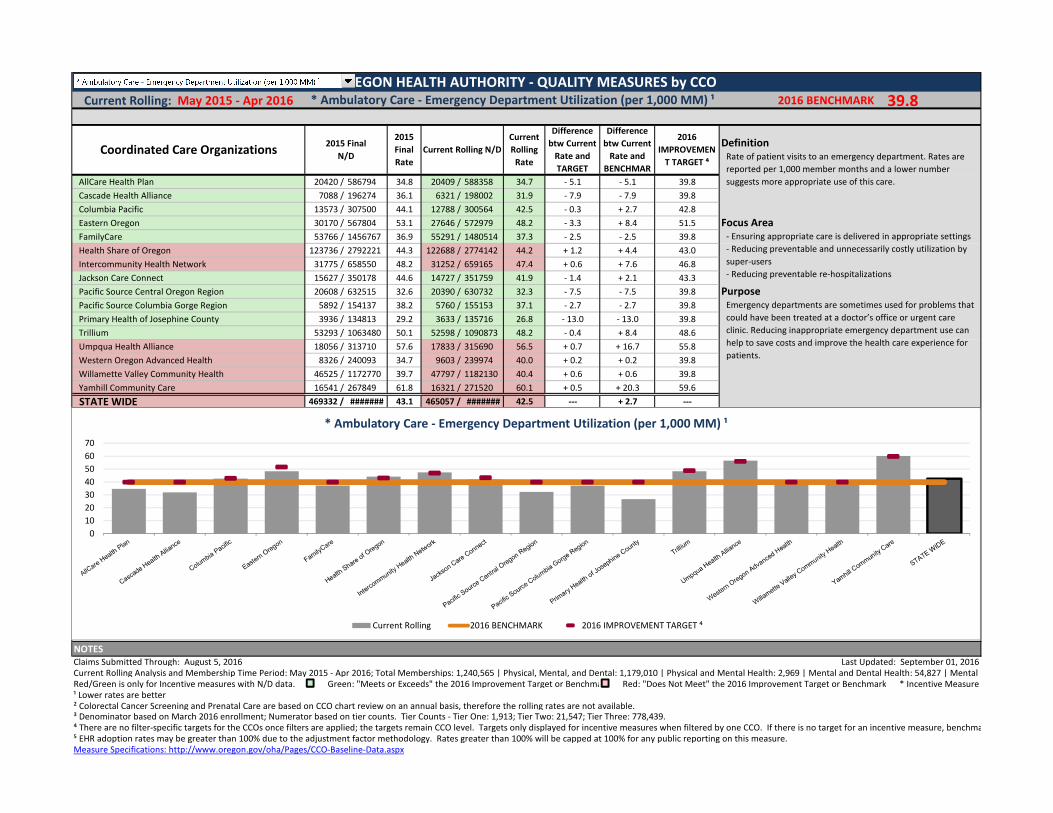
Current Rolling: May 2015 - Apr 2016 2016 BENCHMARK 39.8
Definition
AllCare Health Plan 20420 / 586794 34.8 20409 / 588358 34.7 - 5.1 - 5.1 39.8
Cascade Health Alliance 7088 / 196274 36.1 6321 / 198002 31.9 - 7.9 - 7.9 39.8
Columbia Pacific 13573 / 307500 44.1 12788 / 300564 42.5 - 0.3 + 2.7 42.8
Eastern Oregon 30170 / 567804 53.1 27646 / 572979 48.2 - 3.3 + 8.4 51.5 Focus Area
FamilyCare 53766 / 1456767 36.9 55291 / 1480514 37.3 - 2.5 - 2.5 39.8
Health Share of Oregon 123736 / 2792221 44.3 122688 / 2774142 44.2 + 1.2 + 4.4 43.0
Intercommunity Health Network 31775 / 658550 48.2 31252 / 659165 47.4 + 0.6 + 7.6 46.8
Jackson Care Connect 15627 / 350178 44.6 14727 / 351759 41.9 - 1.4 + 2.1 43.3
Pacific Source Central Oregon Region 20608 / 632515 32.6 20390 / 630732 32.3 - 7.5 - 7.5 39.8 Purpose
Pacific Source Columbia Gorge Region 5892 / 154137 38.2 5760 / 155153 37.1 - 2.7 - 2.7 39.8
Primary Health of Josephine County 3936 / 134813 29.2 3633 / 135716 26.8 - 13.0 - 13.0 39.8
Trillium 53293 / 1063480 50.1 52598 / 1090873 48.2 - 0.4 + 8.4 48.6
Umpqua Health Alliance 18056 / 313710 57.6 17833 / 315690 56.5 + 0.7 + 16.7 55.8
Western Oregon Advanced Health 8326 / 240093 34.7 9603 / 239974 40.0 + 0.2 + 0.2 39.8
Willamette Valley Community Health 46525 / 1172770 39.7 47797 / 1182130 40.4 + 0.6 + 0.6 39.8
Yamhill Community Care 16541 / 267849 61.8 16321 / 271520 60.1 + 0.5 + 20.3 59.6
STATE WIDE 469332 / ####### 43.1 465057 / ####### 42.5 --- + 2.7 ---
NOTES
Claims Submitted Through: August 5, 2016 Last Updated: September 01, 2016
Current Rolling Analysis and Membership Time Period: May 2015 - Apr 2016; Total Memberships: 1,240,565 | Physical, Mental, and Dental: 1,179,010 | Physical and Mental Health: 2,969 | Mental and Dental Health: 54,827 | Mental Health Only: 3,759
Red/Green is only for Incentive measures with N/D data. Green: "Meets or Exceeds" the 2016 Improvement Target or Benchmark Red: "Does Not Meet" the 2016 Improvement Target or Benchmark * Incentive Measure
¹ Lower rates are better
² Colorectal Cancer Screening and Prenatal Care are based on CCO chart review on an annual basis, therefore the rolling rates are not available.³ Denominator based on March 2016 enrollment; Numerator based on tier counts. Tier Counts - Tier One: 1,913; Tier Two: 21,547; Tier Three: 778,439.
⁴ There are no filter-specific targets for the CCOs once filters are applied; the targets remain CCO level. Targets only displayed for incentive measures when filtered by one CCO. If there is no target for an incentive measure, benchmark is displayed.
⁵ EHR adoption rates may be greater than 100% due to the adjustment factor methodology. Rates greater than 100% will be capped at 100% for any public reporting on this measure.
Measure Specifications: http://www.oregon.gov/oha/Pages/CCO-Baseline-Data.aspx
Current Rolling N/D
2015
Final
Rate
2015 Final
N/D
Emergency departments are sometimes used for problems that
could have been treated at a doctor’s office or urgent care
clinic. Reducing inappropriate emergency department use can
help to save costs and improve the health care experience for
patients.
- Ensuring appropriate care is delivered in appropriate settings
- Reducing preventable and unnecessarily costly utilization by
super-users
- Reducing preventable re-hospitalizations
Rate of patient visits to an emergency department. Rates are
reported per 1,000 member months and a lower number
suggests more appropriate use of this care.
OREGON HEALTH AUTHORITY - QUALITY MEASURES by CCO* Ambulatory Care - Emergency Department Utilization (per 1,000 MM) ¹
Coordinated Care Organizations2016
IMPROVEMEN
T TARGET ⁴
Difference
btw Current
Rate and
BENCHMAR
Difference
btw Current
Rate and
TARGET
Current
Rolling
Rate
0
10
20
30
40
50
60
70
* Ambulatory Care - Emergency Department Utilization (per 1,000 MM) ¹
Current Rolling 2016 BENCHMARK 2016 IMPROVEMENT TARGET ⁴

Current Rolling: May 2015 - Apr 2016 2016 BENCHMARK 90.0%
Definition
AllCare Health Plan 71 / 176 40.3% 77 / 162 47.5% + 2.2% - 42.5% 45.3%
Cascade Health Alliance 30 / 63 47.6% 29 / 56 51.8% 0.0 - 38.2% 51.8%
Columbia Pacific 32 / 58 55.2% 38 / 65 58.5% - 0.2% - 31.5% 58.7%
Eastern Oregon 64 / 104 61.5% 71 / 107 66.4% + 1.9% - 23.6% 64.5% Focus Area
FamilyCare 105 / 168 62.5% 117 / 175 66.9% + 1.4% - 23.1% 65.5%
Health Share of Oregon 164 / 248 66.1% 179 / 273 65.6% - 3.5% - 24.4% 69.1%
Intercommunity Health Network 49 / 90 54.4% 42 / 78 53.8% - 4.2% - 36.2% 58.0%
Jackson Care Connect 66 / 98 67.3% 50 / 89 56.2% - 14.1% - 33.8% 70.3%
Pacific Source Central Oregon Region 69 / 117 59.0% 48 / 100 48.0% - 14.1% - 42.0% 62.1% Purpose
Pacific Source Columbia Gorge Region 23 / 30 76.7% 16 / 28 57.1% - 22.6% - 32.9% 79.7%
Primary Health of Josephine County 10 / 19 52.6% 10 / 18 55.6% - 0.7% - 34.4% 56.3%
Trillium 178 / 296 60.1% 168 / 262 64.1% + 1.0% - 25.9% 63.1%
Umpqua Health Alliance 31 / 62 50.0% 49 / 103 47.6% - 6.4% - 42.4% 54.0%
Western Oregon Advanced Health 64 / 129 49.6% 68 / 113 60.2% + 6.6% - 29.8% 53.6%
Willamette Valley Community Health 107 / 160 66.9% 96 / 143 67.1% - 2.8% - 22.9% 69.9%
Yamhill Community Care 5 / 12 41.7% 7 / 20 35.0% - 11.5% - 55.0% 46.5%
STATE WIDE 1068 / 1830 58.4% 1065 / 1792 59.4% --- - 30.6% ---
NOTES
Claims Submitted Through: August 5, 2016 Last Updated: September 01, 2016
Current Rolling Analysis and Membership Time Period: May 2015 - Apr 2016; Total Memberships: 1,240,565 | Physical, Mental, and Dental: 1,179,010 | Physical and Mental Health: 2,969 | Mental and Dental Health: 54,827 | Mental Health Only: 3,759
Red/Green is only for Incentive measures with N/D data. Green: "Meets or Exceeds" the 2016 Improvement Target or Benchmark Red: "Does Not Meet" the 2016 Improvement Target or Benchmark * Incentive Measure
¹ Lower rates are better
² Colorectal Cancer Screening and Prenatal Care are based on CCO chart review on an annual basis, therefore the rolling rates are not available.³ Denominator based on March 2016 enrollment; Numerator based on tier counts. Tier Counts - Tier One: 1,913; Tier Two: 21,547; Tier Three: 778,439.
⁴ There are no filter-specific targets for the CCOs once filters are applied; the targets remain CCO level. Targets only displayed for incentive measures when filtered by one CCO. If there is no target for an incentive measure, benchmark is displayed.
⁵ EHR adoption rates may be greater than 100% due to the adjustment factor methodology. Rates greater than 100% will be capped at 100% for any public reporting on this measure.
Measure Specifications: http://www.oregon.gov/oha/Pages/CCO-Baseline-Data.aspx
Current Rolling N/D
2015
Final
Rate
2015 Final
N/D
Children who have been placed in foster care should have their
physical, mental, and dental health checked so that an
appropriate care plan can be developed. All three health
assessments are a requirement for the foster program, which
one(s) based on age, because of their importance to improving
the health and well-being of a child in a trying situation.
- Improving access to effective and timely care
- Improving behavioral, physical, and dental health coordination
Percentage of children who receive specific health assessments
within 60 days of the state notifying CCOs that the children were
placed into custody with the Department of Human Services
(foster care). Specific assessment requirements: Ages <1 -
Physical health only; Ages 1-4 - Physical and dental; Ages 4
through 17 - Physical, Mental, and Dental.
OREGON HEALTH AUTHORITY - QUALITY MEASURES by CCO* Assessments for Children in DHS Custody
Coordinated Care Organizations2016
IMPROVEMEN
T TARGET ⁴
Difference
btw Current
Rate and
BENCHMAR
Difference
btw Current
Rate and
TARGET
Current
Rolling
Rate
0%10%20%30%40%50%60%70%80%90%
100%
* Assessments for Children in DHS Custody
Current Rolling 2016 BENCHMARK 2016 IMPROVEMENT TARGET ⁴

Current Rolling: May 2015 - Apr 2016 2016 BENCHMARK 20.0%
Definition
AllCare Health Plan 1348 / 6383 21.1% 1358 / 6337 21.4% + 1.4% + 1.4% 20.0%
Cascade Health Alliance 291 / 2194 13.3% 279 / 2185 12.8% - 3.5% - 7.2% 16.3%
Columbia Pacific 536 / 3322 16.1% 523 / 3353 15.6% - 3.5% - 4.4% 19.1%
Eastern Oregon 1117 / 7766 14.4% 1055 / 7759 13.6% - 3.8% - 6.4% 17.4% Focus Area
FamilyCare 2822 / 15428 18.3% 2725 / 15818 17.2% - 2.8% - 2.8% 20.0%
Health Share of Oregon 7332 / 35077 20.9% 6371 / 33675 18.9% - 1.1% - 1.1% 20.0%
Intercommunity Health Network 1270 / 7542 16.8% 1186 / 7529 15.8% - 4.0% - 4.2% 19.8%
Jackson Care Connect 1114 / 4680 23.8% 1021 / 4572 22.3% + 2.3% + 2.3% 20.0%
Pacific Source Central Oregon Region 909 / 8060 11.3% 781 / 7976 9.8% - 4.5% - 10.2% 14.3% Purpose
Pacific Source Columbia Gorge Region 285 / 2263 12.6% 266 / 2229 11.9% - 3.7% - 8.1% 15.6%
Primary Health of Josephine County 298 / 1226 24.3% 268 / 1247 21.5% + 1.5% + 1.5% 20.0%
Trillium 2236 / 11833 18.9% 2234 / 11737 19.0% - 1.0% - 1.0% 20.0%
Umpqua Health Alliance 557 / 3217 17.3% 637 / 3259 19.5% - 0.5% - 0.5% 20.0%
Western Oregon Advanced Health 420 / 2360 17.8% 379 / 2294 16.5% - 3.5% - 3.5% 20.0%
Willamette Valley Community Health 3288 / 17525 18.8% 3214 / 17277 18.6% - 1.4% - 1.4% 20.0%
Yamhill Community Care 721 / 3693 19.5% 557 / 3665 15.2% - 4.8% - 4.8% 20.0%
STATE WIDE 24544 / 132569 18.5% 22854 / 130912 17.5% --- - 2.5% ---
NOTES
Claims Submitted Through: August 5, 2016 Last Updated: September 01, 2016
Current Rolling Analysis and Membership Time Period: May 2015 - Apr 2016; Total Memberships: 1,240,565 | Physical, Mental, and Dental: 1,179,010 | Physical and Mental Health: 2,969 | Mental and Dental Health: 54,827 | Mental Health Only: 3,759
Red/Green is only for Incentive measures with N/D data. Green: "Meets or Exceeds" the 2016 Improvement Target or Benchmark Red: "Does Not Meet" the 2016 Improvement Target or Benchmark * Incentive Measure
¹ Lower rates are better
² Colorectal Cancer Screening and Prenatal Care are based on CCO chart review on an annual basis, therefore the rolling rates are not available.³ Denominator based on March 2016 enrollment; Numerator based on tier counts. Tier Counts - Tier One: 1,913; Tier Two: 21,547; Tier Three: 778,439.
⁴ There are no filter-specific targets for the CCOs once filters are applied; the targets remain CCO level. Targets only displayed for incentive measures when filtered by one CCO. If there is no target for an incentive measure, benchmark is displayed.
⁵ EHR adoption rates may be greater than 100% due to the adjustment factor methodology. Rates greater than 100% will be capped at 100% for any public reporting on this measure.
Measure Specifications: http://www.oregon.gov/oha/Pages/CCO-Baseline-Data.aspx
Current Rolling N/D
2015
Final
Rate
2015 Final
N/D
By sealing the chewing surfaces of children's teeth, decay-
causing bacteria can be prevented from entering pits and
fissures of the of the teeth, adding protection from decay and
cavities.
- Reducing cavities and tooth decay
Percentage of children and adolescents (ages 6-14) who had
dental sealant applied to the chewing surfaces of their teeth.
OREGON HEALTH AUTHORITY - QUALITY MEASURES by CCO* Dental Sealants - All Age Groups
Coordinated Care Organizations2016
IMPROVEMEN
T TARGET ⁴
Difference
btw Current
Rate and
BENCHMAR
Difference
btw Current
Rate and
TARGET
Current
Rolling
Rate
0%
5%
10%
15%
20%
25%
* Dental Sealants - All Age Groups
Current Rolling 2016 BENCHMARK 2016 IMPROVEMENT TARGET ⁴
Current Rolling: May 2015 - Apr 2016 2016 BENCHMARK 50.0%
Definition
AllCare Health Plan 1642 / 2981 55.1% 1647 / 2902 56.8% + 6.8% + 6.8% 50.0%
Cascade Health Alliance 488 / 885 55.1% 477 / 923 51.7% + 1.7% + 1.7% 50.0%
Columbia Pacific 644 / 1278 50.4% 661 / 1266 52.2% + 2.2% + 2.2% 50.0%
Eastern Oregon 1483 / 3320 44.7% 1435 / 3070 46.7% - 1.0% - 3.3% 47.7% Focus Area
FamilyCare 4117 / 6915 59.5% 4271 / 6968 61.3% + 11.3% + 11.3% 50.0%
Health Share of Oregon 7118 / 12427 57.3% 6885 / 11620 59.3% + 9.3% + 9.3% 50.0%
Intercommunity Health Network 1092 / 3020 36.2% 1244 / 2899 42.9% + 3.7% - 7.1% 39.2%
Jackson Care Connect 724 / 1504 48.1% 735 / 1502 48.9% - 1.1% - 1.1% 50.0%
Pacific Source Central Oregon Region 1612 / 2983 54.0% 1585 / 2915 54.4% + 4.4% + 4.4% 50.0% Purpose
Pacific Source Columbia Gorge Region 516 / 889 58.0% 485 / 842 57.6% + 7.6% + 7.6% 50.0%
Primary Health of Josephine County 407 / 484 84.1% 422 / 483 87.4% + 37.4% + 37.4% 50.0%
Trillium 2845 / 4231 67.2% 2967 / 4175 71.1% + 21.1% + 21.1% 50.0%
Umpqua Health Alliance 912 / 1444 63.2% 895 / 1339 66.8% + 16.8% + 16.8% 50.0%
Western Oregon Advanced Health 642 / 1038 61.8% 647 / 963 67.2% + 17.2% + 17.2% 50.0%
Willamette Valley Community Health 3104 / 6473 48.0% 3184 / 6234 51.1% + 1.1% + 1.1% 50.0%
Yamhill Community Care 624 / 1221 51.1% 704 / 1212 58.1% + 8.1% + 8.1% 50.0%
STATE WIDE 27970 / 51093 54.7% 28244 / 49313 57.3% --- + 7.3% ---
NOTES
Claims Submitted Through: August 5, 2016 Last Updated: September 01, 2016
Current Rolling Analysis and Membership Time Period: May 2015 - Apr 2016; Total Memberships: 1,240,565 | Physical, Mental, and Dental: 1,179,010 | Physical and Mental Health: 2,969 | Mental and Dental Health: 54,827 | Mental Health Only: 3,759
Red/Green is only for Incentive measures with N/D data. Green: "Meets or Exceeds" the 2016 Improvement Target or Benchmark Red: "Does Not Meet" the 2016 Improvement Target or Benchmark * Incentive Measure
¹ Lower rates are better
² Colorectal Cancer Screening and Prenatal Care are based on CCO chart review on an annual basis, therefore the rolling rates are not available.³ Denominator based on March 2016 enrollment; Numerator based on tier counts. Tier Counts - Tier One: 1,913; Tier Two: 21,547; Tier Three: 778,439.
⁴ There are no filter-specific targets for the CCOs once filters are applied; the targets remain CCO level. Targets only displayed for incentive measures when filtered by one CCO. If there is no target for an incentive measure, benchmark is displayed.
⁵ EHR adoption rates may be greater than 100% due to the adjustment factor methodology. Rates greater than 100% will be capped at 100% for any public reporting on this measure.
Measure Specifications: http://www.oregon.gov/oha/Pages/CCO-Baseline-Data.aspx
Current Rolling N/D
2015
Final
Rate
2015 Final
N/D
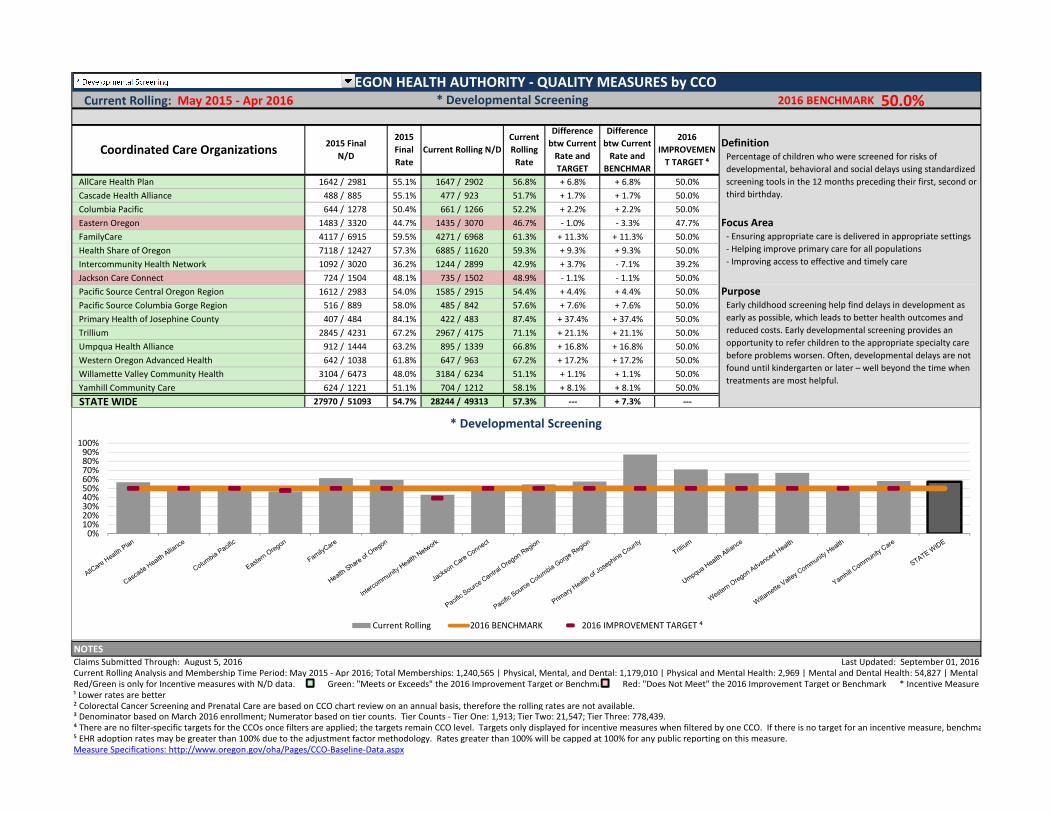
Early childhood screening help find delays in development as
early as possible, which leads to better health outcomes and
reduced costs. Early developmental screening provides an
opportunity to refer children to the appropriate specialty care
before problems worsen. Often, developmental delays are not
found until kindergarten or later – well beyond the time when
treatments are most helpful.
- Ensuring appropriate care is delivered in appropriate settings
- Helping improve primary care for all populations
- Improving access to effective and timely care
Percentage of children who were screened for risks of
developmental, behavioral and social delays using standardized
screening tools in the 12 months preceding their first, second or
third birthday.
OREGON HEALTH AUTHORITY - QUALITY MEASURES by CCO* Developmental Screening
Coordinated Care Organizations2016
IMPROVEMEN
T TARGET ⁴
Difference
btw Current
Rate and
BENCHMAR
Difference
btw Current
Rate and
TARGET
Current
Rolling
Rate
0%10%20%30%40%50%60%70%80%90%
100%
* Developmental Screening
Current Rolling 2016 BENCHMARK 2016 IMPROVEMENT TARGET ⁴
Current Rolling: May 2015 - Apr 2016 2016 BENCHMARK 50.0%
Definition
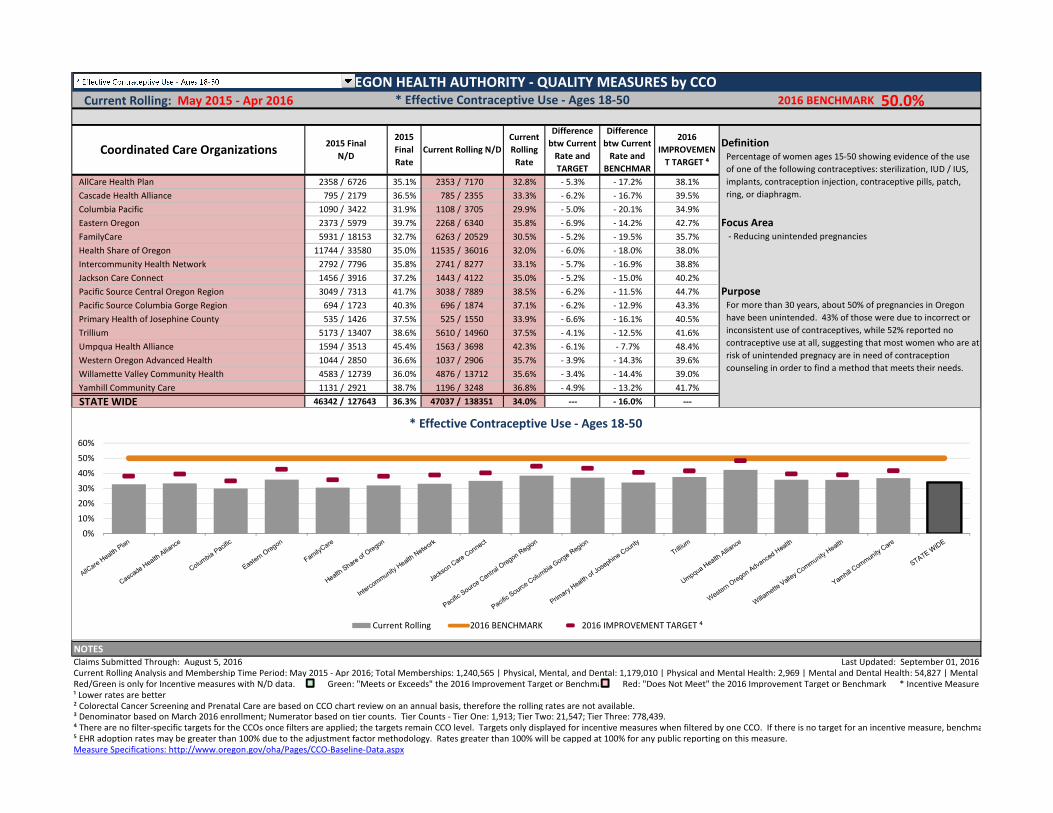
AllCare Health Plan 2358 / 6726 35.1% 2353 / 7170 32.8% - 5.3% - 17.2% 38.1%
Cascade Health Alliance 795 / 2179 36.5% 785 / 2355 33.3% - 6.2% - 16.7% 39.5%
Columbia Pacific 1090 / 3422 31.9% 1108 / 3705 29.9% - 5.0% - 20.1% 34.9%
Eastern Oregon 2373 / 5979 39.7% 2268 / 6340 35.8% - 6.9% - 14.2% 42.7% Focus Area
FamilyCare 5931 / 18153 32.7% 6263 / 20529 30.5% - 5.2% - 19.5% 35.7%
Health Share of Oregon 11744 / 33580 35.0% 11535 / 36016 32.0% - 6.0% - 18.0% 38.0%
Intercommunity Health Network 2792 / 7796 35.8% 2741 / 8277 33.1% - 5.7% - 16.9% 38.8%
Jackson Care Connect 1456 / 3916 37.2% 1443 / 4122 35.0% - 5.2% - 15.0% 40.2%
Pacific Source Central Oregon Region 3049 / 7313 41.7% 3038 / 7889 38.5% - 6.2% - 11.5% 44.7% Purpose
Pacific Source Columbia Gorge Region 694 / 1723 40.3% 696 / 1874 37.1% - 6.2% - 12.9% 43.3%
Primary Health of Josephine County 535 / 1426 37.5% 525 / 1550 33.9% - 6.6% - 16.1% 40.5%
Trillium 5173 / 13407 38.6% 5610 / 14960 37.5% - 4.1% - 12.5% 41.6%
Umpqua Health Alliance 1594 / 3513 45.4% 1563 / 3698 42.3% - 6.1% - 7.7% 48.4%
Western Oregon Advanced Health 1044 / 2850 36.6% 1037 / 2906 35.7% - 3.9% - 14.3% 39.6%
Willamette Valley Community Health 4583 / 12739 36.0% 4876 / 13712 35.6% - 3.4% - 14.4% 39.0%
Yamhill Community Care 1131 / 2921 38.7% 1196 / 3248 36.8% - 4.9% - 13.2% 41.7%
STATE WIDE 46342 / 127643 36.3% 47037 / 138351 34.0% --- - 16.0% ---
NOTES
Claims Submitted Through: August 5, 2016 Last Updated: September 01, 2016
Current Rolling Analysis and Membership Time Period: May 2015 - Apr 2016; Total Memberships: 1,240,565 | Physical, Mental, and Dental: 1,179,010 | Physical and Mental Health: 2,969 | Mental and Dental Health: 54,827 | Mental Health Only: 3,759
Red/Green is only for Incentive measures with N/D data. Green: "Meets or Exceeds" the 2016 Improvement Target or Benchmark Red: "Does Not Meet" the 2016 Improvement Target or Benchmark * Incentive Measure
¹ Lower rates are better
² Colorectal Cancer Screening and Prenatal Care are based on CCO chart review on an annual basis, therefore the rolling rates are not available.³ Denominator based on March 2016 enrollment; Numerator based on tier counts. Tier Counts - Tier One: 1,913; Tier Two: 21,547; Tier Three: 778,439.
⁴ There are no filter-specific targets for the CCOs once filters are applied; the targets remain CCO level. Targets only displayed for incentive measures when filtered by one CCO. If there is no target for an incentive measure, benchmark is displayed.
⁵ EHR adoption rates may be greater than 100% due to the adjustment factor methodology. Rates greater than 100% will be capped at 100% for any public reporting on this measure.
Measure Specifications: http://www.oregon.gov/oha/Pages/CCO-Baseline-Data.aspx
Current Rolling N/D
2015
Final
Rate
2015 Final
N/D
For more than 30 years, about 50% of pregnancies in Oregon
have been unintended. 43% of those were due to incorrect or
inconsistent use of contraceptives, while 52% reported no
contraceptive use at all, suggesting that most women who are at
risk of unintended pregnacy are in need of contraception
counseling in order to find a method that meets their needs.
- Reducing unintended pregnancies
Percentage of women ages 15-50 showing evidence of the use
of one of the following contraceptives: sterilization, IUD / IUS,
implants, contraception injection, contraceptive pills, patch,
ring, or diaphragm.
OREGON HEALTH AUTHORITY - QUALITY MEASURES by CCO* Effective Contraceptive Use - Ages 18-50
Coordinated Care Organizations2016
IMPROVEMEN
T TARGET ⁴
Difference
btw Current
Rate and
BENCHMAR
Difference
btw Current
Rate and
TARGET
Current
Rolling
Rate
0%
10%
20%
30%
40%
50%
60%
* Effective Contraceptive Use - Ages 18-50
Current Rolling 2016 BENCHMARK 2016 IMPROVEMENT TARGET ⁴
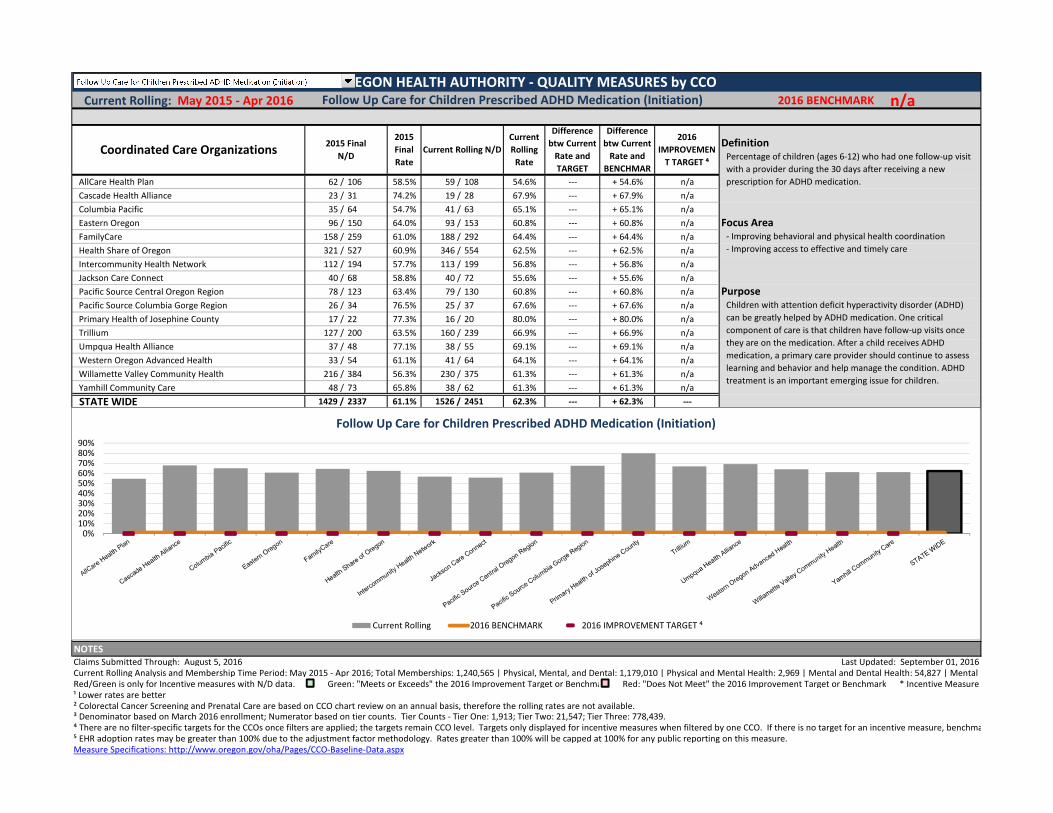
Current Rolling: May 2015 - Apr 2016 2016 BENCHMARK n/a
Definition
AllCare Health Plan 62 / 106 58.5% 59 / 108 54.6% --- + 54.6% n/a
Cascade Health Alliance 23 / 31 74.2% 19 / 28 67.9% --- + 67.9% n/a
Columbia Pacific 35 / 64 54.7% 41 / 63 65.1% --- + 65.1% n/a
Eastern Oregon 96 / 150 64.0% 93 / 153 60.8% --- + 60.8% n/a Focus Area
FamilyCare 158 / 259 61.0% 188 / 292 64.4% --- + 64.4% n/a
Health Share of Oregon 321 / 527 60.9% 346 / 554 62.5% --- + 62.5% n/a
Intercommunity Health Network 112 / 194 57.7% 113 / 199 56.8% --- + 56.8% n/a
Jackson Care Connect 40 / 68 58.8% 40 / 72 55.6% --- + 55.6% n/a
Pacific Source Central Oregon Region 78 / 123 63.4% 79 / 130 60.8% --- + 60.8% n/a Purpose
Pacific Source Columbia Gorge Region 26 / 34 76.5% 25 / 37 67.6% --- + 67.6% n/a
Primary Health of Josephine County 17 / 22 77.3% 16 / 20 80.0% --- + 80.0% n/a
Trillium 127 / 200 63.5% 160 / 239 66.9% --- + 66.9% n/a
Umpqua Health Alliance 37 / 48 77.1% 38 / 55 69.1% --- + 69.1% n/a
Western Oregon Advanced Health 33 / 54 61.1% 41 / 64 64.1% --- + 64.1% n/a
Willamette Valley Community Health 216 / 384 56.3% 230 / 375 61.3% --- + 61.3% n/a
Yamhill Community Care 48 / 73 65.8% 38 / 62 61.3% --- + 61.3% n/a
STATE WIDE 1429 / 2337 61.1% 1526 / 2451 62.3% --- + 62.3% ---
NOTES
Claims Submitted Through: August 5, 2016 Last Updated: September 01, 2016
Current Rolling Analysis and Membership Time Period: May 2015 - Apr 2016; Total Memberships: 1,240,565 | Physical, Mental, and Dental: 1,179,010 | Physical and Mental Health: 2,969 | Mental and Dental Health: 54,827 | Mental Health Only: 3,759
Red/Green is only for Incentive measures with N/D data. Green: "Meets or Exceeds" the 2016 Improvement Target or Benchmark Red: "Does Not Meet" the 2016 Improvement Target or Benchmark * Incentive Measure
¹ Lower rates are better
² Colorectal Cancer Screening and Prenatal Care are based on CCO chart review on an annual basis, therefore the rolling rates are not available.³ Denominator based on March 2016 enrollment; Numerator based on tier counts. Tier Counts - Tier One: 1,913; Tier Two: 21,547; Tier Three: 778,439.
⁴ There are no filter-specific targets for the CCOs once filters are applied; the targets remain CCO level. Targets only displayed for incentive measures when filtered by one CCO. If there is no target for an incentive measure, benchmark is displayed.
⁵ EHR adoption rates may be greater than 100% due to the adjustment factor methodology. Rates greater than 100% will be capped at 100% for any public reporting on this measure.
Measure Specifications: http://www.oregon.gov/oha/Pages/CCO-Baseline-Data.aspx
Current Rolling N/D
2015
Final
Rate
2015 Final
N/D
Children with attention deficit hyperactivity disorder (ADHD)
can be greatly helped by ADHD medication. One critical
component of care is that children have follow-up visits once
they are on the medication. After a child receives ADHD
medication, a primary care provider should continue to assess
learning and behavior and help manage the condition. ADHD
treatment is an important emerging issue for children.
- Improving behavioral and physical health coordination
- Improving access to effective and timely care
Percentage of children (ages 6-12) who had one follow-up visit
with a provider during the 30 days after receiving a new
prescription for ADHD medication.
OREGON HEALTH AUTHORITY - QUALITY MEASURES by CCOFollow Up Care for Children Prescribed ADHD Medication (Initiation)
Coordinated Care Organizations2016
IMPROVEMEN
T TARGET ⁴
Difference
btw Current
Rate and
BENCHMAR
Difference
btw Current
Rate and
TARGET
Current
Rolling
Rate
0%10%20%30%40%50%60%70%80%90%
Follow Up Care for Children Prescribed ADHD Medication (Initiation)
Current Rolling 2016 BENCHMARK 2016 IMPROVEMENT TARGET ⁴
Current Rolling: May 2015 - Apr 2016 2016 BENCHMARK 60.0%
Definition
AllCare Health Plan 114316 / 146370 78.1% 122697 / 145479 84.3% + 24.3% + 24.3% 60.0%
Cascade Health Alliance 38715 / 49317 78.5% 39570 / 49080 80.6% + 20.6% + 20.6% 60.0%
Columbia Pacific 62897 / 74925 83.9% 57686 / 73140 78.9% + 18.9% + 18.9% 60.0%
Eastern Oregon 105058 / 142953 73.5% 115461 / 142881 80.8% + 20.8% + 20.8% 60.0% Focus Area
FamilyCare 323183 / 369252 87.5% 315586 / 365949 86.2% + 26.2% + 26.2% 60.0%
Health Share of Oregon 624470 / 684789 91.2% 605196 / 663771 91.2% + 31.2% + 31.2% 60.0%
Intercommunity Health Network 154116 / 164037 94.0% 148723 / 161988 91.8% + 31.8% + 31.8% 60.0%
Jackson Care Connect 67092 / 87471 76.7% 61506 / 86784 70.9% + 10.9% + 10.9% 60.0%
Pacific Source Central Oregon Region 144023 / 155919 92.4% 146684 / 153981 95.3% + 35.3% + 35.3% 60.0% Purpose
Pacific Source Columbia Gorge Region 36066 / 38499 93.7% 37743 / 37914 99.5% + 39.5% + 39.5% 60.0%
Primary Health of Josephine County 34020 / 34041 99.9% 32832 / 32856 99.9% + 39.9% + 39.9% 60.0%
Trillium 223809 / 271692 82.4% 248502 / 270651 91.8% + 31.8% + 31.8% 60.0%
Umpqua Health Alliance 72461 / 78609 92.2% 66745 / 79014 84.5% + 24.5% + 24.5% 60.0%
Western Oregon Advanced Health 53040 / 60144 88.2% 51693 / 58701 88.1% + 28.1% + 28.1% 60.0%
Willamette Valley Community Health 276516 / 294336 93.9% 276925 / 289401 95.7% + 35.7% + 35.7% 60.0%
Yamhill Community Care 50332 / 67398 74.7% 52775 / 68571 77.0% + 17.0% + 17.0% 60.0%
STATE WIDE ####### 2719752 87.5% ####### 2680161 88.8% --- + 28.8% ---
NOTES
Claims Submitted Through: August 5, 2016 Last Updated: September 01, 2016
Current Rolling Analysis and Membership Time Period: May 2015 - Apr 2016; Total Memberships: 1,240,565 | Physical, Mental, and Dental: 1,179,010 | Physical and Mental Health: 2,969 | Mental and Dental Health: 54,827 | Mental Health Only: 3,759
Red/Green is only for Incentive measures with N/D data. Green: "Meets or Exceeds" the 2016 Improvement Target or Benchmark Red: "Does Not Meet" the 2016 Improvement Target or Benchmark * Incentive Measure
¹ Lower rates are better
² Colorectal Cancer Screening and Prenatal Care are based on CCO chart review on an annual basis, therefore the rolling rates are not available.³ Denominator based on March 2016 enrollment; Numerator based on tier counts. Tier Counts - Tier One: 1,913; Tier Two: 21,547; Tier Three: 778,439.
⁴ There are no filter-specific targets for the CCOs once filters are applied; the targets remain CCO level. Targets only displayed for incentive measures when filtered by one CCO. If there is no target for an incentive measure, benchmark is displayed.
⁵ EHR adoption rates may be greater than 100% due to the adjustment factor methodology. Rates greater than 100% will be capped at 100% for any public reporting on this measure.
Measure Specifications: http://www.oregon.gov/oha/Pages/CCO-Baseline-Data.aspx
Current Rolling N/D
2015
Final
Rate
2015 Final
N/D
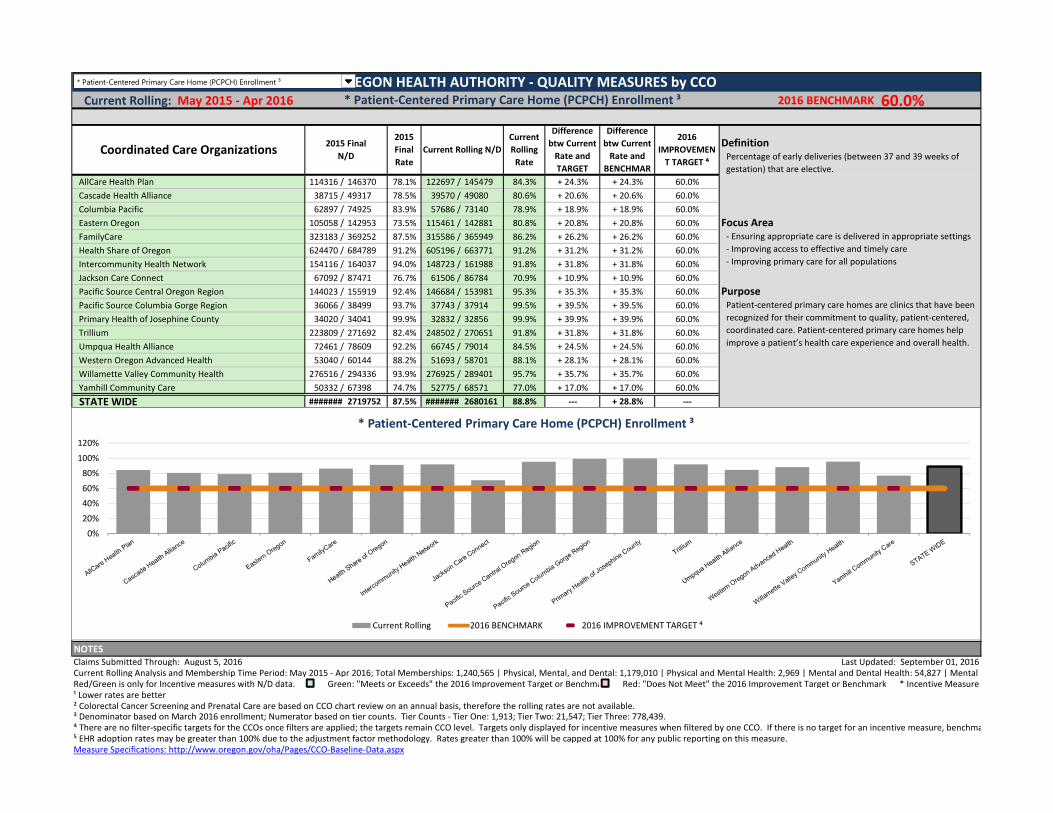
Patient-centered primary care homes are clinics that have been
recognized for their commitment to quality, patient-centered,
coordinated care. Patient-centered primary care homes help
improve a patient’s health care experience and overall health.
- Ensuring appropriate care is delivered in appropriate settings
- Improving access to effective and timely care
- Improving primary care for all populations
Percentage of early deliveries (between 37 and 39 weeks of
gestation) that are elective.
OREGON HEALTH AUTHORITY - QUALITY MEASURES by CCO* Patient-Centered Primary Care Home (PCPCH) Enrollment ³
Coordinated Care Organizations2016
IMPROVEMEN
T TARGET ⁴
Difference
btw Current
Rate and
BENCHMAR
Difference
btw Current
Rate and
TARGET
Current
Rolling
Rate
0%
20%
40%
60%
80%
100%
120%
* Patient-Centered Primary Care Home (PCPCH) Enrollment ³
Current Rolling 2016 BENCHMARK 2016 IMPROVEMENT TARGET ⁴
* Patient-Centered Primary Care Home (PCPCH) Enrollment ³
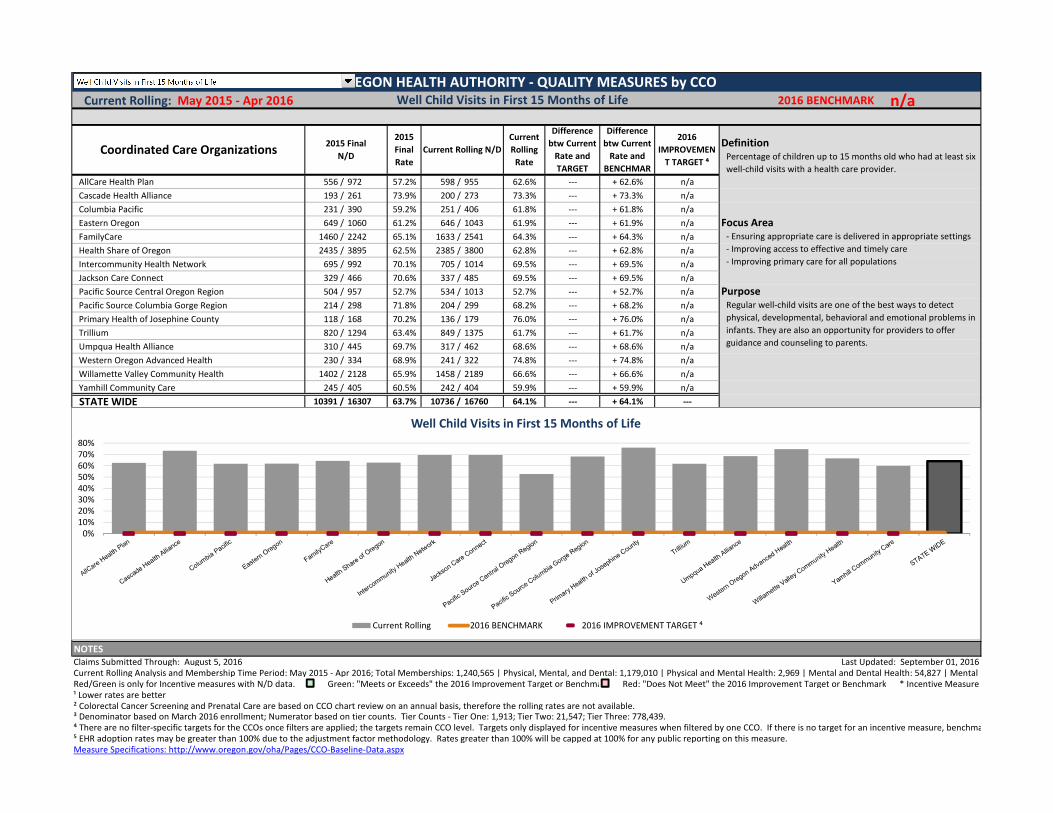
Current Rolling: May 2015 - Apr 2016 2016 BENCHMARK n/a
Definition
AllCare Health Plan 556 / 972 57.2% 598 / 955 62.6% --- + 62.6% n/a
Cascade Health Alliance 193 / 261 73.9% 200 / 273 73.3% --- + 73.3% n/a
Columbia Pacific 231 / 390 59.2% 251 / 406 61.8% --- + 61.8% n/a
Eastern Oregon 649 / 1060 61.2% 646 / 1043 61.9% --- + 61.9% n/a Focus Area
FamilyCare 1460 / 2242 65.1% 1633 / 2541 64.3% --- + 64.3% n/a
Health Share of Oregon 2435 / 3895 62.5% 2385 / 3800 62.8% --- + 62.8% n/a
Intercommunity Health Network 695 / 992 70.1% 705 / 1014 69.5% --- + 69.5% n/a
Jackson Care Connect 329 / 466 70.6% 337 / 485 69.5% --- + 69.5% n/a
Pacific Source Central Oregon Region 504 / 957 52.7% 534 / 1013 52.7% --- + 52.7% n/a Purpose
Pacific Source Columbia Gorge Region 214 / 298 71.8% 204 / 299 68.2% --- + 68.2% n/a
Primary Health of Josephine County 118 / 168 70.2% 136 / 179 76.0% --- + 76.0% n/a
Trillium 820 / 1294 63.4% 849 / 1375 61.7% --- + 61.7% n/a
Umpqua Health Alliance 310 / 445 69.7% 317 / 462 68.6% --- + 68.6% n/a
Western Oregon Advanced Health 230 / 334 68.9% 241 / 322 74.8% --- + 74.8% n/a
Willamette Valley Community Health 1402 / 2128 65.9% 1458 / 2189 66.6% --- + 66.6% n/a
Yamhill Community Care 245 / 405 60.5% 242 / 404 59.9% --- + 59.9% n/a
STATE WIDE 10391 / 16307 63.7% 10736 / 16760 64.1% --- + 64.1% ---
NOTES
Claims Submitted Through: August 5, 2016 Last Updated: September 01, 2016
Current Rolling Analysis and Membership Time Period: May 2015 - Apr 2016; Total Memberships: 1,240,565 | Physical, Mental, and Dental: 1,179,010 | Physical and Mental Health: 2,969 | Mental and Dental Health: 54,827 | Mental Health Only: 3,759
Red/Green is only for Incentive measures with N/D data. Green: "Meets or Exceeds" the 2016 Improvement Target or Benchmark Red: "Does Not Meet" the 2016 Improvement Target or Benchmark * Incentive Measure
¹ Lower rates are better
² Colorectal Cancer Screening and Prenatal Care are based on CCO chart review on an annual basis, therefore the rolling rates are not available.³ Denominator based on March 2016 enrollment; Numerator based on tier counts. Tier Counts - Tier One: 1,913; Tier Two: 21,547; Tier Three: 778,439.
⁴ There are no filter-specific targets for the CCOs once filters are applied; the targets remain CCO level. Targets only displayed for incentive measures when filtered by one CCO. If there is no target for an incentive measure, benchmark is displayed.
⁵ EHR adoption rates may be greater than 100% due to the adjustment factor methodology. Rates greater than 100% will be capped at 100% for any public reporting on this measure.
Measure Specifications: http://www.oregon.gov/oha/Pages/CCO-Baseline-Data.aspx
Current Rolling N/D
2015
Final
Rate
2015 Final
N/D
Regular well-child visits are one of the best ways to detect
physical, developmental, behavioral and emotional problems in
infants. They are also an opportunity for providers to offer
guidance and counseling to parents.
- Ensuring appropriate care is delivered in appropriate settings
- Improving access to effective and timely care
- Improving primary care for all populations
Percentage of children up to 15 months old who had at least six
well-child visits with a health care provider.
OREGON HEALTH AUTHORITY - QUALITY MEASURES by CCOWell Child Visits in First 15 Months of Life
Coordinated Care Organizations2016
IMPROVEMEN
T TARGET ⁴
Difference
btw Current
Rate and
BENCHMAR
Difference
btw Current
Rate and
TARGET
Current
Rolling
Rate
0%
10%
20%
30%
40%
50%
60%
70%
80%
Well Child Visits in First 15 Months of Life
Current Rolling 2016 BENCHMARK 2016 IMPROVEMENT TARGET ⁴