Performance Plan Summary - Home | U.S. Department … improvement rests on ongoing cycles of...
66
FY 2014 Annual Performance Report and FY 2016 Annual Performance Plan—U.S. Department of Education 19 Performance Plan Summary Looking Ahead and Addressing Challenges Quality education continues to be a vital component to the nation’s long-term economic prosperity and recent economic gains. It is an investment that is valued highly by Americans, for both present needs and its future promise. The Department continues to support state and district formula grant programs while supporting the creation of exemplary education models through competitive programs, including Race to the Top, Promise Neighborhoods, Investing in Innovation, Race to the Top – Early Learning Challenge, Preschool Development Grants, and a redesigned School Improvement Grants program. Those commitments are bolstered by increasing the extent to which evidence is used in programs and strategic decision-making. Going forward, the Department will build on what it has already established: state-driven accountability that demands progress for all children; high-quality early learning for more children from low- and moderate-income families; more flexibility for state decision-making; more support for principals and teachers to apply high standards to practice; reforming career education in high schools and community colleges; and reforming and simplifying the application process for student aid to help drive college affordability and completion. Additionally, the Department will continue to strengthen the support systems necessary for all students to succeed. This includes promoting high-quality preschool access for all students, K-12 strategic reforms, and college affordability. Ultimately, the Department looks to create ladders of opportunity to help all students. Data Verification and Validation The GPRA Modernization Act of 2010 requires agencies to prepare information on the reliability of data presented. OMB guidance indicates: Agencies may develop a single data verification and validation appendix used to communicate the agency’s approaches, and/or may also choose to provide information about data quality wherever the performance information is communicated (e.g., websites). Agencies should discuss their verification and validation techniques with their respective OMB Resource Management Office, if necessary. The transmittal letter included in Annual Performance Reports must contain an assessment by the agency head of the completeness and reliability of the performance data presented and a description of agency plans to improve completeness, reliability, and quality, where needed. 6 The full data verification and validation summary and a high-level assessment of the completeness and reliability of the data presented are provided in appendix A of this report. 6 OMB Circular A-11, Preparation, Submission, and Execution of the Budget, Part 6, Section 260.9, 2014.
Transcript of Performance Plan Summary - Home | U.S. Department … improvement rests on ongoing cycles of...
FY 2014 Annual Performance Report and FY 2016 Annual Performance Plan—U.S. Department of Education 19
Performance Plan Summary
Looking Ahead and Addressing Challenges
Quality education continues to be a vital component to the nation’s long-term economic prosperity and recent economic gains. It is an investment that is valued highly by Americans, for both present needs and its future promise. The Department continues to support state and district formula grant programs while supporting the creation of exemplary education models through competitive programs, including Race to the Top, Promise Neighborhoods, Investing in Innovation, Race to the Top – Early Learning Challenge, Preschool Development Grants, and a redesigned School Improvement Grants program. Those commitments are bolstered by increasing the extent to which evidence is used in programs and strategic decision-making.
Going forward, the Department will build on what it has already established:
state-driven accountability that demands progress for all children;
high-quality early learning for more children from low- and moderate-income families;
more flexibility for state decision-making;
more support for principals and teachers to apply high standards to practice;
reforming career education in high schools and community colleges; and
reforming and simplifying the application process for student aid to help drive college affordability and completion.
Additionally, the Department will continue to strengthen the support systems necessary for all students to succeed. This includes promoting high-quality preschool access for all students, K-12 strategic reforms, and college affordability. Ultimately, the Department looks to create ladders of opportunity to help all students.
Data Verification and Validation
The GPRA Modernization Act of 2010 requires agencies to prepare information on the reliability of data presented. OMB guidance indicates:
Agencies may develop a single data verification and validation appendix used to communicate the agency’s approaches, and/or may also choose to provide information about data quality wherever the performance information is communicated (e.g., websites). Agencies should discuss their verification and validation techniques with their respective OMB Resource Management Office, if necessary. The transmittal letter included in Annual Performance Reports must contain an assessment by the agency head of the completeness and reliability of the performance data presented and a description of agency plans to improve completeness, reliability, and quality, where needed.6
The full data verification and validation summary and a high-level assessment of the completeness and reliability of the data presented are provided in appendix A of this report.
6 OMB Circular A-11, Preparation, Submission, and Execution of the Budget, Part 6, Section 260.9, 2014.

PERFORMANCE PLAN SUMMARY
FY 2014 Annual Performance Report and FY 2016 Annual Performance Plan—U.S. Department of Education 20
Reporting on Progress
The Department continues to use tools and processes, such as quarterly performance reviews, to assess progress toward achieving strategic goals and outcomes. Additionally, the Organizational Performance Review (OPR) contributes to the Department’s compliance with the GPRA Modernization Act of 2010 by conducting data-driven performance discussions, and serving as a tool for principal offices to improve their efficiency and effectiveness, by focusing on infrastructure and capacity-building, through operational priorities and initiatives at the principal office level.
To support the tracking and reporting of progress against the goals and objectives, the Department provides regular updates to its data profile on performance.gov. The effective implementation of the Department’s Strategic Plan will depend, in part, on the effective use of high-quality and timely data, including evaluations and performance metrics, throughout the lifecycle of policies and programs.
In addition, the Department’s success in achieving its strategic goals is closely tied to its capacity and funding. In addressing capacity, the Department will invest in the continuous improvement of its workforce and employ comprehensive risk management to ensure prudent use of public dollars by mitigating risk through increased oversight and support of grantees and contractors.
Continuous improvement rests on ongoing cycles of assessing performance, examining data, and employing lessons to improve practices. Creating a culture of continuous improvement is at the heart of the Department’s efforts to partner with and support educators, administrators, and policy makers.
Legislative challenges and fiscal constraints may impact the Department’s ability to provide the necessary incentives and resources to increase quality, transparency, and accountability. Accomplishing all of the goals of the Strategic Plan will require strong coordination and collaboration from Department staff working with Congress, partners at the state and local levels, and other stakeholders.
PERFORMANCE PLAN SUMMARY
FY 2014 Annual Performance Report and FY 2016 Annual Performance Plan—U.S. Department of Education 21
Goal 1. Postsecondary Education, Career and Technical Education,
and Adult Education:
Increase college access, affordability, quality, and completion by
improving postsecondary education and lifelong learning opportunities for youths and adults.
Goal Leader: Ted Mitchell
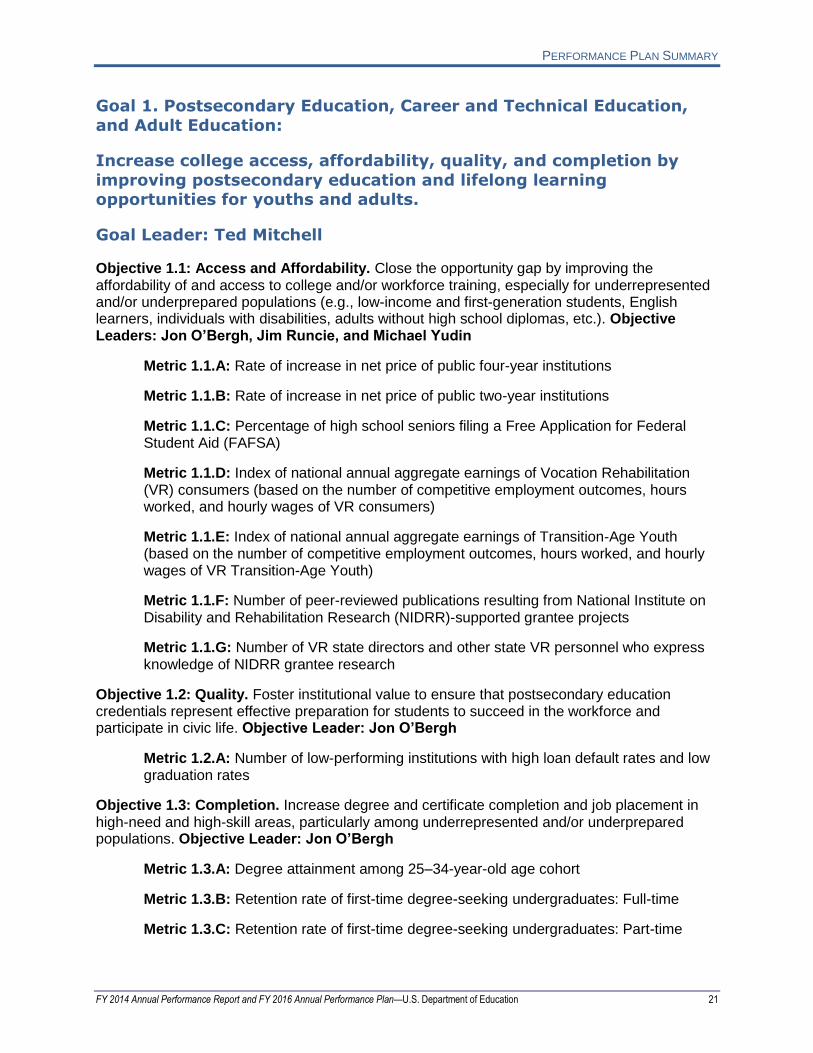
Objective 1.1: Access and Affordability. Close the opportunity gap by improving the affordability of and access to college and/or workforce training, especially for underrepresented and/or underprepared populations (e.g., low-income and first-generation students, English learners, individuals with disabilities, adults without high school diplomas, etc.). Objective Leaders: Jon O’Bergh, Jim Runcie, and Michael Yudin
Metric 1.1.A: Rate of increase in net price of public four-year institutions
Metric 1.1.B: Rate of increase in net price of public two-year institutions
Metric 1.1.C: Percentage of high school seniors filing a Free Application for Federal Student Aid (FAFSA)
Metric 1.1.D: Index of national annual aggregate earnings of Vocation Rehabilitation (VR) consumers (based on the number of competitive employment outcomes, hours worked, and hourly wages of VR consumers)
Metric 1.1.E: Index of national annual aggregate earnings of Transition-Age Youth (based on the number of competitive employment outcomes, hours worked, and hourly wages of VR Transition-Age Youth)
Metric 1.1.F: Number of peer-reviewed publications resulting from National Institute on Disability and Rehabilitation Research (NIDRR)-supported grantee projects
Metric 1.1.G: Number of VR state directors and other state VR personnel who express knowledge of NIDRR grantee research
Objective 1.2: Quality. Foster institutional value to ensure that postsecondary education credentials represent effective preparation for students to succeed in the workforce and participate in civic life. Objective Leader: Jon O’Bergh
Metric 1.2.A: Number of low-performing institutions with high loan default rates and low graduation rates
Objective 1.3: Completion. Increase degree and certificate completion and job placement in high-need and high-skill areas, particularly among underrepresented and/or underprepared populations. Objective Leader: Jon O’Bergh
Metric 1.3.A: Degree attainment among 25–34-year-old age cohort
Metric 1.3.B: Retention rate of first-time degree-seeking undergraduates: Full-time
Metric 1.3.C: Retention rate of first-time degree-seeking undergraduates: Part-time
PERFORMANCE PLAN SUMMARY
FY 2014 Annual Performance Report and FY 2016 Annual Performance Plan—U.S. Department of Education 22
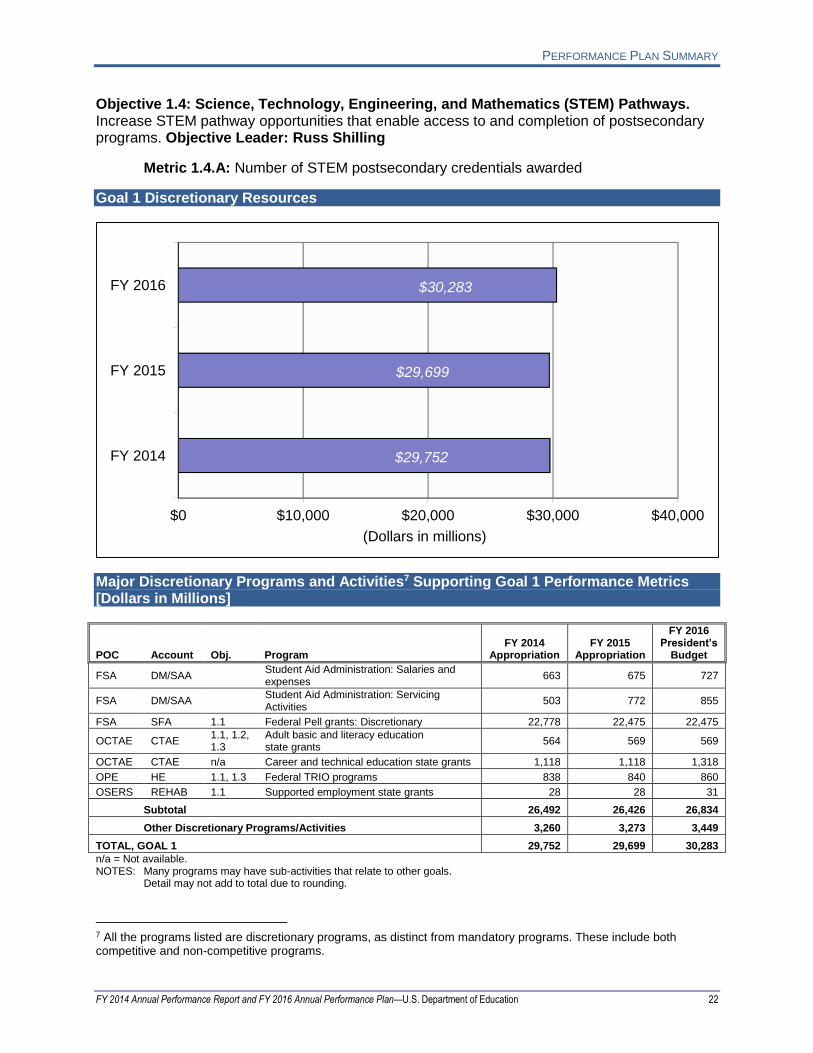
Objective 1.4: Science, Technology, Engineering, and Mathematics (STEM) Pathways. Increase STEM pathway opportunities that enable access to and completion of postsecondary programs. Objective Leader: Russ Shilling
Metric 1.4.A: Number of STEM postsecondary credentials awarded
Goal 1 Discretionary Resources
$0 $10,000 $20,000 $30,000 $40,000
FY 2014
FY 2015
FY 2016
$29,752
$29,699
$30,283
(Dollars in millions)
Major Discretionary Programs and Activities7 Supporting Goal 1 Performance Metrics [Dollars in Millions]
POC Account Obj. Program FY 2014
Appropriation FY 2015
Appropriation
FY 2016 President’s
Budget
FSA DM/SAA Student Aid Administration: Salaries and expenses
663 675 727
FSA DM/SAA Student Aid Administration: Servicing Activities
503 772 855
FSA SFA 1.1 Federal Pell grants: Discretionary 22,778 22,475 22,475
OCTAE CTAE 1.1, 1.2, 1.3
Adult basic and literacy education state grants
564 569 569
OCTAE CTAE n/a Career and technical education state grants 1,118 1,118 1,318
OPE HE 1.1, 1.3 Federal TRIO programs 838 840 860
OSERS REHAB 1.1 Supported employment state grants 28 28 31
Subtotal 26,492 26,426 26,834
Other Discretionary Programs/Activities 3,260 3,273 3,449
TOTAL, GOAL 1 29,752 29,699 30,283
n/a = Not available. NOTES: Many programs may have sub-activities that relate to other goals.
Detail may not add to total due to rounding.
7 All the programs listed are discretionary programs, as distinct from mandatory programs. These include both competitive and non-competitive programs.
PERFORMANCE PLAN SUMMARY
FY 2014 Annual Performance Report and FY 2016 Annual Performance Plan—U.S. Department of Education 23
Public Benefit
Increasing college access, affordability, quality, and completion by improving postsecondary education and lifelong learning opportunities for youths and adults are matters that require equal parts information, motivation, and opportunity to be successful.
Prior to entering postsecondary education, prospective students need easily accessible information on the cost of attendance and financial aid; rates for career placement, graduation, and college loan default; labor market outcomes and demand projections; loan repayment and management options; and other subjects crucial to understanding the affordability and value of the postsecondary institutions and programs of study they are considering. Students deserve to know that, whether they enter a college, university, career training program, or adult education program, the credential they earn will be affordable and its value will be recognized as an indication that they possess the necessary knowledge and skills for success in the workplace and in life.
Providing federal student aid in a simple, reliable, and efficient manner is the main way the Department supports college access, affordability, quality, and completion. In FY 2014, the Department delivered nearly $134 billion in grants, work-study, and loan assistance to approximately 13 million postsecondary students and their families.8 These students attended more than 6,100 institutions of postsecondary education. In addition, the Department administers $2 billion annually in grants to strengthen postsecondary institutions and promote college readiness, and nearly $2 billion more in grant funds for Career and Technical Education (CTE), adult education (including literacy and civics education), and correctional education to help adults secure the skills that equip them for work, civic participation, and lifelong learning.
The Department has already taken significant steps to increase college access, affordability, quality, and completion. Through the SAFRA, passed as part of the Health Care and Education Reconciliation Act of 2010 (HCERA), Congress ended student loan subsidies to banks, saving billions of dollars, which shifted more than $60 billion in savings back to students. Resources developed by the Department, such as the College Affordability and Transparency Center, the Financial Aid Shopping Sheet, the College Scorecard, a consolidated student aid website (https://studentaid.ed.gov), and new loan counseling and financial literacy resources, now provide students and families with tools for informed decision-making. In addition, the Department has simplified the FAFSA so it is easier and faster for students to apply for aid and has created—in partnership with the Internal Revenue Service (IRS)—the IRS Data Retrieval tool, which enables millions of students and families to access the IRS tax return information needed to complete the FAFSA and transfer the data directly into their FAFSA from the IRS website. The Department will build on these efforts to ensure that all Americans, regardless of background, will have the opportunity to access and complete an affordable postsecondary degree or other postsecondary credential.
8 Federal Student Aid Annual Report FY 2014

PERFORMANCE PLAN SUMMARY
FY 2014 Annual Performance Report and FY 2016 Annual Performance Plan—U.S. Department of Education 24
Goal 1: Details
Postsecondary Education, Career
and Technical Education, and Adult Education Indicators
of Success
Baseline
Actuals Targets
2012 2013 2014 2014 2015 2016
Objective 1.1: Access and Affordability. Close the opportunity gap by improving the affordability of and access to college and/or workforce training, especially for underrepresented and/or underprepared populations (e.g., low-income and first-generation students,
English learners, individuals with disabilities, adults without high school diplomas, etc.).
1.1.A. Rate of increase in net price of public four-year institutions
Year: 2010–11
1.7%
Year: 2009–10
-1.2%
Year: 2010–11
1.7%
Year: 2011–12
3.1%
1.5% NOT MET
1.3% 1.1%
1.1.B. Rate of increase in net price of public two-year institutions
Year: 2010–11
1.7%
Year: 2009–10
-3.1%
Year: 2010–11
1.7%
Year: 2011–12
3.2%
1.5% NOT MET
1.3% 1.1%
1.1.C. Percentage of high school seniors filing a FAFSA1
Year: 2013 59.2%
58.4% 59.2% Year: 2014
60.1%
58.8%–60.8% MET
59.1%–61.1%
Within 1 percentage point (+/-) of the previous
year’s calculation
1.1.D. Index of national aggregate annual earnings of VR consumers (based on the number of competitive employment outcomes, hours worked, and hourly wages of VR consumers)2
Year: 2010 $57,971,317
$61,537,760 $61,824,728
TBD Data from
states due Nov
30
$62,750,000 TBD
$64,322,447 $65,608,896
1.1.E. Index of national aggregate annual earnings of Transition-Age Youth (based on the number of competitive employment outcomes, hours worked, and hourly wages of VR Transition-Age Youth)3
Year: 2010 $15,971,665
$17,731,129 $18,353,441
TBD Data from
states due Nov
30
$18,700,000 TBD
$19,094,920 $19,476,818
1.1.F. Number of peer-reviewed publications resulting from NIDRR-supported grantee projects4
Year: 2012 484
484 472 472 489
NOT MET 0 0
1.1.G. Number of VR state directors and other state VR personnel who express knowledge of NIDRR grantee research5
Year: 2014 TBD
Not Collected
Not Collected
Not Collected
Baseline year (0
increase) NA
35% 47%
Objective 1.2: Quality. Foster institutional value to ensure that postsecondary education credentials represent effective preparation for students to succeed in the workforce and participate in civic life.
1.2.A. Number of low-performing institutions with high loan default rates and low graduation rates6
Year: 2010–
11
205
Not Collected
Year: 2010–11
205
Year: 2011–12
91
178 MET
155 135
Objective 1.3: Completion. Increase degree and certificate completion and job placement in high-need and high-skill areas, particularly among underrepresented and/or underprepared populations.
1.3.A. Degree attainment among 25–34-year-old age cohort7
Year: 2012
44.0%
Year: 2011 43.1%
Year: 2012 44.0%
Year: 2013
44.8%
44.7% MET
45.6% 46.8%

PERFORMANCE PLAN SUMMARY
FY 2014 Annual Performance Report and FY 2016 Annual Performance Plan—U.S. Department of Education 25
Postsecondary Education, Career
and Technical Education, and Adult Education Indicators
of Success
Baseline
Actuals Targets
2012 2013 2014 2014 2015 2016
1.3.B. Retention rate of first-time degree-seeking undergraduates: Full-time8
Year: 2011 71.9%
Year: 2010 72.1%
Year: 2011 71.9%
Year: 2012
71.8%
71.9% NOT MET
72.1% 72.1%
1.3.C. Retention rate of first-time degree-seeking undergraduates: Part-time9
Year: 2011 41.7%
Year: 2010 42.1%
Year: 2011 41.7%
Year: 2012
42.2%
41.9% MET
42.6% 42.9%
Objective 1.4: Science, Technology, Engineering, and Mathematics (STEM) Pathways. Increase STEM pathway opportunities that enable access to and completion of postsecondary programs.
1.4.A. Number of STEM postsecondary credentials awarded10
Year: 2010–
11
531,018
Year: 2009–10 500,783
Year: 2010–11 531,018
Year: 2011–12 556,696
560,000 NOT MET
595,000 638,000
NA = Not applicable.
TBD = To be determined.
NOTE: Unless otherwise noted, data correspond to the heading year in the Actuals column. 1 The baseline and actuals have been revised due to an update in the National Center for Education Statistics’ projection for the number of high school seniors, which is used in the calculation of this metric. 2 The baseline, actuals, and targets have been revised due to a recalculation that is more accurately calculated by: outcomes times hours/week times hourly wage. Targets are set at an increase of 2% annually. 3 The baseline, actuals, and targets have been revised due to a recalculation that is more accurately calculated by: outcomes times hours/week times hourly wage. Targets are set at an increase of 2% annually. 4 The Department is removing this metric because NIDRR and all of its functions are moving to the Administration for Community Living in the Department of Health and Human Services. 5 The Department planned to collect baseline data in FY 2014, to be reported in FY 2015, but is considering removing this metric because the data may not be available. 6 Low-performing institutions are defined as Title IV participating institutions—public, private nonprofit, and private for-profit—having a 3-year Cohort Default Rate (CDR) of 30% or greater and a 150% of normal time completion rate (graduation rate plus transfer out rate) that is less than the average rate for its type (four-year, two-year, and less-than-two-year). The Department was unable to precisely recalculate the baseline. One small but contributing factor is that institutions of higher education (IHEs) are able to appeal their published cohort default rates and, if the appeal is successful, the new rate will be reflected in subsequent reports. The Department will revisit the possibility of revising the baseline and targets when there is an additional year’s worth of data and a clearer understanding of how the data are trending. 7 This metric is aligned with an Agency Priority Goal. Note that there is a year lag in the data (i.e., the baseline data are from 2012 but are reported in 2013). 8 The baseline and targets for this performance metric were recalculated from what was reported in the FY 2013 Annual Performance Report and FY 2015 Annual Performance Plan because the original numbers could not be reproduced using a uniform methodology. The targets for 2015 and 2016 appear to be identical because of rounding and the fact that the 2016 target is calculated based on a reference year when the retention rate decreased. 9 The baseline and targets for this performance metric were recalculated from what was reported in the FY 2013 Annual Performance Report and FY 2015 Annual Performance Plan because the original numbers could not be reproduced using a uniform methodology. 10 The baseline has been recalculated from what was reported in the FY 2013 Annual Performance Report and FY 2015 Annual Performance Plan because of revised IPEDS data. Additionally, last year’s data included Military technologies and applied sciences, which is no longer included in the calculation.
Data Sources and Frequency of Collection:
1.1.A. Integrated Postsecondary Education Data System (IPEDS); annually
1.1.B. IPEDS; annually
1.1.C. The denominator is the number of graduating seniors according to the most recent projection by the National Center for Education Statistics (NCES). The numerator is from FSA’s Central Processing System and is based on the number of applications during the first nine months of the application cycle that are—as of September 30 of the first year of the application cycle—complete (not rejected); first-time filers; incoming freshmen, with or without previous college attendance; age 18 or less as of June 30 of the

PERFORMANCE PLAN SUMMARY
FY 2014 Annual Performance Report and FY 2016 Annual Performance Plan—U.S. Department of Education 26
first year of the application cycle; reporting high school diploma attainment; and attended a high school in the fifty states and Washington, DC; annually
1.1.D. Rehabilitation Services Administration-911 (RSA-911); annually
1.1.E. RSA-911; annually
1.1.F. NIDRR Annual Performance Report (APR) Accomplishments Database; annually
1.1.G. New VR state director survey; biennially
1.2.A. FSA Cohort Default Rate (CDR) Report, September 2014, and IPEDS Data Center; annually
1.3.A. NCES Digest of Education Statistics, Table 104.30 (http://nces.ed.gov/programs/digest/d13/tables/dt13_104.30.asp), Number of persons age 18 and over, by highest level of educational attainment, sex, race/ethnicity, and age: 2013. Tabulated from Current Population Survey data, U.S. Census; annually
1.3.B. IPEDS Data Center; annually
1.3.C. IPEDS Data Center; annually
1.4.A. IPEDS Data Center; annually
Note on performance metrics and targets: These metrics were established as a part of the FY 2014–18 Strategic
Plan. Metrics may be updated or revised to reflect awareness of more accurate data or clarifications. Such updates or revisions are identified in footnotes.
Analysis and Next Steps by Objective
Objective 1.1: Access and Affordability
Explanation and Analysis of Progress:
The Department supported or initiated a number of efforts and made progress toward this objective, despite limited ability to impact college costs or control price. The maximum Pell Grant award was increased from $5,645 for 2013–14 to $5,730 for 2014–15. In collaboration with Treasury, the Department produced a fact sheet in June 2014 clarifying how Pell Grant recipients may claim the American Opportunity Tax Credit. The number of institutions of higher education agreeing to utilize the Financial Aid Shopping Sheet grew from around 600 in 2012–13 to more than 2,000 in 2013–14 following the release of a “Dear Colleague” letter in November 2013. The Department is also developing a college rating system as a step toward greater transparency and accountability. In addition, the Department continues to seek ways to simplify the FAFSA so it is easier and faster for students and families to apply for financial aid.
Recognizing that FAFSA completion significantly increases chances that students will actually enroll in college, in FY 2014 the Department issued guidance clarifying that state entities may share FAFSA completion data with local education authorities, TRIO and GEAR-UP grantees, tribal education authorities, and Indian organizations so those entities can maximize the number of their students that complete the FAFSA.
The Department has already taken a number of actions to help struggling federal student loan borrowers manage their debt. In order to mitigate delinquency and default risk, FSA conducted an email campaign during which more than 3 million borrowers were contacted (borrowers whose grace periods were ending, who had fallen behind on their student loan payments, who had higher-than-average debts, and who were in deferment or forbearance because of financial hardship or unemployment). Utilization of income-driven repayment plans has increased 40 percent since the Department and Treasury expanded awareness campaigns and outreach efforts. Additionally, the Department renegotiated performance-based contracts with its loan servicing contractors to ensure high-quality service and incentivize repayment of loans, and the Under Secretary is overseeing a process to collect feedback from student borrowers and loan servicers in order to strengthen such contracts when they are renegotiated in the future.

PERFORMANCE PLAN SUMMARY
FY 2014 Annual Performance Report and FY 2016 Annual Performance Plan—U.S. Department of Education 27
Another aspect of affordability is access to open educational resources (OER). According to figures compiled by the Association of Research Libraries Scholarly Publishing and Academic Resources Coalition, OER have saved postsecondary students in excess of $100 million during the last few years. The accelerating adoption of these resources puts college students on track to pocket $1 billion in savings in the coming years. The Department has championed the development and use of OER, particularly by citing OER development as an example of improving productivity in one of the Secretary’s Supplemental Priorities for discretionary grant programs, as a possible activity under a competitive priority in the TRIO Training grant competition, and in the Trade Adjustment Assistance Community College and Career Training (TAACCCT) grant competition conducted by the Department of Labor with the Department of Education’s assistance. The Departments of Education and Labor are jointly working to develop an Online Skills Academy in FY 2015 to leverage the OER products that have been developed through the TAACCCT grants.
Although results for metrics 1.1.A, 1.1.B, 1.1.C, 1.1.D, and 1.1.E are influenced by actions taken by the Department, they are most influenced by factors that are beyond the control of the Department. For example, results for metrics 1.1.A and 1.1.B are most influenced by actions taken by postsecondary institutions, state and local agencies regarding funding decisions, and market forces and job creation trends. Nonetheless, the Department initiated a number of activities to address these metric subject areas, as explained below.
Regarding metrics 1.1.A and 1.1.B, the Department did not achieve its FY 2014 performance target to slow the increase in average net price at public institutions. States continue to fund higher education at the lowest levels per full-time equivalent student in 25 years, which places pressure on institutions to raise costs in order to maintain quality and levels of service. Without specific programs such as the proposed State Higher Education Performance Fund discussed in objective 1.3, the Department has little influence over state funding decisions and is limited in its ability to ensure progress against these metrics. Despite these challenges, the Department will continue to highlight institutions that are taking steps to ensure affordability for families and will support practices that reduce cost by reducing the time taken to earn a degree, such as competency-based education, dual enrollment, remedial education reforms, and improved articulation between institutions.
Regarding metric 1.1.C, the Department achieved its FY 2014 performance target to increase the number of high school students completing the FAFSA. Efforts such as the FAFSA completion project, increased outreach activities by FSA and other offices, and the Department’s participation since 2011 in the American Council on Education’s National College Application Week initiative, likely contributed to success with this target.
States are required to submit data for metrics 1.1.D and 1.1.E by November 30 for the previous fiscal year. As such, the Department will make the FY 2014 data available to the public in spring 2015. The Workforce Innovation and Opportunity Act (WIOA), signed by the President in July 2014, reforms the public workforce system by strengthening alignment and access to employment, training, education, and support services needed to succeed in the labor market. In particular, the WIOA includes many changes that are designed to strengthen and improve employment for individuals with disabilities, many served by the State VR Services and Supported Employment programs. WIOA places significant emphasis on obtaining competitive integrated employment, especially in the amendments to the Rehabilitation Act of 1973. Program services are designed to maximize the ability of individuals with disabilities, including individuals with the most significant disabilities, to achieve competitive integrated employment through customized employment, supported employment, and other individualized services. The Department will continue to track national aggregate annual earnings of VR consumers and

PERFORMANCE PLAN SUMMARY
FY 2014 Annual Performance Report and FY 2016 Annual Performance Plan—U.S. Department of Education 28
transition-aged youth. Future annual earnings are expected to improve by the regulatory actions that the Department will undertake.
Data for metric 1.1.F indicates no change in the number of peer-reviewed publications resulting from NIDRR-supported grantee projects in FY 2014 from FY 2013. However, WIOA transfers NIDRR and all of its functions from the Department of Education to the Administration for Community Living in the Department of Health and Human Services. For that reason, the Department is removing metric 1.1.F as initially established in the FY 2014–18 Strategic Plan. Similarly, the Department is considering removing metric 1.1.G for which the collection of baseline data was initially planned for FY 2015 because the data may not be available.
Challenges and Next Steps:
The Department plans to take additional actions to help struggling federal student loan borrowers manage their debt. To expand the Pay As You Earn repayment program to all student borrowers with Direct Loans, as instructed in the President’s June 2014 Executive Order, the Department held two public hearings on October 23 and November 4, 2014, and will begin negotiated rulemaking in February 2015 with a goal of making the new plan available to borrowers by December 2015. Specifically, this new repayment option, which will include new features to target the plan to struggling borrowers, will be made available to students with older loans (those who borrowed before October 2007 or who have not borrowed since October 2011), who are currently ineligible for Pay As You Earn. This executive action is expected to help up to 5 million struggling borrowers.
Furthermore, the Department will develop, evaluate, and implement new targeted communication strategies to reach struggling borrowers. The Department also plans to renegotiate performance-based contracts with loan servicing companies in 2016 to ensure high-quality service and incentivize repayment of loans.
President Obama’s America’s College Promise proposal, announced in January 2015, would allow students to attend community colleges tuition-free if they attend half-time, are making satisfactory academic progress to a degree, and maintain a 2.5 GPA. If all states participate and provide quality programs, the plan could benefit nearly 9 million students by making a higher education more affordable.
Additionally, the President has proposed reducing the burden of student loan debt and expanding a middle-class tax cut for college. The Department continues to seek ways to simplify the FAFSA so it is easier and faster for students and families to apply for financial aid.
Finally, in response to the Presidential Memorandum to federal agencies directing them to take action to address job-driven training for the nation’s workers, the Department funded, at $9 million over the next three years, the Job-Driven Vocational Rehabilitation Technical Assistance (TA) Center at the University of Massachusetts-Boston, which will assist state vocational rehabilitation agencies in developing training and employment opportunities for individuals with disabilities that meet the needs of today’s employers and the demands of the local economy.
Objective 1.2: Quality
Explanation and Analysis of Progress:
The Department supported or initiated a number of efforts related to this objective in FY 2014. For example, the Department conducted a series of negotiated rulemaking sessions on several

PERFORMANCE PLAN SUMMARY
FY 2014 Annual Performance Report and FY 2016 Annual Performance Plan—U.S. Department of Education 29
program integrity issues such as Gainful Employment, Adverse Credit standards for PLUS loans, Cash Management and College Debit Cards, and State Authorization. The release of final rules on Gainful Employment is a particularly significant development for institutional quality.
The Department continues to encourage the higher education community to focus on innovative, transparent, and validated approaches to student learning. Through the Experimental Sites initiative, the Department published a notice in July 2014 soliciting proposals for experiments in the areas of competency-based learning, Federal Work Study, and prior learning assessments. The results of these experiments will guide future policy decisions. The Department also hosted an Education Datapalooza event in January 2014 to encourage innovations that increase quality while reducing costs. More than 650 participants attended, showcasing tools and services that were developed for the event and that highlighted innovative practices in the field.
Twenty-four grants were awarded under the new First in the World Program, which focuses on low-income students and promotes evidence-based strategies and practices for college access and completion. Funded projects include redesigning courses to incorporate more project-based learning and technology tools that improve student learning and engagement; redesigning large-lecture STEM courses to engage students through active learning interventions; and strengthening curriculum through an integrated set of tools to increase student engagement, especially for high-risk students. The Department will evaluate these projects at their conclusion, and those showing evidence of success will serve as models for possible dissemination or could be eligible for future validation and scale-up grants.
The Department surpassed its FY 2014 target for reducing the number of low-performing institutions—i.e., those with high cohort default rates and below average completion rates. With the publication of the annual cohort default rates in September 2014, sanctions became effective against institutions with high cohort default rates under a revised methodology that includes tracking borrowers for three years after graduation rather than two. (Sanctions apply to institutions based on the cohort default rate, not on completion rate data.) The Department accommodated institutions with reasonable flexibility during the multiyear phase-in of the new methodology for calculating the rate.
Challenges and Next Steps:
During FY 2014, the Department planned for several rulemaking actions that were subsequently accomplished during the first two months of FY 2015. These include updating regulations regarding Adverse Credit in the PLUS Loan Program (published October 22, 2014) and regulations on Gainful Employment (published October 29, 2014), and issuing a Notice of Proposed Rulemaking on Teacher Preparation (published November 25, 2014). The Department postponed implementation of State Authorization regulations to provide additional time to finalize processes for institutions to be able to comply with certain state provisions. The Department will likely propose a Notice of Proposed Rulemaking in FY 2015 for Cash Management.
The Department continues to seek input from the field regarding the development of a college rating system and planned the announcement of a proposed framework for public comment (subsequently published on December 19, 2014), with implementation slated for 2015. The Department is also developing specifications for the FY 2015 First in the World grant competition.

PERFORMANCE PLAN SUMMARY
FY 2014 Annual Performance Report and FY 2016 Annual Performance Plan—U.S. Department of Education 30
Objective 1.3: Completion
Explanation and Analysis of Progress:
In addition to the actions described below, the Department incorporated a competitive priority in the GEAR-UP State and Partnership grant competitions to encourage applicants to propose postsecondary success strategies, including those that support attention to remedial education needs prior to enrollment in college.
The Department developed a new project for FY 2015 that will involve more states in the development and implementation of career pathways, and a new project on employability skills by (1) upgrading the Department’s interactive employability skills model and (2) aligning the Department’s employability skill standards with “demand side standards” set by the National Association of Business and Industry Associations. The Department also published a Career Pathways Request for Information to inform the Department about models that are improving the college and career readiness of youths and adults.
The Department coordinated with the Department of Veterans Affairs to increase the number of institutions of higher education from 400 to over 1,000 that have committed to implementing the 8 Keys to Veterans Success, which provides specific strategies to support veterans and their successful program completion.
The Department achieved its FY 2014 target for metric 1.3.A with an attainment rate of 44.8 percent. However, the targets in future years are set to grow at increasingly accelerated rates in order to reach the President’s goal of 60 percent degree attainment. While increases in high school graduation rates (one of the factors that feed into the attainment rate) are growing, recent data from the Bureau of Labor Statistics show that fewer high school graduates are opting for college—65.9 percent in 2013 compared to a high point of 70.1 percent in 2009.9 These data may be attributable to the natural cycle of higher enrollment rates during economic downturns followed by lower rates as the economy improves, but the declining enrollment rate may impact the ability to achieve the targeted growth in the attainment rate. Equity gaps in the attainment rate based on race, ethnicity, and disability status have not improved.
With regard to metrics 1.3.B and 1.3.C, the Department did not achieve the retention target for full-time students, but did achieve the retention target for part-time students. These rates tend to fluctuate slightly each year, with the overall trend showing incremental growth over the past five years, so the Department does not consider whether or not this year’s targets were met to be indicative of overall performance. Although the Department funds a number of grant programs that support activities which influence retention, the number of students directly served by these programs is not large enough to significantly affect retention across the board. Nonetheless, the Department is hopeful that efforts through programs such as First in the World, Minority-Serving Institution grants under Titles III and V, and TRIO Student Support Services, along with initiatives to improve remedial education in community colleges, will have an impact in future years.
Challenges and Next Steps:
The White House and the Department jointly held a second College Opportunity Summit on December 4, 2014, which focused on completion and affordability, as well as partnerships
9 Bureau of Labor Statistics, College Enrollment and Work Activity of High School Graduates News Release, April 22,
2014: http://www.bls.gov/news.release/hsgec.htm.
PERFORMANCE PLAN SUMMARY
FY 2014 Annual Performance Report and FY 2016 Annual Performance Plan—U.S. Department of Education 31
between K-12 and higher education, to promote educational quality and seamless transitions from high school to college. The Department is also planning to convene minority-serving community colleges in FY 2015 in an effort to scale up successful practices in remedial education that lead to completion.
The WIOA aligns federal investments to support job seekers and employers and promotes transitions from adult education to postsecondary education and training through career pathways. The act includes many changes that are designed to strengthen and improve employment for individuals with disabilities. In early 2015, the Department will collaborate with the Departments of Labor and Health and Human Services to publish a Notice of Proposed Rulemaking to implement WIOA, with the intent to publish final rules in early 2016.
The administration proposed a State Higher Education Performance Fund that would incentivize states to base institutional funding on performance and reward states that have a strong record of investment in, and show a commitment to, increasing funding support for higher education. The Department included this new grant program in the FY 2015 budget.
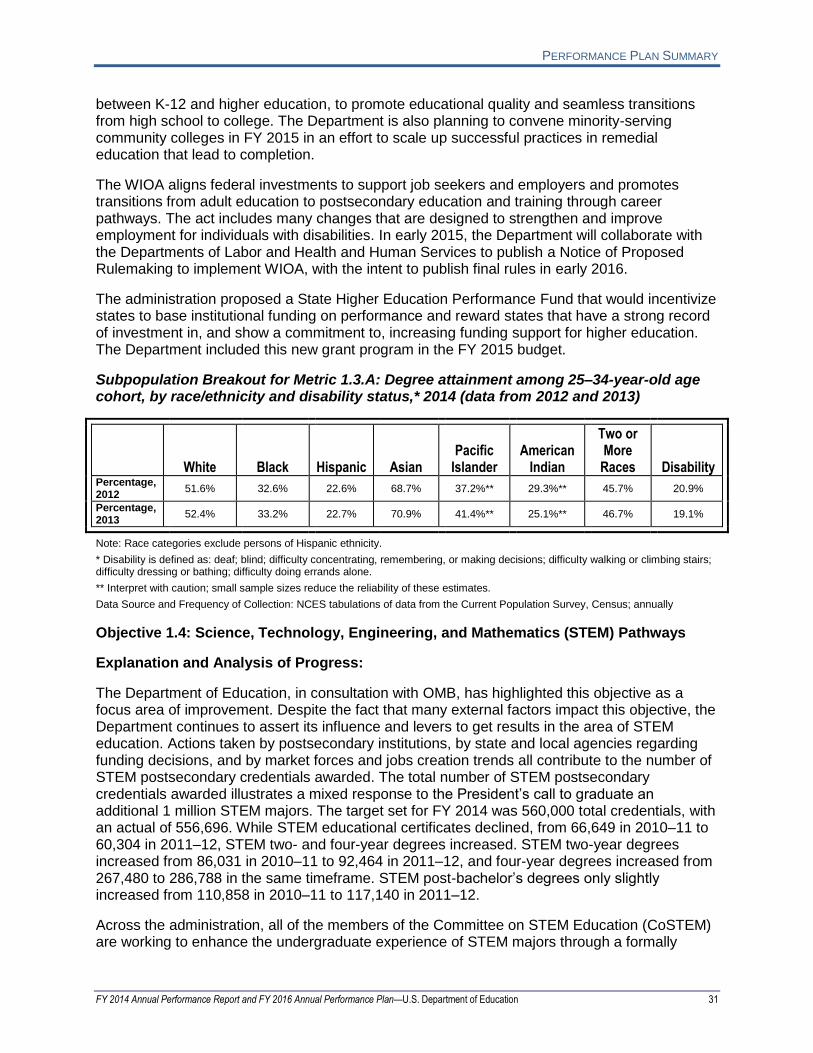
Subpopulation Breakout for Metric 1.3.A: Degree attainment among 25–34-year-old age cohort, by race/ethnicity and disability status,* 2014 (data from 2012 and 2013)
White Black Hispanic Asian Pacific
Islander American
Indian
Two or More
Races Disability Percentage, 2012
51.6% 32.6% 22.6% 68.7% 37.2%** 29.3%** 45.7% 20.9%
Percentage, 2013
52.4% 33.2% 22.7% 70.9% 41.4%** 25.1%** 46.7% 19.1%
Note: Race categories exclude persons of Hispanic ethnicity.
* Disability is defined as: deaf; blind; difficulty concentrating, remembering, or making decisions; difficulty walking or climbing stairs; difficulty dressing or bathing; difficulty doing errands alone.
** Interpret with caution; small sample sizes reduce the reliability of these estimates.
Data Source and Frequency of Collection: NCES tabulations of data from the Current Population Survey, Census; annually
Objective 1.4: Science, Technology, Engineering, and Mathematics (STEM) Pathways
Explanation and Analysis of Progress:
The Department of Education, in consultation with OMB, has highlighted this objective as a focus area of improvement. Despite the fact that many external factors impact this objective, the Department continues to assert its influence and levers to get results in the area of STEM education. Actions taken by postsecondary institutions, by state and local agencies regarding funding decisions, and by market forces and jobs creation trends all contribute to the number of STEM postsecondary credentials awarded. The total number of STEM postsecondary credentials awarded illustrates a mixed response to the President’s call to graduate an additional 1 million STEM majors. The target set for FY 2014 was 560,000 total credentials, with an actual of 556,696. While STEM educational certificates declined, from 66,649 in 2010–11 to 60,304 in 2011–12, STEM two- and four-year degrees increased. STEM two-year degrees increased from 86,031 in 2010–11 to 92,464 in 2011–12, and four-year degrees increased from 267,480 to 286,788 in the same timeframe. STEM post-bachelor’s degrees only slightly increased from 110,858 in 2010–11 to 117,140 in 2011–12.
Across the administration, all of the members of the Committee on STEM Education (CoSTEM) are working to enhance the undergraduate experience of STEM majors through a formally
PERFORMANCE PLAN SUMMARY
FY 2014 Annual Performance Report and FY 2016 Annual Performance Plan—U.S. Department of Education 32
chartered interagency working group led by the National Science Foundation (NSF). The group is focused on four major objectives:
Evidence–based practices to improve undergraduate learning and retention in STEM;
Community college efforts to both support two-year students and create bridges between two- and four-year postsecondary institutions;
Research experiences that involve both university-industry and university-federal entity partnerships, particularly for students in the first two years; and
Promoting mathematics success to help combat excessively high failure rates in introductory math courses at the undergraduate level.
In particular, representatives from the Department have been instrumental in bringing new focus on the role of community colleges in the overall spectrum of support for undergraduate STEM education. This focus may help to address the decline seen in STEM certificates awarded.
Trends for females and minority students point to continued struggles in broadening participation in STEM. More Hispanics attained STEM credentials, but fewer Black and slightly fewer American Indian/Alaska Native students completed STEM degrees or certificates. Along with the Committee on STEM Education interagency working group focused on broadening participation in STEM, the work of the My Brother’s Keeper and Reach Higher initiatives, as well as other targeted efforts from the White House-led initiatives, can be used to help expand participation of underrepresented groups in postsecondary STEM programs.
Challenges and Next Steps:
As the Department’s Office of STEM is newly formed, one of the first tasks is to better identify programs both within the Department and across the federal government in which to emphasize STEM priorities. The investments at the Department that address STEM degree and credential completion in particular are limited to select programs that target minority-serving institutions. As the next grant cycle commences, the Department is engaging in planning meetings to identify areas for strategic leverage—technical assistance to grantees, preaward support to potential applicants, etc. The Department will continue to promote STEM pathway opportunities within the CoSTEM structure that include community colleges.
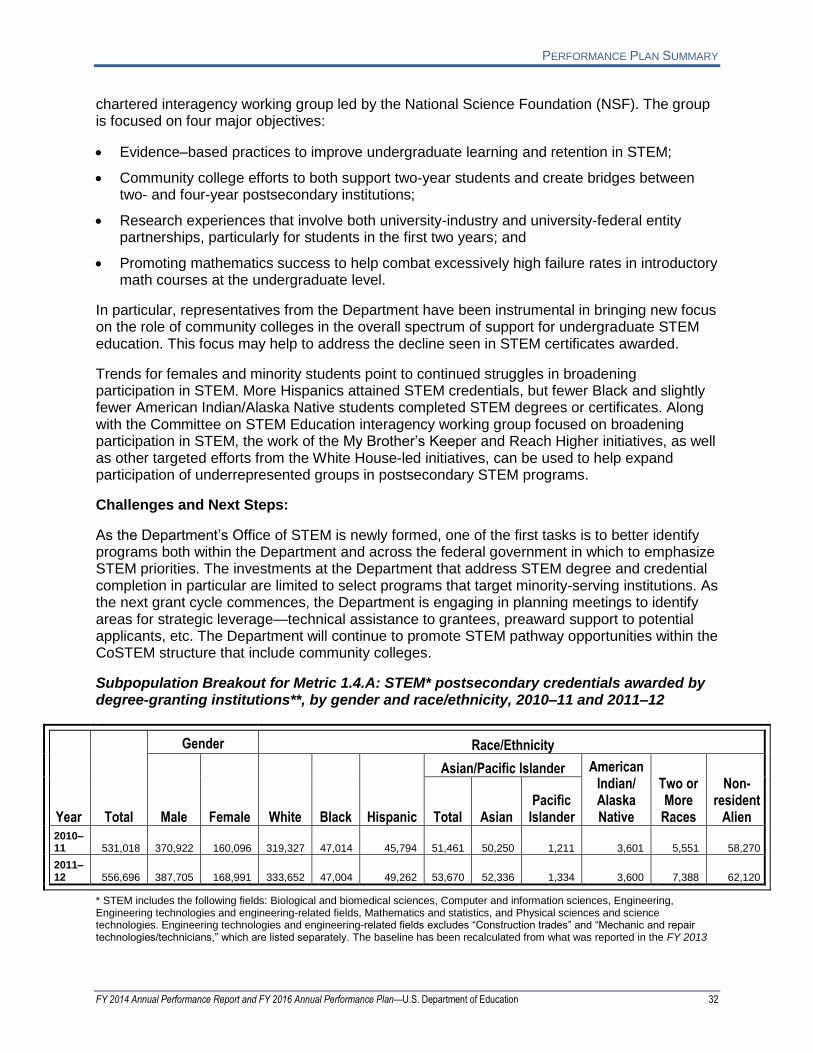
Subpopulation Breakout for Metric 1.4.A: STEM* postsecondary credentials awarded by degree-granting institutions**, by gender and race/ethnicity, 2010–11 and 2011–12
Year Total
Gender Race/Ethnicity
Male Female White Black Hispanic
Asian/Pacific Islander American Indian/ Alaska Native
Two or More
Races
Non-resident
Alien Total Asian Pacific
Islander
2010–11 531,018 370,922 160,096 319,327 47,014 45,794 51,461 50,250 1,211 3,601 5,551 58,270
2011–12 556,696 387,705 168,991 333,652 47,004 49,262 53,670 52,336 1,334 3,600 7,388 62,120
* STEM includes the following fields: Biological and biomedical sciences, Computer and information sciences, Engineering, Engineering technologies and engineering-related fields, Mathematics and statistics, and Physical sciences and science technologies. Engineering technologies and engineering-related fields excludes “Construction trades” and “Mechanic and repair technologies/technicians,” which are listed separately. The baseline has been recalculated from what was reported in the FY 2013

PERFORMANCE PLAN SUMMARY
FY 2014 Annual Performance Report and FY 2016 Annual Performance Plan—U.S. Department of Education 33
Annual Performance Report and FY 2015 Annual Performance Plan because of revised IPEDS data. Additionally, last year’s data included Military technologies and applied sciences, which is no longer included in the calculation.
** Degree-granting institutions grant associate’s or higher degrees and participate in Title IV federal financial aid programs. Race categories exclude persons of Hispanic ethnicity. Reported racial/ethnic distributions of students by level of degree, field of degree, and sex were used to estimate race/ethnicity for students whose race/ethnicity was not reported. To facilitate trend comparisons, certain aggregations have been made of the degree fields as reported in the IPEDS Fall survey: “Agriculture and natural resources” includes Agriculture, agriculture operations, and related sciences and Natural resources and conservation; and “Business” includes Business management, marketing, and related support services and Personal and culinary services.
Data Source and Frequency of Collection: IPEDS Data Center; annually
Selected Strategies to Achieve Goal 1
The Department must ensure that all students—recent high school graduates and adult learners alike—are well prepared for college and careers by helping more of them enroll in postsecondary education and helping to increase the number of those who complete programs of study with a degree or certificate.
To spur reforms at the state level and most effectively impact attainment rates, the Department will implement the President’s College Value and Affordability Agenda. One central strategy promotes innovation and competition (such as in course redesign and student services, accelerating time to degree by fostering dual enrollment, pilot projects, and competency-based education), facilitated by a reduction in federal regulatory requirements that may constrain innovation. To support innovation and competition, the Department has implemented the First in the World grant program, launched a series of Experimental Sites pilots through Federal Student Aid, incorporated dual enrollment in the program of study definition in the GEAR-UP grant competition, hosted an Education Datapalooza event in January 2014 to encourage innovations that increase quality while reducing costs, and released a Request for Information seeking feedback on potential uses for Application Program Interfaces (API) for the purpose of making data and processes in higher education and student aid more open and accessible to students and families. A second major strategy fosters better investment in college education and holds institutions and students accountable for completion and postsecondary outcomes through a college rating system that will help students compare value (e.g., access, affordability, and student outcomes) and eventually tie financial aid to performance and improvement. The Department has collected extensive public input through hearings, forums, meetings, and electronically submitted feedback over the past year to guide the development of this college rating system.
The Department will continue to spotlight model state programs and draw on them to shape federal strategies. Furthermore, the Department is shifting to an evidence-based approach for institutional grants, with, for example, the use of competitive priorities in the Strengthening Institutions Program and the tiered-evidence structure of the First in the World grant competition. The net effect of these strategies will be to boost completion rates and, by extension, educational attainment.
PERFORMANCE PLAN SUMMARY
FY 2014 Annual Performance Report and FY 2016 Annual Performance Plan—U.S. Department of Education 34
Goal 2. Elementary and Secondary Education:
Improve the elementary and secondary education system’s ability to consistently deliver excellent instruction aligned with rigorous
academic standards while providing effective support services to close achievement and opportunity gaps, and ensure all students
graduate high school college- and career-ready.
Goal Leader: Deb Delisle
Objective 2.1: Standards and Assessments. Support implementation of internationally benchmarked college- and career-ready standards, with aligned, valid, and reliable assessments. Objective Leader: Scott Sargrad
Metric 2.1.A: Number of states that have adopted college- and career-ready standards
Metric 2.1.B: Number of states that are implementing next-generation reading and mathematics assessments, aligned with college- and career-ready standards
Objective 2.2: Effective Teachers and Strong Leaders. Improve the preparation, recruitment, retention, development, support, evaluation, recognition, and equitable distribution of effective teachers and leaders.10 Objective Leader: Scott Sargrad
Metric 2.2.A: Number of states that have fully implemented teacher and principal evaluation and support systems that consider multiple measures of effectiveness, with student growth as a significant factor
Objective 2.3: School Climate and Community. Increase the success, safety, and health of students, particularly in high-need schools, and deepen family and community engagement. Objective Leader: Heather Rieman
Metric 2.3.A: Disparity in the rates of out-of-school suspensions for students with disabilities and youth of color (youth of color metric)
Metric 2.3.B: Disparity in the rates of out-of-school suspensions for students with disabilities and youth of color (students with disabilities (SWD), IDEA only metric)
Objective 2.4: Turn Around Schools and Close Achievement Gaps. Accelerate achievement by supporting states and districts in turning around low-performing schools and closing achievement gaps, and developing models of next-generation high schools. Objective Leader: Scott Sargrad
Metric 2.4.A: Number of persistently low graduation rate high schools
Metric 2.4.B: Percentage of Cohort 1 priority schools that have met the state exit criteria and exited priority school status
10 States with approved ESEA Flexibility requests are required to implement teacher and principal evaluation and support systems by 2014–15 or 2015–16, depending on the school year of initial approval. Under previously announced additional flexibility, personnel decisions based on those systems are not required until the 2016–17 school year. Additionally, the Department committed to working with states that need to make adjustments to implementation timelines or sequencing through the ESEA Flexibility renewal process in early 2015.

PERFORMANCE PLAN SUMMARY
FY 2014 Annual Performance Report and FY 2016 Annual Performance Plan—U.S. Department of Education 35
Metric 2.4.C: Percentage of Cohort 1 focus schools that have met the state exit criteria and exited focus school status
Objective 2.5: STEM Teaching and Learning. Increase the number and quality of STEM teachers and increase opportunities for students to access rich STEM learning experiences. Objective Leader: Russ Shilling
Metric 2.5.A: Percentage of high school and middle school teachers who teach STEM as their main assignment who hold a corresponding undergraduate degree
Metric 2.5.B: Number of public high school graduates who have taken at least one STEM AP exam
Goal 2 Discretionary Resources
$0 $10,000 $20,000 $30,000 $40,000
FY 2014
FY 2015
FY 2016
$33,301
$33,202
$35,169
(Dollars in millions)
Major Discretionary Programs and Activities11 Supporting Goal 2 Performance Metrics [Dollars in Millions]
POC Account Obj. Program FY 2014
Appropriation FY 2015
Appropriation
FY 2016 President’s
Budget
OESE ED 2.4 School improvement grants 506 506 556
OESE ED 2.1, 2.2, 2.3, 2.4
Title I Grants to local educational agencies
14,385 14,410 15,410
OESE I&I 2.1 State assessments 378 378 403
OESE SIP 2.2 Improving teacher quality state grants 2,350 2,350 2,350
OESE SSS n/a 21st century community learning centers 1,149 1,152 1,152
11 All the programs listed are discretionary programs, as distinct from mandatory programs. These include both competitive and non-competitive programs.
PERFORMANCE PLAN SUMMARY
FY 2014 Annual Performance Report and FY 2016 Annual Performance Plan—U.S. Department of Education 36
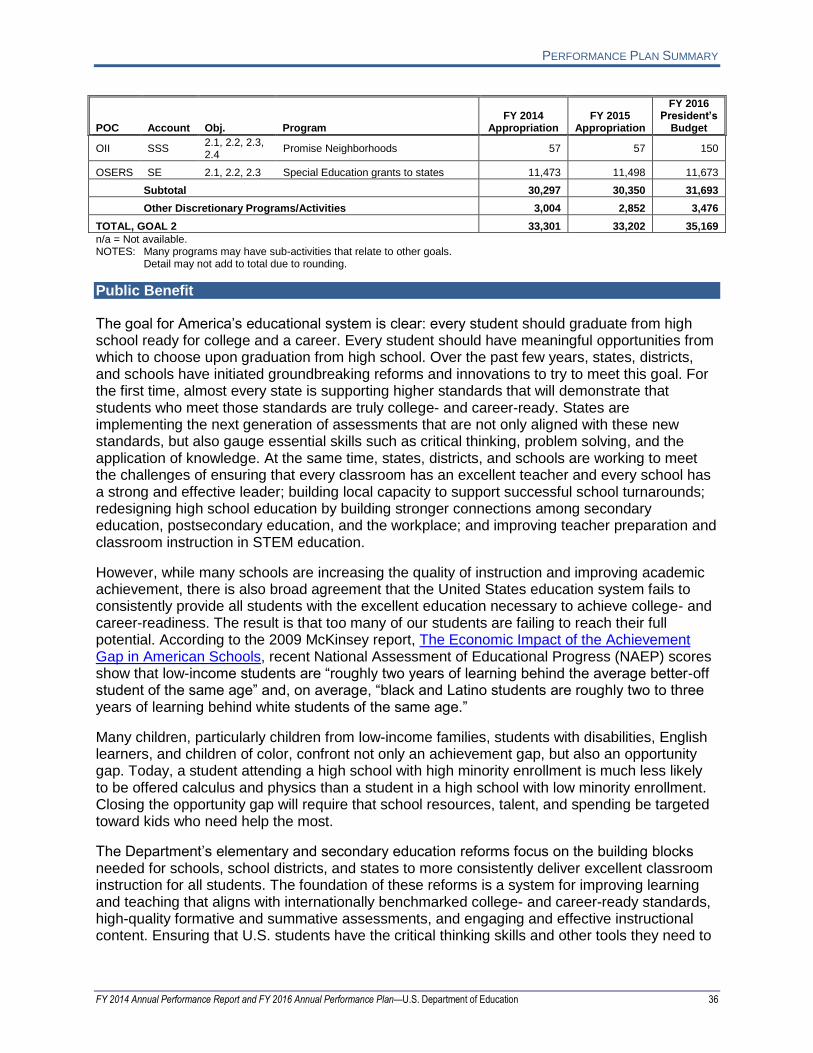
POC Account Obj. Program FY 2014
Appropriation FY 2015
Appropriation
FY 2016 President’s
Budget
OII SSS 2.1, 2.2, 2.3, 2.4
Promise Neighborhoods 57 57 150
OSERS SE 2.1, 2.2, 2.3 Special Education grants to states 11,473 11,498 11,673
Subtotal 30,297 30,350 31,693
Other Discretionary Programs/Activities 3,004 2,852 3,476
TOTAL, GOAL 2 33,301 33,202 35,169
n/a = Not available. NOTES: Many programs may have sub-activities that relate to other goals.
Detail may not add to total due to rounding.
Public Benefit
The goal for America’s educational system is clear: every student should graduate from high school ready for college and a career. Every student should have meaningful opportunities from which to choose upon graduation from high school. Over the past few years, states, districts, and schools have initiated groundbreaking reforms and innovations to try to meet this goal. For the first time, almost every state is supporting higher standards that will demonstrate that students who meet those standards are truly college- and career-ready. States are implementing the next generation of assessments that are not only aligned with these new standards, but also gauge essential skills such as critical thinking, problem solving, and the application of knowledge. At the same time, states, districts, and schools are working to meet the challenges of ensuring that every classroom has an excellent teacher and every school has a strong and effective leader; building local capacity to support successful school turnarounds; redesigning high school education by building stronger connections among secondary education, postsecondary education, and the workplace; and improving teacher preparation and classroom instruction in STEM education.
However, while many schools are increasing the quality of instruction and improving academic achievement, there is also broad agreement that the United States education system fails to consistently provide all students with the excellent education necessary to achieve college- and career-readiness. The result is that too many of our students are failing to reach their full potential. According to the 2009 McKinsey report, The Economic Impact of the Achievement Gap in American Schools, recent National Assessment of Educational Progress (NAEP) scores show that low-income students are “roughly two years of learning behind the average better-off student of the same age” and, on average, “black and Latino students are roughly two to three years of learning behind white students of the same age.”
Many children, particularly children from low-income families, students with disabilities, English learners, and children of color, confront not only an achievement gap, but also an opportunity gap. Today, a student attending a high school with high minority enrollment is much less likely to be offered calculus and physics than a student in a high school with low minority enrollment. Closing the opportunity gap will require that school resources, talent, and spending be targeted toward kids who need help the most.
The Department’s elementary and secondary education reforms focus on the building blocks needed for schools, school districts, and states to more consistently deliver excellent classroom instruction for all students. The foundation of these reforms is a system for improving learning and teaching that aligns with internationally benchmarked college- and career-ready standards, high-quality formative and summative assessments, and engaging and effective instructional content. Ensuring that U.S. students have the critical thinking skills and other tools they need to

PERFORMANCE PLAN SUMMARY
FY 2014 Annual Performance Report and FY 2016 Annual Performance Plan—U.S. Department of Education 37
be effective in the 21st-century economy means improving teaching and learning in all content areas—from literacy, science, technology, engineering, and mathematics to history, civics and government, geography, foreign languages, the arts, economics and financial literacy, environmental education, computer science, health education, and other subjects.
Goal 2: Details
Elementary and Secondary Indicators of Success Baseline
Actuals Targets
2012 2013 2014 2014 2015 2016
Objective 2.1: Standards and Assessments. Support implementation of internationally benchmarked college- and career-ready standards, with aligned, valid, and reliable assessments.
2.1.A. Number of states that have adopted college- and career-ready standards1
Year: 2013 49, plus DC
Not Collected
49, plus DC
49, plus DC and Puerto Rico
50 NOT MET
50 50
2.1.B. Number of states that are implementing next-generation reading and mathematics assessments, aligned with college- and career-ready standards1
Year: 2013 0
Not Collected
0 0 0
NA 50 50
Objective 2.2: Effective Teachers and Strong Leaders. Improve the preparation, recruitment, retention, development, support, evaluation, recognition, and equitable distribution of effective teachers and leaders.
2.2.A. Number of states that have fully implemented teacher and principal evaluation and support systems that consider multiple measures of effectiveness, with student growth as a significant factor1,2
Year: 2013 6
Not Collected
6 7 18
NOT MET 37 43
Objective 2.3: School Climate and Community. Increase the success, safety, and health of students, particularly in high-need schools, and deepen family and community engagement.
2.3.A. Disparity in the rates of out-of-school suspensions for students with disabilities and youth of color (youth of color metric)3
Year: 2012 10.7% point
disparity
10.7% point disparity
Not Collected
TBD 2014 data collected in 2015
8.7% point disparity
TBD NA
6.7% point disparity
2.3.B. Disparity in the rates of out-of-school suspensions for students with disabilities and youth of color (SWD, IDEA only metric)3
Year: 2012 5.7% point disparity
5.7% point disparity
Not Collected
TBD 2014 data collected in 2015
4.2% point disparity
TBD NA
2.7% point disparity
Objective 2.4: Turn Around Schools and Close Achievement Gaps. Accelerate achievement by supporting states and districts in turning around low-performing schools and closing achievement gaps, and developing models of next-generation high schools.
2.4.A. Number of persistently low graduation rate high schools1,4,5
Year: 2011–12
7754 NA
Year: 2011–12
775
Year: 2012–13
737
736 NOT MET
699 5% annual reduction
2.4.B. Percentage of Cohort 1 priority schools that have met the state exit criteria and exited priority school status3
Year: 2013 NA
NA NA
TBD 2014 data
will be available in 2015
10% TBD
15% 20%
2.4.C. Percentage of Cohort 1 focus schools that have met the state exit criteria and exited focus school status3
Year: 2013 NA
NA NA
TBD 2014 data
will be available in 2015
10% TBD
15% 20%

PERFORMANCE PLAN SUMMARY
FY 2014 Annual Performance Report and FY 2016 Annual Performance Plan—U.S. Department of Education 38
Elementary and Secondary Indicators of Success Baseline
Actuals Targets
2012 2013 2014 2014 2015 2016
Objective 2.5: STEM Teaching and Learning. Increase the number and quality of STEM teachers and increase opportunities for students to access rich STEM learning experiences.
2.5.A. Percentage of high school and middle school teachers who teach STEM as their main assignment who hold a corresponding undergraduate degree3,6
Year: 2011–12
62.2% 62.2%
Not Collected
Not Collected
NA NA 65.3%
2.5.B. Number of public high school graduates who have taken at least one STEM AP exam7
Year: 2012 497,922
Not Collected
Year: 2012 497,922
Year: 2013 527,001
536,810 NOT MET
581,419 632,642
NA = Not applicable.
TBD = To be determined. 1 This metric is aligned with an Agency Priority Goal. 2 In the FY 2013 APR and FY 2015 APP, the Department reported a baseline of seven states, initially including DE, FL, IN, LA, MI, RI, and TN. In Quarter 2 of FY 2014, the Department recalculated the baseline and determined it to be 6 states (DE, FL, IN, LA, TN, and DC—removing MI and RI, adding DC). 3 Targets for this metric are based on what the Department expects will occur in a given fiscal year. 4 Persistently low graduation rate high schools are defined as regular and vocational high schools with an average minimum cohort size of 65 or more, and an average adjusted cohort graduation rate (ACGR) of 60% or less over three years. The 2011–12 baseline and actual only included two years of data because the Department did not collect ACGR data until 2010–11. 5 The baseline data for this performance metric were recalculated from what was reported in the FY 2013 Annual Performance Report and FY 2015 Annual Performance Plan. The targets remain at a 5% reduction each year. 6 Data are produced every four years; thus the Department will only receive one set of data (collected in 2015–16) during this Strategic Plan cycle. 7 STEM Advanced Placement (AP) fields include Biology, Calculus, Chemistry, Computer Science, Environmental Science, Physics, and Statistics.
Data Sources and Frequency of Collection:
2.1.A. Elementary and Secondary Education Act (ESEA) Flexibility Monitoring; annually
2.1.B. ESEA Flexibility Monitoring; annually
2.2.A. ESEA Flexibility Applications and Monitoring; annually
2.3.A. Civil Rights Data Collection (CRDC); biennially
2.3.B. Civil Rights Data Collection; biennially
2.4.A. EDFacts; annually
2.4.B. EDFacts; annually
2.4.C. EDFacts; annually
2.5.A. Schools and Staffing Survey (SASS), NCES; quadrennially
2.5.B. College Board/AP administrative records; annually
Note on performance metrics and targets: These metrics were established as a part of the FY 2014–18 Strategic Plan. Metrics may be updated or revised to reflect awareness of more accurate data or clarifications. Such updates or
revisions are identified in footnotes.
Analysis and Next Steps by Objective
Objective 2.1: Standards and Assessments
Explanation and Analysis of Progress:
States have recognized the need to improve the rigor and quality of their standards and assessments. Since 2009, 43 states and the District of Columbia have adopted common, internationally benchmarked college- and career-ready standards in English, language arts, and
PERFORMANCE PLAN SUMMARY
FY 2014 Annual Performance Report and FY 2016 Annual Performance Plan—U.S. Department of Education 39
mathematics that were developed through a state-led effort. Six states and Puerto Rico are implementing their own college- and career-ready standards that have been approved by their state’s network of institutions of higher education. With such standards in place, educators are designing instructional strategies to engage students and implementing support systems to strengthen college- and career-ready skills for all students, including those with disabilities and English learners. The Department will continue to leverage federal investments, including Titles I, II, and III of ESEA, as well as the Individuals with Disabilities Education Act (IDEA), and provide guidance and technical assistance to states to ensure that teachers and principals are well prepared and students have the resources and support needed to graduate from high school ready for college and careers. For those states whose ESEA Flexibility expired at the end of the 2013–2014 school year, the Department worked to extend those waivers through the 2014–2015 school year. As part of this process, the Department determined that each of those states was on track to implementing college- and career-ready standards and that a plan was in place to implement an assessment aligned with those standards according to the timeline established.
Results for this metric are most influenced by actions taken by states and LEAs, but also are influenced by factors that are beyond the control of the LEAs, the states, or the Department. Developing appropriate assessment instruments and approaches for young students poses significant challenges, especially for children from low-income families, children who are English learners, and children with disabilities. Developing and administering the next generation of assessments and supporting teachers through training related to the new standards will require continuing financial support.
Challenges and Next Steps:
A challenge facing the Department over the next two years is effectively supporting states in their plans to implement these college- and career-ready standards and aligned assessments for all students, including English learners, students with disabilities, and low-achieving students.
The Department is taking steps to develop and target technical assistance activities that will help increase state capacity to identify and implement best and promising practices. For example, the Department will build a publicly accessible library of resources that support the implementation of college- and career-ready standards. This library will draw on resources across the Department to develop and identify materials to assist in a full and effective transition to college- and career-ready standards. Resources developed by the technical assistance arm of the former Implementation and Support Unit (ISU) (now part of the Office of State Support (OSS)) and by IDEA-funded technical assistance centers will be added to the library. The Department is also working internally to coordinate the provision of technical assistance across OESE, the Office of Special Education Programs (OSEP), and other related offices and programs. In the most recent Comprehensive Centers competition, the Department created a Center on Standards and Assessments Implementation and a Center on College and Career Readiness and Success, which will help build the capacity of state educational agencies to implement college- and career-ready standards. The Department also recently funded the Center on Improving Transition to Postsecondary Education and Employment for Students with Disabilities.
PERFORMANCE PLAN SUMMARY
FY 2014 Annual Performance Report and FY 2016 Annual Performance Plan—U.S. Department of Education 40
Objective 2.2: Effective Teachers and Strong Leaders
Explanation and Analysis of Progress:
Over the past several years, states and school districts have made educator effectiveness a key priority in their reform efforts. States and districts are working on the development and implementation of high-quality teacher and principal evaluation and support systems, as well as broader human capital management systems that use the results of evaluation systems to inform targeted educator development and support opportunities, placement, retention, promotion, differential performance-based compensation, and other personnel decisions. The Department is supporting the work of states and districts in this area through key programs and initiatives such as Title I, Title II, RTT, Teacher Incentive Fund, ESEA Flexibility, Excellent Educators for All, and the Comprehensive Center on Great Teachers and Leaders, and using these programs and initiatives to provide resources and technical assistance to states and districts so that they can move forward with high-quality implementation. In 2014, more states and districts are implementing teacher and principal evaluation and support systems that are based on multiple measures, including student growth as a significant factor, and nearly all states are continuing to work toward implementation of these systems over the next two to three years.
Similar to objective 2.1, the results of this metric are greatly influenced by state and district actions, as well as other factors not in the Department’s control. As teacher and school leader evaluation systems and compensation decisions are governed by state and local policies, without revisions in state policies and new partnerships with teacher and education leaders’ organizations, reforms of existing evaluation and compensation systems are unlikely to be successful.
Challenges and Next Steps:
Implementation of teacher and leader evaluation and support systems has proven to be very challenging work for states and districts, particularly during the time of transition to new standards and assessments, and has caused states to need to adjust timelines and sequencing of implementation steps. In order to mitigate these risks, the Department is providing flexibility to states regarding the use of student growth based on statewide assessments during the transition to new assessments, as well as other changes that are outside their original implementation timelines and plans. The Department is working to connect all states to experts who can provide technical assistance in this area. There are also challenges associated with teacher and principal support for the new systems, as well as the challenge that these systems may not work as intended. The Department is continuing to work with states to help them engage with educators and develop plans focused on continuous improvement so that they can make adjustments as needed.
Objective 2.3: School Climate and Community
Explanation and Analysis of Progress:
As states and local districts across the country move to increase rigor in schools and improve the college and career readiness of all students, there is a growing recognition in the field that safe and supportive school climates are a necessary precondition of large-scale improvements in student achievement. Central to ensuring safe and supportive school climates for all students is the reform of school discipline policy and practice. Research has repeatedly found, and the Department’s Civil Rights Data Collection confirms, that school discipline as applied in many

PERFORMANCE PLAN SUMMARY
FY 2014 Annual Performance Report and FY 2016 Annual Performance Plan—U.S. Department of Education 41
public schools often negatively and disproportionately impacts minority students and students with disabilities without resulting in any appreciable improvements in school safety or student achievement. Such practices contribute greatly to the loss of instructional time and opportunities for affected students and to a school-to-prison pipeline that involves tens of thousands of young people in the juvenile justice system each year. Since 2011, the Department, in collaboration with the Department of Justice (DOJ), has focused states and local districts on understanding the elements of safe and supportive school climates and the deleterious effects of zero tolerance discipline policies. In the summer of 2011, the Department and DOJ launched the Supportive School Discipline Initiative (SSDI) with a central goal of reducing disproportionalities in the application of school discipline, especially as it pertains to minority students (metric 2.3.A) and students with disabilities (metric 2.3.B). Through the SSDI, the Department released a “Dear Colleague” letter signed by Secretary Duncan and Attorney General Holder, which provides extensive guidance on reforming school discipline policies; convened a national summit, which included more than 20 states that are working to reform state law and policy related to student discipline and youth involvement in the juvenile justice system; and continued to facilitate the Supportive School Discipline Community of Practice to support states implementing student discipline reforms. The Department is also supporting improvements in school climate through $43 million in FY 2014 School Climate Transformation Grants to states and local districts.
Challenges and Next Steps:
School discipline reform is challenging on multiple levels, as it often necessitates changes in state law and local district policy that practitioners on the ground must then understand and implement. Building awareness among local practitioners of research on the effects of zero tolerance discipline policies and the disproportionalities that often result is particularly challenging for states because they oversee hundreds, if not thousands, of autonomous local districts, each with their own unique cultures, policies, and practices as they relate to school discipline. To meet the informational and organizational challenges of reforming school discipline policies, the Department and DOJ are working with 22 states through the SSDI to advance broad adoption of supportive school discipline policies and reduce disciplinary practice that results in disproportionalities among the students affected. The Department is developing a new school climate survey for schools to be released in September 2015 and is working with the Substance Abuse and Mental Health Services Administration (SAMHSA) at the Department of Health and Human Services (HHS) and DOJ on the implementation of the School Climate Transformation Grants.
Objective 2.4: Turn Around Schools and Close Achievement Gaps:
Explanation and Analysis of Progress:
Turning around the lowest-performing schools, closing achievement gaps, increasing high school graduation rates, and decreasing disparities in graduation rates are critical to achieving the President’s goal of once again having the highest proportion of college graduates in the world. States and districts have assumed the challenge of focusing on their lowest-performing schools, and directing significant resources and support in order to improve student outcomes dramatically. Since 2009, more than 1,700 schools have received up to $2 million per year for three years through the SIG program to implement rigorous intervention models intended to turn these schools around. Nearly two-thirds of the schools in the first two cohorts have made progress in improving student achievement in reading, and a similar percentage have shown improvement in math. However, some of this population of schools has also shown decreases in performance, and more work is needed to ensure that the progress is sustained. In addition,
PERFORMANCE PLAN SUMMARY
FY 2014 Annual Performance Report and FY 2016 Annual Performance Plan—U.S. Department of Education 42
the nation has made significant progress in increasing overall graduation rates, but gaps between rates for different student groups continue to persist. See also the Explanation and Analysis of Progress for objective 4.1 for additional information on the Department’s efforts to improve the national high school graduation rate and to close gaps between groups of students.
Challenges and Next Steps:
Turning around the lowest-performing schools is extremely challenging work and takes several years to show progress and success. As a result, there are challenges in communicating that this is a long-term process, not a short-term fix, and managing expectations of what success looks like along the way. Additionally, there is a significant need for effective turnaround leaders for the lowest-performing schools, which the Department is attempting to address through its Turnaround School Leaders Program, a new program focused on helping districts, in partnership with states, institutions of higher education, and nonprofit or for-profit partners, develop pipelines of effective leaders. Additionally, as major grant programs are ending for specific states, districts, and schools, such as RTT and SIG, there may be fewer resources available in some states and districts to support school turnaround. Sustaining successful school turnaround is a major challenge for states, districts, and schools, and the Department is both providing technical assistance and making changes to the SIG program in order to better support sustainability.
Objective 2.5: STEM Teaching and Learning:
Explanation and Analysis of Progress:
Efforts such as the 100kin10 organization’s expansion and the recent awards made to prepare STEM teachers via the Teacher Quality Partnerships program ($35 million in FY 2014) show continued attention and progress toward the Department’s goal of increasing the number and quality of STEM teachers. Across the administration, there has been a significant emphasis on improving STEM instruction, most directly through the CoSTEM Education’s interagency working groups. The Department leads the formally chartered group on P-12 STEM Instruction, which includes regular participation from the National Aeronautics and Space Administration (NASA), National Oceanic and Atmospheric Administration (NOAA), Department of Energy (DOE), U.S. Department of Agriculture (USDA), National Institutes of Health (NIH), NSF, Department of Defense (DoD), and White House (Office of Science and Technology Policy and OMB). All participating agencies have committed to align efforts to support the preparation of high-quality STEM teachers and to support authentic STEM experiences for P-12 educators. Not only do these agencies work together within the context of the CoSTEM Education, but the goals of the interagency working groups align to the CAP Goal for STEM Education across the administration. All activities that are being undertaken by the interagency working groups feed into the CAP process, and all milestones for that process align with the CoSTEM goals. Programs such as the Department’s Mathematics and Science Partnerships (MSP) program, along with numerous other programs aimed at the professional development of STEM teachers, also contribute to this goal but, because we do not have national activities money available within the MSP formula-based grant program, we do not have national program-level data available to help measure the effect on the overall STEM teaching population.

PERFORMANCE PLAN SUMMARY
FY 2014 Annual Performance Report and FY 2016 Annual Performance Plan—U.S. Department of Education 43
2013 data from the College Board shows an overall increase in the number of graduating high school students taking Advanced Placement (AP) STEM exams12—527,001 overall students compared to 497,922 in 2012. In all subgroups, total number of participants increased, ranging from an approximate 15 percent increase for Hispanic/Latino students to a 3 percent increase for Black/African American students. Females still outnumber males in terms of AP STEM exam participation (which has been the case since 2002).
Challenges and Next Steps:
While efforts continue to support P-12 STEM instruction, the dedicated federal efforts to prepare new STEM teachers are limited to just two programs—the Teacher Quality Partnerships program at the Department (which did utilize a STEM priority, but is not a STEM-dedicated program) and the Noyce Scholarship program at NSF. Requests for funding of a dedicated program to prepare STEM teachers have not been fulfilled, and the majority of teachers are prepared at colleges and universities that do not receive direct NSF or Department funding aimed specifically at STEM teacher preparation. The MSP program does not currently have a national activities set-aside to provide technical assistance or perform program-wide evaluation (each project within MSP must complete an evaluation for the state, but these evaluations are not submitted to the Department). While the overall numbers of students taking STEM AP exams have increased—including through Department-supported programs such as i3—AP courses are only one way to provide students with rich STEM learning experiences. Additional support should be given to both formal and informal STEM opportunities for students within the entire P-12 spectrum. The Office of STEM, within OII, will continue to explore opportunities to blend these environments, made possible in part by the appointment of a two-year Robert Noyce Foundation-funded Informal STEM Fellow.
Subpopulation Breakout for Metric 2.5.B: Number of Graduates Taking an AP STEM Exam during High School: U.S. Public Schools, 2012 and 2013
Race/Ethnicity Gender
Socioeconomic Status
Total
American Indian/ Alaska Native
Asian, Asian
American, Pacific
Islander
Black or African
American Hispanic or Latino White Other
No Response Female Male
Low Income
Not Low
Income Number of Graduates, 2012
2,363 73,503 36,689 64,237 298,859 15,001 7,270 256,705 241,217 114,658 383,264 497,922
Number of Graduates, 2013
2,918 78,886 37,816 74,015 312,917 16,785 3,664 271,217 255,784 128,782 398,219 527,001
Data Source and Frequency of Collection: College Board/AP administrative records; annually
Selected Strategies to Achieve Goal 2
The Department is currently implementing a reorganization in OESE that incorporates a new (and aforementioned) Office of State Support, which replaces and enhances services previously provided by the Office of Student Achievement and School Accountability (SASA), Office of
12 STEM exams include: Calculus AB, Calculus BC, Computer Science A, Computer Science AB*, and Statistics;
Biology, Chemistry, Environmental Science, Physics B, Physics C: Electricity and Magnetism, and Physics C: Mechanics.
PERFORMANCE PLAN SUMMARY
FY 2014 Annual Performance Report and FY 2016 Annual Performance Plan—U.S. Department of Education 44
School Turnaround, and ISU. This reorganization integrates key state-administered programs in a new office that will provide improved state-centered support across programs. The Department is using this reorganization to rethink, redesign, and rebuild core grant administration functions in order to provide more transparent, higher quality, and better differentiated support to states. This new structure, which builds on the collaboration that has occurred between OESE, the ISU, and OSEP, will better support states in implementing the key reform programs and initiatives that support Goal 2, and will improve the Department’s ability to execute its core priorities. The Department will continue to provide technical assistance to states in the areas of college- and career-ready standards and assessments, teacher and principal evaluation and support systems, and turning around the lowest-performing schools. The Department will finalize and implement a revised process for peer reviewing state assessments to ensure that they are high-quality and will work with states to develop and implement their plans for ensuring equitable access to effective teachers and leaders for all students. The Department will also implement changes to the SIG program in order to better support states and districts in turning around their lowest-performing schools.
A strong reauthorization of the ESEA that reinforces and extends the progress already being made to strengthen the quality of elementary and secondary education would further this goal.

PERFORMANCE PLAN SUMMARY
FY 2014 Annual Performance Report and FY 2016 Annual Performance Plan—U.S. Department of Education 45
Goal 3. Early Learning:
Improve the health, social-emotional, and cognitive outcomes for all children from birth through 3rd grade, so that all children,
particularly those with high needs, are on track for graduating from high school college- and career-ready.
Goal Leader: Deb Delisle
Objective 3.1: Access to High-Quality Programs and Services. Increase access to high-quality early learning programs and comprehensive services, especially for children with high needs. Objective Leader: Libby Doggett
Metric 3.1.A: Number of states with Quality Rating and Improvement Systems (QRIS) that meet high-quality benchmarks for child care and other early childhood programs
Objective 3.2: Effective Workforce. Improve the quality and effectiveness of the early learning workforce so that early childhood educators have the knowledge, skills, and abilities necessary to improve young children’s health, social-emotional, and cognitive outcomes. Objective Leader: Libby Doggett
Metric 3.2.A: Number of states and territories with professional development systems that include core knowledge and competencies, career pathways, professional development capacity assessments, accessible professional development opportunities, and financial supports for child care providers
Objective 3.3: Measuring Progress, Outcomes, and Readiness. Improve the capacity of states and early learning programs to develop and implement comprehensive early learning assessment systems. Objective Leader: Libby Doggett
Metric 3.3.A: Number of states collecting and reporting disaggregated data on the status of children at kindergarten entry using a common measure
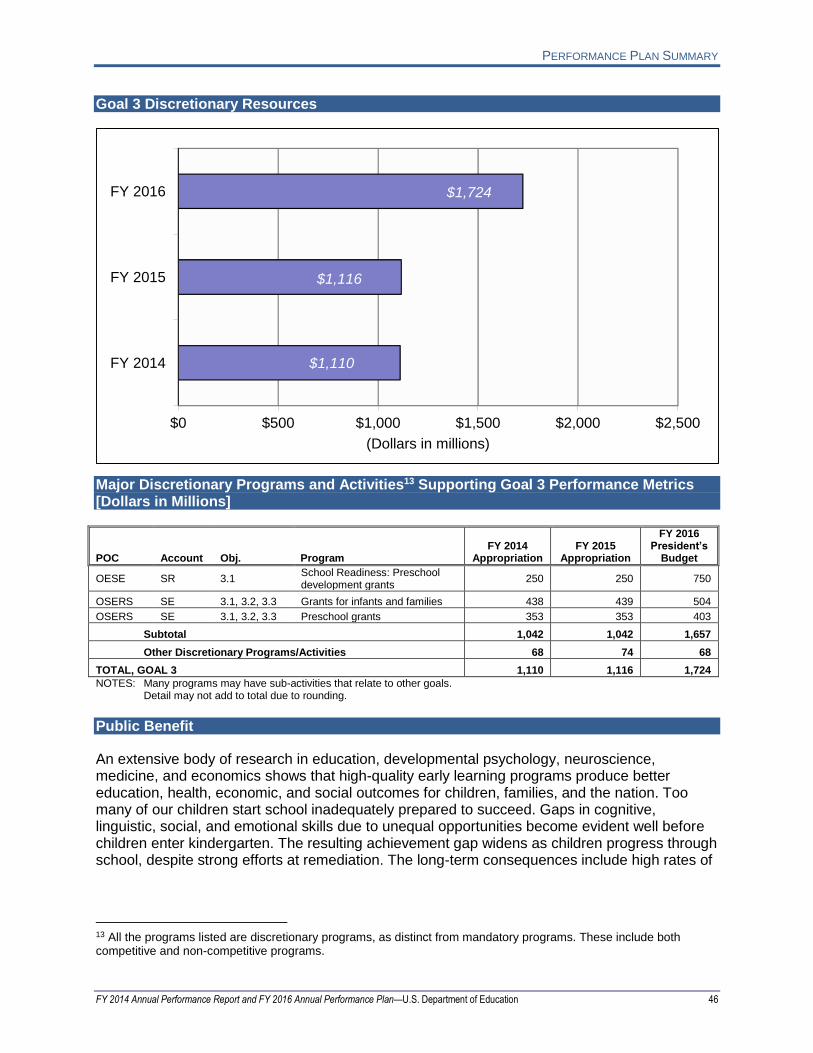
PERFORMANCE PLAN SUMMARY
FY 2014 Annual Performance Report and FY 2016 Annual Performance Plan—U.S. Department of Education 46
Goal 3 Discretionary Resources
$0 $500 $1,000 $1,500 $2,000 $2,500
FY 2014
FY 2015
FY 2016
$1,110
$1,116
$1,724
(Dollars in millions)
Major Discretionary Programs and Activities13 Supporting Goal 3 Performance Metrics [Dollars in Millions]
POC Account Obj. Program FY 2014
Appropriation FY 2015
Appropriation
FY 2016 President’s
Budget
OESE SR 3.1 School Readiness: Preschool development grants
250 250 750
OSERS SE 3.1, 3.2, 3.3 Grants for infants and families 438 439 504
OSERS SE 3.1, 3.2, 3.3 Preschool grants 353 353 403
Subtotal 1,042 1,042 1,657
Other Discretionary Programs/Activities 68 74 68
TOTAL, GOAL 3 1,110 1,116 1,724
NOTES: Many programs may have sub-activities that relate to other goals. Detail may not add to total due to rounding.
Public Benefit
An extensive body of research in education, developmental psychology, neuroscience, medicine, and economics shows that high-quality early learning programs produce better education, health, economic, and social outcomes for children, families, and the nation. Too many of our children start school inadequately prepared to succeed. Gaps in cognitive, linguistic, social, and emotional skills due to unequal opportunities become evident well before children enter kindergarten. The resulting achievement gap widens as children progress through school, despite strong efforts at remediation. The long-term consequences include high rates of
13 All the programs listed are discretionary programs, as distinct from mandatory programs. These include both competitive and non-competitive programs.

PERFORMANCE PLAN SUMMARY
FY 2014 Annual Performance Report and FY 2016 Annual Performance Plan—U.S. Department of Education 47
school failure, grade repetition, inappropriate special education placements, and dropout; involvement in risky behaviors and crime; and even higher risk for adult chronic disease.14
Children from low-income families, on average, start kindergarten 12–14 months behind their peers in pre-reading and language skills. Early findings from the Kindergarten Round of the “Early Childhood Longitudinal Study, Kindergarten Class of 2010–11,” suggest that scores on reading and math were lowest for kindergartners in households with incomes below the federal poverty level and for children coming from homes with a primary home language other than English.15 By increasing access to high-quality early learning programs and services, the country can provide children the foundation they need for success in school and address educational gaps before children enter kindergarten.
The administration began efforts to increase investments in early learning in the first term and has continued to request more funding. RTT-ELC, a program jointly administered by the Department and HHS, funds 20 states to raise the bar on the quality of their early learning programs; establish higher standards; and provide critical links with health, nutrition, mental health, and family support. RTT-ELC states serve as model early learning and development systems, and national technical assistance is available to help all states build coordinated early learning systems.
Part of the President’s overarching vision for early learning is his Preschool for All initiative, a new partnership investment with states to fund preschool for all 4-year-olds from low- and moderate-income families. The program would create incentives for states to expand publicly funded preschool to middle-class families above 200 percent of the federal poverty level and promote access to high-quality, full-day kindergarten and early learning programs for children under the age of 4. The vision also includes continued support for high-quality services for infants, toddlers, and preschool children with disabilities and their families through IDEA Parts B and C services.
A down payment toward that vision was provided through the Preschool Development Grants, which will support state efforts to both establish the infrastructure for high-quality preschool and build more programs for 4-year-olds from low- and moderate-income families in high-need communities. This new program builds on RTT-ELC achievements and further defines quality programs to include 12 nationally recognized standards such as: high staff qualifications; professional development for teachers and staff; low staff-child ratios and small class sizes; full-day programs; developmentally appropriate, evidence-based curricula and learning environments that are aligned with states’ early learning standards; inclusive programs; employee salaries that are comparable to those for K–12 teaching staff; ongoing program evaluation to ensure continuous improvement; strong family engagement; and onsite comprehensive services for children.
To enhance the quality of all early learning programs and services and improve outcomes for all children, including children with disabilities and those who are English learners, the Department will promote initiatives that increase access to high-quality, effective programs; improve the quality of the early childhood workforce; and support comprehensive assessment systems.
14 “Early Childhood Investments Substantially Boost Adult Health,” Science, March 28, 2014: http://www.sciencemag.org/content/343/6178/1478. 15 Mulligan, G.M., McCarroll, J.C., Flanagan, K.D., and Potter, D. (2014). Findings From the First-Grade Rounds of the Early Childhood Longitudinal Study, Kindergarten Class of 2010–11 (ECLS-K:2011) (NCES 2015-109). National Center for Education Statistics, Institute of Education Sciences, U.S. Department of Education. Washington, DC. Retrieved January 14, 2015, from http://nces.ed.gov/pubsearch.

PERFORMANCE PLAN SUMMARY
FY 2014 Annual Performance Report and FY 2016 Annual Performance Plan—U.S. Department of Education 48
Goal 3: Details
Early Learning Indicators of Success Baseline
Actuals Targets
2012 2013 2014 2014 2015 2016
Objective 3.1: Access to High-Quality Programs and Services. Increase access to high-quality early learning programs and comprehensive services, especially for children with high needs.
3.1.A. Number of states with Quality Rating and Improvement Systems (QRIS) that meet high quality benchmarks for child care and other early childhood programs1,2
Year: 2010 17
19 27
2014 data to be available in 2015
29 TBD
32 NA
Objective 3.2: Effective Workforce. Improve the quality and effectiveness of the early learning workforce so that early childhood educators have the knowledge, skills, and abilities necessary to improve young children’s health, social-emotional, and cognitive outcomes.
3.2.A. Number of states and territories with professional development systems that include core knowledge and competencies, career pathways, professional development capacity assessments, accessible professional development opportunities, and financial supports for child care providers1
Year: 2011 30
Not Collected
30 Not
Collected NA 38 NA
Objective 3.3: Measuring Progress, Outcomes, and Readiness. Improve the capacity of states and early learning programs to develop and implement comprehensive early learning assessment systems.
3.3.A. Number of states collecting and reporting disaggregated data on the status of children at kindergarten entry using a common measure3,4
Year: 2010 2
0 3 6 2
MET 9 14
NA = Not applicable.
TBD = To be determined. 1 This metric, including baseline and targets, is part of the Department of Health and Human Services’ FY 2015 Annual Performance Report and Performance Plan. The 2014 data will not be available until 2015. 2 The FY 2015 performance target is changed to reflect information from the Department of Health and Human Services’ FY 2015 Annual Performance Report and Performance Plan. For more information about this metric, see http://www.acf.hhs.gov/sites/default/files/olab/sec2c_ccdf_2015cj_complete.pdf. 3 This metric is aligned with an Agency Priority Goal. 4 Targets for this metric are based on what the Department expects will occur in a given fiscal year. Data Sources and Frequency of Collection: 3.1.A. Child Care Development Fund (CCDF) Report of State Plans with annual updates from states and territories (HHS/Office of
Childcare); annually
3.2.A. Child Care Development Fund (CCDF) Report of State Plans (HHS/Office of Childcare); biennially
3.3.A. Race to the Top (RTT)-Early Learning Challenge (ELC) Technical Assistance Center; annually
Note on performance metrics and targets: These metrics were established as a part of the FY 2014–18 Strategic Plan. Metrics may be updated or revised to reflect awareness of more accurate data or clarifications. Such updates or
revisions are identified in footnotes.
Analysis and Next Steps by Objective
Objective 3.1: Access to High-Quality Programs and Services
Explanation and Analysis of Progress:
No state has sufficient high-quality programs to meet the demand for high-quality early learning programs and services, but all states, especially the 20 states receiving RTT-ELC grants, are working to address the issue using a Tiered Quality Rating and Improvement Systems (TQRIS).
PERFORMANCE PLAN SUMMARY
FY 2014 Annual Performance Report and FY 2016 Annual Performance Plan—U.S. Department of Education 49
This reform metric helps states set progressively higher program standards and provides supports to programs so they can meet those higher standards. Once programs are enrolled in a state’s TQRIS, the state helps them improve their quality and their ranking. States provide technical assistance, professional development opportunities, and program improvement grants that allow programs to make the necessary quality improvements. RTT-ELC states have increased the number of early learning and development programs participating in their TQRIS and are implementing strategies to improve the quality of those programs. The 14 RTT-ELC states that reported data this year (six other states had only received their funding a few months prior to the reporting deadline and were not required to submit reports this year) increased the number of programs enrolled in their TQRIS from 31,321 to 54,157, showing a 73 percent increase from the baseline year.
The 14 RTT-ELC states also showed a substantial increase in the number of children with high needs enrolled in state-funded preschool programs (175 percent increase), in programs that receive funding from the Child Development Fund (43 percent increase), and in Head Start’s Early Head Start programs (83 percent increase) that are in the top tiers of the respective states’ TQRIS.
Some states are also identifying specific high-need communities or “zones” where they will implement a set of initiatives aimed at building local capacity to support the workforce, engage families, and serve more children with high needs. OSEP has three national centers that specifically focus on supporting states in enhancing their Part C and Part B, section 619 programs, as well as other early learning programs, to increase the quality of services provided to children with disabilities and their families. These centers are working with Part C and Part B, section 619 programs to develop effective and efficient infrastructures to deliver high-quality services to infants, toddlers, and preschool age children with disabilities and their families. The centers have developed a systems framework that states can use to assess their infrastructure. Additionally, OSEP recently began implementing a Results Driven Accountability (RDA) system for states. As part of this system, states are being asked to develop a State Systemic Improvement Plan (SSIP) to focus and drive their efforts to improve results for children with disabilities. Within these plans, Part C and Part B, section 619 programs will be working to ensure that children with disabilities have access to high-quality services to support them in meeting their developmental and learning outcomes.
Metrics in Goal 3 are influenced most by actions taken by states or grantees in response to state and federal policy initiatives, but they are also influenced by factors that are beyond the control of states, LEAs, or the Department.
Challenges and Next Steps:
States face many challenges in developing a rating and monitoring process for their TQRIS. Providers must be informed about the process, so as to make them more likely to participate. The observation and rating tool must be a true measure of different levels of quality; it must give the same rating results in many different settings, and it has to be easy to use. Validating the effectiveness of a TQRIS ensures that it is measuring and assessing program quality in ways that make sense to state policy makers, early learning and education programs, and families with young children.
The Department is providing support so states have the knowledge and best research for improving their TQRIS. This technical assistance is provided directly to the states in addition to peer learning groups on various topics of interest such as best ways to validate a TQRIS system or to ensure families understand the difference in the quality tiers. The Department is helping

PERFORMANCE PLAN SUMMARY
FY 2014 Annual Performance Report and FY 2016 Annual Performance Plan—U.S. Department of Education 50
RTT-ELC states to validate their systems, ensure consistency in the reporting of TQRIS ratings, and develop data system linkages between their TQRIS and other systems with data on young children and the early childhood workforce. OSEP-funded technical assistance also supports states in thinking about how to include children with disabilities within the TQRIS system. Additionally, IES is also doing a study of the TQRIS systems and plans to make results available in 2016.
It is anticipated that states will continue to examine the quality of the services supported by funding made available under Parts B and C of the IDEA to meet the needs of young children with disabilities. OSEP TA centers will continue to work with states to enhance the quality of services that they provide.
Objective 3.2: Effective Workforce
Explanation and Analysis of Progress:
Securing a well-trained and properly supported early learning workforce is an essential element of high-quality early learning programs. The quality of teacher-child interactions is the mechanism responsible for learning. Significant headway has been made in describing and conceptualizing what teachers do in the classroom that results in learning, which is a critical first step in getting teachers into those positions. Children benefit most when teachers engage in interactions that stimulate learning while being emotionally nurturing.16 These interactions foster engagement in and enjoyment of learning. Critical to assuring quality are continuous improvement systems that support teachers in the implementation of evidence-based curricula focused on specific areas of learning and socio-emotional development. In-classroom coaching and mentoring is a successful approach to providing this support. In addition, salaries commensurate with comparably prepared K-12 colleagues could stem the flight of teachers away from early learning.
States are addressing the challenge of an effective workforce through legislation regarding staff qualifications, developing workforce frameworks, and funding better support for teachers in classrooms. Only 23 states have passed legislation requiring that all teachers in preschool programs meet certain qualifications. Even these states are struggling to improve the quality of their broader workforce in child care and private settings with limited funding.
One way the Department is helping states address this challenge is through the development of a Workforce Knowledge and Competency Framework, which outlines what early childhood educators should know and be able to teach young children. RTT-ELC provides funding for activities such as surveys of courses offered in higher education institutions and through ongoing in-service education, meetings to collect information and develop consensus to support change, and development of documents. The frameworks provide the foundation for a well-qualified and prepared early childhood education workforce and can guide postsecondary institutions in the development of curricula and professional development providers in the provision of training, mentoring, and coaching in the community. It can also support individual professional development efforts for early childhood educators. As teachers move from a Child Development Associate (CDA) credential or state credential, to an associate degree, to a bachelor’s degree and beyond, early childhood educators should be building on commonly defined, previously learned information and skills.
16 Barnett, W. Steven. “Better Teachers, Better Preschools: Student Achievement Linked to Teacher Qualifications.” NIEER Preschool Policy Matters, Issue 2. http://eric.ed.gov/?id=ED480818
PERFORMANCE PLAN SUMMARY
FY 2014 Annual Performance Report and FY 2016 Annual Performance Plan—U.S. Department of Education 51
Eleven RTT-ELC states are specifically working to provide and expand access to professional development opportunities that are aligned with their Workforce Knowledge and Competency Framework and that tightly link training with professional development approaches, such as coaching and mentoring. These states are also using incentives, such as scholarships, compensation and wage supplements, tiered reimbursement rates, other financial incentives, and other strategies. These other strategies include management opportunities, and they promote professional improvement and career advancement along an articulated career pathway that is based on the state's Workforce Knowledge and Competency Framework.
States that require all programs receiving some sort of federal or state subsidy to enroll in the TQRIS system are leading this work. States that have not linked the TQRIS system to licensing are experiencing more challenges with enrolling programs.
Four states (Delaware, Iowa, Kansas, and Oregon) are specifically working with the OSEP-funded Early Childhood Personnel Center (ECPC) to develop and enhance the personnel system within their states to ensure that personnel have the knowledge and skills to provide services to young children with disabilities and their families. States are making progress in aligning their personnel standards with national professional organization personnel standards; developing partnerships with universities and community colleges to ensure that their curriculum is aligned to state personnel standards and to support better alignment between pre-service preparation and in-service professional development; and implementing evidence-based practices within in-service professional development.
Challenges and Next Steps:
Challenges abound in developing an effective early learning workforce. States have hiring challenges, due in part to a lack of available well-trained and effective personnel. Some states have experienced high turnover of early childhood educators and consultants due to low wages, attractive offers in other states, challenging financial times, and program management. States that have had programs in place for longer periods are having less difficulty recruiting and retaining strong early educators.
The Department and its technical assistance providers are working to address some of these challenges through webinars, peer learning, and pointing out promising practices, such as mentoring and coaching. For example, a study examining career pathways will provide states with an overview of how these systems are working in a handful of leading states. Reducing duplication of efforts and promoting promising practices is necessary for creating an early learning workforce that can deliver on the promise of these programs. ECPC is currently working with Part C and Part B, Section 619 coordinators to identify additional states with which to work to improve their personnel systems.
Objective 3.3: Measuring Progress, Outcomes, and Readiness
Explanation and Analysis of Progress:
The Department, in consultation with OMB, has determined that there has been noteworthy progress toward this objective. KEAs are important tools for determining what children know and are able to do by the time they reach kindergarten. Results of the KEAs provide information to help close the school readiness gap at kindergarten entry and to inform instruction in the early elementary school grades. They also inform parents about their children’s learning and development and involve them in decisions about their children’s education.
PERFORMANCE PLAN SUMMARY
FY 2014 Annual Performance Report and FY 2016 Annual Performance Plan—U.S. Department of Education 52
Nineteen RTT-ELC states17 are working to have in place a KEA that covers multiple developmental domains, including language and literacy, cognition and general knowledge, approaches toward learning, physical well-being and motor development, and social and emotional development. Even though the 19 RTT-ELC states that selected to implement statewide KEAs are at different stages in implementing new or revised assessments, all are making progress.
States are collaborating with and learning from one another as they tackle the complexities and challenges of developing and implementing their KEAs. For example, Illinois and California are using the same tool and collaborating to enhance and improve it. Maryland and Ohio have partnered to develop formative and summative assessments that are based on their individual state standards. According to The Race to the Top – Early Learning Challenge Year Two Progress Report, states are also realizing the importance of first working with kindergarten teachers and administrators when planning to implement a KEA and then providing training and support as teachers begin implementing the KEAs and interpreting and sharing the results. One state, Oregon, fully implemented a statewide KEA in the first quarter of FY 2014 (i.e., fall of 2013). It is using the lessons learned from that KEA to improve the next round of assessments and strengthen data interpretation and reporting. Some areas identified for improvement are the provision for additional guidance on successful kindergarten assessment practices for Spanish-speaking English learners and streamlined mechanisms for data entry and reporting.
In FY 2013, the Department awarded Enhanced Assessment Grants (EAG) to support the development and enhancement of KEAs. Texas and two state consortia, one led by Maryland and the other led by North Carolina, were awarded EAG grants. KEAs under this program should be aligned with state early learning standards and cover all essential domains of school readiness. Three additional RTT-ELC grantees are participating in the Maryland consortium (Massachusetts, Michigan, and Ohio) as well as a number of non-RTT-ELC states. Eight states are partnering with North Carolina: Delaware, Iowa, Maine, North Dakota, Oregon, Rhode Island, South Carolina, and Washington, DC.
On an annual basis through their annual performance reports, OSEP continues to require state Part C and Part B, section 619 programs to report on child outcomes for children that received at least 6 months of IDEA services. OSEP funds a technical assistance center to support states in collecting high-quality data within their outcomes measurement system and in using that data for program improvement.
Challenges and Next Steps:
The field of early learning is increasingly embracing the importance of measuring and monitoring children’s progress due to historical lack of good metrics and the variability of young children’s development. That is changing with the introduction of KEAs through RTT-ELC and state policies. The Department and its early childhood technical assistance center are supporting both RTT-ELC grantee states and non-grantee states by establishing learning communities and providing technical assistance webinars, briefs, and a recent report on progress states are making in implementing KEAs.
In order to better understand the challenges states are facing and progress they are making, the Department has funded a study which will report on how leading states are implementing KEAs as a learning tool. Results will be available late in 2015.
17 One state, Wisconsin, did not choose to implement a KEA as a part of its RTT-ELC work.
PERFORMANCE PLAN SUMMARY
FY 2014 Annual Performance Report and FY 2016 Annual Performance Plan—U.S. Department of Education 53
OSEP is investigating ways to use the Part C child outcomes data in FY 2015 when making annual determinations of performance based on state performance plans and annual performance reports.
Selected Strategies to Achieve Goal 3
The Department is using a multipronged approach to improve the health, social-emotional, and cognitive outcomes for all children from birth through 3rd grade, so that all children, particularly those with high needs, are on track for graduating from high school college- and career-ready. Through technical assistance by Department staff and contractors, technical assistance centers, monitoring, research reports, an annual grantee meeting, and use of the bully pulpit, the Department expects to reach its goal. One tool that supports the Department in its management of this goal is an electronic monitoring and reporting tool that it uses to assess the progress in all RTT-ELC states and deploy specialized technical assistance as quickly as possible to ensure progress continues. Further, the Department works with the ELC TA Center and the Center on Enhancing Early Learning Outcomes (CEELO) to provide targeted technical assistance, establishing learning communities and providing webinars, briefs, and reports on key topics. The Department’s annual grantee meeting allows us to highlight key promising practices, discuss major challenges, and better understand state and local challenges. OSEP will be reviewing states’ SSIPs for Part C in April 2015 and will be supporting them through technical assistance to their infrastructure, data quality, and services and interventions to enhance results for young children with disabilities and their families.
All our efforts are aimed at increasing access to high-quality, effective programs—served by an effective early learning workforce—for children from birth to school entry and beyond (including children with disabilities and those who are English learners). Comprehensive assessment systems will measure our success, helping us to enhance the quality of all early learning programs, and reach the ultimate goal of improving children’s outcomes.

PERFORMANCE PLAN SUMMARY
FY 2014 Annual Performance Report and FY 2016 Annual Performance Plan—U.S. Department of Education 54
Goal 4. Equity:
Increase educational opportunities for underserved students and reduce discrimination so that all students are well-positioned to
succeed.
Goal Leader: Catherine Lhamon
Objective 4.1: Equitable Educational Opportunities. Increase all students’ access to educational opportunities with a focus on closing achievement gaps, and remove barriers that students face based on their race, ethnicity, or national origin; sex; sexual orientation; gender identity or expression; disability; English language ability; religion; socioeconomic status; or geographical location. Objective Leader: Bob Kim
Metric 4.1.A: National high school graduation rate
Objective 4.2: Civil Rights Compliance. Ensure educational institutions’ awareness of and compliance with federal civil rights obligations and enhance the public’s knowledge of their civil rights. Objective Leader: Bob Kim
Metric 4.2.A: Percentage of proactive civil rights investigations launched annually that address areas of concentration in civil rights enforcement
Metric 4.2.B: Percentage of proactive civil rights investigations resolved annually that address areas of concentration in civil rights enforcement
Goal 4 Discretionary Resources
$0 $500 $1,000 $1,500 $2,000 $2,500
FY 2014
FY 2015
FY 2016
$1,485
$1,500
$1,619
(Dollars in millions)

PERFORMANCE PLAN SUMMARY
FY 2014 Annual Performance Report and FY 2016 Annual Performance Plan—U.S. Department of Education 55
Major Discretionary Programs and Activities18 Supporting Goal 4 Performance Metrics [Dollars in Millions]
POC Account Obj. Program FY 2014
Appropriation FY 2015
Appropriation
FY 2016 President’s
Budget
OCR OCR 4.2 Office for Civil Rights 98 100 131
OESE ED 4.1 State agency programs: Migrant 375 375 375
OESE IE 4.1 Indian Education: Grants to local educational agencies
100 100 100
OESE IE 4.1 Indian Education: Special programs for Indian children
18 18 68
OESE SIP 4.1 Alaska Native education equity 31 31 32
OESE SIP 4.1 Education for Native Hawaiians 32 32 33
OESE SIP 4.1, 4.2 Training and advisory services 7 7 7
OESE/OELA ELA 4.1, 4.2 English Language Acquisition 723 737 773
OII I&I 4.1 Magnet schools assistance 92 92 92
OSERS SE n/a Special Olympics education programs 8 8 8
TOTAL, GOAL 4 1,485 1,500 1,619
n/a = Not available. NOTES: Many programs may have sub-activities that relate to other goals.
Detail may not add to total due to rounding.
Public Benefit
The Department is committed to pursuing equity at all stages of education, from birth through adulthood, in institutions of early learning, K–12 schools, career and technical and postsecondary education, adult education, workforce development, and independent living programs. The Department’s goal is to ensure that all—not just a subset—of the nation’s children, youths, and adults graduate from high school and obtain the skills necessary to succeed in college, in the pursuit of a meaningful career, and in their lives.
The Department also recognizes the need to increase educational opportunities systemically for underserved populations, including by exploring ways to increase equitable access to resources and effective teachers within states and districts. Studies show that having a strong teacher is the single most important in-school contributor to a student’s success. Because of this, and regardless of how teacher effectiveness is defined, it is critical that the nation eliminate disparities in the access to effective teachers between high-need students—including low-income students, English learners, and students with disabilities—and all other students. By fostering improved teacher evaluation and support systems and talent pipelines from recruitment to retention, the Department aims to elevate the teaching profession as a whole while also working to ensure that all students—no matter their geographic locations—have equitable access to effective teachers.
Finally, civil rights enforcement is pivotal to ensuring that recipients of federal funding at the preschool, K–12, and postsecondary levels eliminate acts of discrimination that, left unchecked, would otherwise negatively impact students’ achievement and access to educational opportunities. The Department’s OCR uses a variety of tools to ensure compliance with federal civil rights laws, including issuing detailed policy guidance; conducting vigorous complaint investigations; procuring strong systemic remedies; pursuing aggressive monitoring of resolution agreements; launching targeted and proactive compliance reviews and technical assistance activities; collecting and publicizing school-level data on important civil rights
18 All the programs listed are discretionary programs, as distinct from mandatory programs. These include both competitive and non-competitive programs.

PERFORMANCE PLAN SUMMARY
FY 2014 Annual Performance Report and FY 2016 Annual Performance Plan—U.S. Department of Education 56
compliance indicators; and participating in intra- and inter-agency work groups to share expertise and best practices. OCR also engages students, parents, recipients of federal funding, and other stakeholders to inform them about applicable federal civil rights laws and policies so that they are equipped to identify and address civil rights issues at the earliest stages.
OCR has increased the transparency of its work to the public by posting nearly all resolution letters and agreements reached in FY 2014 and beyond on its website. In addition, OCR has released the results of the 2011–12 Civil Rights Data Collection, which it has expanded to include a wealth of new data to assist the Department, states, districts, teachers, administrators, researchers, students, and parents in identifying civil rights trends and issues at the local, state, and national levels.
Goal 4: Details
Equity Indicators of Success Baseline
Actuals Targets
2012 2013 2014 2014 2015 2016
Objective 4.1: Equitable Educational Opportunities. Increase all students’ access to educational opportunities with a focus on closing achievement gaps, and remove barriers that students face based on their race, ethnicity, or national origin; sex; sexual orientation; gender
identity or expression; disability; English language ability; religion; socioeconomic status; or geographical location.
4.1.A. National high school graduation rate1,2
Year: 2011–12 80.0%
Year: 2010–11
79%
Year: 2011–12 80.0%
81% 81.5%
NOT MET 83.0% 84.5%
Objective 4.2: Civil Rights Compliance. Ensure educational institutions’ awareness of and compliance with federal civil rights obligations and enhance the public’s knowledge of their civil rights.
4.2.A. Percentage of proactive civil rights investigations launched annually that address areas of concentration in civil rights enforcement
Year: 2013 7%
Not Collected
7% 21% 7%
MET 10% 12%
4.2.B. Percentage of proactive civil rights investigations resolved annually that address areas of concentration in civil rights enforcement
Year: 2013 8%
Not Collected
8% 15% 8%
MET 10% 12%
1 This metric is aligned with an Agency Priority Goal. Data for the 2012–13 school year will be available during the second quarter of FY 2015. Data for the 2013–14 school year will be available during the second quarter of FY 2016. 2 The data for the 2012–13 Adjusted Cohort Graduation Rate (ACGR) are available at http://nces.ed.gov/ccd/tables/ACGR_2010-11_to_2012-13.asp. Note that the current disclosure protection methodology limits reporting to whole number percentages.
Data Sources and Frequency of Collection: 4.1.A. EDFacts; annually 4.2.A. Office for Civil Rights’ (OCR) Case Management System (CMS) and Document Management (DM) systems; quarterly 4.2.B. Office for Civil Rights’ (OCR) Case Management System (CMS) and Document Management (DM) systems; quarterly
Note on performance metrics and targets: These metrics were established as a part of the FY 2014–18 Strategic
Plan. Metrics may be updated or revised to reflect awareness of more accurate data or clarifications. Such updates or revisions are identified in footnotes.
Analysis and Next Steps by Objective
Objective 4.1: Equitable Educational Opportunities
Explanation and Analysis of Progress:
The Department made progress toward expanding equitable educational opportunities. As explained below, the Department took aggressive steps in FY 2014 through policy development, grant-making, program management, and legal enforcement to close achievement and

PERFORMANCE PLAN SUMMARY
FY 2014 Annual Performance Report and FY 2016 Annual Performance Plan—U.S. Department of Education 57
opportunity gaps that present barriers to learning or achievement at all levels of the educational system, from early education to K–12 to postsecondary. Such barriers include the lack of access to challenging courses, effective teachers and school leaders, sufficient resources and other supports, and safe and healthy learning environments.
Budget
The Department developed an FY 2015 budget that included a new proposed $300 million RTT-Equity and Opportunity competition. While Congress did not provide funding for this program, the Department is working through other programs and actions to further its goals related to ensuring equitable access to rigorous courses, effective educators, and support services in high-need communities into future grant competitions, programs, and initiatives.
Preschool–Grade 12 (P-12) Education
Much of the Department’s P-12 work aims to improve opportunities for students. Along with HHS, the Department has significantly increased funding for early learning. More than $1 billion in RTT-ELC funding is improving the quality of early learning settings in 20 states, and the Department and HHS designed and awarded $250 million in new Preschool Development Grants to states to expand access to high-quality preschool programs for children from low- to moderate-income families in high-need communities in order to close educational gaps between disadvantaged children and their peers and ensure that all children have an equal opportunity to succeed when they enter kindergarten. The Preschool Development Grants will serve more than 33,000 4-year-olds in 18 states in 2015–16 alone. The administration has requested $500 million in FY 2015 to continue high-quality preschool programs in current grantee states and expand to new communities.
The Department granted extensions of ESEA Flexibility for the 2014–15 school year for 34 states, ensuring that those states continue to implement college- and career-ready standards for all students, hold districts and schools accountable for subgroup performance, and implement evaluation and support systems for teachers and principals that, ultimately, can be used to monitor and improve equitable access to effective educators.
The Department also developed and launched the Excellent Educators for All initiative. This initiative is specifically designed to ensure that students of color and students from low-income families have equitable access to excellent educators. The Department will work with states to implement the initiative in the coming year (see next steps section below).
The Department helped to advance the President’s ConnectED initiative, which aims to enrich K-12 education for every student in America through technology (see also the Explanation and Analysis of Progress for objective 5.4). The initiative seeks to provide high-speed broadband and Wi-Fi to schools covering 99 percent of our nation’s students by 2018, provide every student with access to a device suitable for digital learning, enable creation of more high-quality and accessible digital content, and provide resources and support for school leaders and educators to learn to use technology effectively. Since ConnectED’s launch, the Federal Communications Commission (FCC) has worked to modernize the E-rate program to improve broadband and Wi-Fi access in schools across the country. In addition, we have provided guidance to the field to clarify the ability to use federal funds to support the transition to digital learning and share models for effective use of technology to transform learning. In 2015, the Department will release an updated National Educational Technology Plan to set the national vision for how technology can support learning and close equity gaps.
PERFORMANCE PLAN SUMMARY
FY 2014 Annual Performance Report and FY 2016 Annual Performance Plan—U.S. Department of Education 58
The Department continued to implement the National Professional Development (NPD) program to prepare teachers to work with English learners and the Native American and Alaska Native children in Schools (NAM) program to provide support to Native American English learners, in addition to the formula grants to SEAs for English learners (ELs) under Title III of the ESEA. The Department also commissioned a study by the Institute of Medicine (IOM) and the National Academy of Sciences (NAS) on the development of young ELs and Dual Language Learners (DLLs) and on best practices to support education success across diverse settings and institutions from birth through the end of high school.
The Department published a Request for Information seeking public comment and guidance on state obligations under IDEA to address significant disproportion by race or ethnicity within districts in the identification, placement, or discipline of students with disabilities. The Department also announced a new framework known as Results-Driven Accountability, under which the Department will consider multiple educational results and outcomes for students with disabilities—including their participation in state assessments, their proficiency levels as compared to all students, and their performance in reading and math on the National Assessment of Educational Progress—to produce a more comprehensive and thorough picture of the performance of children with disabilities in each state and to inform its annual determinations with respect to each state under IDEA.
In order to help keep students safe and improve their learning environments, the Department awarded more than $70 million in grants to 130 grantees in 38 states, including School Climate Transformation Grants to help create positive school climates that support effective education for all students and Project Prevent grants to help LEAs break the cycle of violence through expanded access to school-based strategies that prevent future violence.
The Bureau of Indian Education (BIE) working group, convened jointly by Education Secretary Duncan and Interior Secretary Jewell, issued a Blueprint for Reform to improve outcomes in BIE schools. The Department provided technical assistance and continued grant awards under the Indian Education Demonstration Grants program, the Professional Development program, and the State Tribal Education Partnership program, in addition to ESEA Title VII formula grants to LEAs for services to American Indian/Alaska Native students. In addition, the Department has been working to identify policies and programs that will support achievement for all Native youth. In conjunction with OCR, the White House Initiative on American Indian and Alaska Native Education conducted a listening tour to address concerns about school climate and Indian mascots in public schools. The Department also joined with HHS and DOI to convene a Languages Summit to discuss best practices in preserving and revitalizing Native languages for children and youth.
The Department incorporated a competitive priority in the GEAR-UP State and Partnership grant competitions to encourage applicants to propose postsecondary success strategies, including those that support early attention to remedial education needs prior to enrollment in college. GEAR-UP provides services at high-poverty middle and high schools to help low-income students prepare for and succeed in postsecondary education. Addressing remedial education prior to college increases the likelihood that students will persist.
The Department released the results of the 2011–12 Civil Rights Data Collection (CRDC), which was expanded to include a wealth of new data to assist the Department, states, districts, teachers, administrators, researchers, students, and parents in identifying civil rights trends and issues at the local, state, and national levels. The CRDC disaggregates data by race, sex, disability, and English proficiency status (as well as by grade level for certain items). The

PERFORMANCE PLAN SUMMARY
FY 2014 Annual Performance Report and FY 2016 Annual Performance Plan—U.S. Department of Education 59
2015–16 collection will include new data to help measure incidents of bullying or harassment based on religion or sexual orientation in public schools.
Higher Education
The Department distributed $31.6 billion in Pell Grant awards to approximately 9 million students in FY 2014. The maximum Pell award was increased from $5,645 for the 2013–14 award year (July 1, 2013–June 30, 2014) to $5,730 for the 2014–15 award year (July 1, 2014–June 30, 2015), which helped cover a greater portion of college costs for low-income students to support college access goals. The Department also awarded 24 First in the World grants totaling $75 million to institutions of higher education, including $20 million to six Minority Serving Institutions, to spur the development of innovations that improve educational outcomes and make college more affordable for students and families and to develop an evidence base of effective practices. The Department continued to support the White House Task Force to Protect Students from Sexual Assault to improve coordination, transparency, and effectiveness in responding to sexual violence in colleges and universities.
The Department’s Migrant Education State Program (MEP), the High School Equivalency Program (HEP) projects, and the College Assistance Migrant Program (CAMP) continue to address the educational needs of students from migrant and seasonal farmworker families as a part of investments in equity and opportunity. HEP and CAMP projects helped 3,292 migrant students obtain high school equivalency and 1,410 migrant students successfully complete their first year of college.
As noted earlier in this report, President Obama’s America’s College Promise proposal, announced in January 2015, would allow students to attend community colleges tuition-free if they attend half-time, are making satisfactory academic progress to a degree, and maintain a 2.5 GPA. If enacted by Congress, this plan would benefit nearly 9 million students by making a higher education more affordable and would particularly impact students of color as community colleges enroll larger percentages of students of color.
Challenges and Next Steps:
The following items delineate future challenges and next steps as the Department works to enhance educational opportunities for underserved populations:
New and continuing proposals related to equity described above are dependent on final appropriations. The Department will work to ensure that programs with high equity focus receive priority attention to the extent possible.
The Department continues to see gaps for students of color and low-income students in important equity metrics such a postsecondary attainment, involvement in STEM, teacher equity, and access to educational resources. The Department will work with the CoSTEM Education interagency working group, the My Brother’s Keeper and Reach Higher initiatives, and other targeted efforts from the White House Initiatives to help expand participation of underrepresented groups in postsecondary STEM.
The Department is working to improve equity of access to excellent educators through a number of efforts. The Department published a Notice of Proposed Rulemaking on teacher preparation in November 2014. Also in fall 2014, the Department released guidance on new State Plans to Ensure Equitable Access to Excellent Educators and launched a support network designed to help states develop and implement comprehensive plans.

PERFORMANCE PLAN SUMMARY
FY 2014 Annual Performance Report and FY 2016 Annual Performance Plan—U.S. Department of Education 60
The Department continues to seek to use Title I and the ESEA Flexibility Framework to close achievement gaps. In its FY 2016 budget, the Department is requesting a major increase in Title I funding to improve access to standards, aligned assessments, and excellent educators in Title I schools. The Department has developed ESEA Flexibility renewal guidance and FAQs that focus on ensuring that underrepresented students have access to standards and assessments and that states maintain accountability and teacher evaluation systems that will help measure progress in schools serving the most high-need students. The Department will finalize new regulations for the School Improvement Grants program to incorporate changes from the FY 2014 appropriations act and lessons learned from four years of SIG implementation, as well as provide three new models, including an early learning model, so that SIG will better support turnaround efforts in the lowest-performing schools.
To support its efforts to improve outcomes for our most vulnerable students, the Department, as part of the My Brother’s Keeper initiative, will launch targeted technical assistance initiatives to assist high-need districts struggling with high student dropout rates, particularly among students of color, and with overuse of and disparities in school discipline practices. A complementary White House initiative, Bridging the Word Gap, will support families and caregivers to help ameliorate the language disparities that exist for children from low-income families.
The Department, through OCTAE, will continue to work with Congress on the reauthorization of the Carl D. Perkins Career and Technical Education Act of 2006 (Perkins). As described in Investing in America’s Future: A Blueprint for Transforming Career and Technical Education, equity is a cross-cutting theme in the Department’s plan for the Perkins reauthorization. The proposal would require states to improve their data collection systems for Perkins by using commonly defined participation and performance indicators, which would lead to increased transparency and accountability for equity gaps. In addition, states would be required to track data at the local level to ensure that CTE programs are serving diverse student populations and communities statewide. The proposal also encourages the use of technology-enabled learning solutions that are accessible to, and usable by, students with disabilities and English learners to create access to high-quality learning opportunities, including to technical courses and virtual work experiences.
The Department will propose a new Statewide Longitudinal Data System competition in FY 2015 that focuses on requiring states to justify their need for SLDS funds to address a small number of high-priority policy issues, including financial and resource equity, teacher preparation, early learning, and college and career readiness.
While overall graduation rates have increased, graduation rates for students of color continue to lag behind white students. For the graduating class of 2012, the National Adjusted Cohort Graduation Rate was 69 percent for black students and 73 percent for Latino students compared to 86 percent for white students.
The Department—in collaboration with the Departments of Labor and HHS, the Corporation for National and Community Service, and the Institute of Museum and Library Sciences—will establish up to 10 Performance Partnership agreements with states, localities, or tribes that provide additional flexibility in using non-mandatory funds that support programs that serve disconnected youth (i.e., individuals between the ages of 14 and 24 who are homeless, in foster care, involved in the juvenile justice system, unemployed, or not enrolled in or at risk of dropping out of an educational institution). States and localities that seek to participate in these pilots will commit to achieve significant improvements for disconnected youth in educational, employment, and other key outcomes in exchange for this new flexibility.
PERFORMANCE PLAN SUMMARY
FY 2014 Annual Performance Report and FY 2016 Annual Performance Plan—U.S. Department of Education 61
In December 2014, through a Notice of Proposed Rulemaking, the Department announced a new priority for Indian Education Demonstration Grants, entitled Native Youth Community Projects. This program will fund projects in a select number of Native communities to support culturally relevant strategies designed to improve the college- and career-readiness of Native children and youth. These projects would support a coordinated intervention strategy chosen by the local community, recognizing that tribal communities are best-positioned to improve outcomes for American Indian/Alaska Native students.
The Department will continue to support postsecondary institutions receiving First in the World grants. For example, funding was provided to a Historically Black University to redesign courses to entail more project-based learning and technology tools that improve student learning and engagement. At a Hispanic-Serving Institution, funds will be used to strengthen curriculum through an integrated set of tools to increase student engagement, especially for high-risk students. Projects will be evaluated at their conclusion, and those showing evidence of success will serve as models for wider dissemination.
Subpopulation Breakout for Metric 4.1.A: National high school graduation rate by race/ethnicity, other characteristics*: School year 2011–121
Total
American Indian/ Alaska Native
Asian/ Pacific
Islander Hispanic Black White Economically
Disadvantaged
Limited English
Proficiency
Students with
Disabilities Percentage 80 67 88 73 69 86 72 59 61
* Data are reported based on the requirements for individual states in the Consolidated State Performance Report (CSPR).
1 School year 2012–13 data will be available by Quarter 2 of FY 2015.
Data Source and Frequency of Collection: EDFacts universe collection, annual reports; annually
Objective 4.2: Civil Rights Compliance
Explanation and Analysis of Progress:
The Department, in consultation with OMB, has determined that performance toward this objective is making noteworthy progress. The Department increased the breadth, depth, and transparency of its civil rights enforcement work while maintaining the quality and pace of resolutions. In FY 2014, OCR received a record high number of complaints (9,989) and resolved more than 9,400 complaints. (By comparison, in 1985 OCR received just 2,199 complaints—80 percent fewer than what OCR now receives in a typical year.) OCR resolved 94 percent of complaints within 180 days of receiving them. It accomplished this with fewer staff than ever before in OCR history. OCR launched 38 proactive investigations (i.e., compliance reviews and directed inquiries) in FY 2014, an increase of 27 percent from FY 2013. OCR resolved 27 proactive investigations—an increase of 59 percent from FY 2013. As OCR achieved this, it expanded the scope of investigations in some of the most pressing civil rights areas—including discipline, sexual violence, and access to college- and career-preparatory courses and opportunities—to ensure it protected all impacted students in its investigations.
The Department released six comprehensive policy guidance documents addressing urgent and complex questions related to sexual assault on campuses; schools’ obligation not to discriminate in discipline policies or practices based on race, color, or national origin; equitable access to resources, including strong educators, textbooks, college-preparatory courses, extracurricular activities, technology, and facilities; the duty of schools to enroll and remove barriers to enrollment for immigrant and undocumented students; the continuing ability and

PERFORMANCE PLAN SUMMARY
FY 2014 Annual Performance Report and FY 2016 Annual Performance Plan—U.S. Department of Education 62
discretion of schools to consider race in their programs, outreach, and admissions following the Supreme Court’s Schuette decision; and the obligation of charter schools to adhere to the federal civil rights laws.
Challenges and Next Steps:
The Department is experiencing record-high civil rights complaint volume while its OCR staffing level continues to reach new historic lows. These trends will likely continue in FY 2015. The Department expects continued or increased activity and record volumes in resource equity, sexual violence, and discipline cases following the recent release of related guidance on these topics.
The Department will take steps in FY 2015 to ensure that, within budget limitations, its OCR staff are as well supported as possible through training, support, and increased communications and that engagement around how work is conducted enables staff to maximize the pace and efficiency of their work. The Department has requested a significant increase in appropriations in its FY 2016 budget request to address the challenges described above to ensure and maintain robust civil rights compliance and awareness pursuant to this objective.
Selected Strategies to Achieve Goal 4
The Department will implement a number of strategies in FY 2015 intended to reach the goal of closing achievement gaps, ensuring equitable access to the educational resources students need to be prepared for college and career, and ensuring all students have the opportunity to attain a high-quality education provided in a supportive and non-discriminatory environment. The Department’s strategies span the P-20 spectrum.
With regard to early education, the Department will support a robust early learning agenda aimed at supporting universal access to high-quality preschool and building state capacity to implement high-quality preschool programs.
The Department will advance its goal of greater access to effective teachers through the review and monitoring of state plans and providing technical assistance pursuant to the Excellent Educators for All initiative. The Department will also issue final regulations related to the performance of teacher preparation programs.
The Department stands ready to work with Congress on strong ESEA reauthorization that ensures opportunity for every child in this country; strengthens our nation economically; and expands support for schools, teachers, and principals, as well as accountability for the progress of all students. The Department’s ESEA Flexibility renewal strategy will enable the Department to continue to push for rapid closing of achievement gaps even in the absence of a reauthorized ESEA. The Department’s ESEA Flexibility renewal guidance continues to emphasize high-need students in priority, focus, and other Title I schools and ensuring that underserved or disadvantaged students have access to standards and assessments. In addition, the Department will seek to advance new proposals for the SLDS and SIG programs to improve student outcomes and attainment.
The Department will also pursue specific initiatives aimed at supporting historically underserved students, such as low-income students, English learner students, and students with disabilities. The Department will support the My Brother’s Keeper initiative by launching targeted technical assistance initiatives to assist high-need districts. The Department will support new initiatives designed to improve teaching and learning in STEM subjects for teachers and students in our

PERFORMANCE PLAN SUMMARY
FY 2014 Annual Performance Report and FY 2016 Annual Performance Plan—U.S. Department of Education 63
nation’s schools. The Department will seek to maximize the potential impact of increased access to broadband and Wi-Fi for high-needs students through the ConnectED initiative. The Department will explore ways to increase school safety, improve the conduciveness of school environments to learning, and reduce racial and socioeconomic isolation in schools. The Department will continue to pursue additional research, teacher preparation, and support for English learners. The Department will pursue equity and support for students with disabilities through IDEA and civil rights enforcement. The Department will advance programs that serve homeless, foster, disconnected, incarcerated, and migrant youth.
In an effort to protect students from discrimination, the Department will increase the number of civil rights policy guidance documents it issues, continue its vigorous investigation of civil rights complaints, launch targeted and proactive civil rights compliance reviews and technical assistance activities, provide more transparency about civil rights processes and resolutions on its website, and expand the Civil Rights Data Collection while providing greater assistance to participating institutions to improve the quality of data submissions.
The Department will foster more equity in career, technical, and adult education programs and support college innovation, affordability, outcomes, and completion, including through issuing new regulations, Pell Grants, and the First in the World program.
PERFORMANCE PLAN SUMMARY
FY 2014 Annual Performance Report and FY 2016 Annual Performance Plan—U.S. Department of Education 64
Goal 5. Continuous Improvement of the U.S. Education System:
Enhance the education system’s ability to continuously improve through better and more widespread use of data, research and
evaluation, evidence, transparency, innovation, and technology.
Goal Leader: Jim Shelton
Objective 5.1: Data Systems and Transparency. Facilitate the development of interoperable longitudinal data systems for early learning through employment to enable data-driven, transparent decision-making by increasing access to timely, reliable, and high-value data. Objective Leader: Ross Santy
Metric 5.1.A: Number of public data sets included in ED Data Inventory and thus linked to Data.gov or ED.gov websites
Metric 5.1.B: Number of states linking K–12 and postsecondary data with workforce data
Metric 5.1.C: Number of states linking K–12 with early childhood data
Objective 5.2: Privacy. Provide all education stakeholders, from early childhood to adult learning, with technical assistance and guidance to help them protect student privacy while effectively managing and using student information. Objective Leader: Kathleen Styles
Metric 5.2.A: Average time to close “cases” (PTAC + FPCO)19
Objective 5.3: Research, Evaluation, and Use of Evidence. Invest in research and evaluation that builds evidence for education improvement; communicate findings effectively; and drive the use of evidence in decision-making by internal and external stakeholders. Objective Leaders: Ruth Neild, Melanie Muenzer, and Margo Anderson
Metric 5.3.A: Percentage of select new20 (non-continuation) competitive grant dollars that reward evidence
Metric 5.3.B: Number of peer-reviewed, full-text resources in the Education Resources Information Center (ERIC)
Metric 5.3.C: Number of reviewed studies in the What Works Clearinghouse (WWC) database
Objective 5.4: Technology and Innovation. Accelerate the development and broad adoption of new, effective programs, processes, and strategies, including education technology. Objective Leader: Richard Culatta
19 Privacy Technical Assistance Center (PTAC) and Family Policy Compliance Office (FPCO). 20 “New competitive grant dollars that reward evidence” includes all dollars awarded based on the existence of at least “evidence of promise” in support of a project, per the framework in the Education Department General Administrative Regulations (34 CFR Part 75). Consideration of such evidence appears through: eligibility threshold (e.g., in the Investing in Innovation program); absolute priority; competitive priority (earning at least one point for it); or selection criteria (earning at least one point for it). The percentage is calculated compared to the total new grant dollars awarded, excluding awards made by the Institute of Education Sciences, the National Institute on Disability and Rehabilitation Research, and technical assistance centers, with some exceptions.

PERFORMANCE PLAN SUMMARY
FY 2014 Annual Performance Report and FY 2016 Annual Performance Plan—U.S. Department of Education 65
Metric 5.4.A: Percentage of schools in the country that have actual Internet bandwidth speeds of at least 100 Mbps
Goal 5 Discretionary Resources
$0 $500 $1,000 $1,500 $2,000 $2,500
FY 2014
FY 2015
FY 2016
$867
$842
$1,348
(Dollars in millions)
Major Discretionary Programs and Activities21 Supporting Goal 5 Performance Metrics [Dollars in Millions]
POC Account Obj. Program FY 2014
Appropriation FY 2015
Appropriation
FY 2016 President’s
Budget
IES IES 5.3 National assessment 132 129 150
IES IES 5.3 Regional educational laboratories 54 54 54
IES IES 5.3 Research in special education 54 54 54
IES IES 5.3 Research, development, and dissemination 180 180 202
IES IES 5.1, 5.2 Statewide longitudinal data systems 35 35 70
IES IES 5.3 Statistics 103 103 125
OII I&I 5.3 Investing in innovation (proposed legislation) 142 120 300
Subtotal 699 675 955
Other Discretionary Programs/Activities 167 167 393
TOTAL, GOAL 5 867 842 1,348
NOTES: Many programs may have sub-activities that relate to other goals. Detail may not add to total due to rounding.
Public Benefit
The foundation for improving systemic capacity is an infrastructure that supports data-driven decision-making. Stakeholders must have access to relevant, useful data in a timely fashion, and they need the skills to better understand and make use of the data. With relevant and actionable data and the ability to use it, policymakers and educators will be able to appraise
21 All the programs listed are discretionary programs, as distinct from mandatory programs. These include both competitive and non-competitive programs.
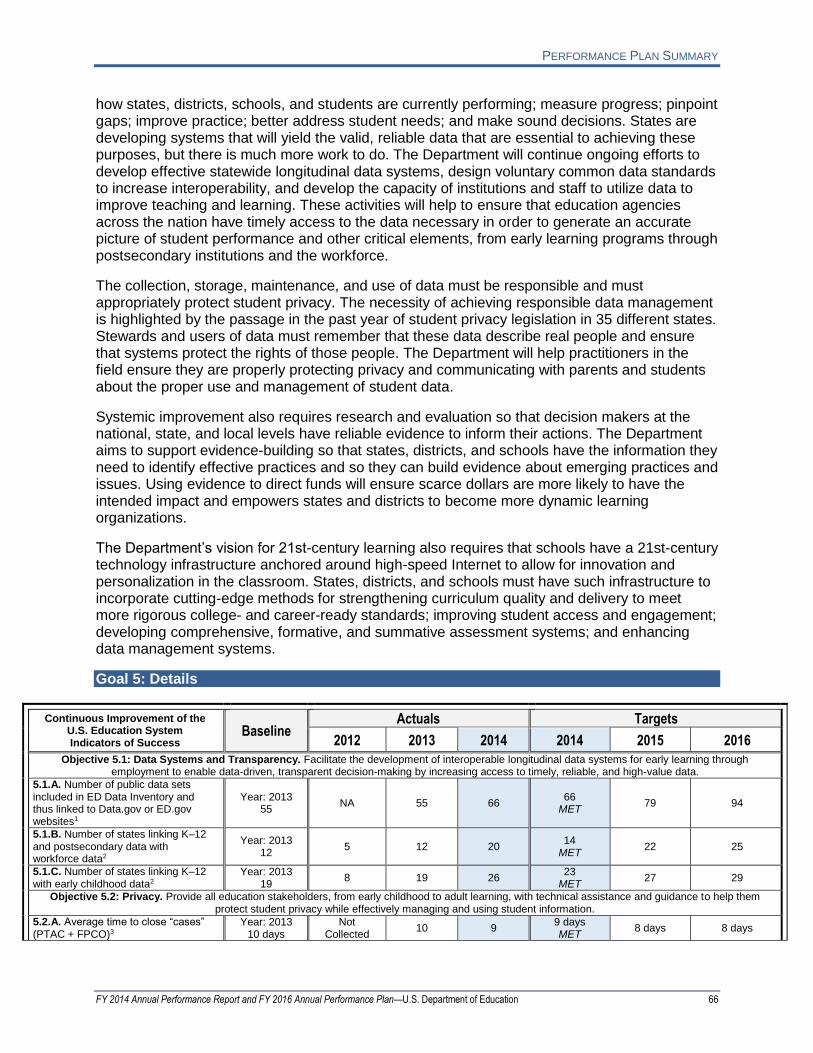
PERFORMANCE PLAN SUMMARY
FY 2014 Annual Performance Report and FY 2016 Annual Performance Plan—U.S. Department of Education 66
how states, districts, schools, and students are currently performing; measure progress; pinpoint gaps; improve practice; better address student needs; and make sound decisions. States are developing systems that will yield the valid, reliable data that are essential to achieving these purposes, but there is much more work to do. The Department will continue ongoing efforts to develop effective statewide longitudinal data systems, design voluntary common data standards to increase interoperability, and develop the capacity of institutions and staff to utilize data to improve teaching and learning. These activities will help to ensure that education agencies across the nation have timely access to the data necessary in order to generate an accurate picture of student performance and other critical elements, from early learning programs through postsecondary institutions and the workforce.
The collection, storage, maintenance, and use of data must be responsible and must appropriately protect student privacy. The necessity of achieving responsible data management is highlighted by the passage in the past year of student privacy legislation in 35 different states. Stewards and users of data must remember that these data describe real people and ensure that systems protect the rights of those people. The Department will help practitioners in the field ensure they are properly protecting privacy and communicating with parents and students about the proper use and management of student data.
Systemic improvement also requires research and evaluation so that decision makers at the national, state, and local levels have reliable evidence to inform their actions. The Department aims to support evidence-building so that states, districts, and schools have the information they need to identify effective practices and so they can build evidence about emerging practices and issues. Using evidence to direct funds will ensure scarce dollars are more likely to have the intended impact and empowers states and districts to become more dynamic learning organizations.
The Department’s vision for 21st-century learning also requires that schools have a 21st-century technology infrastructure anchored around high-speed Internet to allow for innovation and personalization in the classroom. States, districts, and schools must have such infrastructure to incorporate cutting-edge methods for strengthening curriculum quality and delivery to meet more rigorous college- and career-ready standards; improving student access and engagement; developing comprehensive, formative, and summative assessment systems; and enhancing data management systems.
Goal 5: Details
Continuous Improvement of the U.S. Education System Indicators of Success
Baseline Actuals Targets
2012 2013 2014 2014 2015 2016
Objective 5.1: Data Systems and Transparency. Facilitate the development of interoperable longitudinal data systems for early learning through employment to enable data-driven, transparent decision-making by increasing access to timely, reliable, and high-value data.
5.1.A. Number of public data sets included in ED Data Inventory and thus linked to Data.gov or ED.gov websites1
Year: 2013 55
NA 55 66 66
MET 79 94
5.1.B. Number of states linking K–12 and postsecondary data with workforce data2
Year: 2013 12
5 12 20 14
MET 22 25
5.1.C. Number of states linking K–12 with early childhood data2
Year: 2013 19
8 19 26 23
MET 27 29
Objective 5.2: Privacy. Provide all education stakeholders, from early childhood to adult learning, with technical assistance and guidance to help them protect student privacy while effectively managing and using student information.
5.2.A. Average time to close “cases” (PTAC + FPCO)3
Year: 2013 10 days
Not Collected
10 9 9 days MET
8 days 8 days

PERFORMANCE PLAN SUMMARY
FY 2014 Annual Performance Report and FY 2016 Annual Performance Plan—U.S. Department of Education 67
Continuous Improvement of the U.S. Education System Indicators of Success
Baseline Actuals Targets
2012 2013 2014 2014 2015 2016
Objective 5.3: Research, Evaluation, and Use of Evidence. Invest in research and evaluation that builds evidence for education improvement; communicate findings effectively; and drive the use of evidence in decision-making by internal and external stakeholders.
5.3.A. Percentage of select new3 (non-continuation) competitive grant dollars that reward evidence4,5
Year: 2012 6.5%
6.5% 9.35% 15.9% 9.0% MET
11.0% 14.0%
5.3.B. Number of peer-reviewed, full-text resources in the Education Resources Information Center (ERIC)2
Year: 2013 23,512
NA 23,512 27,292 24,712 MET
31,192 35,692
5.3.C. Number of reviewed studies in the What Works Clearinghouse (WWC) database
Year: 2013 9,535
NA 9,535 10,310 9,885 MET
10,235 10,585
Objective 5.4: Technology and Innovation. Accelerate the development and broad adoption of new, effective programs, processes, and strategies, including education technology.
5.4.A. Percentage of schools in the country that have actual Internet bandwidth speeds of at least 100 Mbps6
Year: 2013 20%
NA 20% 41% 30% MET
50% 70%
NA = Not applicable. 1 The data sets are available on Data.gov, www.ed.gov, NCES.ed.gov, studentaid.ed.gov, or other ed.gov subdomain websites. 2 The Department is revising the performance targets established in the FY 2013 Annual Performance Report and FY 2015 Annual Performance Plan for later years to be more ambitious. 3 Privacy Technical Assistance Center (PTAC) and Family Policy Compliance Office (FPCO). 4 “New competitive grant dollars that reward evidence” includes all dollars awarded based on the existence of at least “evidence of promise” in support of a project, per the framework in the Education Department General Administrative Regulations (34 CFR Part 75). Consideration of such evidence appears through: eligibility threshold (e.g., in the i3 program); absolute priority; competitive priority (earning at least one point for it); or selection criteria (earning at least one point for it). The percentage is calculated compared to the total new grant dollars awarded, excluding awards made by the Institute of Education Sciences, the National Institute on Disability and Rehabilitation Research, and technical assistance centers, with some exceptions. 5 This metric is aligned with an Agency Priority Goal. 6 The data source is changed from what was reported for the FY 2013 Annual Performance Report and FY 15 Annual Performance Plan. This change was made because the Department anticipates the Consortium for School Networking E-rate and Infrastructure Survey will be conducted annually and the results are publicly released. The reason this data source was not used last year is because the survey collected data on this metric for the first time this year. Data Sources and Frequency of Collection:
5.1.A. Data Strategy Team Data Inventory and the public ED Data Inventory at http://datainventory.ed.gov; quarterly
5.1.B. State Longitudinal Data Systems (SLDS) grant monitoring (monthly updates from states, annual performance reports, final performance reports, and site visits); quarterly
5.1.C. SLDS grant monitoring (monthly updates from states, annual performance reports, final performance reports, and site visits); quarterly
5.2.A. Case Tracking System (CTS); quarterly
5.3.A. Department calculations based upon multiple Department-controlled data sources, including G5; annually
5.3.B. Education Resources Information Center (ERIC); quarterly
5.3.C. What Works Clearinghouse (WWC); quarterly
5.4.A. Education Superhighway (for baseline), Consortium for School Networking (CoSN)/AASA E-rate Infrastructure Survey (for FY 2014 actual data); annually
Note on performance metrics and targets: These metrics were established as a part of the FY 2014–18 Strategic Plan. Metrics may be updated or revised to reflect awareness of more accurate data or clarifications. Such updates or
revisions are identified in footnotes.
PERFORMANCE PLAN SUMMARY
FY 2014 Annual Performance Report and FY 2016 Annual Performance Plan—U.S. Department of Education 68
Analysis and Next Steps by Objective
Objective 5.1: Data Systems and Transparency
Explanation and Analysis of Progress:
The implementation strategy for this objective is focused on providing technical assistance to states to help them successfully implement data systems that will serve their education needs. The Statewide Longitudinal Data Systems program works with a State Support Team (SST) of experienced government and industry experts in the area of data systems development. Much of the work needed for this objective is dependent upon state actions to implement SLDS grant plans. SLDS program staff assist by reviewing state plans and reports, deploying targeted technical assistance, and monitoring states’ progress. Weekly status report meetings are used to keep all Program Officers and Program Analysts aware of developments, and to focus needed resources on the states with the greatest need at that point in time.
Collaboration is key to the success of this objective. SLDS staff work frequently with other Department programs, including the RTT-ELC, as well as coordinate with Department of Labor’s Wage Data Quality Information (WDQI) Program.
A secondary implementation strategy is for the Department to model good data practices. For this reason, several performance metrics for objective 5.1 are designed around the Department rather than the states. The Department sets an example by highlighting its efforts to make data more accessible, as well as measuring the amount of web traffic on a specific data-centric web page.
The Department’s DST also supports this objective through its sponsorship of the ED Data Inventory and Common Education Data Standards (CEDS). As noted previously, the DST is an intra-agency group of volunteers who coordinate Department data activities. The Department received favorable publicity in FY 2014 for publishing an enhanced data inventory. While the inventory is a work in progress, the public may consult it to explore data that the Department holds.
CEDS successes in FY 2014 included staff work in conjunction with SLDS’ SST staff to assist state efforts to map data models to CEDS. The Department awarded a task order to continue technical support for CEDS later than initially planned, resulting in a gap in support services during the fiscal year. Despite this support interruption, the activities of CEDS related to this objective were successfully completed.
The Department is modeling transparency by publishing the ED Data Inventory. The system provides a new interface for public users to understand data collected and released by the Department. After the initial launch in November 2013 (i.e., the first quarter of FY 2014), work on the inventory has focused upon increasing the links between items in the inventory and publicly available Department data sets and upon improving functionality that will enable program offices to more directly interact with the inventory to ensure accurate representation of their data.
Challenges and Next Steps:
State support for longitudinal data system development remains the largest dependency and area of risk for progress in this area. The SLDS grant program was not designed to provide complete support for state system development and operations. Rather, SLDS program objectives depend upon additional state commitments. In FY 2014 several states spent time and
PERFORMANCE PLAN SUMMARY
FY 2014 Annual Performance Report and FY 2016 Annual Performance Plan—U.S. Department of Education 69
resources addressing internal forces threatening their continued support of the developing systems. Key barriers and challenges include districts’ and states’ limited resources; state procurement practices; lack of engagement with needed district and state stakeholders; difficulties with cross-agency governance and data sharing; ongoing leadership changes at SEAs, partner agencies, and at the state level; misconceptions about data collection and the Family Educational Rights and Privacy Act (FERPA), state laws, and other regulations related to privacy and confidentiality; lack of training on how to use data to make policy and instructional decisions; and concerns from stakeholders about the long-term sustainability of data systems without long-term federal funding.
Cross-sector linkages between K-12, early childhood, postsecondary, and workforce typically require a champion outside the SEA (e.g., a governor’s office), but political support for widespread data collection and linkage varies. Additionally, state education and labor agencies are relatively new partners so they are in the process of figuring out how to work together.
SLDS progress in FY 2014 included steps by many American Recovery and Reinvestment Act of 2009 (ARRA) and FY 2009 grantees to complete their grants. FY 2012 grantees still maintain active grants, and a new competition will be held in FY 2015. That competition will focus on the actual use of SLDS data within the state, built around policy “use cases” to meet state needs in topics ranging from the need to connect early childhood data to understanding return-on-investment for K-12 investments. Additional infrastructure and development costs will be included in the grant only when those “build” activities are essential to support or enable the state’s proposed use(s) of the system.
This year the Department made great strides with the ED Data Inventory and secured contractor resources for FY 2015 to support the development of a system to “feed” future data collections. Future plans also include a process for integrating all existing data collections.
The DST should continue connecting program officers from multiple offices across the Department that would benefit from state development or use of SLDS systems. Building such collaborations, possibly coordinated by the DST, could be beneficial to the Department for ensuring that progress continues to be made on objective 5.1.
Finally, the good practice that the Department wants to model to the states would be enhanced were the Department to take the DST to the next level in governance. Currently the DST is a volunteer organization that only coordinates data, rather than a true governance body.
Objective 5.2: Privacy
Explanation and Analysis of Progress:
The Department has focused on ramping up technical assistance around privacy to schools, districts, states, and third-party online educational services providers. Over the past year, the Department issued guidance regarding educational technology and transparency and provided technical assistance to states. Data collection on the completion of inquiries began in a structured fashion in 2013, creating a baseline of 10 days to respond to “cases,” which refers to requests for quick, informal responses to routine questions related to student privacy. While complex questions relating to FERPA, data security, and data management may necessitate internal discussion and research, less complex inquiries can now be addressed more quickly with recently released guidance. During the first half of FY 2014, a review of existing workflow processes specific to providing both formal and informal responses to requests for guidance and technical assistance led to process improvements in workflow efficiency. These new processes

PERFORMANCE PLAN SUMMARY
FY 2014 Annual Performance Report and FY 2016 Annual Performance Plan—U.S. Department of Education 70
included establishing a new preliminary triage step to better match inquiries and complaints to the appropriate staff and contractor resources, improving the case tracking and reporting metrics, and better collaboration and workflow management. The Department made selective use of contractor resources in support of federal efforts. As a result, the average time to respond to cases decreased from 10 to 9 days, meeting the Department’s FY 2014 performance target.
Additionally, the Department has multiple offices and TA centers providing assistance around privacy to the field. The Privacy, Information, and Records Management Services (PIRMS) office assisted in coordinating work among offices and TA centers. For example, the Department implemented biweekly meetings with partners such as the Office of Education Technology to present a coherent public position about privacy protections in personalized learning and with OSERS to provide TA around IDEA confidentiality provisions.
Challenges and Next Steps:
Resource constraints present a number of challenges in providing TA to approximately 14,000 school districts and several thousand institutions of higher education. While the primary target audience for TA is schools and school districts, the Department also provides support on a limited basis to the third-party vendor community. By working directly with vendors, schools and districts are afforded a greater assortment of privacy-friendly resources.
An additional challenge remains in updating systems and redesigning processes, both for technical assistance and complaints. FY 2014 was the first year the Department had significant metrics for evaluating service delivery, and the Department will continue to use these metrics to improve assistance provided to education stakeholders.
While the Department met the FY 2014 performance target in this area, continued progress is limited by resources and by the slowness of resolution for major policy issues relating to FERPA. Activity in the field on student privacy issues, from new state statutes, to policy statements, to pledges, to coordinating with other enforcement agencies presents a challenge in mobilizing proactive efforts.
Objective 5.3: Research, Evaluation, and Use of Evidence
Explanation and Analysis of Progress:
The Department, in consultation with OMB, has determined that performance toward this objective is making noteworthy progress. Systemic improvement requires research and evaluation so that decision makers at the national, state, and local levels have reliable evidence to identify the effective practices and to inform their actions. Supporting more discretionary grants with evidence will ensure scarce dollars are more likely to have the intended impact and will empower states and districts to become more dynamic learning organizations.
The Department’s Evidence Planning Group (EPG) continues to identify opportunities for discretionary grant programs to use evidence-related priorities or selection criteria in competitions. In FY 2014, a total of five competitions in OII, OESE, and OPE incentivized evidence in competitions through eligibility requirements, competitive preference priorities, and selection criteria. In addition, four competitions asked that applicants design evaluations of their proposed projects that will produce evidence. The Department surpassed the FY 2014 performance target for programs rewarding evidence in grant competitions. In addition, the EPG has met with each of the Department’s grant-making offices to discuss appropriate uses of
PERFORMANCE PLAN SUMMARY
FY 2014 Annual Performance Report and FY 2016 Annual Performance Plan—U.S. Department of Education 71
evidence in FY 2015 competitions. Projections include, at a minimum, the following discretionary grant programs that will reward evidence in their FY 2015 competitions:
Supporting Effective Educator Development
First in the World
Replication and Expansion of High-Quality Charter Schools
i3
TRIO—Student Support Services
The metric above tracks the Department’s progress in incentivizing applicants to build on evidence of “what works” and to generate new evidence in the course of their grants. Two other metrics—one related to the WWC and one to the ERIC—track the Department’s progress in providing unbiased, rigorous assessments of “what works” and in making education research widely available and easily accessible. The Department believes that progress in these metrics will contribute to the information flow that is essential to pushing forward in promising areas of education research and development.
The WWC reviews and summarizes studies of the effectiveness of education interventions and, during FY 2014, surpassed by 4.3 percent the Department’s target for the number of studies reviewed. Reviews of studies submitted by applicants to Department grant competitions contributed to the larger-than-anticipated number of studies reviewed.
Likewise, in FY 2014, the Department updated its ERIC selection policy to prioritize acquisition of peer-reviewed, full-text education research and began renegotiating agreements with content providers to enable ERIC to acquire the full text of peer-reviewed articles from research supported with FY 2012 or later funding from the Department’s IES. This work contributed to surpassing the FY 2014 annual performance target by 3.9 percent for the number of full-text, peer-reviewed resources in ERIC.
Challenges and Next Steps:
The process to collect data and track progress against the goal is still under development, and using evidence to award competitive grants entails a shift in culture and capacity building across the Department to do it well. Building evidence into competitions is also resource intensive in terms of program staff capacity, grantee capacity, and the review process. Additionally, goal targets are based on reasonable projections about which competitive grant programs may make new awards in this fiscal year, but the actual dollar amount awarded will depend on final appropriation amounts and other funding decisions and trade-offs. Grantees vary in their comfort with and understanding of evaluation and use of evidence, yet the Department has limited resources to support grantees in conducting rigorous evaluations that would produce evidence of effectiveness.
The Department’s leadership will continue explaining to internal stakeholders how the new evidence framework in EDGAR can be used in upcoming discretionary grant competitions to reward evidence. For example:
EPG is meeting with program offices throughout the Department to identify ways to incorporate evidence into discretionary grant competitions and in formula programs, particularly SIG.
PERFORMANCE PLAN SUMMARY
FY 2014 Annual Performance Report and FY 2016 Annual Performance Plan—U.S. Department of Education 72
EPG is also exploring ways to support program offices that choose to incorporate evidence and build capacity departmentwide. For example, EPG is exploring the establishment of a departmentwide contract that would provide for technical assistance to grantees on their evaluations, particularly impact evaluations that are intended to produce studies that meet WWC standards. Additionally, IES has collaborated with program offices to recruit peer reviewers familiar with the WWC standards, which will increase scrutiny of applicants’ proposed plans for rigorous evaluations. Finally, OII and IES are providing training to Department staff on logic models and other elements of the evidence framework to better inform our work at the Department and to provide better assistance to our grantees.
The Department’s RELs continue to develop resources and conduct webinars on the creation of logic models to support program design and evaluation.
EPG has compiled several evidence and evaluation resources and is in the process of identifying a central location in which to house them so that all Department staff can access them.
As the pace of evidence generation quickens, a key challenge for the WWC is to quickly update Intervention Reports—that is, summaries of all of the research on a given intervention (not just a summary of one study)—with new findings as they become available. With this in mind, the Department has begun a major effort to improve the WWC databases in order to support dynamically generated reports that can auto-update when a new study of an intervention is reviewed. The Department also intends for the WWC to use this database to create simpler, more graphic summaries of evidence for practitioner and policymaker audiences.
Next steps for the Department’s ERIC investment include incorporating a search function that allows users to identify studies in the ERIC database that were reviewed by the WWC and that met standards. In this way, the greater integration of the Department’s WWC and ERIC investments will contribute to the “virtuous cycle” of using and producing research evidence that also is supported by grant programs that incentivize use of research.
Objective 5.4: Technology and Innovation
Explanation and Analysis of Progress:
The Department of Education, in consultation with OMB, has determined that performance toward this objective is making noteworthy progress. The Department had many successes during FY 2014, including a call to the country’s 16,000 superintendents who lead district, charter, and private schools to join the Department in taking the Future Ready District Pledge. By taking this pledge, superintendents commit to develop, implement, and share technology plans with other districts so they can learn from successes and challenges along the way. The Future Ready District Pledge offers a roadmap to achieve successful personalized digital learning for every student and affirms a commitment by districts to move as quickly as possible toward the shared vision of preparing students for success in college, careers, and citizenship. Based on input from the superintendents, the White House hosted a “ConnectED to the Future” superintendent summit that recognized superintendents from across the country for their leadership and provided opportunities for leaders to share lessons learned and help disseminate promising approaches for transforming learning through technology from across the nation.
To support the work of the superintendents, the Department collected a series of best practices for connecting schools, providing devices, and preparing teachers to use technology effectively. These practices were published in guides released at the “ConnectED to the Future”
PERFORMANCE PLAN SUMMARY
FY 2014 Annual Performance Report and FY 2016 Annual Performance Plan—U.S. Department of Education 73
superintendent summit: Future Ready Schools: Empowering Educators through Professional Learning and Future Ready Schools: Building Technology Infrastructure for Learning. The Department also issued guidance to state and local superintendents to clarify that technology and digital learning can be an allowable use of more than $27 billion in federal funds under the ESEA and IDEA.
The Department provided direct support to the President’s ConnectED Initiative, which sets four clear goals to transition to digital learning across the country in five years: Upgraded Connectivity, Access to Learning Devices, Supported Teachers, and Digital Learning Resources (see Explanation and Analysis of Progress for objective 4.1 for more information). As part of that effort, the FCC is investing $2 billion over the next two years to expand high-speed Internet connectivity dramatically for America’s schools and libraries and another $2 billion for wireless connectivity within schools—connecting 20 million more students to next-generation broadband and wireless. In addition, private sector companies have also committed more than $2 billion to deliver cutting-edge technologies to classrooms, including devices, free software, teacher professional development, and home wireless connectivity.
In November 2014, the Department co-hosted, with the White House Office of Science and Technology Policy, a convening at the White House on innovation in higher education, which focused on providing expert guidance in technology models and issues relevant to postsecondary education, competency-based education, and workforce development. This kicked off an intensive collaboration with the White House and other agencies to conceptualize an Online Skills Academy in anticipation of a Department of Labor grant solicitation.
Finally, in response to the President’s call to action to create compelling educational software, in collaboration with the White House Office of Science and Technology Policy, the Department hosted the first-ever White House Education Game Jam, the culminating event of an education games week. Over the weekend of September 6–7, 2014, more than 100 game developers and dozens of teachers, learning researchers, and students gathered to develop fun, innovative ways to address content that teachers and students had previously identified as particularly difficult to teach and learn via traditional approaches. This will be followed by the creation of an app developer’s toolkit—the first guidance from the Department specifically for developers of educational software. The Department’s goal through the Game Jam and the development of the toolkit is to increase interest in the development of highly engaging tools and apps for education and show that college- and career-ready standards can be achieved in creative and engaging ways.
Challenges and Next Steps:
Several challenges remain in meeting the goals of this objective, including the fact that there is no ongoing funding for activities to support the development and adoption of new technologies. External barriers to success include educating the public about privacy and data security (leading to setbacks in the ability to use data to create personalized learning systems), difficulty measuring effectiveness without a robust evaluation program, and difficulty showing impact without data collection.
Risk mitigation strategies include requesting ongoing budget funding, seeking external foundation funding to support the work, and proposing rapid evaluation of effectiveness of technologies through the pooled evaluation fund authority. Concerns around privacy and data security are more difficult to predict, but continue to be addressed through outreach and communication efforts. Although external data sources indicate that the established FY 2014 performance target was met, more reliable and robust surveys of the state of the field in regards
PERFORMANCE PLAN SUMMARY
FY 2014 Annual Performance Report and FY 2016 Annual Performance Plan—U.S. Department of Education 74
to the appropriate and effective use of connectivity and technology will be key to accurately assessing the Department’s contributions to this goal.
Selected Strategies to Achieve Goal 5
Several themes run across Goal 5 implementation strategies. Collaboration will be a key strategy needed to implement all objectives, including collaboration within the Department, collaboration within government, and collaboration with the education community as a whole. Sufficient resources are also key to all objectives in Goal 5, both federal resources and (in the case of the SLDS program) state resources as well. Privacy is both a stand-alone objective and a theme in other objectives. The Department must address valid privacy concerns and dispel privacy myths.
Another theme for success in Goal 5 is developing sustainable, scalable solutions for using data and evidence in decision-making, which will require the Department to be both efficient and effective. Carefully reviewing studies against WWC standards is painstaking work and challenging to carry out at scale and in a short time frame. The Department is taking deliberate steps to increase the number of reviewers who are certified to carry out WWC reviews and to procure contracts that allow the Department to act nimbly to obtain these reviews.

PERFORMANCE PLAN SUMMARY
FY 2014 Annual Performance Report and FY 2016 Annual Performance Plan—U.S. Department of Education 75
Goal 6. U.S. Department of Education Capacity:
Improve the organizational capacities of the Department toimplement the Strategic Plan.
Goal Leader: Andrew Jackson
Objective 6.1: Effective Workforce. Continue to build a skilled, diverse, and engaged workforce within the Department. Objective Leader: Cassandra Cuffee-Graves
Metric 6.1.A: Staffing gaps percentage22
Metric 6.1.B: EVS engagement index23
Metric 6.1.C: Time to hire
Metric 6.1.D: Effective Communication Index24
Objective 6.2: Risk Management. Improve the Department’s program efficacy through comprehensive risk management, and grant and contract monitoring. Objective Leaders: Phil Maestri and Jim Ropelewski
Metric 6.2.A: Percentage of A-133 Single Audits Overdue for resolution
Metric 6.2.B: Compliance rate of contractor evaluation performance reports25
Objective 6.3: Implementation and Support. Build Department capacity and systems to support states’ and other grantees’ implementation of reforms that result in improved outcomes, and keep the public informed of promising practices and new reform initiatives. Objective Leader: Heather Rieman
Metric 6.3.A: Percentage of states who annually rate the Department’s technical assistance as helping build state capacity to implement education reforms
Objective 6.4: Productivity and Performance Management. Improve workforce productivity through information technology enhancements, telework expansion efforts, more effective process performance management systems, and state-of-the-art leadership and knowledge management practices. Objective Leaders: Danny Harris, Cassandra Cuffee-Graves, and Denise Carter
Metric 6.4.A: Number of ED information technology (IT) security incidents
22 Percent resulting from dividing number of all agency positions into unfilled agency vacancies. 23 Based on positive Federal Employee Viewpoint Survey (FEVS, also referred to as “EVS”) responses. 24 Based on positive FEVS responses. 25 As reported in the Past Performance Information Retrieval System (PPIRS) reporting tool at www.ppirs.gov.
Government use of PPIRS is required by Federal Acquisition Regulation Subpart 42.15, and governmentwide annual reporting performance targets are set by the Office of Management and Budget in the March 6, 2013, memorandum titled, “Improving the Collection and Use of Information about Contractor Performance and Integrity.” The PPIRS compliance metric “calculates the number of completed evaluations against the contract actions that should have had an evaluation completed. This number is displayed as a percentage” (https://www.cpars.gov/cparsfiles/pdfs/Improving_Compliance.pdf).

PERFORMANCE PLAN SUMMARY
FY 2014 Annual Performance Report and FY 2016 Annual Performance Plan—U.S. Department of Education 76
Metric 6.4.B: EVS Results-Based Performance Culture Index26
Metric 6.4.C: EVS Leadership and Knowledge Management Index27
Metric 6.4.D: Total usable square footage
Metric 6.4.E: Rent cost
Goal 6 Discretionary Resources
$0 $500 $1,000 $1,500 $2,000 $2,500
FY 2014
FY 2015
FY 2016
$481
$469
$533
(Dollars in millions)
Major Discretionary Programs and Activities28 Supporting Goal 6 Performance Metrics [Dollars in Millions]
POC Account Obj. Program FY 2014
Appropriation FY 2015
Appropriation
FY 2016 President’s
Budget
OIG OIG Office of Inspector General 58 58 59
DM/PA Program Administration: Building modernization - - 14
DM/PA Program Administration: Salaries and expenses 423 411 460
TOTAL, GOAL 6 481 469 533
NOTES: Many programs may have sub-activities that relate to other goals. Detail may not add to total due to rounding.
Public Benefit
To ensure the achievement of the Department’s mission critical objectives, grants and contract management will remain a strategic focus for improvement in long- and short-term initiatives. Additionally, strengthening human capital strategies, competencies and resources, along with
26 Based on positive FEVS (also referred to as “EVS”) responses. 27 Based on positive FEVS responses. 28 All the programs listed are discretionary programs, as distinct from mandatory programs. These include both competitive and non-competitive programs.

PERFORMANCE PLAN SUMMARY
FY 2014 Annual Performance Report and FY 2016 Annual Performance Plan—U.S. Department of Education 77
the continuous improvement of IT security and technologically enhanced work environments, continue to be priorities needed to support those objectives. The stated initiatives aim to support grantees, schools, students, families, and communities in achieving their educational and economic goals, while also continuing to hold recipients of the Department’s funding accountable to clear financial requirements and legal obligations.
The Department will also continue to focus on human capital management and acquire and build a skilled and knowledgeable workforce; rethink how it monitors and intervenes with high-risk grantees, as well as contractors; enhance workforce productivity through information technology and performance management; and transform the way the Department interacts with states, districts, institutions of higher education, and other grantees and stakeholders across the country. The expected transformation will result in improved performance results, increased stakeholder collaboration, and greater employee engagement.
In FY 2014, the Department developed a new approach to workforce and succession planning and used a strategic approach to identify organizational capabilities, establish areas of expertise and challenges, and to continue building a sustainable, skilled workforce.
Goal 6: Details
U.S. Department of Education Capacity
Indicators of Success Baseline
Actuals Targets
2012 2013 2014 2014 2015 2016
Objective 6.1: Effective Workforce. Continue to build a skilled, diverse, and engaged workforce within the Department.
6.1.A. Staffing gaps percentage
Year: 2013 15%
Not Collected
15% 4% 15% MET
15% 15%
6.1.B. EVS engagement index1
Year: 2012 64.7%
64.7% 66% 67% 66.0% MET
69% 71%
6.1.C. Time to hire2 Year: 2013
65% Not
Collected 65% 85%
66% MET
68% 69%
6.1.D. Effective Communication Index3
Year: 2012 48%
48% 49.6% 50% 49% MET
50% 51%
Objective 6.2: Risk Management. Improve the Department’s program efficacy through comprehensive risk management and grant and contract monitoring.
6.2.A. Percentage of A-133 Single Audits Overdue for resolution
Year: 2012 57%
57% 52% 37% 50% MET
43% 37%
6.2.B. Compliance rate of contractor evaluation performance reports
Year: 2013 85%
Not Collected
85% 97% 95% MET
100% 100%
Objective 6.3: Implementation and Support. Build Department capacity and systems to support states’ and other grantees’ implementation of reforms that result in improved outcomes, and keep the public informed of promising practices and new reform
initiatives.
6.3.A. Percentage of states who annually rate the Department’s technical assistance as helping build state capacity to implement education reforms
Year: 2013 54%
Not Collected
54% 75% 58% MET
67% 77%
Objective 6.4: Productivity and Performance Management. Improve workforce productivity through information technology enhancements, telework expansion efforts, more effective process performance management systems, and state-of-the-art
leadership and knowledge management practices.
6.4.A. Number of ED IT security incidents4
Year: 2012 756
756 755 445 718 MET
682 648
6.4.B. EVS Results-Based Performance Culture Index
Year: 2012 53%
53% 54% 56% 54% MET
56% 57%
6.4.C. EVS Leadership and Knowledge Management Index
Year: 2012 60%
60% 61% 61% 61% MET
62% 63%

PERFORMANCE PLAN SUMMARY
FY 2014 Annual Performance Report and FY 2016 Annual Performance Plan—U.S. Department of Education 78
U.S. Department of Education Capacity
Indicators of Success Baseline
Actuals Targets
2012 2013 2014 2014 2015 2016
6.4.D. Total usable square footage5
Year: 2012 1,563,641
1,563,641 1,573,317 1,533,239 1,525,937 NOT MET
1,525,937 1,459,937
6.4.E. Rent cost6 Year: 2014
$74.3M $64.6M $71.7M $74.1M
$74.3M MET
$80.3M $80.3M
NA = Not applicable. 1 The Department is revising the performance targets established in the FY 2013 Annual Performance Report and FY 2015 Annual Performance Plan for later years to be more ambitious. 2 Time from the date the hiring request is received in HCCS to the initial employment offer. 2013 data are based on OPM’s 80-day model. During Quarter 3 of FY 2014, the Department began basing time-to-hire on 90 days, which factors in position classification at the beginning of the hiring cycle, to provide greater accuracy and improve reengineering effort to gain efficiencies. The baseline data are not being changed due to the nominal difference in the time-to-hire when reviewing the number of actions processed in each quarter. 3 Positive response rate to FEVS (also referred to as “EVS”) questions 53, 58, and 64. 4 An incident, as defined under federal guidelines, is a violation of computer (cyber) policy or practices. Some incidents, by nature, are significant and require reporting to the Department of Homeland Security (DHS) United States Computer Emergency Readiness Team (US-CERT). The significant reportable incidents are associated with unauthorized access; successful denial of service attacks; successful installation and execution of malicious code; and improper usage—i.e., personally identifiable information (PII) breaches. 5 Baseline updated to reflect previous year’s data. 6 The Department of Education currently leases 27 buildings, occupying 1,533,239 usable square feet of space, costing $74.3M in FY 2014. By FY 2018, the Department will reduce its number of leases to 25 and its space footprint from 1,533,239 to 1,202,319 (21%). Without the above footprint reductions, the Department’s FY 2018 rent costs would escalate to $91M; however, the Space Modernization Initiative reduces the FY 2018 cost by $23.5 million (25.7%) to $67.8M. Rent savings in FY 2015–17 are offset by rent escalations in those fiscal years. Assumptions: 1) All leased buildings: 2% is applied for anticipation of CPI (Consumer Price Index) annual increases on the anniversary date of the active lease/occupancy agreement (OA); and 2.5% is applied for anticipation of annual tax increases; 2) All federal buildings: 2.5% is applied for operating cost escalations on the anniversary date of the active OA; 3) 20% is applied to all federal buildings after an OA has expired and a new OA is unavailable. (Projected increase on the appraisal); 4) 40% is applied to all leased buildings after an OA has expired and a new OA is unavailable. (Projected increase on the market rent); 5) If a new OA is unavailable, 3 months early rent is applied to all buildings that are relocating due to possible Department delays. Example: Changes made to the designs after space specifications are completed; and 6) 3 months late rent is applied to all buildings that are relocating due to possible Department delays. Example: Delays in returning space back to rentable condition. Actual for FY 2014 varies slightly from baseline to reflect 4th quarter data versus baseline established in 1st quarter. Data Sources and Frequency of Collection:
6.1.A. Mission Critical Occupation (MCO) Staffing Gap Report; quarterly
6.1.B. Office of Personnel Management (OPM) Federal Employee Viewpoint Survey (FEVS); annually
6.1.C. Workforce Transformation Tracking System (WTTS) and Entrance on Duty System (EOS); quarterly
6.1.D. OPM Federal Employee Viewpoint Survey (FEVS); annually
6.2.A. Office of the Chief Financial Officer’s (OCFO) Audit Accountability & Resolution Tracking System (AARTS); annually
6.2.B. Past Performance Information Retrieval System (PPIRS) www.ppirs.gov “PPIRS Compliance Report”; annually
6.3.A. The Reform Support Network Annual State and CoP Leads Survey (administered Q3 2014); annually
6.4.A. Operational Vulnerability Management Solution (OVMS) System; quarterly
6.4.B. OPM FEVS; annually
6.4.C. OPM FEVS; annually
6.4.D. Department’s Master Space Management Plan; annually
6.4.E. Department’s Master Space Management Plan; annually
Note on performance metrics and targets: These metrics were established as a part of the FY 2014–18 Strategic Plan. Metrics may be updated or revised to reflect awareness of more accurate data or clarifications. Such updates or
revisions are identified in footnotes.

PERFORMANCE PLAN SUMMARY
FY 2014 Annual Performance Report and FY 2016 Annual Performance Plan—U.S. Department of Education 79
Analysis and Next Steps by Objective
Objective 6.1: Effective Workforce
Explanation and Analysis of Progress:
The Department’s strategic goals support postsecondary education, career and technical education, adult education, elementary and secondary education, early learning, equity, and continuous improvement of the United States education system. To accomplish this, the Department’s workforce must be in the right position, at the right time, and with the right skills, led by skilled and engaging supervisors and managers. The Department is revising supervisory training to expand core skills such as human capital management, budgeting, and information technology, and it will be published by the end of FY 2015. The Department is focusing on enhancing employee productivity by aligning priorities and goals at every level in the organization with the Department’s strategic objectives. The Department has seen incremental progress in FEVS results. Since 2010, the Department has improved scores in the Employee Engagement Index of the FEVS from 62.6 percent to 66.6 percent in 2014. In FY 2015, the Department will implement a 12-month engagement strategy based on the FEVS results and monitor progress continuously.
The Department has an important role to play in providing differentiated support and technical assistance to those pursuing this challenging work—even while continuing to improve the quality and reduce the burden of its fundamental stewardship function. To do so, the Human Capital Office worked with all Departmental offices to use the Workforce Transformation and Tracking System (WTTS). This system allows the Department to track the hiring of employees with the right skills. In conjunction with the Department’s Talent Management System, career paths and developmental plans help retain and train Department employees.
Human capital management plays a critical role in the Department’s ability to fulfill its mission. By effectively planning for workforce changes, addressing skill gaps, and providing options for recruitment, staffing, and retention, the Department is better poised to provide consistent oversight, execution, and support for its various programs.
Challenges and Next Steps:
The Department and its principal offices (POs) will evaluate offices’ current and future competency needs and begin recruiting and hiring to meet those needs. Each PO must continue its efforts of evaluating each position prior to its becoming vacant to determine where there are opportunities to begin internal job sharing or training, while building pipelines for entry level personnel. The Department will continue working with POs to ensure current staff are receiving the right training to meet the mission needs and future hiring of staff is based on those needs. The Department realizes the challenge of budget constraints coupled with low attrition, which can limit the ability to hire under current employee ceilings.
Objective 6.2: Risk Management
Explanation and Analysis of Progress:
Risk management plays a critical role in enhancing the capacity of grantees to implement needed reforms. It helps assess the ability of applicants to fulfill grant requirements, focus grant monitoring efforts, and identify performance challenges that can be addressed through measures such as enhanced technical assistance. Risk management is also an essential aspect of contract monitoring, which is achieved by actively assessing program and
PERFORMANCE PLAN SUMMARY
FY 2014 Annual Performance Report and FY 2016 Annual Performance Plan—U.S. Department of Education 80
performance risks inherent in contracts through oversight and support and issuance of policy and guidance to program and contract officials.
The Department significantly reduced the number of overdue audits by resolving more audits timely and reducing the backlog of existing overdue audits. Of all A-133 audits that were unresolved at the end of FY 2014, only 37 percent were overdue. The Department also greatly increased compliance with contractor evaluation performance reporting requirements, and has the best compliance rate in the federal government with 97 percent.
Challenges and Next Steps:
The Department will continue supporting offices with the greatest number of overdue audits to reduce the number of overdue audits. In addition, the Department will increase compliance with contractor evaluation performance reporting requirements. In FY 2014, the system for recording past performance changed to allow contractors a 60-day comment period instead of the previous 30-day period. Unless the contractor comments earlier, the agency receives credit for compliance only after this 60-day comment period. In FY 2015, every Government agency’s compliance target is 100 percent, even though only two agencies met their FY 2014 performance targets (Departments of Education and Housing and Urban Development), and the Department of Education was the only agency to exceed 95 percent. Based on performance to date and the change to the contractor comment period, reaching the remaining 5 percent to achieve the 100 percent target will be a challenge and require significant Department resources. The Departmental management will work with Contracting Officers to ensure that Past Performance Information Retrieval System (PPIRS) compliance metrics reflect accurate information on outstanding contractor evaluation performance reports.
Objective 6.3: Implementation and Support
Explanation and Analysis of Progress:
One of the primary challenges facing SEAs today is the shift from a compliance focus to one of building capabilities and capacity needed to lead education reform initiatives effectively and support school districts and schools with performance management. Over the past 12 years, SEAs have taken on stronger leadership and policy development roles, and key federal programs, such as programs under the ESEA as amended by the No Child Left Behind Act of 2001 (NCLB), including SIG, as well as programs under ARRA, such as RTT, have also helped to create a more robust role for SEAs and their increasing role of supporting districts and schools.
In response to this new environment, the Department recently implemented a reorganization of OESE to consolidate a number of offices into the new OSS. The OSS is designed to provide improved state-centered support across related Department programs. The Department is using this reorganization to rethink, redesign, and rebuild core grant administration functions in order to provide more transparent, higher quality, and better differentiated support to states. The reorganization was approved in the fourth quarter of FY 2014 and the OSS was created on October 5, 2014. The matrix organization model adopted by the OSS ensures that a state has a primary contact within the Department and this individual serves as the liaison across key state-administered grant programs and major federal funding streams that flow to each state and district. By consolidating processes and technical assistance, the Department will be able to more effectively customize its outreach to individual states and model the critical partnerships that states should have with their respective districts. The OSS builds on the state-focused
PERFORMANCE PLAN SUMMARY
FY 2014 Annual Performance Report and FY 2016 Annual Performance Plan—U.S. Department of Education 81
support work that the Department has undertaken over the past several years through RTT, SIG, and ESEA Flexibility.
Challenges and Next Steps:
Transitioning to the new OSS is a significant change that will take time to implement fully. OESE and OSS leadership are establishing new processes and procedures, and the transition will take place gradually over the next year. Challenges include clear delegation of responsibilities, appropriate professional development and support for staff, and relevant outreach and communication internally and externally.
Building new and stronger relationships with states and stakeholders who are affected by Department reforms and grants requires significant outreach and effort. The Department will have continuous communication with stakeholders and grantees to share lessons learned across grantees and non-grantees and with the general public. The Department will use its communications channels, such as its printed publications, the Homeroom blog site, the PROGRESS blog, the Education Reform Hub, an OSS technical assistance site, YouTube videos, and speeches to tell the stories of success so that the public can learn from reforms being implemented at the state and local levels.
Objective 6.4: Productivity and Performance Management
Explanation and Analysis of Progress:
The Department of Education, in consultation with OMB, has highlighted this objective as a focus area of improvement. The Department’s workforce must be in the right position, at the right time, with the right skills, and at the right cost, led by skilled and engaging supervisors and managers to support its mission. The Department is focusing on enhancing employee productivity and aligning performance management practices with Departmental strategic objectives by aligning priorities and goals at every level in the organization. The Department must manage changing technology, a more mobile workforce, and increased efficiency of workspace.
To date, the Department eliminated staffing classification backlogs, reduced the shortage of trained human capital practitioners, and established performance metrics to align with competency-based training. The Department established performance metrics for all Office of Management employees to include customer service, operations or production work, and general project management. In addition, the performance metrics established a link to all federal certification programs. All employees’ certification programs are part of their Individual Development Plans and are tailored to their areas of responsibility. Both employees and managers are held accountable for performance standards at their grade level.
The Department reduced the number of reportable IT security incidents during FY 2014. The reduction is due to a better educated workforce, improved IT security response capabilities, and the introduction of new automated capabilities that intercept a hostile cyber activity or alert IT security response teams before such an adverse event becomes an actual IT security incident.
The Department completed development of a five-year project plan and a business case of the Department’s Space Modernization Program. Such a major project involves many underlying elements to ensure success, including training managers for transition, improving management of a more remote workforce, and changing the nature of a performance culture. The Department revised the related internal guidance document with targets for space utilization rates consistent with OMB and the General Services Administration’s (GSA) Freeze the Footprint program

PERFORMANCE PLAN SUMMARY
FY 2014 Annual Performance Report and FY 2016 Annual Performance Plan—U.S. Department of Education 82
requirements. The Department is also updating its telework policies and helping managers learn to oversee employees when they are not in the office physically. The Department has started to implement a more robust telework program by providing mobile workers with 21st century IT tools, strengthening performance management practices, promoting cultural acceptance of a mobile workforce, and offering a new practical training workshop on how to implement telework policies effectively. Finally, the Department increased records management assistance to POs as they assessed their current records inventory and identified records that could be purged, archived, or digitized to reduce their file space footprint.
Challenges and Next Steps:
POs should focus on developing and achieving measurable results within their human capital performance metrics. Training managers on writing meaningful performance metrics, providing ongoing feedback, and providing clear examples of accomplishments for each performance level will be critical for both managers and employees. Future metrics must align with the Department’s strategic plan and should cascade from executive, to manager and supervisor, and to the workforce, ensuring that all Department employees have performance metrics that link to the strategic plan.
The Department continued implementation and optimization of its automated response capabilities. These efforts will reduce the number of security incidents in FY 2015 and FY 2016. Additional training for the Department’s third-party partners will reduce the potential for Personally Identifiable Information (PII) disclosures and ensure the proper protection of our customers’ information.
Employee engagement is a critical component in supporting the changes to workspace, work patterns, and technology. The General Services Administration will continue to provide support through its National Workplace Engagement program. The Department will work with each PO to make the overall transition successful. Continued development of a robust telework program by the Department will add to the success of the overall program.
Selected Strategies to Achieve Goal 6
The Department must support the learning and development of its leaders so that they can assess employee competency gaps and developmental needs, distinguish performance versus conduct issues, and provide meaningful and ongoing feedback to employees so that employees are accountable for producing or exceeding the expected results.
The cybersecurity focus will remain on data protection and control. The Department will continue implementing various capabilities to control the flow of sensitive information, and prevent access to related systems, data, or other critical information and infrastructure by unauthorized individuals. These new capabilities with existing protective measures will ensure the protection of employee and customer data.
Finally, the Department must work with POs to develop customized change management strategies necessary to successful redesign and reduction of the Department’s space. By consolidating units, renegotiating leases, and making reductions in the needed space, the Department will cut its overall space footprint by more than half.

PERFORMANCE PLAN SUMMARY
FY 2014 Annual Performance Report and FY 2016 Annual Performance Plan—U.S. Department of Education 83
Management Priorities and Challenges
The Department continues to make a substantive commitment and investment in improving its working capacity and infrastructure. Goal 6 of the Strategic Plan (U.S. Department of Education Capacity: Improve the organizational capacities of the Department to implement the Strategic Plan) supports those aims by ensuring that the Department’s hiring, staffing, training, culture, systems, and procedures enable the Department to deliver programs and resources in ways that are faster, smarter, and better year after year. Thus, the commitment and the investments are both short- and long-range in nature.
Examples of the Department’s employee-focused strategies are seen in prioritizing greater employee engagement, diversity, and inclusion, and on expanding leadership and knowledge management efforts in mission-support operations such as IT customer service. Because the Department aims to be a best place to work, the Department has created a workgroup on employee engagement to work on key areas for improvement, including formalized supervisor and peer recognition, intensive manager training and development pilots, increased development and usage of telework policies and flexibilities, and employee wellness, lifestyle balance, and volunteerism campaigns.
IT delivery is another area where the Department has committed considerable resources. The Office of the Chief Information Officer has pushed for greater technology innovation to improve the workload capacity for employees. Efforts to improve security, gain efficiency in storage, improve network service and responsiveness, increase system speed, and increase the footprint of Wi-Fi and other wireless and mobility solutions in the Department’s facilities and for those working remotely, have significantly improved the employee computing experience. These efforts have clarified the Department’s needs and provide a clear vision for how technology can help employees in their work.
The Department has also made significant progress on Cybersecurity, one of the President’s mission CAP goals. During FY 2014, the Department significantly reduced the number of threats and risks, including security breaches. For example, the technology group saw a nearly 150 percent increase in the number of grantees who now use personal identity verification (PIV) to electronically sign grant award notices. These advances resulted from the Department’s proactive strategies to seek innovation.
Office of Inspector General’s (OIG) Management Challenges
OIG works to promote efficiency, effectiveness, and integrity in the programs and operations of the Department. Through audits, inspections, investigations, and other reviews, OIG continues to identify areas of concern within the Department’s programs and operations and recommend actions the Department should take to address these weaknesses. The Reports Consolidation Act of 2000 requires the OIG to identify and report annually on the most serious management challenges the Department faces. The GPRA Modernization Act of 2010 requires the Department to include in its agency performance plan information on its planned actions, including performance goals, indicators, and milestones, to address these challenges.
Last year OIG presented five management challenges. Although OIG noted some progress by the Department in addressing these areas, each remains as a management challenge for FY 2015.

PERFORMANCE PLAN SUMMARY
FY 2014 Annual Performance Report and FY 2016 Annual Performance Plan—U.S. Department of Education 84
The FY 2015 management challenges are:
(1) Improper Payments, (2) Information Technology Security, (3) Oversight and Monitoring, (4) Data Quality and Reporting, and (5) Information Technology System Development and Implementation.
These challenges reflect continuing vulnerabilities and emerging issues faced by the Department as identified though OIG’s recent audit, inspection, and investigative work.
The full report is published by the OIG. To view the full report, go to: http://www2.ed.gov/about/offices/list/oig/managementchallenges.html.
OIG noted some progress by the Department in addressing the FY 2014 management challenges. The Department remains committed to improved governance and better business processes. Management has worked closely with OIG to gain its perspective about the Department’s most significant management and performance challenges.
Lower-Priority Program Activities
The Cuts, Consolidations and Savings volume of the President’s Budget identifies the lower-priority program activities, where applicable, as required under the GPRA Modernization Act of 2010, 31 U.S.C. 1115(b)(10). The public can access the volume at http://www.whitehouse.gov/omb/budget.