Performance of X 258 third-stage motor in delta 36 (OT-3) · PERFORMANCE OF X 258 THIRD-STAGE MOTOR...
41
Lc_ D- 4050 z c 4 wl 4 TN . , i PERFORMANCE OF X 258 THIRD-STAGE MOTOR ON DELTA 36 (OT-3) by James E. Schmidt Goddard Space Flight Center Greenbelt, Md NATIONAL AERONAUTICS AND SPACE ADMINISTRATION WASHINGTONYD, i.' '1. '- J~u~y,~isa7 ', ' i, 1 1 , \.y, J & 2 . -_ 2 . . ,g 11 f https://ntrs.nasa.gov/search.jsp?R=19670022080 2018-06-28T01:42:41+00:00Z
-
Upload
vuongduong -
Category
Documents
-
view
215 -
download
0
Transcript of Performance of X 258 third-stage motor in delta 36 (OT-3) · PERFORMANCE OF X 258 THIRD-STAGE MOTOR...

Lc_ D- 4050
z c 4 wl 4
TN
. ,
i
PERFORMANCE OF X 258 THIRD-STAGE MOTOR ON DELTA 36 (OT-3)
by James E. Schmidt Goddard Space Flight Center Greenbelt, M d
NATIONAL AERONAUTICS A N D S P A C E ADMINISTRATION WASHINGTONYD, i.' '1. ' - J ~ u ~ y , ~ i s a 7 ', ' i , 1 1 ,
\.y, J & 2 . -_ 2..
,g 11 f
https://ntrs.nasa.gov/search.jsp?R=19670022080 2018-06-28T01:42:41+00:00Z
TECH LIBRARY KAFB, "l
1llllllllllll1111llllllllllllllllllllllllllll 0130771
NASA TN D-4050
PERFORMANCE O F X 258 THIRD-STAGE MOTOR
ON DELTA 36 (OT-3)
By James E . Schmidt
Goddard Space Flight Center Greenbelt , Md.
NATIONAL AERONAUTICS AND SPACE ADMINISTRATION
For sole by the Clearinghouse for Federal Scientific and Technical Information Springfield, Virginia 22151 - CFSTI price $3.00
I

ABSTRACT
This report summarizes the results of the in-flight performance measurements made on the X 258 solid-propellant rocket motor used as a third stage of the Delta Launch vehicle in placing an Operational Tiros (OT-3) into orbit. Delta 36 (OT-3) third-stage in-flight perform- ance was obtained using an FM/FM telemetry package whose instru- mentation indicated near-nominal values for total impulse, propellant specific impulse, incremental velocity, burning time, acceleration-vs- time curves, and pressure-vs-time curves. Spin rates, spinup time, and separation were also nominal, but a coning motion of a 4.5 degree half-angle was experienced upon motor burnout, and both nozzle- deflection measurements and motor-case temperature measurements failed to account for this disturbance.
ii

CONTENTS
A b s t r a c t . . . . . . . . . . . . . . . . . . . . . . . . . . . . . . . . . . . . . . . ii
INTRODUCTION ................................. 1
INSTRUMENTATION .............................. 2
PERFORMANCE DATA PRESENTATION AND ANALYSIS. . . . . . 3
Total Impulse , Specif ic Impulse , and I n c r e m e n t a l Veloci ty . . 4 Third-Stage Spin R a t e . .......................... 5 Third-Stage Coning . . . . . . . . . . . . . . . . . . . . . . . . . . . . 6 Vibra t ion . . . . . . . . . . . . . . . . . . . . . . . . . . . . . . . . . . . 8
CONCLUSIONS . . . . . . . . . . . . . . . . . . . . . . . . . . . . . . . . . . 8
ACKNOWLEDGMENTS . . . . . . . . . . . . . . . . . . . . . . . . . . . . . 9
R e f e r e n c e s . . . . . . . . . . . . . . . . . . . . . . . . . . . . . . . . . . . . . 9
iii

PERFORMANCE OF X 258 THIRD-STAGE MOTOR ON DELTA 36 (OT-3)
by James E. Schmidt
Goddard Space Flight Center
INTRODUCTION
The Delta Launch vehicle from its inception until 1963 had used as third stage a solid- propellant rocket motor designated X 248 (Altair).* Delta 21 (launched 11/26/63) and all Deltas subsequent to Delta 25 (launched 8/19/66) have used the X 258 as third stage, replacing the X 248. The X 258 developed during the period 1961-1963 provided an improvement in total impulse of 20 percent over the X 248 within the same structural envelope and thus had come to be accepted as the fourth stage for Scout and the third stage for Delta. However, the X 258 performance history has been plagued by wide variations in flight performance, as compared with predicted behavior based on ground static test results. Instrumented in-flight measurements have generally shown a disturbance during X 258 burnout followed by some coning motion; on one occasion this was as much as 20 degrees half-angle.
The purpose of this report is to describe the results of the in-flight performance measure- ments made on the X 258 motor, Serial No. RH 88; this was used as the third stage of the Delta 36 launch which placed an Operational Tiros (OT-3) into orbit. Delta 36 was the thirteenth Delta to employ an X 258 for a third stage. The motor was instrumented to obtain longitudinal and radial acceleration, low-level longitudinal acceleration, chamber pressure, temperatures at 26 locations around the motor chamber walls and dome, and nozzle displacement using linear-motion transducers on three axes at four locations. Secondary instrumentation consisted of a vibration pickup, but vibration measurements are not included as a part of this report. All sensors fed their signals to a standard FM/FM telemetry package and the composite signal was transmitted to ground receiving stations on 256.2 MHz, using a 4-watt transmitter.
Delta 36 (OT-3) was successfully launched from Cape Kennedy, Florida, at 0741:23.7 GMT on February 3, 1966. Orbital parameters for the OT-3 spacecraft are shown in Table 1. Significant flight events are given in Table 2.
- *Manufactured by Allegany Ballistics Laboratory, Hercules Company.
1

11 Expected (DTO)
400
Perigee (NM) 400 Inclination (deg) 98.36
99.60
Table 2 Sequence of Launch Events.
Event I Expected (sec)
Actual
453.8
375.9
97.89
100.20
~
Liftoff (T + 0) Main engine cut off (MECO) Stage-II ignition Fairing ejection Second stage engine cut off (SECO) Third-stage spinup Separation/fire retros Third-stage ignition Third-stage burnout
*Transmitted by third-stage telemetry.
0722:OO.O GMT T + 146.2 (M = 0) M + 4 M + 84 M + 170.5 M + 595 M + 597 M + 610 M + 632.5
Actual (sec)
0741:23.7 GMT T + 145.3 M + 4 M + 84 M + 166.7 M + 595f M + 597* M + 608.4* M + 631.8*
The Delta 36 third-stage instrumentation package was designed to measure chamber pressure, case-wall temperature, nozzle deflection, and flight environmental vibration levels on the X 258. The case-wall-temperature and nozzle-deflection measurements were designed to gain insight into the cause of the onset of third-stage burnout coning. This coning can result in significant deviation in injection attitude for those spacecraft that have critical attitude restrictions.
Three theories have been proposed to explain the fact that coning is not present during burning and is initiated at burnout:
1 . Nozzle Deflection
Hydrotests have shown that the bond between the X 258 nozzle-attach ring and motor-aft dome sometime fails, causing a nozzle misalignment. During the transient condition at burnout when the chamber pressure is falling and the motor case is relaxing, the lateral component of thrust caused by a nozzle misalignment may impart a side-thrust disturbance which combines with vehicle spinning and results in coning.
2. Case Temperature
Upon exposure to the high temperatures of third-stage combustion, the fiberglass motor- case-aft dome may soften, resulting in a thrust misalignment or mass imbalance and conse- quently-coning at burnout.
3. Slug Movement
Aluminum and/or aluminum-oxide slag trapped in the motor during burn may be redistrib- uted in the motor asymmetrically at burnout, causing a dynamic imbalance.
INSTRUMENTATION
Of the three theorized causes of coning, the OT-3 telemetry package monitored only nozzle de- flection and motor-case temperature. In addition, the package measured low-level-longitudinal,
2
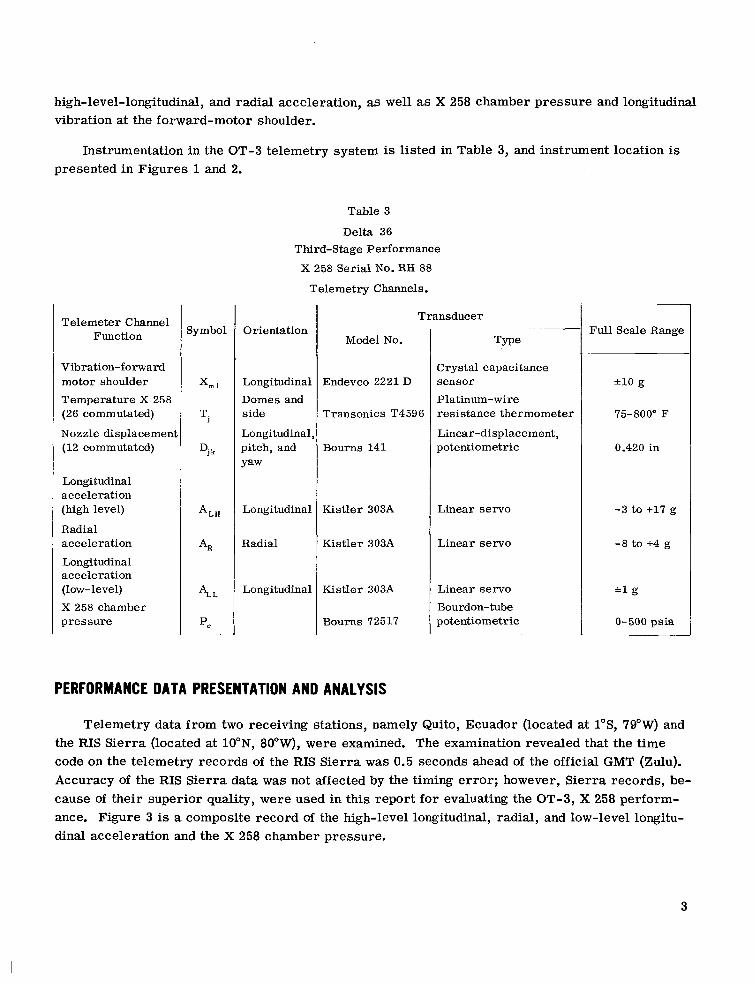
high-level-longitudinal, and radial acceleration, as well as X 258 chamber pressure and longitudinal vibration at the forward-motor shoulder.
Instrumentation in the OT-3 telemetry system is listed in Table 3, and instrument location is presented in Figures 1 and 2.
Table 3
Delta 36 Third-Stage Performance
X 258 Serial No. RH 88
Telemetry Channels.
Telemeter Channel Function
Vibration-forward motor shoulder Temperature X 258 (26 commutated)
Nozzle displacement (12 commutated)
Longitudinal acceleration (high level)
Radial acceleration
Longitudinal acceleration (low-level) X 258 chamber pressure
Orientation
Longitudinal Domes and side
Longitudinal pitch, and Yaw
Longitudinal
Radial
Longitudinal
Model No.
Endevco 2221 D
Transonics T4596
Bourns 141
Kis t le r 303A
K i s t l e r 303A
Kistler 303A
Bourns 72517
Transducer
Crystal capacitance sensor Platinum-wire resistance thermometer
Linear-displacement, potentiometric
Linear servo
Linear servo
Linear servo Bourdon- tube potentiometric
Full Scale Range
* lo g
'75-800" F
0.420 in
-3 to +17 g
-8 to +4 g
g
0-500 psia
PERFORMANCE DATA PRESENTATION AND ANALYSIS
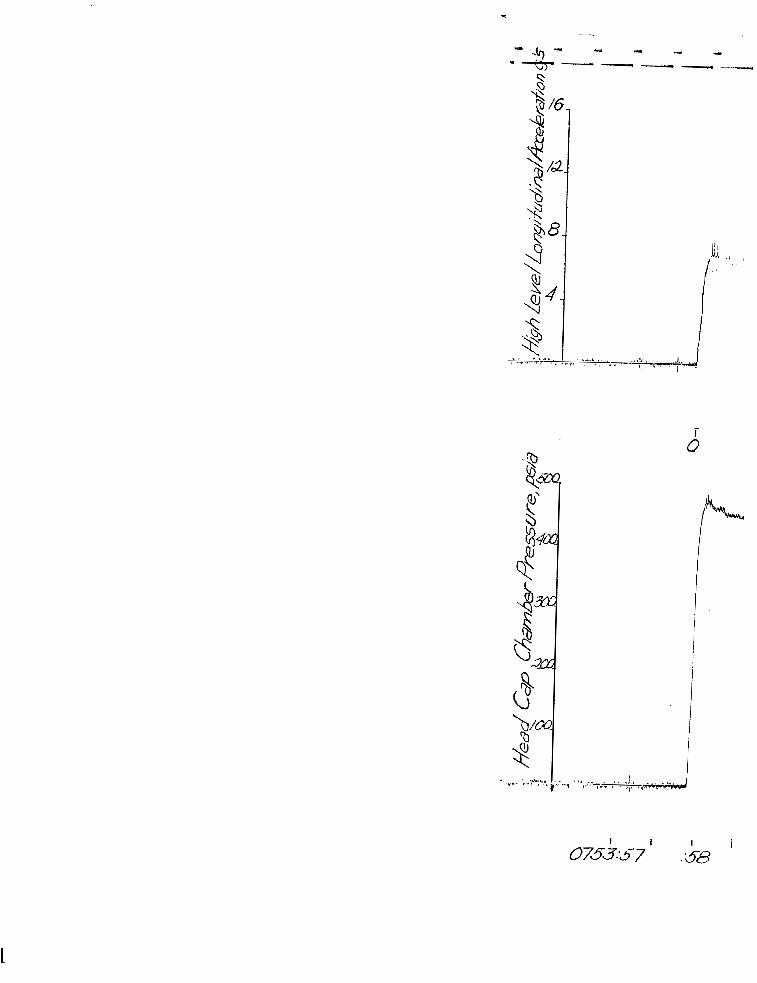
Telemetry data from two receiving stations, namely Quito, Ecuador (located at 1"S, 79"W) and the RIS Sierra (located at 10"N, 80°W), were examined. The examination revealed that the time code on the telemetry records of the RIS Sierra was 0.5 seconds ahead of the official GMT (Zulu). Accuracy of the RIS Sierra data was not affected by the timing error ; however, Sierra records, be- cause of their superior quality, were used in this report for evaluating the OT-3, X 258 perform- ance. Figure 3 is a composite record of the high-level longitudinal, radial, and low-level longitu- dinal acceleration and the X 258 chamber pressure.
3

I 111 111 .I I I I I I I I 1 I1 1 1 1 1 1 1 1111 11111 1 1 1 , . 111 1,111. ,1,.-..1. I I I, I I .I I I, .,I I .I , , , . , , ,.,,,. , .,-.
Total Impulse, Specific Impulse, and Incremental Velocity
X 258 motor impulse was determined by preparing an oscillograph record and integrating the expanded chamber pressure-time curves (Figure 4) by use of a planimeter. The chamber-pressure- time curve integration yielded a value of 9657 psia-sec. The value for chamber-pressure integral compares closely with the values from two previous instrumented third stages (OT-1, 9668 psia- sec a& OSO-B2, 9650 psia-sec (References 3 and 4). The total impulse, ITOT, was calculated using the formula:
where
c, = thrust coefficient A, = throat area, in2 pC = chamber pressure, psia to = X 258 ignition time, sec
t f = X 258 burnout time, sec.
The computed total impulse, using an average value of C, At of 14.5 determined from data for five static tested X 258 motors (Reference 3), yielded a result of 140,000 lb-sec. Propellant specific impulse, assuming a manufacturer’s quoted propellant weight of 501.7 lb, was 279.1 sec.
Comparison of chamber pressure and acceleration integrals revealed a disagreement of calcu- lated performance values and prompted a closer examination of the two channels of telemetry data. The ensuing examination revealed that the zero level of the high-level longitudinal-acceleration channel had shifted 0.2 g downward at third-stage ignition, thus indicating low X 258 performance. (It should be noted here that no shift in the zero level of the chamber-pressure channel occurred.) Using a corrected zero level, the acceleration-time curve was reintegrated to find the incremental velocity, AV , from the formula:
AV = It‘ adt ,
t 0
where
a = vehicle acceleration, ft/sec2 to = X 258 ignition time, sec t f = X 258 burnout time, sec.
4
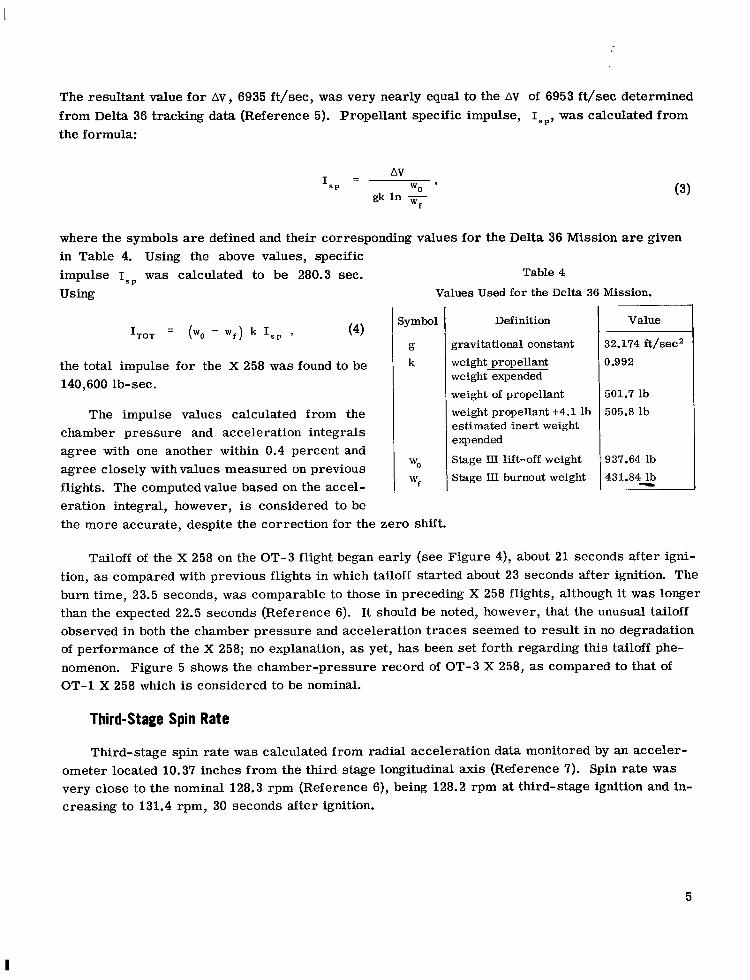
The resultant value for A v , 6935 ft/sec, was very nearly equal to the A v of 6953 ft/sec determined from Delta 36 tracking data (Reference 5). Propellant specific impulse, Is,, was calculated from the formula:
AV I s p = Wo ’
gk In - . w f
(3)
where the symbols are defined and their corresponding values for the Delta 36 Mission are given in Table 4. Using the above values, specific impulse was calculated to be 280.3 sec. Using
Table 4
Values Used for the Delta 36 Mission.
(4)
the total impulse for the X 258 was found to be 140,600 lb-sec.
The impulse values calculated from the chamber pressure and acceleration integrals agree with one another within 0.4 percent and agree closely withvalues measured on previous flights. The computedvalue based on the accel- eration integral, however, is considered to be
Definition
gravitational constant weight propellant weight expended
weight of propellant weight propellant +4.1 lb estimated inert weight expended
Stage III lift-off weight
Stage IJI burnout weight
Value
32.174 ft/sec2 0.992
501.7 lb 505.8 lb
937.64 lb 431.84Lb
the more accurate, despite the correction for the zero shift.
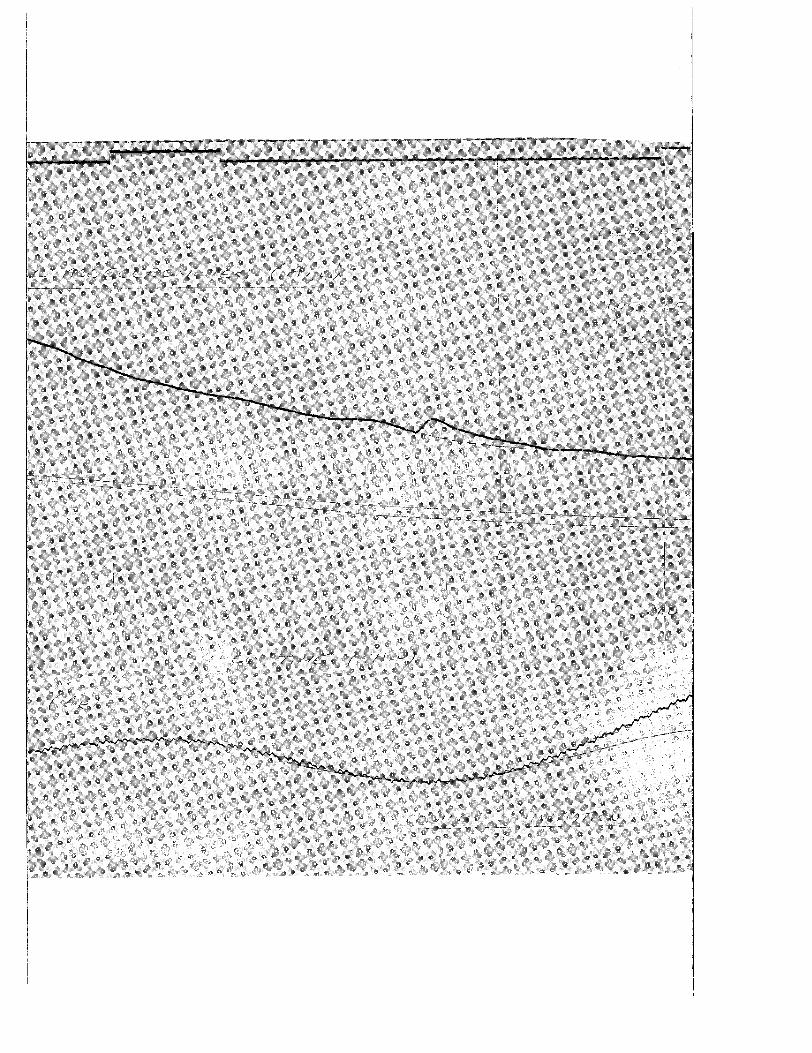
Tailoff of the X 258 on the OT-3 flight began early (see Figure 4), about 21 seconds after igni- tion, as compared with previous flights in which tailoff started about 23 seconds after ignition. The burn time, 23.5 seconds, was comparable to those in preceding X 258 flights, although it was longer than the expected 22.5 seconds (Reference 6). It should be noted, however, that the unusual tailoff observed in both the chamber pressure and acceleration t races seemed to result in no degradation of performance of the X 258; no explanation, as yet, has been set forth regarding this tailoff phe- nomenon. Figure 5 shows the chamber-pressure record of OT-3 X 258, as compared to that of OT-1 X 258 which is considered to be nominal.
Third-Stage Spin Rate
Third-stage spin rate was calculated from radial acceleration data monitored by an acceler- ometer located 10.37 inches from the third stage longitudinal axis (Reference 7). Spin rate was very close to the nominal 128.3 rpm (Reference 6), being 128.2 rpm at third-stage ignition and in- creasing to 131.4 rpm, 30 seconds after ignition.
5
I

Third-Stage Coning
Coning-Angle Magnitude
The coning half angle, A , was calculated from the equation
ALL ='my where Table 5 defines the symbols and their respective values transmitted by OT-3 telemetry. The value* for p is given below. The resulting value of A was 4.5 degrees.
Table 5
Values for Coning Determination.
Symbol
*L L
4
R
P
~~
Definition ~
0-pk-level longitudinal- accelerometer sinusoidal amplitude
low-level longitudinal- accelerometer sinusoidal frequency
third-stage spin rate radial distance from motor cen- terline to accelerometer
Value
7.41 ft/sec2
9.21 rad/sec
13.76 rad/se
0.898 f t
(5)
Coning ensued at approximately 0754:20.85, which coincides with third-stage burnout, as deter- mined from Figure 6 which is the oscillograph record of the high-level longitudinal and radial accelerometers respectively with time and radial acceleration scales expanded. Coning initiation was determined by inspecting the radial accelerometer trace to find a significant deviation from the pattern established during third-stage burning.
Nozzle Deflection
X 258 motor-nozzle attach-ring displacements were measured in the pitch (radial), yaw (cir- cumferential), and longitudinal (axial) directions by displacement gages mounted at four locations (shown in Figure 7) about the aft-motor shoulder. Nozzle displacements measured at the time of significant events are presented in Table 6. Axial-nozzle attach-ring displacements occurring before, after, and at the onset of coning are plotted in Figure 6. (The displacements plotted in Figure 6 are referenced to gage 4). Maximum nozzle-angle deflection due to the axial deflection
*L. A. Williams, Goddard Space Flight Center, Private communication.
6

Table 6
X 258 Nozzle Ring Deflection (OT-3).
Event
Displacement and Direction Before Separation After Separation Before Ignition
After Ignition
Before Burnout
During Burnout After Burnout
Displacement and Direction Before Separation After Separation Before Ignition
After Ignition Before Burnout
During Burnout After Burnout
Axial (+ Aft)
+z, +z, +z3 +z4 -10 -10 -15 -5
0 0 0 0
+110 +lo5 +115 +I15
+I10 +lo5 +120 +115
+65 +65 +65 +60
+lo +5 +5 +10
X Direction
+XI +x2 +x, +x4 -5 -15 -3 +20
0 0 0 0
+5 +10 + 5 0
-5 0 -5 -5
0 +5 -5 0 0 -5 0 0
Radial (+ Outward)
+Yl +x, -Y3 -x4 -20 -15 -15 -20
0 0 0 0
0 +10 0 0
-10 0 +10 +5
-10 +5 +5 0
-5 0 +5 0 ~-
Y Direction
+Yl +Y2 +Y3 +Y4 -20 0 +15 0
0 0 0 0
0 +5 0 +10
-10 -10 -5 0
-10 -10 -5 0
-5 0 - 5 0
Rotational (+ CW)
+XI -Y* -x3 +Y4 -5 0 +3 0
0 0 0 0
+5 -5 -5 +10
-5 +10 +5 0
0 +10 +5 0 0 0 + 5 0
Zulu Time Hr/Min:Sec
0753
0753:50
0753:58 0754: 15
0754:20 0754:25
occurred during the burnout phase, and at coning initiation was found to be 0" 1.41'. Angular de- flections resulting from pitch and yaw displacements were too small to be worthy of consideration.
Difficulty was encountered in defining nozzle deflection from the measurements made by the displacement gages, because the shoulder on which the mounting bracket assemblies of the dis- placement gages were affixed was also subject to movement caused by motor-case expansion dur- ing burning. The displacements recorded by the gages, then, were actually the combined relative movements of the nozzle-attach-ring and the aft-motor shoulder. The gage measurements do make possible, however, an estimate of an upper boundary for nozzle-angle deflection. The maximum nozzle-angle deflection, 0" 1.411, indicated by the displacement gages at the time when coning was first encountered is of smaller magnitude than the specification for nozzle misalignment, 0" 1.72' for acceptance of a new X 258 motor from the manufacturer. In evaluating the effects of nozzle deflection, data from the Delta 32 (OT-1) third stage can also be used, since it carried nozzle- deflection measuring instruments and responded similarly to Delta-36 disturbance that might cause coning. This response was due to its being very nearly the same weight as the Delta-36 third stage. The nozzle-deflection measuring devices on Delta 32 indicated an angular deflection of 0" 1.5' and Delta 32 experienced coning of only 1.24-degrees half-angle (Reference 7) while Delta 36 with a smaller nozzle misalignment encountered coning of 4.5" half-angle. Hence, the data do not tend to uphold the theory that coning is induced by nozzle deflection.
I
Motor- Case TemperaEure
Temperature histories at 26 locations on the X 258 motor were recorded on the OT-3 flight. One temperature gage was mounted on the forward-motor dome, fifteen were mounted on the motor- case side and ten were mounted on the aft-motor dome. The locations of the temperature trans- ducers are shown in Figure 2. The case-side temperature gages over the propellant-grain core star void correspond to the area with the greatest amount of insulating liner, while the gages di- rectly between the voids correspond to the area with the least amount of insulator. The tempera- ture data from the OT-3 mission are presented in Figures 8 and 9. Temperature data from the OSO-C motor case side are presented for comparison in Figure 10, but aft-dome temperatures for OSO-C are not presented. The aft-dome temperatures recorded were abnormal and should not be compared to the aft-dome temperatures of OT-3. This is because the OSO-C third stage failed to separate from the spin table, resulting in the destruction of part of the telemetry system mounted on the aft section of the motor. The OSO-C-motor case-side temperature gages, however, appeared to be unaffected by the failure. Since the case-side temperature time data from the OT-3 and OSO-C missions approximately correspond, it would seem that all the temperature data recorded on the OT-3 flight is representative of a typical aluminum foil wrapped X 258 burning.
When coning of the third stage began, all the temperature gages on OT-3 read 100°F or less; Reference 8 states that at 100°F the fiberglass material used in the X 258 motor retains a high percentage of its room-temperature strength. Thus, the theory that high-temperature softening of the X 258 motor case aft dome caused thrust misalignment or mass imbalance and, consequently, coning has been essentially disproved.
Vibration data gathered by the OT-3 telemetry package is to be analyzed elsewhere and will, therefore, not be treated in this report.
CONCLUSIONS
Table 7 contains a summary of the performance telemetry and the results evaluated from the telemetry experiments carried on Delta missions.
Overall consistency can be seen in the values of total impulse, specific impulse, and burn time. Incremental velocity and spin rate vary from mission to mission, owing to differences in spacecraft weight.
Third-stage coning encountered on the instrumented Delta missions does not seem to be con- sistent, and telemetry instrumentation has so far been unsuccessful in defining the cause for the coning. Nozzle deflection data from the Delta 32 and Delta 36 missions have given little support to the theory that third-stage coning is initiated by a nozzle deflection. Temperature data recorded on Delta missions 33 and 36 tend to show that coning is not caused by a thrust misalignment result- ing from high temperature softening of the X 258 motor-case aft dome. Little can be said for
8

Mission
Delta 29/ OW-BZ(4) Delta 32/
Delta 33/
Delta 36/
OT-1(3 & 8)
OW-C(11)
OT-3
281.0
280.25
Stage Ill Burnout
Weight (lbs.)
663
414
756
432
5100 23.35 109 3.50
7151 122.5 I 131 1 1.24
Table I Summary of X 258 Performance Telemetry and Results.
Total Impulse (lb-sec)
142,000
140,600
140,600
Specific Incremental Burn coning Impulse 1 Velocity 1 Time 1 I Half-Angle
(sec) (ft/sec) (sec) (RPM) (degrees)
280.3 I 6935 123.5 I 131 1 4.53
Nozzle Deflection
Sensors
No
Yes
Yes
Yes
Motor Case Temperature
Sensors
No
No
Yes
Yes
Slag Sensors
No
No
Yes
No
aluminum-propellant slag as a cause of coning; because the slag sensors were destroyed on the only mission (Delta 33/OSO-C) that carried such sensors. In our attempt to learn more about the cause of coning, two X 258 motors (S/N's RH-123 and RH-128) were tested at AEDC under con- ditions of simulated attitude and spinning; and the lateral thrust components of the motors were measured (Reference 9). The AEDC tests gave no indication of any unusual lateral forces which might initiate coning during the motor burnout or tailoff. The one recurring observation which has been made in all telemetry instrumented flights is that coning begins during the third-stage burnout phase and is apparently not present during X 258 burning. Further flight avd static test data seem to be necessary before definite conclusions can be made concerning the cause of third-stage coning.
ACKNOWLEDGMENTS
Since the report described herein was contingent upon a successful launch requiring the com- bined efforts of a multitude of specialists too numerous to mention, the author can only express his indebtedness to them by this general acknowledgment. The author is grateful to the various mem- bers of the Delta Project Office who freely released the telemetry information gained from the Delta 36 third-stage experiment. He wishes to acknowledge particularly the help of Robert Conrad and his staff in the Sounding Rocket Instrumentation section, who built the telemetry instrumentation package, and to L. A. Williams and his colleagues in the Test and Evaluations Division, who sup- plied the calibrations, telemetry sensors, and oscillographic records from the analog tapes.
Goddard Space Flight Center National Aeronautics and Space Administration
Greenbelt, Maryland, January 10, 1967 492-05-00-01-51
REFERENCES
1. "Delta 36 Final Field Report," Delta Operations Branch, Kennedy Space Center TR364, May 27, 1966.
2. Conrad, R. W., "OSO-C/Delta 33 Third Stage Performance Telemetry Package," GSFC Internal Report, 1966.
9

3. "Flight Report Delta Program Mission No. 32, Spacecraft: Tiros OT-1," Douglas Aircraft Co. Report SM-46508, August 1965.
4. Dembrow, D., "Performance of X 258 Third Stage Motor, Delta 29," GSFC Document X-623-65-330, July 1965.
5. "Flight Report Delta Program Mission No. 36, Spacecraft: Tiros OT-3," Douglas Aircraft Co. Report SM-52403, May 1966.
6. 'Tiros OT-3 DTO Trajectory," Douglas Aircraft Co. Report A2-260-AACS-D5597, October 25, 1965.
7. Farkas, J. A., "X 258 (S/N RH-88) Motor Flight Performance Delta 32/OT-l," Delta Engineer- ing Report No. 104, August 25, 1965.
8. "Plastics for Flight Vehicles (Part 1: Reinforced Plastics), MIL-Hdbk-17, November 5, 1959.
9. Cimino, A. A., and Harris, J. E., "Results of Testing Two HPC-ABL-X-258 E-6 (S/N's RH-123 and RH-128) Solid Propellant Rocket Motors Under the Combined Effects of Simulated Altitude and Rotational Spin, AEDC-TR-65-189, September, 1965.
10

I
I , I 1 CHARGE I 1 I
AMPLIFIER log CRYSTAL
26 TEMPERATURE COMMUTATOR
- 1 * 1/8 IN. I, ‘ I ALH -4 TO +8g
FILTER AR +3ov+ ACCELEROMETER I
I ACCELEROMETER - 3 TO +17g
CHAMBER 0 TO 500 PSlA PRESSURE
REG + 6 V
- ALL
I I
t 3 0 v - c ACCELEROMETER 1 - ‘ I I
70.0 KHz i 15% - +30V 1
=&zEFt:: 4-1 MIXER AMPLIFIER
DISPL 22.0 K H z * 15%
10.5 K M * 797 p-1 9 7.35 KHz f 797 1
5.4 KM *73% [ 3.9 KM*71%
VOLTAGE BATTERY
20 HR - 30V DC + 30V
--- ------ TELEMETRY CHASSIS BATTERY CHASSIS
QUADRALOOP ANTENNAS
1 +3;v
I
FM TRANSMITTER 4 WATT
256.2 MHz
TEMP CAGE (TYP)
Figure 1 -0T-3 third-stage performance telemetry system block diagram.

.


\ '1

I F T W r- 4
mechanica I layout.
13

/e I, IS : I !
I k r-r2-"'1
--n


3 "1 L-
-/oi ' - io I , i
I
.. ..

I
. . * * / i , I . , , * , * I . . . , . . , . . ' I .' . ' , . I , , , . . . " * ., . , # ' , ... , I . * , , 7 . r .. . ., , I ,
i ,.
Figure 3-Third-stage performance, composite record of the X 258 sensors.
15

I - r'
I i i
I I i


I
/ I
2 I
3 I 4 I
5 I
- 6 I 7
1
8

3 I /O
I
16 - i
/7
Figure 4-Delta 36 X 258 RH-88 performance.
17

I
/S I I
d/ c.22 I
623

~ . . . .. , ... , .. ._.

I I I I I I 1 I I I J 2 4 6 a 10 12 14 16 18 20 22 24
0 I 0
TIME AFTER IGNITION (sec)
Figure 5-Comparison of the chamber pressure records of OT-1 and OT-3.
19


I.

I
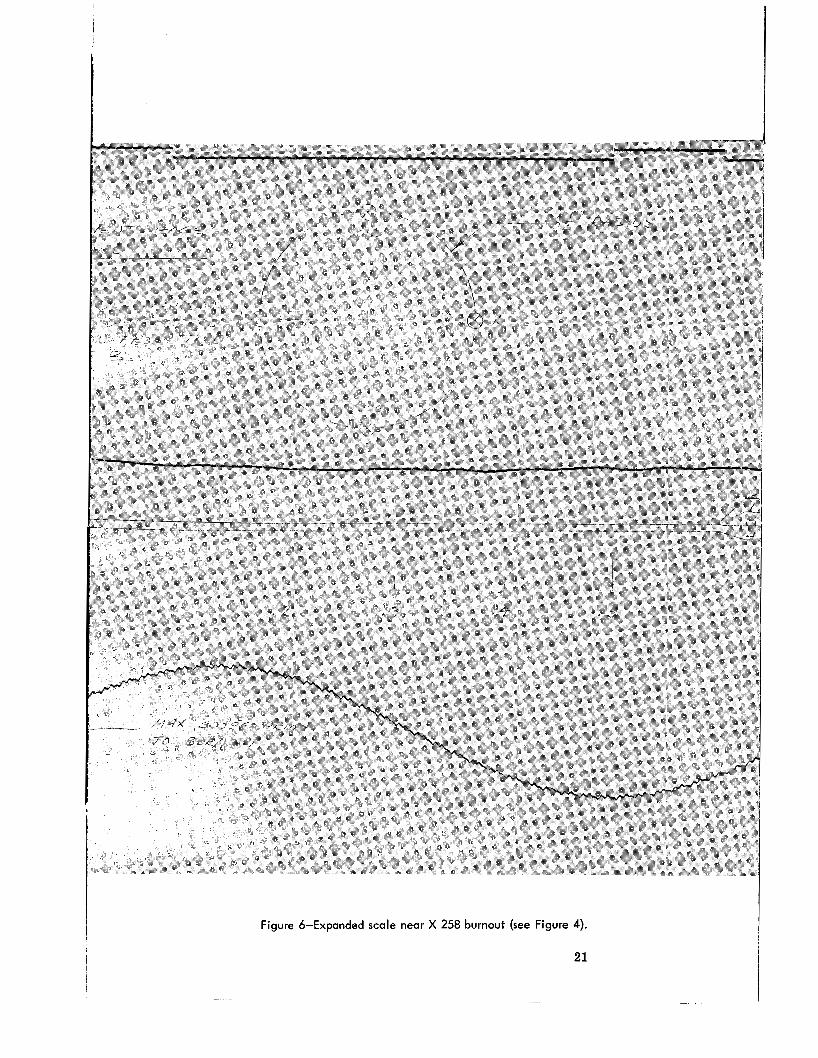
Figure 6-Expanded scale near X 258 burnout (see Figure 4).
21


I


Z AXIS I S AFT
0 100 200 300 400 500 600 700 800 900 TIME AFTER BURNOUT (sec)
MEASUREMENT PolNT Figure 9-OT-3 X 258 RH-88 motor-case temperature (aft dome).
CAUSES INCREASE AFT V l W OF MOTOR I N OUTPUT VOLTAGE LOOKING FORWARD
Figure 7-Nozzle displacement sensors schematic diagram.
1 600 I
I , t d
0 100 200 300 400 500 600 700 800 900 TIME AFTER BURNOUT (sec)
I I 100 200 300 400 500 600
I O O
TIME AFTER BURNOUT (sec)
.-
Figure 8-OT-3 X 258 RH-88 motor-case temperature Figure 10-OSO-C X 258 RH-78 motor-case tempera- (case side). tures (case side).
23

“The aeronautical and space activities of the United States shall be conducted so as to contribute . . . to the expansion of human knowl- edge of phenomena in the atmosphere and space. The Administration shall provide for the widest practicable and appropriate dissemination of information concerning its activities and the results tbereof.”
-NATIONAL AERONAUTICS AND SPACE ACT OF 1958
NASA SCIENTIFIC AND TECHNICAL PUBLICATIONS
TECHNICAL REPORTS: Scientific and technical information considered important, complete, and a lasting contribution to existing knowldge.
TECHNICAL NOTES: Information less broad in scope but nevertheless of importance as a contribution to existing knowledge.
TECHNICAL MEMORANDUMS: Information receiving limited distribu- tion because of preliminary data, security classification, or other reasons.
CONTRACTOR REPORTS: Scientific and technical information generated under a NASA contract or grant and considered an important contribution to existing knowledge.
TECHNICAL TRANSLATIONS: Information published in a foreign language considered to merit NASA distribution in English.
SPECIAL PUBLICATIONS: Information derived from or of value to NASA activities. Publications include conference proceedings, monographs, data compilations, handbooks, sourcebooks, and special bibliographies.
TECHNOLOGY UTILIZATION PUBLICATIONS: Information on tech- nology used by NASA that may be of particular interest in commercial and other non-aerospace applications. Publications include Tech Briefs, Technology Utilization Reports and Notes, and Technology Surveys.
Details on the availability of these publications may be obtained from:
SCIENTIFIC AND TECHNICAL INFORMATION DIVISION
NATIONAL AERONAUTICS AND SPACE ADMINISTRATION
Washington, D.C. PO546