Performance of Wind Energy Conversion Systems Under
7
Performance of wind energy conversion systems under low power density wind regimes Namoora H a , Mathew S a , Shah H a and Lim C M a a Universiti Brunei Darussalam, Jalan Tungku Link, Gadong BE 1410, Brunei Darussalam Email: [email protected] Abstract: Due to the present day’s energy crisis and growing environmental concerns, supplementing our energy base with clean and renewable resources like wind has become imperative. With its steady growth rate over the years, wind energy would become a major player in the clean energy scenarios in the near future. On the other hand, sites with high wind energy potential are becoming scarce due to social, technical and economic reasons and the future wind power developments would more be focused on sites with moderate wind spectra. Keeping this in view, several leading wind turbine manufactures have introduced turbine designs targeting sites with low to medium wind potential. The current investigation theoretically analyzes and simulates the performance of some of these new designs under low power density wind regimes. Three low wind speed turbines recently introduced by leading wind turbine manufacturers were considered under this study. Performances of these turbines at a representative site falling under the wind class 3 were modeled. The model basically combines the Weibull probability density function of the wind velocity at the site and the velocity – power response of the turbine which is then integrated within the productive functional limits of the turbine. Expressions for the energy yield and capacity factor of the turbine at a given site are presented. Wind Energy Resource Analysis (WERA) tool, which is based on the above models, is then used to simulate the performance of the selected turbines at the representative site. Performance of a conventional turbine at the given site has also been analyzed for comparison. Results of the simulation indicates that, with reasonably high capacity factors, all the three low wind speed turbines perform well under the low power density wind conditions. The key requirements for the turbines to perform better under low wind regions have been identified as lowering the cut-in and rated wind speeds, and design improvements for better velocity power response at lower wind spectra. Keywords: Wind turbine, wind velocity frequency distribution, power curve, WERA, capacity factor 20th International Congress on Modelling and Simulation, Adelaide, Australia, 1–6 December 2013 www.mssanz.org.au/modsim2013 1530
-
Upload
haseeb-shah -
Category
Documents
-
view
10 -
download
1
description
Due to the present day’s energy crisis and growing environmental concerns, supplementing ourenergy base with clean and renewable resources like wind has become imperative. With its steady growthrate over the years, wind energy would become a major player in the clean energy scenarios in the nearfuture. On the other hand, sites with high wind energy potential are becoming scarce due to social, technicaland economic reasons and the future wind power developments would more be focused on sites withmoderate wind spectra. Keeping this in view, several leading wind turbine manufactures have introducedturbine designs targeting sites with low to medium wind potential. The current investigation theoreticallyanalyzes and simulates the performance of some of these new designs under low power density windregimes.Three low wind speed turbines recently introduced by leading wind turbine manufacturers were consideredunder this study. Performances of these turbines at a representative site falling under the wind class 3 weremodeled. The model basically combines the Weibull probability density function of the wind velocity at thesite and the velocity – power response of the turbine which is then integrated within the productive functionallimits of the turbine. Expressions for the energy yield and capacity factor of the turbine at a given site arepresented. Wind Energy Resource Analysis (WERA) tool, which is based on the above models, is then usedto simulate the performance of the selected turbines at the representative site. Performance of a conventionalturbine at the given site has also been analyzed for comparison.Results of the simulation indicates that, with reasonably high capacity factors, all the three low wind speedturbines perform well under the low power density wind conditions. The key requirements for the turbinesto perform better under low wind regions have been identified as lowering the cut-in and rated wind speeds,and design improvements for better velocity power response at lower wind spectra.Keywords:
Transcript of Performance of Wind Energy Conversion Systems Under

Performance of wind energy conversion systems under low power density wind regimes
Namoora Ha, Mathew Sa, Shah Ha and Lim C Ma
a Universiti Brunei Darussalam, Jalan Tungku Link, Gadong BE 1410, Brunei Darussalam Email: [email protected]
Abstract: Due to the present day’s energy crisis and growing environmental concerns, supplementing our energy base with clean and renewable resources like wind has become imperative. With its steady growth rate over the years, wind energy would become a major player in the clean energy scenarios in the near future. On the other hand, sites with high wind energy potential are becoming scarce due to social, technical and economic reasons and the future wind power developments would more be focused on sites with moderate wind spectra. Keeping this in view, several leading wind turbine manufactures have introduced turbine designs targeting sites with low to medium wind potential. The current investigation theoretically analyzes and simulates the performance of some of these new designs under low power density wind regimes.
Three low wind speed turbines recently introduced by leading wind turbine manufacturers were considered under this study. Performances of these turbines at a representative site falling under the wind class 3 were modeled. The model basically combines the Weibull probability density function of the wind velocity at the site and the velocity – power response of the turbine which is then integrated within the productive functional limits of the turbine. Expressions for the energy yield and capacity factor of the turbine at a given site are presented. Wind Energy Resource Analysis (WERA) tool, which is based on the above models, is then used to simulate the performance of the selected turbines at the representative site. Performance of a conventional turbine at the given site has also been analyzed for comparison.
Results of the simulation indicates that, with reasonably high capacity factors, all the three low wind speed turbines perform well under the low power density wind conditions. The key requirements for the turbines to perform better under low wind regions have been identified as lowering the cut-in and rated wind speeds, and design improvements for better velocity power response at lower wind spectra.
Keywords: Wind turbine, wind velocity frequency distribution, power curve, WERA, capacity factor
20th International Congress on Modelling and Simulation, Adelaide, Australia, 1–6 December 2013 www.mssanz.org.au/modsim2013
1530

Namoora et al., Performance of wind energy conversion systems under low power density wind regimes 1. INTRODUCTION
The global wind power sector is growing at an impressive rate for the past few decades. With an annual average growth rate of 22% for the past ten years, the global wind power capacity has reached 282.5 GW by the end of 2012 (GWEC, 2013a). This growth trend is expected to be continued and the forecasts indicate that the cumulative installations may reach up to 1600 GW by 2030, even under moderate growth scenarios (GWEC, 2013b). These installations would enable wind energy sector to contribute 14.1% to 15.8 % of the global electricity demand by 2030. Hence, wind power is going to play major role in the future clean energy scenarios. As a result, several ambitious wind power projects are being planned in different parts of the world. However, sites with high wind resource potential (for example, wind class 6) are getting scarce these days. Further, many of these sites are located at remote areas. Extending the necessary infrastructure for power generation and transmission to these sites are economically and technically challenging (Schreck and Laxson, 2005). On the other hand, sites coming under the low wind speed regions (for example, typically wind class 3-4) are abundant and many of these sites are easily available and accessible for large scale installations. For example, studies conducted by the Stanford group (Cristina and Mark, 2005), analysing the wind observations from 7753 surface stations around the globe, revealed that there are plenty of class 3 wind sites which can potentially be used for power generation. Hence, due to this steady increase in global wind power capacity, scarcity of sites with high wind resource, and various technical and environmental constraints in utilizing some of the highly potential sites, the future wind power developments would focus more on regions with low to moderate wind spectra (wind class 3-4). However, the current commercial turbines are designed to work efficiently at high wind velocities and hence may not perform well under these low speed wind regimes. This issue has already been identified by the wind power industry and many manufacturers are introducing turbine models specifically designed for low wind power density regions. These low wind speed turbines generally have a bigger wind rotor which drives a relatively smaller generator, thus allowing the rotor to produce enough torque to drive the generator even at lower wind speeds. The current paper investigates the performances of some of these ‘new generation’ wind turbines under a site representing the low power density wind regimes. The performances of these turbines are modelled and simulated by combining the Weibull probability density of wind velocities at the site with the power curves of the turbines and integrating this over the productive regions of the system.
2. REPRESENTATIVE WIND REGIME AND LOW WIND SPEED TURBINES
In order to demonstrate the performance of the commercial ‘low wind’ turbines at locations with moderate wind power density, a representative site was chosen for the study. Three years of wind data from this site has been analyzed. The selected site has an annual average wind velocity of 5.25 m/s at 10 m height and hence represents the wind velocity class 3 (NREL, 2013). As the available wind data were from 10 m height, it was transformed to 100 m equivalents (representing the standard hub height of a modern wind turbine), using the logarithmic law:
0100 10
0
100ln
10ln
ZV V
Z
=
(1)
where Z0 is the roughness height t the site.
After transforming the velocities to 100 m, the wind spectra at this site were modeled using Weibull distribution, which is characterized by its probability density function f(V) and cumulative F(V) distribution functions such that:
( )1
( )
kk Vck V
f V ec c
− − =
(2)
1531

Namoora et al., Performance of wind energy conversion systems under low power density wind regimes
Fig. 1 Weibull probability density and cumulative distribution functions of wind velocities at the representative site
and
( )0
( ) ( ) 1
kV
cF V f V dV eα −
= = − (3)
Here, k is the Weibull shape factor and c is scale factor. From the wind data, k and c were calculated following the standard deviation method (Mathew, 2006) presented by:
1.090V
mk
V
σ −
=
(4)
and
2 mVc
π=
(5)
The k and c for the selected site was found to be 1.4 and 7.18 m/s respectively. Based on this, the probability density and cumulative distribution functions for the site were generated and presented in Fig. 1.
Similarly, three commercial wind turbines (named as T1, T2, T3) proposed for low wind power density areas by leading turbine manufacturers, were considered for the analysis. To bring out the distinct advantage of low wind speed turbines, this is then compared with a turbine (T4), which is suitable for moderate to high wind speed areas. Technical specifications of these turbines are given in Table. 1.
Table. 1 Technical specifications of low wind speed turbines considered for the study
Turbine T1 T2 T3 T4
Rotor diameter (m)
100 82 120
80
Rated power (MW)
2.0 2.0 2.5
2.0
Cut-in wind speed (m/s)
3 2 3
4
Rated wind speed (m/s)
12 13 12
16
Cut-out wind speed (m/s)
20 28 25
25
0
0.01
0.02
0.03
0.04
0.05
0.06
0.07
0.08
0.09
0.1
0.11
0 5 10 15 20 25
Pro
babi
lity
den
sity
Velocity, m/s
0
0.1
0.2
0.3
0.4
0.5
0.6
0.7
0.8
0.9
1
0 5 10 15 20 25
Cum
ulat
ive
Dis
trib
utio
n
Velocity, m/s
1532

Namoora et al., Performance of wind energy conversion systems under low power density wind regimes
Fig. 2 Power curve of a typical 2 MW pitch controlled wind turbine
3. PERFORMANCE MODEL FOR THE WIND TURBINES
Figure 2 represents the typical power curve of a pitch controlled wind turbine as considered in this study. VI,, VR and VO indicate the cut-in, rated and cut-out wind speeds and PR is the rated power. From VI, to VR, the power increases with the increase in wind speed where as from VR to VO, the output is kept constant at its rated value of PR. The velocity (V) - power (P) relationship between VI, and VR can be expressed as:
nVP aV b= + (6)
where PV is the power developed by the turbine at any velocity V, a and b are constants and n is the velocity-power proportionality. Applying the above expression to the boundary conditions (P(VI) and P(VR)), a and b can be solved and substituting these in the above expression we get:
n nI
V R n nR I
V VP P
V V
− = −
(7)
Thus, PV at any wind velocity V between VI, and VR can be estimated in terms of PR, VI, and VR and n. The value of n for a particular turbine can be solved by digitizing the turbines power curve and fitting Eq. 7 to the resulting P and V values (Mathew and Geeta, 2011).
In general, the energy E generated by the turbine over a period of time T can be estimated by:
( )O
I
V
VV
E T P f V dV= (8)
As the power curve has 2 distinct productive regions (from VI to VR and VR to VO ), E can be split in to 2 parts such that:
IR ROE E E= + (9)
where EIR and ERO are the energy yield corresponding to VI to VR and VR to VO respectively.
0
500
1000
1500
2000
2500
0 5 10 15 20 25 30
Velocity, m/s
Pow
er, W
VI
VR VO
PR
1533

Namoora et al., Performance of wind energy conversion systems under low power density wind regimes Hence, from Eq. 8 we have:
( )R
i
V
IR VV
E T P f V dV= (10)
And
( )O
R
V
RO RV
E T P f V dV= (11)
Substituting for f(V) and PV in Eq. 10 and simplifying, we get:
( ) ( )1R kVc
I
V kn nR
IR In nR I V
P T k VE V V e dV
c cV V
−− = − −
(12)
Substituting:
, andkk k
OI RI R O
VV VX X X
c c c
= = =
(13)
And simplifying thereafter, EIR can be expressed as:
( ) ( )R Xn
k I R
I
Xn nX XR R I
IR n n n nR I R IX
P T c P T VE X e dX e e
V V V V
− − − = − − − −
(14)
Similarly, As ( ) ( )f V dV F V= , expression for ERO, given in Eq. 11 can be simplified as:
( )OR XXRO RE T P e e−−= − (15)
Once EIR and ERO are computed using Eq. 14 and Eq. 15, the total energy can be calculated using Eq. 9.
The capacity factor CF - which is the ratio of the energy actually produced by the turbine to the energy that could have been produced by it, if the machine would have operated at its rated power throughout the time period – can be calculated as:
IR ROF
R R
E EEC
P T P T
+= =
(16)
4. SIMULATED PERFORMANCE OF THE TURBINES
Fig. 3 Screenshots of simulation using WERA
1534
Namoora et al., Performance of wind energy conversion systems under low power density wind regimes
0
0.05
0.1
0.15
0.2
0.25
0.3
0.35
0.4
T1 T2 T3 T4
Cap
acit
y fa
ctor
Turbine
0
1000
2000
3000
4000
5000
6000
7000
8000
9000
T1 T2 T3 T4
Ann
ual E
nerg
y P
rodu
ctio
n, M
Wh
Turbine
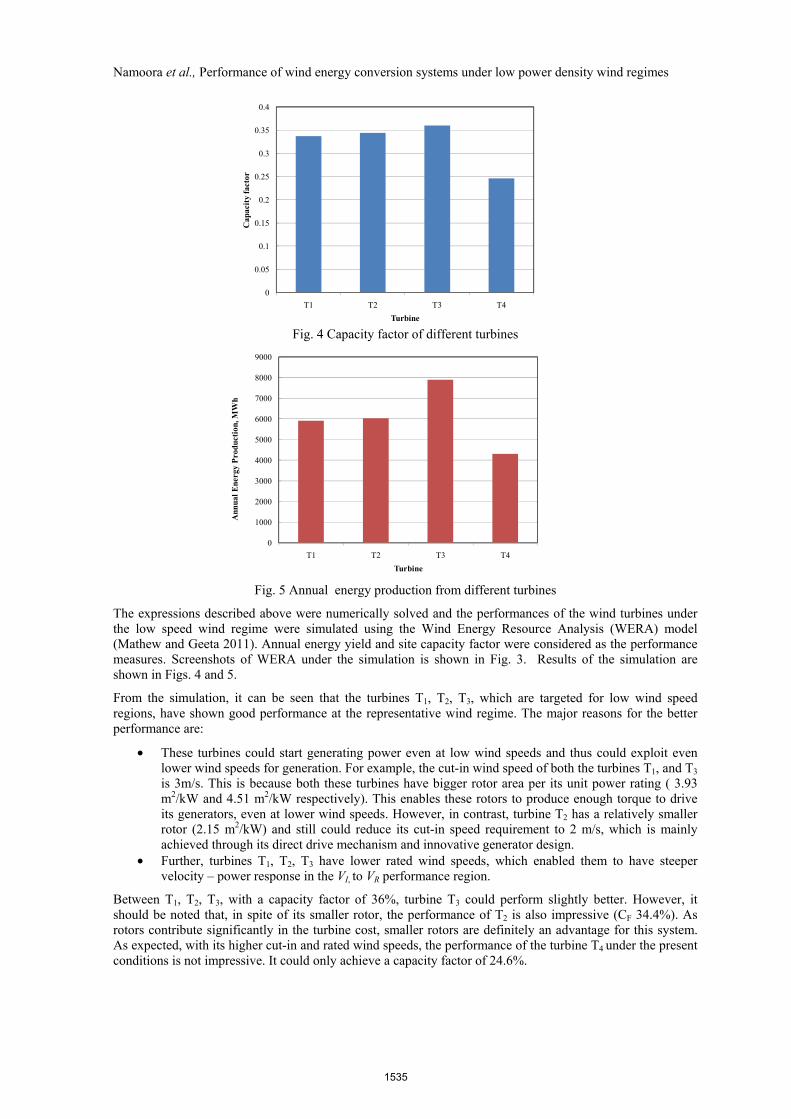
Fig. 4 Capacity factor of different turbines
Fig. 5 Annual energy production from different turbines
The expressions described above were numerically solved and the performances of the wind turbines under the low speed wind regime were simulated using the Wind Energy Resource Analysis (WERA) model (Mathew and Geeta 2011). Annual energy yield and site capacity factor were considered as the performance measures. Screenshots of WERA under the simulation is shown in Fig. 3. Results of the simulation are shown in Figs. 4 and 5.
From the simulation, it can be seen that the turbines T1, T2, T3, which are targeted for low wind speed regions, have shown good performance at the representative wind regime. The major reasons for the better performance are:
• These turbines could start generating power even at low wind speeds and thus could exploit even lower wind speeds for generation. For example, the cut-in wind speed of both the turbines T1, and T3 is 3m/s. This is because both these turbines have bigger rotor area per its unit power rating ( 3.93 m2/kW and 4.51 m2/kW respectively). This enables these rotors to produce enough torque to drive its generators, even at lower wind speeds. However, in contrast, turbine T2 has a relatively smaller rotor (2.15 m2/kW) and still could reduce its cut-in speed requirement to 2 m/s, which is mainly achieved through its direct drive mechanism and innovative generator design.
• Further, turbines T1, T2, T3 have lower rated wind speeds, which enabled them to have steeper velocity – power response in the VI, to VR performance region.
Between T1, T2, T3, with a capacity factor of 36%, turbine T3 could perform slightly better. However, it should be noted that, in spite of its smaller rotor, the performance of T2 is also impressive (CF 34.4%). As rotors contribute significantly in the turbine cost, smaller rotors are definitely an advantage for this system. As expected, with its higher cut-in and rated wind speeds, the performance of the turbine T4 under the present conditions is not impressive. It could only achieve a capacity factor of 24.6%.
1535

Namoora et al., Performance of wind energy conversion systems under low power density wind regimes 5. CONCLUSIONS
The objective of the present investigation was to theoretically investigate the suitability of the ‘new generation’ low wind speed turbines recently introduced by the wind power industry. Performance of three such turbines are modeled and simulated under a low power density wind regime. This is further compared with the performance of another ‘conventional’ turbine under the same conditions. It is seen that the new turbines proposed for low wind speed conditions could perform well under the representative wind regime chosen for the study. Lowering the cut-in and rated wind speeds and design improvements for better velocity power response at lower wind speeds are found to be the reasons for this better performance.
REFERENCES
Harty, C. (2004). Planning strategies for mangrove and saltmarsh changes in southeast Australia. Coastal Management, 32, 405–415.
Cristina, L. A. and Mark Z. J. (2005). Evaluation of global wind power. Journal of Geophysical Research, 110, 1-20.
GWEC (2013a). Global wind report: Annual market update 2012. Global Wind Energy Council, Brussels, Belgium.
GWEC (2013b). Global wind report: Global wind energy outlook 2012. Global Wind Energy Council, Brussels, Belgium.
Mathew, S. (2006). Wind Energy: Fundamentals, Resource Analysis and Economics. Springer Berlin, Heidelberg and New York.
Mathew, S. and Philip, G.S. (2011). Advances in Wind Energy Conversion Technology. Springer Berlin, Heidelberg and New York .
NREL (2013). Classes of wind power density at 10 m and 50 m. Retrieved from http://rredc.nrel.gov/wind/pubs/ atlas/tables/1-1T.html
Schreck, S. and Laxson A (2005). Low Wind Speed Technologies Annual Turbine Technology Update (ATTU) Process for Land-Based, Utility-Class Technologies. Technical Report NREL/TP-500-37505, National Renewable Energy Laboratory, Colorado, USA.
1536