
Performance of Mutual Funds: The Case of Bangladesh
12
World Journal of Social Sciences Vol. 6. No. 1. March 2016 Issue. Pp. 210 – 221 Performance of Mutual Funds: The Case of Bangladesh Rajib Lochan Das 1 Performance evaluation measures of mutual fund are basically examined on three popular indicators namely Sharpe ratio, Treynor ratio and Jensen’s Alpha. The most widely used indicator in Bangladesh, especially in the relevant environment with Dhaka Stock Exchange (DSE), is net asset value (NAV). NAV calculation is guided by the SEC. It has significant appeal to individual investors in general. There is increasing demand of deeper understanding of mutual fund performances, which includes the formation of fund in terms of ownership status, investment option and stock variety. Fama and French criticized Capital Asset Pricing Model (CAPM) as its invalidity in realities and suggested 3-Factor Model (3FM) emphasizing on portfolio selection. This research has shaded light on searching of relationship between fund formation and performance measuring ratios. The evidences with available data related to DSE in Bangladesh are analyzed in relations with theoretical tools. It is concluded that further rigorous research needs to be done for forming an accepted formula expressing significant relationship between fund formation and performance measure ratios. Keywords: NAV, CAPM, Sharpe ratio, Treynor ratio, Jensen‟s Alpha, 3FM, Portfolio selection Field of study: Finance 1. Introduction Quest for preparing a perfect measure for mutual fund performances had been started in late 60‟s. This inevitably got attractions of many researchers around the world because of its innate significance in Finance. Katerina Simons (1998) written in the New England Economic Review that the mutual funds are preferred way for individual and corporate investors to participate in the capital market and their popularity has increased demands for evaluation of fund performance. In 1967, M. C. Jensen mentioned in his famous paper “The Performance of Mutual Funds” that, a central problem in finance was the evaluation of performance of portfolios at risky environments. Jensen (1967) also mentioned in simple words that the two major tasks of a portfolio manager are to increase the portfolio return, and minimize the amount of insurable risks. This legendary paper suggested the performance index, now well known as Jensen‟s Alpha or Jensen Ratio could be used for evaluating the performance of portfolio managers especially the mutual fund managers. Other similar ratios, such as, Sharpe Ratio and Treynor Ratio are also very commonly used for the same purpose besides the Jensen Ratio. All these were developed in late 60‟s and in relation with the U.S. stock market. U.S. stock markets are matured and huge comparing to Bangladesh stock markets in terms of number of securities and market capitalization. Dhaka Stock Exchange (DSE) is the biggest 1 Rajib Lochan Das, is formerly an Assistant Professor at Eastern University, Bangladesh. As on January, 2016, he is a PhD student at Assumption University, Thailand. Rajib can be contacted at [email protected].
Transcript of Performance of Mutual Funds: The Case of Bangladesh

World Journal of Social Sciences
Vol. 6. No. 1. March 2016 Issue. Pp. 210 – 221
Performance of Mutual Funds: The Case of Bangladesh
Rajib Lochan Das1
Performance evaluation measures of mutual fund are basically examined on three popular indicators namely Sharpe ratio, Treynor ratio and Jensen’s Alpha. The most widely used indicator in Bangladesh, especially in the relevant environment with Dhaka Stock Exchange (DSE), is net asset value (NAV). NAV calculation is guided by the SEC. It has significant appeal to individual investors in general. There is increasing demand of deeper understanding of mutual fund performances, which includes the formation of fund in terms of ownership status, investment option and stock variety. Fama and French criticized Capital Asset Pricing Model (CAPM) as its invalidity in realities and suggested 3-Factor Model (3FM) emphasizing on portfolio selection. This research has shaded light on searching of relationship between fund formation and performance measuring ratios. The evidences with available data related to DSE in Bangladesh are analyzed in relations with theoretical tools. It is concluded that further rigorous research needs to be done for forming an accepted formula expressing significant relationship between fund formation and performance measure ratios.
Keywords: NAV, CAPM, Sharpe ratio, Treynor ratio, Jensen‟s Alpha, 3FM, Portfolio selection Field of study: Finance
1. Introduction Quest for preparing a perfect measure for mutual fund performances had been started in late 60‟s. This inevitably got attractions of many researchers around the world because of its innate significance in Finance. Katerina Simons (1998) written in the New England Economic Review that the mutual funds are preferred way for individual and corporate investors to participate in the capital market and their popularity has increased demands for evaluation of fund performance. In 1967, M. C. Jensen mentioned in his famous paper “The Performance of Mutual Funds” that, a central problem in finance was the evaluation of performance of portfolios at risky environments. Jensen (1967) also mentioned in simple words that the two major tasks of a portfolio manager are to increase the portfolio return, and minimize the amount of insurable risks. This legendary paper suggested the performance index, now well known as Jensen‟s Alpha or Jensen Ratio could be used for evaluating the performance of portfolio managers especially the mutual fund managers. Other similar ratios, such as, Sharpe Ratio and Treynor Ratio are also very commonly used for the same purpose besides the Jensen Ratio. All these were developed in late 60‟s and in relation with the U.S. stock market. U.S. stock markets are matured and huge comparing to Bangladesh stock markets in terms of number of securities and market capitalization. Dhaka Stock Exchange (DSE) is the biggest
1Rajib Lochan Das, is formerly an Assistant Professor at Eastern University, Bangladesh. As on January, 2016,
he is a PhD student at Assumption University, Thailand. Rajib can be contacted at [email protected].

Das
211
market in Bangladesh, which has 546 listed securities as on the end of year 2014 and closing market capitalization of BDT 3259246.76 Mn (DSE Website, 2015). The share of market traded close end mutual funds is 1.13% as on December 2014 (Bangladesh Bank, 2015), which is in value BDT 36829.48 Mn. It is clearly conceived that the impact of mutual fund performances on the whole market in terms of capitalization is sufficiently low. Yet, mutual fund performances might have significant influences on individual investors‟ decisions as the mutual funds are managed by professional financial analysts. Another important focus of the context is how the funds are formed. William F. Sharpe (1966) suggested that the results of portfolio selection has to be combined with the results of pricing of risky capital assets and behavior of stock market prices for evaluating mutual fund performance. Klaas P. Baks (2001) of University of Pennsylvania suggested that a combination of 30% weightage of fund managers‟ personal qualities has to be combined with the 70% weightage of the fund for comprehensive performance reports. Though, the conclusion of Baks‟ paper ensures that the fund itself primarily determines the performance of a fund, not its manager. This research recognizes the significance of two stages of evaluation process for mutual fund performances: 1. Portfolio selection, where the NAV will play the role of a performance measure tool, and 2. Abnormal returns, where the Sharpe ratio, Treynor ratio and Jensen alpha are considered as measuring tools. The objectives of this research are:
a) To critically investigate the portfolio selection situation in mutual funds related to DSE in Bangladesh.
b) To look for any probable connection between portfolio selection and abnormal returns.
Review of relevant literature including research papers, scholarly articles, books and various reports is summarized in the next section of this paper. Papers published in last recent decade on the mutual fund context of Bangladesh were given emphasis. Other papers were reviewed on the basis of theoretical relevance. After literature review, design and methodology of this study were described in brief. Then the details of analysis and results are written in four sub-sections. Examinations of and comparisons among mutual fund performance measures are summarized in this section under different measurement tools. Finally the conclusion section includes concluding remarks and recommendations of the author based on findings and analysis.
2. Literature Review Like in countries worldwide mutual fund performances in Bangladesh are measured with common indices including ratios from Sharpe (1966), Treynor (1965) and Jensen (1967) besides the net asset value (NAV) of the funds. A performance study on 32 selective mutual funds in DSE during the period of January 2012 to June 2013, done by Qamruzzaman (2014), shows that most of the funds made abnormal returns comparing to the market returns. Study of Qamruzzaman (2014) was made on analyses of common calculated measures of mutual funds‟ performance ratios. This study is focused on average market returns and formation of funds in addition to performance ratios. The author intends to shed light on probable connections among performance ratios of mutual funds and other derivatives of market conditions and fund formations. The periodic NAV of funds indicates the fundamentals to its investors while the ratios show the overall performance of fund managers in terms of risk management actions and actual portfolio returns earned. Xu et al (2001) showed by using

Das
212
standard portfolio optimization techniques that, the portfolio weights for the stocks selected by fund managers are on average inefficient in the context of New York Stock Exchange. There is no similar study done and suggestions made for the mutual funds in Dhaka Stock Exchange. This paper looks for probable influences of fund formation and stock selection besides usage of popular ratios while evaluating performances of mutual funds in relation to the DSE in Bangladesh. According to the Securities and Exchange Commission (SEC) Mutual Fund Laws 2001 all mutual fund managers shall submit weekly NAV of all units to the SEC along with quarterly and annual reports with specific requirements. As a result, the weekly NAV‟s of all mutual fund units are publicly available through organizational websites, which gives regular fundamental positions of the funds to their individual investors. Mutual fund managers do have scopes and should have necessary skills to select securities from the stock market that will ensure higher returns. There are theories of forming an efficient portfolio, the earliest one of which was given by H. Markowitz in two separate papers in 1952 and 1959. Following the theoretical guidelines available market specific parameters are worth to be taken into account during formation of a portfolio. Tracking regular NAV of fund units will be justified at the investigative findings on a fund in light of portfolio selection. This is also to ensure that the diversifiable risks have properly been taken care of. Evaluation of mutual funds starts from here and follow the next evaluation measures of all important and commonly used ratios mentioned earlier. The University of Chicago professor Eugene Fama and renowned researcher Kenneth French (1996) wrote a paper by criticizing Capital Asset Pricing Model1 and suggested 3-Factor Model2 to find a more appropriate ratio that suffices the demands of small individual investors. From the literature review and the background of this research the author states three specific null hypotheses as shown below. H0-1: There is no significant influence of market returns on fund formations of mutual funds. H0-2: There is no evidence of difference between performance ratio and documentations of mutual funds. H0-3: There is no significant influence of mutual fund performances on fund formation measures.
3. Design and Methodology This is primarily an explorative research. Critical analyses are done on common and popular practices of theoretical tools in the research world around the DSE in Bangladesh. Periodical reports of SEC, central bank of Bangladesh, DSE, and different mutual fund organizations are reviewed with relevant factors. Annual reports and financial statements of 18 mutual funds are analyzed. Different study reports during last decade are also reviewed for understanding the scenario of using theories in practical analyses. Critical observations are compiled and compared to prepare discussions on every theoretical tool. In necessary cases, up to a certain extent, the discussions are made on the calculated results with real data from the stock market of DSE. Then at the end, a combined discussion summary has been made from the holistic point of view based on which the paper has been concluded. Data of everyday fund facts are collected from two types of sources: stock market and mutual fund organizations. Data, in secondary state, are taken from different periodical reports and website publications from the Dhaka Stock Exchange and different mutual fund organizations. Data of regulatory directives are collected from SEC and Bangladesh Bank reports and

Das
213
websites. Then the data are analyzed with the aid of descriptive and inferential statistical tools by using excel and statistical package for social science (SPSS). The time period in this research is three consecutive fiscal years in Bangladesh, from July 1, 2012 to June 30, 2015. The three years are named as 2012-2013, 2013-2014, and 2014-2015.
4. Analysis of Results The researcher has analyzed the following theoretical tools and measures in this study. 4.1 NAV, EPS and Dividend NAV of mutual funds are weekly calculated and published for the individual investors who are concerned about their investments in the mutual fund units.NAV on market price is calculated for each unit fund as:
Here, n is the number of outstanding units of the fund EPS (Earning Per Share), and Dividend per share unit are collected from the funds‟ annual statements and declared public announcements. For the consecutive three years 2014-2015, 2013-2014, and 2012-2013 NAV, EPS and Div of 18 mutual funds from 5 fund managers are shown in Table-1. The funds are randomly chosen from different fund managers from public, private and foreign sectors.

Das
214
Table 1: NAV, EPS and Dividend of selected mutual funds
Manager MF name Period NAV EPS Dividend
ICB Asset Management
Company Limited
ICB AMCL 1st NRB MF
2014-2015 27.17 2.46 3.20
2013-2014 24.92 3.70 3.00
2012-2013 26.91 2.33 2.50
ICB AMCL 2nd NRB
MF
2014-2015 10.99 0.87 1.00
2013-2014 10.93 1.06 1.00
2012-2013 11.39 0.00 1.00
Prime Finance 1st
MF
2014-2015 11.59 0.93 1.00
2013-2014 11.52 1.02 1.00
2012-2013 11.63 0.64 1.00
ICB AMCL 2nd MF
2014-2015 8.50 0.54 0.50
2013-2014 8.22 0.52 0.50
2012-2013 7.95 0.00 0.00
ICB Emp. Prov. MF
One
2014-2015 8.13 0.62 0.75
2013-2014 7.81 0.53 0.50
2012-2013 7.19 0.00 0.00
Prime Bank 1st ICB
AMCL MF
2014-2015 8.37 0.56 0.70
2013-2014 7.86 0.54 0.50
2012-2013 7.17 0.00 0.00
Phoenix Finance 1st
MF
2014-2015 7.86 0.53 0.50
2013-2014 7.49 0.53 0.50
2012-2013 6.92 0.00 0.00
Alliance Capital Asset
Management
Mutual Trust Bank Unit
Fund
2014-2015 11.80 0.65 0.95
2013-2014 11.61 0.70 1.10
2012-2013 10.81 0.35 0.50
Asset and Investment
Management Services Limited
AIMS 1st MF
2014-2015 39.27 2.24 1.18
2013-2014 48.88 4.71 4.10
2012-2013 42.92 3.02 2.50
Grameen Mutual Fund
One
2014-2015 31.93 1.74 1.51
2013-2014 34.91 3.41 3.603
2012-2013 30.78 2.29 2.00
LR Global Bangladesh
Asset Management
Company Limited
DBH 1st MF
2014-2015 10.39 0.45 0.40
2013-2014 9.88 0.38 0.06
2012-2013 9.14 -0.02 0.00
Green Delta MF
2014-2015 10.12 0.49 0.45
2013-2014 9.73 0.64 0.00
2012-2013 8.94 0.07 0.00
LR Global Bangladesh
MF One
2014-2015 10.78 0.30 0.80
2013-2014 11.03 0.48 0.50
2012-2013 9.87 0.35 0.69
AIBL 1st Islamic MF
2014-2015 9.94 1.19 0.00
2013-2014 10.16 -0.14 0.55

Das
215
2012-2013 9.23 0.84 0.00
Race Management
Private Company Limited
Eastern Bank
Limited 1st MF
2014-2015 10.82 0.66 1.23
2013-2014 11.00 0.64 0.70
2012-2013 10.00 0.60 1.15
First Janata Bank MF
2014-2015 11.33 1.04 1.85
2013-2014 12.00 1.76 3.19
2012-2013 11.00 0.78 0.00
IFIC Bank 1st MF
2014-2015 11.21 0.99 1.70
2013-2014 12.00 0.72 1.16
2012-2013 11.00 0.90 1.56
AB Bank 1st MF
2014-2015 12.24 1.67 2.82
2013-2014 13.00 0.64 1.03
2012-2013 12.00 1.00 1.67
In many cases, more dividends are declared compared to the earnings of the corresponding period. The reason is to keep investors satisfied, from which it can eventually be assumed that the investors in general are not sufficiently knowledgeable on financial activities and investment environments. In spite of nearly zero market returns in both directions (Table -2), almost all of the EPS‟s are positive, from which it can be perceived that the funds have partial incomes from sources other than the stock market. 4.2 Annual Average Market Return Annual average is calculated from the daily market returns for each of the annual periods taken into account in this research. Daily market return is calculated as:
Market index is taken from the DSEX index, which is being calculated as S&P 500 since January 2012. Market returns are shown in Table-2 for the periods of consideration. Market return for the year 2014-2015 is used for calculating Jensen‟s alpha.
Table 2: Market returns
Annual Average Market Return
Period Rm
2014-2015 0.00030
2013-2014 -0.00057
2012-2013 -0.00016

Das
216
4.3 Fund Formation Efficient fund formation is linked with three different viewpoints:
1) Ownership status of the fund, showing that how much has come from company directors, how much from individual investors, and how much from corporate sponsors.
2) Investment options of the fund, telling that how much is invested in different sectors including the capital market, how much is reserved in merchant banks, and how much is invested in other sectors as various forms of financial credits and securities.
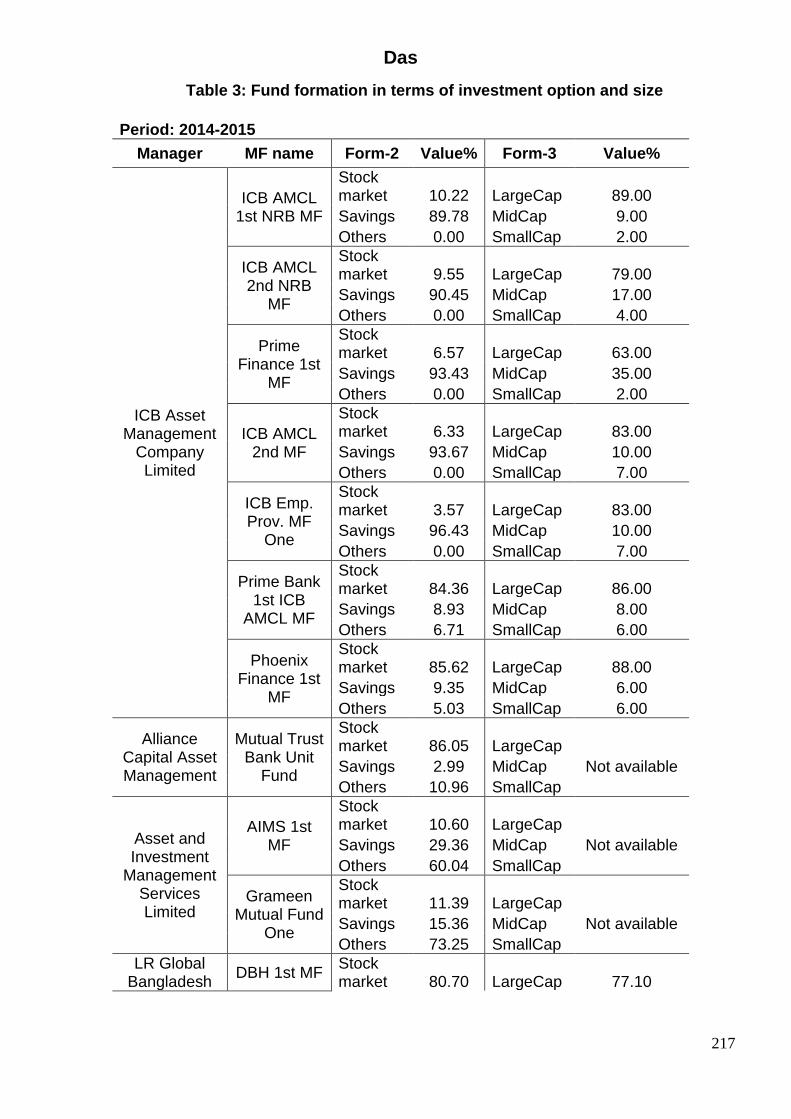
3) Stock varieties of the fund, describing that when it is invested in the capital market, how much is invested by sectors and categories of the stocks, and how much is invested by the size4 of stocks according to market capitalization.
Data of the fund formations with all three parameters mentioned above are not available for the mutual funds under consideration in this research. The data set based on formation query points 2 and 3 is compiled in the Table-35.
Das
217
Table 3: Fund formation in terms of investment option and size
Period: 2014-2015 Manager MF name Form-2 Value% Form-3 Value%
ICB Asset Management
Company Limited
ICB AMCL 1st NRB MF
Stock market 10.22 LargeCap 89.00
Savings 89.78 MidCap 9.00
Others 0.00 SmallCap 2.00
ICB AMCL 2nd NRB
MF
Stock market 9.55 LargeCap 79.00
Savings 90.45 MidCap 17.00
Others 0.00 SmallCap 4.00
Prime Finance 1st
MF
Stock market 6.57 LargeCap 63.00
Savings 93.43 MidCap 35.00
Others 0.00 SmallCap 2.00
ICB AMCL 2nd MF
Stock market 6.33 LargeCap 83.00
Savings 93.67 MidCap 10.00
Others 0.00 SmallCap 7.00
ICB Emp. Prov. MF
One
Stock market 3.57 LargeCap 83.00
Savings 96.43 MidCap 10.00
Others 0.00 SmallCap 7.00
Prime Bank 1st ICB
AMCL MF
Stock market 84.36 LargeCap 86.00
Savings 8.93 MidCap 8.00
Others 6.71 SmallCap 6.00
Phoenix Finance 1st
MF
Stock market 85.62 LargeCap 88.00
Savings 9.35 MidCap 6.00
Others 5.03 SmallCap 6.00
Alliance Capital Asset Management
Mutual Trust Bank Unit
Fund
Stock market 86.05 LargeCap
Savings 2.99 MidCap Not available
Others 10.96 SmallCap
Asset and Investment
Management Services Limited
AIMS 1st MF
Stock market 10.60 LargeCap
Savings 29.36 MidCap Not available
Others 60.04 SmallCap
Grameen Mutual Fund
One
Stock market 11.39 LargeCap
Savings 15.36 MidCap Not available
Others 73.25 SmallCap
LR Global Bangladesh
DBH 1st MF Stock market 80.70 LargeCap 77.10

Das
218
Asset Management
Company Limited
Savings 4.80 MidCap 22.20
Others 14.50 SmallCap 0.00
Green Delta MF
Stock market 63.10 LargeCap 77.90
Savings 2.80 MidCap 22.10
Others 34.10 SmallCap 0.00
LR Global Bangladesh
MF One
Stock market 70.10 LargeCap 78.80
Savings 3.10 MidCap 19.50
Others 26.80 SmallCap 1.70
AIBL 1st Islamic MF
Stock market 73.00 LargeCap 81.40
Savings 2.00 MidCap 18.60
Others 25.00 SmallCap 0.00
Race Management
Private Company Limited
Eastern Bank
Limited 1st MF
Stock market 72.75 LargeCap
Savings 13.40 MidCap Not available
Others 13.85 SmallCap
First Janata Bank MF
Stock market 61.16 LargeCap
Savings 26.64 MidCap Not available
Others 12.20 SmallCap
IFIC Bank 1st MF
Stock market 63.71 LargeCap
Savings 27.11 MidCap Not available
Others 9.18 SmallCap
AB Bank 1st MF
Stock market 53.22 LargeCap
Savings 29.77 MidCap Not available
Others 17.01 SmallCap
Publicly owned limited company Investment Corporation of Bangladesh (ICB) has highest reserves and secured surpluses of funds. It could be a considerable option instead of investing in the capital market as the market return is nearly zero and the risk free rate of return is 7.27%, whose calculation details are stated later. All mutual fund managers including ICB have selected the large capital stocks in the market. Middle sized capital stocks are chosen occasionally and small sized capital stocks are nominal. Fama and French (1996) suggested that the small cap stocks are better options for mutual fund managers because there will be more return opportunities due to more risks involved. In another paper Fama and French (2004) boldly depicted CAPM as a simple introductory formula in theory which is practically invalid in realities. For example, CAPM states confirmed positive returns when a manager selects small, low-beta or value stocks where there is no relevant scope of managers‟ skills. In other words, it is conceived that playing with higher beta and not-so-high value stocks will ensure performances of fund managers when the portfolio ensures satisfactory returns comparing to the market returns. But the mutual funds in Bangladesh do not consider any experimental fund choices rather than going with the regular and popular flow that eventually rejects the null hypothesis H0-1.

Das
219
4.4 MF Performance Ratios To evaluate the mutual fund managers‟ performance on their abnormal returns gained against respective funds, the most common performance measure ratios used are Sharpe ratio, Treynor ratio, and Jensen ratio. All these are related to CAPM and adjusted with risk measures of the market and the individual fund volatility. Risk free rate of return is another significant factor for all necessary calculations of standard deviations, variances, and coefficients of variation. Risk free rate of return is 7.27%, which is calculated as an annual average of 91-days BCR6 during the period from July 1, 2014 to June 30, 2015.Values of all the ratios mentioned above can describe certain aspects of the performance of fund manager. The common observation for all these ratios are „higher the values with positive signs are better the performance‟, that is, more abnormal returns are ensured comparing to the market returns at a certain period of time. The Jensen ratio, mostly known as Jensen‟s Alpha7, of the mutual funds in the year 2014-2015 are shown in the Table-4. These alpha values were calculated based on the part of the funds that were managed by the mutual fund managers and invested in the capital market in Bangladesh. Most of the funds were invested in the DSE.
Table 4: Jensen’s Alpha of the selected mutual funds
Period: 2014-2015
Manager MF name Jensen's Alpha
ICB AMCL
ICB AMCL 1st NRB MF 0.029
ICB AMCL 2nd NRB MF 0.000
Prime Finance 1st MF -0.028
ICB AMCL 2nd MF 0.088
ICB Emp. Prov. MF One 0.000
Prime Bank 1st ICM AMCL MF 0.038
Phoenix Finance 1st MF -0.014
Alliance Mutual Trust Bank Unit Fund 0.120
AIMS AIMS 1st MF -0.291
Grameen Mutual Fund One -0.291
LR Global
DBH 1st MF 0.029
Green Delta MF 0.017
LR Global Bangladesh MF One 0.027
AIBL 1st Islamic MF 0.032
RACE
Eastern Bank Limited 1st MF 0.027
First Janata Bank MF 0.083
IFIC Bank 1st MF -0.093
AB Bank 1st MF 0.052

Das
220
Most of the funds have gained abnormal returns above the market returns as the Jensen‟s Alpha values are positive in most cases. The top two performing funds are ICB AMCL 2nd MF and First Janata Bank MF managed by ICB AMCL and Race MPCL respectively. The two performing funds at the bottom line are AIMS 1st MF and Grameen MF One both managed by the AIMS Limited of Bangladesh. Performance claims printed in the annual documentations of the mutual funds for their investors are compared with the results and found similar slightest differences. This suggests that we can accept the hypothesis H0-2. For investigating with the third hypothesis we need to have sufficient fund formation information including size of the capitalization of the companies where the mutual funds are investing. Unavailability of information is two-fold; first, there is no regulation for publicize details of investments, and second, there is no suggested format of announcing details of investments. It is perceived that there must be relations between returns of the funds and corresponding investment selections in the stock market. Further study may reveal this probable influence and its intensity, and hence the decision of hypothesis H0-3 may be made.
5. Conclusion Evaluation of mutual fund performance is not depended on only popular ratio measurements and net asset value of the fund calculated from the market prices. In almost all cases, fund managers outperform by ensuring abnormal positive returns comparing to market returns without any dependencies on fund managers‟ skills. Qamruzzaman (2014) agreed with this fact in his study on performance ratio comparisons of mutual funds in Bangladesh. Annual reports of mutual fund organizations also state the same. Unlike the Qamruzzaman‟s paper, this study recognizes that the fund itself plays a major role about actual rate of returns. Fund formation has to be taken into account given emphasis on three viewpoints, such as, fund ownership, investment option and stock selections. All mutual fund managers do not declare the proportion of fund ownerships. Mutual funds ensure higher returns than the market without considering any experimental fund choices. The popular fund choices are the stocks with high beta and no-so-high value. Managers always declare the name of the stocks that the funds are invested on. But the categories of the stocks in terms of capitalization size are not classified. It is conceived that a fund‟s investments on different capital sized stocks will have impacts on performance measures. Classification is also not done by firms‟ fundamentals, which is expected to have significant influence on fund performance. Mutual fund managers can play a vital role by making more comprehensive reports that help make better understanding of individual investors. A rigorous further research is needed to find evidence of inter-relation between fund formation and performance measuring ratios regarding mutual funds‟ performance evaluation.
Endnotes 1. Capital Asset Pricing Model (CAPM), originally formulated individually by Sharpe (1964) and Lintner (1965), is very widely used formula in application of calculating price and rate of return of investments of firms and stock market capitals. 2. 3-Factor Model (3FM) is one of the most powerful factor based assessment tool that calculates influences on mutual fund performance measures from 1. market returns (Mkt), 2. small to big company returns (SmB) and 3. high to low priced stock returns (HmL). 3. This is taken as an example. There are few more dividends in different mutual funds in different years that were declared as Re-investment Units (RIU). Here, the example monetary value of the dividend was converted from original dividend 30% RIU. The conversion formula used:
Das
221
Adjusted NAV = (NAV * n + 10 * 0.3 * n) / ((1+0.3) * n) . . . . . . . . . . (1) Converted Div = (EPS / NAV) * Adjusted NAV . . . . . . . . . . . . . . . . (2) The provision of declared dividend and retained earnings are not considered in the conversion. 4. SmallCap stocks in DSE are defined for the stocks whose market capital is less than BDT800Mn, LargeCap stocks in DSE are defined for the stocks whose market capital is more than BDT2Bn, and the MidCap stocks are in between these two sizes. 5. Some of the values under Form-2 column were directly fetched from annual reports of respective funds; some others are extracted and reformed from annual financial statements. Likewise, some values under Form-2 column are directly fetched from annual reports, some others capitalization sizes are estimated from sector-wise allocations reported in the annual reports of the funds. „Not available‟ is mentioned for the cases where this combination could not be found or formulated from any available sources of data. 6. BCR means the Bangladesh Compounded Rate taken daily based on the cut-off yield of 91 days Treasury Bill auction. This is primarily used as floating rate instruments of the government developed and provided by the Bangladesh Bank. 7. Jensen‟s Alpha describes how much abnormal returns are gained of a security or a portfolio comparing to the market return in the market risk environment. The formula for calculating Jensen‟s Alpha is:
αj = (Ri – Rf) – βM.(RM – Rf) Here, Ri is the return of the stock or portfolio i Rf is the risk free rate of return ΒM is the market risk RM is the market rate of return
References Baks, KP 2001, „On the Performance of Mutual Fund Managers‟, SIRIF Conference on
Performance of Managed Funds for valuable comments, Department of Finance, The Wharton School, University of Pennsylvania
Bangladesh Bank 2015, Financial Stability Report 2014, Bangladesh Bank Financial Stability Department, Issue 5, June 2015, p. 94
DSE Website. 2015. Market At A Glance, Reviewed 7 December 2015, <http://dsebd.org/mglc.php>
Fama, EF & French, KR 2004, „The Capital Asset Pricing Model: Theory and Evidence‟, Journal of Economic Perspectives, Vol. 18, no. 3, pp. 25-46
Fama, EF & French, KR 1996, „Multifactor Explanations of Asset Pricing Anomalies‟, Journal of Finance, Vol. 51, no. 1, pp. 55-84
Jensen, MC 1967, „The Performance Of Mutual Funds In The Period 1945-1964‟, Journal of Finance, Vol. 23, no. 2, pp. 389-416
Markowitz, H 1952, „Portfolio Selection‟, Journal of Finance, Vol. 7, no. 1, pp. 77-91 Qamruzzaman, M 2014, „Comparative Study on Performance Evaluation of Mutual Fund
Schemes in Bangladesh: An Analysis of Monthly Returns‟, Journal of Business Studies Quarterly, Vol. 5, no. 4, pp. 190-209
Sharpe, WF 1966, „Mutual Fund Performance‟, Journal of Business 39, Part 2: pp 119-138 Simons, K 1998, „Risk-Adjusted Performance of Mutual Funds‟, The New England Economic
Review, September/October 1998, pp. 33-48 Treynor, J 1965, „How to Rate Management of Investment Funds?‟ Harvard Business Review,
pp. 63-75