Performance of international securities markets
276
Heiko Schmiedel Performance of international securities markets Bank of Finland Studies E:28 · 2004
Transcript of Performance of international securities markets

H e i k o S c h m i e d e l
Performance ofinternational securitiesmarkets
B a n k o f F i n l a n d S t u d i e s
E : 2 8 · 2 0 0 4
ISBN 952-462-132-0ISSN 1238-1691
Vammalan Kirjapaino OyVammala 2004
Performance of international securities m
arkets Bank of Finland Studies E:28 · 2004

H e i k o S c h m i e d e l
Performance of international securities markets
B a n k o f F i n l a n d S t u d i e s
E : 2 8 · 2 0 0 4

The views expressed in this study are those of the author and do not necessarily reflect the views of the Bank of Finland.
ISBN 952-462-132-0ISSN 1238-1691(print)
ISBN 952-462-133-9ISSN 1456-5951(online)
Vammalan Kirjapaino OyVammala 2004

3
Abstract This study evaluates the performance of international securities markets by analysing the efficiency, economies of scale, and technological development in stock exchanges and securities settlement systems. Implications for future policy and market design are also addressed. This work provides empirical support for theoretical projections in research on stock markets. At the heart of this study is an international comparison that explores productivity, efficiency, and innovation of a wide range of stock exchanges over recent years. There is evidence of considerable variability in the efficiency of stock exchanges, both within Europe and world-wide. The evidence also indicates a positive relationship between the organisational structure and performance of the stock exchanges. It also reveals that technological change is the key driver of rising total productivity and appears to be advantageous for the performance of international securities markets. Furthermore, the study conveys how strategic interactions between stock exchanges are affected by network activity, and examines its influence on stock market performance. The adoption of network strategies was observed to be a promising tool for creating added value in the provision of trading services, and appears to be a crucial component in the strategic decision-making and performance of stock exchanges. The study also examines how far consolidation of and mergers among securities depository and settlement systems might go in the face of economies of scale and technological advancements. The results indicate substantial scale economies in settlement activities, although the extent of such effects differs by size of settlement institution and region. Overall, cost effectiveness has improved in recent years, partly due to innovations and upgrades in settlement technologies. Finally, the results are relevant for practitioners, policymakers, monetary and regulatory authorities, as they suggest further equity market integration. Networks, alliances, mergers and so forth seek to improve market efficiency, explore the benefits of economies of scale, and reduce the average transaction cost to end-users. Key words: exchanges, settlement systems, networks, economies of scale, efficiency JEL classification: C2, F3, G2, L2, O3

4
Tiivistelmä Työssä arvioidaan kansainvälisten arvopaperimarkkinoiden toimintaa analysoimalla pörssien ja selvitysjärjestelmien tehokkuutta, skaala-etuja ja teknistä kehitystä. Lisäksi pohditaan vaikutuksia tulevaisuu-den politiikaan ja markkinoiden muotoutumiseen. Tutkimus tarjoaa empiiristä tukea osakemarkkinoita koskevan tutkimuksen teoreettisille projisoinneille. Eri pörssien tuottavuutta, tehokkuutta ja innovaatioita viime vuosi-na tutkitaan laajan kansainvälisen vertailun avulla. Pörssien välillä ha-vaitaan suuria eroja tehokkuudessa sekä Euroopassa että maailmanlaa-juisesti. Tulosten mukaan organisaatiorakenteet vaikuttavat pörssien suorituskykyyn. Lisäksi havaitaan, että tekninen kehitys on merkittävä tekijä kokonaistuottavuuden lisäämisessä ja että sillä on suotuisa vaikutus kansainvälisiin arvopaperimarkkinoihin. Tutkimuksessa selvitetään myös, kuinka aktiivinen verkottuminen vaikuttaa pörssien väliseen strategiseen vuorovaikutukseen ja mikä vaikutus sillä on osakemarkkinoiden toimintaan. Verkottumisen ha-vaitaan luovan lisäarvoa kaupankäyntipalvelujen tarjoamisessa. Lisäksi työssä tarkastellaan, kuinka pitkälle yhdistymiset ja fuusiot arvopaperisäilytyksen ja selvitysjärjestelmien välillä voivat tuottaa skaalaetuja ja hyötyä teknisessä kehityksessä. Tulosten mukaan suuria skaalatuottoja havaitaan selvityspuolella, mutta etujen suuruus riippuu selvitysinstituution koosta ja sijainnista. Kaiken kaikkiaan kustannus-tehokkuus on parantunut viime vuosina, osittain selvitysjärjestelmien teknisen kehityksen tuloksena. Tutkijoiden lisäksi tulokset kiinnostanevat alan ammattilaisia, poliitikkoja sekä rahapolitiikka- ja säätelyviranomaisia, koska niiden mukaan osakemarkkinoiden integraatio jatkuu. Verkottuminen, liittoutuminen ja fuusiot parantavat markkinoiden tehokkuutta, vaikuttavat skaalatuottoihin ja pienentävät loppukäyttäjien keskimää-räisiä transaktiokustannuksia. Avainsanat: pörssit, selvitysjärjestelmät, verkottuminen, skaalatuotot, tehokkuus JEL-luokittelu: C2, F3, G2, L2, O3

5
Foreword This doctoral thesis studies the performance of the securities exchange and settlement systems industry. I became interested in this subject, when international stock markets grew to a scale unimaginable over the previous decade, even taking into account current economic downturns in many markets. This dynamism inspired me to dig into more detail on the economics of the institutions that make these markets work. Despite the heightened economic significance, very little attention has been given in the debate surrounding the infrastructure of marketplaces. Taking up this line of reasoning, the net results of the research effort are documented in this dissertation. This work is a fitting tribute to all those who made this project possible. First, I thank my promoter Thomas Straubhaar for giving me the opportunity to pursue a Ph.D. I am equally thankful to the HWWA-Hamburg Institute of International Economics for the enjoyable place to work and the financial support. I also thank my colleagues at the HWWA, in particular Carsten Hefeker, Beate Reszat, and Hans-Eckart Scharrer, for their advise, openness, and criticism. Special thanks go to my co-examiner Hartmut Schmidt. His comments and guidance through the literature are gratefully acknowledged. I am most grateful to Iftekhar Hasan for having taken the risk of collaborating with me. Teaming up with him has proven to be instructive, rewarding, and a great pleasure. Thanks are also due to Markku Malkamäki for his generous support and advise on parts of this work produced jointly. Esa Jokivuolle, David Mayes, Nico Valckx, and Jouko Vilmunen also deserve special thanks. I enjoyed their encouraging discussions and constructive comments at various stages of this project. This research greatly benefited from my stays as a visiting scholar at the Bank of Finland. I would like to thank the Bank of Finland for providing such a stimulating research environment and for their hospitality, which I highly appreciated. In particular, I thank Juha Tarkka, the head of the Bank�s Research Department, who found the right balance between challenging and promoting my research initiative. His co-operation was extremely valuable for this study. I also thank Ingo Walter for the visiting research fellowship at the New York Stern University Salomon Center, which had a substantial impact on the direction of my research and the contents of this thesis. Bringing this work to fruition also relied on the immeasurable support and dedication of several persons in many practical matters. Virpi Andersson and Jani-Petri Laamanen provided excellent research

6
assistance. Britta Jens and Päivi Nietosvaara took care of the editing and final layout. Glenn Harma, on many occasions, helped me to improve the linguistic shortcomings. Their assistance in all phases of this work is gratefully acknowledged. In summary, I owe a particular debt of gratitude to all of those mentioned above. If there are others who assisted this work in meetings, discussions, conferences, I apologise for the oversight and thank them for their contribution. The final word of recognition is reserved for my family and friends. Especially, I thank Bettina for her enduring encouragement and friendship during my Ph.D. My deepest personal thanks go to my parents. To my dear Mum I express my gratitude for her invaluable support, trust, and patience. I would not have been able to finish this work without her. To her I dedicate this book. Helsinki, May 2004 Heiko Schmiedel

7
Contents Abstract...............................................................................................3 Tiivistelmä...........................................................................................4 Foreword.............................................................................................5 Chapter 1 Heiko Schmiedel Performance of international securities markets: a study of economies of scale, efficiency, and innovation of stock exchanges and securities settlement system .......................9 Chapter 2 Heiko Schmiedel Technological development and concentration of stock exchanges in Europe.........................................................................57 Chapter 3 Iftekhar Hasan � Markku Malkamäki � Heiko Schmiedel Technology, automation, and productivity of stock exchanges: international evidence.........................................91 Chapter 4 Heiko Schmiedel Total factor productivity growth among European stock exchanges: a non-parametric frontier approach................137 Chapter 5 Iftekhar Hasan � Heiko Schmiedel Do networks in the stock exchange industry pay off? European evidence .........................................................................177 Chapter 6 Heiko Schmiedel � Markku Malkamäki � Juha Tarkka Economies of scale and technological development in securities depository and settlement systems ...............................221 Chapter 7 Heiko Schmiedel Discussion and conclusion of the study.........................................255 Appendix .........................................................................................263

8

9
Chapter 1
Performance of international securities markets: A study of
economies of scale, efficiency, and innovation of stock exchanges and
securities settlement systems
Heiko Schmiedel
1 Introduction ..................................................................................11 1.1 Observations and motivation................................................11 1.2 Place in the literature............................................................14 1.3 Organization.........................................................................18 2 Securities exchanges and settlement systems ...............................19 2.1 Stock exchanges ...................................................................19 2.2 Depository and settlement systems ......................................20 3 Methodological aspects in measuring performance ......................22 3.1 Efficiency and productivity as performance drivers.............22 3.2 Different approaches to measuring efficiency......................23 3.2.1 Parametric vs non-parametric...................................23 3.2.2 Stochastic frontier models ........................................25 3.2.3 Data envelopment analysis .......................................27 3.3 Network externalities ...........................................................28 3.4 Economies of scale and scope ..............................................29 3.5 Database ...............................................................................31
10
4 Performance results of securities exchanges and settlement institutions ...................................................................33 4.1 Efficiency of European stock exchanges..............................33 4.2 Stock exchange performance and technological innovation world-wide .........................................................34 4.3 Non-parametric estimates.....................................................35 4.4 Stock exchange alliances and network externalities.............36 4.5 Economies of scale in depository and settlement businesses.............................................................................38 5 Conclusions ..................................................................................40 5.1 Summary of motivation and results......................................40 5.2 Outlook for future research ..................................................42 References ..........................................................................................46 Appendix............................................................................................55

11
1 Introduction
1.1 Observations and motivation
Securities markets play a vital role in the international financial system and in a country�s long-term economic development. This view is supported by recent empirical evidence at the macro- and microeconomic level. The research suggests that financial markets in general, and well-functioning stock markets in particular, are beneficial elements in promoting overall economic growth and stability (Levine and Zervos, 1998; Rajan and Zingales, 1998).1 In particular, the literature stresses that stock markets facilitate the effective allocation of capital by funneling society�s resources to promising, productivity-enhancing investments across space and time. The marketplaces operated by exchanges have grown at an unprecedented pace, giving them a central role and responsibility in the global financial system. Recent FIBV statistics (2001) highlight the long-term growth trend in global stock markets. While the market capitalization of equities listed on FIBV member exchanges totaled $9400bn in 1990, total market capitalization had increased to $26780bn by end of 2001, after peaking at $36286bn in March 2000. This translates to a growth in equity market capitalization of 285% over the past decade. Trading volume increased by 664% and the turnover velocity of shares accelerated from 66% to 153%, demonstrating the increase in liquidity provided on exchanges. Moreover, the value of equity market capitalization of FIBV member exchanges varied from a 2% low to a high of 383% of GDP at the end of 2000. These impressive statistics show that the performance of the financial sector deserves close attention from researchers, expert practitioners, monetary authorities, regulators as well as policy makers. The efficiency of financial markets has been analyzed and debated at length and by many;2 Meanwhile, very little attention has been paid to understanding the performance of the institutions that
1 Earlier theoretical and empirical research that emphasizes positive linkages between stock markets and long-term economic growth include studies by Atje and Jovanovic (1993), Bencivenga and Smith (1991), Demirguc-Kunt and Maksimovic (1996), and Levine (1991). 2 See Fama (1991), Lo and Roll (1997) for extensive reviews of efficient market literature.

12
operate these markets (eg insurance companies, banks, investment firms, and trading services providers such as stock exchanges and settlement companies). And yet the efficient operation and organization of these financial service providers is crucial to the efficient functioning of the financial system as a whole and for overall economic performance. Stock exchanges and settlement institutions combine rules, know-how, and technology to enable efficient, transparent and smooth trading and settlement of assets. They thereby improve efficiency throughout the transaction value chain, boost the quality of complex financial information, and support the work of all participants in the capital markets. Thus, stock exchanges and settlement institutions are key players in the global financial industry and have to fulfill a distinct role within the financial services sector. Nowadays, stock exchanges and settlement institutions operate on a global scale, in a dynamic, fast-paced, and highly competitive environment. The globalization and integration of all types of financial markets, along with technological progress and deregulation, have transformed the competitive framework and business targets of the trading service industry. As a result, trading service providers behave like business firms and have responded to the new environment on two levels. First, many trading service operators have switched from a business structure based on a mutual association of exchange members with inside ownership to for-profit, publicly listed companies accountable to shareholders (eg Stockholm Stock Exchange and Deutsche Börse). Second, exchanges and settlement companies seek to outperform their competitors by 1) creating horizontal alliances in order to expand their services to other products or equity markets (Euronext Stock Exchange); 2) forming vertical mergers and silo systems to exploit synergies along the trading and settlement value chain (Deutsche Börse and Clearstream International, and Helsinki Stock Exchange and APK); or 3) laterally providing IT services and support for other trading service providers (Xetra System on the Ireland Stock Exchange). The recent wave of alliances and mergers in the securities industry also reflects the fact that trading service operators are striving to meet the growing demand of institutional and individual investors who wish to derive maximum benefit from international risk and portfolio diversification, resulting in a rapid expansion of cross-border trading.3 3 See BIS (1995:9, Table 1) for detailed data supporting the view that the growth of cross-border trading of bonds and equities has far exceeded the growth of GDP especially in recent years.

13
In the European context, the unified currency has triggered increased cross-border trading coupled with growing pressure by institutional investors and broker-dealers to reduce the cost and complexity of international trading. Equally important, these developments and the increase in trading volume on exchanges are driven by technological advances stemming from innovations in the software and communication industry. These advances have reduced communication and transaction costs and have helped to minimise the fragmenting effects of physical distance, not only on exchange formation but also on exchange operations and services. The present study deals with the aspects that characterize this transition period. It provides a comprehensive microeconomic analysis of the performance of the securities exchange and settlement industry. The way one may conceive the future of the securities trading industry will depend on empirical evidence related to its structure, performance, and conduct over recent years. This study is empirical in nature. It attempts to answer, among other things, the following seven key questions: 1. How efficiently are securities trading service providers organized?
How does inefficiency in exchanges evolve over time? Which are the most efficient trading service providers and which are the more inefficient ones? What is the evidence for Europe and on a global scale?
2. What drives the performance of stock exchanges? In other words,
what explains inefficiencies in the organizational structure and provision of trading services? Does the exchange�s particular organizational design and structure influence its efficiency?
3. Which role does technological innovation play? What are the
benefits stock exchanges derive from investing in automation and �system development�?
4. What are the sources of progress or deterioration in the overall
productivity of stock exchanges? 5. What are potential ways for stock markets to network amongst
each other? Does the adoption of network strategies affect the performance of exchanges?

14
6. Does scale matter in depository and settlement businesses? More specifically, do potential economies of scale in the activities of settlement services differ by type, size, and geographical location?
7. What are the future prospects for policy and market design? Different aspects of the research questions investigated in this study are of relevance for a wide range of audiences. A number of key issues are relevant to market participants most closely associated with stock exchanges and settlement systems. On the supply side, this group comprises members, owners, and expert practitioners charged with the responsibility of making operational and strategic choices and governance decisions for their exchange and settlement system. On the demand side, this work is relevant to a wider group of market participants looking to avail themselves of the services offered by exchange and settlement providers, ie financial intermediaries, investors, and issuers. Finally, many of the issues examined herein are intended to spark interest among regulators and policy-makers. 1.2 Place in the literature
To answer the questions listed above, this study refers to two broad strands in the literature: research on the microstructure and organization of securities markets on the one hand, and frontier efficiency analysis on the other. The first line of literature referred to generally examines how the phenomena of competition between exchanges and other types of market participants, internalization, and transparency affect �best execution� and market performance.4 The debate on the first issue centers on fragmentation of order flows. The question raised is whether all orders in any particular security should be concentrated on a single trading system, or on a small number of competing systems in order to attract order flow, or whether trading should be fragmented in order to cater to differing trader needs and preferences. Overall, the current state of research seems to agree that a degree of competition between exchanges and different trading venues enhances market
4 See Lee (2002) and Madhavan (2000) for surveys on market microstructure literature.

15
performance and benefits investors.5 The matter of internalization as a form of fragmentation has arisen in the market microstructure literature. While earlier studies emphasize adverse selection problems and possible costs associated with internalization (Cohen et al, 1982; Easley et al, 1996), a growing number of more recent studies highlight the benefits arising from internalization (Battalio, 1997; Harris, 2002).6 The evidence on the effects of transparency on market performance is mixed. On the one hand, transparency, ie the ability of market participants to view information about the trading process (O�Hara, 1995), is found to enhance the price discovery process; on the other hand, there is growing evidence to the contrary, which indicates that transparency does not enhance market performance. Reasons include wider bid-ask spreads and reduced investor willingness to expose confidential trading strategies, resulting in lower liquidity (Bloomfield and O�Hara, 1999, 2000; Madhavan, 1995, 2000; Madhavan et al, 1998; Porter and Weaver, 1998).7 The research presented in this study contributes to the literature on securities market trading structure in various ways. This work represents one of the very first attempts to comprehensively evaluate the performance of trading service providers, treating them as operative firms, as suggested by Arnold et al (1999) and Pirrong (1999). This approach is of great importance for the evolution of market structures and contestability of markets because stock exchanges and settlement companies make choices concerning trading technologies, ie the supply side of their trading services. Domowitz and Steil (1999) argue that the industrial structure of market places cannot be explained by focusing primarily on the demand side, which deals with trading system characteristics, trading services, and the 5 Prominent examples that support the view that competition between exchange organizers and other types of trading systems can be effective and beneficial to investors include the work of Glosten, 1994; Pagano, 1989; and Schmidt, 1977, among others. A large volume of empirical research has been conducted on the effects of competition between trading systems. Most of the work concludes that increased competition in securities markets narrows bid-ask spreads (Booth et al, 1999; Huang and Stoll, 1991, 1996; Pagano and Röell, 1990; Schmidt and Iversen, 1992). These articles compare trading costs across securities and trading systems at the national and international level. 6 Internalization occurs when a dealer trades with its own retail customers thereby arranging trades away from a central exchange (Harris, 2002). 7 In a recent study, Schmidt and Küster Simíc (2000) investigate the impact of orderbook transparency in an electronic unintermediated auction market on bidding behavior. The authors establish that orders subsequent to large limit orders shown in the orderbook are likely to increase the non-execution risk of limit orders. In turn, due to the balancing effects on non-book sources of liquidity, this does not necessarily have negative repercussions on the number and structure of limit orders on the book and market liquidity.

16
exchange�s ability to attract liquidity, as well as spread and volatility. Following the basic arguments of Arnold et al (1999) and Pirrong (1999), this study evaluates the performance of stock exchanges and settlement institutions, treating them as regular operating firms and thus emphasizing the nature and importance of the supply side and infrastructure of the trading service industry. This research also substantively improves present knowledge of the behavioral underpinnings and infrastructure of trading service providers. Chapters 2�4 focus on institutions that provide trading services at the front end of the transaction chain, ie listing, information dissemination, order routing, and order execution. These Chapters collectively present evidence on the performance, automation, and productivity of stock exchanges throughout Europe and world-wide. The integration phenomenon of all types of financial markets triggered increased popularity of implicit mergers or network deals among exchanges. While the finance literature provides abundant introductions to and potential benefits of such network arrangements � taking either a theoretical or descriptive approach (Cybo-Ottone et al, 2000; Di Noia, 2001; Domowitz, 1995; Domowitz and Steil, 1999) � no empirical attempt is made to understand and investigate the current structure of the network and its impact on market performance. Chapter 5 presents evidence whether network linkages among exchanges have an effect on the performance of individual exchanges. One prerequisite for the efficient functioning of securities markets is a smooth and well-functioning clearing and settlement process (Cruickshank, 2001). Although it is widely believed that a large number of transaction and clearing and settlement systems tend to fragment liquidity and increase costs, especially for cross-border clearing and settlement (Giddy et al, 1996; Giovanni Group, 2002; Lannoo and Levin, 2001), no research so far has quantified economies of scale in depository and settlement systems. Chapter 6 attempts to fill this gap in the literature by examining the cost-effectiveness of securities depository and settlement systems. It estimates and tests for potential cost savings arising from consolidation and further integration of such back-office operating services. Second, as mentioned earlier, this study relates to frontier analysis. In general terms, frontier analysis is concerned with �benchmarking� the relative performance of decision-making units, which convert inputs to outputs. Frontier analysis has made significant contributions to the economic modeling of production and the efficiency measurement of production units, in two ways. First, the beauty of frontier analysis lies in a wide range of measurement tools. For instance, it is possible to identify �best-practice� firms and their

17
rankings within a specific industry; to calculate individual micro-level efficiency scores; to make performance comparisons at higher levels of aggregation, eg over time or across geographical regions (cities, states, countries, etc); and to use this information for academic research purposes or for policy recommendations, by evaluating the effects of deregulation, mergers, and market structure on efficiency. Second, frontier analysis endows strategic decision-makers with more powerful optimizing techniques and benchmarking procedures than otherwise available, allowing them to determine areas of best practice for complex internal service operations and processes and to improve overall managerial performance. The most valuable attribute of frontier analysis is that it adds value to the qualitative understanding of the performance of decision-making units. It does so by providing a new, generalized and objective quantification of performance that is not available through other methods. Efficiency analysis has a long tradition and the methods of performance measurement can be applied to a variety of �firms�, including private-sector firms, the services industry, eg travel agencies and restaurants, and even non-profit organizations, such as schools and hospitals. There is a large body of research on the performance and efficiency of financial institutions, most of which was carried out in the context of banking institutions and insurance firms.8 However, the literature lacks a systematic, panel-based international comparison and examination of institutions providing securities trading services. The present study attempts to combine the research fields of frontier efficiency analysis and securities market structure approaches. It provides an international comparison exploring the nature of the �production� process in securities trading service institutions. It compares the performance and efficiency of a wide range of stock exchanges and settlement systems over recent years, in a multiple input/multiple output framework. The Chapters include a detailed discussion of the application and relative virtues of different performance techniques. Two main approaches are used in this study: stochastic frontier analysis and data envelopment. They differ by type of estimates, data, and underlying assumptions concerning frontier technology and the economic behavior of stock and settlement institutions. The first approach assumes that it is possible to assign parameters to productive behavior in the industry, while the second is nonparametric. Of course, both have their advantages and 8 Berger and Humphrey (1997) survey and contrast the results of 130 studies on financial institution efficiency covering 21 countries and based on five different frontier efficiency approaches.

18
disadvantages. The study, in particular Chapters 5 and 6, is enhanced by correlation, regression techniques, and graphical evidence to further illustrate and analyze the securities trading infrastructure. 1.3 Organization
Some important technical points deserve mention here. This study is composed of seven Chapters. This introductory Chapter presents the coherent framework of the behavioral underpinnings and performance of the stock exchange and settlement industry. This provides the necessary background and wider context for the remaining Chapters in the study. All Chapters are closely related to each other, especially for Chapters 2, 3, 4, and 6, which provide similar approaches to analyzing efficiency and economies of scale in stock exchanges and securities settlement systems, from both a European and a world-wide perspective, each using a multiple input/multiple output framework. Meanwhile, Chapter 5 provides additional insights into the effects of a networked infrastructure on stock market performance. Thus it is perhaps most convenient to read them in order. However, this is not obligatory, as each Chapter can also stand on its own as an independent study. Each Chapter is comprised of an abstract, a brief introduction, some substantive sections, and a conclusion that summarizes the key issues discussed in the Chapter. The final Chapter 7 discusses some limitations of the study and provides concluding remarks. The remainder is organized as follows: The next part, Section 2, discusses the nature and functions of stock exchanges and settlement institutions and serves as a basis for further analysis. Section 3 discusses methodological aspects of efficiency measurement, network externalities, and tests for economies of scale and scope in the securities exchange and settlement industry. It also provides a note on the data used in the Chapters. Section 4 summarizes the main findings of each Chapter. Section 5 presents the conclusions, followed by the Chapters themselves in their full length.

19
2 Securities exchanges and settlement systems
2.1 Stock exchanges
The literature contains controversial views on and various definitions of what exactly an exchange is. At the most general level, stock exchanges provide facilities for the trading of securities.9 More detailed descriptions of the attributes and characteristics of exchanges usually refer to the functions and services that exchanges perform. A closer look at the operations described in stock exchange�s annual reports indicates that they pursue two distinct activities. The first function relates to the provision of a trading system. In operating a trading system, stock exchanges furnish the computers, software, and personnel for pooling liquidity by matching and processing fairly homogeneous transactions. As mentioned in Lee (1998), the function of providing trading services is very general and irrespective of the type of organization operating the trading system, the range of products traded on the system, the governance structure, regulatory issues, and whether the trading environment is floor-based or fully automated. The second function of stock exchanges involves evaluating issuer-specific information and the procedure for listing companies. Stock exchanges have the personnel and infrastructure required to maintain the marketplace and to communicate with companies to handle the listing of companies. They also monitor how company-specific information is released and whether companies comply with the regulations set by the marketplace. In developing and enforcing listing requirements, the exchange offers a service to the issuers, as it adds value for the company by assuring potential investors that the securities are of a certain quality. The literature (Gehrig, 1998) suggests that financial activities based on straightforward, generally available information tend to be centralized. For example, limit orders and market orders consist of a high degree of simple and standardized information. The processing of such standardized financial activities is therefore a technical matter and does not rely on complex local or issuer-specific information. 9 See Lee (1998) for a survey of definitions and generally accepted meanings of the term �exchange�.

20
That is, all the transactions are treated in more or less the same way. Thus trades can realistically be transferred through electronic networks, which are standardized throughout each country or region. In contrast, complex and issuer-specific financial activities may require face-to-face interactions, eg when individuals make contracts with confidential content, and when proper understanding is crucial. In the case of such non-standardized information, centralization of financial activities becomes less likely and more limited. Therefore, it is likely that geography will continue to be relevant in financial activities and for stock exchanges at the national level, because of their ability to aggregate local, non-standardized and complex information. Beyond listing-related services and the market for secondary trading in securities, a large part of a stock exchange�s business often involves the design, operation, and promotion of trading technologies, as well as data services based on trading data. Apart from offering a platform for trades, exchange organizations may also provide services related to the clearing and settlement of trades. These activities and related aspects are discussed in the following section. 2.2 Depository and settlement systems
In general, securities clearing and settlement involve post-trade services, ie the safe and smooth conclusion of a security transaction. The clearing and settlement process begins after a trade has been executed and the buyer and seller have been brought together (Giovanni Group, 2002; Lannoo and Levin, 2001). The first step, clearing, establishes �who owes what to whom�: clearinghouses balance the respective obligations of the buyer and the seller in a financial market transaction. In some markets, clearinghouses provide additional managerial services to minimize the risk of failure of such trading contracts. They operate as a central counter-party (CCP) by taking contrary positions to all sellers and to all buyers. This intermediate position of a CCP allows for netting off all buy and sells, thereby enormously lowering the final volume, value, and cost of securities settlement. The second step, settlement, represents the physical delivery or mostly dematerialized transfer of ownership of a security and its payment. While payment is usually effected via a banking/payment system, the Central Securities Depository (CSD) usually carries out the delivery of securities directly. However, the settlement is only
21
final once both trading parties have fulfilled their delivery and payment obligations. In this context, an important characteristic of a settlement system is the method of payment. For example, delivery versus payment (DVP) is a special mechanism that allows for simultaneous exchange of funds and securities. Registration in accounts finalizes the security transaction and settlement. Securities are usually deposited in a CSD and managed on behalf of investors by an additional financial entity, consisting of members of the CSD in question. These so-called custodians become more important the more complex an international trade settlement is. In this case, investors may make use of global custodian banks in which they centralize holdings of international issued securities. These global custodians hold membership in a number of local CSDs or have established linkages to local custodians. Alternatively, an international security may be deposited in an international CSD that, unlike their local counterparts, may hold securities that were issued in non-domestic markets.10 In essence, three different types of institutions perform these functions of clearing and settling securities: local CSDs, international CSDs, and custodians. However, each organization more or less supplies its own service and targets different clients. While the activities of the first are bound to the local market, international CSDs provide international settlement services for large investors. Custodians act as an intermediary between international investors and CSDs or ICSDs. Due to differing technical requirements, market practices, legal environments, and institutional arrangements, the securities trading, clearing and settlement infrastructure has traditionally been organized in a multiplicity of systems along national lines, especially in Europe. The parallel operation of several different systems and complex institutional arrangements raises concerns about the efficiency and cost-effectiveness of the securities clearing and settlement sector (Cruickshank, 2001). To empirically test for inefficiency, scale, and network effects in the trading and settlement industry, the following section presents several ways of measuring the relative performance of firms within an industry.
10 See Giovanni (2002) for more specific features of cross-border clearing and settlement.

22
3 Methodological aspects in measuring performance
3.1 Efficiency and productivity as performance drivers
When evaluating the performance of decision-making units, eg financial institutions or exchanges, the idea is to examine whether they operate efficiently and productively. The following paragraphs present a more detailed explanation of productivity and efficiency and how they are quantified, as well as related aspects. Efficiency measures how closely trading and settlement service providers approximate a �best-practice� set of firms or efficient frontier. In other words, efficiency measures deviations from the efficient production function or frontier. Efficiency in this context relates to technical efficiency. As originally introduced by Farrell (1957), technical efficiency describes the ability of a firm or stock exchange to obtain maximal output from a given set of inputs.11 In other words, a stock exchange is technically efficient when no equiproportionate reduction in inputs is feasible without cutting its outputs. For example, a stock exchange may achieve higher profits at lower costs than other stock exchanges if it is able to better combine its inputs and transform them into outputs at lower cost. This concept differs from allocative efficiency. When prices are available, allocative efficiency is measured as the ability of a firm to use inputs and/or outputs in optimized proportions, given their respective prices and given production technology. A combination of both these quantities is often referred to as total economic efficiency. As output price information for trading service providers is not readily available, the focus of this study is on technical efficiency. Depending on the firm�s overall objective (eg minimizing costs vs maximizing profits), it is possible to measure efficiency by comparing observed and optimum costs and revenues (Coelli et al, 1998). Another dimension of performance is the productivity of a firm or an industry. Productivity refers to the ratio of output to input by describing the output volume per unit of input. Economies of scale
11 See Appendix for a detailed presentation of Farrell�s (1957) concept of technical and allocative efficiency.

23
measure the proportional rate of change in output when all inputs are varied by the same amount. When a proportional increase in all inputs entails the same proportional increase in output, this is described as constant returns to scale. Increasing returns to scale exist when a proportional increase results in a disproportionately large increase in output, while decreasing returns to scale indicate a less than proportional increase in output when all inputs are increase in the same proportion (Coelli et al, 1998). In other words, economies of scale exist if the average unit cost decreases when a firm increases the level of outputs. Economies of scale may be expressed in terms of either the production function or the corresponding cost function. The concept of economics of scale must be distinguished from economies of scope. Scope economies arise from potential cost savings resulting from producing two or more outputs jointly rather than separately. Thus, economies of scope enable a firm to spread its fixed costs over a wider range of products. Hypotheses and relevance of economies of scale and scope for the securities trading service industry are discussed in greater detail in Section 3.4. 3.2 Different approaches to measuring
efficiency
3.2.1 Parametric vs non-parametric
The key methodological issue of efficiency is that the true underlying benchmark frontier is unknown and must be estimated from levels found in the data set. Parametric and non-parametric approaches are two distinct methods of estimating efficiency within an industry (Ali and Seiford, 1993; Greene, 1993; Lovell, 1993). A number of different techniques exist for each approach. The choice of the preferred estimation technique is controversial.12 Established methods of efficiency measurement differ mainly in the functional form of the best-practice frontier and the distributional assumptions governing random noise and inefficiency. However, both approaches share a common intent to compare actual vs optimal values of a firm�s output and input.
12 See Lovell (1993) for a review of pros and cons of parametric and non-parametric approaches.

24
In parametric frontier approaches, a stock exchange is labeled inefficient if its costs are higher or profits are lower than the best-practice exchange organization, after adjusting for an error term. There are basically three main parametric methods: Stochastic Frontier Analysis (SFA), Thick Frontier Analysis (TFA), and Distribution Free Approach (DFA). They all specify a functional form for the cost, revenue, or production relationship among inputs, outputs, and other, exogenous factors. The three techniques differ in the way the inefficiency term is disentangled from the composite error term, before one can judge the performance of the individual firm in the sample.13 The present study uses the stochastic frontier approach. The main argument in favor of SFA is that it better accounts for random error than other models. First, the incorporation of a random term appears important, since the analysis is based largely on the accounting data of the sample exchange organizations, which is likely to contain measurement errors. Second, trading service providers may also be heterogeneous with respect to their services, operations and businesses, implying potential specification errors. Additionally, SFA is the preferred parametric method as it is superior in its abilities to generate firm-specific estimates and allow varying inefficiency over time. Chapters 2 and 3 use different SFA models. Non-parametric frontier models like Data Envelopment Analysis (DEA) and Free Disposal Hull (FDH) are less restrictive in determining, ex ante, the shape of the efficient frontier. Instead, the benchmark is generated directly from the observations for the evaluated firms or exchanges. In contrast to DEA, FDH does not control for scale properties of the best-practice frontier and is therefore a less efficient estimator. Like FDH, DEA is a deterministic mathematical programming method for constructing production frontiers and for measuring efficiency relative to the benchmark constructed. The main advantage of non-parametric models is that the production frontier does not need to be determined by a generic functional form, hence no prior assumptions are required regarding the underlying distribution of inefficiencies across the evaluated firms. The main drawback of non-parametric models, however, is that they do not account for random error affecting firms� performance. Different techniques have been developed to generalize and extend the standard DEA non-parametric approach. For example, a useful supplement used in this study is the DEA-like Malmquist index 13 See Bauer et al (1998) for a detailed discussion and comparison between a stochastic frontier model, a thick frontier model, a distribution free model, and Data Envelopment Analysis.

25
method of productivity measurement, which adds explanatory power with respect to the sources of improvements in efficiency. This technique is employed in Chapter 4. Because of differences in the assumptions and setup of the parametric and non-parametric approaches, the final answer to the question of which frontier method is best for measuring the performance of decision-making units, in this case stock exchange organizations, clearly depends on the researchers� objectives. Overall, parametric techniques are better in estimating efficiency, while non-parametric models are more useful when analyzing the sources of changes in productivity. In this study, the preferred parametric and non-parametric methods are the SFA and DEA-like Malmquist index approach, respectively. In summary, the key arguments in favor of the SFA model are its advantages with respect to hypothesis testing, fit, and incorporation of a disturbance term. SFA yields individual efficiency scores for the stock exchanges evaluated, which allows testing for differences between stock exchanges across different markets. As mentioned above, the DEA-based Malmquist index offers a useful tool for analyzing sources of improvements in securities markets over time. The following two sections discuss the two preferred models in detail. 3.2.2 Stochastic frontier models
In stochastic econometric frontier models, the functional form to be estimated for the cost, profit, or production relationship among inputs, outputs and environmental factors, is supposed to be accompanied by a composite disturbance. This residual term in turn may be split up into two parts. One component of the error term accounts for traditional noise and uncontrollable factors, while the second component captures individual firm deviations or errors due to factors within control of management, such as technical and allocative efficiency. While random errors follow a symmetric distribution, usually the standard normal, inefficiencies are assumed to have an asymmetric distribution, usually half-normal.14 The basic idea is that inefficiencies must have a truncated distribution because inefficiencies are bound to be non-negative. As originally proposed by Aigner et al (1977) and Meeusen and van den Broeck (1977), the parameters of the
14 See Aigner et al (1977), Greene (1990) and Stevenson (1980) for a discussion of alternative distributional assumptions.

26
two distributions are estimated and may be used to obtain firm individual inefficiency scores. Accordingly, the estimated inefficiencies are taken as the conditional mean or mode of the distribution of the inefficiency, given the observation of the composed error term.15 Constructing a benchmark model for stock exchange efficiency requires a priori specification of an appropriate functional form for the empirical model. Different functional forms were considered and applied in this study, before settling on the standard translog function, a standard approach. Unlike Cobb-Douglas or CES alternatives, a translog model has the nice feature that it accommodates multiple outputs and that it is flexible to approximate second-order terms of any well-behaved multivariate function, eg a cost or revenue function. Greater flexibility can be achieved by using the Fourier-Flexible-Form, which is a global approximation including a standard translog plus Fourier trigonometric terms. However, the evidence suggests that the differences between the two functions are marginal (Berger and Mester, 1997). As the number of parameters increases in the Fourier form, the significant levels for many of the coefficients can be small, given the relatively small data set of exchange organization. Therefore, the models presented herein collectively follow the standard approach by using a translog functional form (Christensen et al, 1973).16 Once the efficiency concepts and measurement methods are used and applied to the same data set of stock exchange organizations, an attempt is made to explain remaining differences in efficiency across exchanges. In particular, the analyses investigate potential correlation between stock exchange efficiency and firm-specific factors reflecting various aspects of the exchange organization, its strategy, management practices, and conditions of the environment and relevant markets. Methodologically, inefficiency can be modeled in two distinct ways (Kumbhakar and Lovell, 2000). The first approach consists of two stages: the first stage estimates a stochastic frontier. The predicted efficiencies are then regressed against the exogenous variables in a second stage. The second approach specifies stochastic frontier models in which inefficiency effects are modeled as explicit functions of firm-specific factors. Accordingly, all parameters are
15 The reader is referred to the respective chapters of this study and to Coelli et al (1998), Fried et al (1993), Kumbhakar and Lovell (2000), and the other cited references for additional methodological details. 16 See the respective papers for detailed formulation on the cost and revenue functions as well as input/output specification.

27
estimated in a single-stage procedure (Battese and Coelli, 1995; Kumbhakar et al, 1991; Reifschneider and Stevenson, 1991). These techniques are used in Chapters 2 and 3. Each Chapter also highlights the advantages and disadvantages of both approaches. 3.2.3 Data envelopment analysis
Although the stochastic frontier approach as described in the previous section allows the researcher to gain a picture of relevant variables that may be contributing to inefficiency, it pays little attention to the ways in which securities markets develop and the sources of changes in performance. In non-parametric models, such as DEA, it is possible to more closely examine the sources of efficiency improvements in securities markets. DEA is a linear mathematical programming technique for measuring relative efficiency, first formulated by Banker et al (1984) and Charnes et al (1978). DEA constructs a convex piece-wise surface that connects the set of all best-practice observations in the dataset. The efficient frontier envelops all other data points, hence the name. Relative efficiency is then computed as a ratio of outputs over inputs for each firm or stock exchange. As such, DEA does not require prior specification of the underlying production relationship or needs in order to make prior assumptions concerning the form of the distribution of inefficiencies across observations. The DEA concept is applicable for single-period time settings. However, a new dimension comes into play when a researcher intends to compare different sample exchanges over time. Essentially, the observations of each individual member of the sample are no longer solely evaluated against the efficient frontier of the same time period, but also measured against a second benchmark of the previous time period. This is the basic idea of the DEA-like Malmquist indices. When suitable panel data are available, the Malmquist index allows for computing changes in the performance of an individual exchange within a multiple input/output setting between two adjacent periods of time. Moreover, decomposition of the Malmquist index provides the researcher with effective tools to judge whether improvements in exchanges� overall performance stems from changes in efficiency or from shifts in technology. A further extension of this approach is to divide changes in technical efficiency into scale efficiency and �pure� technical efficiency by assuming that not all exchanges are operating at optimal scale. In this case, the DEA model accounts for variable returns to scale (VRS) situations and ensures that only inefficient exchanges of

28
equal size are benchmarked against each other, which differs from the constant return to scale (CRS) assumption (Banker et al, 1984). Hence, VRS DEA models yield technical efficiencies of a particular exchange, which are not scale dependent. In other words, any difference between CRS and VRS technical efficiency scores indicates that the exchange in question has scale inefficiency. Technically, calculating the components of Malmquist indices requires solving a number of linear programming problems. These equations are presented in Chapter 4. 3.3 Network externalities
The way in which the stock exchange industry develops may be analyzed within the framework of network economics. The concept of networks and network externalities applies to a number of industries, eg telecommunications, airlines, railroads, banks (ATMs), etc.17 Network externalities refer to the added value for an individual as the number of participants in the network increases. According to Economides (1993), in a typical network, the addition of a new customer increases the willingness to pay for network services among all participants. A number of researchers have applied the concept of networks to financial intermediation and securities markets. Economides (1993) establishes that stock exchanges may be considered as networks since the more traders enter the market, the more market uncertainty is diminished. Similarly, Domowitz (1995) and Domowitz and Steil (1999) state that an exchange or a trading system is analogous to a communication network, as the benefit to one trader transacting on a given trading system increases when another trader chooses to transact there as well. Economides (1996) points out that there are two ways in which financial exchange networks exhibit network externalities. First, the act of matching securities trades generates a composite good, which is the �exchange transaction.� For the transaction to take place, it is crucial that minimum liquidity be available. Second, network effects may result from the different vertically related services required for a transaction, ie brokerage services. However, the first source of network externality plays a more important role in financial markets. Positive-size externality is an essential property of financial market networks in the sense that the expected utility for all network 17 See Shy (2001) for an overview of network applications.
29
participants positively depends on the thickness of the exchange market. Economides and Siow (1988) show that liquidity considerations limit the number of markets in a competitive economy. In their spatial competition model with liquidity as a positive externality, there may be too few markets because nobody wants to use a new market with low liquidity. Economides (1993) argues that networks, like electronic trading systems, are by nature self-reinforcing and frequently exhibit positive critical mass meaning that in the presence of one network, a differently organized network is not likely to exist. In this sense, network providers have market power through the setting of standards for the network. As a matter of fact, stock exchanges set the rules and regulations for their trading systems. As the literature suggests, strong network externalities encourage exchanges to establish formal or informal linkages (Domowitz, 1995). The exact design of such interconnections is less important. They may take the shape of implicit and explicit acquisitions and mergers, strategic alliances, simply pooling order-flows, or even information-sharing arrangements (Domowitz and Steil, 1999). Exchanges that are less active in forming alliances or linkages are likely to lose competitive ground vis-à-vis their peers who pursue network strategies. The existing literature on networks with application to finance is theoretical or descriptive in nature. A number of articles focus on the impact of cross-listing across exchanges and evaluate its impact on stock prices18. Cybo-Ottone et al (2000) outline the merger activities of exchanges over the past decade; however, they did not investigate any likely relationship between networks or implicit mergers and different elements of exchange-specific performance. Thus, there is an obvious need for empirical research in this area. Chapter 5 attempts to fill this gap. 3.4 Economies of scale and scope
The analysis of cost structures in the securities industry can yield useful information for three main reasons. First, in securities markets, if there is evidence of potential economies of scale, one might expect that large-scale exchange or settlement organizations would enjoy numerous competitive advantages and drive their smaller counterparts 18 See Blass and Yafeh (2001), Chaplinsky and Ramchand (2000), Foerster and Karolyi (1993), Karolyi (1998), Pagano et al (2002).

30
out of business as the barriers between them fall. Second, in response to tighter competition, smaller organizations may engage in mergers or alliances in order to benefit from potential cost savings as they change in size. Third, information about the industry�s cost structure can help regulatory authorities to formulate policies that strive to ensure the efficient and smooth functioning of the settlement systems. Securities depository and settlement businesses appear to be subject to strong economies of scale since these service providers handle and process thousands of standardized securities transactions. Accordingly, settlement providers try to achieve a critical mass of customers in order to spread heavy investments in information technology and efficient settlement systems over a large number of transactions, which reduces the unit cost per settled transaction. An empirical assessment of economies of scale in depository and settlement facilities is the main focus of Chapter 6.19 In general, the concept of potential economies of scale maintains that average or unit cost decreases when all outputs are expanded by the same proportion per time period; ie scale economies are available if the sum of the cost output elasticities is smaller than one, whereas scores above unity imply diseconomies. In a multi-product setting, economies of scale may be measured using Baumol et al�s (1988) concept of ray average cost. According to Baumol et al (1988), the degree of multi-product economies of scale refers to proportionate changes in the quantities of the entire product set. In this context, scale economies are considered along a particular, loglinear expansion path. The increased use of new system technologies and communication networks creates opportunities for settlement providers to expand and exploit economies of scale in settlement businesses. In order to separate effects from increased automation and technological advancements, the proposed models account for characteristics of the underlying technology, thus measuring the pace and direction of change in cost functions over time. Additional cost savings may arise if single output production is more costly than multi-product production. In this sense, economies of scope exist when the joint production of multiple goods and services is less costly than the sum of costs of the same bundle of services if produced separately. Diseconomies of scope are present when the marginal costs of joint production exceed the sum of independent production cost. However, the measurement of economies of scope
19 See Hasan and Malkamäki (2001) for an analysis of economies of scale and scope among stock exchanges.

31
requires a number of caveats. For example, this measure assumes that cost structures of single and multi-product firms are comparable. Berger et al (1987) point out that translog models are undefined for zero output levels and claim that the outcomes depend on the zero output approximation. Mester (1987) attempts to address these limitations by incorporating ad hoc values for zero output levels in translog models. However, the results of such corrected models remain rather sensitive to the ad hoc parameters and variables selected. For these reasons, further analysis of the cost structures of international settlement arrangements concentrates on the estimation of economies of scale. In summary, the concepts of economies of scale and scope differ from the concept of efficiency. While efficiency requires a firm to operate on the highest feasible production frontier or on the minimum attainable cost function, scale economies require a firm to produce at a point of constant returns to scale at which the average cost is minimized. 3.5 Database
A close examination of the securities industry calls for information on trading activities, stock market indicators, and other economic statistics, as well as on individual data for a broad set of stock exchanges and settlement institutions over time. As a result, over the years a new database has arisen, which serves as the basis for each of the Chapters. This database draws on a wide range of sources and allows for a comprehensive assessment of the development, structure, and competitive performance of stock exchanges and settlement service operators. It allows for constructing indicators of performance, size, organizational design, network activity, and management practices. In each case, the studies attempted to include as many exchanges as possible to answer the stated research questions. Although there is an inherent bias towards Europe, the analysis takes an international approach, looking at securities markets and settlement systems in a broad spectrum of developed and emerging markets. In all, this study covers 49 stock exchanges, of which 25 are registered in Europe, from 1985 to 1999. The initial efficiency study in Chapter 2 covers 17 of the major European exchanges for the period 1985�1999, while the analysis in Chapter 3 considers a wider range of 49 exchanges world-wide for 1989�1998. Chapters 2 and 3 use translog frontier functions.

32
Chapter 4 is a data envelopment study that covers 16 European exchanges for the period 1993�1999. In order to examine network effects among stock exchanges, Chapter 5 uses a unique data set containing information on 24 individual exchanges over the five year period from 1996 to 2000. Chapter 6 sampled data for a set of 16 depository and settlement institutions in various regions for the years 1993�2000. The DEA study uses a balanced dataset, whereas the other analyses are based on unbalanced datasets with substantially more observations in more recent years after 1993. The data is derived from a variety of sources, including the balance sheet and profit and loss accounts taken from the annual reports of the individual exchanges and settlement institutions for a number of years; various issues of the International Federation of Stock Exchanges (FIBV) Yearbook; IMF International Financial Statistics (IFS); European Central Bank Blue Book on Payment and Securities Settlement Systems in the European Union; Bank for International Settlement Statistics on Payment and Settlement Systems; the MSCI Handbook; the Thomas Murray CSD Guide; Elkins/McSherry Universe, and the institutions� homepages. All variables and indicators used in the models are discussed in detail in each of the studies. In all analyses, national currencies were converted to USD and deflated using CPI data from IFS.20
20 The Appendix at the end of this study contains a more detailed description of the data sample and definitions of the individual variables and proxies.

33
4 Performance results of securities exchanges and settlement institutions
4.1 Efficiency of European stock exchanges
As previous studies of the greater importance of equity markets in economic development suggest, the EU as a whole would benefit from a more integrated, stable, and smoothly functioning single market in financial services (Committee of Wise Men, 2001). For this reason, monetary and policy bodies have traditionally had a keen interest in monitoring, evaluating, and studying developments in European and global financial markets. Technological developments, regulatory changes, and globalization are generally considered the main drivers of major changes in modern global and European financial exchange markets. However, relatively little is known about the impact of such forces on the efficient organization of these markets. Chapter 2 studies the efficient structure and organization of stock exchanges in a European context. The present study attempts to evaluate stock exchange performance, treating exchanges as regular operating firms (Arnold et al, 1999; Pirrong, 1999). It expands on related empirical work in securities markets research, by using stochastic frontier techniques to estimate technical efficiency. Interest in �frontier� analysis of economic efficiency has grown rapidly over the past two decades and econometric modeling and estimation of efficiency has been widely employed in banking efficiency studies (Berger and Humphrey, 1997). Using the latest stochastic frontier estimation techniques (Battese and Coelli, 1995), Chapter 2 quantifies the efficiency of stock exchanges in a single-stage approach. In addition, it analyzes exchange-specific factors that may explain departures from the benchmark. The most striking thing about the empirical results presented in the second Chapter is the existence of considerable inefficiencies in the European securities industry. It is shown that European stock exchanges operate at 20�25 percent above the �best-practice� frontier. The efficiency of the sample exchanges improved over the sample period. Chapter 2 also examines the relationship between exchange institution efficiency and organizational form. The evidence suggests that efficiency of European stock exchanges is directly correlated with

34
a greater size of the exchange, demutualization, adoption of automated trading systems, and diversification in trading service activities. The results were found to be statistically robust vs alternative model specifications. 4.2 Stock exchange performance and
technological innovation world-wide
Chapter 3 traces the performance � cost and revenue efficiency � of stock exchanges over time, across different organizational set-ups, and from a global perspective. It builds on the initial efficiency study of Chapter 2 and uses a sample of exchanges across world-wide regions. It also investigates, among other things, the impact of technology on the revenue and cost efficiency of sample exchanges. The aspect of evolving technology is of great importance, as it is seen as one of the key drivers for recent growth in world-wide securities trading. However, at present nothing is known about the impact of new technologies on the efficiency of exchanges. Chapter 3 focuses on the influence of organizational type, structure, and corporate governance on cost and revenue efficiency. Similar to the results from the European sample, the results in Chapter 3 suggest the existence of substantial revenue and cost inefficiency across exchanges. Overall, North American exchanges are the most cost- and revenue-efficient, followed by European exchanges. Exchanges in South American and Asia-Pacific regions appear to be lagging behind in both cost and revenue efficiency estimations. Controlling for technical change, the results show considerable efficiency gains over time, which might be due in part to the effects of the opening-up and globalization of markets over the time period under study. In particular, European exchanges reveal the highest degree of improvement, at least in terms of cost efficiency. Consistent with the theoretical predictions of Domowitz and Steil (1999) and Williamson (1999), the empirical results suggest that commitments and initiatives in technology-related advancements are worthwhile and productive, as these were found to be positively and significantly associated with overall cost and revenue efficiency. Moreover, it is likely that, in future, exchanges will not only engage in the business of listing and trading stocks, but will also increasingly promote their own trading technology to other exchange partners and participants. As in Chapter 2, the results of Chapter 3 support the view that organizational structure and market competition are significantly

35
related to an exchange�s performance. In particular, automated exchanges are more efficient than their auction counterparts. Additionally, trading in derivatives, having a for-profit ownership structure, and having a larger number of exchanges in a country are associated with greater efficiency. 4.3 Non-parametric estimates
Chapter 4 goes one step further in examining efficiency in European stock exchanges, by evaluating major sources affecting productivity growth in the stock exchange industry. While Chapters 2 and 3 use stochastic frontier analysis to analyze the efficiency of stock exchanges, Chapter 4 performs a non-parametric productivity analysis of stock exchanges using DEA piecewise linear production function and the Malmquist productivity index. The calculation of Malmquist indices allows for analyzing the pattern of efficiency gains and the impact of technological innovation on overall performance and production productivity of European stock exchanges. A further decomposition of the Malmquist indices results in additional evidence of technical change, pure technical efficiency and scale efficiency. The results from this study reveal that total factor productivity in the European stock exchange industry increased at an average annual rate of 5% over the period 1994�1999. The increase in productivity was shown to be mainly the result of technical change rather than of improvements in pure technical efficiency. This finding supports the view that technological innovation plays a pivotal role in shaping trading service industry. In this sense, technological progress can be seen as a sign of the dynamic nature of the whole securities industry, where stock exchanges go to extraordinary lengths to adopt new cost-effective technologies and have to cope with an increasingly competitive market environment. The results suggest that exchanges benefited from intense diffusion and spillover of new technologies and information systems, enabling them to operate on a higher production frontier. Largely consistent with the SFA-based analyses, the results of Chapter 4 indicate higher technological progress for exchanges that share characteristics of automation, equity and derivative trading, for-profit governance structure, and large and mid-sized capitalized markets. Building on this analytical framework, the second part of Chapter 3 discusses the potential implications of the empirical results as it takes a look at future prospects for policy and market design. It argues

36
that technological innovation and networked electronic trading platforms will stimulate potential for productivity growth and improved efficiency in the stock exchange industry in the near future. Moreover, it can be expected that merger activities and formation of alliances contribute to productivity improvements as they enhance efficiency or scale economies or increase market power by centralizing trading services. Additionally, by collaborating, exchanges can benefit from pooling their interests to jointly invest in new trading technologies by sharing the high investment and setup costs for such technologies. Another possible development is that stock exchanges could become more and more active in licensing or selling their trading technologies to other trading service operators. This would likely result in the use of more standardized technologies and trading systems; a high degree of compatibility among different systems would pave the way for further alliances and co-operative actions among exchanges. In summary, the evidence supports the view that money spent on technology, appropriate organizational structure, network involvement, and corporate governance is a crucial component of strategic decision-making and performance during the time period under study and for the near future. As exchanges continue to go through transition and innovation, it is important to study stock exchanges as conventional firms, and examine them in terms of operating strategies, market environment and performance. 4.4 Stock exchange alliances and network
externalities
Economic theory of network externalities provides the framework for Chapter 5�s analysis of possible effects of network strategies on the overall performance of European stock exchanges. Evidence of network effects is beginning to emerge in various ways and is visible in a number of international alliances and co-operative arrangements between exchanges around the globe. The implications of electronic trading are crucial and far-reaching for the entire securities industry. In this context, a number of recently established market linkages and cooperative arrangements proposed and undertaken by various financial exchanges deserve particular attention. As the results of the previous sections suggest, the innovation and implementation of new electronic trading technologies differs considerably across different regions, cultures, and organizational structures; and exchanges have

37
been undergoing enormous transition in recent years. A closer look at existing inter-exchange connections confirms that European exchanges are the most active �networkers�, and more inclined to implicit mergers or alliances and other collaborative initiatives. In fact, the majority of the 100 inter-exchange network-related deals in the world are in Europe (Cybo-Ottone et al, 2000).21 The first step in Chapter 5 is the identification and classification of actual or potential strategic collaboration, inter-market connections, and network-related deals in Europe and beyond. This is done by quantifying network strategies and the extent of networking in European stock exchanges in recent years. It also maps the present architecture of market linkages and cooperation proposed and undertaken by various stock and derivative exchanges, showing a complex and networked European securities trading landscape.22 The second stage in Chapter 5 is an empirical investigation of the potential relationship between network initiatives and collaboration and several measures of exchange performance and efficiency. By tracing the experiences of all major European exchanges over the second half of the 1990s, Chapter 5 examines the impact of network effects on market liquidity, growth, turnover velocity, transaction costs of trading and the cost of exchange operations. The empirical results show a strong and statistically significant correlation between decisions to collaborate and exchange performance. In particular, the empirical evidence clearly suggests a significant relationship between the adoption of network strategies and market capitalization, growth, and efficiency. Network strategy also apparently helps markets to lower the transaction costs of trades as well as the costs of operating a stock exchange. All results are robust even after controlling for other pertinent variables that are likely to affect stock exchange performance and efficiency.
21 See Cybo-Ottone et al (2000), Domowitz (1995), Domowitz and Steil (1999), Lee (1998), Licht (1998) for an extensive description of historical deals among stock exchanges. 22 See Figure 2.1 for an overview of networks of European stock and derivative exchanges.

38
4.5 Economies of scale in depository and settlement businesses
While the focus of the aforementioned studies is on stock and derivative exchanges, Chapter 6 tests for economies of scale in the depository and settlement industry. This Chapter seeks to analyze potential cost savings arising from concentrating depository and settlement activities, and gives separate perspectives for different world regions, size and scope of settlement services. Different cost functions were estimated in order to investigate economies of scale among settlement institutions. At present, particularly in Europe, the settlement infrastructure is fragmented along national lines, making cross-border trading and settlement costly. This impedes the further integration and efficient and smooth functioning of a truly pan-European capital market (Giovanni Group, 2002). The empirical findings of the last Chapter reveal considerable economies of scale related to depository and settlement businesses. It turns out that the centralized US system is the most cost-effective settlement system and may serve as a benchmark for cost saving. In contrast, European and Asia-Pacific settlement institutions show the highest potential for unit cost savings. Similar results are found for relatively small settlement systems where the rule of thumb applies that costs should increase by about two-thirds as settlement and depository activities double. Equally important, the evidence supports the view that operating costs for settling trades across borders are substantially higher than those for operating domestic settlement systems. This finding obviously reflects the current complex structure of international securities settlement and prevailing differences in the underlying scope of international settlement service providers. Additionally, it was found that investments in new systems or upgrades of settlement technologies always lowered the costs of running settlement systems. What can be inferred from the results of Chapter 6 regarding future market policy and design? As acknowledged in ECB (2000), integration processes between securities settlement providers are generally driven by economies of scale and scope. One plausible implication from the present study is that an expansion or pooling of depository and settlement businesses is likely to enhance unit cost savings for small and medium-sized institutions. Therefore, smaller institutions may be well advised to accelerate their investment plans, change their pricing policies, or create implicit mergers or alliances, thereby stimulating higher production at lower unit cost in their

39
provision of settlement and depository services. Market regulation also appears to have a substantial impact on the effectiveness of the operative infrastructure in the settlement industry. As evidenced by the regulated and centralized US market, settlement activities are carried out in the US at almost optimal scale, vs the less cost-effective European and Asia-Pacific systems. However, against the backdrop of a number of integration barriers in the EU, it remains unclear to what extent the US experience could be successfully transferred to Europe. For the European case, it seems more likely that integration will take the form of collaboration or consolidation between existing settlement service providers, while in other markets totally new infrastructure solutions could be more feasible.

40
5 Conclusions
5.1 Summary of motivation and results
The aim and scope of the present study was to investigate the performance of the securities trading and settlement industry. This study empirically analyzes the existence and extent of efficiency, economies of scale, and technological developments in stock exchanges and securities depository and settlement systems. To my knowledge, this is the first time in the empirical literature that an attempt was made to assess the performance of securities trading service providers, treating them as regular operating firms in line with the theoretical considerations of Arnold et al (1999) and Pirrong (1999). This approach is of great importance for the evolution of market structures and contestability of markets because stock exchanges and settlement agencies make choices concerning their businesses and trading technologies, ie the supply side of their trading and settlement services. Domowitz and Steil (1999) pointed out that the industrial structure of market places cannot be explained by focusing on the demand side alone, as is the case in financial market microstructure studies that concentrate on the characteristics of trading systems and the demand side of trading services (ie the traders). It is equally important to compare the providers of alternative technologies for trading services. Against this backdrop, the present study evaluates securities trading industry from a supply-side perspective. This study entails finance applications using parametric as well as non-parametric frontier analyses to evaluate the performance of the securities trading industry. Various cost and revenue functions were estimated in order to explore the nature of the �production� process of a wide range of stock exchanges and settlement systems over recent years in a multiple input/multiple output framework allowing for an international comparison with respect to efficiency, economies of scale, organizational and technological aspects. Using well-established panel regression techniques and approaches adopted from other fields of research, the study investigates the interrelation between the institutional arrangement of stock markets and overall performance and interlinking in securities markets. Basically, by employing a number of different methods, combined with a range of analytical procedures, the answers to the aforementioned research questions become surprisingly clear. At the

41
risk of oversimplifying, the findings of this study may be summarized as follows: 1. There is clear evidence on considerable room for improving the
efficiency of stock exchanges both in Europe and beyond. In other words, the securities market infrastructure, eg stock exchanges, is not as efficient as it could be. The major North American exchanges were found to be most efficient. Although in their current state, European exchanges are still operating below benchmark efficiency, they have successfully narrowed the gap to North American efficiency levels in recent years.
2. The evidence reveals a positive correlation between organizational
structures, ie issues of exchange governance, size, activities that include derivatives, and the efficiency and performance of stock exchanges. These findings are supported by theoretical predictions of appropriate governance practices of stock exchanges (Hart and Moore, 1996; Pirrong, 1999).
3. It turns out that technological change through money spent on
electronic trading systems and automation positively influences the overall performance of securities markets and settlement systems.
4. In fact, technological change appears to be the key driver of
changes in total productivity in exchanges. 5. The adoption of network strategies and relationships was found to
be a promising way for European exchange markets to create additional value in the provision of trading services. Overall, investments in new technologies and network involvement are crucial components in strategic decision-making and performance.
6. There is evidence on substantial economies of scale in depository
and settlement systems. The extent of such scale economies, however, differs by size of settlement institution and region. The centralized and regulated US system serves as the most cost-effective benchmark, while settlement systems in Europe and Asia appear to be operating at a sub-optimal scale. Overall cost-effectiveness improved steadily over the sample period, partly due to technological innovation and upgrades in settlement technologies.

42
7. In Europe and the rest of the world, additional vertically or horizontally integrated structures in the securities industry are likely to develop as the result of interoperability, alliances, joint ventures and mergers. In the long run, these developments will increase market efficiency, improve economies of scale and reduce the average transaction costs to final users. In general, consolidation should be driven by the private sector. However, in practice, if markets fail to find optimal solutions, regulatory interim solutions may be warranted. In this case, policy authorities may act as catalysts and are challenged to remove unfair and unjustified barriers to integration and competition. First initiatives in this direction were achieved by the recent agreement on a more efficient EU legislative process in order to create a truly integrated European financial services and capital market (Committee of Wise Men, 2001).
5.2 Outlook for future research
This study makes no claim to exhaustiveness in describing the performance of securities stock exchanges and settlement systems. However, it contributes to a better understanding of the overall performance picture and strategic and behavioral underpinnings of the trading service institutions. What are possible promising directions for future research? Each of the Chapters raises several research questions that deserve further investigation. Some general research themes can be outlined. First, this study exclusively covers stock exchanges and settlement institutions. A closer institutional and comparative analysis of new alternative electronic trading venues, eg ECNs and ATS, is beyond the scope of this study and is therefore left for future research. Second, if more detailed data becomes available in the future, it would be useful to carry out a similar analysis for other securities market institutions in the transaction value chain, such as central counterparties and custodian banks. In any case, empirical studies on securities trading service providers should take into account the prevailing complex infrastructure and nature of this industry. However, as these institutions continue to experience transition and innovation, it is important that they are studied as conventional firms and examined in terms of operating strategies, market environment and performance.

43
Third, because stock exchanges around the globe are increasingly moving towards a more heavily networked market set-up, the issue of technological innovations in international securities markets may become increasingly topical in the future. Therefore, further empirical attempts on the impact of new technologies on the exchange industry and financial markets seem to be fruitful ways in which to extend this study. Even more generally, the question can be raised, in which financial markets are likely to develop over coming years in the age of electronification and other technical innovations? What will the future trading landscape look like? Who will be the winners and losers in future securities markets? These sweeping and challenging questions are still open to debate and study. Fourth, this study looks at the performance of the institutions that provide trading and post-trading services for securities transactions. Shifting the focus of the analysis to another level, future research may well address inter-organizational issues. This would increase the understanding of the processes in which stock exchanges and settlement system providers operate. From the perspective of competition, it would be interesting to study the cost and pricing structures of operational processes of stock exchanges and clearing and settlement companies. In particular, additional insights could be gained whether some securities exchanges try to cross-subsidize their trading or settlement systems or services by using profits earned in one particular business activity to support against key rival markets or cover losses in other critical businesses. Given the unavailability of consistent data at current stage, these aspects are left for future research. Fifth, the stock exchanges� or settlement service providers� position in the market may also be important in explaining its performance.23 In the context of the European stock exchanges, preliminary research initiatives confirm the intuition that changes in the industry structure make exchanges facing tighter competition from other exchanges as well as from brokers (Andersen, 2003). These
23 For example, in the banking literature, a vast number of researchers proposed different approaches to investigate the structure-performance relationship in international banking markets (Molyneux et al, 1997). A positive relationship between concentration and performance has been found in some, but far from all, of the empirical studies investigating bank market structure and performance. The lack of consistent results have led some researchers to conclude that the literature contains too many inconsistencies and contradictions to establish a satisfactory structure-performance relationship in banking. In addition, despite being numerous empirical studies, it became clear that the structure-performance hypothesis and the role of market structure warrants a more explicit model of the banking firm (Hannan, 1991).

44
findings support the view that a more rewarding approach to study stock exchanges� performance might be through inefficiency. One may also object that even if industrial structure and market power approaches help to explain stock exchanges� performance, empirical testing that might explain also differences in exchanges� performance is not obvious. However, to complete the overall picture on the strategic behavior and performance of stock exchanges in a changing technological and regulatory environment, there is clearly a need for researchers to continue to undertake more research in the area of concentration and market power analysis. This might include also comparisons of results obtained from different estimation methods. Finally, dating back to Schumpeter (1911), a considerable amount of economic literature has emerged over the past century, which emphasizes the positive influence of the development of a country�s financial sector on the level and growth of its per capita income. Although some competing views proclaim reverse causality, existing empirical work consistently find, however, supporting evidence that the services of financial systems are important for productivity growth and economic development (Goldsmith, 1969; more recently King and Levine, 1993a; Rajan and Zingales, 1998). Other important contributions in the literature on the finance and growth nexus have established with reasonable confidence that financial development, characterized by sizeable banking sector and stock markets, as well as cross-country differences in legal and accounting standards, promote economic growth (King and Levine, 1993b; Levine and Zervos, 1998; Beck et al, 2000; Levine et al, 2000).24 The next important step in the research agenda would involve digging further into the micro-details governing the actual functioning of the finance-growth link. For example, Cetorelli and Gambera (2001) provide evidence that concentration in the banking industry plays a substantial role in growth by facilitating younger firms� access to credit. An micro-macro assessment whether financial sector efficiency has empirical relevance for economic growth would require first a comprehensive cross-country efficiency analysis of the financial service industry exploring the nature of the production process in banks, stock exchanges, and possibly other relevant financial entities. Building on the results of a financial sector efficiency analysis, further research would involve a closer examination whether efficient and well-functioning stock markets and banks promote economic growth. 24 In the short term, it should be noted that more liberal commitments in the framework of the WTO negations on trade, esp. in banking and securities services, may imply greater vulnerability to financial crises and instability in the financial sector (Valckx, 2002)

45
If suitable panel data becomes available, future work might investigate whether measures of financial system efficiency are robustly correlated with current and future rates of economic growth. This approach would also require to control for a broad set of economic and political factors that may influence growth to gauge the sensitivity of the results to changes in the conditioning information set. In particular for the European area, future research in this area could improve the understanding of the relationship between financial integration, financial development and economic efficiency in view of the Community�s effort to accelerate the completion of the Internal Market and to promote efficient euro-denominated financial markets. As expected overall results, one might anticipate a positive linkage between the efficient provision of financial services and stronger growth across countries. It is likely that improved financial system efficiency stimulate growth by channeling, more effectively, resources to productivity-enhancing endeavors. More insights on the finance-growth linkage could be gained with respect to differences between industrialized and developing countries. It seems also plausible that improvements in efficiency of the financial intermediaries industry are associated with electronification and other aspects of technological advances in the financial services production process. This would suggest that financial sector efficiency is an integral part of the growth process and emphasize the importance of an improved efficient and consolidated institutional structure of the financial sector. In this respect, any policies that impedes or alters overall economic efficiency of the financial sector would enhance an economically negative influence on growth. Particular attention should be paid to improving the understanding of a causal relationship, if any, between financial performance, financial efficiency of intermediaries, ie stock exchanges, settlement systems, banking institutions, etc, and financial development and integration as well as the financial system�s economic growth and stability. Only then one can fully comprehend the performance of international securities trading institutions within the financial markets in which they operate. This in turn can lead to a better understanding of the impact and importance of financial institutional efficiency and integration in overall economic growth and financial stability.
46
References Aigner, D.J. � Lovell, C.A.K. � Schmidt, P. (1977) Specification and
estimation of frontier production, profit and cost functions. Journal of Econometrics, 6, 21�37.
Ali, A.I. - Seiford, L. (1993) The mathematical programming
approach to efficiency analysis. In: Fried, H.O., Lovell, C.A.K. and Schmidt, S. S. (eds.), The Measurement of Productive Efficiency, New York, Oxford University Press.
Andersen, A. (2003) Competition between European stock
exchanges. Helsinki School of Economics Working Paper, No. W-342.
Annual Reports (1985�1999) Annual reports of 49 stock and
derivative exchanges. Annual Reports (1993�2000) Annual reports of 16 depository and
settlement institutions. Arnold, T. � Hersch, P. � Mulherin, J.H. � Netter, J. (1999) Merging
markets. Journal of Finance, 52, 655�681. Atje, R. � Jovanovic, B. (1993) Stock markets and development.
European Economic Review, 37, 632�640. Bank for International Settlements (1995) Cross-border securities
settlements. Basel, Switzerland, March 1995. Bank for International Settlements, various issues. Statistics on
payment systems in the Group of Ten countries, Basel. Banker, R.D. � Charnes, A. � Cooper, W.W. (1984) Some models for
estimating technical and scale inefficiencies in Data Envelopment Analysis. Management Science, 30, 1078�1092.
Battalio, R.H. (1997) Third market broker-dealers: Cost
competitors or cream Skimmers? Journal of Finance, 52, 1, 241�252.

47
Battese, G. � Coelli, T. (1995) A model for technical inefficiency effects in a stochastic frontier production function for panel data. Empirical Economics, 20, 325�332.
Bauer, P.W. � Berger, A.N. � Ferrier, G.D. � Humphrey, D.B. (1998)
Consistency condition for regulatory analysis of financial institutions: A comparison of frontier efficiency methods. Journal of Economics and Business, 50, 85�114.
Baumol, W.J. � Panzar, J.C. � Willing, R.D. (1988) Contestable
markets and the theory of industry structure. Harcourt Brace Jovanovich, Publishers, Orlando, Florida 32887, USA.
Beck, Th. � Levine, R. � Loayza, N. (2000) Finance and the sources
of growth. Journal of Financial Economics, 58, 261�300. Bencivenga, V. � Smith, B. (1991) Financial intermediation and
endogenous growth. Review of Economic Studies, 58, 195�209. Berger, A.N. � Hanweck, G.A. � Humphrey, D.B. (1987)
Competitive viability in banking. Journal of Monetary Economics, 20, 501�520.
Berger, A.N. � Humphrey, D.B. (1997) Efficiency of financial
institutions: International survey and directions for future research. European Journal of Operational Research, 98, 175�212.
Berger, A.N. � Mester, L.J. (1997) Inside the black box: What
explains differences in the efficiencies of financial institutions? Journal of Banking and Finance, 21, 895�947.
Blass, A. � Yafeh, Y. (2001) Vagabond shoes longing to stray: Why
foreign firms list in the United States. Journal of Banking and Finance, 25, 555�572.
Bloomfield, R. � O�Hara, M. (1999) Market transparency: Who
wins and who loses? Review of Financial Studies, 12, 1, 3�37. Bloomfield, R. � O�Hara, M. (2000) Can transparent markets
survive? Journal of Financial Economics, 55, 3, 425�459.
48
Booth, G.G. � Iversen, P. � Sarkar, S.K. � Schmidt, H. � Young, A. (1999) Market structure and bid-ask spreads: IBIS vs NASDAQ. European Journal of Finance, 5, 51�71.
Cetorelli, N. � Gambera, M. (2001) Banking market structure,
financial dependence and growth: International evidence from industry data. Journal of Finance, 56, 2, 617�648.
Chaplinsky, S. � Ramachand, L. (2000) The impact of global equity
offerings. Journal of Finance, 55, 6, 2767�2789. Charnes, A. � Cooper, W.W. � Rhodes, E. (1978) Measuring the
efficiency of decision making units. European Journal of Operational Research, 2, 429�444.
Christensen, L. � Jorgenson, D. � Lau, L. (1973) Transcendental
logarithmic production functions. Review of Economics and Statistics, 55, 28�45.
Coelli, T.J. � Prasada Rao, D.S. � Battese, G.E. (1998) An
introduction to efficiency and productivity analysis. Kluwer Academic Publishers, Boston, Massachusetts 02061 USA.
Committee of Wise Men (2001) Final report of The Committee of
Wise Men on the regulation of European securities markets. Brussels.
Cruickshank, D. (2001) Clearing and settlement � the barrier to a
Pan-European capital market. International Finance, 4, 2, 321�333.
Cybo-Ottone, A. � Di Noia, C. � Murgia, M. (2000) Recent
development in the structure of securities markets. Brookings-Wharton Papers on Financial Services, 2000.
Demirguc-Kunt, A. � Maksimovic, V. (1998) Law, finance, and firm
growth. Journal of Finance, 53, 2107�2137. Di Noia, C. (2001) The stock-exchange industry: Network effects,
implicit mergers, and remote access. European Financial Management, 7, 1, 39�72.

49
Domowitz, I. (1995) Electronic derivatives exchanges: Implicit mergers, network externalities and standardization. The Quarterly Review of Economics and Finance, 35, 2, 163�175.
Domowitz, I. � Steil, B. (1999) Automation, trading costs, and the
structure of the trading services industry. Brookings-Wharton Papers on Financial Services, 1�52.
Economides, N. (1993) Network economics with application to
finance. Financial Markets, Institutions & Instruments, 2, 5, 89�97.
Economides, N. (1996) The economics of networks. International
Journal of Industrial Organization, 16, 4, 675�699. Economides, N. � Siow, A. (1988) The division of markets is
limited by the extent of liquidity (Spatial competition with externalities). The American Economic Review, 78, 1, 108�121.
Elkins/Mc Sherry (1995�2001) Global trading cost analysis. New
York. European Central Bank (2000) Monthly Bulletin. February, 2000. European Central Bank Blue Book, various issues. Payment and
securities settlement systems in the European Union. Frankfurt am Main.
Fama, E. (1991) Efficient capital markets: II. Journal of Finance,
46, 5, 1575�1617. Farrell, M.J. (1957) The measurement of productive efficiency.
Journal of the Royal Statistical Society, Series A, CXX, 253�281. FIBV (1985�2001) Annual reports 1985�1999. International
Federation of Stock Exchanges, Paris. Foerster, S. � Karolyi, A. (1998) Multimarket trading and liquidity:
A transaction data analysis of Canada-U.S. interlistings. Journal of International Financial Markets, Institutions and Money, 8, 393�412.

50
Fried, H.O. � Lovell, C.A.K. � Schmidt, S.S. (1993) The measurement of productive effiency. New York, Oxford University Press.
Gehrig, T. (1998) Cities and the geography of financial centers.
University of Freiburg and Centre of Economic Policy Research, London, Discussion Paper 1894.
Giddy, I. � Saunders, A. � Walter, I. (1996) Alternative models for
clearance and settlement: The case of the single European capital market. Journal of Money, Credit, and Banking, 28, 4, 986�1000.
Giovannini Group (2002) Cross-border clearing and settlement
arrangements in the European Union. European Commission Economic papers.
Glosten, L.R. (1994) Is the electronic open limit order book
inevitable? Journal of Finance, 49, 4, 1127�1161. Greene, W.H. (1990) A gamma-distributed stochastic frontier
model. Journal of Econometrics, 13, 141�163. Greene, W.H. (1993) The econometric approach to efficiency
analysis. In: Fried, H.O., Lovell, C.A.K. and Schmidt, S.S. (eds.), The Measurement of Productive Efficiency, New York, Oxford University Press.
Group of Thirty (2003) Global clearing and settlement: a plan of
action. Washington DC, USA. Goldsmith, R. (1969) Financial Structure and Development. Yale
University Press, New Haven. Hannan, T.H. (1991) Foundation of the structure-conduct-
performance paradigma in banking. Journal of Money, Credit and Banking, 23, 1, 68�83.
Harris, L. (2002) Trading and exchanges: Market microstructure
for practitioners. Oxford University Press, New York.

51
Hart, O. � Moore, J. (1996) The governance of exchanges: Members� cooperatives versus outside ownership. Oxford Review of Economic Policy, 12, 4, 53�69.
Hasan, I. � Malkamäki, M. (2001) Are expansions cost effective for
stock exchanges? A global perspective. Journal of Banking and Finance, 25 (12), 2339�2366.
Huang, R.D. � Stoll, H.R. (1991) Major world equity markets:
Current structure and prospects for change. Monograph Series in Finance and Economics, New York University, Leonard N. Stern School of Business. Salomon Center, 1991.
Huang, R.D. � Stoll, H.R. (1996) Dealer versus auction markets: A
paired comparison of execution costs on NASDAQ and NYSE. Journal of Financial Economics, 41, 313�357.
International Monetary Fund, various issues. International Financial
Statistics. Washington. Karolyi, A. (1998) Why do companies list shares abroad?: A
survey of the evidence and its managerial implications. New York University Salomon Center, Financial Markets, Institutions & Instruments, 7, 1, 1�60.
King, R.G. � Levine, R. (1993a) Finance and growth: Schumpeter
might be right. Quarterly Journal of Economics, 108, 3, 717�737. King, R.G. � Levine, R. (1993b) Finance, entrepreneurship, and
growth: Theory and evidence. Journal of Monetary Economics, 32, 513�542.
Kumbhakar, S.C. � Gosh, S. � McGuckin, J.T. (1991) A generalized
production frontier approach for estimating determinants of inefficiency in U.S. dairy farms. Journal of Business and Economic Studies, 9, 279�286.
Kumbhakar, S.C. � Lovell, C.A.K. (2000) Stochastic Frontier
Analysis. Cambridge University Press. Lannoo, K. � Levin, M. (2001) The securities settlement industry in
the EU structure, Costs and the Way Forward. CEPS Research Report.

52
Lee, R. (1998) What is an exchange? The automation,
management, and regulation of financial markets. Oxford University Press, New York.
Lee, R. (2002) Capital markets that benefit investors: A survey of
the evidence on fragmentation, internalisation, and market transparency. Oxford Finance Group.
Levine, R. (1991) Stock markets, growth, and tax policy. The
Journal of Finance, 46, 1445�1465. Levine, R. � Zervos, S. (1998) Stock markets, banks, and economic
growth. The American Economic Review, 88, 3, 537�558. Levine, R. � Loayza, N. � Beck, Th. (2000) Financial intermediation
and growth: Causality and causes. Journal of Monetary Economics, 46, 31�77.
Licht, A.N. (1998) Regional stock market integration in Europe.
Harvard Institute for International Development, Consulting Assistance on Economic Reform II Discussion Papers, No 15.
Lo, A. � Roll, R. (1997) Market efficiency: Stock market behavior
in theory and practice. Edward Elgar Publishing. Lovell, C.A.K. (1993) Production frontiers and productive
efficiency. In: Fried, H.O., Lovell, C.A.K. and Schmidt, S.S. (eds.), The Measurement of Productive Efficiency, New York, Oxford University Press.
Madhavan, A. (1995) Consolidation, fragmentation, and the
disclosure of trading information. Review of Financial Studies, 8, 3, 579�603.
Madhavan, A. (2000) Market microstructure: A survey. Journal of
Financial Markets, 3, 205�258. Madhavan, A. � Porter, D. � Weaver, D. (1998) Should securities
markets be transparent? Working Paper, University of Southern California.

53
Meeusen, Y.M. � van den Broeck, J. (1977) Efficiency estimation from Cobb-Douglas production functions with composed errors. International Economic Review, 18, 435�444.
Mester, L.J. (1987) A multiproduct cost study of savings and loans.
Journal of Econometrics, 29, 305�325. MSCI (1995�2000) Handbook of world stock, derivative, and
commodity exchanges. Mondo Visione, UK. Molyneux, P. � Altunbas, Y. � Gardener, E. (1997) Efficiency in
European banking. John Wiley and Sons, New York. Murray, T. (1999) Thomas Murray CSD guide. Thomas Murray
Publications Ltd. O�Hara, M. (1995) Market microstructure theory. Basil Blackwell,
Cambridge, Massachussetts. Pagano, M. (1989) Trading volume and asset liquidity. Quarterly
Journal of Economics, Vol. 104, 255�276. Pagano, M. � Röell, A. (1990) Trading systems in European stock
exchanges: Current performance and policy options. Economic Policy, 65�115.
Pagano, M. � Röell, A. � Zechner, J. (2002) The geography of equity
listing: Why do companies list abroad? Journal of Finance, 57, 6, 2651�2694.
Pirrong, C. (1999) The organization of financial exchange markets:
Theory and evidence. Journal of Financial Markets, 2, 329�357. Porter, D. � Weaver, D. (1998) Post-trade transparency on
Nasdaq�s national market system. Journal of Financial Economics, 50, 231�252.
Rajan, R.G. � Zingales, L. (1998) Financial dependence and
growth. The American Economic Review, 88, 3, 559�586. Reifschneider, D. � Stevenson, R. (1991) Systematic departures
from the frontier: A framework for the analysis of firm inefficiency. International Economic Review, 15, 515�521.
54
Schmidt, H. (1977) Advantages and disadvantages of an integrated
market compared with a fragmented market. Commission of the European Communities, Collection Studies, Competition � Approximation of Legislation, No. 30, Brussels.
Schmidt, H. � Iversen, P. (1992) Automating German equity
trading: Bid-ask spreads on competing systems. Journal of Financial Services Research, 6, 4, 373�397.
Schumpeter, J. (1911) A Theory of Economic Development.
Cambridge, MA, Harvard University Press. Shy, O. (2001) The economics of network industries. Cambridge
University Press. Stevenson, R.E. (1980) Likelihood functions for generalized
stochastic frontier estimation. Journal of Econometrics, 13, 58�66.
Valckx, N. (2002) WTO financial services commitments:
Determinants and impact of financial stability. IMF Worling Paper, No. 02/214.
Williamson, C. (1999) Structural changes in exchange-traded
markets. Bank of England Quarterly Bulletin, 39, 2, 202�206.

55
Appendix Figure A1 Technical and allocative efficiencies
X2/Y P
0 X1/Y
Q�R
B�
B
A�
AQ
Source: Farrell (1957). Figure A1 illustrates Farrell�s (1957) concept of technical and allocative efficiencies for a two-input/one-output setting under constant returns-to-scale. Given a known efficient production frontier, represented by BB�, consider a firm combining input quantities as defined by point P, produces a unit of output. Point Q represents an efficient firm using the same input ratio as in P. According to Farrell (1957), technical inefficiency measures the amount by which all inputs can be reduced while maintaining the same level of output. Hence, the ratio QP/0P defines the technical efficiency of the firm P. The ratio equals one if the firm is fully efficient (firm at point Q) and becomes indefinitely small as the amounts of inputs per unit output become indefinitely large. Knowledge of prices allows for measuring a firm�s ability to combine inputs in optimal proportions. Consider the input price ratio, represented by the slope of the isocost line, AA�. The distance RQ reflects potential cost savings in the production that would occur if the firm operated at the allocatively and technically efficient point Q� instead of the 100% technically efficient, but not allocatively inefficient point Q.

56
Combining technical and allocative efficiency measures yields the measure of overall economic efficiency. It measures the extent of potential cost reductions, expressed by the fraction 0R/0P that could be achieved if the firm were both technically and allocatively efficient. Note that the above efficiency measures assume knowledge of the underlying production or cost function. Since engineering information on the technology underlying financial institutions or stock exchanges, is not available, the efficient frontier must be estimated using either non-parametric or parametric functions. In a non-constant returns case, the above efficiency measures can be defined analogously.

57
Chapter 2
Technological development and concentration
of stock exchanges in Europe
Heiko Schmiedel
Abstract ..............................................................................................58 Acknowledgements ............................................................................58 1 Introduction ................................................................................59 2 Relevant literature ......................................................................62 3 �Co-ompetition� among financial exchanges..............................64 4 Methodology ..............................................................................66 4.1 Stochastic cost frontier .......................................................66 4.2 Multiproduct cost function .................................................68 5 Data and variables ......................................................................71 6 Empirical results.........................................................................75 7 Conclusions ................................................................................83 References ..........................................................................................85 Appendix............................................................................................88

58
Abstract This paper provides an empirical analysis of technical inefficiencies among financial exchanges in Europe. A single-stage stochastic cost frontier approach is employed, which generates inefficiency scores using unbalanced panel data for all major European exchanges over the period 1985�1999. The evidence reveal that European exchanges operate at 20�25% above the cost benchmark. However, stock exchanges� ability to efficiently manage their production and input resources has notably improved over time. The results also affirm that size, market concentration and quality, exchange governance, diversification in trading service activities, and automation of trading influence the efficient provision of trading services in Europe. Key words: Europe, financial exchanges, panel data, technical efficiency JEL classification: C23, G2, L2, O52
Acknowledgements This paper originates from the authors� research visit at the Research Department Bank of Finland, Helsinki. He would like to thank the Bank of Finland for its hospitality and generous support. Special thanks are also due to HWWA-Hamburg Institute of International Economics for having supported this research. Iftekhar Hasan, David Mayes, Juha Tarkka, and Jouko Vilmunen gave most valuable comments and suggestions. This research benefited from conferences and workshops at the Bank of Finland, Dutch National Bank, and European Workshop on Productivity and Efficiency Analysis in Oviedo, Spain. The author is also grateful to Virpi Andersson and Jani-Petri Laamanen for providing most efficient research assistance. The views expressed are those of the author and do not necessarily reflect the views of the Bank of Finland. An earlier version of this study was published as a Bank of Finland Discussion Paper, No. 21/2001. Reprinted from Research in Banking and Finance, Vol. 3, Schmiedel H., Technological development and concentration of stock exchanges in Europe, 381�408, 2003, with kind permission from Elsevier.

59
1 Introduction This study deals with the microstructure of the securities industry in Europe by analysing empirically the existence and extent of as well as the explanation for inefficiency effects among all major European financial exchanges. Integration of European financial services and capital markets is believed to have significant long-term benefits arising from improved capital allocation, more efficient intermediation of savings to productive investments, and the strengthening of the EU economy (Committee of Wise Men, 2001). This is the major motivation that led monetary and policy authorities traditionally articulate prime interest in European and global financial market developments. The European security industry is experiencing a period of great and rapid change, which is driven by three fundamental forces. First, the risk factor of exchange rate changes in the Euro area has been removed with the introduction of a common European currency. Second, the imposition of the Investment Service Directive has removed considerable restrictions in European financial markets as it provides financial intermediaries with a �single passport�, allowing them to benefit from favourable stock trading conditions on any European market regardless of their physical location. Third, in a global context advances in sophisticated communication and information technologies are reducing trading costs and are accelerating the production process of financial services (Chapter 3). These far-reaching structural changes in European financial markets stimulate more effectively inter-exchange competition. This paper addresses these developments affecting the structure of European equity markets and it anticipates potential efficiency improvements arising from further consolidation and concentration of the industry. The paper pursues a number of research issues concerning the microstructure of exchanges. First, are providers of trading services organised efficiently? If this is not the case, what is the level of inefficiency that financial exchanges are facing relative to the best practice exchange and to what extent might efficiency gains arise from the consolidation and concentration of stock exchanges in Europe? How does inefficiency among exchanges evolve over time? What determines exchange inefficiency and what are the characteristics explaining inefficiencies in the organisational structure and provision of trading activities? While efficiency research to date has been extensively carried out in the context of bank performance (Berger and Humphrey, 1997), efficiency effects among exchanges have not been researched so far.

60
Existing evidence relates to economies of scale and scope in stock exchanges (Hasan and Malkamäki, 2001). As noticed by Hasan and Malkamäki (2001), a plausible explanation for this neglected research field is the unavailability of consistent panel data on key balance sheet items across stock exchanges. The purpose of this paper is to fill this gap in the literature and to contribute to the discussion about the future of stock exchanges by estimating technical efficiencies of European stock exchanges in a stochastic frontier framework. Domowitz and Steil (1999) claim that the traditional literature on financial market structures mainly focuses on explicit trading rules, mechanisms, and on their impact on the price discovery process, but less work has been carried out on the economics of exchanges themselves. To have a better understanding of the functioning of the security trading industry, this paper examines the organisation of financial exchange markets from a supply-side perspective. Following Arnold et al (1999) as well as Domowitz and Steil (1999), stock exchanges are considered herein as operative firms, which offer trading products and embody particular technologies. The key hypothesis of this analysis is that although inefficiency effects in the provision of trading services by European stock exchanges might have declined over time, inefficiencies still remain at a considerably high level. A unique unbalanced panel data set has been constructed, consisting of all major European financial exchanges over the time period 1985�1999. Using a single-stage econometric frontier approach (Coelli et al, 1998; Kumbhakar and Lovell, 2000), the paper estimates stochastic frontier functions incorporating inefficiency effects of European stock exchanges and examines potential correlates helping to explain deviations from the efficient frontier. The overall findings exhibit evidence that European exchange inefficiency scores are 20�25 per cent higher than the predicted benchmark. Improvements in efficiency among exchanges over the sample period are found in association with a number of exchange-specific characteristics. The results indicate that exchange size, market concentration and quality, diversification in other trading activities, the emergence of sophisticated trading technologies, as well as changes in exchange governance structures play a dominant role in the efficient provision of trading services in the European stock exchange industry. In order to benefit from a fully integrated European financial services and capital market, the results support the need for a more efficient security-trading infrastructure and for consolidation of the present fragmented security trading landscape at the European level. In this respect, one major challenge for European financial regulators

61
will be to create and ensure a stable European regulatory system that is flexible enough to adjust adequately to future technological and market developments. Initial advances in this discussion have been achieved by a recent agreement on a new legislative process for European security markets based on the reports of the Committee of Wise Men (2001). Against the background of recent trends in the global and European economic environment, future nation-wide and cross-border consolidation, alliances and mergers, as well as take-overs of financial exchanges are likely to be forthcoming in Europe. The structure of the remainder is as follows. In Section 2, the discussion of prior empirical and theoretical literature on financial market structure provides the background for this study. Section 3 highlights recent developments in the stock and derivative exchange industry. The stochastic frontier methodology and the functional specifications of the frontier models employed in this paper are defined in Section 4. Section 5 describes the data set and deals with the selection of relevant variables. The empirical results are presented and discussed in Section 6. The paper ends by drawing conclusions in Section 7.

62
2 Relevant literature In the literature a considerable amount of research has been carried out about the empirical estimation of financial institution efficiency, primarily in the context of depository institutions as well as firms in the insurance industry. Berger and Humphrey (1997) have surveyed the results of 130 studies of financial institution efficiency covering 21 countries and based on five different frontier efficiency approaches. Overall evidence of the reviewed studies suggests efficiency estimates near 80 per cent using both, parametric and non-parametric, frontier techniques. Although extensive evidence exists on different types of financial institutions, no study can be detected so far which benchmarks empirically the relative performance of financial exchanges. There is only little research available that addresses international comparisons of financial exchanges themselves. In contrast to classical financial market studies, Domowitz and Steil (1999) emphasise the important effects of advances in automated trading technologies on operating costs and the organisational structure of an exchange, rather than focusing on transaction costs that traders face. By modelling aspects of the organisation of financial exchanges, Pirrong (1999) concludes that the existence of scale economies in the provision of trading infrastructure encourages co-operation and consolidation among financial trading service providers. In an earlier study on scale economies in security markets, Doede (1967) reports that the average operating costs of stock exchanges are a declining function of trading volume. In a closely related study, Demsetz (1968) observes that bid-ask spreads are a declining function of the rate of transaction volume. In a game-theoretic framework, Di Noia (2001) addresses possible effects of cross-network externalities on competition and consolidation in the European stock exchange industry. It is demonstrated that competition may lead to inefficient equilibria, while an implicit merger may have a Pareto-optimal outcome and result in higher profitability for both exchanges. The implicit merger model shows that specialisation in listing or trading services among exchanges is likely. By analysing the effects of U.S. exchange mergers on trading volume and execution costs, Arnold et al (1999) find that merging exchanges attracted market share and experienced narrower bid-ask spreads. Malkamäki and Topi (1999) argue that economies of scale and scope and network effects will foster cross-border competition among exchanges. Furthermore, Hasan and Malkamäki (2001) investigate

63
empirically the existence of economies of scale and scope among exchanges providing separate perspectives on different regions. They find evidence indicating substantially higher economies of scale and scope in North American and European exchanges in comparison to Asian and South American exchanges. Comparing descriptive statistics of total costs to total revenues of eleven European stock exchanges over 1993�1994, Cybo-Ottone et al (2000) observe that efficiency differences are likely to exist across the sample exchanges. However, the reviewed studies do not provide a comprehensive panel-based benchmark analysis of the stock exchange industry and the factors that may explain variations from the efficient frontier exchange. Following the basic arguments of Arnold et al (1999) and Pirrong (1999), this paper adopts a supply-side viewpoint and presents novel insights into the efficient organisation and structure of European exchange markets.

64
3 �Co-ompetition� among financial exchanges
The term �co-ompetition� is used in order to describe the trend of increasing co-operation and competition among exchanges pointing towards the concentration of stock exchanges in Europe as a potential outcome of continuing globalisation, innovations in communication and trading technologies, as well as deregulation. Against this background, financial exchanges reorganise their operations and form alliances in order to leverage themselves in a stronger competitive position. It seems evident that financial exchanges follow different paths of coping with investor demands for lower trading costs, improved liquidity and immediate access to international trading. Consistent with OECD (2001), four different models of inter-exchange co-operation can be identified. The first strategy is that promoted by NASDAQ. The basic idea is to establish branches with local partners using a common technology in order to have access to regional markets. Prominent examples are NASDAQ Europe, NASDAQ Canada, and NASDAQ Japan. The objective is to build up inter-connected hubs for a global electronic 24/7 marketplace. A second type includes mergers among exchanges, ie the recent merger of Paris, Brussels, and Amsterdam under the name Euronext, or the ill-fated London Stock Exchange and Deutsche Börse merger attempt. Here the purpose is to achieve actively economies of scale by concentrating trading on one stock exchange with a common trading system. A third strategy is reflected in the attempted hostile take-over bid pursued by the Swedish OM Group for the London Stock Exchange. Finally, a fourth design of exchange co-operation is reflected in the New York Stock Exchange. This attempt seeks to interconnect leading equity exchanges in a Global Equity Market (GEM) by means of a shared common electronic interface. In derivative markets, Globex Alliance and Eurex have already pooled trading activities in a de facto interconnected single electronic trading platform. Globex Alliance as a world global electronic trading system offers remote trading access to its interconnected member exchanges. Under the Globex Alliance, participants of the Chicago Mercantile Exchange (CME), Euronext, Singapore Exchange Derivatives Trading (SGX), Brazil�s Bolsa de Mercadorias & Futuros (BM&F), Spain�s MEFF, and the Bourse de Montréal benefit from remote access to all the Alliance markets through a single electronic trading system.

65
The Eurex exchange was jointly launched by the German Deutsche Börse AG and the Swiss Exchange through the merger of the formerly DTB Deutsche Terminbörse und SOFFEX (Swiss Options and Financial Futures Exchange) in 1996. Eurex provides direct electronic access to a wide range of derivative products. In terms of trading volume, the rapid emergence of Eurex relative to the UK-based London International Financial Futures Exchange (LIFFE), affirms that cost efficiency and the importance of network economics play a dominant role in the efficient microstructure of trading systems. There are also substantial economic forces of fragmentation at work, which limit the extent of consolidation among financial institutions within Europe. In a recent study, Berger et al (2001) claim that efficiency barriers, in particular distances between nations, linguistic and cultural differences, or implicit rules against foreign institutions, may inhibit the creation of an EU-wide single market for financial services and institutions. Although the Single Market Programme and European Monetary Union remove some of these restrictions for EU nations and for the EMU member countries, the remaining obstacles may make it difficult to exploit all advantages of potential efficiency gains arising from a consolidated EU market for financial services. Overall, it seems that despite the ongoing formation of alliances, ultimately mergers, or letters of intent to create joint and specialised market segments, further concrete progress in the consolidation process is required and is likely to be forthcoming in Europe.

66
4 Methodology
4.1 Stochastic cost frontier
The stochastic frontier analysis (SFA) literature has made significant contributions to the econometric modelling of production and the estimation of the technical efficiency of firms. Econometric SFA models incorporate a two-component error structure. One part of the error term is associated with traditional random and uncontrollable factors, and the second component captures individual firm deviations or errors due to factors within the control of management, such as technical and allocative efficiency. By estimating the ratio of the variability for the two separated error terms, the level of technical inefficiency for each observation in the sample can be quantified.1 In terms of the specific estimation technique used in this paper, different stochastic cost frontiers using panel data and incorporating technical inefficiency effects are formulated, following Battese and Coelli (1995). The most notable features of this stochastic cost frontier approach are that it accommodates unbalanced panel data, or pooled time-series, cross-sectional data, and that it estimates in a single stage both the cost frontier and the coefficients of firm-specific variables that may explain deviations from the efficient cost frontier. Several studies adopt a two-stage approach, in which a stochastic frontier is estimated in the first stage, and obtained efficiencies are then regressed against a vector of firm-specific variables in the second stage. However, one of the reasons to argue against the two-step formulation is that the underlying assumptions are clearly inconsistent with those of the stochastic frontier estimation. For example, it is assumed in the first stage that the inefficiencies are independent and identically distributed, but this assumption is contradicted in the second-stage regression, in which predicted efficiencies are assumed to have a functional relationship with the firm-specific characteristics. More recent studies address this problem and adopt a single-stage approach, in which explanatory variables are incorporated directly into the inefficiency error component. This approach assumes that the inefficiency error component is a truncation at zero of a normal distribution with the mean being dependent on a vector of firm-specific variables. Battese and Coelli (1995) propose a model that 1 Coelli et al (1998) and Kumbhakar and Lovell (2000) provide a survey of literature on econometric approaches to efficiency estimation.
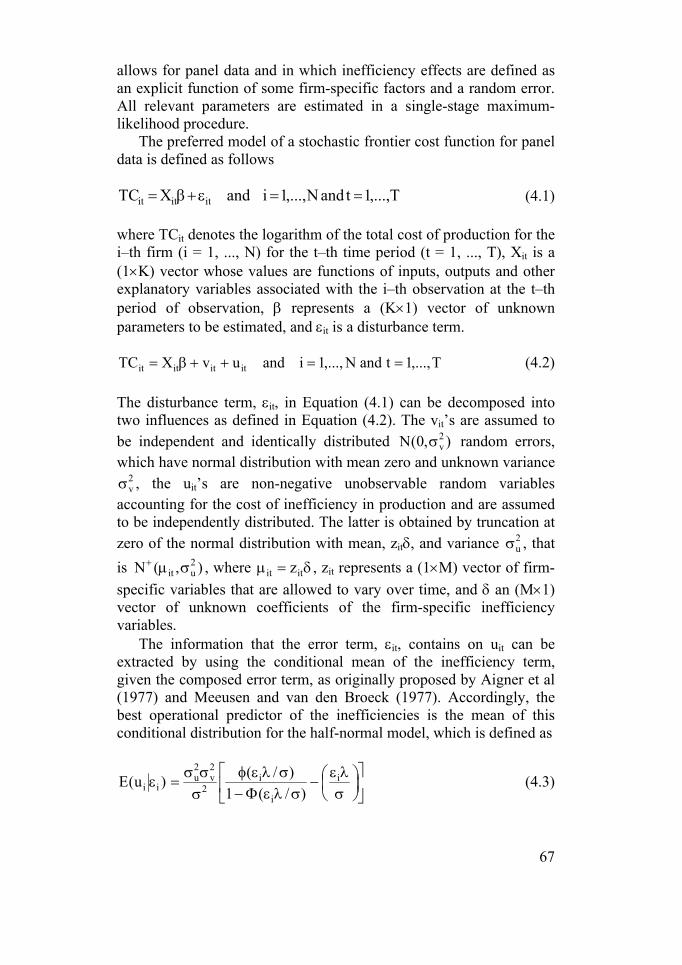
67
allows for panel data and in which inefficiency effects are defined as an explicit function of some firm-specific factors and a random error. All relevant parameters are estimated in a single-stage maximum-likelihood procedure. The preferred model of a stochastic frontier cost function for panel data is defined as follows
T,...,1tandN,...,1iandXTC ititit ==ε+β= (4.1) where TCit denotes the logarithm of the total cost of production for the i�th firm (i = 1, ..., N) for the t�th time period (t = 1, ..., T), Xit is a (1×K) vector whose values are functions of inputs, outputs and other explanatory variables associated with the i�th observation at the t�th period of observation, β represents a (K×1) vector of unknown parameters to be estimated, and εit is a disturbance term.
T,...,1tandN,...,1ianduvXTC itititit ==++β= (4.2) The disturbance term, εit, in Equation (4.1) can be decomposed into two influences as defined in Equation (4.2). The vit�s are assumed to be independent and identically distributed ),0(N 2
vσ random errors, which have normal distribution with mean zero and unknown variance
2vσ , the uit�s are non-negative unobservable random variables
accounting for the cost of inefficiency in production and are assumed to be independently distributed. The latter is obtained by truncation at zero of the normal distribution with mean, zitδ, and variance 2
uσ , that is ),(N 2
uit σµ+ , where δ=µ itit z , zit represents a (1×M) vector of firm-specific variables that are allowed to vary over time, and δ an (M×1) vector of unknown coefficients of the firm-specific inefficiency variables. The information that the error term, εit, contains on uit can be extracted by using the conditional mean of the inefficiency term, given the composed error term, as originally proposed by Aigner et al (1977) and Meeusen and van den Broeck (1977). Accordingly, the best operational predictor of the inefficiencies is the mean of this conditional distribution for the half-normal model, which is defined as
⎥⎦
⎤⎢⎣
⎡⎟⎠⎞
⎜⎝⎛σλε
−σλεΦ−
σλεφσσσ
=ε i
i
i2
2v
2u
ii )/(1)/()u(E (4.3)

68
where the total variance is 2/12u
2vs )( σ+σ≡σ , vu /σσ≡λ , φ(.) and Φ(.)
are the standard normal density and the cumulative normal density function, respectively.2 For the Battese and Coelli (1995) frontier model, the null hypothesis, that technical inefficiency effects are absent from the model, can be conducted by testing the null and alternative hypotheses, 0:H0 =γ with )/( 2
u2v
2u σ+σσ≡γ versus 0:H1 >γ . The
null hypothesis that the second-order coefficients and the cross terms in the translog function are zero tests whether the Cobb-Douglas frontier is an adequate representation of the data. Also, the null hypothesis that the technical inefficiency effects are not influenced by the level of the explanatory variables can be tested by 0:H0 =δ against 0:H1 >δ , where δ denotes the vector of coefficients of the exchange-specific inefficiency variables included in the expression, zitδ. These formal hypotheses tests are performed using generalised likelihood-ratio statistics. To obtain maximum likelihood estimates of a common efficiency frontier and of the technical inefficiency effects model of Battese and Coelli (1995), two further a priori specifications are therefore required. These comprise the selection of an appropriate underlying cost function and the identification of the firm-specific variables. 4.2 Multiproduct cost function
A commonly used translog functional form is employed to examine the underlying cost structure and to benchmark the performance of European stock and derivative exchanges. The translog cost model has the appealing virtues that it accommodates multiple outputs and that it is flexible enough to provide a second-order approximation of any well-behaved underlying cost frontier at the mean of the data (Kumbhakar and Lovell, 2000). The general functional form of the translog cost function is defined as
2 Battese and Coelli (1995) use the parameterisation of Battese and Corra (1977) involving the parameters, 2
u2v
2s σ+σ≡σ and 2
s2u /σσ≡γ . Further details are presented in
the Appendix of Battese and Coelli (1993).

69
ititittkitk
khith
h
2tttit
kkitkit
hhith
2itxxitxhitkit
k hhk
litkitk l
klkitk
k
jithith j
hjhith
h0itititit
uvTXlnTPlnTQln
T21TXlnPlnXlnQln
)X(ln21XlnQlnPln
PlnPln21Pln
QlnQln21Qln)T,X,P,Q(TCln
++ω+ψ+ρ+
τ+τ+λ+κ+
ξ+ξ+η+
β+β+
α+α+α=
∑∑
∑∑
∑∑
∑∑∑
∑∑∑
(4.4)
The total costs, TCit, depend on the vector of output, Qit, the vector of factor prices, Pit, the stock market performance, Xit, and a time variable, T, for each exchange i and time period t.3 The technical inefficiency effects are captured by the inefficiency term uit, as discussed above. Finally, to control for measurement errors and cost determinants beyond the control of management, the second random term vit is added. To ensure symmetry and linear homogeneity in input prices, Equation (4.4) is reformulated by imposing the usual restrictions
lkkljhhj and β=βα=α
.0 0 0 0 1k
kk
kk
hkl
klk
k ∑∑∑∑∑ =ψ=λ=η=β=β
This normalisation is achieved by scaling total costs, price of capital, and input cross terms by the price of labor input, arbitrarily chosen. The translog cost function is then defined as
3 See Section 5 for detailed information on the data and variables.

70
ititittkitk
khith
h
2tttit
kkitkit
hhith
2itxxitxhitkit
k hhk
litkitk l
klkitk
k
jithith j
hjhith
h0
itititit
uvTXlnTPlnTQln
T21TXlnPlnXlnQln
)X(ln21XlnQlnPln
PlnPln21Pln
QlnQln21Qln
)T,X,P,Q(TCln
++ω+ψ+ρ+
τ+τ+λ+κ+
ξ+ξ+η+
β+β+
α+α+α
=
∑∑
∑∑
∑∑
∑∑∑
∑∑∑
(4.5)
where n,...,1j,h = and 1p,...,1l,k −= and pititit P/TCTC = ,
pitkitkit P/PP = , pitlitl P/PP = .

71
5 Data and variables The data used in this study come from a variety of sources, including annual reports of European exchanges, various issues of the International Federation of Stock Exchanges (FIBV), IMF International Financial Statistics (IFS), and information from exchange Internet sites. Most of the data were collected from annual balance sheets, income statement reports, and the Internet pages of all major operating stock and derivative exchanges in Europe covering a 15-year time period (Annual Reports, 1985�1999). In some cases, additional information was obtained from the exchanges by correspondence. Also various issues of the MSCI Handbook served as an important source of information on exchange-specific characteristics. Although reporting schemes and the information content of the financial accounts vary across time and exchange a consistent data set has been constructed including all necessary information on key balance sheet and income statement items for 28 individual exchanges, of which 17 exchanges over the period from 1985�1999 finally entered the estimations.4 All national currencies are converted into US$ and are inflation-adjusted using data from IFS. All variables other than qualitative proxies are expressed in natural logarithms.5 As mentioned earlier, financial exchanges are herein regarded as operative firms. Given the model details in Section 4, financial exchanges can thus be characterised as incurring operating costs, TC, while producing two different outputs, Q, using two inputs, P, operating in a performing market environment, X. In terms of the cost structure, total costs are measured as the amount of dollar value in thousands of operating expenses excluding financial and extra ordinary items. The outputs of exchanges used in this study are taken from various issues of the FIBV Annual Yearbooks (1985�1999). As mentioned earlier, financial exchanges are treated as a type of firm that produces two different operative transaction services. First, exchanges facilitate trade processing and matching by providing a centralised trading place or electronic trading systems. Second, financial exchanges are also 4 An overview of the panel data sample is provided in the Appendix Table A1. Not all years are available for all exchanges. Exchanges with missing variables have been eliminated from the original database and some observations have been omitted when failing a standard set of criteria for data quality. 5 See Table A2 for data definition and summary statistics.

72
engaged in the monitoring of listed companies and maintenance of the marketplace, attempting to ensure that transactions are fairly and efficiently executed. The output concerning trade processing can be proxied by using trading statistics, namely the number and value of executed trades. Proxies for the output regarding the listing procedure of companies are the number and value of companies listed on a particular exchange. In line with Hasan and Malkamäki (2001), the number of listed companies and the value of transactions are identified as the most appropriate output variables.6 The input variables for the study include two direct measures of inputs, namely the price of capital and the price of labor. The price of capital is measured by taking the sum of capital expenditure, ie office expenses, IT and systems costs, and equipment scaled by the book value of net total office premises and equipment. The price of labor is calculated as the total expenditures on employees divided by the number of full-time equivalent employees at the end of the year. In addition, the stock market index performance is treated as netput to control explicitly in the translog function for the performance of the individual stock market. In order to obtain parametric measures of technical characteristics of the underlying technology, the above-discussed model accounts for the possibility of technical change. This is achieved by including a linear time trend variable, its square, and interactions of the other factor inputs and outputs (Coelli et al, 1998). All exogenous variables in this paper considered as potential correlates to inefficiency are related in various aspects to exchange size, market concentration, institutional organisation, governance structure, and the ability to adopt new innovative trading technologies. The first exchange characteristics control for size effects on efficiency. As a direct measure of exchanges size, the variables, ASSET and CAPITAL, are included in the regressions. These variables represent the total of financial and non-financial assets and the total capital of the i�th exchanges for the t�th time period respectively. It may be argued that larger exchanges have a better ability to manage exchange operations. Hence, a negative relationship between exchange size and inefficiency would be intuitive. The
6 When regressing total cost on the number and value of transactions and listed companies respectively, the number of listed companies and the value of transactions perform best in terms of regression fit. The estimation results are not reported here, since they are consistent with those found in Hasan and Malkamäki (2001). Thus, the estimations focus on two output proxies, the number of listed companies and the value of trades.

73
exchange industry is intensively competing to attract market shares and concentrate trading, so it is important to determine the efficiency effects of market concentration and market quality. Several variables, CONCAP and TURNOVER are included to control for the degree of market concentration and market quality. Here, negative coefficients of these variables are expected. Additionally, the paper considers whether an exchange�s age, AGE, is related to efficiency. Following the bank efficiency literature (Berger and Mester, 1997), one plausible explanation is that exchanges with many years in the trading service business occupy a relatively better position on the learning curve. The stochastic frontier model for the technical inefficiency effects of the European stock exchange industry also includes a set of binary explanatory variables. Some exchanges have expanded their operations to derivative and settlement business. The first dummy variable, DER, is intended to capture efficiency differences between stock exchanges that are also involved in derivatives and securities settlement operations. In the case that an exchange is engaged in these activities, the variable takes a value of one and zero otherwise. It may be argued that the pooling of diverse trading services and vertical integration of clearing and settlement activities is inversely related to the overall level of inefficiency, thus a priori a negative coefficient is expected. The next two trading technology variables, AUTOM and REMOTRADE, are measured by dummy variables to take recent technological innovations and advances in new computerised trading facilities as well as sophisticated cross-border securities trading systems into account. These variables are termed as first and second-generation technologies in electronic equities trading. The first-generation variable models the switchover from manual to automated execution of orders. From the annual reports of exchanges it can be inferred that screen-based trading systems across Europe have been mainly implemented in the 1990s. The advent of new electronic trading facilities should be related to increasing trading efficiencies in the securities industry compared to earlier manual processes. Hence, a negative coefficient is postulated. Second-generation technologies incorporate further evolution and competition between security trading systems. Several European stock exchanges launched cross-boarder electronic trading networks, but some, like the Madrid Stock Exchange, do not allow remote membership. Concerning the proxy of remote access, it is less obvious to predict any particular direction, in which the level of exchange efficiency is determined. Hence, two possible contradicting hypotheses are formulated. It can be argued that exchanges increase

74
efficient trading and benefit from offering remote membership, since remote-trading facilities are an important element of expanding networks and a remedy to enhance liquidity associated with network effects (Domowitz and Steil, 1999). In this case a negative coefficient could be hypothesised. Alternatively, developments in more sophisticated cross-border trading environments made exchanges face high initial investment and implementation costs, especially at the end of the 1990s. Although one might expect higher efficiency in order processing and execution from the creating of cross-border trading systems over time, significant cost increases can take place in the short run. Overall, no a priori coefficient is anticipated. The fourth variable, PROFIT, incorporates the ownership structure of stock exchanges. In pre-automation times, financial exchanges have mostly been organised as national monopolies owned by their members, ie member-firm brokers and dealers. Traditionally, these exchange members operated necessarily as transaction intermediaries for those with only limited trading access, thereby gaining monopolistic profits from exchange transactions (Domowitz and Steil, 1999). The situation in an automated market is different, where the increase in competition among exchanges and other electronic networks requires exchanges to become more efficient and profitable in all their activities. If an automated exchange can still be organised following the traditional mutual concept, it is doubtful that such a governance structure is optimal and adaptive enough in times of intensifying competition among stock exchanges. The importance of an adequate governance structure has led a number of European exchanges to demutualise, with the effect of diminishing member firm influence over the commercial activities of the exchange (see Domowitz and Steil (1999) for further discussion on this issue). Some prominent examples of exchange demutualisation are Stockholm (1993), Copenhagen (1996), Amsterdam (1997), and Iceland (1999). Given the need for profitable and efficient strategic governance decision-making in a dynamic competitive environment, the transformation of an exchange governance structure seems to result in a more market-efficient organisation than its mutual counterpart. Thus, the ownership variable, taking the value one if an exchange has demutualised and zero otherwise, should be negatively related to the exchange inefficiency level. Summary statistics over the period 1985�1999 and definitions of all relevant variables in the stochastic frontier and in the inefficiency model are displayed in the Appendix Table A2. The data sample covers a wide range of financial exchanges in terms of size, trading statistics and other characteristics.

75
6 Empirical results The maximum likelihood estimates of the translog stochastic cost functions for the pooled sample in equation (4.5), as well as the parameters for the technical inefficiency effects, are portrayed in Tables 6.1a and 6.1b. Asymptotic standard errors are also reported in the tables. All coefficients reveal the expected signs, except the variable AGE. Different model specifications and sub-samples were analysed to test the robustness of the regression results. In the first model, a translog cost frontier model is estimated comprising two inputs and outputs, as well as a stock market performance variable and a time trend in linear terms. To determine the efficiency effects of the selected exchange-specific characteristics in this model, the panel data structure requires focusing on the sub-sample period 1993�1999. In the second model, the translog functional form is extended by the cross- and squared terms of the performance measure and by non-neutral technical change. Variations in the inefficiency model allow enlarging the time dimension and making conclusions about the development of inefficiency among European exchanges over the 15-year time period 1985�1999. Formal statistical tests are conducted to check the significance of the estimated models. The different hypothesis tests are presented in Table 6.2. All values of the test statistic that exceed the critical value in this table are significant at the 5 percent level. Given the specifications of the translog frontier of Model I, the tests of hypotheses in the first part of Table 6.2 indicate that the Cobb-Douglas frontier is rejected as an adequate representation, and the hypothesis of no technical change is also rejected. However, the hypothesis of no performance effect cannot be rejected, given the specifications of the translog frontier. Therefore, the preferred frontier specification is Model Ib. The last section of Table 6.2 presents tests of various null hypotheses, given the specifications of the stochastic frontier with inefficiency effects defined by Model II. The first null hypothesis of the second model, that the Cobb-Douglas frontier is an appropriate model approximation of European stock exchanges, is clearly rejected by the data. Also, the second null hypothesis, specifying that stock market performance does not determine the stochastic frontier model, is rejected by the data. Likewise, the third null hypothesis of no technical change in European stock exchanges is also rejected at the

76
five per cent level. Given the specifications of Model II, the preferred frontier model is thus the frontier with technical change.7 Table 6.1a Maximum-likelihood estimates for parameters of translog stochastic cost frontier function for European stock exchanges Model Ia Model Ib Variable Parameter Coeff. Std. Error Coeff. Std. Error Cost frontier model constant α0 �0.5775 1.5578 �0.2547 2.4171 lnQ1 α1 �1.0979 0.9457 �0.7818 0.7764 lnQ2 α2 0.0355 0.2941 0.0776 0.2472 lnQ1lnQ1 α11 0.2194 0.1450 0.1852 0.1371 lnQ2lnQ2 α22 0.0524 0.0179 0.0490 0.0173 lnQ1lnQ2 α12 �0.0671 0.1040 �0.0732 0.0852 lnP1 β1 1.5557 0.8864 1.0579 0.7673 lnP1lnP1 β11 0.2335 0.0853 0.2320 0.0883 lnP1lnQ1 η1 0.0118 0.1557 0.0393 0.1546 lnP1lnQ2 η2 �0.2221 0.0775 �0.2031 0.0755 lnX1 ξx 0.0361 0.0314 T τt �0.0074 0.1442 0.0337 0.0265 Inefficiency model constant δ0 0.2386 1.1853 0.1474 0.9065 ZI1 δ1 �0.4124 0.0782 �0.2990 0.1028 ZI2 δ2 �0.0287 0.0716 0.0074 0.0609 ZI3 δ3 �0.2616 0.3131 �0.3245 0.3022 ZI4 δ4 1.1401 0.2798 0.9934 0.3007 ZI5 δ5 �0.1343 0.1091 �0.1659 0.0955 sigma squared 2
u2v
2s σ+σ=σ 0.0956 0.0197 0.0824 0.0161
gamma 2s
2u / σσ=γ 0.3845 0.1166 0.2079 0.1444
no. obs. 63 63 loglikelihood function �5.9007 �5.4099 mean inefficiency 0.2601 0.2114 7 The production technology may also depend on whether the exchanges are involved in derivative and settlement activities. If they do not follow the same cost function, it is not proper to pool derivative and stock exchanges. To test for it, the cost frontier in Equation (4.5) was extended by having a binary variable. It equals one if the exchanges is engaged in these businesses and zero otherwise. The models were estimated with the included dummy variables. The LR-test for the null hypothesis did not exceed the critical value of the chi-square distribution at the five per cent level, indicating that the structure of the cost functions does not differ significantly, and that the data for derivative and stock exchanges in the sample could be pooled. Although differences in the cost structure for derivative and stock exchanges are statistically insignificant, evidence is found that diversification in the provision of trading activity matters when explaining inefficiencies among exchanges.

77
Table 6.1b Maximum-likelihood estimates for parameters of translog stochastic cost frontier function for European stock exchanges Model IIa Model IIb Variable Parameter Coeff. Std. Error Coeff. Std. Error Cost frontier model constant α0 3.7139 1.0041 1.9647 1.0189 lnQ1 α1 1.8129 0.8427 1.1976 1.1328 lnQ2 α2 0.4972 0.3243 0.6415 0.4561 lnQ1lnQ1 α11 0.1082 0.1334 0.1608 0.1322 lnQ2lnQ2 α22 �0.0105 0.0213 �0.0107 0.0194 lnQ1lnQ2 α12 �0.0600 0.1026 �0.0802 0.0958 lnP1 β1 1.0677 0.4102 1.0869 0.4606 lnP1lnP1 β11 �0.0705 0.0381 �0.0618 0.0349 lnP1lnQ1 η1 �0.1746 0.1133 �0.1261 0.0962 lnP1lnQ2 η2 0.0362 0.0564 �0.0033 0.0516 lnX1 ξx �3.9299 0.6530 �2.9577 0.7270 lnX1lnX1 ξxx 0.0988 0.2396 0.2726 0.1402 lnX1lnQ1 κ1 �0.4363 0.3164 �0.2492 0.2077 lnX1lnQ2 κ2 0.1393 0.1455 0.0646 0.0943 lnX1lnP1 λ1 �0.4035 0.1290 �0.1634 0.1018 T τt 0.0065 0.1660 TT τtt �0.0063 0.0057 TlnQ1 ρ1 0.0254 0.0533 TlnQ2 ρ2 �0.0132 0.0257 TlnP1 ψ1 0.0599 0.0234 TlnX1 ωt 0.1079 0.0821 Inefficiency model constant δ0 0.3887 0.1289 0.1990 0.3435 ZII1 δ1 �0.8802 0.2914 �0.7888 0.6760 ZI12 δ2 �0.2964 0.2376 �0.4844 0.2919 ZI13 δ3 1.0610 0.3381 1.1034 0.3452 ZI14 δ4 �0.5649 0.2670 �0.0740 0.3502
sigma squared 2u
2v
2s σ+σ=σ 0.1043 0.0287 0.1227 0.0974
gamma 2s
2u / σσ=γ 0.2595 0.2309 0.1590 0.8262
no. obs. 109 109 loglikelihood �25.9749 �35.5571 mean inefficiency 0.2888 0.189

78
Table 6.2 Generalised likelihood-ratio tests of hypotheses for parameters of the stochastic frontier cost function for European stock exchanges Null hypothesis Log-likelihood λ 2
95.0χ -value Decision complete model I �5.90 H0: Cobb-Douglas model �13.02 14.24 12.59 Reject H0 H0: no performance effect �5.41 0.98 3.84 Accept H0 H0: no technical change �14.42 17.05 3.84 Reject H0 H0: γ = 0 �13.43 15.06 13.40 Reject H0 H0: δIi = 0 �13.44 15.07 11.07 Reject H0 i = 1,...,5 complete model II �25.97 H0: Cobb-Douglas model �66.35 77.64 25.00 Reject H0 H0: no performance effect �35.27 18.60 12.59 Reject H0 H0: no technical change �35.56 16.05 12.59 Reject H0 H0: γ = 0 �34.93 17.90 11.91 Reject H0 H0: δIIi = 0 �34.00 16.05 9.49 Reject H0 i = 1,...,4 Notes: The generalised likelihood-ratio test statistic is calculated as λ = �2{ln[L(H0)]�ln[L(H1)]} where L(H0) and L(H1) are the values of the likelihood function under the null and alternative hypotheses, H0 and H1, respectively. The test statistic has approximately chi-square distribution with degrees of freedom equal to the number of restrictions involved. The likelihood ratio statistic for the test involving γ = 0 is asymptotically distributed as a mixed chi-square distribution. The critical value for this test is obtained from Table 1 of Kodde and Palm (1986). Values of the test statistic that exceed the critical value in this table are significant at the 5 per cent level. The estimated parameters of the inefficiency models are of particular interest to this study. Under the cost frontier formulation in Model I, the overall findings indicate that the size of an exchange is negatively associated to inefficiency. As expected, larger institutions appear to have better abilities to manage overall trading service operations. The results for the second group of variables conform to their a priori expected sign. It is shown that market concentration (CONCAP) is inversely correlated to inefficiency. Given the specified frontier Model I, it is found that an exchange�s age affects negatively the efficient provision of trading services. At first glance, this finding appears to be counter-intuitive. A potential explanation of this finding is that more recently established exchanges may benefit from sharing trading service experiences with those exchanges having more years in business, possibly due to technological diffusion. Given the second inefficiency model, the coefficient of the variable, DER, reveals a negative sign, indicating that exchanges that integrate derivative and settlement activities seem to have significantly better capabilities in managing overall costs.

79
The negative AUTOM coefficient implies that the switchover from floor-based to automated trading helped stock exchanges to reduce cost inefficiencies. Interestingly, concerning the variable remote access, REMOTRADE, a significant positive association related to cost inefficiency is observed. As mentioned earlier, this result confirms the hypothesis that exchanges incurred recently high initial establishment costs of offering remote membership access, which in turn does not lower inefficiencies in the short run, though efficiency gains in the long run are intuitive. Finally, the negative coefficient for the variable, PROFIT, confirms statistically significant higher efficiency associated with recent transformations of exchange governance structure from a mutually owned into a for-profit investor-owned company, which is termed demutualisation. It supports the view that ownership has a direct impact on management and that a for-profit exchange can operate more efficiently in responding and adjusting adequately to technological advances and changes in the regulatory and economic environment. One striking result of the model estimations is that the γ coefficient indicates that residual variation is partly due to the inefficiency effect, uit. In both cases, the null hypothesis that inefficiency effects are absent from the model, γ = 0, is rejected at the 5 per cent level of significance. Furthermore, the one-sided generalised likelihood-ratio tests of H0: δIi = 0, i = 1,...,5, and H0: δIii = 0, i = 1,...,4, reveal statistics, that exceed the 5 per cent critical value respectively. Hence, as mentioned by Battese and Coelli (1995), this proves that the joint effects of the exchange-specific characteristics on the inefficiencies of trading service production are significant, although the individual effects of one or more of the variables may not have a statistically significant impact. The technical inefficiency scores of European financial exchanges under the different model specifications were predicted. With respect to Model Ia and Ib, the mean technical inefficiency scores were found to be 26.01 and 21.14 per cent respectively. Although the Models IIa and IIb are statistical different, technical inefficiencies of European financial exchanges were estimated alternatively under the translog frontier specification with and without technical change. Descriptive statistics as well as the individual mean inefficiency scores of each exchange under the above-discussed model specifications IIa and IIb are reported in Table 6.3. Observing the predicted inefficiency scores over the entire sample and period, the combined estimate indicates that an average financial exchange in Europe experiences a cost inefficiency score of 28.88 per cent under the preferred frontier

80
specification. A closer look at five-year sub-samples makes evident that the average level of cost efficiency has improved over time. Concerning the five-year sub-samples 1985�1989, 1990�1994, 1995�1999, the mean cost-inefficiency scores decreased considerably over time and came down from 45.20, 32.23, to the lowest score of 23.02 per cent reported in the second half of the 1990s. Table 6.3 Ranking and descriptive statistics of inefficiency scores of European exchanges Exchange Model IIa Exchange Model IIb Swiss Exchange 0.0345 Euronext Brussels 0.0293 Euronext Brussels 0.0408 Swiss Exchange 0.0295 Euronext Amsterdam 0.0466 Budapest Stock Exchange 0.0310 Budapest Stock Exchange 0.0466 Euronext Amsterdam 0.0314 Deutsche Börse AG 0.0719 Deutsche Börse AG 0.0922 Barcelona Stock Exchange 0.0845 Barcelona Stock Exchange 0.1024 Copenhagen Stock Exchange 0.1915 Helsinki Stock Exchanges 0.1684 Tallinn Stock Exchange 0.1955 Bourse de Luxembourg 0.2027 Bolsa de Madrid 0.2235 Iceland Stock Exchange 0.2139 Bourse de Luxembourg 0.2606 Tallinn Stock Exchange 0.2156 Helsinki Stock Exchanges 0.3365 Bolsa de Madrid 0.2221 Euronext Paris 0.3924 Copenhagen Stock Exchange 0.2267 OM Stockholm Exchange 0.4136 Euronext Paris 0.2459 Iceland Stock Exchange 0.4258 London Stock Exchange 0.2495 Oslo Bors 0.4489 Oslo Bors 0.2535 London Stock Exchange 0.4629 OM Stockholm Exchange 0.2652 Wiener Börse 0.5288 Wiener Börse 0.6356 1985�1989 0.4520 1985�1989 0.2245 1990�1994 0.3223 1990�1994 0.1753 1995�1999 0.2302 1995�1999 0.1891 combined 1985�1999 0.2888 combined 1985�1999 0.1885 top 5a) 0.2329 top 5a) 0.1461 mediuma) 0.3059 mediuma) 0.1935 smallest 5a) 0.3319 smallest 5a) 0.2478 Notes: The estimates in this table are average and individual inefficiency scores of European financial exchanges over the time period 1985�1999. The coefficients are listed in ascending order so that those stock exchanges with the lowest inefficiency level are ranked first. Note that an accurate interpretation of these scores is valid only under the specific stochastic frontier formulations. a) The grouping of the stock exchanges is constructed according to the value of the capitalisation of the respective market. Furthermore, inefficiency scores have been calculated for three different panels. The classification of the exchanges has been made according to the value of the market capitalisation of the respective stock market. For example, the first panel includes the five leading European markets, namely Amsterdam, Frankfurt, Madrid, London, and Paris, while the others comprise medium and smaller exchanges. The evidence reveals average inefficiency scores for the top five, medium, and smallest exchanges of 23.29, 30.59, and 33.19 per cent respectively. These scores suggest that larger exchanges operate more

81
efficiently relative to the group of smaller exchanges. In the first part of Table 6.3, disaggregated results provide information on the inefficiency level of the individual stock exchanges. When interpreting the ranking of the inefficiency scores, one should bear in mind that the estimates are valid only given the specific stochastic frontier formulations. Overall, there is little effect on the average level or dispersion of cost inefficiency across the model variation, although the preferred model with non-neutral technical change in the stochastic frontier exhibits some higher inefficiency scores. A breakdown of the estimated cost efficiencies on the individual exchange level also shows that the ranking of exchanges according to their efficiency is also robust to model variations. Aggregated results expose decreasing inefficiency over time. The histograms in Figures 6.1a and 6.1b depict the distribution of exchanges with their corresponding technical inefficiency scores over the entire time period. Both graphs reveal an asymmetric distribution of technical inefficiency scores pointing towards efficiency progress over time. It is apparent that most of the exchanges have predicted inefficiencies in the interval 30 per cent observed in the period 1985�1989. However, the majority of stock exchanges were able to improve substantially technical efficiencies over the last decade, so that most observations can be found in the inefficiency range close to 10 per cent in the last five-year time interval. It can be summarised from empirical evidence that changes in the governance structure, market concentration and quality, as well as developments in new trading technologies are associated with improved cost efficiency among European stock exchanges. Disaggregated results exhibit the better ability of larger exchanges to manage costs in a more efficient manner relative to their smaller competitors. In addition, evidence reveals that diversification in trading activities experiences higher cost efficiency.

82
Figure 6.1a Distribution of sample cost inefficiencies of European stock exchanges by 5-year time intervals (Model IIa: with technical change)
0
10
20
30
40
50
60
0-1010-2020-3030-4040-5050-6060-7070-more
Range of Inefficiencies
Perc
enta
ge
1995-1999 1990-1994 1985-1989
70-more 60-70 50-60 40-50 30-40 20-30 10-20 0-10
Range of Inefficiencies1995-1999 1990-1994 1985-1989
60
50
40
30
20
10
0
Perc
ent a
ge
Figure 6.1b Distribution of sample cost inefficiencies of European stock exchanges by 5-year time intervals (Model IIb: without technical change)
0
10
20
30
40
50
60
0-1010-2020-3030-4040-5050-more
Range of Inefficiencies
Perc
enta
ge
1995-1999 1990-1994 1985-1989
Perc
enta
ge
0
10
20
30
40
50
60
50-more 40-50 30-40 20-30 10-20 0-10
Range of Inefficiencies1995-1999 1990-1994 1985-1989

83
7 Conclusions Despite important structural changes in modern global and European financial exchange markets mainly due to technological developments, a changing regulatory environment, and continuing globalisation, relatively little is known about the impact of such forces acting on the efficient organisation of these markets. The paper provides novel insights into the microstructure of European financial exchanges and extends related empirical work in this area in several ways. The innovation includes the use of a translog stochastic frontier model to quantify technical efficiency effects among financial exchanges. Moreover, the present study employs a single-stage approach to estimate inefficiency effects. Furthermore, the study evaluates the organisation of exchange institution efficiency in a European context, since increasing competition among stock exchanges is a recent and quite acute phenomenon, especially in Europe. The paper also makes a first attempt at analysing potential correlates helping to explain variations from the efficient frontier. The estimations are based on a unique unbalanced panel data set covering all major European financial exchanges during the years 1985�1999. Overall evidence suggests that, on average, European financial exchanges operate at a 20 to 25 per cent higher cost level compared to the efficient benchmark exchange. The estimates also indicate that European exchanges have experienced steady improvements in their relative technical efficiency scores over the sample period. Nevertheless, it was found that in more recent years trading service providers in Europe still operate at a significantly less efficient level than the predicted benchmark. Graphical evidence on the distribution of inefficiency scores over the sample period is consistent with the finding of substantially increasing but persisting differences in technical efficiency among European exchanges. Moreover, sub-sample results show that large exchanges outperform their smaller counterparts in terms of higher efficiency. With the incorporation of efficiency effects, the paper also contributes to examining the relationship between exchange institution efficiency and organisational form. Accordingly, the presented evidence suggests that exchange operating efficiency is related to size effects, ownership form, trading quality and market concentration, the integration of other trading activities, and first generation automated trade execution technologies, though no efficiency enhancing effect was found for the years in business and second generation cross-border trading facilities at the current stage.

84
What can be inferred from the presented results concerning future prospects for an integrated common European security market? One plausible implication in light of the ongoing discussion about the fragmented European exchange industry is that the formation of mergers or alliances among exchanges may have a beneficial effect on the market if they enhance efficiency improvements and permit exchanges to take advantage of scale economies. Furthermore, the creation of alliances among exchanges would also enable co-operating exchanges to share the high establishment and development cost of new electronic trading technologies, which might lead to greater system efficiency. The trend towards the concentration of exchange markets in Europe is well on its way, but considerable room for improvement remains in attaining an efficient market organisation of the European trading landscape. In this respect, regulators are challenged to create and ensure a stable European regulatory system that is flexible enough to adjust adequately to future technological and market developments. Initial initiatives in this direction have already been achieved by a recent agreement on a new legislative process for the European securities market based on the reports of the Committee of Wise Men (2001).

85
References Aigner, D.J. � Lovell, C.A.K. � Schmidt, P. (1977) Specification and
estimation of frontier production, profit and cost functions. Journal of Econometrics 6, 21�37.
Annual Reports (1985�1999) Annual reports of 28 European stock
exchanges. Arnold, T. � Hersch, P. � Mulherin, J.H. � Netter, J. (1999) Merging
markets. Journal of Finance 52, 655�681. Battese, G.E. � Coelli, T.J. (1993) A stochastic frontier production
function incorporating a model for technical efficiency effects. Working Papers in Economics and Applied Statistics 69, University of New England, Armidale.
Battese, G.E. � Coelli, T.J. (1995) A model for technical inefficiency
in a stochastic frontier production function for panel data. Empirical Economics 20, 25�332.
Battese, G.E. � Corra, G.S. (1977) Estimation of a production
frontier model: with application to the pastoral zone of eastern Australia. Australian Journal of Productivity Analysis 3, 153�169.
Berger, A.N. � DeYoung, R. � Udell, G.F. (2001) Efficiency barriers
to the consolidation of the European financial services industry. European Financial Management 7 (1), 117�130.
Berger, A.N. � Humphrey, D.B. (1997) Efficiency of financial
institutions: International survey and directions for future research. European Journal of Operational Research 98, 175�212.
Berger, A.N. � Mester, J. (1997) Inside the black box: What
explains differences in the efficiencies of financial institutions. Journal of Banking and Finance 21, 895�947.
Coelli, T.J. � Prasada Rao, D.S. � Battese, G.E. (1998) An
introduction to efficiency and productivity analysis. Kluwer Academic Publishers, Boston, Massachusetts 02061.

86
Committee of Wise Men (2001) Final report of the Committee of Wise Men on the regulation of European securities markets. Brussels.
Cybo-Ottone, A. � Di Noia, C. � Murgia, M. (2000) Recent
development in the structure of securities markets. Brookings-Wharton Papers on Financial Services, 2000.
Demsetz, H. (1968) The cost of transacting. Quarterly Journal of
Economics 82, 33�53. Di Noia, C. (2001) The stock-exchange industry: Network effects,
implicit mergers, and remote access. European Financial Management 7 (1), 39�72.
Doede, R. (1967) The monopoly power of the New York Stock
Exchange. Unpublished Ph.D. dissertation, University of Chicago. Domowitz, I. � Steil, B. (1999) Automation, trading costs, and the
structure of the trading services industry. Brookings-Wharton Papers on Financial Services, 1�52.
FIBV (1985�1999) Annual reports 1985�1999. International
Federation of Stock Exchanges, Paris. Hasan, I. � Malkamäki, M. (2001) Are expansions cost effective for
stock exchanges? A global perspective. Journal of Banking and Finance, 25 (12), 2339�2366.
International Monetary Fund, various issues. International Financial
Statistics, Washington. Kumbhakar, S.C. � Lovell, C.A.K. (2000) Stochastic frontier
analysis. Cambridge University Press. Malkamäki, M. � Topi, J. (1999) Strategic challenges for exchanges
and securities settlement. Bank of Finland Discussion Paper Series, 4/1999.
Meeusen, Y.M. � van den Broeck, J. (1977) Efficiency estimation
from Cobb-Douglas production functions with composed errors. International Economic Review 18, 435�444.

87
MSCI (1995�2000) Handbook of world stock, derivative, and commodity exchanges. Mondo Visione, UK.
OECD (2001) Future prospects for national financial markets and
trading centres. OECD, Paris. Pirrong, C. (1999) The organization of financial exchange markets:
Theory and evidence. Journal of Financial Markets 2, 329�357.

88
Appendix Table A1 Summary of panel data set
Exchange Years Euronext Amsterdam 1989�1999 Athens Stock Exchange 1997�1999 Barcelona Stock Exchange 1992�1995 Bolsa de Bilbao 1992�1999 Bolsa de Madrid 1995�1999 Bolsa de Valencia 1989�1990, 1992�1999 Euronext Brussels 1991�1999 Copenhagen Stock Exchange 1992�1999 Deutsche Börse AG 1991�1999 Helsinki Stock Exchanges 1985�1999 Istanbul Stock Exchange 1995�1999 Bolsa de Valores de Lisboa/Porto 1997�1998 London Stock Exchange 1989�1999 Ljubljana Stock Exchange 1990�1999 Bourse de Luxembourg 1993�1999 Malta Stock Exchange 1992�1999 Oslo Bors 1987�1999 Euronext Paris 1990�1999 OM Stockholm Exchange 1985�1999 Swiss Exchange 1996�1999 Wiener Börse 1993�1999 Warsaw Stock Exchange 1993�1999 Irish Stock Exchange 1996�1998 Tallinn Stock Exchange 1996�1999 Budapest Stock Exchange 1997�1999 Prague Stock Exchange 1992�1999 Iceland Stock Exchange 1989�1999 Riga Stock Exchange 1996�1999

89
Table A2 Summary statistics for variables in the stochastic frontier and employed as potential correlates of inefficiency for European exchanges, 1985�1999 Variable Definition Mean Standard
Deviation TC TC
(thousands US$) Total operating expenses of the i�th exchange in the t�th time period
47583 84315
Q1 NCOM Number of companies listed on the i�th exchange in the t�th time period
399 555
Q2 VTRADE (millions US$)
Total value of shares traded on the i�th exchange in the t�th time period
211000 658000
Q3 VCOM (millions US$)
Total value of listed companies on the i�th exchange in the t�th time period
323000 1360000
Q4 NTRADE (thousands US$)
Total number of trades dealt on the i�th exchange in the t�th time period
5759 10869
P1 PRICE CAPITAL (%)
Total capital expenditures, ie office expenses, IT and systems costs, and equipment, scaled by the book value of net total office premises and equipment of the i�th exchange in the t�th time period
2.2725 2.1868
P2 PRICE LABOR (thousands US$/ employee)
Total expenditures on employees divided by the number of employees for the i�th exchange in the t�th time period
69.8381 33.6582
X SMI (%) Stock index performance of the i�th exchange and the t�th time period
136.45 235.81
T TIME Time trend ZI1 ASSET
(thousands US$) Total of financial and non-financial assets of the i�th exchange in the t�th time period
152943 518463
ZI2 CAPITAL (thousands US$)
Total capital of the i�th exchange in the t�th time period
56716 92101
ZI3 CONCAP(%) Market concentration of five per cent of the most capitalised domestic companies compared with the total market capitalisation of domestic companies on the i�th exchange in the t�th time period
56.72 13.92
ZI4 AGE (years) Number of years the i�th exchange is in business
129 95
ZI5 TURNOVER (%) Turnover velocity is the annualised ratio between turnover of domestic shares and their market capitalisation for the i�th exchange in the t�th time period
72.61 36.69
ZII1 DER Dummy, equals one if the i�th exchange is involved in derivative activities in the t�th time period, otherwise zero
0.18 0.39
ZII2 AUTOM Dummy, equals one if the i�th exchange has switched from materialised to automated trade execution, otherwise zero
0.23 0.42

90
Table A2 Summary statistics for variables in the (continued) stochastic frontier and employed as potential correlates of inefficiency for European exchanges, 1985�1999
Variable Definition Mean Standard Deviation
ZII3 REMOTRADE Dummy, equals one if the i�th exchange allows remote access, otherwise zero
0.02 0.13
ZII4 PROFIT Dummy, equals one if the exchange has demutualised, otherwise zero
0.08 0.27
Notes: All currencies are converted into uniform U.S.$ measures and all variables other than the qualitative proxies are expressed in natural logarithms.

91
Chapter 3
Technology, automation, and productivity of stock exchanges:
international evidence
Iftekhar Hasan � Markku Malkamäki � Heiko Schmiedel
Abstract ..............................................................................................92 Acknowledgements ............................................................................93 1 Introduction ................................................................................94 2 Stock exchanges and the changing environment ........................97 3 Related literature ......................................................................101 4 Measurement issues..................................................................104 5 Empirical methodology ............................................................107 6 Correlates of cost and revenue efficiency.................................110 7 Data and descriptive statistics ..................................................113 8 Empirical evidence...................................................................116 9 Conclusions ..............................................................................128 References ........................................................................................130

92
Abstract The paper stresses the importance of understanding operational choices, strategies, and performances of stock exchanges as regular operating firms (Arnold et al, 1999; Pirrong, 1999). Using unbalanced panel data on 49 stock exchanges over the period 1989�1998, the paper traces the productivity of stock exchanges over time and across different types and groups of exchanges. We find significant variability in productivity � revenue and cost efficiency � across these exchanges. On average, North American exchanges are found to be most cost and revenue efficient. However, our findings also indicate that European exchanges have improved the most, in respect of cost efficiency, while exchanges in South America and Asia-Pacific are found to be lagging as regards both cost and revenue estimations. Evidence also indicates that investment in technology-related developments effectively influenced cost and revenue efficiency. Moreover, organisational structure and market competition are found to be significantly associated with both cost and revenue efficiency for the exchanges studied, whereas market size and quality are related only to revenue efficiency. Key words: stock exchanges, technological progress, technical efficiency JEL classification: C23, G2, L2, O50

93
Acknowledgements This paper originates from the research visits of Heiko Schmiedel at the Research Department Bank of Finland, Helsinki, and New York Stern University Salomon Center. He would like to thank both institutions for their hospitality and generous support. Special thanks are also due to the HWWA-Hamburg Institute of International Economics for having supported this research. This work benefited from conferences and workshops at the Bank of Finland, International Atlantic Economic Society Conference in Philadelphia, USA, Canadian Capital Market Institute in Toronto and the S.U.E.R.F. conference in Helsinki. The authors are grateful to the comments and suggestions provided by Ian Domowitz, Larry Eckoben, Paul Halpern, Bob Jennings, David Mayes, Ted Neave, and Juha Tarkka. The authors are also grateful to Virpi Andersson and Jani-Petri Laamanen for providing most efficient research assistance. The views expressed are those of the author and do not necessarily reflect the views of the Bank of Finland. An earlier version of this paper was published as a Bank of Finland Discussion Paper, No. 04/2002. Reprinted from Journal of Banking and Finance, Vol. 27, Hasan I., Malkamäki M., and Schmiedel H., Technology, automation, and productivity of stock exchanges: international evidence, 1743�1773, 2003, with kind permission from Elsevier.

94
1 Introduction Increased integration and consolidation of financial markets and institutions, changing technology, and the regulatory environment have altered the competitive norm within the stock exchange industry. Consequently, exchanges are behaving more like business firms, adjusting to the new environment via increased automation, changes in organisational governance, and creation of alliances to compete for increased market share and to minimize costs and maximize revenue. These trends have been popular both in domestic markets as well as in the global arena (Arnold et al, 1999; Hasan and Malkamäki, 2001). The overwhelming consensus so far is that these changing initiatives and the growth of trading on exchanges are driven by technological developments that have reduced communication and transaction costs and encouraged exchanges to invade each others� market for order flows (Angel, 1998; Lee, 1998; Wicker-Miurin and Hurt, 1999). Exchanges have thus been spending enormous sums to upgrade their technology and revise their business strategies in order to cope with the new environment.1 In fact, 77% of the CEO�s of the stock exchanges around the globe intend to develop e-business beyond using the Internet as a means of communications (FIBV, 2001). Recent examples of technological advances are NASDAQ�s plans to establish a new automated exchange, SuperMontageSM, designed to achieve best execution of trades2 and the New York Stock Exchange investment in another six Onyx2TM visualisation supercomputers in its� already remodelled 3D visualisation operation centre (NYSE, 1999). Other substantial innovations of new electronic venues for efficient and cost effective national and cross-border trading comprise recent implementations of Virtx and Norex. It is widely believed that investments in new technologies will result into higher efficiency, effectiveness and quality of operation. Such expectations are consistent with Brynjolfsson et al (2001) finding that a dollar of 1 Investment in information processing equipment accounted for about 34% of total investment, surpassing the 22% share of industrial machinery products invested in the economy (Triplett, 1999). 2 SuperMontageSM intends to bring together the auction and market maker system with a single point of entry for both quotes and order activity in contrast to the current Unisys 6830 quotation system, Automated Confirmation Transaction Service (ACTSM) and SupersoesSM technology. The SuperMontageSM is going to be more costly but more affective than SupersoesSM � introduced in the year 2000 � which uses Tandem�s non-stop 50 Himalyn machines with each capable of handling 2000 transactions per second. For more details see www.nasdaq.com.
95
installed new technology capital generates five dollars of additional market value. The merging of exchanges has led to growth of market share, narrower bid-ask spreads (Arnold et al, 1999) and lower cost and quality of trading (Bessembinder and Kaufman, 1997). Similar experiences abound in other countries and regions, especially in Europe (Di Noia, 2001; Chapter 2). Interesting debates have been stimulated by analytical studies of exchanges. One matter of concern is the benefits deriving from stock exchanges� investments in automation and �system development�. Another concern is whether stock exchanges are as efficient as operating firms. Does particular organisational structure influence exchange efficiency and are there significant economies of scale in the operations of stock exchanges? If so, would their exploitation results in dominance by a few super exchanges and possible elimination of the relatively smaller exchanges? Domowitz and Steil (1999) report that automation advances have fundamentally changed the cost for trading services to inverstor benefit. Williamson (1999) calls technology one of the key driving factors of structural change and the advancement of stock markets. Hasan and Malkamäki (2001) report on the existence of significant economies of scale and scope among stock exchanges. This is consistent with prior projections by Demsetz (1968), Stigler (1961) and Stulz (1999). On the other hand, some argue that any differences in the price of risk across markets or the existence of heterogeneous information will continue to slow the integration process (Gehrig, 1998a; Korajczyk, 1997). McInish and Wood (1996) further show that competition among markets produces tighter spreads and lower liquidity premia. In the popular business literature, there is also fairly wide agreement that costs associated with technology implementation are �sunk� to an extent and that payback is somewhat doubtful for the spending on computers and related technology that is deemed necessary in order to keep up with current technology norms (Strassman, 2001). Using unbalanced panel data on 49 stock exchanges for the period 1989�1998, this paper attempts to contribute further to the debate by tracing the productivity of stock exchanges over time and across different types and groups of exchanges. The paper introduces stochastic frontier analysis in estimating cost and revenue efficiency of the sample exchanges.3 It further investigates the impact of technology affecting efficiency. Additionally, it examines the
3 See Kumbhakar and Lovell (2000) for econometric details on stochastic frontier.

96
influence of organisational type, structure, and corporate governance on efficiency. This is one of the first comprehensive attempts to evaluate stock exchange performance treating exchanges as operating firms (Arnold et al, 1999; Pirrong, 1999). This approach is of great importance for the evolution of market structures and contestability of markets because stock exchanges make choices concerning trading technologies, ie the supply side of their trading services. Domowitz and Steil (1999) argue further that industrial structure of market places cannot be explained by focusing on the demand side alone, as found in financial market microstructure studies that concentrate on the characteristics of trading systems and the demand side of trading services (ie the traders). It is equally important to know more about the provision of alternative technologies for trading services. The overall results indicate that there are substantial revenue and cost inefficiencies across exchanges. On average, North American exchanges are the most cost and revenue efficient. However, European exchanges are found to be the most improved in terms of cost efficiency. Exchanges in South American and Asia-Pacific regions appear to be lagging in both cost and revenue efficiency estimations. Evidence indicates that investment in technology development effectively influenced cost effectiveness as well as revenue efficiency. Additionally, organizational design and market competition are found to be significantly associated with both cost and revenue efficiency whereas market size and quality are associated only with revenue efficiency. The paper is organised as follows: Section 2 introduces the business of stock exchanges and examines recent developments in the industry. This is followed by a brief review of the literature in Section 3. Sections 4�7 introduce data and measurement issues as well as the empirical models. Section 8 reports the results and the conclusions, are given in Section 9.

97
2 Stock exchanges and the changing environment
Stock exchanges are primarily in the business of providing security listing, trading, and clearing services, ie match making between buyers and sellers of securities, and providing a mechanism for price discovery. Exchanges are also involved in producing revenue for the organisers of the market. In fact, unless organisers are sufficiently compensated, they are not likely to provide the funds and services needed to operate indefinitely (Angel, 1998). While the US and Canadian exchanges have been operating in a competitive environment for a number of years, the European and Asian exchanges have historically been local monopolies. In Europe, it is only recently that an exchange has been seen as an entity competing for customers and businesses with a corporate-like bottom-line-oriented organisation (Di Noia, 2001). Di Noia rightly points out that it is difficult to understand what constitutes the industry and what is its relevant market. Fishel and Grossman (1984) assumed an exchange to be a large corporation that competes with other firms and is forced to produce the best possible price-quantity combinations. Ownership structure, however, makes exchanges different from traditional firms because, in some cases, the customers are also the owners of the firm. And it is likely that the owners of these exchanges may not be the best profit maximisers. As Pirrong (1999) claims, rapid advances in communications technology have helped to minimise the fragmenting effect of physical distance on exchange formation. Shapiro and Varian (1999) believe that cheap computer technology will allow electronic trading to dominate the business. Networks will provide investors with a range of alternatives to choose from. The recent success of Eurex is an example of how networks can replace a trading floor in another country. Currently the financial markets entail network externalities especially in the United States where there has been a huge invasion of new equity routing/matching/trading systems, eg Instinet, POSIT, AZ, and Attain. These systems have gained increasing volumes, especially in stocks listed on NASDAQ as well as many NYSE-listed stocks.4 This situation has enabled new scenarios in which economies 4 For more details on these issues, see Bessembinder and Kaufmann (1997), Domowitz and Steil (1999), Economides (1993), Economides and Siow (1988), and Malkamäki and Topi (1999).

98
of scale and expectations of additional revenue and cost efficiencies can lead to consolidation of traditional stock exchanges.5 Worldwide, a large number of new derivative and stock exchanges have been established. In the 1990s alone, we have seen the emergence of 60 new exchanges, most of them located in Asia-Pacific Rim and in Central and Eastern Europe.6 These new exchanges in emerging economies are functioning primarily in national markets and are local in nature and activities. While there has been an increase in the number of exchanges, forces such as deregulation, technological developments and increased network externalities have created a consolidation-friendly environment, especially in Europe. The introduction of the euro has added further incentives to initiate alliances. Malkamäki and Topi (1999) argue that these changes on the whole will allow financial institutions to take advantage of economies of scale in their operations and that location will gradually lose some of its importance for market places and competition will intensify among financial centres, exchanges and settlement systems. New structures will emerge and even the centres may become less important. White (1996) emphasises the importance of uniform regulations that will bring substantial benefits associated with the resulting harmonisation. North American exchanges lead the regions of the world in providing a relatively homogeneous regulatory framework for stock listings, trading, executions and settlements. Following the US example, Europeans have recently taken initiatives to put in place uniform regulations in all areas. The Asian and South American exchanges are under less centralised and harmonised regulatory umbrellas and operate mostly according to country-specific rules and regulations.7 Developments in technology have been a major source of structural changes in securities markets during recent decades. These changes have created a foundation for modern electronic trading, clearing and settlement systems used in securities markets. Economic analysis suggests that a single market will come into being if there are no regulatory barriers that prevent its formation and if advanced telecommunication technologies exist, ie if the market is not dependent on physical location. Hasan and Malkamäki (2001) find
5 At the same time, as new alternative electronic trading systems create new services and competition that may lead to fragmentation of liquidity and cream skimming. 6 See Clayton et al (1999) and MSCI Handbook of World Stock, Derivative, and Commodity Exchange (1999). 7 See Freedman (1999), Malkamäki and Topi (1999) and White (1996) for more details.

99
that economies of scale are clearly present in stock exchange trading systems. The authors argue that rapid advancement in communications technology has served to minimise the fragmenting effect of physical distance on exchange formation. Domowitz (1995) and Domowitz and Steil (1999) state that an exchange or trading system is analogous to a communication network, as benefits to one trader transacting on a given trading system increase when another trader chooses to transact there as well. These benefits are referred to as network effects or network externalities. Theoretical and empirical analyses both suggest that economies of scale and cost efficiency are a major source of competitive pressure in a stock exchange�s environment if the necessary preconditions for contestable markets are fulfilled. Moreover, new technology facilitates additional ways for infrastructure to develop. In particular, we see that trading platforms of stock exchanges meet increasing competition from less organised marketplaces. In US markets, the entry of off-exchange trading institutions such as Arizona Exchange, Instinet and Posit, which use the Internet as an essential transmission channel, already pose a challenge to existing stock exchanges and traditional brokers. The value of the Internet lies in its capacity to provide immediate access to information at very low costs. Although the euro security markets together comprise the second largest market in the world, after the U.S. market, the market for euro denominated securities is much smaller, relative to the size of the economy, than the US securities market. Securitisation is likely to proceed in Europe because of the increased size and liquidity of the euro securities markets compared with the former individual national securities markets (Duisenberg, 1999; McCauley and White, 1997; Prati and Schinasi, 1997). Introduction of the euro and other measures contributing to European integration are boosting European securities and derivatives markets onto the global stage. Demand for cross-border financial services has increased rapidly. Asset managers and brokers must be able to operate in many markets. This has led the biggest banks and securities houses to look for scale advantages via mergers and acquisitions. Within Europe, competition among marketplaces and institutions operating trading and settlement systems is rapidly intensifying. Several intercontinental mergers of listed companies also raise the question of where trading of these companies� shares will take place in the future. Clearly, there is now global competition for the liquidity. In respect of organisational structure, the automated trading system creates a new environment, as it allows firms to specialise more in producing trading services. These firms seem to capture market share

100
quite easily, especially in the United States. Many exchanges that were formerly cooperatives have changed their ownership structure to that of a profit-motivated corporation. Some exchanges such as NYSE have a traditional trading floor-based-auction market as well as electronic books and automated network. The success of Eurex, as compared to LIFFE, may on the other hand, be partly explained by differences exchange governance. Hart and Moore (1996) argue that members of cooperative exchanges may be reluctant to accept changes that would affect their own business, even if this is not in their own interest in the longer run.

101
3 Related literature A number of studies focus on scale economies in information processing and the future of financial centres. Stigler (1961) published one of the first studies on scale economies in securities markets, which was followed by a more extensive paper by Doede (1967). These papers report that average operating costs of stock exchanges are a declining function of trading volume and that there seems to be evidence of economies of scale in the industry. Demsetz (1968) focuses on bid-ask spreads, finding them to be a declining function of the rate of transaction volume. He, thus claims the existence of some sort of economies of scale in market making of a particular security. Smith (1991) highlights the declining marginal cost of information and the benefits of integrated markets. Domowitz (1995) argues that common electronic trading platforms, ie implicit mergers between existing exchanges, will emerge because of the positive liquidity effect and that this will enable increased revenue, as individual exchanges are likely to set prices above marginal cost. Cybo-Ottone et al (2000) investigate European exchanges over the period 1993�1994, reporting potential differences in level of efficiency and performance across exchanges, based on cost-to-revenue ratios. Hasan and Malkamäki (2001) find that overall economies of scale exist among the big exchanges, especially in North America and Europe, and look to increased productivity in the future. Davis (1990) reports that innovation in technology and new uniformity of regulation in the EU countries would lower entry barriers, and foster competition and better performance. Gaspar and Glaeser (1996) show that telecommunications is complementary, rather than supplementary, for financial centres, which contradicts the usual argument that telecommunications will reduce the importance of traditional exchanges and locations. Gehrig (1998b), Grilli (1989), and Krugman (1991) claim that technological conditions and economies of scope and scale are the sources of potential agglomeration and performance among markets. Brennan and Cao (1997) and Grinblatt and Keloharju (2001) note the importance for performance of culture, language and related behavioural aspects of investors and institutions, as compared to distance, technology and related factors. A number of studies either compare or discuss theoretical predictions of performance differences across exchanges in US markets, based on various differences in regulation or market or organisational structure. Bhattacharrya and Spiegel (1991) focus on differences in enforcement of trading laws while Biais (1993) and

102
Schmidt (1977) discusses market differences between a centralised single venue and a fragmented marketplace. Huang and Stoll (1996) discuss differences between NYSE and NASDAQ markets, finding a higher spread on the NASDAQ, which is a dealers� market. Similarly, comparing bid-ask spreads of German Dax stocks traded on IBIS with a sample of US stocks traded on NASDAQ, Booth et al (1999) provide evidence for lower spreads in the German agency market relative to the US dealer market for the most active stocks in each market.8 Analysing the German electronic trading system, Schmidt and Simić (2000) establish that orders subsequent to large limit orders appeared in the book are likely to increase the non-execution risk of limit orders. In turn, due to the balancing effects on non-book sources of liquidity, this does not necessarily have negative repercussions on the number and structure of limit orders on the book and market liquidity. Domowitz and Steil (1999) look at differences between trading floor and automated electronic order-based trading and also between mutual and non-mutual institutions. A few of the related papers focus on the multi-country environment. Perold and Sirri (1997) investigate cross-country variation in trading costs, and a similar paper by Domowitz et al (1999) followed, focusing on the simultaneous relationship between cost, liquidity, and volatility. Recently, Jain (2001) extends the literature using comprehensive multi-country evidence to determine the liquidity of stock exchanges as related to an exchange�s institutional structure. He reports lower spreads and volatility on exchanges with hybrid systems (incl. both trading floor and electronic order book and networks) than on fully dealer-based systems. Except for Domowitz and Steil (1999) and Hasan and Malkamäki (2001), most of the studies discussed above focus primarily on the demand side, dealing with trading system characteristics, trading services, and the exchange�s ability to attract liquidity, as well as spread and volatility. Following the basic arguments of Arnold et al (1999) and Pirrong (1999), this paper evaluates the performances of stock exchanges treated as operating firms and thus stresses the nature and importance of the supply side of their trading services. The paper also deals with a multiyear global data set, which avoids regional bias. Given the differences in the extent of initiatives of consolidations, implicit alliances, and cooperation among exchanges in different regions (especially in Europe), it is important that the
8 See Schmidt and Iversen (1992) for additional bid-ask spreads comparisions between the competing systems of IBIS, MATIS, and SEAQ International.

103
study provide separate perspectives for different regions. Therefore, we use the information from a panel of 49 exchanges over the sample years in four continents.

104
4 Measurement issues What constitutes inputs or outputs for any financial institution is controversial. It is even more difficult to do so for the exchanges since it is not clear what comprises the stock industry or relevant market. In general, processing fairly homogeneous transactions and evaluating issuer-specific information can be seen as two separate functions. A close look at operations and annual reports of stock exchanges confirms the notion of two functions producing two outputs (Hasan and Malkamäki, 2001). Stock exchanges have computers, software and personnel for matching and processing trades. They also have personnel and regulations that are needed to maintain the marketplace, communicate with companies in order to handle the listing of companies, monitor how company-specific information is released, and determine whether companies observe marketplace regulations. Literature suggests that such activities, which are based on very simple information, tend to be centralised. Limit orders and market orders can be considered standardised information, the processing of information, which is technical and not issuer-specific, ie, all transactions are treated in more or less the same way in the trading system. Thus, trade executions can realistically be based on technology that is standardised throughout a country or region. On the other hand, more complex, issuer-specific information may require face-to-face contacts for proper understanding. Centralisation in this area may cause congestion problems and may be costly. It might therefore be optimal that listing procedures, communication with companies and related matters be handled by national exchanges. Following some of the justifications and arguments above, we consider relevant proxies for trading system output that seem fairly obvious and for which we can obtain consistent data, including the number and value of executed transactions. The output associated with company listing procedures and monitoring of company specific information is more difficult to measure. Possible proxies for this output are number and value of listed companies.9 There are no direct measures available for inputs of stock exchanges. The two most important input prices for the operations of stock exchanges (see Table 1) are costs associated with trading systems (technology and
9 The listing procedures and monitoring may differ across countries, however, here we follow FIBV (Federation of International Stock Exchnages) data which requires some uniform reporting procedures by the member exchanges.

105
office expenses) and employees. Based on averages for the available sample period, Asian exchanges had significantly higher office expenses. A significantly higher proportion of exchanges� expenses were staff-related. These expenses were highest in North America (38.40%) compared to other regions, eg Asia-Pacific region (28.90%), Europe (32.52%), and South America (18.0%). Disaggregated labor data is not available in many of the annual reports. We started our empirical research by including at least one relevant input price variable, per capita gross domestic product (GDP), as a proxy for labor cost differences across countries. Later we concentrate on sub-sample regressions for which we have clean data for labor expenses. In fact, we were able to get the actual labor cost data for 26 of the exchanges. Interestingly, the estimations using per capita GDP as the labor input proxy did not yield significantly different results for the 26 exchanges compared to estimations using direct measure of labor price as an input. Table 4.1 Distribution of average cost structure by region (% of total cost) Systems Administration Staff Office Depreciation Other Asia 18.8 16.0 28.9 11.5 9.5 15.2 (16.2�23.1) (14.2�18.7) (27.7�30.0) (10.1�12.3) (9.3�9.9) (11.0�19.0) Europe 21.93 7.60 32.32 8.22 10.93 18.97 (18.9�26.6) (6.6�9.0) (28.5�35.1) (7.8�8.9) (9.9�12.2) (18.2�20.0) North 20.7 10.6 38.4 4.5 8.7 17.3 America (17.3�23.2) (7.3�13.9) (33.9�43.4) (4.3�4.7) (8.3�9.1) (12.3�23.2) South 8.9 21.7 18.0 5.3 10.0 34.5 America (8.5�9.4) (19.6�23.0) (13.6�20.6) (5.7�7.9) (10.4�12.1) (27.9�39.6) Notes: Averages are based on the last three years of information provided by the FIBV. The distribution range is given in brackets. Data previous to these years do not provide segmented information. Some of the stock exchanges have expanded their operations to include derivatives and settlement businesses. Many of these do not publish sectoral cost figures. In order to incorporate such differences in reported cost data, we added a dummy variable in regression estimations, highlighting those exchanges whose business activities and cost data include derivatives and/or securities settlement expenses in addition to the output and input variables. We estimated four models using the greatest possible numbers of sample exchanges in the data set. Model 1 includes two outputs (number of companies, value of shares traded) and one input (GDP per capita) over the sample years, 1989�1998. Model 2 is the same as Model 1 except that the sample period is 1993�1998. Model 3 uses the

106
same outputs but more direct measures of inputs, ie price of labor and price of capital, as well as a netput variable � transaction velocity � to control for the quality aspect of exchange operation. The model also includes an operational environmental variable, ie industrial production per sample year. Model 4 is similar to Model 3, but it includes technological change, which associates the time trend with output, input, and netput variables.

107
5 Empirical methodology In carrying out our empirical analysis, we use the methodology developed by Aigner et al (1977), Meeusen and Broeck (1977), and Stevenson (1980) � stochastic frontier analysis. This allows us to calculate a measure of revenue and cost efficiency for each sample stock exchange (Kumbhakar and Lovell, 2000). The stochastic frontier function to be estimated, eg a maximum revenue or a minimum cost frontier, incorporates a two-component error structure. One component is a controllable factor and the other is a random uncontrollable component. For the i�th producer in the t�th time period, we observe
itititititititit DSR)T,Z,P,Y(f)TR(TC ε+++= (5.1) with i = 1,...,N and t = 1,...,S, where TCit (TRit) represents the firm�s total cost (total revenue), Yit represents the various products or services produced by the firm, Pit represents the prices of inputs used by the firm in the production of the products and services, Zit represents the fixed netput quantities, quality of output, T represents technology change, SRit represents the environmental variable, Dit is a dummy for exchanges with both derivatives and security settlements, and εit represents a random disturbance term which allows the cost (revenue) function to vary stochastically, ie it captures the fact that there is uncertainty regarding the level of total costs or revenue that will be incurred for given levels of production. Decomposing the error term yields,
)vu(vuDSR)T,Z,P,Y(f)TR(TC ititititititititititit +−++++= (5.2) with i = 1,...,N and t = 1,...,S, where vit�s represent random uncontrollable factors that affect total costs, such as weather, luck, labor strikes, or machine performance. The vit�s are identically distributed as normal variates and the value of the error term in the cost and revenue relationship is, on average, equal to zero. The uit�s, on the other hand, represent the controllable components � consisting of factors such as the firm�s technical and allocative efficiency, which are under the control of firm�s management. The uit�s are derived from a N(0, 2
uσ ) distribution truncated below zero. Following Aigner et al (1977), and Jondrow et al (1982), we gain insight into controllable firm efficiency by considering the ratio of variability of the firm�s

108
technical and allocative efficiency. The frontier function approach maintains that managerial or controllable inefficiencies only increase (decrease) costs (revenue) above (below) frontier or best practice levels and that random fluctuations can either increase or decrease costs (revenue). Since uncontrollable factors are assumed to be symmetrically distributed, the frontier of the cost (revenue) frontier, f(.) + εit, is clearly stochastic. The positive (negative in a revenue function) term, uit, representing inefficiency, causes the cost (revenue) of each firm to be above (below) the frontier.10 Jondrow et al (1982) demonstrate that the ratio of variability (λ = σu/σv) for uit and vit can be used to estimate a firm�s inefficiency. Small values of λ imply that the uncontrollable factors, σv, dominate the controllable inefficiencies, σu. A measure of controllable inefficiency for the i�th firm is formulated as
]/)/(/)/()[1/(]u[E 2 σλε+σελΦσλεφλ+σλ=ε (5.3) 10 In Aigner et al (1977) and Jondrow et al (1982), a firm is permitted to be both technically and allocatively inefficient and requires a joint system of a frontier production function and the associated first order conditions for a cost minimum. Departures from the production frontier represent technical mistakes, while errors in the first order conditions are indicative of allocative mistakes. Kopp and Diewart (1982) provide an alternative specification, which permits flexible functional forms and utilizes only the information contained in the cost function. This is heavily drawn from the duality theory and requires no direct knowledge of production frontier specification or its parameters. We decided to stay with a translog cost function rather than adopting more flexible function, such as Fourier flexible form, due to our limited sample size whereas the flexible form requires additional parameters in the estimation. Revenue efficiency is estimated in a similar way using a so-called �nonstandard� revenue specification. The nonstandard approach has been applied to banking data by Berger et al (1996), Humphrey (1994), and Pulley and Humphrey (1993). In a �standard� approach to estimate a revenue function, output markets are assumed to be perfectly competitive, thus revenues are specified as a function of output prices and input quantities, with the institution choosing its output quantities based on these prices. In contrast, a �nonstandard� revenue function assumes that institutions have some market power in output markets, so revenues are specified as a function of input prices and output quantities, with the institution or the firm choosing input quantities and output prices. Since market power can vary greatly across both geographic and product markets, it is difficult to know if the individual institution or exchange chooses output prices, output quantities, or both. We assume that output quantities are exogenous, ie exchanges choose output prices. This allows us to use the nonstandard revenue function. This decision is based on practical concern, because the nonstandard approach avoids the use of output price data. We specify the nonstandard revenue function identically to equation (1), with the single exception that total exchange costs are replaced on the left-hand-side of the equation by total revenues (TR). TR equals gross revenue earned by the exchange.

109
where 212v
2u )( σ+σ=σ , φ is the standard normal density function, Φ
the cumulative normal density function, and all other terms are as previously defined. A commonly used translog functional form is employed here to estimate the cost and revenue performance measures of the stock exchanges. The general form of the translog function is defined as
it1odPrt
itkit
2
1llkit
2
1kk
21it1l
litl
2
1kitkitk
itit2it1litkit
2
1k
2
1lkl
nitlit
2
1l
2
1nlnmitkit
2
1k
2
1mkm
lit
2
1llkit
2
1kk0itit
DIlnR
TZlnMTPlnTYln
TT21TZlnPlnZlnYln
ZlnZln21ZlnPlnYln
PlnPln21YlnYlnx
21
PlnYln)TR(ln TCln
ε+++
+κ+τ+
ω+ω+θ+λ+
φ+φ+δ+
γ++
β+α+α=
∑∑
∑∑
∑∑
∑∑∑∑
∑∑
==
==
= =
= == =
==
(5.4)
where, xkm = xmk and γln = γnl by symmetry, ∑ =β
ll ,1 ∑ =γ
lnln ,0 ,i∀
,0l
kl =δ∑ ,i ∀ ∑ =θl
l ,0 and ∑ =κl
l 0 by linear homogeneity. The
efficiency scores of an exchange i at time t is computed as the mean of the conditional distribution of uit given εit and is defined as:
]|)u[exp(EEFF ititit ε= (5.5)

110
6 Correlates of cost and revenue efficiency
Having estimated revenue and cost efficiency scores, we employ a series of estimates to investigate possible correlations between inefficiency and other relevant organisation-specific variables such as firm strategy, portfolio positions and management practices. One issue is whether technology-related initiatives and expenses are significantly correlated with the revenue and cost efficiency scores. We are also focused on correlations between efficiency scores and organisational structures of exchanges, eg automated vs hybrid and exchanges with derivative trading facilities vs equity-only trading exchanges. Simple correlation, in contrast to regression analysis, allows for two-way causation (Mester, 1996). Mester notes some limitations of the two-step procedure. Such analyses are suggestive � not necessarily conclusive � as the dependent variable in the regressions, inefficiency, is an estimate whose standard error is not accounted for in the subsequent regression or correlation analysis. One should interpret the results as providing information on correlation only � not on causality as variables used in the estimation also suffer from the endogeneity problem and so coefficient estimates are biased. We estimate both multiple- and single variable regressions. Including an endogenous variable in a multiple regression can bias the coefficients, even for exogenous variables. Berger and Mester (1997) warn that perhaps all of our variables are partly endogenous and partly exogenous. In single-variable estimation, the drawback is that correlation may be spurious, with both efficiency score and the independent variable being strongly related to another omitted variable. Given the pros and cons of both methods, any conclusive statements should be taken with caution except when a particular variable behaves similarly in both estimations and is highly statistically significant. Using the individual efficiency scores, the second-step regression includes the following variables:

111
itit13
it12it11
it10it9
it8it7
it6it5
it4it3
it2it10itit
)COSTEFFbTRADEFEEbLISTFEEb(
MARKETCAPbTURNOVERbTHOURSbRMERGERb
PROFITbNOEXCHbFIRM3bAUTOMb
EQTDERIVbTECHCOSTba)REVEFF( COSTEFF
ε++++++++
++++
++=
(6.1)
COSTEFF or REVEFF represents cost efficiency or revenue efficiency scores derived in the previous section. All the independent variables are proxies of one kind or another management practice, organisational designs, business experience and performance, as well as market competition. TECHCOST includes all technology- and automation-related costs encountered by the exchanges during the sample year as a ratio of total cost of the exchange. It is plausible that higher investment in technology corresponds to higher efficiency, but it could also be a cause of lower performance. Therefore, the expected sign of the coefficient could be positive or negative. EQTDERIV is a binary variable, which takes a value of one if the stock exchange is involved in both equity and derivative trading and zero otherwise. This dual activity of the exchange may lead to higher costs at least in the early years, causing a negative relationship with cost and revenue performance. AUTOM is a binary variable. A value of one stands for a fully automated exchange or one that maintains a primarily automated trading environment; zero means that the exchange is totally or nearly an auction market such as NYSE. The market share of the top three firms on a given exchange is captured by 3FIRM, a proxy commonly used assessing the competitive environment of the market (Berger, 1995). It is likely that high concentration of few firms has a negative effect on efficiency. NOEXCH represents the number of exchanges in the country where the sample exchange is located. This is a measure of market competition faced by the exchange. It is likely that the higher the number of competitive exchanges, the higher (lower) the costs (revenues) of the exchange in question. This higher cost could relate to a number of areas including human capital and marketing costs. Such a scenario is more likely to cause lower efficiency. However, it can also be argued that competition creates an environment where businesses tend to eliminate some expenses otherwise deemed routine. PROFIT is a binary variable that takes the value of one for an exchange that is profit oriented and either traded in

112
the market or having a normal corporate structure. Otherwise, it takes a value of zero, ie for exchanges that are primarily non-profit motivated, mutual institutions. It is more likely that stock institutions or profit-oriented exchanges will have greater incentive to be efficient due to increased pressure and monitoring. RMERGER represents a binary variable that takes the value of one if the exchange has explicitly or implicitly merged with another exchange(s) within the past three years. THOURS is the number of hours the exchange is open for trading per day. Being open for longer hours could be costly for exchanges but, on the other hand, the additional trading hours may bring additional revenue. TURNOVER represents the velocity of the exchange measured as the ratio of value of equity traded to market capitalisation. Markets with higher turnover are likely to be more efficient. MARKETCAP is market size as represented by the natural logarithm of the market capitalization of the respective markets. In the revenue efficiency regressions, we include listing and trading fees and cost efficiency as additional independent variables in determining revenue efficiency scores.11
11 We have also estimated regressions adding a series of binary variables representing sample years. However, given that the results did not change materially, we decided not to report them in the text. These results are available upon request.

113
7 Data and descriptive statistics The data used in this study are from a variety of sources, including annual reports of stock exchanges, various issues of the International Federation of Stock Exchanges (FIBV), IMF International Financial Statistics (IFS), and the exchanges� websites. Most of the data were collected from annual balance sheets, income statement reports, and Internet pages of major operating stock and derivative exchanges covering a 10-year period (Annual Reports 1989�1998). In some cases, additional information was obtained from the exchanges by correspondence. Also various issues of the MSCI Handbook served as an important source of information on exchange-specific characteristics. Although reporting schemes and information content of financial accounts vary across time and exchanges, a consistent data set has been constructed including all necessary information on 49 individual exchanges� key balance sheet and income statement items. Of these, 44 exchanges over the period from 1989�1998, were used in the estimations. All national currencies are converted into US dollars and are inflation-adjusted using data from IFS. All variables other than qualitative proxies are expressed in natural logarithms.12 Table 7.1 provides average cost and average revenue information on the sample exchanges, based on continent of location. We see differences across average cost and revenue variables without any overwhelming pattern. South American exchanges have some of the highest average total costs as well as average revenue per trade. Per trade costs reported for North American exchanges are higher than those for European and Asia-Pacific exchanges. Except for a few variables eg, trading fee and average total revenue, overall, the markets in North America and Europe are apparently similar with respect to their cost and revenue structures that are in most cases similar to those of the Asia-Pacific and South American groups.13
12 The stock exchanges in the sample are: Amex, Amsterdam, Athens, Australian, Barcelona, Bilbao, Brussels, Buenos Aires, Chicago, Copenhagen, Germany, Helsinki, Hong Kong, Irish, Istanbul, Italy, Jakarta, Johannesburg, Korea, Kuala Lumpur, Lima, Lisbon, Ljubljana, London, Luxembourg, Madrid, Mexico, Montreal, Nasdaq, New Zealand, NYSE, Osaka, Oslo, Paris, Philippine, Rio de Janeiro, Santiago, Sao Paulo, Singapore, Stockholm, Switzerland, Taiwan, Tel Aviv, Thailand, Tokyo, Toronto, Vancouver, Warsaw, Vienna. 13 The different ratios reported in Table 7.1 are not all based on the same number of sample exchanges, for example, the information on technology cost, listing and trading fees are limited to 26 exchanges to a combined total of 84 during the sample years.

114
Table 7.2 provides the descriptive statistics for some of the binary and related variables used in the estimation. Table 7.1 Distribution of cost and revenue structure of stock exchanges Regions Variables or Ratios
Combined Asia-Pacific Europe North America South America
Average Total 81.645 64.848 62.166 168.474 49.890 Cost (ATC) in 000�s
(2.964�356.148) (1.524�452.758) (17.612�564.666) (6.832�83.276)
ATC to Number 16.67 14.46 11.5 17.15 36.84 of Trade (0.9�63.8) (2.1�26.5) (3.8�36.6) (9.9�62.5) ATC to Value 1.05 1.08 1.24 0.92 1.39 of Share traded (0.15�7.4) (0.2�8.3) (0.13�3.9) (0.32�4.1) Employee 32.13 29.48 34.83 37.14 21.95 Cost to ATC (24.4�35.1) (30.16�38.2) (35.8�41.0) (13.2�27.6) Office Cost to 8.91 12.69 9.38 6.32 6.90 ATC (8.4�13.1) (1.5�10.1) (4.0�9.6) (6.2�7.3) Technology 11.89 3.95 14.65 16.23 4.93 Cost to ATC (0.30�9.5) (1.01�26.8) (8.2�22.8) (4.2�5.5) Average Total 99.587 78.996 78.857 193.921 72.451 Revenue (ATR) in 000�s
(7.970�372.477) (1.651�561.327) (19.110�634.380) (8.079�91.762)
ATR to Number 21.76 15.09 22.63 19.04 48.63 of Trade (1.10�10.5) (4.8�29.8) (4.12�44.27) (10.2�76.5) ATR to Value 2.28 2.01 3.25 1.82 1.66 of Share Traded (0.3�10.5) (1.03�12.56) (0.21�6.8) (0.36�3.9) Listing Fee 18.97 14.45 18.06 21.49 6.71 Income to ATR (1.9�16.8) (1.8�34.3) (8.0�32.2) (2.4�10.1) Trading Fee to 38.66 43.97 51.92 40.31 36.97 ATR (10.41�70.31) (40.1�70.2) (34.6�46.3) (19.6�49.4) Notes: (1) Distribution Range is given in parentheses; (2) All currencies are converted to dollars and inflation adjusted.

115
Table 7.2 Descriptive statistics (1989�1998) Panel A
Regions Number of Sample
Exchanges
Number of Companies
Traded
Average Number of
Exchanges in the Country
Turnover Ratio
Trading Hours
Equity Transactions
(000000)
Combined 49 776 4.12 63.61 6.04 12.122 Asia-Pacific 14 642 4.54 66.89 6.78 16.163 Europe 22 618 2.49 63.87 5.85 5.790 North America 8 1425 7.33 55.62 6.40 23.011 South America 5 470 5.70 61.27 6.88 1.607 Panel B
Regions Market Capitalization
(000000)
Top 3 Company Market Share
Merger Dummy
Equity Only
Dummy
Fully Automated
(no auction)
Profit Motivated Ownership
Dummy Combined 566,057 22.7 0.41 0.71 0.74 0.11 Asia-Pacific 444,194 18.5 0.32 0.40 0.89 0.06 Europe 341,598 27.3 0.47 0.69 0.82 0.19 North America 1,620,664 12.8 0.52 0.88 0.55 0.0 South America 82,143 36.85 0.0 1.0 0.22 0.0

116
8 Empirical evidence Translog cost and revenue function estimates for each of the four model specifications are reported in Tables 8.1 and 8.2. All parameters associated with these estimates are reasonably consistent with expectations. In most cases, output and input specifications and binary variables are statistically significant. But importantly for such models, the R-squared and F-statistics exonerate the choice of output and input variables considered in this study. These models generate cost and revenue efficiency measures for each of the sample exchange. As mentioned earlier, we estimate several cost and revenue models using alternative input, output, and other specifications. The efficiency scores should be considered as the average efficiency of a given stock exchange relative to the best-practice stock exchange in the sample. Overall, all estimated models reveal reasonably similar magnitude and relative importance across different model specifications.14 Tables 8.3 and 8.4 report averages of cost and revenue estimates for each of the model. In Table 8.3, combined estimates show that cost efficiency of exchanges ranges from 85.04% to 92.69%. In other words, about 7% to 15% of incurred cost can be attributed to lost efficiency relative to �best cost practice� stock exchange, depending on the model specification used in the estimation. In Table 8.4, we find that the combined average scores range from 79.03% to 89.44%, implying at least 10% of potential revenue loss relative to the �best revenue practice� exchange. Tracing yearly averages in both tables, we observe an increase in cost and revenue efficiency scores over the sample period, as indicated by the averages reported for 1989, 1993, and 1998. Focusing on results reported by Model 4 for cost estimates (Table 8.3) � a model that adjusts for quality control, economic environment, and technological change over the time period 1993 to 1998 � we observe efficiency ranging from a low 75.39% for South American exchanges to a high 89.64% for North American exchanges. Also the efficiency average improves from 80.16% in 1993 to 91.76% in 1998.
14 Additional regressions including a dummy variable as well as various structural tests (Mester, 1993) were undertaken in order to test if the production technology differs for two groups of exchanges with different reporting schemes on the value of trade. These additional estimations and tests confirmed the applicability of the whole sample under an uniform frontier rather than using two different frontiers. These results are available upon request from the authors.

117
The same Model 4, in the revenue estimates (Table 8.4), shows lower revenue efficiency estimates by the South American exchanges (72.60%) and high efficiency scores (85.29%) reported by the North American exchanges. Average revenue scores also improved slightly from 79.11% in 1993 to 84.04% in 1998. Although not captured or evaluated explicitly in the models, efficiency gains could be a product of the influence of alternative trading systems, mushrooming in the exchange business over the sample period. We further analyse the estimates of Model 4 by providing weighted average scores for each of the sample years according to geographic location as well as organizational design, type, and size. These estimates are reported in Tables 8.5 and 8.6 for cost and revenue efficiency respectively. The combined estimates in both tables are consistent with previous results where there is evidence of continuous cost and revenue efficiency improvements over the sample period. The estimates in both tables also show substantially lower scores for South American and Asia-Pacific exchanges. In the cost estimations, the South American exchanges show substantial improvement in cost efficiency over the sample years.

118
Table 8.1 Cost regression parameters Variable Coefficient
Model 1 (1989�1998)
Model 2 (1993�1998)
Model 3 (1993�1998)
Model 4 (1993�1998)
α0 �9.6128 �2.0564 * �1.0823 2.7550 (�1.01) (�1.90) (�0.57) (1.26) αY1 3.5009 *** 2.8931 *** 1.5836 *** 1.0932 *** (20.65) (30.29) (32.57) (24.45) αY2 �0.4170 �0.3201 �0.4284 ** �0.3079 * (�1.43) (�1.57) (�2.00) (�1.70) xY1Y1 �0.0007 �0.0060 0.0474 ** 0.0409 ** (�0.02) (�0.20) (2.17) (2.04) xY2Y2 0.1722 0.1430 0.0450 0.0561 (1.25) (1.35) (0.43) (0.29) xY1Y2 �0.1034 ** �0.1056 ** �0.1670 *** �0.1445 *** (�2.10) (�2.58) (�3.61) (�3.54) βP1 1.6955 * 1.4219 ** 0.6645 ** 0.6244 ** (1.83) (2.13) (2.16) (2.32) γY1.P1 0.0076 0.0070 0.0361 0.0367 (0.56) (0.66) (0.35) (0.31) δY1.P1 �0.3805 ** �0.3035 ** �0.3287 *** �0.3100 *** (�2.41) (�2.57) (�3.01) (�4.21) δY2.P2 0.1009 0.1216 0.1835 ** 0.1807 ** (0.32) (0.53) (2.18) (2.26) φZ �0.5634 * �0.4875 ** (�1.88) (�2.05) φZZ 0.0345 ** 0.0340 ** (2.55) (2.68) λY1.Z �0.3246 *** �0.2803 *** (�3.48) (�3.08) xY2.Z 0.1090 *** 0.1188 *** (3.14) (3.98) θP1.Z 0.4507 ** 0.4034 * (2.16) (1.85) R(IPROD) �0.0760 ** �0.0733 ** (-1.99) (�2.37) ω1T �0.7705 *** (�3.71) ω2TT 0.0085 (1.57) τY1.T �0.0663 ** (�2.30) τY2.T 0.0001 *** (7.00) κP1.T 0.0654 (1.45) MZ.T �0.0366 ** (�2.74) Derivative �1.8175 *** �1.4545 *** �0.8721 *** �0.6542 *** Dummy (�10.60) (�10.04) (�198.00) (�145.64) Log-likelihood
�469.944 �400.3090 �582.061 �564.053
λ 2.6403 ** 2.0945 ** 3.8704 ** 3.0046 ** (2.08) (2.02) (2.57) (2.39)

119
Table 8.1 Cost regression parameters (continued) Variable Coefficient
Model 1 (1989�1998)
Model 2 (1993�1998)
Model 3 (1993�1998)
Model 4 (1993�1998)
σ 9.5435 *** 8.4576 *** 5.5681 ** 5.0074 ** (3.04) (2.80) (2.27) (2.36) N 176 102 102 102 Notes: ***, **, * mean significant at 1%, 5% and 10% levels respectively. IPROD = Industrial production. Model 1 uses per capita GDP as input whereas models 2, 3 and 4 use actual labor and capital expenditure as inputs. T-values are reported in parentheses. All variables in this table are the coefficient estimates using the translog functional form as depicted in equation 4. The firm�s total cost (TCit) represent the dependent variable in all estimations; Yit represents the various products or services produced by the firm; Pit represents the prices of inputs used by the firm in the production of the products and services; Zit represents the fixed netput quantities, quality of output; T represents technology change; SRit is an environmental variable; Dit is a dummy for exchanges with both derivatives and security settlements, λ = σu/σv is the ratio of variability for the
decomposed error terms; 2u
2v
2σ+σ=σ is the total standard deviation of the error term.

120
Table 8.2 Revenue regression parameters Variable Coefficient
Model 1 (1989�1998)
Model 2 (1993�1998)
Model 3 (1993�1998)
Model 4 (1993�1998)
α0 227.5800 188.0600 964.5500 * 188.0500 (0.29) (0.30) (1.91) (0.18) αY1 1.0967 0.9822 1.1408 *** 1.0441 *** (0.26) (0.42) (28.84) (29.83) αY2 0.9077 0.8931 0.3500 * 0.3832 ** (0.05) (0.01) (1.86) (2.32) xY1Y1 −0.2688 −0.2568 −0.0380 * −0.0405 * (�0.11) (�0.13) (�1.82) (�1.73) xY2Y2 1.0166 0.8952 0.0404 0.0302 (0.12) (0.14) (0.14) (0.40) xY1Y2 −0.1267 ** −0.1186 ** 0.1821 ** 0.1088 ** (�2.10) (�2.08) (2.60) (2.73) βP1 −3.5546 −3.0619 −0.6645 ** −0.5695 ** (�0.06) (�0.05) (�2.16) (�2.53) γP1P1 0.0770 0.0743 0.0289 −0.0120 (0.08) (0.13) (0.38) (�0.16) δY1.P1 0.5406 0.4433 0.1850 ** 0.2540 * (0.07) (0.07) (2.19) (1.83) δY2.P2 −0.2406 −0.1853 0.2134 ** 0.1520 ** (�0.02) (�0.02) (2.00) (2.07) φZ 0.5634 * 0.6158 ** (1.88) (2.08) φZ.Z 0.0567 *** 0.0467 *** (3.00) (4.51) λY1.Z −0.2885 ** −0.2855 ** (�2.23) (�2.03) xY2.Z 0.0856 ** 0.1304 ** (2.86) (2.86) θP1.Z 0.3844 0.3562 (1.50) (1.34) R(IPROD) 0.0907 * 0.0567 * (1.83) (1.91) ω1T 0.0356 ** (2.78) ω2TT −0.0304 (�1.31) τY1.T 0.0592 (2.22) τY2.T 0.2955 (1.26) κP1.T −0.0248 (�0.13) MZ.T 0.3420 ** (2.52) Derivative 0.0660 0.0601 0.6604 *** −0.6670 *** Dummy (0.18) (0.14) (14.51) (�14.62) Log-likelihood −0.5328 −1.2904 −7.0493 −4.3201 λ 1.8488 2.0732 6.2455 ** 3.0544 ** (0.14) (0.18) (2.35) (2.42)

121
Table 8.2 Revenue regression parameters (continued) Variable Coefficient
Model 1 (1989�1998)
Model 2 (1993�1998)
Model 3 (1993�1998)
Model 4 (1993�1998)
σ 265.0800 ** 275.0500 ** 5.0833 ** 4.8842 ** (2.44) (2.60) (2.43) (2.37) N 176 102 102 102 Notes: ***, **, * mean significant at 1%, 5% and 10% levels respectively. IPROD = Industrial production. Model 1 uses per capita GDP as input whereas models 2, 3 and 4 use actual labor and capital expenditure as inputs. T-values are reported in parentheses. All variables in this table are the coefficient estimates using the translog functional form as depicted in equation 4. The firm�s total revenues (TRit) represent the dependent variable in all estimations; Yit represents the various products or services produced by the firm; Pit represents the prices of inputs used by the firm in the production of the products and services; Zit represents the fixed netput quantities, quality of output; T represents technology change; SRit is an environmental variable; Dit is a dummy for exchanges with both derivatives and security settlements, λ = σu/σv is the ratio of variability for the
decomposed error terms; 2u
2v
2σ+σ=σ is the total standard deviation of the error term.
Table 8.3 Cost efficiency scores Model 1 Model 2 Model 3 Model 4 Combined sample 89.21 86.54 92.69 85.04 (74.2−98.6) (73.1−96.4) (74.1−98.6) (68.4−98.6) Asia-Pacific 86.08 84.29 90.39 80.62 (81.73−96.7) (80.2−95.1) (74.1−95.8) (74.2−92.2) Europe 89.63 90.64 92.51 85.28 (74.2−98.6) (73.1−95.9) (84.0−98.6) (75.8−95.1) North America 90.89 92.51 93.45 89.64 (85.3−97.2) (85.0−96.4) (87.7−98.1) (85.2−98.6) South America 81.19 86.72 86.74 75.39 (77.5−85.3) (81.7−90.3) (76.2−90.1) (68.4−86.1) 1989 83.46 (74.2−89.6) 1993 88.18 86.31 91.05 80.16 (73.4−96.5) (73.1−94.3) (74.1−96.3) (72.6−86.8) 1998 92.05 90.82 94.46 91.76 (78.2−98.6) (82.5−96.4) (91.2−98.6) (83.7−93.6)
Notes: Distribution range is given in parentheses.

122
Table 8.4 Revenue efficiency scores Model 1 Model 2 Model 3 Model 4 Combined sample 89.44 88.31 79.03 82.60 (76.1−97.4) (69.1−96.7) (56.7−97.2) (65.0−97.7) Asia-Pacific 85.4 83.32 72.4 76.51 (78.5−92.9) (75.7−92.0) (58.0−84.3) (69.4−96.3) Europe 90.88 90.41 79.35 82.28 (76.1−97.4) (69.1−95.8) (66.1−97.2) (65.0−94.1) North America 91.27 89.56 84.02 85.29 (86.4−95.8) (84.2−96.7) (71.4−94.6) (71.0−97.7) South America 86.54 83.01 73.90 72.60 (80.3−93.2) (73.6−89.3) (56.7−90.2) (66.3−88.4) 1989 86.55 (76.7−97.0) 1993 89.95 87.43 77.94 79.11 (84.2−95.5) (82.1−93.1) (58.4−90.4) (65.0−90.1) 1998 92.23 89.57 81.34 84.06 (85.5−96.1) (84.6−94.4) (59.3−97.7) (72.2−97.8)
Notes: Distribution range is given in parentheses. Table 8.5 Cost efficieny scores over 1993�1998 Regions and Organisation Set Up
Combined Score 1993 1994 1995 1996 1997 1998
Combined 85.04 80.16 84.27 87.01 87.85 88.22 91.76 Asia-Pacific 83.62 82.84 81.19 83.92 84.10 84.30 85.26 Europe 85.28 84.23 85.60 86.45 88.93 90.51 93.68 North America 89.64 86.83 88.67 87.39 88.40 89.94 90.05 South America 75.39 72.64 74.71 79.82 79.86 83.25 83.76 Automated 86.69 83.92 85.01 88.39 89.07 88.84 92.65 Auction 82.21 79.17 78.92 84.03 83.85 86.22 88.36 Exchanges with Derivatives 86.34 83.21 85.31 88.92 89.03 89.07 92.73 Equity Only Exchange 82.27 79.32 82.56 86.06 85.02 86.69 89.01 Profit 89.27 83.06 86.31 88.50 89.02 90.48 92.66 Motivated Cooperative & Non Profit 81.06 79.55 82.62 83.91 84.56 85.01 86.48 10 Largest 86.84 85.90 86.73 87.12 87.93 87.04 90.25 Middle 10 83.09 83.68 84.12 83.23 83.32 83.80 80.23 10 Smallest 84.47 83.60 82.23 85.56 84.30 85.29 85.36 Notes: Estimations are based on Model 4, which accommodates additional performance measures, environmental factors and technological change.

123
Table 8.6 Revenue efficiency scores over 1993�1998 Regions and Organisation Set Up
Combined Score
1993 1994 1995 1996 1997 1998
Combined 82.60 79.11 84.54 82.93 83.20 83.92 84.06 Asia-Pacific 76.51 74.22 78.39 80.56 80.02 82.36 84.36 Europe 82.28 78.35 76.07 86.32 82.28 83.23 85.61 North America 85.29 82.38 84.21 84.90 86.57 87.80 93.54 South America 72.60 64.06 72.75 74.56 75.02 76.48 75.02 Automated 84.92 80.25 80.69 84.43 84.91 85.32 87.56 Auction 89.21 89.07 85.32 87.43 87.70 89.32 92.04 Exchanges with Derivatives 85.47 84.32 80.37 83.44 86.80 87.95 90.21 Equity Only Exchange 86.21 83.18 83.45 84.92 88.07 85.53 88.53 Profit 84.36 77.30 81.56 84.36 84.02 88.38 93.02 Motivated Cooperative & Non Profit 78.72 73.02 76.04 77.52 79.32 82.01 84.51 10 Largest 85.94 77.42 76.52 82.34 88.51 89.33 91.60 Middle 10 84.31 80.51 80.88 83.56 84.02 89.38 90.12 10 Smallest 80.73 78.33 78.54 77.57 81.36 86.32 84.29
Notes: Estimations are based on Model 4, which accommodates additional performance measures, environmental factors and technological change. Although cost efficiency scores for North American exchanges are higher for the early years in the sample, the European stock exchanges show a high gain of cost efficiency (84.23% to 93.68%) over the sample period and surpass North American Exchanges for 1997 and 1998. In respect of organizational design, the average scores report a higher efficiency score for �automated� exchanges, 86.69%, vs �auction� type exchanges, 82.21%. Exchanges that include derivative trades score higher than equity-only exchanges while profit motivated exchanges show higher cost efficiency than cooperative and non-profit exchanges. Among different groups, ranked by market capitalization size, the middle group is found to be the most cost effective. For revenue efficiency estimates, the North American exchanges not only score highest in efficiency, they have also shown the most improvement over the sample years. Interestingly, auction type markets show higher revenue efficiency, whereas automated exchanges show higher improvement over the years. Exchanges with and without derivative trading facilities report almost similar scores, but exchanges that also trade derivatives show higher improvement of revenue efficiency scores over the sample years. As expected, profit motivated exchanges have substantially higher revenue efficiency compared to other non-profit and cooperative exchanges. The largest grouping of exchanges show the highest average revenue efficiency scores as well as the highest changes over the sample years. In the next step of the analysis, we focus on the relationship between cost (revenue) efficiency scores and a number of relevant

124
organisation-specific and other related variables, reflecting, inter alia, organizational structure, management strategy, efficiency and practices, and competitive environment (Tables 8.7 and 8.8). In both estimates, our focus is on the potential influence of technology cost on overall efficiency. Given that technology cost information was available only for a limited number of exchanges, we report for regression Model 1 estimates that include the technology cost, followed by the estimates without this technology cost variable in regression Model 2. Finally, we report coefficients of individual estimates of each of the independent variables as they correlate to efficiency scores in separate regression estimates. These are reported in the last two columns in both tables. We further analyse the correlations between efficiency scores and organisational structures of the exchanges (eg automated vs auction or automated auction hybrid, exchanges with derivative trading facilities vs equity-only trading exchanges, and profit motivated vs non-profit exchanges), market competition (3-firm concentration and number of exchanges in the country), management strategy, efficiency and practices (recent mergers, turnover, and trading hours), and size of market (market capitalization). In the cost efficiency correlates estimates (Table 8.7), we see positive correlation between the technology-related cost ratio and cost efficiency, in both the multivariate regressions (Regression 1) and single-variable estimates (last two columns). Although such a relationship contradicts some of the findings in popular business literature, where the return from technology is never found to be profitable, it is consistent with recent academic literature, eg Litan and Rivlin (2001), where significant savings were generated by productive use and implementation of technology. Exchanges with derivative trading do not show any significant cost efficiency relationship.15 Automated exchange variable coefficients are found to be associated with higher cost efficiency. Exchanges with higher concentration of a few firms (3-firm concentration ratio) show a negative correlation with cost efficiency. Positive and significant influence of the NOEXCH (total number of exchanges in the country) coefficient could not support the view that competition forces exchanges to become more efficient, and their apparent efficiency gains outweigh any additional costs related to employees or promotional activities in 15 Alternative estimates using SETTLE, a binary variable representing exchanges with in-house settlement arrangements rather than alliances with settlement firms also show positive association with cost efficiency. However, the coefficients were not statistically significant.

125
the more competitive environment. As expected, profit-motivated exchanges are associated with significant cost efficiency. Larger exchanges (MARKETCAP) and busier exchanges (TURNOVER) do not show any significant relationship with cost efficiency. Table 8.7 Correlates of cost efficiency Regression 1 Regression 2 Separate Regressions
on Each Independent Variable
Variables/Ratios parameters t-statistics parameters t-statistics parameters t-statistics Intercept 0.318 61.12*** 0.450 11.48*** Technology Cost to Total Cost 0.194 1.92* 0.265 2.34** Equity + Derivatives # 0.032 1.04 0.035 0.98 0.004 1.68* Automated Market # 0.193 2.07** 0.024 2.04** 0.168 2.65** Top 3 Firms� Market Share in the Exchange −0.0001 �1.83* −0.0001 �1.76* −0.0001 �1.91* Number of Exchanges in the Country 0.013 2.02** 0.003 1.97** 0.005 1.83* Profit Motivated # 0.044 3.21*** 0.038 2.79** 0.061 2.12** Recent Mergers # 0.005 0.64 0.007 0.51 0.004 0.82 Trading Hours Per Week −0.018 �2.29** −0.010 �2.33* −0.004 �2.00** Turnover Ratio −0.001 �0.67 −0.001 �0.54 −0.0001 �0.93 Log of Market Capitalization −0.003 �0.84 −0.003 �0.80 −0.004 �1.12 Model Statistics Adjusted R2 .3902 .3167 Range .0078 to .0700 F-Statistics 4.89*** 4.71*** 0.6401 to 11.70 Number of Observations 84 102 102 Notes: ***, **, * = significant at 1%, 5% and 10% significance levels respectively. # = Binary variables. Regression 1 and 2 are multiple regressions based correlation results; estimates in the last two columns are based on correlation estimates from regression on each of the individual independent variables. The number of observations in these estimates are 102 except for the technology cost ratio (84).

126
Table 8.8 Correlates of revenue efficiency Regression 1 Regression 2 Separate Regressions
on Each Independent Variable
Variables/Ratios parameters t-statistics parameters t-statistics parameters t-statistics Intercept 0.460 3.97*** 0.521 5.14*** Technology Cost to Total Cost 0.001 1.60 0.001 1.75* Listing Fee 0.052 1.48 0.054 1.63 0.059 1.17 Trading Fee 0.001 0.74 0.001 0.88 0.003 0.51 Cost Efficiency 0.099 1.43 0.106 1.38 0.046 1.77* Equity + Derivatives # 0.063 1.81* 0.067 1.75* 0.041 1.69* Automated Market # 0.027 1.01 0.041 1.17 0.018 1.25 Top 3 Firms� Market Share in the Exchange −0.0008 �0.82 −0.099 �0.47 −0.00004 �0.41 Number of Exchanges in the Country −0.003 �1.99** −0.003 �1.93* −0.004 �2.40** Profit Motivated # 0.134 3.26*** 0.105 3.02*** 0.035 2.93*** Recent Mergers # −0.029 �1.09 −0.011 �0.29 −0.004 �0.56 Trading Hours Per Week 0.027 2.03** 0.021 2.00** 0.002 1.28 Turnover Ratio 0.0002 1.81* 0.0001 1.70* 0.0003 2.67** Log of Market Capitalization 0.019 2.14** 0.018 1.98** 0.0004 1.80* Model Statistics Adjusted R2 .2130 .2425 Range .0104 to .0704 F-Statistics 10.61*** 9.31*** 1.66 to 8.57 Number of Observations
84 102 102
Notes: ***, **, * = significant at 1%, 5% and 10% significance levels respectively. # = Binary variables. Regression 1 and 2 are multiple regressions based correlation results; estimates in the last two columns are based on correlation estimates from regression on each of the individual independent variables. The number of observations in these estimates are 102 except for the technology cost ratio (84). In the revenue estimates (Table 8.8), technology cost has a positive association with efficiency, however, the statistical significance of coefficients are weak. Surprisingly, listing and trading fees have no influence on, or significant correlation, with revenue efficiency and hence are not effective tools in influencing revenue efficiency. However, the cost efficiency variable indicates that being cost efficient does help to achieve a positive relationship with revenue efficiency. This finding is found to be statistically significant in the separate regressions and to a lesser extent in all other estimates. Exchanges that include derivative trading are found to be associated with higher revenue efficiency relative to equity-only exchange sub-

127
sample.16 Here we find that, although there are cost inefficiencies, additional derivative trading activities in the same exchange pays off in terms of higher revenue efficiency. With respect to competition variables, we find no impact of the 3-FIRM variable and an inverse relationship between NOEXCH and revenue efficiency. The latter result simply confirms that a gain in cost efficiency from a competitive environment does not necessarily mean that stronger market competition translates into more revenue efficiency. In fact, such competition hurts revenue efficiency. In both cost and revenue models no evidence is found that recent merger initiatives are associated with greater cost or profit efficiency. It is possible that many mergers are of very recent vintage, occurring in the years 1997�1998, and that exchanges are yet to directly benefit from mergers and alliances. Profit-motivated exchanges and exchanges with longer working hours are associated with higher revenue efficiency. The results also suggest that large and efficient exchanges are more highly correlated with higher revenue efficiency. In summary, the North American exchanges are revealed to be most productive in respect of cost and revenue efficiency, followed by European exchanges. European markets greatly improved cost efficiency during the sample period, taking initiatives to harmonize their regulations and adopting new technologies. Both Asia-Pacific and South American exchanges showed considerable overall efficiency, albeit not on a par with the North American and European exchanges. Additionally, our evidence indicates that investment in technology effectively influenced cost efficiency. Moreover, organizational structure, governance, and competitive environment are found to be significantly associated with both cost and revenue efficiency. Market size and turnover were more important in terms of revenue compared to cost efficiency.
16 Alternative estimates using SETTLE also show a positive and significant association with revenue efficiency scores in all regressions, but unlike the reported EQTDERIV coefficients, statistical significance is only found in the last estimate with single variable correlation.

128
9 Conclusions Despite increased integration and consolidation of capital markets and evolving organizational governance, alliances and regulatory changes, there is little information available on the performance, competitiveness, and behavioural underpinnings of stock exchanges across the globe. A consensus exists that evolving technology and the fact that exchanges� efforts to adapt and cope with some of these changes drives recent growth of world-wide trading. However, nothing is known about whether adoption of new technologies yields higher efficiency for the exchanges. One might anticipate that investment and implementation of any such technological initiatives will result in higher efficiency, effectiveness, and quality of operations, which would be consistent with evidence that market value increases by five dollars for each dollar of installed new technology capital (Brynjolfsson et al, 2001). Using unbalanced panel data on 49 stock exchanges during the period 1989�1998, this paper traces the productivity of stock exchanges over time and across different types and groups of exchanges. Specifically, the paper investigates, inter alia, the impact of technology on the revenue and cost efficiency of sample exchanges. Additionally, the paper focuses on the influence of organisational type, structure, and corporate governance on cost and revenue efficiency. This is one of the first comprehensive attempts to evaluate stock exchange performance treating exchanges as operating firms (Arnold et al, 1999; Pirrong, 1999). Our findings suggest the existence of substantial revenue and cost inefficiency across exchanges. On average, North American exchanges are the most cost and revenue efficient. European exchanges, on the other hand, are found to be the most improved exchanges, at least in terms of cost efficiency. The ongoing formation of alliances and networks, and recent automation spree in Europe are probably helping to enhance efficiency, as exchanges take advantage of all aspects of increased scale economies. Exchanges in South Americas and Asia-Pacific regions are substantially less efficient in all estimates. Hasan and Malkamaki (2001) report on uncoordinated regulatory norms in these two continents as well as the lack of a market-oriented business environment. Consistent with Domowitz and Steil (1999) and Williamson (1999), we conclude that commitments and initiatives in technology-related advancements are worthwhile and productive endeavours, as these are usually found to be positively and significantly associated

129
with overall cost and revenue efficiency. Moreover, we anticipate for the future that exchanges are not only in the business of listing and trading stocks, but they will also increasingly engage in promoting their own trading technology to other exchange partners and participants. Additionally, results support the view that organisational structure and market competition are significantly related to both cost and revenue efficiency. Market competition, as proxied by the number of other exchanges in the same country, appears to be positively associated with cost efficiency but negatively associated with revenue efficiency. Market size (capitalisation) and quality of market (turnover) are found to be important in relation to revenue efficiency where bigger and more active exchanges are correlated with higher efficiency. Our findings are consistent with the fact that exchanges and security markets in a homogeneous regulatory environment (North America followed by Europe) are the most efficient. We also provide evidence that investments in standardisation and new technologies clearly pay off in productivity gains. Automated electronic trading systems have helped to minimise the fragmenting effect of physical distance, not only on exchange formation but also on operations and services, as it shows up as higher productivity in terms of cost efficiency. It is obvious from our results that money spent on technology, appropriate organisational structure, network involvement, and corporate governance issues are crucial components of strategic decision-making and performance. As exchanges continue to experience transitions and innovations, it is important that they be studied as conventional firms and examined in terms of operating strategies, market environment and performance.

130
References Aigner, D.J. � Lovell, C.A.K. � Schmidt, P. (1977) Specification and
estimation of frontier production, profit and cost functions. Journal of Econometrics, 6, 21�37.
Angel, J.J. (1998) Consolidation in the global equity market: An
historical perspective. Working Paper, Georgetown University. Annual Reports (1989�1998) Annual reports of 49 stock and
derivative exchanges. Arnold, T. � Hersch, P. � Mulherin, J.H. � Netter, J. (1999) Merging
markets. Journal of Finance, 52, 655�681. Berger, A.N. � Humphrey, D. � Pulley, L.B. (1996) Do consumers
pay for one stop banking? Evidence from an alternative revenue function. Journal of Banking and Finance, 20, 1601�1621.
Berger, A.N. � Mester, L.J. (1997) Inside the black box: What
explains differences in the efficiencies of financial institutions? Journal of Banking and Finance, 21, 895�947.
Bessembinder, H. � Kaufman, H.M. (1997) A cross-exchange
comparison of execution costs and information flow for NYSE-listed stocks. Journal of Financial Economics, 46, 293�319.
Bhattacharrya, V. � Spiegel, M. (1991) Insiders, outsiders and
market breakdown. Review of Financial Studies, 4, 255�282. Biais, B. (1993) Price formation and equilibrium liquidity in
fragmented and centralised markets. Journal of Finance, 48, 157�185.
Booth, G.G. � Iversen, P. � Sarkar, S.K. � Schmidt, H. � Young, A.
(1999) Market structure and bid-ask spreads: IBIS vs NASDAQ. European Journal of Finance, 5, 51�71.
Brennan, M.J. � Cao, H.H. (1997) International portfolio
investment flows. Journal of Finance, 52, 1851�1880.

131
Brynjolfsson, E. � Hitt, L. � Yang, S. (2001) Intangible assets: How the interaction of computers and organisation structure affects stock market valuations. NBER Working Paper, 2001.
Clayton, M.J. � Jorgensen, B.N. � Kavajecz, K.A. (1999) On the
formation and structure of international exchanges. Unpublished manuscript, New York University.
Cybo-Ottone, A. � Di Noia, C. � Murgia, M. (2000) Recent
development in the structure of securities markets. Brookings-Wharton Papers on Financial Services, 2000.
Davis, E.P. (1990) International financial centres � An industrial
analysis. Bank of England, 51. Demsetz, H. (1968) The cost of transacting. Quarterly Journal of
Economics, 82, 33�53. Di Noia, C. (2001) The stock-exchange industry: Network effects,
implicit mergers, and remote access. European Financial Management, 7, 1, 39�72.
Doede, R. (1967) The monopoly power of the New York Stock
Exchange. Unpublished Ph.D. dissertation, University of Chicago. Domowitz, I. (1995) Electronic derivatives exchanges: Implicit
mergers, network externalities and standardization. The Quarterly Review of Economics and Finance, 35, 2, 163�175.
Domowitz, I. � Steil, B. (1999) Automation, trading costs, and the
structure of the trading services industry. Brookings-Wharton Papers on Financial Services, 1�52.
Duisenberg, W.F. (1999) Development in the financial sector in
Europe. Following the introduction of Euro. Economides, N. (1993) Network economics with application to
finance. Financial Markets, Institutions & Instruments, 2, 5, 89�97.
Economides, N. � Siow, A. (1988) The division of markets is
limited by the extent of liquidity (spatial competition with externalities). The American Economic Review, 78, 1, 108�121.

132
FIBV (1989�2001) Annual reports 1989�1999. International
Federation of Stock Exchanges, Paris. Fishel, D. � Grossman, S. (1984) Customer protection in futures
and securities markets. Journal of Futures Markets, 273. Freedman, C. (1999) The regulation of CSDs and the linkages
between CSDs and large value payment systems. Fifth Conference of Central Securities Depositories, Toronto, Canada.
Gaspar, J. � Glaeser, E.L. (1996) Information technology and the
future of cities. NBER Working Paper 5562. Gehrig, T. (1998a) Cities and the geography of financial centers.
University of Freiburg and Centre of Economic Policy Research, London, Discussion Paper 1894.
Gehrig, T. (1998b) Competing markets. European Economic
Review, 42, 277�310. Grilli (1989) Financial markets. Economic Policy, 387�421. Grinnblatt, M. � Keloharju, M. (2001) How distance, language and
culture influences stockholdings and trades. Journal of Finance, 56, 3, 1053�1074.
Hart, O. � Moore, J. (1996) The governance of exchanges:
Members� cooperatives versus outside ownership. Oxford Review of Economic Policy, 12, 4, 53�69.
Hasan, I. � Malkamäki, M. (2001) Are expansions cost effective for
stock exchanges? A global perspective. Journal of Banking and Finance, 25, 12, 2339�2366.
Huang, R. � Stoll, H. (1996) Dealer versus auction markets: A
paired comparison of execution costs on NASDAQ and NYSE. Journal of Financial Economics, 41, 313�357.
Humphrey, D. (1994) Delivering deposit services: ATM versus
branches. Federal Reserve Bank of Richmond, Economic Quarterly, 80, 2, 50�81.

133
International Monetary Fund, various issues. International Financial Statistics, Washington.
Jain, P. (2001) Institutional design and liquidity on stock
exchanges. Working Paper Kelley School of Business Indiana University.
Jondrow, J. � Lovell, C.A.K. � Materov, I.S. � Schmidt, P. (1982) On
estimation of technical inefficiency in the stochastic frontier production function model. Journal of Econometrics, 19, 233�238.
Kopp, R.J. � Diewert, E.W. (1982) The decomposition of frontier
cost function deviations into measures of technical and allocative effciency. Journal of Econometrics, 19, 319�331.
Korajczyk, R. (1997) A measure of stock market integration for
developed and emerging markets. Working Paper 197, Northwestern University.
Krugman, P. (1991) Increasing returns and economic geography.
Journal of Political Economy, 99, 483�499. Kumbhakar, S.C. � Lovell, C.A.K. (2000) Stochastic frontier
analysis. Cambridge University Press. Lee, T. (1998) What is an exchange? The automation,
management and regulation of financial markets. Oxford University Press, New York.
Litan, R.E. � Rivlin, A.M. (2001) Projecting the economic impact of
the internet. American Economic Review, May 2001, 313�317. Malkamäki, M. � Topi, J. (1999) Strategic challenges for exchanges
and securities settlement. Bank of Finland Discussion Paper Series, 4/1999.
McCauley, R.N. � White, W.R. (1997) The Euro and European
financial markets. Bank of International Settlements, Monetary and Economic Developments Working Paper 41.

134
McInish, T.H. � Wood, R.A. (1996) Competition, fragmentation and market quality. In: Lo, A. (ed.), The industrial organization and regulation of the security industry, National Bureau of Economic Research, Chicago, University of Chicago Press, 63�74.
Meeusen, Y.M. � van den Broeck, J. (1977) Efficiency estimation
from Cobb-Douglas production functions with composed errors. International Economic Review, 18, 435�444.
Mester, L.J. (1993) Efficiency in the savings and loan industry.
Journal of Banking and Finance, 17, 267�286. Mester, L.J. (1996) A study of bank efficiency taking into account
risk-preferences. Journal of Banking and Finance, 20, 1025�1045.
MSCI (1995�2000) Handbook of world stock, derivative, and
commodity exchanges. Mondo Visione, UK. NYSE (1999) New York Stock Exchange press release. October,
1999. Perold, A.F. � Sirri, E.R. (1997) The cost of international equity
trading. Working Paper 97�012, Harvard Business School, Research Division.
Pirrong, C. (1999) The organization of financial exchange markets:
Theory and evidence. Journal of Financial Markets, 2, 329�357. Prati, A. � Schinasi, G.T. (1997) The organization of financial
exchange markets: Theory and evidence. John M. Olin School of Business, Washington University, unpublished manuscript.
Pulley, L.B. � Humphrey, D. (1993) The role of fixed cost and cost
complementarities in determining scope economies and the cost of narrow banking proposals. Journal of Business, 66, 437�461.
Schmidt, H. (1977) Advantages and disadvantages of an integrated
market compared with a fragmented market. Commission of the European Communities, Collection Studies, Competition � Approximation of Legislation 30, Brussels.
135
Schmidt, H. � Iversen, P. (1992) Automating German equity trading: bid-ask spreads on competing systems. Journal of Financial Sercvices Research, 6, 4, 373�397.
Schmidt, H. � Simić, A.K. (2000) Zur Theorie der Geld-Brief-
Spanne auf Anlegerauktionsmärkten: Der Einfluss der Orderbuchtransparenz auf die Abschlussunsicherheit. Kredit und Kapital, 15, 137�172.
Shapiro, C. � Varian, H.R. (1999) Information rules. A strategic
guide to the network economy. Harvard Business School Press, Boston, Massachusetts.
Smith, C.W. (1991) Globalization and financial markets. Carnegie-
Rochester Conference Series on Public Policy, 34, 77�96. Stevenson, R.E. (1980) Likelihood functions for generalised
stochastic frontier estimation. Journal of Econometrics, 13, 57�66.
Stigler, G. (1961) The economics of information. Journal of Political
Economy, 49, 213�225. Strassmann, P. (2001) Guru who sees no profit in computers.
Financial Times Report by Alan Kane. Stulz, R.M. (1999) Globalization of equity markets and cost of
capital. NBER Working Paper Series 7021. Triplett, J.E. (1999) The solow productivity paradox: What do
computers do to productivity. Canadian Journal of Economics, 32, 2, 309�334.
White, L.J. (1996) International regulation of securities:
Competition or harmonization? In: Lo, A. (ed.), The industrial organization and regulation of the security industry, National Bureau of Economic Research, Chicago, University of Chicago Press, 207�235.
Wicker-Miurin, F. � Hart, R. (1999) The changing face of European
equity markets. The MSCI Handbook of world stock, derivative and commodity exchanges, Mondo Visione, UK.

136
Williamson, C. (1999) Structural changes in exchange-traded markets. Bank of England Quarterly Bulletin, 39, 2, 202�206.

137
Chapter 4
Total factor productivity growth among European stock exchanges: a non-parametric frontier approach
Heiko Schmiedel
Abstract ............................................................................................138 Acknowledgements ..........................................................................139 1 Introduction ..............................................................................140 2 Literature review ......................................................................144 3 Methodology ............................................................................147 3.1 Non-parametric frontier models .......................................147 3.2 Malmquist productivity index ..........................................149 4 Data and descriptive statistics ..................................................154 5 Empirical results.......................................................................158 6 Future prospects for policy and market design.........................164 7 Conclusions ..............................................................................170 References ........................................................................................173

138
Abstract This paper examines progressive changes in the productivity of the European stock exchange industry using non-parametric frontier techniques. Within a framework of Malmquist indices, total factor productivity growth is decomposed into technological progress and technical efficiency change for a balanced panel of all major European stock exchanges over the period 1993�1999. The principal findings indicate an overall rise in productivity over the sample period, which is driven more by technological innovation than by efficiency improvements. According to organisational setup, technological innovation is more pronounced for exchanges with the following characteristics: automation, equity and derivatives trading, a for-profit governance structure, and large or medium-size capitalized markets. Technological progress can be interpreted as a sign of the dynamic nature of the whole exchange industry, in which stock exchanges take advantage of an intense diffusion of new cost-effective technologies and information systems in order to leverage themselves onto a higher production frontier. Key words: stock exchanges, productivity, technological progress, Europe JEL classification: D24, G29, C23, O52
139
Acknowledgements This paper originates from the authors� research visits at the Research Department Bank of Finland, Helsinki, and New York Stern University Salomon Center. He would like to thank both institutions for their hospitality and generous support. Special thanks are also due to HWWA-Hamburg Institute of International Economics for having supported this research. David Mayes and Juha Tarkka gave most valuable comments and suggestions. The author is also grateful to Virpi Andersson and Jani-Petri Laamanen for providing most efficient research assistance. The views expressed are those of the author and do not necessarily reflect the views of the Bank of Finland. This paper was published as a Bank of Finland Discussion Paper, No. 11/2002.

140
1 Introduction European stock exchanges are experiencing a period of great und rapid change. Global integration in financial markets, innovations in communication and information technologies, and the launch of the single currency are fundamental forces that have trigged far-reaching transformations of the stock exchange industry in Europe over recent years. Therefore, several stock exchanges are devising strategic responses in a number of directions in order to meet investors� demands for lower trading costs, improved liquidity and immediate access to international trading. These include: changes in their organizational governance; improvements in trading services and procedures concerning service quality, staff and new technologies; as well as alliances, implicit mergers, and co-operative agreements. All these trends are visible both in European markets as well as on a global scale (Arnold et al, 1999; Di Noia, 2001a, 2001b; Chapters 2 and 3). The adoption and implementation of new technologies allowing for fully automated securities trading seem to play an important role for the whole industry in this transition period. Exchanges, for example, either established branches with local trading partners using a common technology to access regional markets, or formed alliances or implicit mergers with other exchanges, launched hostile take-over bids, or attempted to interconnect leading equity exchanges by means of a shared common electronic interface. As portrayed in Chapter 2, these strategies led exchanges to build up and expand complex networks through interconnected trading places. Essentially, it is widely believed that investments in new electronic trading facilities will yield higher levels of productivity, increased efficiency, and better quality of operation. Against this background, the present paper attempts to answer the following research questions: the first is whether and to what extent stock exchanges experienced progress or regress in total factor productivity? Second, what are the real sources of productivity change? Does a catching up process with the efficient benchmark because of changes in pure technical efficiency or scale efficiency primarily drive improvements in the overall productivity? Or is the productivity growth of stock exchanges mainly determined by a frontier shift effect stemming from enormous resources spent on new technologies over the last few years? Domowitz and Steil (1999) and Williamson (1999) argue from a supply-side perspective that exchanges nowadays perform

141
increasingly more like operative firms and that advances in the automation of trading have become a crucial factor of structural changes in stock markets that helped to reduce the costs of trading services for the benefits of investors. Hasan and Malkamäki (2001) find economies of scale and scope among exchanges across different regions. As mentioned above, Chapter 2 analyses the performance of European stock exchanges and provides evidence on considerable inefficiencies in individual financial exchanges in Europe. Similar results are found for other countries and regions in Chapter 3. The next important step on the research agenda involves identifying the major factors affecting productivity growth in the stock exchange industry. Using balanced panel data for a sample of all major European stock exchanges over the period 1993�1999, the primary motivation for this study is to contribute to these debates by evaluating productivity changes at a stock exchange specific level within a non-parametric multiproduct frontier framework. Malmquist productivity indices capture overall change in total factor productivity. It further allows drawing conclusions about two elements of productivity growth: changes in technical efficiency over time (catching up) and frontier technology shifts over time (innovation) (Färe et al, 1994). That is, an increase in productivity over two subsequent years may be due to higher technical efficiency, technological progress, or a combination of these two components. In general, the analysis of technical efficiency is an attempt to measure if inputs and outputs are combined in an efficient manner by the production process. However, technical efficiency itself may not adequately solve the issue of what actually drives productivity changes for an organization or industry operating in a changing environment where technological change occurs. Hence, it is equally important to study technological progress as another source of productivity improvement. Technological progress causes a shift of the efficient frontier due to new technologies employed by the decision-making unit, and should therefore be distinguished from efficiency improvements by units narrowing the distance from the frontier. The Malmquist productivity index is often employed in the literature to calculate technological progress and technical efficiency change components (Coelli et al, 1998). Although extensive research has been carried out to examine the efficiency and productivity changes of financial institutions for different countries, little is known about the relative impact of

142
technological change on financial exchanges.1 This paper continues the research conducted in another study where efficiency scores for European stock exchanges were investigated through stochastic frontier analysis (Chapter 2). The present study provides a comprehensive analysis of the microstructure of the European stock exchange industry, assuming that exchanges are actually operative firms (Arnold et al, 1999; Pirrong, 1999). A novum is the application of non-parametric frontier methods to the field of stock exchange research. Importantly, it evaluates efficiency and productivity changes in stock exchanges during the 1993�1999 period using Malmquist productivity indices. The calculation of Malmquist indices provides new insights into the pattern of efficiency gains and the impact of technological innovations on the total performance and production productivity of stock exchanges in Europe. This approach is important for policy formulation so as to anticipate developments in the structure of the trading services industry, as exchanges increasingly engage in using new technologies for trading and associated transaction services. Domowitz and Steil (1999) claim that traditional studies on financial market microstructure mainly focus on the demand side alone, concentrating on explicit trading rules and mechanisms, and on their impact on the price discovery process. To have a better understanding of the functioning of the security trading industry, it is equally important to examine the provision and organization of financial exchange markets from a supply-side perspective. Thus, there is an obvious need for research in this area. The principal findings of this paper indicate a rise in total factor productivity in the European stock exchange industry during the 1993�1999 period. The evidence shows that productivity growth is primarily driven by technological progress rather than improvements in technical efficiency. Concerning organizational status and other exchange-specific variables, the results report higher technological progress for exchanges that show characteristics of automation, equity and derivative trading, a for-profit governance structure, and large and mid-sized capitalized markets. The paper is structured as follows. The next section reviews studies on stock exchanges and related fields. Section 3 presents a non-parametric frontier framework with which to calculate the Malmquist productivity index and its decompositions. This is followed by a discussion of the data and empirical results. Section 6
1 Berger and Humphrey (1997) and Berger and Mester (1997) survey applications of this literature.

143
comments on policy implications, the role of technology, and future prospects for the sector. Conclusions are given in the final section.

144
2 Literature review In a broader context, a number of studies examine important changes in global financial markets, evaluating the causes and consequences of, and future prospects for financial sector consolidation and emphasizing the relevance of geographic patterns of financial activities (Berger et al, 1999; Committee of Wise Men, 2000, 2001; Group of Ten, 2001; OECD, 2001). In particular, a recent OECD study (2001) describes the forces shaping structural changes in financial markets. The authors anticipate the development towards a future single global market by means of interconnected national equity markets as a potential outcome of rapidly proceeding market globalization and technological advances. They also argue in favor of a remaining coexistence of national local trading places for less-liquid financial products. However, problems may arise, as their role is no longer unchallenged by international rival markets and thus the importance of smaller marketplaces is expected to diminish over time. Similarly, Malkamäki and Topi (1999) stress driving forces of the changes in the market structures for financial exchanges and securities settlement systems. They argue that economies of scale and scope and network effects will foster cross-border competition among exchanges. There is only little research available that addresses international comparisons of financial exchanges themselves. In contrast to classical financial market studies, Domowitz and Steil (1999) emphasize important effects of advances in automated trading technologies on the operating costs and the organizational structure of an exchange, rather than focusing on transactions costs that traders face. By modelling aspects of the organization of financial exchanges, Pirrong (1999) concludes that the existence of scale economies in the provision of trading infrastructure encourages co-operation and consolidation among financial trading services. Stigler (1961) published one of the first studies on scale economies in securities markets followed by a more extensive paper by Doede (1967). These studies report that average operating costs of stock exchanges are a declining function of trading volume. In a closely related study, Demsetz (1968) observes that bid-ask spreads are a declining function of the rate of transaction volume. These approaches indicate evidence on economies of scale in exchange operations and in the market making of a particular security, respectively. Domowitz (1995) argues that common electronic trading platforms, ie implicit mergers between existing exchanges will emerge

145
because of the positive liquidity effect and that such implicit mergers will allow for increased revenue as individual exchanges are likely to set prices above marginal cost. In a game-theoretic framework, Di Noia (2001a) addresses possible effects of cross-network externalities on competition and consolidation in the European stock exchange industry. It is demonstrated that competition may lead to inefficient equilibria while an implicit merger may have a Pareto optimal outcome and result in higher profitability of both exchanges. The implicit merger model shows that specialization in listing or trading services among exchanges is likely. By analyzing the effects of U.S. exchange mergers on trading volume and execution costs, Arnold et al (1999) find that merging exchanges attracted market share and experienced narrower bid-ask spreads. Recently, Jain (2001) extended the literature using comprehensive multi-country evidence determining the liquidity of stock exchanges as it relates to the institutional design of exchanges. The paper reports lower spreads and volatility in the exchanges that have a hybrid system (includes both a trading floor and an electronic order book and networks) than totally dealership-based systems. Furthermore, Hasan and Malkamäki (2001) investigate empirically the existence of economies of scale and scope among exchanges, providing separate perspectives on different regions. They find evidence indicating substantially higher economies of scale and scope in North American and European exchanges in comparison to Asian and South American exchanges. Comparing descriptive statistics of total costs to total revenues of eleven European stock exchanges over 1993�1994, Cybo-Ottone et al (2000) observe that efficiency differences are likely to exist across the sample exchanges. The authors do not explicitly compute efficiency effects across stock exchanges. Such an analysis is performed in Chapter 2 and provides evidence on the existence, extent, and explanation of technical efficiency effects of financial exchanges in Europe. Overall cost efficiency scores reveal that European stock exchanges operated on a considerably higher cost level than the efficient benchmark during the 1985�1999 period. Chapter 2 reports further evidence on the importance of exchange-specific factors for the efficient provision of trading services, such as size, institutional design, governance structure, market concentration and quality, and automation of trading. In a subsequent study, Chapter 3 provides further evidence on cost and revenue efficiency effects from a global perspective. They found that on average North American exchanges are the most cost and revenue efficient, while European exchanges have improved the most, in

146
respect of cost efficiency. Exchanges in the South American and Asia-Pacific regions are found to be lagging in terms of efficiency. The literature review shows that there does not exist a comprehensive panel-based analysis that measures productivity changes in the security industry over time. This paper attempts to fill this gap. Following the basic argument of Arnold et al (1999); Domowitz and Steil (1999); Pirrong (1999), this paper examines changes in the nature of the �production� process of financial exchanges where exchanges are herein considered as operative firms and thus stresses the importance and provisions of the supply side of their trading services. The analysis is performed in a multiple input/multiple output framework using a multiyear European data set.

147
3 Methodology
3.1 Non-parametric frontier models
The two principal concepts used in the literature to measure efficiency are data envelopment analysis, for short DEA, and stochastic frontiers analysis, abbreviated as SFA. These methods include mathematical programming and econometric estimation techniques respectively. For a parametric approach applied to stock exchanges, refer to Chapters 2 and 3. The central focus of this study is the application of Malmquist DEA methods to panel data in order to calculate indices of total factor productivity change, technological change, technical efficiency change and scale efficiency change. Comprehensive reviews of the DEA methodology and applications can be found in Banker et al (1984), Charnes et al (1995), Coelli et al (1998), Färe et al (1994), and Fried et al (1993). An exposition of the DEA technique for generating the Malmquist productivity index follows. DEA is a non-parametric estimation methodology that is usually employed to analyze the efficiency and performance of non-profit as well as for-profit entities using inputs to obtain outputs of interest. Within this framework, it is possible to construct a non-parametric piece-wise surface over observations of decision-making units. Efficiency measures are then calculated as deviations of each firm from the efficient frontier. Traditional, total economic efficiency can be decomposed into technical efficiency and allocative efficiency as initially proposed by Farrell (1957). The former refers to the ability of a firm to maximize outputs given a set of inputs. In turn, allocative efficiency pertains to the optimal choice of a cost-minimizing production plan, given relative input prices and technology. To calculate efficiency measures relative to the benchmark frontier, it is necessary to solve a sequence of linear programming problems. Figure 3.1 portrays a simple DEA model with two outputs (y1 and y2) and a single input (x1). The line pp� represents the efficient frontier which envelops all data points. For example, the exchange at point a operates at a technically inefficient level, which is captured by the distance between the two production points a and b, as measured by the ratio 0a/0b. When price information is available, represented by the isorevenue line, qq�, allocative efficiency can be calculated as the ratio 0b/0c. In summary, both measures combined yield overall economic efficiency as presented in Equation (3.1)

148
⎥⎦⎤
⎢⎣⎡×⎥⎦
⎤⎢⎣⎡=
×=
b0a0
c0b0
c0a0
efficiencytechnicalefficiencyallocative efficiencyeconomic (3.1)
Unlike traditional econometric estimation approaches, DEA does not capture explicitly random noise. Thus, DEA attributes all deviations from the estimated benchmark to inefficiencies. Since inputs and outputs are measured in their original units, measurement deficiencies are less likely. Another advantage of DEA is that it does not rely on a predetermined specification of the production frontier. Figure 3.1 Efficient frontier from a two-output, one-input DEA model
y1/x
p
0 y2/xp�
c
b�
a
b
q
q�
This allows DEA to be flexible enough to address differences in production functions across firms. Furthermore, DEA is free of any behavioural assumptions such as cost minimization or profit maximization. It further allows computing efficiency measures when price data is difficult to obtain (Coelli et al, 1998). Allowing for technical efficiency within a non-parametric framework, the Malmquist index approach is used to obtain an indication of major sources of productivity losses or gains in the European stock exchange industry.

149
3.2 Malmquist productivity index
The Malmquist index is employed in this analysis to measure stock exchange productivity change as originally formulated by Caves et al (1982). Färe et al (1994) use DEA-like methods to calculate Malmquist total factor productivity change indices for a sample of OECD countries from 1979 to 1988. They further illustrate that changes in productivity are the product of changes in efficiency and technological innovation over time. Alternative indices, such as the Fisher (1922) and Tornqvist (1936) indices, are used in other studies to examine technical change (Coelli et al, 1998; Färe et al, 1994; Färe et al, 1997). As mentioned in Grifell-Tatjé and Lovell (1996), the Malmquist index is superior in its properties in several respects relative to the Fisher and Tornqvist indices. The most notable features of the Malmquist productivity index are that it does not require a priori behavioural assumptions such as profit maximization or cost minimization nor input and output prices. When suitable panel data is available, it permits the researcher to calculate multiple input/multiple output production technologies and to obtain additional decomposition results of changes in technical efficiency and technological change. The Malmquist productivity index is defined by distance functions with respect of two different time periods. An output distance function addresses the maximal proportional expansion feasible without altering the input quantities (Coelli et al, 1998).2 The output distance function, d(x,y), takes a value of unity if the observed exchange belongs to the frontier output set and takes a value less than one for exchanges operating below the most feasible production set. Define x = (x1,...,xn) and y = (y1,...,ym) to be a vector of non-zero inputs and outputs of the i�th exchange in t�th period, respectively. The geometric mean of two productivity indices is taken to compute the Malmquist index, where the first evaluates productivity under the base technology in period t and the second with respect to period t+1 technology. According to Färe et al (1994), the output-oriented Malmquist index, M, between t and t+1 is defined as
2/1
tt1t
1t1t1t
ttt
1t1tttt1t1t )y,x(d
)y,x(d)y,x(d
)y,x(d)y,x,y,x(M ⎥⎦
⎤⎢⎣
⎡×=
+
+++++++ (3.2)
2 In this paper only output functions are considered. Input distance functions can be used in a similar way and are defined as the minimal proportional reduction of the input vector, given an output vector.

150
Equation (3.3) represents an equivalent way of writing this index
2/1
tt1t
ttt
1t1t1t
1t1tt
ttt
1t1t1t
tt1t1t
)y,x(d)y,x(d
)y,x(d)y,x(d
)y,x(d)y,x(d
)y,x,y,x(M
⎥⎦
⎤⎢⎣
⎡×
=
++++
+++++
++
(3.3)
The Malmquist index can be decomposed into technical efficiency change and technological change as follows
change caltechnologichange efficiency technical)y,x,y,x(M tt1t1t
×=++ (3.4)
The ratio outside the square brackets captures the efficiency change component and the remaining expression in square brackets measures technological change as depicted in equations (3.5) and (3.6), respectively
)y,x(d)y,x(dchange efficiency technical
ttt
1t1t1t +++= (3.5)
2/1
tt1t
ttt
1t1t1t
1t1tt
)y,x(d)y,x(d
)y,x(d),y,x(dchange caltechnologi ⎥
⎦
⎤⎢⎣
⎡×=
++++
++ (3.6)
The Malmquist index reveals values greater than unity if improvements in productivity occur. A decline in performance is indicated by a Malmquist index of less than one. The same arithmetic holds for each of the components of the Malmquist index. Since the product of the efficiency and technical change defines productivity growth over adjacent time periods, each of these components may show opposite results.
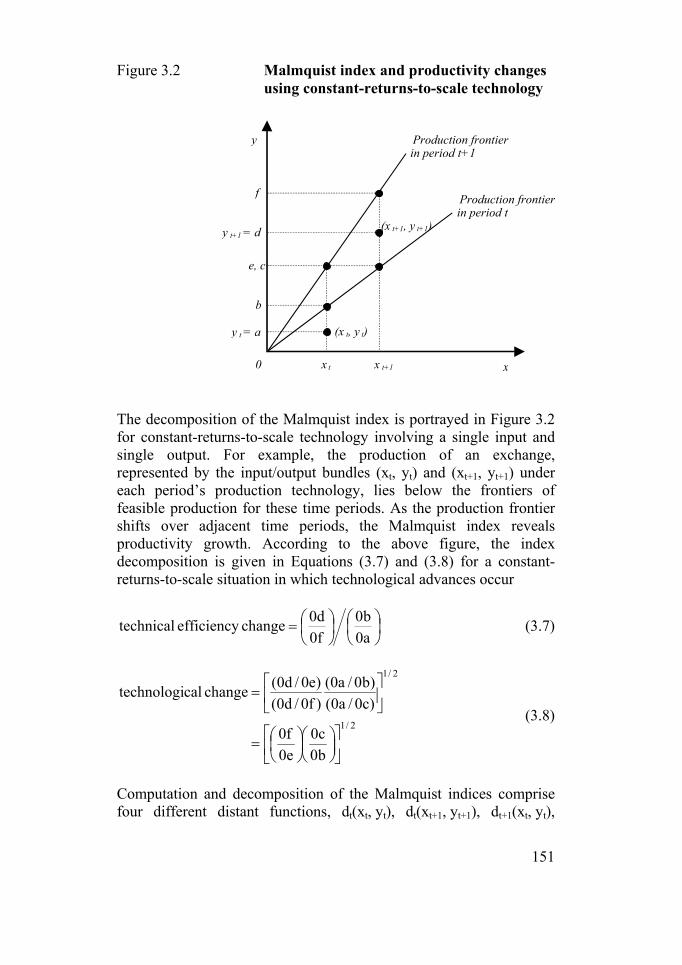
151
Figure 3.2 Malmquist index and productivity changes using constant-returns-to-scale technology
y Production frontier
in period t+1
x t+1 x t
y t = a
b
e, c
y t+1 = d
f
(x t , y t )
(x t+1 , y t+1 )
0
Production frontier in period t
x The decomposition of the Malmquist index is portrayed in Figure 3.2 for constant-returns-to-scale technology involving a single input and single output. For example, the production of an exchange, represented by the input/output bundles (xt, yt) and (xt+1, yt+1) under each period�s production technology, lies below the frontiers of feasible production for these time periods. As the production frontier shifts over adjacent time periods, the Malmquist index reveals productivity growth. According to the above figure, the index decomposition is given in Equations (3.7) and (3.8) for a constant-returns-to-scale situation in which technological advances occur
⎟⎠⎞
⎜⎝⎛
⎟⎠⎞
⎜⎝⎛=
a0b0
f0d0change efficiency technical (3.7)
2/1
2/1
b0c0
e0f0
)c0/a0()b0/a0(
)f0/d0()e0/d0(change caltechnologi
⎥⎦
⎤⎢⎣
⎡⎟⎠⎞
⎜⎝⎛⎟⎠⎞
⎜⎝⎛=
⎥⎦
⎤⎢⎣
⎡=
(3.8)
Computation and decomposition of the Malmquist indices comprise four different distant functions, dt(xt, yt), dt(xt+1, yt+1), dt+1(xt, yt),

152
dt+1(xt+1, yt+1). To estimate these frontier functions, a DEA-like linear programming method is employed as the most popular technique suggested by Färe et al (1994). Assuming constant returns-to-scale technology, the output-oriented DEA-optimization problems are formulated in Equations (3.9)�(3.12). It should be noted that the distance functions in Equations (3.9) and (3.10) include production information and technology each from the same time periods. The other two linear programs compare production points from one period to the reference technology from a different time period. The output-oriented linear programs are as follows:
00Xx0Yy s.t.
max)]y,x(d[
tt,i
tt,i
,1
ttt
≥λ
≥λ−
≥λ+φ−
φ= λφ−
(3.9)
00Xx0Yy s.t.
max)]y,x(d[
1t1t,i
1t1t,i
,1
1t1t1t
≥λ
≥λ−
≥λ+φ−
φ=
++
++
λφ−
+++
(3.10)
00Xx0Yy s.t.
max)]y,x(d[
1tt,i
1tt,i
,1
tt1t
≥λ
≥λ−
≥λ+φ−
φ=
+
+
λφ−+
(3.11)
00Xx0Yy s.t.
max)]y,x(d[
t1t,i
t1t,i
,1
1t1tt
≥λ
≥λ−
≥λ+φ−
φ=
+
+
λφ−
++
(3.12)
where φ stands for technical efficiency, λ is a N×1 vector of constants, X and Y represent input and output matrices respectively, and s.t. abbreviates �subject to�. This approach can be extended for the variable-returns-to-scale case by further decomposing technical efficiency change into scale efficiency and �pure� technical efficiency components. The enhanced

153
decomposition can be obtained by expanding the LPs with the convexity constraint N1�λ=1. In sum, there are (4×T�2)×N linear programs to solve for the construction of a chained index (Coelli et al, 1998). In the case of this study of N=16 individual exchanges across T=8 years, this would involve (4×8�2)×16 = 480 linear programs.

154
4 Data and descriptive statistics This paper employs data from a variety of sources, including annual reports of European exchanges, various issues of the International Federation of Stock Exchanges (FIBV), IMF International Financial Statistics (IFS), and information from exchange Internet sites. Most of the observations were collected from the annual balance sheets, income statement reports, and Internet pages of all the major operating stock and derivative exchanges in Europe. In some cases, additional information was obtained from the exchanges by correspondence. Also various issues of the MSCI Handbook served as an important source from which to obtain additional information on exchange-specific characteristics. Although the reporting schemes and information content of the financial accounts vary across time and exchange, a consistent balanced panel data set has been constructed including all necessary information on key balance sheet and income statement items for 16 individual exchanges. All national currencies are converted into U.S. dollars and are inflation-adjusted using data from IFS. The research is designed to follow technical efficiency and the technological regress or progress of the European stock exchange industry over the period 1993�1999 (Annual Reports 1993�1999). Measuring productivity necessitates identification of relevant inputs and outputs. In general, no strong consensus exists amongst researchers about the specifications of inputs and outputs of any financial institution. Similarly, it is not an obvious task to determine the relevant market of stock exchanges. The final solution depends on the specific understanding of a stock exchange�s functioning. In principle, two separate functions can be derived from stock exchange businesses and their annual reports. First, exchanges facilitate trade processing and matching by providing a centralised trading place or electronic trading systems. Second, financial exchanges are also engaged in the monitoring of listed companies and the maintenance of the marketplace, attempting to ensure that transactions are fairly and efficiently executed. The output concerning trade processing can be proxied by using trading statistics, namely the number and value of executed trades. Proxies for the output regarding the listing procedure of companies are the number and value of companies listed on a particular exchange. On the input side, stock exchanges utilize personnel, physical capital including the IT infrastructure, ie computers and software, to maintain the marketplace and to communicate with companies in order to fulfil their listing and monitoring functions. The two most

155
important inputs for stock exchange operations are labor and capital, as used reflected in this study. The first input, LABOR (x1), equals the number of full-time equivalent employees on the payroll at the end of each year. The latter, PHCAP (x2), is measured as the net asset value of total office premises and equipment. Within this framework, a relatively efficient stock exchange will therefore minimize the level of capital and the number of staff employed, while maximizing outputs in terms of company listings and transactions. A summary of variable specifications and definitions is provided in Table 4.1. Table 4.2 contains descriptive statistics for the input and output variables for each sample year. The means and standard deviations reported in the table suggest that there are substantial variations across the sample with respect to the input and output variables. Examples of other studies where these variables have been used include (Hasan and Malkamäki, 2001; Chapters 2 and 3). Table 4.1 Variables and definition of in- and outputs Variables Definition Inputs x1 Full-time equivalent employees of the i�th exchange in the t�th time period x2 Total physical capital of the i�th exchange in the t�th time period (in thousands
US$) Outputs y1 Total number of companies listed on the i�th exchange in the t�th time period y2 Total value of shares traded on the i�th exchange in the t�th time period (in millions
US$) y3 Total number of trades on the i�th exchange in the t�th time period (in hundred
thousands) y4 Total value of listed companies on the i�th exchange in the t�th time period (in
millions US$)

156
Table 4.2 Descriptive statistics of input and output variables, 1993�1999 Variables Combined 1993 1994 1995 1996 1997 1998 1999 Mean
[SD] Mean [SD]
Mean [SD]
Mean [SD]
Mean [SD]
Mean [SD]
Mean [SD]
Mean [SD]
Inputs x1 230.26 193.44 197.06 208.44 228.88 215.38 252.31 316.31 [223.76] [256.56] [243.98] [242.23] [227.73] [175.33] [187.95] [238.25] x2 29.137 25.602 24.387 23.425 24.555 28.678 34.151 43.160 [46.920] [52.550] [41.211] [40.045] [42.584] [44.789] [48.175] [61.285] Outputs y1 511 482 480 507 531 588 481 506 [634] [615] [587] [660] [726] [811] [572] [550] y2 306.715 156.191 165.524 172.503 235.525 359.238 473.585 584.436 [519.187] [279.836] [290.931] [305.707] [359.280] [510.866] [690.906] [828.201] y3 7.684 2.645 3.134 4.186 5.516 8.826 12.050 15.527 [12.879] [3.754] [3.973] [5.967] [7.847] [11.476] [16.241] [22.073] y4 369.720 239.141 225.764 249.236 303.729 405.374 486.514 678.284 [504.920] [345.262] [316.002] [356.290] [393.994] [494.079] [581.919] [794.487] Notes: All currencies are converted to US$ and inflation-adjusted. SD stands for �standard deviation�. Table 4.3 Summary of European stock exchanges in the sample, 1993�1999
Exchanges Model I Model II Model III Euronext Amsterdam X X X Bolsa de Bilbao X Bolsa de Madrid X X X Euronext Brussels X Copenhagen Stock Exchange X X X Deutsche Boerse AG X X X Helsinki Stock Exchange X X X Istanbul Stock Exchange X London Stock Exchange X X X Luxembourg Stock Exchange X Oslo Borse X X X Euronext Paris X X X OM Stockholm Exchange X X X Swiss Exchange X Warsaw Stock Exchange X X X Budapest Stock Exchange X
The following models are estimated in this study. Modelling output-oriented Malmquist productivity growth indices, the first estimation includes two outputs, namely the number of listed companies and the total value of trades, and two inputs, labor and physical capital. Model II keeps the same outputs and inputs; however, it concentrates on a fewer number of stock exchanges, as in Model III. Additionally,

157
Model III considers all four of the output variables, the number of listed companies, the value of shares traded, the number of trades, and the value of the listed companies, whilst keeping the same inputs as in the other models.3 All models are estimated for the 1993�1999 sample years.4 Table 4.3 summarises all financial exchanges included in Models I to III.
3 Considering additional outputs in Model III requires a smaller sample size. Other exchanges could not be included due to missing observations and data availability. 4 Note that all Malmquist index numbers are measured using an output-oriented approach. Similar results are obtained when modeling input-orientation and are available from the author upon request.

158
5 Empirical results The models discussed above provide the measures of total factor productivity change and its multiplicative composites of efficiency and technological change for the sample period across each year and for exchange-specific variables as well as different organizational designs, types and sizes. The results are reported in Tables 5.1 to 5.4. All estimates are reasonably consistent across different model specifications and variations of in-sample exchanges. Recall that the Malmquist index and any of its components with values greater than unity indicate an increase in the relevant performance, whereas values below one signal a drop in exchange performance. Tables 5.1 to 5.3 show mean annual components of the Malmquist productivity index for each of the models for 1994�1999. On average the European stock exchange industry increased total factor productivity about 4.9% to 13% over the sample period, depending on the model specification used in the estimation (see bottom row of mean values in Tables 5.1 to 5.3). This indicates that European stock exchanges have performed well in recent years in terms of productivity growth. In respect of annual sector performance, 1997 is associated with the largest rise in productivity. A closer look at the major sources of total factor productivity shows that technological change on average made the largest contribution rather than improvements in efficiency, regardless of model variation. Tracing yearly averages in Tables 5.1 to 5.3, it is found that in Models II and III an overall increase in efficiency change has occurred during the entire period, although Model I reveals a marginal loss in technical efficiency. However, the picture becomes clearer when decomposing efficiency change into scale change and pure technical change. In this case, all estimates find on average rising pure technical efficiency in the sector, with a highest average score of 2 percent per year. Hence, scale deficiencies may explain the lower performance of stock exchanges in terms of the efficiency change in Model I. However, in Models II and III scale efficiency appears to be positive, with peak scores in 1998. The results of individual years show evidence that not all observations over the sample years are associated with an increase in pure technical efficiency. Declines in pure technical efficiency should be construed against the background that technical progress might further magnify an observed reduction in pure technical efficiency. One plausible explanation is that pure technical efficiency is calculated against an efficient frontier that represents more advanced

159
production technology. Generally, if the shift of the benchmark frontier, due to an increase in pure technical efficiency, were less than the upward movement of the frontier caused by technological innovation, it would result in an overall regress in pure technical efficiency. Put differently, scale deficiencies are mainly due to the poor performances of most exchanges over the entire period, compounded by a considerable frontier shift that many exchanges could not keep pace with in terms of adjusting to optimal size. Figures 5.1 to 5.3 provide visual summaries of the Malmquist productivity index and its basic components for each model during the 1993�1999 period. Note that 1993 represents the base year and equals the value of one. The graphs indicate that total factor productivity is driven more by technological change than by pure technical efficiency. Table 5.1 Malmquist productivity index summary of annual means (Model I), 1994�1999 Year Efficiency
change (EFFCH)
Technical change
(TECHCH)
Pure technical efficiency (PECH)
Scale efficiency (SECH)
Malmquist index (MALM)
1994 1.346 0.840 1.206 1.116 1.130 1995 1.161 0.919 1.112 1.043 1.066 1996 0.918 1.174 0.991 0.926 1.078 1997 0.869 1.420 0.896 0.970 1.234 1998 0.846 1.076 1.117 0.758 0.910 1999 0.798 1.147 0.844 0.945 0.915 Mean 0.972 1.080 1.020 0.953 1.049 Notes: All Malmquist index averages are geometric means. Table 5.2 Malmquist productivity index summary of annual means (Model II), 1994-1999 Year Efficiency
change (EFFCH)
Technical change
(TECHCH)
Pure technical efficiency (PECH)
Scale efficiency (SECH)
Malmquist index (MALM)
1994 1.195 0.950 1.191 1.003 1.136 1995 1.086 0.969 1.066 1.019 1.052 1996 0.934 1.328 1.006 0.928 1.241 1997 0.814 1.723 1.010 0.805 1.402 1998 1.085 0.779 0.780 1.390 0.845 1999 1.029 1.154 1.057 0.974 1.187 Mean 1.016 1.112 1.010 1.006 1.130 Notes: All Malmquist index averages are geometric means.

160
Table 5.3 Malmquist productivity index summary of annual means (Model III), 1994�1999 Year Efficiency
change (EFFCH)
Technical change
(TECHCH)
Pure technical efficiency (PECH)
Scale efficiency (SECH)
Malmquist index (MALM)
1994 1.102 0.969 1.119 0.985 1.067 1995 1.221 0.862 1.045 1.169 1.053 1996 0.937 1.207 1.029 0.911 1.130 1997 0.882 1.541 0.951 0.927 1.359 1998 0.996 0.814 0.865 1.152 0.811 1999 0.977 1.089 1.019 0.959 1.064 Mean 1.013 1.055 1.001 1.012 1.069 Notes: All Malmquist index averages are geometric means. Figure 5.1 Summary of productivity changes in the European stock exchanges industry (Model I), 1993�1999
0.4
0.8
1.2
1.6
1993 1994 1995 1996 1997 1998 1999
Years
Index
MALM TECHCH PECH

161
Figure 5.2 Summary of productivity changes in the European stock exchanges industry (Model II), 1993�1999
0.4
0.8
1.2
1.6
1993 1994 1995 1996 1997 1998 1999
Years
Index
MALM TECHCH PECH Figure 5.3 Summary of productivity changes in the European stock exchanges industry (Model III), 1993�1999
0.4
0.8
1.2
1.6
1993 1994 1995 1996 1997 1998 1999
Years
Index
MALM TECHCH PECH

162
Focusing further on the results reported by Model I, the model with the highest number of observations, productivity scores are analyzed according to different groups of exchange institutions. These estimates are presented in Table 5.4 for exchange-specific variables as well as different organizational designs, types and sizes. It shows that all types of exchanges reveal an overall rise in productivity. The estimates are also consistent with the previous findings that gains in productivity are rather due to technological innovations than efficiency gains over the sample period. Almost all exchange types have values greater than unity for technological change, except for smaller, less capitalized markets, which remain nearly unchanged. However, there is some variation in productivity and efficiency across different types and characteristics of stock exchanges over the period under consideration. Controlling for exchange size, larger and mid-sized exchanges in terms of employment and asset size score higher on improvements in productivity due to higher technological progress relative to smaller-sized exchanges. However, smaller exchanges score higher in efficiency and seem to have adopted good management practices that compensate for size. The results further show that both older and more recently established exchanges have improved productivity over recent years, with average scores of 11.4% and 12.1% respectively. Older exchanges show scores greater than one in each component of the Malmquist index, with the highest numbers for technological change, whereas more recently established exchanges seem to better achieve optimal scale. Furthermore, the average scores report somewhat higher technological change numbers for automated exchanges over auction-type exchanges, whereas auction type-exchanges indicate marginally better overall performance.

163
Table 5.4 Malmquist productivity index by size, categorization, organizational form of European stock exchanges (Model I) Exchange characteristics and organizational setup
Efficiency change
(EFFCH)
Technical change
(TECHCH)
Pure technical efficiency (PECH)
Scale efficiency (SECH)
Malmquist index
(MALM)
No. employees >300 1.024 1.134 1.001 1.033 1.100
100�300 1.041 1.172 0.984 1.081 1.196 0�100 1.041 1.068 0.978 1.052 1.075
Total assets
>80000 0.933 1.226 0.935 1.001 1.106 40000�80000 1.073 1.111 0.984 1.121 1.160
0�40000 1.088 1.040 1.019 1.058 1.106 Recently established exchanges 1.097 1.054 0.936 1.173 1.121 Older exchanges 1.016 1.138 1.004 1.014 1.114 Auction 1.001 1.167 1.014 1.000 1.108 Automated 0.957 1.170 0.963 0.986 1.093 Equity only exchanges 1.076 1.114 1.009 1.075 1.157 Exchanges with derivatives 0.951 1.122 0.941 1.010 1.029 Cooperative exchanges 1.157 1.033 1.025 1.148 1.137 De-mutualized 0.953 1.174 0.961 0.989 1.101 Top 5 markets 1.001 1.167 1.014 1.000 1.108 Medium markets 0.957 1.170 0.963 0.986 1.093 Smallest markets 1.157 0.999 0.980 1.186 1.133
Notes: All currencies are converted to US$ and inflation-adjusted. Exchanges that include only stock trading score higher productivity gains, which are mainly due to better efficiency numbers, relative to exchanges with derivative trades. However, exchanges that are also active in derivative trading seem to engage more in updating and upgrading their trading technologies, which is supported by the evidence of greater technological progress. The governance structure seems to be important for an exchange�s decision-making process to adopt new technologies. The results support this view and exhibit higher improvements in technological innovation for profit-motivated exchanges over cooperative and non-profit-oriented exchanges; however, demutualized exchanges deviate from the optimal scale. Among different groups, according to market capitalization, substantial productivity improvements of 9.3% to 13.3% are associated with higher technological progress for top and medium markets compared to smaller-sized markets, while the latter experienced the highest gains in scale.

164
6 Future prospects for policy and market design
Building on the analytical framework presented in the previous sections, this section discusses global issues and concerns for policy and market infrastructure as regards major developments affecting the European securities markets in the near future. As financial markets become more integrated, national and regional marketplaces and providers of financial trading services are challenged to maintain their existing market shares while adjusting to a rapidly changing environment with new competitive norms. Compounding this global pressure for consolidation, advances in technology have caused a reduction in communication and transaction costs. A number of exchanges are revising their business strategies and are transforming governance structures into more profit-oriented businesses aiming to become listed companies themselves. At the same time, additional competitive pressure has arisen from alternative trading systems attempting to invade exchanges� markets by providing alternate liquidity pools. As securities markets evolve, financial regulatory authorities are equally opposed to coping with these trends and to undertaking appropriate steps to set up and ensure a stable and favourable regulatory environment. Against this background, stock exchanges face unique problems with high relevance for the whole industry on an unprecedented and global scale. In the following, future outcomes for the trading landscape arising from these restructuring processes are discussed by outlining different strategies available to national and regional stock exchanges as well as to regulatory authorities for meeting these challenges. Regulatory initiatives and arrangements In the European context, it is widely believed that a number of factors and barriers are significantly preventing progress towards EU cross-border integration of financial markets in a large number of areas. Such factors concern the lack of clear EU regulation, the lack of an effective decision-making system or common interpretation of rules, differences in legal systems and taxation, political and external trade obstacles, as well as cultural barriers.

165
In this respect, the recently established Committee of Wise Men, chaired by Baron Alexandre Lamfalussy, was to propose reforms towards a future, more homogeneous regulatory environment in EU securities markets that could best respond to market developments (Committee of Wise Men, 2000, 2001). The Lamfalussy committee succeeded in establishing a broad consensus on the priorities required to accelerate the regulatory progress. This regards the following points: a single prospectus for issuers to facilitate firms� access to capital across Europe; modernization of admission to trading; home country supervision for all wholesale members and a more distinct definition of a professional investor; adoption of international accounting standards; and a single passport for recognized stock markets. As a result, the Committee of Wise Men received widespread support for a four-stage concept of future financial services legislation. Level 1 contains framework principles determining the essential political direction to be decided by the European Parliament and the Council of Ministers on the basis of a proposal by the European Commission. Level 2 foresees the establishment of two new Committees � the EU Securities Committee (ESC) with a primarily regulatory mandate and the EU Securities Regulators Committee (ESCR) with advisory functions � to define, propose and decide on the technical details of implementing the legislation. The third level encompasses the strengthening of a cooperative network among regulators to ensure common implementation standards. Finally, the Commission is responsible for the enforcement of Community law. The views of the Lamfalussy Committee outlined above represent an important investigation towards a more efficient EU legislative process aimed at creating a fully integrated European financial services and capital market. These regulatory initiatives are sorely needed and reflect a move in the right direction. Nevertheless, there are important limits and one should not overstate this reform proposal, as it would only partially remove obstacles to an integrated European securities market. In particular, it seems to be challenging to find the right balance in dividing and assigning responsibilities among the various EU institutions � The Council of Ministers, the Commission, and the new Securities Committees. Unclear competencies among these institutional bodies and inflexible incorporation of the proposed new regulatory committees in the EU apparatus bear the risk of delaying the implementation of reforms and at the same time delaying the benefits arising from market integration. Among other suggestions, Murray (2001) rightly points out that it is equally important that the Commission pursue a much more active role in

166
enforcing existing legislation, ie by monitoring those governments that impede single market access. Overall, it would be optimal to establish a new and flexible regulatory framework, allowing Europe to compete effectively in the global arena. Concentration versus fragmentation As established in Chapter 2, European stock and derivative exchanges reorganise their businesses and their operations by forming alliances, takeovers, or other forms of cooperation in order to maintain market shares and leverage themselves into a better position vis-à-vis their competitors. In this light, such co-operations among European stock exchanges is mainly motivated by the assumption that trading would be most efficient if trading were centralised not necessarily on a few or eventually on only one physical base. It may be simply a technological agreement between exchanges to use standardized technologies ensuring high compatibility in different or even one centralised trading system so as to maximise scale economies and improve actively efficiency in the provision of trading services. Consistently, it is apparent from the findings of this study that technological innovation and the creation of networks plays an important role for the future European trading landscape. As Pirrong (1999) claims, rapid advances in communications technology have helped to minimise the fragmenting effect of physical distance on exchange formation. Shapiro and Varian (1999) believe that cheap computer technology will cause trading via networks to dominate business. Networks will provide investors with options to choose from among alternative preferences. Domowitz (1995) and Domowitz and Steil (1999) state that an exchange or a trading system is analogous to a communication network, as the benefit to one trader transacting on a given trading system increases when another trader chooses to transact there as well. In terms of trading volume, the rapid emergence of Eurex is a good example of how networks can replace a trading floor in another country. This effect is called network effects or network externalities. Economides and Siow (1988) showed that liquidity considerations limit the number of markets in a competitive economy. In their spatial competition model with liquidity as a positive externality, they demonstrate that the value of a network increases with the number of users. In other words, there may be too few markets because nobody wants to use a new market with low liquidity. Later, Economides (1993) revealed that networks (such as electronic trading systems) are

167
by their nature self-reinforcing. As a consequence, networks exhibit positive critical mass. A second consequence is that optimality will not result from perfect competition. According to Economides, this opens up the possibility that some market structures (such as monopoly), which can co-ordinate expectations, might achieve larger networks and higher welfare than would perfect competition. Network providers have market power through the setting of standards for the network. Stock exchanges usually set rules and regulations for their trading systems. This, according to Economides, impedes technological innovation. This should motivate authorities and the investment community to prohibit the possibility that upcoming alliances operate as a price cartel or misuse their market power to impede competition (Malkamäki, 1999). Economides (1993) also argues that equilibrium price information from a financial exchange network is another externality, in addition to market liquidity. A concern here stems from the observation that smaller exchanges are actually cream skimming, as some of them concentrate on trades that take advantage of price discovery on a major exchange. It is also seen that realised bid-ask spreads are higher for shares that are subject to cream skimming. Thus the validity of the market price on the bigger exchange seems to be reduced as customers (brokers) switch to alternative networks. The problem of course is that this is not necessarily in the interest of end investors, as the spreads are wider and the quality of the market price worse. A solution suggested by Economides is to price market equilibrium information appropriately. This question relates to legislation and interim rules and regulations as well as the microstructure of trading systems of stock exchanges and specifically those of alliances. Currently, the financial market includes network externalities especially in the United States, where there has been a huge invasion of new equity routing/matching/trading systems, eg Instinet, Posit, AZ, and Attain etc.5 Technological innovations have considerably reduced set-up and implementation costs for new trading systems, at the same time lowering barriers for new entrants to penetrate the market, while encouraging the construction of novel and sophisticated types of trading systems (OECD, 2001). Even though the experience of alternative trading systems is less successful in Europe, these new alternative electronic trading systems create new services and competition that may lead to the fragmentation of liquidity and cream skimming, thus posing a major challenge for the management of
5 For a comprehensive overview on these issues, see Korhonen (2001).

168
exchanges. On the other hand, it is probably not likely that these systems will gain sufficient market share to put too much pressure on exchanges, as they are dependent on the pricing data established on main exchanges. However, all these trends have opened new strategic scenarios in which economies of scale and expectations of further cost efficiency may lead to the consolidation of traditional stock exchanges. Exchanges� governance structure Concerning organizational structure, many exchanges, formerly mutual co-operatives, have transformed their ownership structure into for-profit shareholder-owned corporations. Hart and Moore (1996) argue that in co-operative exchanges members may be reluctant to accept changes that would affect their own business, even if this were in their own interest in the longer run. In other words, it seems that member-owned exchanges with a non-automated trading environment tend to impede the transition to automated and remote membership trading technologies. The success of Eurex relative to LIFFE may be partly explained by differences in the governance of these exchanges. As competition intensifies, there is a clear need for exchanges to behave like for-profit-oriented companies in order to adopt more efficient decision-making processes. This includes a direct influence by ownership on the management. At the same time, exchanges are likely to become more flexible in order to employ appropriate measures to adjust to market developments, to facilitate alignments and cross-border co-operation among exchanges, and to show greater responsibility concerning marketplace maintenance. It can be anticipated that demutualization and privatisation will be prime prerequisites to being successful in the future. However, as mentioned in Di Noia (2001b), the ownership composition may create many conflicts of interest as the interests of the owners of the exchange may diverge from those of the principal customers of its trading services. Productivity gains Further integration of financial markets and technological advances will affect the development of the stock exchange infrastructure. The combined effect of these various forces has created a plausible environment for consolidation in the European securities industry and will have an impact on the nature of the �production� process of

169
trading service providers. Overall, European stock exchanges seem to operate on a relatively higher cost level than optimal (Chapter 2). Accordingly, a substantial degree of consolidation of the exchange industry is likely to take place as less productive or otherwise less successful trading service providers will have to revise their strategies or to quit the business. One possible effect is that by concentrating trading activities on a few exchanges, consolidation might force an exchange to produce the most efficient price-quantity combination. A more cost-efficient provision of the supply side of trading services may probably also translate to some degree into less costly trading on the demand side. In addition, consolidation of the stock exchange industry might also increase overall system efficiency if the remaining exchanges are better able to agree on a high degree of standardization across systems. Consequently, it would be advantageous for cooperating exchanges to share, sometimes high, investment and establishment costs of new trading technologies or networks. Given the importance of an exchange in the financial and economic system of a country, it seems clear that consolidation will not only have a positive effect on listed companies and investors, but will also be beneficial for the whole economy.

170
7 Conclusions In light of increasing integration and consolidation in modern global and European financial markets, evolving governance structures, alliances and a changing regulatory environment, this paper provides important new evidence on the productivity, performance, and competitiveness of stock exchanges in Europe. Generally, the rapid pace of advances in innovative communication means and new technologies is deemed to be one of the major forces driving the recent growth of trading in global financial markets. The potential impact of electronification is important and far-reaching for the whole trading industry. In this scenario, stock exchanges are facing a new dimension of increased competition, forcing them to revise their business strategies and to undertake enormous efforts in investment and implementation programs of new technologies in order to cope with these changes and the new environment. Although one might anticipate that advances in new technologies have the potential to shape the future trading landscape, relatively little is known empirically about the impact that technology has on the production process of the stock exchange industry. Put differently, it is unclear what actually drives productivity changes for the stock exchanges industry operating in a changing environment where technological change occurs. It is at the heart of this study to evaluate the nature and extent of changes in productivity in the European stock exchange industry. Furthermore, this paper examines whether stock exchanges were able to raise productivity rather through a catching-up process with the efficient benchmark or through intense investments in updating or upgrading their technologies. Using balanced 1993�1999 data of all major European stock exchanges, this paper traces the productivity of stock exchanges over time and among different types and groups of exchanges. Specifically, the study inquires whether total factor productivity growth is primarily driven by improvements in efficiency or technological progress. Additionally, the paper focuses on the role of organizational status, structure, and corporate governance influencing the performance of exchanges. A novum of this study is further that productivity analysis of European stock exchanges is performed in a non-parametric framework using a DEA piece-wise linear production function and the Malmquist productivity index. This approach permits us to analyze simultaneously changes in total factor productivity and its components of pure technical change, scale efficiency, and technological change.

171
Clear evidence emerges from this study that European stock exchanges have exhibited positive productivity growth over the period in focus. The results indicate a small overall rise in pure technical efficiency and more significant overall technological progress. The empirical findings of this study support the view that technological innovation played a pivotal role in shaping trading service provision during the 1993�1999 period. Technological progress can be interpreted as a sign of the dynamic nature of the whole exchange industry, where stock exchanges take extraordinary efforts to adopt new cost-effective technologies and to cope with a changing security market environment. As a result, the stock exchanges studied were able to take advantage of an intense diffusion of new technologies and information systems in order to leverage themselves onto a higher production frontier. The automation of trading, electronic trading platforms, remote trading facilities and the creation of networks among exchanges represent important characteristics of this sector for the period under consideration and for the near future. Additionally, the results report higher technological progress for exchanges that show characteristics of automation, equity and derivative trading, a for-profit governance structure, and large and mid-sized capitalized markets. This finding supports the view that technological advances in stock exchanges have been an expensive undertaking and that bigger and medium exchanges with larger capital backup and higher turnover of trades were more able to fund intense technological investments relative to their smaller counterparts. One possible implication for the future of the European stock exchange industry is that technological innovation is likely to continue to drive productivity. It is anticipated that the creation of networked electronic trading platforms will provide the potential for future productivity growth and improved efficiency in the provision of trading services. Additionally, it can be expected that merger activity in the form of strategic alliances or acquisitions could change the productivity of the sector. The formation of mergers or alliances among exchanges in Europe is likely to have a beneficial effect on the overall productivity level as a means to enhance efficiency or scale economies and to foster synergies, or even to increase market power by centralizing trading. Such alliances would enable co-operating exchanges to commonly invest in technological innovations or to rent out or sell new technologies to other trading service providers in order to achieve greater economies of scale. This would also lead to the use of more standardized technologies with a high degree of compatibility among different systems. The analysis of total factor productivity, pure technical efficiency, and technological change in this study

172
provides valuable information to policy authorities and exchange decision-makers in their pursuit of future strategies that encourage technological innovation and foster productivity gains.

173
References Annual Reports (1993�1999) Annual reports of 16 European stock
exchanges. Arnold, T. � Hersch, P. � Mulherin, J.H. � Netter, J. (1999) Merging
markets. Journal of Finance, 52, 655�681. Banker, R.D. � Charnes, A. � Cooper, W.W. (1984) Some models for
estimating technical and scale Inefficiencies in data envelopment analysis. Management Science, 30, 1078�1092.
Berger, A.N. � Demsetz, R.S. � Strahan, P.E. (1999) The
consolidation of the financial services industry: Causes, consequences, and implications for the future. Journal of Banking and Finance, 23, 135�194.
Berger, A.N. � Humphrey, D.B. (1997) Efficiency of financial
institutions: International survey and directions for future research. European Journal of Operational Research, 98, 175�212.
Berger, A.N. � Mester, L.J. (1997) Inside the black box: What
explains differences in the efficiencies in financial institutions. Journal of Banking and Finance, 21, 895�947.
Caves, D.W. � Christensen, L.R. � Diewert, W.E. (1982) The
economic theory of index numbers and the measurement of input, output and productivity. Econometrica, 50, 1393�1414.
Charnes, A. � Cooper, W. � Lewin, A. � Seiford, L. (1995) Data
envelopment analysis: Theory, methodology and application. Kluwer Adademic Publishers, Boston.
Coelli, T.J. � Prasada Rao, D.S. � Battese, G.E. (1998) An
introduction to efficiency and productivity analysis. Boston, Kluwer Academic Publishers, Boston, Massachusetts 02061 USA.
Committee of Wise Men (2001) Final report of the Committee of
Wise Men on the regulation of European securities markets. Brussels.
174
Committee of Wise Men (2000) Initial report of The Committee of Wise Men on the regulation of European securities markets. Brussels.
Cybo-Ottone, A. � Di Noia, C. � Murgia, M. (2000) Recent
development in the structure of securities markets. Brookings-Wharton Papers on Financial Services, 2000.
Demsetz, H. (1968) The cost of transacting. Quarterly Journal of
Economics, 82, 33�53. Di Noia, C. (2001a) The stock-exchange industry: Network effects,
implicit mergers, and remote access. European Financial Management, 7, 1, 39�72.
Di Noia, C. (2001b) Customer-controlled firms: The case of
financial exchanges. In: Ferrarini, G., Hopt, K.J., Wymeersch, E. (eds.), 2001, Capital markets in the age of the Euro, Kluwer London.
Doede, R. (1967) The monopoly power of the New York Stock
Exchange. Unpublished Ph.D. dissertation, University of Chicago. Domowitz, I. (1995) Electronic derivatives exchanges: Implicit
mergers, network externalities and standardization. The Quarterly Review of Economics and Finance, 35, 2, 163�175.
Domowitz, I. � Steil, B. (1999) Automation, trading costs, and the
structure of the trading services industry. Brookings-Wharton Papers on Financial Services, 1�52.
Economides, N. (1993) Network economics with application to
finance. Financial Markets, Institutions & Instruments, 2, 5, 89�97.
Economides, N. � Siow, A. (1988) The division of markets is
limited by the extent of liquidity (spatial competition with externalities). American Economic Review, 78, 1, 108�121.
Färe, R. � Grosskopf, S. � Lovell, C.A.K. (1994) Production
frontiers. Cambridge (Mass.), Cambridge University Press.

175
Färe, R. � Grosskopf, S. � Norris, M. � Zhang, Z. (1994) Productivity growth, technical progress, and efficiency change in industrialized countries. American Economic Review, 84, 66�83.
Färe, R. � Grosskopf, S. � Roos, P. (1997) Malmquist productivity
indexes: A survey of theory and practice. In: Färe, R., Grosskopf, S., Russel, R.R. (eds.), Index numbers: Essays in honour of Sten Malmquist, Kluwer Academic Publishers, Boston.
Farrell, M.J. (1957) The Measurement of productive efficiency.
Journal of the Royal Statistical Society, Series A, CXX, 253�281. FIBV (1993�1999) Annual reports 1993�1999. International
Federation of Stock Exchanges, Paris. Fisher, I. (1922) The Making of index numbers. Boston, MA:
Houghton-Miflin. Fried, H.O. � Lovell, C.A.K. � Schmidt, S.S. (1993) The
Measurement of productive efficiency: Techniques and applications. New York: Oxford University Press.
Grifell-Tatjé, E. � Lovel, C.A.K. (1996) Deregulation and
productivity decline: The case of Spanish savings banks. European Economic Review, 40, 1281�1303.
Group of Ten (2001) Report on consolidation in the financial
sector. Basel. Hart, O. � Moore, J. (1996) The governance of exchanges:
Members� cooperatives versus outside ownership. Oxford Review of Economic Policy, 12, 4, 53�69.
Hasan, I. � Malkamäki, M. (2001) Are expansions cost effective for
stock exchanges? A global perspective. Journal of Banking and Finance, 25, 12, 2339�2366.
International Monetary Fund, various issues. International Financial
Statistics, Washington. Jain, P. (2001) Institutional design and liquidity on stock
exchanges. Working Paper Kelley School of Business Indiana University.

176
Korhonen, K. (2001) Securities market ATS�s concepts, their roles
and related policy issues. Bank of Finland Discussion Paper Series, 24/2001.
Malkamäki, M. (1999) Are there economies of scale in stock
exchange activities? Bank of Finland Discussion Paper Series, 4/1999.
Malkamäki, M. � Topi, J. (1999) Strategic challenges for exchanges
and securities settlement. Bank of Finland Discussion Paper Series, 4/1999.
MSCI (1995�2000) Handbook of world stock, derivative, and
commodity exchanges. Mondo Visione, UK. Murray, A. (2001) The future of European stock markets. Centre
for European Reform, UK. OECD (2001) Future prospects for national financial markets and
trading centres. OECD, Paris. Pirrong, C. (1999) The organization of financial exchange markets:
Theory and evidence. Journal of Financial Markets, 2, 329�357. Shapiro, C. � Varian, H.R. (1999) Information rules. A strategic
guide to the network economy. Harvard Business School Press, Boston, Massachusetts.
Stigler, G. (1961) The economics of information. Journal of Political
Economy, 49, 213�225. Tornqvist, L. (1936) The Bank of Finland�s consumption price
index. Bank of Finland Monthly Bulletin, 10, 1�8. Williamson, C. (1999) Structural changes in exchange-traded
markets. Bank of England Quarterly Bulletin, 39, 2, 202�206.

177
Chapter 5
Do networks in the stock exchange industry pay off?
European evidence
Iftekhar Hasan � Heiko Schmiedel
Abstract ............................................................................................178 Acknowledgements ..........................................................................179 1 Introduction ..............................................................................180 2 Networks, alliances, and cooperation among European stock exchanges........................................................................183 3 Recent literature on network externalities and stock exchanges........................................................................191 4 Data and methodology .............................................................196 5 Empirical evidence...................................................................201 6 Conclusions ..............................................................................215 References ........................................................................................216

178
Abstract Economic theory of network externalities provides the rationale for this paper to investigate whether the adoption of network strategies in European stock exchange markets creates additional value in the provision of trading services. Using unbalanced panel data from all major European exchanges over the period 1996�2000, the paper examines empirically the presence of network effects on the liquidity, growth, and efficiency of the exchanges, the transaction cost of trades, and the cost of exchange operations. The evidence shows that adopting a network strategy is significantly associated with higher liquidity, growth and efficiency among sample markets. Additionally, a network strategy helps markets in lowering transaction costs of trades as well as operational costs for stock exchanges. Key words: stock exchanges, network externalities, remote access, Europe JEL classification: F36, G15, O52

179
Acknowledgements This paper originates from the research visits of Heiko Schmiedel at the Research Department Bank of Finland, Helsinki, and New York Stern University Salomon Center. He would like to thank both institutions for their hospitality and generous support. Special thanks are also due to the HWWA-Hamburg Institute of International Economics for having supported this research. This research benefited from conferences and workshops at the Bank of Finland and Financial Management Association Conference in Copenhagen, Denmark, and the Symposium on International Equity Market Integration at the Institute for International Integration Studies at Trinity College Dublin, Ireland. Colm Kearney, Bryan Lucey, David Mayes, Oz Shy, and Juha Tarkka gave most valuable comments and suggestions. The authors are also grateful to Virpi Andersson and Jani-Petri Laamanen for providing most efficient research assistance. The views expressed are those of the author and do not necessarily reflect the views of the Bank of Finland. An earlier version of the paper was published as a Bank of Finland Discussion Paper, No. 02/2003. Reprinted from International Review of Financial Analysis, forthcoming, Hasan I. and Schmiedel H., Network and equity market integration: European evidence, with kind permission from Elsevier.

180
1 Introduction In recent years, stock exchanges have been experiencing a challenging and unprecedented environment. Globalization and integration of all types of financial markets, the continuous emergence of innovative technology, new deregulatory initiatives, and the adoption of alternative corporate governance systems are among some of the key issues faced by exchanges around the world. The integration phenomenon increased the popularity of mergers, especially implicit mergers or network deals among exchanges. As companies seek to broaden their shareholder base and raise capital beyond local markets (Domowitz et al, 1998; Lee, 1998; Licht, 1998; Pagano et al, 2001), such implicit mergers1 are preferred by investors as an alternative to multiple listings across markets and exchanges prefer this type of deal, which allows them to avoid direct competition from stronger markets and the fragmentation of liquidity. This type of arrangement is likely to develop a competitive environment, where the most efficient exchanges will eventually win the confidence of investors, traders and companies (Cybo-Ottone et al, 2000). The emergence of these types of consolidation provides a common trading platform among exchanges who are willing to open up to each others� markets for cross listing and trading purposes with ample freedom for brokers and traders to operate across markets. Network arrangements will help in gaining new demand for exchange products and are also likely to bring efficiency gains through economies of scale (Economides 1995; Hasan and Malkamäki, 2001). Hagel III-Armstrong (1997), and Saloner and Shepard (1995) emphasize the role of critical mass and time dimensions in evaluating the true impact of network scope. Shapiro and Varian (1999) point out that computer technology, ie networks, will dominate the trading business. Networks will provide investors with options to choose from alternative preferences. The recent success of EUREX is a good example of how networks can
1 A definition also used by Di Noia (2001) and Domowitz (1995) for equity and derivative markets respectively.

181
replace a trading floor in another country.2 European exchanges, historically local monopolies, are the most active players in adopting such a network or common trading platform. Taking their cue from NASDAQ�s proposed and partially implemented global plan to list and trade across markets, the European exchanges have taken the lead in forming and joining in active network cooperation among European markets. In fact, the majority of the 100 executed or potential merger-related deals in the world are in Europe (Cybo-Ottone et al, 2000). Today, there are four inter-exchange cooperation models that link security markets within and outside European boundaries (Figure 2.1). While the finance literature is abundant in introducing and describing the potential benefits of network arrangements in terms of increased participation, liquidity, efficiency, and transaction costs, no article discusses the potential consequences or impact of adopting such network cooperation. Cybo-Ottone et al (2000) provide the first descriptive approach to understanding mergers and cooperation across exchanges; however, their study was focused primarily on the factors associated with consolidation efforts. A separate volume of papers focused on the motives as well as on the consequences of cross-border listings and cross-listed stocks (Blass and Yafeh, 2001; Chaplinsky and Ramchand, 2000; Foerster and Karolyi, 1998; Karolyi, 1998; Pagano et al, 2002). These papers, however, are more focused on the motivations and consequences among the companies rather than on the impact of cross listings on markets. Importantly, for our purpose, none of the papers deals with issues associated with networks or implicit mergers. In this paper, we attempt to fill this gap in the literature not only by introducing details on the landscape of network cooperation among exchanges in Europe, but also by showing the potential impact of such inter-exchange cooperative initiatives on the performance, growth, and turnover of the sample exchanges. Additionally, we present evidence on the consequences of adopting such network cooperation for the cost of trading, investors, and for the cost of operations to the
2 An additional example is the emergence of network externalities especially in the United States, where there has been a huge invasion of new equity routing/matching/trading systems, eg, Instinet, POSIT, AZ, and Attain etc. These systems have gained increasing volume, especially in stocks listed on NASDAQ as well as many NYSE-listed stocks. This situation has opened increased pressure and possibilities for exchanges to cooperate and compete for market share.

182
stock exchanges.3 Our evidence shows that even after controlling for pertinent variables, the network cooperation decision, represented by several alternative network proxy variables, is significantly associated with stock exchange market capitalisation, its growth, as well as its efficiency. Moreover, network strategy apparently helps markets in lowering transaction costs of trades as well as operational costs for stock exchanges. The paper is organised as follows: Section 2 introduces networks, alliances, and cooperation among European stock exchanges followed by a brief literature review in Section 3. Section 4 introduces the data and descriptive statistics. Section 5 reports the results and the conclusions are presented in Section 6.
3 Arnold et al (1999), Domowitz and Steil (1999), and Pirrong (1999) stress the importance of assuming that exchanges are actually operative firms and argue that the industrial structure of market places cannot be explained by focusing on the demand side alone, as in financial market microstructure studies that concentrate on the characteristics of trading systems and the demand side of trading services, ie the traders. It is equally important to know more about the provision of alternative technologies for trading services.

183
2 Networks, alliances, and cooperation among European stock exchanges
Evidence for the presence of network externalities is starting to develop in various ways and can be seen in various types of international alliances and cooperative arrangements between exchanges, although not all announced initiatives and attempts to foster cross-border links among stock exchanges have been completed. The overall goal is to provide investors the opportunity to trade shares of globally listed firms on a continuous 24/7 basis at the lowest possible cost of trading. In this scenario, the implications of electronic trading play a pivotal role and are far-reaching for the entire securities industry. However, in financial exchange markets, the innovation and implementation of new electronic trading technologies varies considerably by geography, culture, and the organizational structure of the exchanges, which have been undergoing enormous transitions in recent years (Chapter 3). For example, there is evidence that North American stock exchanges operate most efficiently in order to serve the best interests of the marketplace, and in particular those of investors. However, Europe has been much quicker and ambitious to respond to the rise of electronic trading by adopting it and creating several cooperative market linkages between stock and derivative exchanges (Chapters 2 and 4). Amongst the anticipated benefits of cooperative projects and strategic alliances among exchanges were that they would give exchanges the opportunity to gain advantage over their competitors, mostly by extending trading hours, allowing for remote membership, modifying prices, and thereby lowering costs. It is crucial for the success of networked electronic trading platforms that increasing efficiency, transparency, faster executions, and lowering costs can attract a critical mass of order-flows and generate additional liquidity to the market. The liquidity effect, in turn, is determined by the scope and size of the network requiring compatible trading technologies.

Figu
re 2
.1
N
etw
ork
of E
urop
ean
stoc
k an
d de
riva
tive
exch
ange
s
So
urce
: Aut
hors
ow
n gr
aphi
cal i
llust
ratio
n. E
x po
st, a
n al
tern
ativ
e di
agra
mm
atic
repr
esen
tatio
n of
the
linku
ps a
nd a
llian
ces b
etw
een
Euro
pean
cas
h an
d de
rivat
ive
mar
kets
bec
ame
avai
labl
e an
d is
dow
nloa
dabl
e at
ww
w.fe
se.o
rg.

185
A range of the most recent market linkages and cooperative initiatives proposed and undertaken by various stock exchanges deserves particular attention in this section. The analysis of inter-exchange connection schemes focuses on European projects as well as on US and other global order-routing linkages. A good survey of historical deals among stock exchanges illustrating various aspects of cooperation is presented in a number of studies, including the work of Cybo-Ottone et al (2000), Domowitz (1995), Domowitz and Steil (1999), Lee (1998), and Licht (1998). Figure 2.1 illustrates the architecture of market linkages and cooperation proposed and undertaken by various stock and derivative exchanges, forming a complex and networked European securities trading landscape.4 Tracing back the development of these linkages, it can be observed that a large number of deals among exchanges were only quite recent phenomena, which have been mostly negotiated between 1997�2002. It seems evident that financial exchanges use different means of coping with investor demands for lower trading costs, improved liquidity and immediate access to international trading. However, some structural patterns can be derived as to how European stock exchanges create inter-connections between cooperating exchanges. Consistent with a recent OECD study (2001), four different models of inter-exchange co-operation can be identified in Figure 2.1. The first strategy has been promoted by NASDAQ. The basic idea is to establish branches with local partners using a common technology in order to have access to regional markets while retaining regional commercial and regulatory characteristics. Prominent examples are NASDAQ Europe, NASDAQ Canada, and NASDAQ Japan. NASDAQ Europe, a re-launch of Easdaq, has established the European hub of a global market and has created a basis for further integration with other national and regional European markets. However, it seems crucial for the successful realization of NASDAQ�s global strategy to establish a robust trading and listing presence, thereby building up inter-connected trading hubs for a world-wide electronic marketplace. Rival interest in setting up a European-based network of growth company markets has been expressed by EURO.NM. In the wave of the founding of new markets on a national basis, the Paris Bourse and the Belgian Bourse de Bruxelles initiated the creation of a similar 4 Ex post, an alternative diagrammatic representation of the linkups and alliances between European cash and derivative markets became available and is downloadable at www.fese.org.

186
European-wide networked market to facilitate and encourage cross-border cooperation. Since 1999, five new market exchanges have belonged to the European network of high growth and young companies, which includes Neuer Markt (Germany), Nouveau Marché (France), Nieuwe Markt (The Netherlands), and the Nuovo Mercato (Italy). Among other objectives regarding common international marketing and promotional activities, EURO.NM attempts to harmonize market rules in respect of listing and disclosure requirements as well as trading procedures. It further seeks to establish connections between markets in order to simplify joint trading and common data dissemination. It is also intended that EURO.NM represent an institutionalised body in order to articulate the shared and common interests of its members to European authorities and other non-European entities. Concerning its future prospects, it remains to be seen if EURO.NM or its members can successfully pursue such a concept and were able to differentiate themselves from other potential competitors, eg NASDAQ Europe. Similarly, other trading service providers launched common efforts to create a pan-European market. As of June 2001, Virt-x, a collaboration of the SWX Swiss Exchange and the UK Tradepoint Financial Networks plc, started trading all major pan-European blue-chip equities that are included in major indices. It is stated by its founders that Virt-x was designed in order to respond to the market demand for an efficient and cost-effective pan-European blue chip exchange created to support increasing cross-border trading in European blue chips. The virt-x market is based on an integrated trading, clearing and settlement model aimed at facilitating the process of trading and significantly reducing the costs associated with cross-border trading. A crucial question for the success of virt-x is whether it can benefit from first mover advantage in developing critical mass in the rapidly expanding cross-border European securities markets. A second type includes mergers among exchanges. In legal terms, an explicit merger is defined as a transaction that leads to the creation of a new entity incorporating the two or more merging entities (Lee 1998). Here the purpose is to achieve actively economies of scale by concentrating trading on one stock exchange with a common trading system. Examples of such initiatives include the recent merger of the Paris, Brussels, and Amsterdam exchanges under the name Euronext N.V. in September 2000, thus becoming the first pan-European exchange, or the ill-fated London Stock Exchange and Deutsche Börse merger attempt. As of the end of 2001, 1539 firms were listed on Euronext regulated markets representing a market capitalisation of almost USD 2 trillion US$.

187
Only recently, other European exchanges joined or signed cross-membership and cross-access agreements with Euronext N.V. on cash and derivative trading. In February 2002, the Portuguese exchange, BVLP � Bolsa de Valores de Lisboa e Porto, formed through the restructuring of the former Lisbon Stock Exchange Association and the Porto Derivative Exchange Association, joined Euronext after all its shareholders unanimously accepted Euronext�s merger offer. Following the merger, BVLP shareholders became shareholders of Euronext N.V. and BVLP. This wholly owned subsidiary of Euronext N.V. has been renamed Euronext Lisbon in a similar way to Euronext Paris, Euronext Amsterdam and Euronext Brussels. As a result of the merger, Euronext aims to offer improved services to investors, intermediaries and issuers, gain access to an additional market and distribution network, increase its scale, extend the use of its trading and clearing systems, as well as to reinforce its position in the European exchange sector. In particular, Euronext�s unified cash trading platform, NSC, and its market model, both already implemented in France, Belgium, and in the Netherlands in the course of 2001, is also intended to be implemented in Portugal, ensuring Euronext members equal access to all financial instruments traded on these markets. Excluding ownership arrangements, both the Helsinki Stock Exchange (HEX) and the Warsaw Stock Exchange (WSE) agreed on cross-membership and cross-trading with Euronext N.V. While the cross-membership agreement is designed to develop exchange member trading activities, the cross-access agreement provides the technical solutions for these members to trade from their actual locations on HEX, WSE and Euronext cash markets. At a technical level, HEX and WSE members are intended to have access to the trading of all Euronext cash products via the unified access architecture of NSC through remote membership links. HEX will establish an access point in Euronext, which offers cost effective access for Euronext members to the Finnish securities market. The technical implementation is scheduled to be completed by the end of 2002 and in 2004 for the HEX and the WSE respectively. Already in 1992 the WSE and the Paris exchange established a close relationship, as the Paris exchange accompanied WSE in the automation of its trading, which it adopted the French NSC trading system. A third strategy is the attempted hostile take-over bid pursued by the Swedish-based OM Group for the London Stock Exchange. Similar to the iX merger, the OM bid finally failed in the autumn of 2000, mainly due to a mixture of regulatory uncertainty, technological nationalism, and skepticism among politicians and small shareholders of the London Stock Exchange. At the same time, another exchange

188
concept, called Jiway, was launched initially as a joint venture of the OM Group and Morgan Stanley Dean Witter, who had a 60/40% share respectively. Changing the capital structure effective as of October 2001, OM became the sole owner of the Jiway exchange. Jiway is Europe�s first integrated stock exchange for retail investors. Private investors are allowed to directly connect to the Jiway electronic trading platform and to have access to more than 6,000 U.S. and European shares. Finally, a fourth design of exchange cooperation is portrayed by the New York Stock Exchange. This attempt seeks to interconnect leading equity exchanges in a Global Equity Market (GEM) by means of a common electronic interface. The GEM project is chaired by the New York Stock Exchange and the participant exchanges comprise the Australian Stock Exchange, Euronext, the Hong Kong Exchanges and Clearing, the Bolsa Mexicana de Valores, the Bolsa de Valores de Sao Paulo, the Tokyo Stock Exchange, and the Toronto Stock Exchange. Its stated aim is to provide its customers with a transparent 24/7 trading mechanism for the world�s blue chip equities, thereby improving global liquidity and achieving better global price discovery. Transactions on the GEM should be channelled through the respective local stock exchange while creating a single global pool of liquidity. Similarly, an example of regional strategic cooperation can be found in the alliance among the Nordic securities exchanges under the name NOREX, comprising initially the Copenhagen Stock Exchange and Stockholmsbörsen in 1998. Later in 2000, both the Iceland Stock Exchange and Oslo Börs became partners of the NOREX Alliance. The NOREX Alliance envisions implementing a joint cost-efficient marketplace for financial instruments and harmonizing requirements among the exchanges with respect to trading and membership. To pursue these objectives, the NOREX project follows four strategic principles: cross-membership; a single point of liquidity; a common trading system; and a common regulatory framework. Cross-membership foresees member firms joining all the NOREX exchanges, thereby increasing liquidity and strengthening the Nordic securities market. The single point of liquidity principle requires firms to list their shares on only one NOREX exchange, ensuring that liquidity in the listed firms is concentrated in one market, which contributes to fair price setting. The NOREX partners agreed on a common trading system enabling the exchanges to share technological innovation and establishment costs and to create synergies of costs, which in turn may translate into reduced member fees. In addition, the NOREX exchanges adopted the electronic trading system SAXESS, which was developed by Swedish OM Technology. SAXESS is an

189
order-based system in which orders are automatically matched to a trade when price and volume match. The trading is decentralized, which means that member firms are connected to the system and trade from their home offices irrespective of their geographical location. Concerning the common regulatory framework, it is envisaged not only to harmonize trading rules and membership requirements as well as the training and authorization of brokers in the member countries of the Nordic alliance, but also the listing requirements for companies in order to make it easier for the investor to evaluate the companies on the different NOREX markets. In derivative markets, Globex Alliance and Eurex have already pooled trading activities in a de facto interconnected single electronic trading platform. Globex Alliance, as a world global electronic trading system, offers remote trading access to its interconnected member exchanges. Under the Globex Alliance, participants in the Chicago Mercantile Exchange (CME), Euronext (formerly ParisBourse), Singapore Exchange Derivatives Trading (SGX), Brazil�s Bolsa de Mercadorias & Futuros (BM&F), Spain�s MEFF, and the Bourse de Montréal benefit from remote access to all the Alliance markets through a single electronic trading system. The Eurex exchange was jointly launched by the German Deutsche Börse AG and the Swiss Exchange through the merger of the formerly DTB Deutsche Terminbörse und SOFFEX (Swiss Options and Financial Futures Exchange) in 1996. Eurex provides direct electronic access to a wide range of derivative products. In contrast, LIFFE continued running a floor-based market until the late 1990s. However, by the second half of the decade technological advances started dramatically reshaping the derivative market. As customers began to gravitate towards electronic markets at a much lower cost base, LIFFE were no longer able to operate a competitively floor-based market for financial products. In 1998, LIFFE�s market share of trading German Government Bond futures and options contracts rapidly fell from 70% to zero, as traders shifted all their orders in the Bund contracts to Eurex, which was able to provide London-based customers with remote access facilities through its screen-based trading platform. As a result, the rapid emergence of Eurex relative to UK based LIFFE affirms that cost efficiency and the importance of network economics play a dominant role in the efficient microstructure of trading systems. Since the beginning of 2002 LIFFE has joined the Euronext Group and represents the derivative business of Euronext. The combination of Euronext and LIFFE�s derivative operations is mainly designed to achieve economies of scale and scope by providing customers, through a single trading platform, access to a deep market with a wide

190
range of complementary products. All of the combined entity�s derivatives businesses are to be transacted on the LIFFE CONNECTTM system, LIFFE in-house electronic trading platform developed only recently, offering market participants remote trading access. In this way greater distribution as a result of the access of Euronext�s members to LIFFE CONNECTTM is aimed at increasing the quality of the market by improving liquidity and price information. Different projects and strategies of collaborative arrangements among European stock exchanges were described in this section. Although some of the surveyed deals among stock exchanges have failed or were abandoned, it seems apparent that Europe is increasingly a favourable environment in which stock exchanges pursue cooperative strategies in order to build up networked markets and create additional value in the provision of their trading services. The views expressed in the literature are rather mixed in respect of the advantages and success of network-creating activities in the stock exchange industry. For example, some authors assess sceptically the prospects of a networked stock exchange organization in Europe (Licht, 1998; Steil, 1996). Their hypothesis centres chiefly on the argument that a strategy of enhancing competition is more likely to foster stock market integration than the networking model. Others, such as Cybo-Ottone et al (2000), and Di Noia (2001), emphasize the positive effects of competition and integration among stock exchanges in Europe through network effects and implicit mergers. Addressing these controversial statements in this research field, the following section analyses empirically the implications of network externalities for liquidity, trading costs, and growth in securities markets in Europe.

191
3 Recent literature on network externalities and stock exchanges
The concept of network externalities is developed in the New Theory of Industrial Organization and represents an important field in economics, as it applies to a variety of industries, such as telecommunications, airlines, railroads etc. Shy (2001) presents an array of topics in network economics focusing on strategic interactions that network activity creates between firms and its impact on consumers� choices of products and services.5 A network externality can be defined as a production or consumption positive size externality. Formally, networks consist of links that connect nodes. In a typical network, the addition of a new consumer (or network node) increases the willingness to pay for network services among all participants. This effect is called network effects or network externalities. Several authors apply the concept of networks to financial intermediation and securities markets. Regarding a financial exchange network, Domowitz (1995) and Domowitz and Steil (1999) state that an exchange or a trading system is analogous to a communication network, as the benefit to one trader transacting in a given trading system increases when another trader chooses to transact there as well. Economides (1996) points out that there are two ways in which financial exchange networks exhibit network externalities. First, the act of matching buys and sells for goods or assets generates a composite good, namely the exchange transaction. It is important that a critical mass of counteroffers is available. In financial terms, minimal liquidity is required for the transaction to occur. Second, network effects may also stem from different vertically related services necessary for a financial transaction, ie the matching services of brokers. However, the first type of externality seems to be more pronounced in financial markets. Positive size externality is an essential property of financial market networks in the sense that the expected utility for all network participants positively depends on the thickness of the exchange market. Economides and Siow (1988) show that liquidity considerations limit the number of markets in a competitive economy.
5 An interactive bibliography on the network-externalities literature and related issues applied to finance can be found online at http://www.stern.nyu.edu/networks/biblio.html.

192
In their spatial competition model with liquidity as a positive externality, there may be too few markets because nobody wants to use a new market with low liquidity. Later, Economides (1993) argued that networks (such as electronic trading systems) are by their nature self-reinforcing. As a consequence, networks exhibit positive critical mass. A second consequence is that optimality will not result from perfect competition. According to Economides, this opens up the possibility that some market structures (such as monopolies), which can co-ordinate expectations, might achieve larger networks and higher welfare than would perfect competition. Network providers have market power through the setting of standards for the network. Stock exchanges usually set rules and regulations for their trading systems. This, according to Economides, impedes technological innovation. He argues that equilibrium price information from a financial exchange network is another externality, in addition to market liquidity. A concern here stems from the observation that exchanges other than the NYSE are actually cream skimming, as some of them concentrate on trades that take advantage of price discovery in the NYSE. It is also seen that realized bid-ask spreads are higher for shares that are subject to cream skimming. Thus the validity of the NYSE market price seems to be reduced as customers (brokers) switch to alternative networks. The problem of course is that this is not necessarily in the interest of end investors, as the spreads are wider and the quality of the market price worse. A solution suggested by Economides is to price market equilibrium information appropriately. This question relates to legislation and interim rules and regulations as well as the microstructure of trading systems of stock exchanges and specifically those of alliances. Liquidity plays a pivotal role in financial exchange markets where order-flow attracts order-flow. According to research of Economides (1993) and Economides and Siow (1988), the spatial consolidation of markets tends to increase liquidity. Subsequent proposals by Economides and Schwartz (1995a) advocate the introduction of electronic calls and discuss, from the perspectives of investors, listed companies, exchanges, brokers, and regulators, the advantages of this innovation in respect to enhancing liquidity, order handling, information revelation, market transparency, market anonymity, and avoidance of free-riding. Similarly, Economides (1995) argues that call markets provide coordination of many transactions in the time dimension, and thus increase liquidity and reduce transaction costs for public participants. In sum, call markets bear higher liquidity because they take advantage of network externalities.

193
From a similar perspective concerning the design of electronic markets, Gode and Sunder (2000) claim that technological constraints create a conflict between achieving simultaneously a continuous market mechanism with a geographically dispersed trader population on the one hand and ensuring equal market access on the other. To provide equal access more easily, the authors argue in favour of electronic global exchanges that should ideally be call markets with more frequent calls, such that they are close to continuous markets. Given the importance of liquidity for traders and their risk aversion, traders have an incentive to delay the placement of an order in a call market, thereby benefiting from the closeness of the time of the order to participate in the call market and benefiting from the committed level of liquidity at this point in time. When traders wait until the last moment, there is significant uncertainty in the number of traders participating at the call. Economides and Heisler (1994) discuss how to increase liquidity at the call. They envision a proprietary electronic call market with a time-dependent commission schedule offering discounts in trading costs to traders who commit to early participation in the market. In general, it is believed that market participants seek immediate execution of their transactions. Economides and Schwartz (1995b) investigated the demand for immediacy of order execution in a questionnaire sent to major equity traders. The principal finding is that the majority of traders would opt for a delay in trade if this decreased execution costs. Alternative electronic trading systems are generally seen as attractive alternatives in respect to reduced market impact, lower spreads, better liquidity, and anonymity. Complementarity, compatibility, and standards are other important characteristics that are inherent in many networks (Farrell and Saloner, 1986; Katz and Shapiro, 1985, 1986). On the technical side of network industries, compatibility is an essential element in the market structure for network goods. Regarding the choice of a technical standard, Economides and Flyer (1998) analyse the tradeoffs that firms are facing in competitive markets where network externalities are present. In their model, they contrast the conflicting benefits arising from adhering to a leading compatibility standard versus the advantages of adopting unique standards associated with less intra-platform competition, but also with less added value by a large network. As a result, the authors state that market equilibria often show extreme asymmetries in firms� profits and output, while using the same production technologies. The authors relate this finding to the fact that often only one or very few firms dominate network industries. For example, the success of Eurex relative to the

194
UK-based London International Financial Futures Exchange (LIFFE) may be partly explained by differences in the technical compatibility standards of these exchanges. In a game-theoretic framework, Di Noia (2001) addresses the possible effects of cross-network externalities on competition and consolidation in the European stock exchange industry. It is demonstrated that competition may lead to inefficient equilibria, while implicit mergers among exchanges together with remote access may have a Pareto optimal outcome and may result in higher profitability for exchanges and consumers. The model suggests that implicit mergers and remote access can be helpful for specializing in listing or trading services. The recent success of automated trading systems supports this finding, as they achieve unilaterally compatibility by trading stocks listed on other exchanges, given their strong cost advantage. Analysing market implications of alliances among stock exchanges, Shy and Tarkka (2001) establish that alliances are very likely to improve total welfare as well as to increase profits for stock exchanges, depending most importantly on the exchanges� ability to reduce the costs of foreign share purchases. In turn, brokers or investors were not seen to benefit from the creation of exchange alliances, irrespective of improved social welfare. As a result, the authors anticipate the possibility of the amalgamation of brokerage and stock exchange functions in the near future. Cybo-Ottone et al (2000) analyse selected types of deals among stock exchanges over time according to legal structure, technical integration, status, location, and area. However, they do not study empirically network and cross-network effects among stock exchanges. Madhavan (2000) and Sirri (2000) explore how technological progress and the process of regulatory arbitrage shape modern equity markets and enable new venues for trade. As a result of these factors, market fragmentation associated with diminished liquidity and higher intra-day volatility seems to pose a major challenge for central regulators and policy makers as they in turn aim to promote competition and encourage innovation. Likewise, alternative trading venues also alter the competitive norms of brokers traditionally being exchanges� customers. Strong network externalities force exchange markets to create formal or informal linkages. The exact design of such inter-connections is less important. They are likely to occur in the form of implicit and explicit acquisitions and mergers, strategic alliances, simply pooling order-flows, or even information sharing agreements

195
as discussed in Domowitz and Steil (1999). Financial exchanges that are less active in forming alliances or linkages are likely to lose competitive ground vis-à-vis their counterparts engaging in network strategies. The existing literature on networks that relates to stock exchanges or to financial intermediaries is theoretical or descriptive in nature. We are not aware of any empirical literature particularly dealing with network economics among the exchanges. A number of articles � as mentioned earlier � focused on the impact of cross-listing across exchanges and evaluated its impact on stock prices6 Additionally, Cybo-Ottone et al (2000) outlined the merger of exchanges during the 1990s; however, they did not investigate any likely association between networks or implicit mergers with different elements of exchange-specific firm performance, volatility, and efficiency. Thus, there is an obvious need for empirical research in this area. This study attempts to fill this gap.
6 See Blass and Yafeh (2001); Chaplinsky and Ramchand (2000); Foerster and Karolyi (1993); Karolyi (1998), and Pagano et al (2002).

196
4 Data and methodology Our empirical approach in this paper is to trace the potential relationship between network variable(s) and several measures of exchange performance and efficiency. These performance and efficiency measures include market capitalisation, the growth of market capitalisation, turnover velocity, the transaction costs of trading and the operating costs of the respective exchanges. The estimations control for other pertinent variables that are likely to affect stock exchange performance and efficiency, such as the local economic environment, the relative importance of the private sector, accounting or disclosure standards, market monopoly by the largest firms, the costs of trading, market competition and size. The data used in this study come from a variety of sources, including annual reports of stock exchanges (Annual Reports, 1996�2000), various issues of the International Federation of Stock Exchanges (FIBV), International Monetary Fund (IMF) International Financial Statistics (IFS), Elkins/McSherry (1995�2001), and information from exchange Internet sites. Most of the data were collected from annual balance sheets, income statement reports, and the Internet pages of all major operating stock and derivative exchanges covering a 5-year time period including annual reports of stock exchanges (Annual Reports, 1996�2000). In some cases, additional information was obtained from the exchanges through correspondence. Also various issues of the MSCI Handbook (MSCI, 1995�2000) served as an important source of information on exchange-specific characteristics, such as the concentration of market share of the top three companies in each market (a proxy for market monopoly by largest firms) as well as the number of additional exchanges in the country (market competition) where the sample exchange is located. Although reporting schemes and the information content of the financial accounts vary across time and exchange, a consistent data set has been constructed including all necessary information on 24 individual exchanges� key balance sheet and income statement items, of which 120 observations over the period 1996�2000 finally entered into the estimations. All national currencies are converted into USD and are inflation-adjusted using data from IFS. All variables other

197
than qualitative proxies are expressed in natural logarithms.7,8 The accounting or disclosure standard is constructed by using the CIFAR index to measure the quality of accounting disclosure, a method used previously by researchers. The CIFAR index used in the existing literature represents the average number of 90 specific items disclosed in the annual reports of at least three companies per country, including items from the company�s income statement, balance sheet, statement of cashflows and notes to the financial statements (CIFAR, 1995). The maximum score a country can obtain is 90.9 In order to examine network effects among stock exchanges, a data set has been compiled including all major inter-market connections along different types of exchange markets in the European Union. Since networks among exchanges is more frequent and plays an important role in European markets, we focus in this study on EU linkages. Accordingly, the network linkages in our data set include two or more entities where at least one entity is a European exchange. Figure 2.1 portrays all strategic cooperation, network experiences, and announcements among European stock and derivative exchanges by the year 2002. Building on this diagram, we traced back the development of each network to its year of implementation and establishment. The experience of European exchanges from the mid-1990s to 2002 shows that network strategies are only quite recent phenomena. The total number of such linkages considerably increased after 1997/98. A classification of network linkages has been made according to different market categories in order to control for compatibility among different types of networks. This is in particular important since stock exchanges are engaged in multiple transaction and trading services in various stock and derivative markets. As already mentioned in Cybo-Ottone et al (2000), the classification of networks is not a straightforward exercise, given only limited access to information and details in respect of announcements, implementation status and network members. Against this background, the underlying categorisation in this paper may, however, slightly differ from schemes employed in related studies or official views stated by the exchanges themselves. Different NETWORK variables were constructed in order to examine network externalities in financial exchange markets. The first variable included in this study controls whether an exchange generally 7 In constructing the growth variable, we have also used 1995 data. 8 See Schmiedel (2001) for more details on the European sample exchanges. 9 LaPorta et al (1997, 1998) have used this source to identify the accounting standard.

198
pursues any kind of network strategy. If an exchange is engaged in networks and maintains/offers network access the variable ACCESS takes a value of one, otherwise zero. Secondly and more specifically, the total number of different types of networks, NDN, captures the fact that exchanges build-up various connections with varying network partners. Therefore, the variable NDN proxies the overall network activity of such exchanges that have successfully established different and not necessarily fully compatible network connections with other participating exchanges. Based on the theoretical considerations proposed in Section Two, however, the value of a network increases exponentially with each new participant that enters the network. Accordingly, the third variable, NNM, accounts for all members that are connected via each market�s network. Furthermore, a key factor for analysing these networks is to distinguish them along different types of securities segments. In respect to the total number of stock exchanges linked through networks, these market interconnections were classified along three criteria: blue chip equity markets, derivative markets, and new markets for innovative and mostly high-tech oriented companies. Equity markets account for inter-linkages and cooperation among exchanges that were established primarily for trading in all major blue chips. Derivative markets capture networked trading platforms for options and financial futures, while new growth and tech-oriented markets comprise interconnections of markets with newly listed high-growth and innovative-oriented firms. Figure 2.1 plots all major established network connections of European exchanges by 2002 classified according to the criteria discussed above. Transaction costs data for each European exchange market come from Elkins/McSherry (E/M) Universe. This is a rolling four quarter compilation of data comprising current and historical information on 700 global managers and 800 global brokers, containing average commissions, fees, market impact and stock price information from 208 exchanges in 42 countries. Although an assessment of the quality of trading is beyond the scope of this trade execution data, it, however, enables a comparison of commissions, fees, and market impact to a universe of costs in different countries. The E/M system calculates the cost of trade execution on the basis of the volume weighted average price and the spreads of the stocks.10 The E/M data contains all time of each trade including the high, low,
10 Consult http://www.elkins-mcsherry.com/edata.html for an example of volume weighted average price and spread calculations.

199
open and close, volume traded, volume weighted average price and average spread. The market impact, being considered as a major cost component of the transaction cost, is calculated by E/M as the difference between the trade execution price and the average price (high, low, open, and close) for every stock in 42 countries daily. Commissions, fees and market impact costs are compared to the average institutional costs in each country and then broken down by portfolio manager, account, client and broker. Finally, the summary costs for each institution enter into the E/M Universe of average costs. The total trading cost is measured in basis points representing the average sum of commission, fees and market impact based on trade data on all global trades executed by large institutional investors in a given market. Following the FIBV statistics, turnover velocity controls for the quality of each particular market. The velocity of an exchange is computed as the annualised ratio of the monthly average turnover of domestic shares to their month-end market capitalisation. Finally, macroeconomic information such as GDP per capita, and concentration of private sectors is taken from the IFS data bank. As mentioned earlier, the estimation model in this paper investigates the potential relationship between the NETWORK variable(s) and exchange PERFORMANCE and EFFICIENCY measures as portrayed by equations 4.1 and 4.2. As evident, we employ a series of ordinary least squared regressions to capture these potential relations. First, we investigate the relationship with a number of simple single variable regressions (4.1), later followed by multivariate estimations (4.2) incorporating other control variables that are pertinent to the exchange performance measures. Market capitalisation (MKTCAP), the growth of market capitalisation (GMKTCAP), turnover velocity (TURNOVER), the transaction costs of trading (TCOSTR), and operating costs (OPCOST) are used as proxies for the dependent variables.
itit0itit NETWORK)EFFICIENCY( EPERFORMANC ε++α= (4.1)
∑ ε++
++α=
itit
it0itit
VARIABLES CONTROLNETWORK)EFFICIENCY( EPERFORMANC
(4.2)
The NETWORK variable is represented by alternative variables. The first three estimates are based on the variables that trace (1) ACCESS; (2) NDN, and (3) NNM respectively. The next three regressions follow a detailed definition of the NETWORK variable NNM.

200
Accordingly, it considers the total number of other exchanges linked with an individual exchange via an (4) Equity or Blue Chip Network (ENNM), (5) a Technology or Growth Network (TNNM), or (6) Derivative Network links (DNNM). Although our interest is primarily focused on the first four estimates, it is however interesting and informative, when detailed information is available, to investigate the relative importance of specific types of network or impact in connecting with other exchanges. Control variables considered are: GDP per capita in the country where the exchange is located (local economic environment); total Private Sector Accumulation to GDP ratio (relative importance of private sector); Disclosure Index (accounting or disclosure standards in CIFAR); Concentration of Ownership by the top three firms in the Exchange, (extent of influence of larger firms in the exchange); Transaction Cost (cost of trading); Number of Exchanges within the Domestic Borders (competition in the exchange business); and Market Capitalisation (market size). These control variables are selectively added to each regression, given what is considered as exchange performance (dependent variable) in a particular estimation, and are consistent with the relevant literature.11
11 GDP Per Capita and Private Sector Accumulation to GDP ratio are taken from International Financial Statistics and are adjusted for inflation and converted into US dollars. Concentration of Ownership, and Number of Exchanges are taken from the MSCI Handbook; Disclosure Index has been taken from La Porta et al (1997) and cross-checked with the CIFAR Index; Transaction Cost, which is used as a dependent variable in some estimates and as an independent variable in others, is from Elkins-McSherry. As mentioned in the text, the Network variable is constructed by tracing the developments of stock exchanges over the sample period from different public information sources and on some occasions by writing to the exchanges directly. Additionally, the dependent variables, Market Capitalisation, Growth of Market Capitalisation, and Turnover Velocity are taken from the FIBV and the Operating Cost (OPCOST) comes from the annual reports of respective exchanges during the sample period.

201
5 Empirical evidence Table 5.1 provides the names and a number of key statistics for each of the sample exchanges. These statistics include average market capitalization, turnover velocity, transaction cost of trading and the extent of their involvement in exchange networks during the sample years. It reveals that the exchanges are of different sizes of market capitalisation. An interesting observation in this respect is that the turnover, transaction costs, and network involvement are not necessarily always proportional to size. Many smaller exchanges report higher turnover, lower transaction costs, and higher involvement in network cooperation. Table 5.2a follows with mean, standard deviation and the range of key variables of the overall sample. The Riga exchange of Latvia has the smallest market with a market capitalization of USD 289 million, while the London stock exchange represents the largest market of USD 2,474,579 million in a given sample year respectively. On average the markets are growing at a rate of almost 29% with a varied range of turnover velocity. The transaction costs range from as low as 23.80 (Paris exchange) to as high as 161.01 (Czech Republic) in a given sample year. The maximum number of network links available to exchanges in Europe is four and the total number of stock exchanges linked through networks as high as 19 exchanges. These sample exchanges are from countries with a wide range of GDP per capita, private sector involvements and accounting standards. A more detailed analysis of the network variable(s) and some of their components is shown in Table 5.2b. It reports the extent of network links by different types of networks, ie Derivative Network. The correlation coefficient of all key variables used in this paper is shown in Table 5.3. In summary, the relationships between these variables are consistent with expected magnitudes and significance. However high correlation coefficients between NETWORK variables (ACCESS, NDN, NNP, and NNM) suggest that any estimate that incorporates all of the above Network variables in the same regression would suffer from severe multicollinearity problems.

202
Table 5.1 Sample European capital markets, 1996�2000
Name and Country of the Exchange
Market Capitalisation (Thousands of
USD)
Turnover-Velocity
in the Market
Trans-action Cost of Trading
Extent of Network Involve-
ment
Number of Total Stock Exchanges
linked through Network
Amsterdam � Netherlands 611,881,123 63.91 32.61 0.80 3.20 Athens � Greece 100,011,452 76.96 77.25 0 0 Brussels � Belgium 191,121,752 23.76 35.12 0.80 3.20 Copenhagen � Denmark 101,466,314 57.28 39.64 0.40 1.20 Frankfurt � Germany 1203,214,712 123.75 32.11 1.40 4.80 Helsinki � Finland 214,126,751 48.81 41.90 0.40 1.60 Dublin � Ireland 64,142,512 54.38 104.51 0 0 Istanbul � Turkey 57,286,049 140.73 60.08 0 0 Lisbon � Portugal 53,276,152 56.03 52.44 0.60 4.80 Ljubljana � Slovenia 2,126,019 34.70 n.a. 0 0 London � UK 1924,869,663 47.56 72.61 1 2 Luxembourg � Luxembourg 40,568,432 2.91 82.82 0 0 Madrid � Spain 375,954,841 155.66 42.73 0.60 4.80 Oslo � Norway 62,907,938 77.51 38.21 0.20 0.80 Paris � France 1140,873,128 60.11 29.04 1.40 8.00 Stockholm � Sweden 334,893,180 70.90 32.52 0.40 1.20 Zurich � Switzerland 715,898,118 78.31 38.33 0.60 2.00 Vienna � Austria 39,866,283 38.20 43.99 0.20 0.40 Warsaw � Poland 17,347,631 61.35 n.a. 0 0 Budapest � Hungary 11,140,044 n.a. 104.65 0 0 Reykjavik � Iceland 2,829,086 n.a. n.a. 0 0.80 Malta � Malta 1,010,668 n.a. n.a. 0 0 Prague � Czech Republic 10,829568 n.a. 111.99 0 0 Riga � Latvia 225,421 n.a. n.a. 0 0

203
Table 5.2a Descriptive statistics Variables / Ratios Mean Standard
Deviation Minimum Maximum
Market Capitalisation (thousands of USD) 366,006,527 588,957,820 289,125 2474,579,290 Market Capitalisation Growth 48.681 130.016 32.047 238.435 Turnover � Velocity 62.84 45.81 5 196 Transaction Cost of Trading (average fee) 54.55 28.98 23.803 161.005 Operation Cost of the Stock Exchange (thousands of USD) 80,421 136,147 706 721,074 Access to Network (Yes/No) 0.458 0.500 0 1 Extent of Network Involvement 0.591 0.770 0 4 Total Number of Stock Exchanges Linked through Network 2.285 3.636 0 19 GDP Per Capita (000) 21.337 11.151 3.056 39.071 Concentration of Private Sector to GDP 0.363 0.454 0.052 0.736 Accounting Standard 63.66 11.696 36 83 3-Firm Concentration on the Exchange 32.681 22.001 3 78 Number of Exchanges in the Country 2.166 2.145 1 9 Table 5.2b Descriptive statistics
Variables / Ratios Mean Standard Deviation
Minimum Maximum
Access to Network (Yes/No) 0.458 0.500 0 1 Extent of Network Involvement 0.591 0.770 0 4 Total Number of Stock Exchanges Linked through Network 2.285 3.636 0 19 Total Number of Stock Exchanges Linked through a Blue-Chip Equity or Equity Network 0.343 1.006 0 4 Total Number of Stock Exchanges Linked through a networked market for Growth or Tech-oriented Companies 0.416 1.389 0 5 Number of Total Stock Exchanges Linked through a Derivative Network 1.24 2.57 0 11
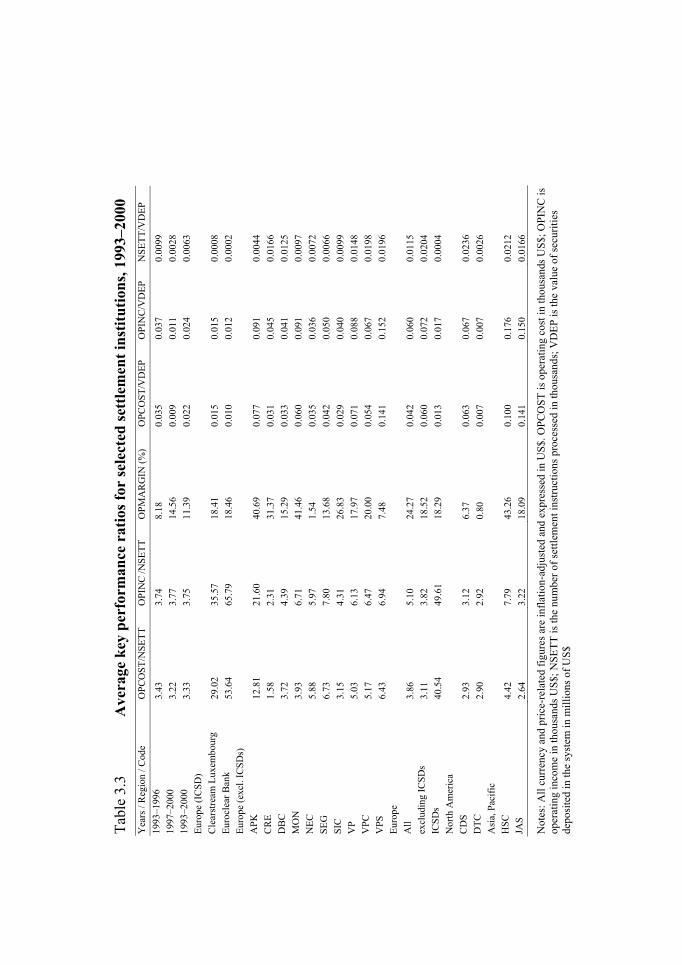
Tabl
e 3.
3
Ave
rage
key
per
form
ance
rat
ios f
or se
lect
ed se
ttle
men
t ins
titut
ions
, 199
3�20
00
Yea
rs /
Reg
ion
/ Cod
e O
PCO
ST/N
SETT
O
PIN
C /N
SETT
O
PMA
RG
IN (%
) O
PCO
ST/V
DEP
O
PIN
C/V
DEP
N
SETT
/VD
EP
1993
�199
6 3.
43
3.74
8.
18
0.03
5 0.
037
0.00
99
1997
�200
0 3.
22
3.77
14
.56
0.00
9 0.
011
0.00
28
1993
�200
0 3.
33
3.75
11
.39
0.02
2 0.
024
0.00
63
Euro
pe (I
CSD
)
C
lear
stre
am L
uxem
bour
g 29
.02
35.5
7 18
.41
0.01
5 0.
015
0.00
08
Euro
clea
r Ban
k 53
.64
65.7
9 18
.46
0.01
0 0.
012
0.00
02
Euro
pe (e
xcl.
ICSD
s)
APK
12
.81
21.6
0 40
.69
0.07
7 0.
091
0.00
44
CR
E 1.
58
2.31
31
.37
0.03
1 0.
045
0.01
66
DB
C
3.72
4.
39
15.2
9 0.
033
0.04
1 0.
0125
M
ON
3.
93
6.71
41
.46
0.06
0 0.
091
0.00
97
NEC
5.
88
5.97
1.
54
0.03
5 0.
036
0.00
72
SEG
6.
73
7.80
13
.68
0.04
2 0.
050
0.00
66
SIC
3.
15
4.31
26
.83
0.02
9 0.
040
0.00
99
VP
5.03
6.
13
17.9
7 0.
071
0.08
8 0.
0148
V
PC
5.17
6.
47
20.0
0 0.
054
0.06
7 0.
0198
V
PS
6.43
6.
94
7.48
0.
141
0.15
2 0.
0196
Eu
rope
A
ll 3.
86
5.10
24
.27
0.04
2 0.
060
0.01
15
excl
udin
g IC
SDs
3.11
3.
82
18.5
2 0.
060
0.07
2 0.
0204
IC
SDs
40.5
4 49
.61
18.2
9 0.
013
0.01
7 0.
0004
N
orth
Am
eric
a
C
DS
2.93
3.
12
6.37
0.
063
0.06
7 0.
0236
D
TC
2.90
2.
92
0.80
0.
007
0.00
7 0.
0026
A
sia,
Pac
ific
HSC
4.
42
7.79
43
.26
0.10
0 0.
176
0.02
12
JAS
2.64
3.
22
18.0
9 0.
141
0.15
0 0.
0166
Not
es: A
ll cu
rren
cy a
nd p
rice-
rela
ted
figur
es a
re in
flatio
n-ad
just
ed a
nd e
xpre
ssed
in U
S$. O
PCO
ST is
ope
ratin
g co
st in
thou
sand
s US$
; OPI
NC
is
oper
atin
g in
com
e in
thou
sand
s US$
; NSE
TT is
the
num
ber o
f set
tlem
ent i
nstru
ctio
ns p
roce
ssed
in th
ousa
nds;
VD
EP is
the
valu
e of
secu
ritie
s de
posi
ted
in th
e sy
stem
in m
illio
ns o
f US$

205
Table 5.4a Ordinary least square estimates � network on market performance Dependent Variable
Market Capitalisation Independent Variable/Ratios 1 2 3 4 5 6 Model Parameter
(t-statistics)Parameter
(t-statistics)Parameter
(t-statistics)Parameter
(t-statistics)Parameter
(t-statistics)Parameter
(t-statistics) Intercept 6.784
(30.16)***7.314 (44.03)***
11.43 (65.01)***
17.965 (70.52)***
17.819 (78.53)***
17.550 (76.93)***
Access to Network (Yes=1 � No=0)
2.772 (7.89)***
Extent of Network Involvement
1.618 (6.84)***
Total Number of Exchanges Linked through Network
0.304 (5.98)***
Total Number of Stock Exchanges Linked through the Equity Network
0.413 (2.62)***
Total Number of Stock Exchanges Linked through a networked market for Growth or Tech-oriented Companies
0.566 (3.49)***
Total Number of Stock Exchanges Linked through Derivative Network
0.401 (4.81)***
Adjusted R-Squared 0.352 0.302 0.239 0.105 0.118 0.144 F-Statistics 52.60*** 39.03*** 28.68*** 9.80*** 12.19*** 23.17*** Number of Obs. 120 120 120 120 120 120
Notes: ***, **, * portray significance at the 1, 5, 10 percent levels respectively.
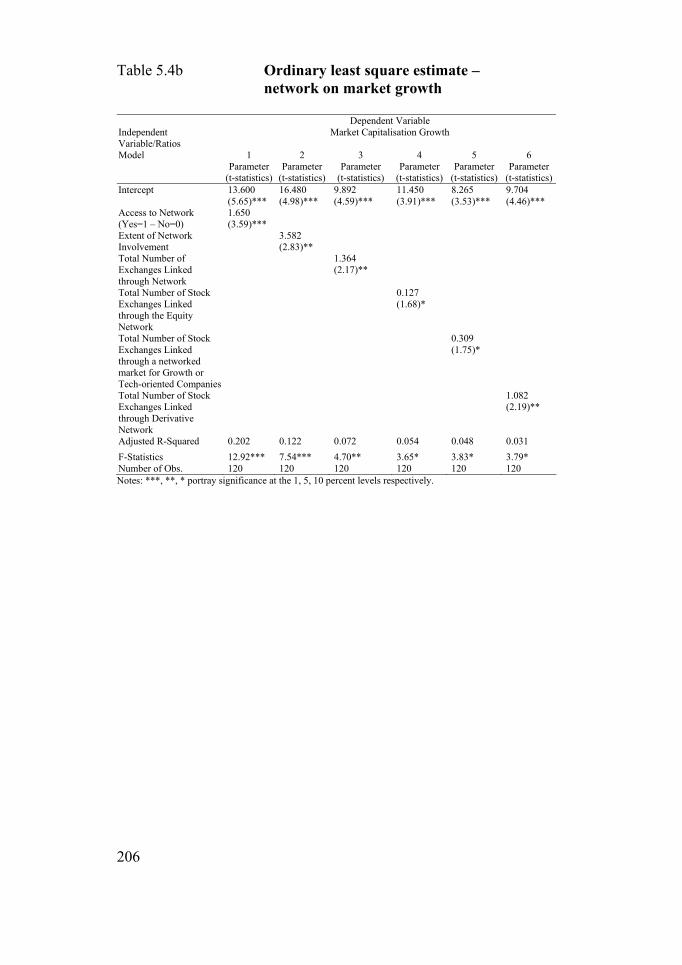
206
Table 5.4b Ordinary least square estimate � network on market growth Dependent Variable Independent Variable/Ratios
Market Capitalisation Growth
Model 1 2 3 4 5 6 Parameter
(t-statistics)Parameter
(t-statistics)Parameter
(t-statistics) Parameter
(t-statistics)Parameter
(t-statistics)Parameter
(t-statistics) Intercept 13.600
(5.65)*** 16.480 (4.98)***
9.892 (4.59)***
11.450 (3.91)***
8.265 (3.53)***
9.704 (4.46)***
Access to Network (Yes=1 � No=0)
1.650 (3.59)***
Extent of Network Involvement
3.582 (2.83)**
Total Number of Exchanges Linked through Network
1.364 (2.17)**
Total Number of Stock Exchanges Linked through the Equity Network
0.127 (1.68)*
Total Number of Stock Exchanges Linked through a networked market for Growth or Tech-oriented Companies
0.309 (1.75)*
Total Number of Stock Exchanges Linked through Derivative Network
1.082 (2.19)**
Adjusted R-Squared 0.202 0.122 0.072 0.054 0.048 0.031 F-Statistics 12.92*** 7.54*** 4.70** 3.65* 3.83* 3.79* Number of Obs. 120 120 120 120 120 120 Notes: ***, **, * portray significance at the 1, 5, 10 percent levels respectively.

207
Table 5.4c Ordinary least square estimate � network on market efficiency Dependent Variable
Turnover Velocity Independent Variable/Ratios 1 2 3 4 5 6 Model Parameter
(t-statistics)Parameter
(t-statistics)Parameter
(t-statistics)Parameter
(t-statistics)Parameter
(t-statistics)Parameter
(t-statistics) Intercept 6.784
(30.16)***7.314 (44.03)***
11.430 (65.01)***
17.965 (70.52)***
17.819 (78.53)***
17.550 (76.93)***
Access to Network (Yes=1 � No=0)
2.772 (7.89)***
Extent of Network Involvement
1.618 (6.84)***
Total Number of Exchanges Linked through Network
0.304 (5.98)***
Total Number of Stock Exchanges Linked through the Equity Network
0.413 (2.62)**
Total Number of Stock Exchanges Linked through a networked market for Growth or Tech-oriented Companies
0.566 (3.49)***
Total Number of Stock Exchanges Linked through Derivative Network
0.401 (4.81)***
Adjusted R-Squared 0.094 0.056 0.090 0.045 0.042 .104 F-Statistics 8.50*** 6.28*** 9.71*** 5.06** 4.77** 11.30*** Number of Obs. 114 114 114 114 114 114 Notes: ***, **, * portray significance at the 1, 5, 10 percent levels respectively.

208
Table 5.4d Ordinary least square estimate � network on transaction cost of trading Dependent Variable Total Transaction of Trading Independent Variable/Ratios
Parameter (t-statistics)
Parameter (t-statistics)
Parameter (t-statistics)
Parameter (t-statistics)
Parameter (t-statistics)
Parameter (t-statistics)
Model 1 2 3 4 5 6 Intercept 4.628
(9.04)*** 3.463 (10.18)***
4.514 (11.31)***
6.245 (8.16)***
5.104 (5.65)***
3.102 (4.43)***
Access to Network (Yes=1 � No=0)
�0.063 (1.98)**
Extent of Network Involvement
�0.026 (1.95)*
Total Number of Exchanges Linked through Network
�0.038 (1.93)*
Total Number of Stock Exchanges Linked through the Equity Network
�0.091 (2.00)**
Total Number of Stock Exchanges Linked through a networked market for Growth or Tech-oriented Companies
�0.164 (1.80)*
Total Number of Stock Exchanges Linked through Derivative Network
�0.346 (2.02)**
Adjusted R-Squared 0.2643 0.2518 0.2561 0.1813 0.1455 0.1539 F-Statistics 4.08*** 3.93*** 4.11*** 3.85*** 4.16*** 4.29*** Number of Obs. 109 109 109 109 109 109 Notes: ***, **, * portray significance at the 1, 5, 10 percent levels respectively.

209
Table 5.4e Ordinary least square estimate � network on operating cost of stock exchange Dependent Variable Exchange Operation Cost to Market Capitalisation Independent Variable/Ratios
Parameter (t-statistics)
Parameter (t-statistics)
Parameter (t-statistics)
Parameter (t-statistics)
Parameter (t-statistics)
Parameter (t-statistics)
Model 1 2 3 4 5 6 Intercept 0.013
(4.71)*** 0.004 (4.09)***
0.003 (4.00)***
0.002 (3.68)***
0.003 (3.72)***
0.003 (3.86)***
Access to Network (Yes=1 � No=0)
�0.005 (2.98)***
Extent of Network Involvement
�0.003 (2.01)**
Total Number of Exchanges Linked through Network
�0.001 (1.86)*
Total Number of Stock Exchanges Linked through the Equity Network
�0.001 (1.41)
Total Number of Stock Exchanges Linked through a networked market for Growth or Tech-oriented Companies
�0.001 (1.44)
Total Number of Stock Exchanges Linked through Derivative Network
�0.001 (1.75)*
Adjusted R-Squared 0.078 0.029 0.023 0.013 0.016 0.023 F-Statistics 8.53*** 3.64** 3.12* 2.03 2.08 3.12* Number of Obs. 92 92 92 92 92 92 Notes: ***, **, * portray significance at the 1, 5, 10 percent levels respectively.

210
These initial sets of single equation estimates are reported in Tables 5.4a to Table 5.4e. In each table, we provide results of the possible impact of all alternative NETWORK variables (or components of it) on one of the exchange PERFORMANCE measures. To illustrate, Table 5.4a reports the potential relationship between the logarithm of market capitalisation with five different independent variables in five separate estimates. The evidence portrayed here reveals overwhelmingly a positive and significant association between NETWORK variable(s) and market capitalisation. Interestingly, we observe that in each of the reported regressions, the model statistics, ie adjusted R-squared and F-Statistics, are quite high and significant. For example, the first regression of Table 5.4a shows that over 35% of the market capitalisation variability of the sample is captured by a simple bivariate independent variable. In Table 5.4b market growth is considered as the dependent variable, calculated by taking the annual growth of market capitalisation of the respective exchanges.12 The evidence shows a strong association between NETWORK variable(s) and market growth. Next, we turn to inquire about a possible association of NETWORK variables with TURNOVER in the market. The turnover velocity reflects the efficiency of the exchange. These results are reported in Table 5.4c. Although model statistics reported here are relatively weak, the coefficients of the NETWORK variable are significantly and positively associated with the dependent variables, in this case with TURNOVER. We then focus our attention on the possible relationship between the NETWORK variable and the TCOSTR (transaction cost of trade) in respective markets. Exchanges with higher network linkages are expected to be associated with lower trading costs. Evidence in Table 5.4d reports high model statistics, and importantly for our purposes, all NETWORK variables are found to be negatively and significantly associated with TCOSTR. Next we replace cost of trade as a dependent variable with the operational cost of an exchange to market capitalisation ratio (OPCOST), described in Table 5.4e. The estimates here are designed to see whether the NETWORK variable(s) have any relationship with the usual operational costs � costs reflected in the financial statements � of an exchange. One may expect that the newly developed network links may increase the operational costs in running day-to-day exchange businesses. On the contrary, it can be also argued
12 We include 1995 market capitalisation data for the sample exchanges in order to calculate the growth variable.

211
that such a link would lower the marginal cost as well as the total cost of exchange operations due to the economies of scale and scope in attracting new listings or volumes. Our evidence reports a negative and significant relationship primarily on the first three estimates. The model statistics of these regressions were relatively low. We follow-up estimations in Table 5.4a�5.4e with another set of estimations as portrayed in Table 5.5a�5.5c with the exception that we proceed with reporting only the first four estimates (rather than the seven represented in 4s) ie, representing a relatively broader proxy for NETWORK variables. In these regressions, we also control for additional variables that may be pertinent in explaining all the dependent variables used in our regressions. These variables were selected based on similar use of these variables in the literature in different research contexts. Most of the independent variables used in Table 5.5a�5.5c are quite similar across regressions, except for an additional size variable (market capitalisation) used in the two cost regressions, 5.5b and 5.5c. Once again, these independent variables were controlling for the macroeconomic environment, incorporating: GDP per capita; the relative importance of the private sector in the economy, considering the total private sector accumulation to GDP ratio; accounting or disclosure standards of the economy where an exchange is located; relative concentration of the top three firms in the exchange; the cost of trading (as relevant for specific dependent variables); and the number of exchanges within the domestic borders, a proxy for market competition. In summary, even after adding all other independent variables in our estimations, we find our key focus variables represented by NETWORK (ACCESS, NDN, and NNM) are still significantly associated with dependent variables in most estimations. Indeed, their relative significance � or t-statistics � were not as strong as the ones reported in Table 5.4a�5.4e, where no control variables were added to the NETWORK variables. Nonetheless, they are relevant and significant in explaining the variability of dependent variables. Moreover, the marginal increase in model statistics due to the addition of several new independent variables reveals that the R-squared represented by NETWORK variable(s) takes the lead in explaining the variability of exchange performance.

212
Table 5.5a Impact of network access on market capitalisation and market growth Dependent Variables Market Capitalisation Market Capitalisation Growth Independent Variables / Ratios
Parameters (t-statistics)
Parameters (t-statistics)
Parameters (t-statistics)
Parameters (t-statistics)
Parameters (t-statistics)
Parameters (t-statistics)
Model 1 2 3 1 2 3 Intercepts
14.637 (7.08)***
15.500 (8.15)***
14.810 (7.76)***
3.085 (2.75)**
4.094 (3.09)***
3.478 (2.94)***
Access to Network (Yes=1 � No=0)
0.227 (1.98)**
0.206 (2.94)***
� �
Extent of Network Involvement
0.631 (2.76)**
� 1.450 (1.90)*
�
Total Number of Exchanges Linked through Network
0.181 (1.96)**
� � 0.905 (1.77)*
GDP Per Capita (thousands of USD)
0.023 (1.52)
0.033 (1.94)*
0.031 (1.79)*
0.045 (1.89)*
0.032 (1.44)
1.908 (1.07)
Concentration of Private Sector to GDP
1.603 (4.87)***
1.508 (4.90)***
1.499 (4.77)***
0.894 (5.09)***
0.832 (1.98)**
1.685 (2.32)**
Accounting Standard 0.065 (5.05)***
0.060 (4.71)***
0.063 (5.00)***
0.058 (4.29)***
1.47 (3.03)***
0.953 (1.76)*
3-Firm Concentration on the Exchange
�0.026 (2.51)**
�0.014 (1.84)**
�0.016 (2.03)**
�0.029 (2.44)**
�0.054 (2.94)***
�0.095 (2.46)**
Transaction Cost of Trading
�0.030 (1.47)
�0.124 (1.30)
�0.002 (0.94)
�0.027 (1.56)
�0.075 (1.33)
�0.745 (1.21)
Number of Exchanges in the Country
�0.700 (1.44)
�0.061 (1.19)
�0.084 (1.49)
�0.574 (1.50)
�0.316 (0.73)
�0.286 (1.31)
Adjusted R-Squared 0.739 0.715 0.723 0.242 0.208 0.217 F-Statistics 14.06*** 16.88*** 16.33*** 5.98** 4.47** 3.86** Number of Obs. 106 106 106 106 106 106 Notes: ***, **, * portray significance at the 1, 5, 10 percent levels respectively.

213
Table 5.5b Impact of network access on market efficiency and transaction cost Dependent Variable Turnover Velocity Transaction Cost of Trading Independent Variables / Ratios
Parameters (t-statistics)
Parameters (t-statistics)
Parameters (t-statistics)
Parameters (t-statistics)
Parameters (t-statistics)
Parameters (t-statistics)
Model 1 2 3 1 2 3 Intercepts
2.431 (3.01)***
2.791 (3.02)***
2.648 (2.99)***
4.296 (14.54)***
4.284 (13.84)***
4.232 (14.03)***
Access to Network (Yes=1 � No=0)
0.001 (1.89)*
�0.126 (1.88)*
Extent of Network Involvement
0.001 (1.66)*
�0.032 (1.80)*
Total Number of Exchanges Linked through Network
�0.001 (1.04)
�0.042 (1.50)
GDP Per Capita (thousands of USD)
�1.954 (2.52)**
�1.596 (2.35)**
1.999 (2.60)**
�0.012 (2.40)**
�0.023 (3.09)***
�0.019 (2.82)**
Concentration of Private Sector to GDP
6.017 (1.68)*
1.775 (1.71)*
1.19 (1.65)
�0.252 (1.93)*
�0.236 (1.90)*
�0.242 (1.90)*
Accounting Standard �0.111 (0.22)
�0.015 (0.03)
�0.011 (0.06)
0.001 (0.18)
0.001 (0.34)
0.002 (0.47)
3-Firm Concentration on the Exchange
�0.684 (3.15)***
�0.626 (1.84)*
�0.619 (1.88)*
0.005 (1.54)
0.004 (1.46)
0.006 (2.05)**
Transaction Cost of Trading
�39.186 (1.93)*
�8.720 (1.92)*
�5.61 (1.77)*
Market Capitalisation �1.065 (2.02)**
�1.120 (2.23)**
�0.901 (1.96)**
Number of Exchanges in the Country
2.419 (0.96)
2.233 (0.88)
2.684 (1.06)
�0.042 (1.80)*
�0.051 (2.09)**
�0.035 (1.87)*
Adjusted R-Squared 0.453 0.489 0.525 0.331 0.332 0.321 F-Statistics 9.50*** 9.87*** 9.38*** 3.79*** 4.05*** 4.24*** Number of Obs. 100 100 100 106 106 106 Notes: ***, **, * portray significance at the 1, 5, 10 percent levels respectively.

214
Table 5.5c Impact of network access on stock exchange operating cost Dependent Variable Exchange Operation Cost to Market Capitalisation Independent Variables / Ratios Parameters
(t-statistics) Parameters (t-statistics)
Parameters (t-statistics)
Model 1 2 3
Intercepts
0.005 (6.66)***
0.001 (6.84)***
0.005 (6.63)***
Access to Network (Yes=1 � No=0)
�0.001 (1.73)*
Extent of Network Involvement
�0.001 (1.66)*
Total Number of Exchanges Linked through Network
�0.003 (0.39)
GDP Per Capita (thousands of USD) �0.001 (4.70)***
�0.001 (5.41)***
�0.001 (5.18)***
Concentration of Private Sector to GDP 0.001 (0.99)
0.001 (0.67)
�0.003 (3.18)***
Accounting Standard 0.0001 (0.43)
0.001 (0.41)
0.001 (0.55)
3-Firm Concentration on the Exchange �0.001 (5.68)***
�0.001 (3.02)***
�0.004 (3.18)***
Logarithm of Market Capitalisation
�0.001 (1.08)
�0.001 (5.79)***
�0.004 (5.17)***
Number of Exchanges in the Country �0.0001 (3.60)***
�0.002 (4.03)***
�0.006 (4.31)***
Adjusted R-Squared 0.653 0.659 0.640 F-Statistics 16.89 *** 9.87*** 9.33*** Number of Obs. 92 92 92 Notes: ***, **, * portray significance at the 1, 5, 10 percent levels respectively.

215
6 Conclusions The topic of networks has been very popular in the academic literature; whether they be theoretical or descriptive in nature, no empirical attempt has been made to understand and investigate the actual structure of the network and its impact on market performance. The increasing involvement of stock exchanges in different trading network modules, especially in Europe, warrants further investigation as to whether the adoption of network strategies adds additional value in the provision of trading services. This paper investigates the network externalities among stock exchanges by constructing and quantifying the network strategy and the extent of networks adopted by the European stock exchanges in recent years. This is one of the very first empirical initiatives to explore whether network linkages or common trading platforms among exchanges matter in affecting individual exchange performance. Tracing the experiences of all major European exchanges over the 1996�2000 period, this paper examines the impact of the network effects on market liquidity, growth, turnover velocity, transaction costs of trading and the costs of exchange operations. All alternative NETWORK variables constructed reveal a strong and significant association with exchange performance. In summary, the empirical evidence clearly reveals that the adoption of a network strategy by stock exchanges is significantly associated with performance measures. As the stock exchanges around the globe are increasingly moving towards a more network-linked market set-up, further empirical attempts are warranted on the impact of network economics on the exchange industry and financial markets.

216
References Annual Reports (1996�2000) Annual reports of 24 stock and
derivative exchanges. Arnold, T. � Hersch, P. � Mulherin, J.H. � Netter, J. (1999) Merging
markets. Journal of Finance, 52, 655�681. Blass, A. � Yafeh, Y. (2001) Vagabond shoes longing to stray: Why
foreign firms list in the United States. Journal of Banking and Finance, 25, 555�572.
Chaplinsky, S. � Ramachand, L. (2000) The impact of global equity
offerings. Journal of Finance 55, 2767�2789. CIFAR (1995) Center for International Financial Analysis and
Research, Inc. International Accounting and Auditing Trends, Vol. 1, 4th Edition. CIFAR Publications, Inc., Princeton, NJ.
Cybo-Ottone, A. � Di Noia, C. � Murgia, M. (2000) Recent
development in the structure of securities markets. Brookings-Wharton Papers on Financial Services, 2000.
Di Noia, C. (2001) The stock-exchange industry: Network effects,
implicit mergers, and remote access. European Financial Management, 7, 1, 39�72.
Domowitz, I. (1995) Electronic derivatives exchanges: Implicit
mergers, network externalities and standardization. The Quarterly Review of Economics and Finance, 35, 2, 163�175.
Domowitz, I. � Glen, J. � Madhavan, A. (1998) International cross-
listing and order flow migration: Evidence from an emerging market. Journal of Finance, 53, 2001�2027.
Domowitz, I. � Steil, B. (1999) Automation, trading costs, and the
structure of the trading services industry. Brookings-Wharton Papers on Financial Services, 1�52.
Economides, N. (1993) Network economics with application to
finance. Financial Markets, Institutions & Instruments, 2(5), 89�97.

217
Economides, N. (1995) How to enhance market liquidity. In R.
Schwartz (Ed.), Global equity markets, New York: Irwin Professional, Chapter 6.
Economides, N. (1996) The economics of networks. International
Journal of Industrial Organization, 16, 4, 675�699. Economides, N. � Flyer, F. (1998) Compatibility and market
structure for network goods. Discussion Paper EC-98-02, Stern School of Business, New York University.
Economides, N. � Heisler, J. (1994) Equilibrium fee schedules in a
monopolist call market. Discussion Paper EC-94-15, Stern School of Business, New York University.
Economides, N. � Schwartz, R. (1995a) Electronic call market
trading. Journal of Portfolio Management, 21, 3, 10�18. Economides, N. � Schwartz, R. (1995b) Equity trading practices
and market structure: Assessing asset managers� demand for immediacy. Financial Markets, Institutions & Instruments, 4, 4, 1�46.
Economides, N. � Siow, A. (1988) The division of markets is
limited by the extent of liquidity (spatial competition with externalities). The American Economic Review, 78, 1, 108�121.
Economides, N. � White, L.J. (1993) One-way networks, two-way
networks, compatibility, and antitrust. Mimeo. Elkins/Mc Sherry (1995�2001) Global trading cost analysis. New
York. Farrell, J. � Saloner, G. (1986) Standardization and variety.
Economic Letters, 20, 71�74. FIBV (1996�2000) Annual reports 1996�2000. International
Federation of Stock Exchanges, Paris.

218
Foerster, S. � Karolyi, A. (1998) Multimarket trading and liquidity: A transaction data analysis of Canada-U.S. interlistings. Journal of International Financial Markets, Institutions and Money, 8, 393�412.
Gode, D. � Sunder, S. (2000) Designing electronic markets: On the
impossibility of equitable continuously clearing mechanisms with geographically distributed agents. Presented at the Ninth Annual Financial Markets Conference of the Federal Reserve Bank of Atlanta.
Hagel III-, A.G. (1997) Net gain. Harvard Business School Press. Hasan, I. � Malkamäki, M. (2001) Are expansions cost effective for
stock exchanges? A global perspective. Journal of Banking and Finance, 25, 12, 2339�2366.
International Monetary Fund, various issues. International Financial
Statistics, Washington. Karolyi, A. (1998) Why do companies list shares abroad?: A
survey of the evidence and its managerial implications. New York University Salomon Center, Financial Markets, Institutions & Instruments, 7, 1, 1�60.
Katz, M. � Shapiro, C. (1985) Network externalities, competition,
and compatibility. American Economic Review, 75, 3, 424�440. Katz, M. � Shapiro, C. (1986) Technology adoption in the presence
of network externalities. Journal of Political Economy, 94, 4, 822�841.
La Porta, R. � Lopez-de-Silanes, F. � Shleifer, A. � Vishny (1997)
Legal determinants of external finance. Journal of Finance, 52, 1131�1150.
La Porta, R. � Lopez-de-Silanes, F. � Shleifer, A. � Vishny (1998)
Law and finance. Journal of Political Economy, 106, 1113�1155. Lee, R. (1998) What is an exchange? The automation,
management and regulation of financial markets. Oxford University Press Inc., New York.

219
Licht, A.N. (1998) Regional stock market integration in Europe. Harvard Institute for International Development, Consulting Assistance on Economic Reform II, Discussion Papers 15.
Madhavan, A. (2000) In search of liquidity in the internet era.
Presented at the Ninth Annual Financial Markets Conference of the Federal Reserve Bank of Atlanta.
MSCI (1995�2000) Handbook of world stock, derivative, and
commodity exchanges. Mondo Visione, UK. OECD (2001) Future prospects for national financial markets and
trading centres. OECD, Paris. Pagano, M. � Röell, A. � Zechner, J. (2002) The geography of equity
listing: Why do companies list abroad? Journal of Finance, 57, 6, 2651�2694.
Pagano, M. � Randl, O. � Röell, A. � Zechner, J. (2001) What makes
stock exchanges succeed? Evidence from cross-listing decisions. European Economic Review, 45, 770�782.
Pirrong, C. (1999) The organization of financial exchange markets:
Theory and evidence. Journal of Financial Markets, 2, 329�357. Saloner, G. � Shepard, A. (1995) Adoption of technologies with
network effects: An empirical examination of adoption of automated teller machines. Rand Journal of Economics, 26, 479�501.
Shapiro, C. � Varian, H.R. (1999) Information rules. A strategic
guide to the network economy. Harvard Business School Press, Boston, Massachusetts.
Shy, O. (2001) The economics of network industries. Cambridge
University Press, New York. Shy, O. � Tarkka, J. (2001) Stock exchange alliances, access fees
and competition. Bank of Finland Discussion Paper Series, 22/2001.

220
Sirri, E. (2000) What glory price? Institutional form and the changing nature of equity trading. Presented at the Ninth Annual Financial Markets Conference of the Federal Reserve Bank of Atlanta.
Steil, B. (1996) The European equity markets. The Royal Institution
for International Affairs.

221
Chapter 6
Economies of scale and technological development in securities depository
and settlement systems
Heiko Schmiedel � Markku Malkamäki � Juha Tarkka
Abstract ............................................................................................222 Acknowledgements ..........................................................................223 1 Introduction ..............................................................................224 1.1 Observations and motivation............................................224 1.2 Clearing and settlement ....................................................225 1.3 Literature review ..............................................................226 1.4 Analysis and organization ................................................226 2 The model ................................................................................228 2.1 Measurement issues..........................................................228 2.2 Empirical methodology ....................................................230 3 Data and descriptive statistics ..................................................232 4 Empirical evidence...................................................................238 5 Conclusions ..............................................................................249 References ........................................................................................251 Appendix..........................................................................................253

222
Abstract This paper investigates the existence and extent of economies of scale in depository and settlement systems. Evidence from 16 settlement institutions across different regions for the years 1993�2000 indicates the existence of significant economies of scale. The degree of such economies, however, differs by size of settlement institution and region. While smaller settlement service providers reveal a high potential of economies for scale, larger institutions show an increasing trend toward cost effectiveness. Clearing and settlement systems in countries in Europe and Asia report substantially larger economies of scale than those of the US system. European cross-border settlement seems to be more cost intensive than that on a domestic level, reflecting chiefly complexities of EU international securities settlement systems and differences in the scope of international settlement service providers. The evidence also reveals that investments in implementing new systems and upgrades of settlement technology continuously improved cost effectiveness over the sample period. Key words: securities settlement, economies of scale, technological progress JEL classification: D4, G20, F36, L22, O33

223
Acknowledgements This paper originates from the research visit of Heiko Schmiedel at the Research Department Bank of Finland, Helsinki. He would like to thank the Bank of Finland for its hospitality and generous support. Special thanks are also due to the HWWA-Hamburg Institute of International Economics for having supported this research. This research benefited from seminars at the Bank of Finland, the Nordic Baltic Meeting on Securities Clearing and Settlement 2002, and at the third workshop of the ECB-CFS Research Network at the Bank of Greece in 2003. Yarkov Amihud, Pentti Hakkarainen, and Iftekhar Hasan as well as seminar and conference participants at the Bank of Finland and Bank of Greece gave most valuable comments. The authors are also grateful to Virpi Andersson and Jani-Petri Laamanen for providing most efficient research assistance. The views expressed are those of the authors and do not necessarily reflect the views of the Bank of Finland. This paper was published as a Bank of Finland Discussion Paper, No. 26/2002.

224
1 Introduction
1.1 Observations and motivation
The most notable feature of major trends in global capital markets is that they reflect pressures of globalisation and consolidation. Technological innovations and a changing regulatory environment have been fundamental catalysts behind these structural changes in modern financial markets. Technological advances have been causing less dependency on physical market locations, thus exposing market participants to an increasingly competitive new environment in domestic markets as well as in the global arena. Equally important is the growing interest among institutional and individual investors in maximizing the positive effects of international portfolio diversification, resulting in a rapid expansion in trading internationally (Chapter 3; Gehrig, 1998a, 1998b; Malkamäki and Topi, 2002; Smith, 1991; Stulz, 1999). All these developments are acutely relevant for the securities market infrastructure, ie for the securities settlement services for equities, interest-bearing instruments and derivatives. Their importance derives from the fact that clearance and settlement costs can be viewed as a subset of the transaction costs facing an investor in effecting a trade (Giddy et al, 1996). Such costs deserve particular attention today, in particular in the European context where institutional arrangements for clearing and settling securities remain fragmented along national lines, making cross-border trading costly. This paper addresses the costs associated with depository and settlement businesses and it anticipates potential cost savings from consolidation and concentration of the industry. The paper deals with a number of research issues that have emerged in the forefront of the clearing and settlement debate: the first is to analyse whether the settlement of securities is a business in which essentially scale matters and whether there exist significant economies of scale in the function of settlement services. If this is the case, what is the extent of such scale economies? Do potential cost savings differ across type, size, and region? In particular, how cost-efficient are the European systems compared to other international experiences? What are the implications for the structure of the settlement industry? Would it result in the dominance of a new large or a few super regional settlement service providers making the existence of relatively smaller institutions obsolete?

225
1.2 Clearing and settlement
Clearance and settlement services are essential requisites of a well-functioning securities market. Clearing involves the process of establishing the respective obligations of the buyer and the seller in a security trade, while settlement comprises the actual transfer of securities from the seller to the buyer. Three types of clearance-settlement organisations provide these services: domestic central securities depositories (CSDs), international central securities (ICSDs) and custodians. The settlement infrastructure has traditionally been most integrated in US securities markets. The latest step in the consolidation process in the US has been the integration of the operations of the Depository Trust Company (DTC) and the National Securities Clearing Cooporation (NSCC) under a common holding company, the Depository Trust & Clearing Corporation (DTCC). Together, the companies and their affiliates clear and settle virtually all securities transactions in the US market, while the DTC remains the world�s largest securities depository. In contrast to the United States, the securities settlement and depository infrastructure in the European Union is still quite fragmented, although some efforts towards a more integrated infrastructure are well paving the way. At the national level, the integration of CSDs and settlement houses is already relatively far advanced, so that the emphasis is now on the need for reforms in the cross-border settlement of securities. The fragmentation of the EU clearing and settlement infrastructure also differs across the main securities markets. For example, in debt markets, two international central securities depositories (ICSDs), Euroclear Bank and Clearstream International, already play a dominant role. The ICSDs were originally established to carry out settlement services for the Eurobond market. Nowadays they provide settlement processing for most types of fixed-income trades and to a lesser extent equity transactions. However, in equity markets settlement is processed in a plethora of national systems involving varying technical requirements, market practices, fiscal procedures and legal environments. Consequently, the cross-border clearing and settlement of equities is more problematic than in bond markets. However, some attempts point towards cross-border consolidation in the European clearing and settlement industry, as evidenced by the recent merger of Deutsche Börse Clearing and Cedelbank Luxembourg under the name Clearstream International. Here, the

226
purpose is to actively achieve economies of scale by vertically integrating trading, clearing, and settlement services in a single institution. Other initiatives involve ongoing attempts to integrate each Euronext member�s settlement system under the Euroclear Group, while the announced merger plans between Euroclear and CrestCo UK exemplify horizontal consolidation between domestic trading/clearing/settling systems for different securities, ie fixed income and equities, or cross-border consolidation between two or more national systems for the same kind of instruments.1 1.3 Literature review
We are not aware of any empirical study particularly dealing with economies of scale in the depository and settlement industry. Several authors have analysed and discussed alternative models for clearance and settlement within a single European capital market. Giddy et al (1996) examine barriers to European financial market integration associated with imperfections and frictions imbedded in the clearance and settlement of cross-border trade. Comparing cross-country descriptive statistics concerning the securities industry in the EU, Lannoo and Levin (2001) observe that the operating costs of securities settlement systems in the EU are higher than in the US, although the difference is not as high as often proclaimed. A comprehensive assessment of current arrangements for cross-border clearing and settlement is presented in Giovannini Group (2002). 1.4 Analysis and organization
This paper attempts to fill the gap in the literature with a comprehensive panel-based analysis of economies of scale across all major global depository and settlement institutions over the 1993�2000 period. This is one of the very first comprehensive attempts at providing separate perspectives on scale effects across different types, sub-groups, and geographical location of settlement service providers. In related studies, a few researchers examine economies of scale, relative efficiency, and technological development in the stock
1 See also Giddy et al (1996) and Malkamäki and Topi (2002) for a discussion on settlement structures in Europe.

227
exchange industry from a European and global perspective (Chapters 2 to 4). Following the stock exchange literature (Arnold et al, 1999; Domowitz and Steil, 1999; Pirrong, 1999), depository and settlement services providers are herein considered as operative firms. This approach is of great importance for the evolution of the structure and contestability of the markets because also settlement institutions make choices concerning, for example, their trading technologies, ie the supply side of their settlement services. Domowitz and Steil (1999) argue further that the industrial structure of market places cannot be explained by focusing on the demand side alone, as is the case in financial market microstructure studies. It is equally important to know more about the supply side, ie the provision of settlement services. The overall results of this study reveal the existence of substantial economies of scale among depository and settlement institutions. On average, the centralised US system is found to be the most cost-effective settlement system and may act as the cost-saving benchmark. However, settlement institutions from Europe and the Asia-Pacific region show the highest potential in unit cost savings. Similar results were found for relatively smaller service providers where a doubling of settlement and depository activities would increase costs by 2/3. The findings also suggest that operating costs for carrying out cross-border settlement appear to be much higher than operating a domestic CSD, reflecting the current complexities of EU international securities settlement systems and differences in the underlying scope of ICSD services. Moreover, the evidence indicates that operating costs decreased continuously over time, possibly due to investments in implementing new systems or upgrading settlement technology. Consistent with the Giovannini Group (2002), this paper stresses the importance that the removal of cost inefficiencies in clearing and settlement is a necessary condition for the development of a large and efficient financial infrastructure in particular in Europe. The paper is organized as follows. Section 2 develops the model of estimating settlement systems� economies of scale. It is followed by a description of the data and the resulting statistics. Section 4 addresses empirical results, while Section 5 concludes the analysis.

228
2 The model
2.1 Measurement issues
Following the literature on stock exchanges (Arnold et al, 1999; Domowitz and Steil, 1999; Pirrong, 1999), each settlement institution is assumed to be a multiproduct firm that incurs operating costs while producing different outputs and using inputs. In general, it is controversial what constitutes inputs or outputs for any financial institution. It is even more difficult to do so for the settlement institutions and neither is it obvious what constitutes the relevant market of the settlement industry. In general, securities settlement systems mainly provide settlement and depository services. �Settlement� refers to the actual transfer of a security while �depository� is the safekeeping of assets and the administration of securities on behalf of intermediaries and investors. A close look at the operations and annual reports of settlement institutions would confirm such notions of two functions producing two outputs. In order to assess cost/income structures and to calculate economies of scale in the settlement industry, it is important to define relevant proxies of the costs, outputs, and inputs for a settlement system. We are aware of the methodological particularities involved in making direct comparisons of the fees charged to market participants, since each settlement institution has elaborated its own complex fee structure and pricing scheme depending on the type of transaction, its volume, and the size and nature of the client (see also Lannoo and Levin (2001)). Following this justification, the total cost variable in this study represents the reported operating expenses of a settlement system including depreciation. Similarly, the operating income of a settlement system serves as a proxy of settlement income. Both variables are based on publicly available information, which can be found in each institution�s financial statements of annual reports. Concerning the output relating to the settlement procedure and depository activities, we consider two direct measures. One possible proxy for the settlement service might be the number of securities settled in the system (NSETT), while the output for the depository business might be proxied by the value of securities deposited in the system (VDEP). There are no direct measures available for inputs of settlement institutions. The statements in the annual reports reveal that the two most important input prices for the operations of settlement

229
institutions are the settlement system comprising technology and office expenses, and the personnel costs. Disaggregated system cost and labor data is unavailable for many of the annual reports. In order to include at least one relevant input price variable, the GDP (Gross Domestic Product) per capita is used to act as a proxy for differences in labor costs across countries. Interestingly, in similar studies on the stock exchange industry (Hasan and Malkamäki, 2001; Chapter 3), the estimations using per capita GDP as a labor input proxy do not yield significantly different results compared to estimations that actually use the direct measure of labor price as an input. Most of the sample institutions in this paper are domestic CSDs, reflecting the fact that the settlement of securities has traditionally been carried out by domestic CSDs on a national level in the European area. Differing historical, institutional, technical, and legal environments led to a fragmented settlement industry, which was unable to address adequately the growing needs of market participants to operate cross-border. However, two international central securities depositories (ICSDs), Euroclear and Clearstream, have been established in order to capture the settlement market of internationally traded securities. These institutions also differ in many respects from their domestic counterparts concerning the scope of instruments, environments, and services. The ICSDs primarily focus on the settlement of fixed income instruments, but nevertheless of equity transactions as well. ICSDs are also engaged in different markets dealing with multiple currencies and different regulatory environment and requiring more complex services and advanced system technologies. Moreover, ICSDs provide a number of services that a CSD does not, ie corporate action services.2 In order to incorporate such differences in reported cost data, we introduce a binary variable in all regression estimations highlighting the two ICSDs whose business activities and cost data might differ from the services and nature of domestic CSDs. The models presented below are based on our attempts to investigate the research questions by including the highest possible number of sample institutions in the data set. The starting point of our analysis is a series of rather straightforward loglinear models (Ia�d) regressing total operating cost on the output proxies. In the next step, we estimate translog cost functions of the sample settlement
2 See Table 11 in Lannoo and Levin (2001) for an overview of different services provided by ICSDs and CSD.

230
institutions. Models IIa�c depict the single product case including one output (number of settlement instructions processed) and one input (GDP per capita). Models IIIa�c deal with multioutput technologies by incorporating two outputs (number of settlement instructions processed and value of deposited settlement instructions in the system) and keeping the same input as in Models II. In each model, we control whether an institution is engaged to settle securities on a cross-border basis. Additionally, Models II and III control for technological change by adding either a linear time trend variable and alternatively by including binary variables for each year. The sample period considered in all estimations is 1993�2000. Total operating cost, including depreciation represent the dependent variable in all of these models. 2.2 Empirical methodology
A commonly used translog cost function (Berndt, 1991) is employed in order to evaluate economies of scale in the settlement industry. The most notable feature of this translog function is that it allows scale economies to vary with the level of output. The general functional form of the multiproduct translog cost function can be written as
∑
∑∑
∑∑
∑
δ+
τ+λ+δ+
+β+γ+
γ+β+
β+α+α+α=
lll
111ki k
iik
2112i j
jiij
ii
i2
222
211122110
YR
TDQlnPln
QlnQlnPlnPln
Pln)Q(ln
)Q(lnQlnQln)YR,T,D,Q,P(TCln
(2.1)
The total costs, TC, depend on the vector of output, Q, and the vector of factor prices, P, for each institution and over time. The variable (D) equals unity for ICSD and zero otherwise. Scale elasticity coefficients with respect to the two outputs are calculated as follows
ii
i1212111
c1 PlnQlnQln2
QlnTCln
11 ∑δ+β+β+α=∂∂
=ε (2.2)

231
ii
i212122222
c2 PlnQlnQln2
QlnTCln ∑δ+β+β+α=
∂∂
=ε (2.3)
Generally, the concept of potential economies of scale maintains that average or unit cost decreases as all outputs are expanded by the same proportion per time period; that is, scale economies are available if the sum of the cost output elasticity is smaller than one, whereas scores above unity imply diseconomies. When a multiproduct cost function (Q = (Q1, ..., Qn)) is assumed, the conventional measure of scale economies is defined as the inverse of the elasticity of Ray average cost. In the case of two outputs it yields
)Q,Q()Q,Q(QlnTCln
S1
21c221
c1
i iε+ε=
∂∂
= ∑ (2.4)
It is often useful to consider the scale economies along a particular expansion path, eg defined by Q1 = f(Q2) (Baumol et al, 1988). In this respect a loglinear expansion path is incorporated in the estimations. The partial derivative of Equation (3.1) with respect to time (T) or to each year (YR) will then measure the technical characteristics of the underlying technology. This provides an indication of the rate of movement in the cost function over time. For technical advancement to occur, the sign of these coefficients should be negative, indicating the cost function is shifting down over time. If it turns out that the second order terms in the translog model are not any different from zero, the translog function reduces to the special linear case, ie the linear logarithmic Cobb-Douglas cost function. The linear logarithmic model to be estimated is in that case
∑∑ δ+τ+λ+γ+
+α+α+α=
lll111i
ii
22110
YRTDPln)r/(Qln)r/(Qln)r/()YR,T,D,Q,P(TCln
(2.5)
with α1 + α2 = 1 and S = r. As r is a constant, returns to scale cannot vary with the level of output in this model.

232
3 Data and descriptive statistics The data used in this study comes from a variety of sources, including annual reports of settlement institutions, various issues of the European Central Bank Blue Book on Payment and Securities Settlement Systems in the European Union, Bank for International Settlement Statistics on Payment and Settlement Systems, IMF International Financial Statistics (IFS), and information from the settlement institutions� Internet sites. Most of the data was collected from the annual balance sheets, income statement reports, and Internet pages of all major operating settlement institutions covering an eight-year time period (Annual Reports 1993�2000). In some cases, additional information was obtained from the settlement institutions by correspondence. Also the Thomas Murray CSD Guide served as an important source from which to obtain information on settlement institution-specific characteristics. Although reporting schemes and the information content of the financial accounts vary across time and settlement institution, a consistent data set has been compiled including all necessary information on 16 individual settlement agencies� key balance sheet and income statement items over the period 1993�2000, which entered the estimations. Table 3.1 provides an overview of all sample settlement institutions. The sample of settlement institutions has a special focus on the European area and comprises national as well as international EU systems. Additionally, settlement systems from the North American and Asia-Pacific regions are considered in the sample. The US system enters the panel as an example of a monopolistic and centralised system. Table 3.2 summarizes the variable structure and data sources. All national currencies are converted into US dollars and are inflation-adjusted using data from IFS. All variables other than the qualitative proxies are expressed in natural logarithms in the regression models. Table 3.2 provides an overview of the key performance ratios of the sample settlement institutions over the years 1993�2000. It includes settlement institutions from the European area, North America, and Asia-Pacific regions. Moreover, the table reports separate perspectives for the European ICSDs and CSDs and provides aggregated information on the cost and revenue structure for European sub-samples. Overall the data varies considerably across different systems, illustrating the diversity of economic conditions and operating systems, the range of services provided by each institution, and to some extent differing financial reporting schemes.

233
Table 3.1 Summary of sample settlement institutions, 1993�2000 Region/Code Settlement institution Country CSD/ICSD Years Europe CED Clearstream Luxembourg Luxembourg ICSD 1999 ECB Euroclear Bank United Kingdom ICSD 1999�2000 Europe (excl. ICDS) APK APK Finland CSD 1997�2000 CRE CrestCo United Kingdom CSD 1997�2000 DBC Clearstream Frankfurt Germany CSD 1994�2000 MON Monte Titoli Italy CSD 1996�2000 NEC Necigef Netherlands CSD 1993�1999 SEG SegaIntersettle Switzerland CSD/ICSD 1995�1997;
2000 SIC Euroclear France
(formerly Sicovam) France CSD 1999�2000
VP Danish Securities Centre Denmark CSD 1993�2000 VPC VPC Sweden CSD 1995�1998 VPS Verdipapirsentralen Norway CSD 1994�1998 North America CDS Canadian Depository for
Securities Canada CSD 1993�2000
DTC Depository Trust & Clearing Company
United States CSD 1993;1995�2000
Asia Pacific HSC Hong Kong Securities
Clearing Company Hong Kong /China CSD 1993�1998
JAS Japan Securities Depository Center
Japan CSD 1996�1998
Table 3.2 Data structure and sources
Variables Coefficients Definition and measurement units Sources OPINC TR Total operating income in
thousands of US$ Annual reports 1993�2000
OPCOST TC Total operating cost in thousands of US$
Annual reports 1993�2000
Inputs GDPC P1 Gross domestic product per capita
in thousands of US$ IFS Yearbooks
Outputs NSETT Q1 Number of settlement instructions
processed in the system in thousands
Annual reports 1993�2000; ECB (various issues) Blue Book; BIS (various issues) Payment statistics
VDEP Q2 Value of settlement instructions processed in the system in millions of US$
Annual reports 1993�2000; ECB (various issues) Blue Book; BIS (various issues) Payment statistics
Others TIME T Linear time trend variable YEAR YR94-00 Dummy variables for the years
1994�2000
ICSD D1 Binary variable for ICSD = 1, otherwise 0
Annual reports 1993�2000

234
The most readily comparable key measure of cost efficiency is the cost per trade. It gives information on the average �unit cost� of settling a securities market trade in the system. A relative cost comparison shows that the average cost per settled transaction is $3.86 for all European institutions and $2.90 in the US. In other words, securities settlement in Europe is 1.33 times more costly than on the DTC. The average costs for carrying out cross-border settlement appear to be much higher than operating a domestic CSD, ie $40.54 relative to $3.11 for EU CSDs or to $2.90 for US system. Consistent with Lannoo and Levin (2001), this gap reflects the current complexities of EU international securities settlement and differences in the underlying scope of their services. Considering only the cost differential between CSDs in the EU vis-à-vis the US the data becomes less dramatic (only EU CSDs $3.11 compared to $2.90). However, the lower cost ratio for European CSDs seems to be driven by the cost-effective settlement system in the UK ($1.58). All other European domestic systems report scores above average. This is in particular the case for the Finnish system with the highest average cost per settled instruction of $12.81. Securities trading, clearing, and settlement services are vertically integrated and carried out in various subsidiaries of the HEX Group. Generally, vertical integration may offer a number of positive effects such as increased speed, safety, and risk management. However, the cost data does not support the view of relative cost optimal structures in the Finnish silo model. A more favourable picture emerges for the cross-border settlement concerning the cost per value of deposited instructions in the system. The ICSDs show almost the same cost effectiveness as their US counterpart ($0.013 versus $0.007), while national CSDs report a lower cost efficiency of $0.060. The Asia-Pacific system scores lowest in terms of cost per value of deposited securities. The findings of lower cost performance in respect to the number of settled transactions and the higher cost effectiveness for the value of deposited securities reveal that ICSDs are likely to benefit from settling securities instructions from large, international firms which trade low in volume and high in value across borders. This view is also supported by the turnover velocity ratios in the last column of Table 4.4 where EU ICSDs and the US system appears to perform much better compared to national CSDs from other regions. On the income side, the figures indicate that the EU (EU excl. ICSD) average operating income per settled securities instruction is almost 75% (30%) higher than in the US ($5.10 ($3.82) as compared to $2.92). In other words, the operating revenues cover on average the operating expenditure of European ICSDs and CSDs at a considerable

235
level of 18.29% and 18.52%, respectively. The Asia-Pacific institutions show average operating margins within the range of those from Europe. Both North American systems operate with significantly smaller margins compared to those from other regions. In particular, the operating margin of the centralised system in the US is lower than unity ($0.80), indicating that generated revenues just cover costs. The cost data illustrate that there exist potential economies of scale in the settlement industry. These effects are fairly pronounced for both the number of settlement instructions and for depository activities. These relationships are graphically presented in Figures 3.1 and 3.2 below.

Tabl
e 5.
3
Cor
rela
tion
coef
ficie
nt m
atri
x V
aria
bles
/ R
atio
s 1
2 3
4 5
6 7
8 9
10
11
12
13
1.M
arke
t Cap
italis
atio
n 1
0.40
***
0.24
**
�0.2
5*
0.75
***
0.47
***
0.63
***
0.53
***
0.30
**
0.84
***
0.40
***
�0.3
6***
0.59
***
2.
Mar
ket C
apita
lisat
ion
Gro
wth
1 0.
61**
* �0
.43*
**0.
37**
* 0.
46**
* 0.
37**
0.
30**
0.
04
0.34
**
�0.0
2 �0
.21
0.33
**
3. T
urno
ver �
Vel
ocity
1
�0.3
8***
0.39
***
0.30
**
0.26
**
0.32
**
�0.2
7*
0.17
�0
.14
�0.3
1**
0.55
***
4.
Tra
nsac
tion
Cos
t of
Trad
ing
1
�0.3
7**
�0.5
7***
�0.4
0***
�0.4
3***
�0.3
1*
�0.0
5 �0
.21
0.15
�0
.25*
*
5. O
pera
tion
Cos
t of t
he
Stoc
k Ex
chan
ge
1 0.
43**
* 0.
60**
* 0.
52**
* 0.
24
0.51
***
0.12
�0
.34*
**0.
66
6. A
cces
s to
Net
wor
k (Y
es=1
No=
0)
1
0.71
***
0.63
***
0.50
***
0.38
***
0.13
�0
.11
0.41
***
7. E
xten
t of N
etw
ork
Invo
lvem
ent
1 0.
92**
* 0.
45**
* 0.
51**
* 0.
09
�0.1
8 0.
44**
*
8. T
otal
Num
ber o
f St
ock
Exch
ange
s Lin
ked
thro
ugh
Net
wor
k
1
0.38
***
0.24
* �0
.05
�0.0
9 0.
42**
*
9GD
P Pe
r Cap
ita (0
00)
1 0.
21
0.50
***
0.12
0.
09
10 C
once
ntra
tion
of
Priv
ate
Sect
or to
GD
P
1 0.
23
�0.3
7**
0.51
***
11 A
ccou
ntin
g St
anda
rd
1
0.09
0.
05
12 3
-Firm
Con
cent
ratio
n on
the
Exch
ange
1 �0
.30*
*
13 N
umbe
r of E
xcha
nges
In th
e C
ount
ry
1
Not
es: *
**, *
*, *
por
tray
sign
ifica
nce
at th
e 1,
5, 1
0 pe
rcen
t lev
els r
espe
ctiv
ely.

237
Figure 3.1 Cost and volume of settlement instructions, 1993�2000
Number of settlement instructions (log)
Cos
t/val
ue o
f dep
osite
d se
curit
ies (
log)
6.5 7 7.5 8 8.5 9 9.5 10 10.5 11 11.5 12 12.5
4.5
4.0
3.5
3.0
2.5
2.0
1.5
1.0
0.5
0.0
Figure 3.2 Cost and value of deposited securities, 1993�2000
Value of deposited securities (log)
25 26 27 28 29 30 31 32 33
-1.5
-2.0
-2.5
-3.0
-3.5
-4.0
-4.5
-5.0
-5.5
Cos
t/val
ue o
f dep
osite
d se
curit
ies (
log)

238
4 Empirical evidence The loglinear and translog cost function estimates for each of the model specifications are reported in Tables 4.1�4.3. All parameter estimates associated with these estimates are reasonably consistent with expectations. In most cases, the output and input specifications and binary variables turned out to be statistically significant. Importantly for such models, the R-squared and F-statistics exonerate the choice of output and input variables considered in this study. The starting point of our analysis is a series of similar regressions using simple loglinear models (Ia�Id). All potential output variables (NSETT and VDEP) as well as a binary variable (ICSD) and proxy variables for technological progress are exclusively and jointly regressed on the total cost variable.3 These estimates perform quite well according to the model specification statistics. A sample of some of these estimates is reported in Table 4.1. Based on the statistical considerations from the loglinear models, the evidence clearly shows that both variables (NSETT and VDEP) are relevant proxies for output and thus were selected for further analysis. Several translog models are estimated using alternative input, output, and other specifications as given by equation 2.1. The outcome of these models is presented in Tables 4.2 and 4.3. A number of interesting observations can be derived from the tables. The translog specifications in Models II and III have statistically significant second-order terms, justifying the use of these more flexible forms. Models IIb and IIIb are the preferred models because the t-statistics of the parameter estimates and the R-squared are somewhat higher compared to the other model specifications. In the single output case the evidence clearly indicates that processing a higher number of settlement instructions reduces costs for settlement institutions. Similar evidence on returns to scale is obtained when the second output variable (VDEP) is considered in Models III. The dummy variable for ICSD businesses is highly statistically significant in all estimates with very much the same range of coefficients and signs. Consistent with the simple cost ratio comparisons in Table 3.3, this finding may be interpreted that costs are three times higher if an institution initiates cross-border securities settlement operations. This 3 As mentioned above a dummy variable is included in order to control for the different institutional structure and business activities of those institutions that settle securities on a cross-border basis. If the costs of these institutions are included in the sample, the binary variable takes a value of unity and zero otherwise.

239
reflects the fact that such institutions deal with a wider array of services, instruments, and different economic and legal environments requiring more complex and costly services and advanced system technologies. Once the translog cost functions are explicitly specified, we can derive parametric estimates of scale economies. Focusing further on the preferred Models IIb and IIIb for the single- and multi-product case, we estimate scale elasticity at the sample median as well as at the mean. All results are reasonably similar in most estimates. We prefer the median estimates because when ranking the settlement institutions by the number of settled instructions, we find that the sample is skewed towards a few very big settlement institutions with a larger number of settled securities transactions. Therefore, we opt for median estimates as more representative over the mean estimates. The scale elasticity estimates are obtained by taking the first partial derivative of the estimated translog model. The scale elasticity scores are then calculated by applying the estimated coefficients from Tables 4.2 and 4.3. Ray average costs (Baumol et al, 1988) are computed by estimating a loglinear expansion path for the settlement institutions, lnVDEP = f(lnNSETT), on the sample data.4 We repeat our estimates on sub-samples. The median number of settlement instructions processed in the system is selected next for each group as its representative output. The total value of deposited securities at this point is forecasted by using the outcome of expansion path estimation.
4 The estimation results for the expansion path lnVDEP = f(lnNSETT) are reported in Table A1 in the Appendix.

240
Table 4.1 Costs regressed on output proxies Model Ia Model Ib Model Ic Model Id Explanatory variables
Coefficients Parameter estimates
Parameter estimates
Parameter estimates
Parameter estimates
Intercept α0 4.0878*** �1.7455*** �0.7885 0.3563 (9.26) (3.35) (1.58) (0.67) NSETT αQ1 0.7189*** 0.2410*** 0.3703*** (15.17) (4.78) (6.81) VDEP αQ2 0.5998*** 0.4468*** 0.3411*** (23.99) (11.51) (7.72) ICSD λ1 1.2452*** (4.22) TIME τ1 �0.0347* (1.81) R2-adjusted 0.7510 0.8832 0.9096 0.9266 F-statistics 230.17*** 575.56*** 383.21*** 240.91*** N 77 77 77 77 Notes: Regressions are estimated using panel estimation on pooled settlement institution data for 1993�2000. All regressions are OLS estimates. The dependent variable represents total operating costs. All are log variables. T-values are reported in parentheses. Superscripts ***, **, * indicate significance levels of 1%, 5%, and 10% respectively.

241
Table 4.2 Translog cost regression parameters including single output, single input, and binary variables, 1993�2000 Model IIa Model IIb Model IIc Explanatory variables
Coefficients Parameter estimates Parameter estimates Parameter estimates
Intercept α0 70.758*** 68.1059*** 68.8940*** (3.36) (3.40) (3.31) NSETT αQ1 �2.6086 �2.0939 �2.2723 (1.30) (1.09) (1.14) NSETTSQ βQ1Q1 0.0419** 0.0449** 0.0437** (1.93) (2.17) (2.03) GDPC γP1 �10.7725*** �10.7234*** �10.7295*** (4.18) (4.36) (4.21) GDPCSQ γP1P1 0.4504*** 0.4740*** 0.4644*** (6.03) (6.62) (6.27) GDPCNSETT γP1Q1 0.2474 0.1936 0.2138 (1.13) (0.92) (0.98) ICSD λ1 2.7348*** 2.8810*** 2.8903*** (11.94) (12.85) (12.32) TIME τ1 �0.0514*** (2.85) YR94 δ1 �0.0503 (0.27) YR95 δ2 0.0626 (0.36) YR96 δ3 �0.0375 (0.22) YR97 δ4 �0.1664 (1.02) YR98 δ5 �0.1616 (0.98) YR99 δ6 �0.1914 (1.11) YR00 δ7 �0.3535** (2.01) R2-adjusted 0.9303 0.9367 0.9334 F-statistics 170.07*** 161.77*** 82.89*** N 77 77 77 Notes: Regressions are estimated using panel estimation on pooled settlement institution data for 1993�2000. All regressions are OLS estimates. The dependent variable represents total operating costs. All are log variables except for binary variables. T-values are reported in parentheses. Superscripts ***, **, * indicate significance levels of 1%, 5%, and 10% respectively.

242
Table 4.3 Translog cost regression parameters including multiple outputs, single input, and binary variables, 1993�2000 Model IIIa Model IIIb Model IIIc Explanatory variables
Coefficients Parameter estimates Parameter estimates Parameter estimates
Intercept α0 65.0174 91.1888 94.8119 (0.91) (1.34) (1.35) NSETT αQ1 �0.1498 0.9173 0.8946 (0.03) (0.20) (0.18) VDEP αQ2 �0.0569 �0.6864 �0.7150 (0.02) (0.20) (0.20) NSETTSQ βQ1Q1 �0.0732 �0.0393 �0.0339 (0.76) (0.43) (0.36) VDEPSQ βQ2Q2 �0.0561 �0.0660 �0.0687 (0,68) (0,84) (0.84) NSETT*VDEP βQ1Q2 0.1436 0.1277 0.1263 (0.82) (0.77) (0.73) GDPC γP1 �11.8353 �16.8055* �17.4758* (1.10) (1.63) (1.64) GDPCSQ γP1P1 0.5274 0.7205** 0.7399** (1.48) (2.10) (2.09) GDPC*NSETT δP1Q1 �0.0960 �0.2273 �0.2315 (0.25) (0.61) (0.60) GDPC*VDEP δP1Q2 0.1227 0.2391 0.2546 (0.41) (0.84) (0.87) ICSD λ1 2.8095* 3.1596** 3.2389** (1.99) (2.36) (2.33) TIME τ1 �0.0522*** (2.98) YR94 δ1 �0.0633 (0.37) YR95 δ2 �0.0131 (0.08) YR96 δ3 �0.0521 (0.34) YR97 δ4 �0.1689 (1.11) YR98 δ5 �0.1484 (0.97) YR99 δ6 �0.2504 (1.55) YR00 δ7 �0.4008** (2.36) R2-adjusted 0.9408 0.9471 0.9441 F-statistics 121.84*** 124.76*** 76.48*** N 77 77 77 Notes: Regressions are estimated using panel estimation on pooled settlement institution data for 1993�2000. All regressions are OLS estimates. The dependent variable represents total operating costs. All are log variables except for binary variables. T-values are reported in parentheses. Superscripts ***, **, * indicate significance levels of 1%, 5%, and 10% respectively.

243
Table 4.4 Decomposition of single- and multi-product scale economies in translog and loglinear model specifications according to size and geographical location1,2 Panel A: Cost scale elasticities and economies of scale for single output and input case including trend and ICSD variable according to model IIb
Category
1QlnTCln
∂∂ 3
2QlnTCln
∂∂ 4 ∑
∂∂n
i iQlnTCln 5
∑∂∂n
i iQlnTCln
1 6
Q1 0.560 0.560 1.787 Q2 0.663 0.663 1.508 Q3 0.728 0.728 1.373 Q4 0.818 0.818 1.223 Median 0.696 0.696 1.437 Europe, Canada All 0.682 0.682 1.467 Excl. ICSD 0.639 0.639 1.565 ICSD 0.696 0.696 1.437 US 0.944 0.944 1.059 Asia, Pacific 0.741 0.741 1.350 Loglinear model median 0.744 0.744 1.344
1 Based on median number of settlement instructions processed in each group. 2 Estimated expansion path for settlement institutions lnVDEP = 10.9131 + 1.07 lnNSETT. 3 Scale elasticity coefficient of costs with respect to number of settlement instructions (Equation 2.2). 4 Scale elasticity coefficients of costs with respect to value of deposited securities (Equation 2.3). 5 Ray scale elasticity coefficient with respect to multiple outputs, NSETT and VDEP (Equation 2.4). 6 Inverse of c
Rayε .

244
Table 4.4 Decomposition of single- and multi-product (continued) scale economies in translog and loglinear model specifications according to size and geographical location1,2 Panel B: Cost scale elasticities and economies of scale for multiple output and single input case including trend and ICSD variable according to model IIIb
Category
1QlnTCln
∂∂ 3
2QlnTCln
∂∂ 4 ∑
∂∂n
i iQlnTCln 5
∑∂∂n
i iQlnTCln
1 6
Q1 0.497 0.144 0.640 1.562 Q2 0.513 0.185 0.698 1.433 Q3 0.555 0.175 0.730 1.370 Q4 0.613 0.162 0.775 1.291 Median 0.534 0.180 0.714 1.400 Europe, Canada All 0.525 0.182 0.707 1.414 Excl. ICSD 0.498 0.188 0.686 1.458 ICSD 0.534 0.180 0.714 1.400 US 0.694 0.143 0.837 1.194 Asia Pacific 0.563 0.173 0.736 1.358 Loglinear model median 0.413 0.306 0.718 1.392
1 Based on median number of settlement instructions processed in each group. 2 Estimated expansion path for settlement institutions lnVDEP = 10.9131 + 1.07 lnNSETT. 3 Scale elasticity coefficient of costs with respect to number of settlement instructions (Equation 2.2). 4 Scale elasticity coefficients of costs with respect to value of deposited securities (Equation 2.3). 5 Ray scale elasticity coefficient with respect to multiple outputs, NSETT and VDEP (Equation 2.4). 6 Inverse of c
Rayε .
The scale elasticity coefficients with respect to the single- and multiple-output case as well as the Ray average cost (S) are reported in Table 4.4, Panels A and B. The inverse of S is the scale elasticity of the combination of the two outputs. The median scale elasticity coefficient of the combined sample with respect to the number of settlement instructions processed in the system is 0.696 and 0.534 in Panels A and B of Table 4.4, respectively. In other words, cost would increase by almost 70% (53%) if the number of securities settled in the system is doubled. This means that there are significant scale economies involved in settlement operations. On the other hand, the elasticity coefficient is 0.180 with respect to the value of deposited securities, ie an increase in cost of 18% if the value of deposited instructions is doubled. This demonstrates that overall economies of
245
scale also exist to a large extent in depository activities. Moreover, evidence suggests that doubling both outputs pays off because costs would only increase by around 70%. A comparison of the results with the outcome of the estimated log linear model reveals almost identical results. For brevity, only the corresponding median estimates of the combined sample for the loglinear models are reported. Here, the doubling of settlement and depository businesses is associated with only 71% to 74% higher costs. Analysing the data by geographical regions, we notice the existence of high economies of scale in the European and Asia-Pacific sub-samples. For example, in the European sub-sample, domestic CSDs show the highest potential for cost savings. The doubling of operations in CSD and ICSD systems would increase costs by 63.9% and 69.6% (68.6% and 71.4%) in the single (multiple) output case respectively. However, the experiences of the US system reveal a different picture. Indeed, the US settlement system suffers from substantially higher costs relative to other regions in processing twice of their outputs. For example, the costs would increase by 94% if the number of settlement instructions were doubled. Thus, the centralised US system operates at an almost optimal scale and acts as a cost benchmark meaning that the doubling of activities does not improve cost effectiveness. In order to gain further insights into economies of scale in the settlement industry, we estimate cost elasticities for four different size categories based on the median number of settlement instructions. Clearly, significant economies of scale exist for smaller systems, independently of the number of outputs considered. The cost of processing twice the number of settlement instructions is 56% among the smallest institutions. Economies of scale also exist among the largest settlement institutions, although the extent of savings in unit costs is relatively low. The doubling of the number of settlement instructions for the largest settlement agencies implies a cost increase of around 80%, depending on the model specification. According to our findings, the smaller settlement service providers can exploit high potential economies of scale. This may result in average or unit cost reductions as the level of output increases per time period. Importantly, in the presence of such economies of scale, smaller settlement institutions may be well advised to accelerate investment plans, reduce prices, and thereby increase overall production at a lower unit cost than if scale economies were absent. These findings also bear important implications for the competitive structure of the settlement industry. It can be inferred that mergers/alliances especially of smaller institutions may be cost

246
advantageous. It might be optimal for smaller settlement service providers to form implicit mergers in order to process more settlement business through a lower number of systems. Thereby, costs may be spread over a wider number of transactions and settlement services could be provided at a lower cost. Moreover, our findings suggest that greater integration of different systems would allow settlement service providers in the European area and Asia-Pacific region to directly benefit from economies of scale. Accordingly, the rule of thumb of �two-thirds� applies in the settlement industry that costs should increase by about 65%�70% as output or potential volume doubles. The centralised US model appears to serve as the cost-saving benchmark. However, when interpreting the results one should bear in mind that it is unlikely that the centralised US model could be successfully implemented in the EU at least in the short and medium run given a plethora of integration barriers, including national differences in information technologies and interfaces, taxation, legal certainty, cultures, etc.5 Table 4.5 Scale economies and technological progress
tTC∂∂
− Model IIb
[1 output, input, trend, ICSD] Model IIIb
[2 output, input, trend, ICSD] Total
average
Translog �0.0514 �0.0522 �0.0518 Loglinear �0.0380 �0.0376 �0.0378 Total average �0.0447 �0.0449 �0.0448
As discussed in Section 3, we are also interested in seeing whether the influence of technology-related initiatives and expenses generated cost savings over time. We estimate the influence of technological progress indirectly by including the time trend term (T) in the loglinear and translog model specifications. Differentiating the cost function with respect to T and taking it with the negative sign yields a measure of technical progress. The derived estimates reported in Table 4.5 suggest that settlement institutions were able to become more cost effective over time at an average yearly rate of 4.5% of cost reduction, made possible by the intensive use of and investment in new technologies and system updates. Strikingly similar results are obtained by alternatively controlling for time, when dummy variables for each year enter the estimations according to Models IIc and IIIc.
5 Consult Giovannini Group (2002) for a more detailed discussion on barriers to efficient cross-border clearing and settlement in the EU.

247
The estimates reveal negative coefficient signs for all yearly variables suggesting yearly cost reductions due to technological progress. The only exception is 1995, when the operating cost of the settlement institutions rose at a rate of 6.3%, possibly reflecting intensive investments in upgrading settlement system technologies. In later years, these investments seemed to pay off in helping settlement institutions become more cost-effective, as evidence indicates a statistically significant and peak annual cost reduction by 16.21% from 1999 to 2000. These findings are consistent with the academic literature (Litan and Rivlin, 2001), where significant savings were generated by the productive use and implementation of technology. Additionally, recent research on the stock exchange industry reports comparable results of productivity improvements over time due to technological change and money spend on new technologies (Chapters 3 and 4). Table 4.6 Relative efficiency of individual settlement institutions
Code Model IIb [1 output, 1 input, trend, ICSD]
Code Model IIIb [2 output, 1 input, trend, ICSD]
CRE �0.3068 NEC �0.2936 JAS �0.2943 CRE �0.2769 NEC �0.2807 MON �0.1893 MON �0.2117 VP �0.1552 VPS �0.1500 SEG �0.0777 VP �0.1440 DTC �0.0419 CDS �0.0060 VPS �0.0085 ECB 0.0000 ECB 0.0000 CED 0.0141 CED 0.0112 DTC 0.0272 CDS 0.0228 HSC 0.1014 JAS 0.0744 SEG 0.1473 VPC 0.0974 VPC 0.1894 DBC 0.1958 DBC 0.2589 HSC 0.2071 SIC 0.3102 SIC 0.2150 APK 0.4658 APK 0.5372
Notes: The coefficients reported in this table are calculated as residuals from the models including outputs, input, and binary variables. The scores are listed in descending order according to the relative efficiency levels of the individual settlement institutions. It is also useful to analyse the relative operative efficiency of settlement institutions. Table 4.6 provides preliminary analysis based on the results shown in Table 4.4. Residuals of our preferred models provide indicative information on the efficiency of the individual settlement service providers. One should note that the log of the residuals provides us only with information on the deviations from the estimated average cost performance. This information does not take

248
returns to scale into account, meaning that it is only possible to compare settlement institutions that are of the same size. A more detailed picture could be obtained by carrying out efficient frontier analysis, which is beyond the scope of this paper. However, in spite of the limitations of the analysis, it documents that settlement service providers of equal size seem to experience extreme differences in efficiency. Especially, this should raise concerns for the service providers that are ranked at the bottom of the table. Owners of the SICOVAM have actually taken important steps in order to improve overall efficiency, as evidenced by the initiative to integrate and carry out settlement businesses as a wholly-owned subsidiary of the Euroclear Group.
249
5 Conclusions This paper examines economies of scale in the depository and settlement industry. The key intention is to inquire whether there is any potential cost saving from expanding depository and settlement businesses, drawing particularly on the experiences of settlement institutions by region of the world, by size and scope of settlement services. The paper investigates the existence and extent of economies of scale among settlement institutions using loglinear and translog cost functions. As acknowledged in Giovannini Group (2002), the importance for such analysis derives from the fact that the removal of cost inefficiencies in clearing and settlement is a necessary condition for the development of a large and efficient financial infrastructure, in particular for the European context. The overall results of this study reveal the existence of substantial economies of scale related to both depository and settlement activities. On average, the centralised US system is found to be the most cost-effective settlement system and may act as the cost- saving benchmark. However, settlement institutions from the European and Asia-Pacific regions show the highest potential in unit cost savings. Similar results were found for relatively smaller service providers where a doubling of settlement and depository activities would increase costs by 2/3. The findings also suggest that operating costs for carrying out cross-border settlement appear to be much higher than operating a domestic CSD, reflecting the current complexities of EU international securities settlement and differences in the underlying scope of ICSD services. Moreover, the evidence indicates that operating costs decreased continuously over time, possibly due to investments in implementing new systems or upgrading settlement technology. The results clearly support the formation of mergers and alliances among smaller settlement institutions. In other words, expansions or the pooling of depository and settlement businesses is likely to enhance savings in unit costs for small and medium-sized institutions. This effect tends to be less pronounced for bigger service providers. Therefore, smaller institutions may be well advised to accelerate investment plans, reduce prices, or form implicit mergers, thereby achieving higher production at a lower unit cost in their depository and settlement businesses. Our results also suggest that regulation matters a lot for the effectiveness of the operative infrastructure in the settlement industry. We find that in the regulated and centralised US market, settlement is

250
carried out on an almost optimal scale compared to the corresponding systems in the European and Asia-Pacific regions. However, it is strongly questionable to what extent a US style model can successfully be implemented in the EU at least in the short and medium run given a plethora of integration barriers in the EU. In its current state, a possible outcome of the further integration of the settlement infrastructure in the European area is likely to be some kind of collaboration or consolidation of existing CSDs, while totally new infrastructure solutions could be more feasible in other markets.

251
References Annual Reports (1993�2000) Annual reports of 16 depository and
settlement institutions. Arnold, T. � Hersch, P. � Mulherin, J.H. � Netter, J. (1999) Merging
markets. Journal of Finance, 52, 655�681. Bank for International Settlements, various issues. Statistics on
Payment Systems in the Group of Ten Countries, Basel. Baumol, W.J. � Panzar, J.C. � Willing, R.D. (1988) Contestable
markets and the theory of industry structure. Harcourt Brace Jovanovich, Publishers, Orlando, Florida 32887, USA.
Berndt, E.T. (1991) The practice of econometrics: Classic and
contemporary. Massachusetts Institute of Technology and the National Bureau of Economic Research, Addison-Wesley Publishing Company, Inc.
Domowitz, I. � Steil, B. (1999) Automation, trading costs, and the
structure of the trading services industry. Brookings-Wharton Papers on Financial Services, 1�52.
European Central Bank Blue Book, various issues. Payment and
Securities Settlement Systems in the European Union, Frankfurt am Main.
Gehrig, T. (1998a) Cities and the geography of financial centers.
University of Freiburg and Centre of Economic Policy Research, London, Discussion Paper 1894.
Gehrig, T. (1998b) Competing markets. European Economic
Review, 42, 277�310. Giddy, I. � Saunders, A. � Walter, I. (1996) Alternative models for
clearance and settlement: The case of the single European capital market. Journal of Money, Credit, and Banking, 28, 4, 986�1000.

252
Giovannini Group (2002) Cross-border clearing and settlement arrangements in the European Union. European Commission Economic papers.
Hasan, I. � Malkamäki, M. (2001) Are expansions cost effective for
stock exchanges? A global perspective. Journal of Banking and Finance, 25, 12, 2339�2366.
International Monetary Fund, various issues. International Financial
Statistics, Washington. Lannoo, K. � Levin, M. (2001) The securities settlement industry in
the EU structure, costs and the way forward. CEPS Research Report.
Litan, R.E. � Rivlin, A.M. (2001) Projecting the economic impact of
the internet. American Economic Review, 91, 2, 313�317. Malkamäki, M. � Topi, J. (2002) Future challenges for securities
and derivative markets. Research and Banking and Finance, Elsevier Science, forthcoming.
Murray, T. (1999) Thomas Murray CSD Guide. Thomas Murray
Publications Ltd. Pirrong, C. (1999) The organization of financial exchange markets:
Theory and evidence. Journal of Financial Markets, 2, 329�357. Smith, C.W. (1991) Globalization and financial markets. Carnegie-
Rochester Conference Series on Public Policy, 34, 77�96. Stulz, R.M. (1999) Globalization of equity markets and cost of
capital. NBER Working Paper Series 7021.

253
Appendix Table A 3 Linear logarithmic expansion path estimation
Explanatory variables Coefficients Parameter estimates
Dependent variable VDEP Intercept α0 10.913*** (13.80) NSETT αQ1 1.070*** (12.59) R2-adjusted 0.6745 F-statistics 158.48*** N 77

254

255
Chapter 7
Discussion and conclusion of the study
Heiko Schmiedel
1 Limitations ...............................................................................256 1.1 Market structure ...............................................................256 1.2 Efficiency and productivity analysis ................................258 1.3 Aspects of comparability and performance ......................259 2 Conclusion and future perspective ...........................................260

256
1 Limitations
1.1 Market structure
The analysis of the present study traces the performance of stock exchanges and securities settlement providers across different types of entities, markets, and over time. The analysis focuses on the effects of securities infrastructure providers� operational and strategic choices on their capabilities to generate revenues and to perform cost efficiently. The study further examines the impact of network strategies of stock exchanges on the quality and cost of trading. The results of this study are homogeneous and for the most part intuitive. However, the results presented here are also subject to certain limitations. When seen in the correct light, some aspects of a possible future perspective can emerge from the present study and can lead to cohesive answers and policy implications. A first important limitation relates to the role of market structure and level of competition in the performance of the securities industry. To put it differently, to what extent is the performance of securities infrastructure providers driven by their competitive conditions as reflected by overall market concentration and firm-specific market shares or to what extent is it determined by efficiency and productivity? The study assumes a perfect competitive situation in which stock exchanges and securities settlement providers operate. The study considers performance to be synonymous with profitability or with the extent to which exchanges and settlement providers are efficient at minimizing costs or maximizing revenue. In practice however, profit maximization and/or cost minimization is not necessarily observed for various reasons. First, exogenous factors such as regulations, national protectionism, taxation, and economic shocks can cause suboptimal outcomes and performance. Although not negligible when making proper judgments and comparisons of the contestability and performance of securities markets, the study broadly abstracts from such influences. An attempt was made to control for the overall economic environment in different markets in the models. However, empirically, the role and significance of such individual variables is not obvious to describe. At present, it is a recurring problem in the literature and hence the issue of other exogenous factors is also not

257
entirely solved here. Surely, more needs to be done with respect to data collection and compiling information on these factors. Possible other explanations for deviations from profit maximizing behavior might be determined by the competitive environment and inefficiency problems. The latter has been extensively studied here and refers to the inefficient and suboptimal use of inputs given outputs and vice versa. The former basically seeks to explain performance through market structure conditions, such as the size and number of firms and market entry conditions. Of course, it cannot be ruled out that the performance of trading and post-trading service providers is the direct result of market power or structure. As mentioned in Chapter 1, literature on industrial structures of stock exchanges measuring competition effects is as yet in a very premature state. However, first research initiatives confirm that exchanges, often deemed local monopolies, actually face competition from other exchanges as well as brokers. This reasoning confirms that an important alternative engine driving stock exchanges� and securities settlement providers� performance relates to efficiency. In any case, future research may shed more light on these issues by focusing on alternative variables to control for competitive conditions and by estimating a market power model to ensure robust and interpretable results. Such new approaches should also take into consideration the role of firms� strategic and competitive behavior. By this is meant the way securities infrastructure providers react to each others� decisions. Technically, if longer and more detailed data series were available, this would allow for estimating firm-specific reaction functions and possibly contribute to a more complete picture of the relationship between performance and market structure conditions. A second concern relates to the definition of the relevant market of stock exchange and securities settlement providers. In particular, the analyses in Chapters 2, 3, 4, and 6 are based on the observation from the annual reports that the securities infrastructure providers have been generating fairly homogeneous and comparable outputs in the past. However, it is debatable whether there is indeed one securities exchange market. Taking a more forward-looking perspective, these traditional lines in the functions and products may become more and more blurred in the future as stock exchanges may seek to diversify their income structures, responding to increased competition from other exchanges and other alternative trading venues. Especially in today�s modern securities markets on-exchange trade execution seems to become a commodity. One may question what kinds of intermediation services are needed in an electronic trading environment? This goes hand in hand with reflection on what the

258
future scope will be for exchanges to �de-commoditise� or �re-intermediate� their businesses. The term �re-intermediation� refers to the process by which a dis-intermediated entity is re-established in the new and fully automated environment. Accordingly, this might involve a re-bundling of trading services initiatives, eg post-trade services, trading strategies, aggregate liquidity information, etc. These are open issues that go beyond the scope of this thesis and are therefore left for future analysis. 1.2 Efficiency and productivity analysis
Another important issue is that a persistent paradox exists in stochastic frontier efficiency research. This imbalance states that one cannot compare the efficiency or productivity of firms without assuming these firms to operate under a common frontier. More explicitly and taking the extreme case, each stock exchange and securities settlement provider should operate under its own frontier since its set of marketable outputs and employed inputs will never match the input-output mix of their competitors. Furthermore, stock exchanges and settlement system providers may not always have the same access to technology in different countries. However, in order to benchmark the securities infrastructure providers, it is assumed that they belong to a common frontier. In this study, it is assumed that the sample entities have access to the same frontier technology. As a result, the same sample entities having different sizes, sharing the same multiple input-output sets, operating within the same international economic environment are pooled under a single frontier. As many researchers note that the assumption of a single frontier is an unsettled issue in the efficiency literature, this imbalance is not exclusively inherent in the framework of this study. Future studies may need to face this imbalance. Empirical modeling calls for a framework that allows for efficiency comparisons of firms in n groups without having to assume that they operate under a single identical frontier. Such new methodology would also enable measuring the degree of homogeneity or convergence of international securities markets over time, eg by assessing the distance of country-by-country results from a common international frontier. By this calculation, �truly� comparable cross-country efficiency scores for firms could be obtained. Within this approach, further insights could be gained with respect to technological gaps of firms or exchanges in a given country relative to the technology available to the industry as a

259
whole. However, this approach requires long data series with a very large number of observations since a first step in the analysis would involve the estimation of country-specific frontiers before comparing the obtained efficiency scores against the industry standard. Therefore, these broader aspects of stochastic efficiency modeling may be promising directions for future frontier analysis. 1.3 Aspects of comparability and performance
A final issue relates to the comparability of securities exchanges and settlement systems. The models presented in this study adjust for size and type of exchange and settlement institution, for example including whether they are automated or not, whether they trade derivatives or equities, whether they are an international CSD or domestic one, etc. As a self-critical commentary, one should acknowledge that exchange markets also differ along other important criteria, making direct comparisons less obvious. For example, exchanges and settlement providers may differ in terms of liquidity, transparency, average bid-ask spreads and other transaction costs, average speed of executing trades, average clearing and settlement cycles and services, and jurisdictions, eg investor protection, enforceability of contracts, bureaucratic delays, and commonality of language and legal system. These are important omissions as they bear the potential to directly or indirectly influence the relative performance of markets. In fact, this limitation is related to the previous ones: as more data become available, one might be able to take into account additional criteria or groupings of exchanges and settlement providers. To defend the chosen approach in this study, Chapter 5 tries to overcome these omissions. Here, an attempt was made to test whether network strategies improve the quality and costs of trading services, thereby taking additional measures and market characteristics into account, eg cost and revenue efficiency, trading costs, capitalization, growth of market capitalization, turnover velocity, networks, accounting standards, concentration ratios, and economic environment. However, more needs to be done in particular with respect to capturing the impact of advances in new technologies and communication means on stock market structure and performance.

260
2 Conclusion and future perspective
In concluding, what does this study say about the strategies available to stock exchanges and securities settlement system providers to meet the challenges that lie ahead in a globalizing world? Although no concrete picture exists of what the future trading and post-trading landscape will look like, there are a number of findings that appear to have particular relevance and that can be used to extrapolate current trends to a possible future of the securities industry. Tomorrow�s world securities markets are characterized by ongoing integration and consolidation initiatives. In this process stock exchanges and settlement providers are devising strategic responses in a number of directions in order to best meet investors� demands for lower trading costs, improved liquidity, and immediate access to international trading and settlement. Key in this development are economies of scale, efficiency gains, and the adoption of network technologies encouraging competition and consolidation among securities trading service providers. Efficiency and productivity gains. The evidence presented in this study suggests the existence of large potential efficiency gains across exchanges. Investments in standardization and new technologies pay off in productivity gains and automated trading overcomes distance constraints and improves efficiency. Hence, the ongoing formation of alliances and networks compounded with enormous investments in new technologies and trading system upgrades are probably helping to enhance efficiency, as exchanges take advantage of all aspects of increased scale economies. Significant scale economies. This study shows that overall economies of scale exist among the major securities settlement system providers, possibly leading to increased productivity in the future. This research further argues that such cost-cutting opportunities in so-called back-office activities are most prone to occur in European markets. Network strategies. Recent developments in equity and derivative markets provide evidence that technology is already sufficiently advanced and available at very modest cost to enable investors to trade via networks. The empirical analysis reports that adopting network strategy helps in attracting higher liquidity, market growth and efficiency, as well as in lowering transaction costs. Taking advantage of new technologies, alternative trading systems and

261
electronic communication systems increasingly enter the order routing and execution chains through which a considerable portion of transactions is already channeled. Concerning the future shape of modern global securities market infrastructure, one may anticipate continued and increased merger activities and alliances among exchanges and settlement institutions in the near future. Consider, for example, recent European initiatives demonstrating various integration efforts pointing towards an increased networked and integrated securities landscape combined with efficient governance practices. Also transatlantic networks and mergers would be beneficial in terms of reductions in the cost of trading, ie costs associated with marketplaces and intermediaries, bid-ask spreads and market impact costs. As this study suggests, greater scale and network externalities are the key responses and will favour the global players. Thus, it is most likely that a few large market institutions are the great winners and will take the lead in shaping future securities markets, with the limits to size being defined by the heterogeneity of the instruments traded. A lot of mid- and smaller-sized institutions may find it difficult to survive in future exchange markets. Their success will basically depend on their ability to adapt to increased competition either through greater size or specialization. Extensive technological and marketing investments will increase the chances of achieving superior performance and viability of stock exchange and settlement systems in the future. International competition and regulatory authorities should act as a catalyst promoting safe, efficient and integrated securities infrastructures with the aim of exploiting potential benefits from economies of scale. At the same time, it is crucial that market infrastructures are kept contestable. Authorities should ensure enough competitive pressure preventing providers of infrastructure services from exploiting monopoly pricing. The markets of the future will likely be fully automated and worldwide. In the long-term perspective, the fundamental issue seems to be that the existing distinction between exchanges and alternative trading systems or electronic brokers may become increasingly blurred. In this scenario, the traditional role and organization forms of exchanges will no longer be unchallenged.

262
263
Appendix
The data Sample data Data on European and international stock exchanges and securities settlement providers have been collected from a number of sources. The most important data source comprises publicly available balance sheets and income statements of stock exchanges� and settlement providers� annual reports. The annual reports provide the cost, revenue, input and output data for stock exchange and securities settlement industries in Europe and worldwide. Additional data has been taken from the: Bank for International Settlement Payment Statistics; Center for International Financial Analysis and Research; Elkins/McSherry Universe Database; European Central Bank Blue Book; Federation of European Stock Exchanges; International Federation of Stock Exchanges Annual Yearbook; International Monetary Fund Financial Statistics; Internet pages of the stock exchanges and settlement institutions; MSCI Handbook of World Stock, Derivative, and Commodity Exchanges; and the Thomas Murray CSD Guide. In all, data for the stock exchange sample has been pooled for the period 1985 to 1999. In the initial analysis presented in Chapter 2, the beginning year 1985 was chosen to capture the advent of technological developments and advances in the automation of trade processing in the stock exchange industry to the greatest extent possible. It should be mentioned that only a small number of observations could be obtained for these early stages. Therefore, Chapters 2 to 4 focus mainly on the period from 1993 to 1999. Importantly, this time period spans the generalization of the demutualisation process of stock exchanges. In 1993, for example, the Stockholm Stock Exchange was the first bourse to have privatise its ownership structure. Because stock exchanges publish their annual reports with a time lag of at least one year, the most current data that could be obtained at the time of analysis was for the year 1999. Due to

264
data availability, Chapter 5 covers a 5-year time period and ends with the most updated data as of the year 2000. For the same reasons as stated above, the data sample of securities settlement system providers in Chapter 6 covers the time period 1993 to 2000. Since the study takes an international approach, it examines comparatively the productivity and efficiency of a wide range of developed and emerging markets. Overall, the study covers 49 major stock exchanges worldwide, of which 29 are registered in Europe. More specifically, the European exchanges sample includes: Amsterdam, Athens, Barcelona, Bilbao, Brussels, Budapest, Copenhagen, Dublin, Frankfurt, Helsinki, Istanbul, Lisbon, Ljubljana, London, Luxembourg, Madrid, Malta, Oslo, Paris, Prague, Reykjavik, Riga, Stockholm, Tallinn, Valencia, Vienna, Warsaw, Zurich. The worldwide panel sample used in Chapter 2 comprises the stock exchanges: Amex, Amsterdam, Athens, Australia, Barcelona, Bilbao, Brussels, Buenos Aires, Chicago, Copenhagen, Dublin, Frankfurt, Helsinki, Hong Kong, Istanbul, Italy, Jakarta, Johannesburg, Korea, Kuala Lumpur, Lima, Lisbon, Ljubljana, London, Luxembourg, Madrid, Mexico, Montreal, Nasdaq, New Zealand, NYSE, Osaka, Oslo, Paris, Philippine, Rio de Janeiro, Santiago, Sao Paulo, Singapore, Stockholm, Taiwan, Tel Aviv, Thailand, Tokyo, Toronto, Vancouver, Vienna, Warsaw, Zurich. The sample in Chapter 6 consists of 16 settlement institutions, namely: Clearstream Luxembourg, Euroclear, APK, CrestCo, Clearstream Frankfurt, Monte Titoli, Necigef, SegaIntersettle, Euroclear France, Danish Securities Centre, VPC, Verdipapirsentralen, Canadian Depository for Securities, Depository Trust & Clearing Company, Hong Kong Securities Clearing Company, Japan Securities Depository Center. It should be noted that not all years are available for all exchanges or settlement providers. Those institutions with missing variables have been eliminated from the original database and in some cases, observations have been omitted when failing a standard set of criteria for data quality. Since the DEA measurement concept requires a balanced panel structure, the dataset in Chapter 4 is constrained to be balanced. In order to keep as many institutions as possible in the sample, the remaining Chapters are based on unbalanced datasets. Outliers were considered by computing simple key performance ratios and by estimating the models with all observations. The obtained scores were then checked for outliers. All observations suspected of being outliers were removed and the models were re-estimated. The results were then reported with all observations (corrected by the outliers) depending on whether the coefficients changed significantly. To ensure that variables were calculated similarly across countries and

265
over time, all national currencies were converted into U.S. dollars and were inflation-adjusted using CPI. The CPI and exchange rate series were taken from IMF International Financial Statistics. 1995 was arbitrarily chosen as the basis year. To control for scale differences in the data, all variables other than qualitative proxies are expressed in natural logarithms. All data was measured on an annual basis. Variables Cost and revenues: Consistent with most efficiency and productivity studies, stock exchange and settlement institutions are assumed to be multi-product firms that incur operating costs (and generates revenues), while producing outputs and using inputs. In Chapters 2, 3, and 6, the total operating costs and total revenues for the i-th stock exchange or settlement institution in the t-th time period include the following components:
ititit
itit
itit
costsOther offs- Write costs Office costs Personnel costs tiveAdministra
costs related IT and Systems costs Total
+++++
= (A.1)
and
itit
ititit
revenuesOther revenues Services revenues Trading revenues Listing revenues Total
++++=
(A.2)
The vast majority of the entities under consideration in this study follow the International Accounting Standards rules in their financial statements. However, the reporting schemes of the balance sheets and profit and loss accounts vary to some degree across entities due to different financial and accounting practices and policies. Therefore, disaggregated information on the cost and revenue components is not always available. In these cases, aggregated data on costs and revenues is taken into the database. Consequently, the sample size is limited due to the lack of detailed breakdown information in some models. However, in sub-sample estimations in Chapter 3, the total of technology and automation-related costs encountered by the i-th exchange in the t-th time period was taken into consideration. Likewise, data on revenues generated by listing and trading fees were employed in sub-sample estimations in Chapter 3.

266
Unfortunately, disaggregated cost and revenue data for securities settlement providers is not available in many of the annual reports. Therefore, data on an aggregate level is used in the models. Output: Concerning stock exchanges, two relevant proxies for trading system output are considered. These include the number and value of executed transactions dealt on the i�th exchange in the t�th time period. The turnover is defined as the total value of shares traded. The turnover figures are single counted, ie only one side of the transaction is considered. According to the Federation of International Stock Exchanges, it should be noted that stock exchanges sometimes use different definitions and calculation methods to compile turnover statistics. Consequently, there might be some differences in the total value of shares traded data. However, most of the reporting exchanges use a common data methodology for the value of trades statistics. The available turnover variables should serve as reasonable proxies. The output associated with company listing procedures and monitoring of company-specific information is approximated by the number and value of companies listed on the i�the exchange in the t�th time period. The latter reflects the value of the market at a given time. It is the market capitalization, defined as the total number of issued shares of domestic companies multiplied by their respective prices. Calculating percent changes in the market capitalisation of the respective markets yields the market growth. In order to calculate the growth variable, 1995 market capitalisation data was included in the data for the sample exchanges in Chapter 5. The listed shares variable represents the number of companies that have shares listed on a specific exchange. A company with several classes of shares is counted as one. Concerning the output generated by securities settlement and depository institutions, two measures are considered. One possible proxy for the settlement service is the number of securities settled in the i�th system in the t�th time period. The second output variable with respect to the depository business is approximated by the value of securities deposited in the system. Input: Turning to input prices, there is no direct measure readily available for inputs of stock exchanges and securities settlement providers. This is partly due to incomplete data on key items in the annual reports for a number of years during the sample period. However, the two most important input prices for the operations of securities infrastructure providers are costs associated with office and IT systems, and employees. Disaggregated data on the latter is not available in many of the annual reports. To include at least one input price variable and for the sake of including in a first attempt the

267
greatest number of entities and years in the sample, per capita gross domestic product is used as a rough proxy for labour cost differences across countries. As such, difficulties related to missing employee data are mitigated in the analyses presented in Chapters 3 and 6.1 In the estimations on European exchanges and in sub-sample regressions presented in Chapters 2 and 3 respectively, it is possible to get actual labour cost data for a smaller number of exchanges. Here, the price of labour is measured as the total expenditures on employees scaled by the total number of full-time equivalents at the end of the year. Information on part-time employees is not available and therefore is not considered here. As a second input variable, the price of physical capital is included in the models. The price of capital is computed as the total capital expenditures, ie office expenses, IT and system costs, and equipment, divided by the sum of office premises and equipment of the i-th stock exchange in the t-th time period. Organizational and ownership variables: In order to reflect the organizational and ownership structures of stock exchanges and settlement institutions, a set of additional variables was collected and taken into the database. To start with, data on the number of years that an exchange has been in business was used as a proxy for professional experience of the entities under consideration. Some exchanges have expanded their operations to include derivative and settlement businesses. Many of these do not publish sectoral cost figures. To make inter-institutional comparisons more accurate, such differences in the reported cost data were incorporated by adding a binary variable in the models. Another dummy variable controls for the degree of automation in order processing on the exchange. The variable equals one if an exchange has switched from materialised to fully automated trade execution, otherwise zero. Related to this, an additional dummy equals one if an exchange offers access for remote trading to its participants, zero otherwise. A direct measure for local competition not being available, it has been proxied by the total number of exchanges in the respective country. Similarly, a variable was added that controls for recent mergers. If an exchange has merged with another entity, the proxy equals one, otherwise zero. With respect to the trading activities, an additional variable reflects the number of hours the exchange is open for trading per day. For the purpose of comparability across exchanges, only the main trading session is considered, excluding pre-opening and pre-trading as well as after 1 As a robustness check, it turned out that the estimations using GDP per capita as a labour input proxy do not yield fundamentally different results for the same sample of exchanges compared to the estimations using more direct measures of inputs.

268
market and post-trading sessions. The trading hours data was gathered from the stock exchanges� annual reports, the MSCI Handbook of World Stock, Derivative, and Commodity Exchanges, and the Federation of European Stock Exchanges. Another variable controls for the legal and ownership structure of the exchanges, allowing for a more detailed analysis of stock exchanges business. This variable splits up two groups. The first category includes exchanges registered as private, limited companies, which have privatised or demutualised. This category regroups also publicly listed exchanges. Common to the exchanges of the first category is the commercial attitude and for-profit business motive. A value of one is assigned to this group. The second category is composed of exchanges registered as private, limited companies with ownership restricted to their members, also including associations or cooperatives. Exchanges with another legal status, including a public or semi-public structure, are also gathered in this category. A value of zero is assigned to this group. Unfortunately, within the trend towards demutualised exchanges, no detailed information could be obtained on different transformation stages and hybrid categories embracing various forms of legal and ownership structures. With respect to securities settlement institutions, two international central securities depositories are included in the sample, namely: Euroclear and Clearstream. It should be noted that these institutions differ from their domestic counterparts with respect to the scope of their services and markets. However, in order to control for such differences in the reported cost data, a binary variable is included in all models highlighting the two ICSDs whose business activities and cost data might differ from the services and nature of the domestic CSDs. Other balance sheet items: In order to capture size effects in the efficiency scores of stock exchanges, two additional variables are included in the estimations in Chapter 2. These variables represent the sum of financial and non-financial assets and the total capital of the i�th exchange for the t�th time period respectively. Network variables: In order to examine network linkages, a set of variables has been constructed reflecting all mergers, strategic cooperation, and market-interconnections among European stock exchanges. Cross-sectional data was obtained by taking a snapshot of existing linkages between exchanges at the end of the year 2002. Tracing back the development of each market connection to its year of implementation and establishment yielded the data on the experiences of European exchanges from 1995 to 2000. Reflecting technological

269
developments and more flexible governance structures, it should be noted that exchanges created such linkages increasingly after 1997/98. The data sources include the annual reports and Internet pages of the stock exchanges and the work of Cybo-Ottone et al (2000), Domowitz (1995), Domowitz and Steil (1999), Lee (1998), and Licht (1998). As mentioned by previous researchers (Cybo-Ottone et al, 2000), it should be noted that a classification of networks is not readily available and that there is only limited access to information and details on announcements and implementation status of co-operation and linkages among exchanges. Accordingly, one drawback when gathering such information is that the underlying categorisation might differ from the official views stated by the exchanges themselves. However, the information available in this study serves as a rough proxy for the network connections and inter-linkages in the European trading industry. In particular, the following network variables are used in the study: the first binary variable approximates if an exchange is engaged in networks and maintains network access. Secondly, the overall network activity of exchanges is measured by the total number of different types of networks. The third variable is calculated as the total number of the trading members connected through the respective market network. This variable was further split up along different securities segments, ie equity markets, derivative markets, and new markets for innovative and mostly high tech-oriented companies. Stock market variables: The stock market index performance as used in Chapter 2 was taken from FIBV annual statistics. According to the FIBV definition, indexes are normally chain-linked, ie, accounting for capital operations like new issues as well as changes in the composition of the indexes. Most of the indexes measure changes in the share prices and do not take into consideration returns from dividend pay-outs. Only a few indexes measure the total return on investment on index shares, including reinvested dividends. To control for market concentration, two concentration ratios are employed in Chapter 2. These are a market concentration of 5% of the most capitalized domestic companies and of the 5% most traded domestic companies compared with the total market capitalization of domestic companies and the turnover value of domestic companies respectively. Similarly in Chapter 3 and 5, the extent of influence of larger firms in the exchange is measured by the concentration ratio of the top three capitalized firms to the total market capitalization. The control variable turnover velocity is included in the model to account for the market quality. Following the FIBV statistics, the turnover velocity is computed as the ratio of the turnover of domestic

270
shares to their market capitalization. The value is annualized by applying the following equation:
12tioncapitalizamarket domestic end-Month
turnovershare domesticMonthly velocityTurnover
×
= (A.3)
Transaction cost data: As used already by previous researchers (Pagano et al, 2002), transaction cost data for each European exchange come from Elkins/McSherry (E/M) Universe. The database is a compilation of actual trade data gathered from over 220 large institutions. According to Elkins/McSherry, the data covers over 11 million trades, USD 2 trillion worth of principal and 215 billion shares of trading from 1400 investment managers and 2000 brokers worldwide. It contains information on average commissions, fees, market impact, and total trading costs from 208 exchanges in 42 countries worldwide. Although an assessment of the quality, calculation and computation methodology of the E/S data is beyond the scope of this study, it allows for a comparison of average institutional total trading costs, composed of execution commissions, fees and market impact. The market impact, being considered as a major cost component of the transaction cost, is calculated as the difference between the trade execution price and the stock�s high, low, opening and closing price during the day. The total trading cost is measured in basis points representing the average sum of commission, fees, and market impact. Economic variables: To control for overall economic conditions in the respective market, a set of variables is considered in the study. This includes the GDP per capita in the country where the entity is located, the ratio of total private sector accumulation to GDP, representing the relative importance of the private sector in the country, and the disclosure index, reflecting disclosure and accounting standards. The data on GDP per capita and on private sector accumulation is taken from IMF International Financial Statistics. A method used by previous researchers (LaPorta et al, 1997, 1998; Pagano et al, 2001), the proxy for the quality of the accounting standard is the index of financial reporting practices for industrial companies by country and year taken from CIFAR. In years not analyzed by CIFAR the previous figure was filled forward. Time trend variables: To capture technological change effects as well a linear time trend variable has been added to the models. To

271
check for robustness, binary variables for each year were alternatively included. Overall, it should be noted that every effort has been made to ensure that the data used in this study is accurate at the time of analysis, but possible remaining shortcomings are due to data inconsistencies, errors, or omissions born by the reporting entities.

Publications of the Bank of Finland
Series E (ISSN 1238-1691, print) (ISSN 1456-5951, online)
(Series E replaces the Bank of Finland’s research publications series B, C and D.)
E:1 Jukka Vesala Testing for Competition in Banking: Behavioral Evidence from Finland. 1995. 206 p. ISBN 951-686-447-3.
E:2 Juha Tarkka Approaches to Deposit Pricing: A Study in the Determination of Deposit Interest and Bank Service Charges. 1995. 166 p. ISBN 951-686-457-0.
E:3 Timo Tyrväinen Wage Determination, Ta xes, and Employment: Evidence from Finland. 1995. 212 p. ISBN 951-686-459-7.
E:4 Sinimaaria Ranki Realignment Expectations in the ERM: Causes and Measurement. 1996. 164 p. ISBN 951-686-507-0.
E:5 Juhana Hukkinen Kilpailukyky, ulkomaankaupan rakenne ja taloudellinen kasvu (Competitiveness, structure of foreign trade and economic growth). 1996. 134 p. ISBN 951-686-512-7.
E:6 Eelis Hein Deposit Insurance: Pricing and Incentives. 1996. 120 p. ISBN 951-686-517-8.
E:7 Vesa Vihriälä Banks and the Finnish Credit Cycle 1986–1995. 1997. 200 p. ISBN 951-686-537-2.
E:8 Anne Brunila Fiscal Policy and Private Consumption-Saving Decisions: European Evidence. 1997. 147 p. ISBN 951-686-558-5. (Published also as A-131, Helsinki School of Economics and Business Administration, ISBN 951-791-225-0, ISSN 1237-556X)
E:9 Sinimaaria Ranki Exchange Rates in European Monetary Integration. 1998. 221 p. ISBN 951-686-564-X.
E:10 Kimmo Virolainen Tax Incentives and Corporate Borrowing: Evidence from Finnish Company Panel Data. 1998. 151 p. ISBN 951-686-573-9. (Published also as A-137, Helsinki School of Economics and Business Administration, ISBN 951-791-290-0, ISSN 1237-556X)
E:11 Monica Ahlstedt Analysis of Financial Risks in a GARCH Framework. 1998. 181 p. ISBN 951-686-575-5.
E:12 Olli Castrén Fiscal-Monetary Policy Coordination and Central Bank Independence. 1998. 153 p. ISBN 951-686-580-1.
E:13 Antti Ripatti Demand for Money in Infl ation-Targeting Monetary Policy. 1998. 136 p. ISBN 951-686-581-X.
E:14 Risto Koponen – Kimmo Soramäki Intraday Liquidity Needs in a Modern Interbank Payment System. A Simulation Approach. 1998. 135 p. ISBN 951-686-601-8.

E:15 Liisa Halme Pankkisääntely ja valvonta. Oikeuspoliittinen tutkimus säästöpankkien riskinotosta (Banking regulation and supervision: A legal policy study of risk taking by savings banks). 1999. XLIV + 560 p. ISBN 951-686-606-9, print; ISBN 951-686-607-7, online.
E:16 Juha Kasanen Ilmoitusvelvollisten osakeomistus ja -kaupat Helsingin Pörssissä (Corporate insiders shareholdings and trading on the HEX Helsinki Exchanges). 1999. 146 p. ISBN 951-686-630-1, print; ISBN 951-686-631-X, online.
E:17 Mikko Spolander Measuring Exchange Market Pressure and Central Bank Inter vention. 1999. 118 p. ISBN 951-686-645-X, print; ISBN 951-686-646-8, online.
E:18 Karlo Kauko The Microeconomics of Innovation: Oligopoly Theoretic Analyses with Applications to Banking and Patenting. 2000. 193 p. ISBN 951-686-651-4, print; ISBN 951-686-652-2, online. (Published also as A-166, Helsinki School of Economics and Business Administration, ISBN 951-791-442-3, ISSN 1237-556X)
E:19 Juha Kilponen The Political Economy of Monetary Policy and Wage Bargaining. Theory and Econometric Evidence. 2000. 180 p. ISBN 951-686-665-4, print; ISBN 951-686-666-2, online.
E:20 Jukka Vesala Technological Transformation and Retail Banking Competition: Implications and Measurement. 2000. 211 p. ISBN 951-686-695-6, print; ISBN 951-686-696-4, online. (Published also as A-184, Helsinki School of Economics and Business Administration, ISBN 951-791-518-7, ISSN 1237-556X)
E:21 Jian-Guang Shen Models of Currency Crises with Banking Sector and Imperfectly Competitive Labor Markets. 2001. 159 p. ISBN 951-686-711-1, print; ISBN 951-686-712-X, online.
E:22 Kari Takala Studies in Time Series Analysis of Consumption, Asset Prices and Forecasting. 2001. 300 p. ISBN 951-686-759-6, print; ISBN 951-686-760-X, online.
E:23 Mika Kortelainen Edge: a model of the euro area with applications to monetary policy. 2002. 166 p. ISBN 952-462-001-4, print; ISBN 952-462-002-2, online.(Published also as A-204, Helsinki School of Economics and Business Administration, ISBN 951-791-715-5, ISSN 1237-556X)
E:24 Jukka Topi Effects of moral hazard and monitoring on monetary policy transmission. 2003. 148 p. ISBN 952-462-031-6, print; ISBN 952-462-032-4, online.
E:25 Hanna Freystätter Price setting behavior in an open economy and the determination of Finnish foreign trade prices. 2003. 84 p. ISBN 952-462-045-6, print; ISBN 952-462-046-4, online.
E:26 Tuomas Välimäki Central bank tenders: three essays on money market liquidity auctions. 2003. 232 p. ISBN 952-462-051-0, print; ISBN 952-462-052-9, online.(Published also as A-218, Helsinki School of Economics, Acta Universitatis Oeconomicae Helsingiensis, ISBN 951-791-762-7, ISSN 1237-556X)
E:27 Heikki Hella On robust ESACF identifi cation of mixed ARIMA models. 2003. 159 p. ISBN 952-462-112-6, print; ISBN 952-462-113-4, online.

Suomen PankkiBank of FinlandPO BOX 160, FI – 00101 HELSINKI, FINLAND
Tel +358 9 1831, fax +358 9 174 872, email [email protected]
Subscriptions to the E series of of the Bank of Finland's research publications and changes in address details
Old address details
Company
New address details/subscriptions
Name
Address
Company
Name
Address
New subscription Cancellation Number of copies
SUOMEN PANKKIBANK OF FINLAND
PO BOX 160FI – 00101 HELSINKIFINLAND
Cutalongdottedline.!

ISBN 952-462-132-0ISSN 1238-1691
Vammalan Kirjapaino OyVammala 2004
Performance of international securities m
arkets Bank of Finland Studies E:28 · 2004