Performance of ICT Industry in Six Asian Countriesyasuohoshino.com/2013 Fazli Hoshino, Performance...
24
www.sciedu.ca/ijba International Journal of Business Administration Vol. 4, No. 6; 2013 Published by Sciedu Press 96 ISSN 1923-4007 E-ISSN 1923-4015 Performance of ICT Industry in Six Asian Countries Mohd Fazli Mohd Sam 1,2 & Yasuo Hoshino 1,3 1 Graduate School of Business Administration, Aichi University, Nagoya, Japan 2 Faculty of Technology Management and Technopreneurship, University of Technical Malaysia Melaka, Melaka, Malaysia 3 Institute of Policy and Planning Sciences, University of Tsukuba, Tsukuba, Japan Correspondence: Mohd Fazli Mohd Sam, Graduate School of Business Administration, Aichi University, 10-31 Tsutsui 2-Chome, Higashi-ku, Nagoya, Aichi-ken, 461-8641 Japan. Tel: 81-80-454-5606. E-mail: [email protected] Received: September 29, 2013 Accepted: October 21, 2013 Online Published: November 8, 2013 doi:10.5430/ijba.v4n6p96 URL: http://dx.doi.org/10.5430/ijba.v4n6p96 Abstract This study explores the performance of ICT industry through Sales Growth Rate and Profitability Ratio between ASEAN and East Asia and also through individual country. Data from Orbis Database (OVBD) were analyzed; 24 ICT companies in ASEAN region which involve Thailand, Malaysia, and Philippines; and 231 ICT companies in East Asia; Japan, China and South Korea by using t test and ANOVA techniques. Our empirical results shows that East Asia shows a good performance in Sales Growth Rate but low performance in Profitability Ratio compare to ASEAN in the ICT industry. By comparing the performance of each country, China shows positive performance in the Sales Growth while Malaysia has the low performance in Profitability Ratio; ROSF, ROCE and Korea with its ROA, Profit Margin and EBITDA. Various resources were used to support our findings such as Global Information Technology Report, China Internet Network Information Center, Asian Development Bank and also implying sales maximization theory in this study. Keywords: performance, ICT, East Asia, ASEAN 1. Introduction Information and Communication Technology (ICT) has rapidly developed across the globe which involve many industries. Accordingly, new knowledge and innovation have been created resulting in the continual development in the economy and society. The information and communication technology cluster consists of a large number of different companies, ranging from manufacturers to service providers. It is certain fact that the ICT industry and ICT-enabled innovation in non-ICT industries and services make an important contribution to the economic growth of advanced economies. Vu (2011) conducts a broad empirical examination to investigate the effect of ICT on growth of 102 countries in 1996 to 2005 and found that there are some new growths drivers have materialized and emerged during that period claimed that ICT was an important source of growth. ICT is a general-purpose technology that extents to all areas of the economy, improving and becoming cheaper over time by enabling the new creation of services and goods (Bresnahan & Trajtenberg, 1995). The ICT industry is founded on innovation, and while the economic turmoil may challenge some, it can also overturn the established order and stimulate the emergence of new entrants with new technologies. The speed of ICT penetration has been astounding, particularly in the case of new technologies. Fagerberg & Verspagen (2002) argued that in the last decades, technological change developed rapidly in most today’s successful countries, with ICT-based solutions and demand for R&D infrastructure and skills has made the latecomers difficult to catch-up the pace. Previous researchers have made significant developments in relating IT-enabled capabilities and information technology to firm performance (Kohli and Grover 2008). Mithas, et. al. (2012) finds that the impact of IT investments on sales and profitability is higher than advertising and R&D expenditures. Newly and developed industrialized economies has contributed to economic growth by the ICT industry (Lee, et. al., 2009). Lee and Blevins (1990) had compare with 400 manufacturing and non-manufacturing business performance in two developed countries (DCs), with that in two newly industrializing countries (NIC's) using financial data but none had measured the performance in ICT industry regarding in profitability ratio and sales growth. Therefore, the main objective of this paper is to investigate the performance by analyzing sales growth ratio and
Transcript of Performance of ICT Industry in Six Asian Countriesyasuohoshino.com/2013 Fazli Hoshino, Performance...

www.sciedu.ca/ijba International Journal of Business Administration Vol. 4, No. 6; 2013
Published by Sciedu Press 96 ISSN 1923-4007 E-ISSN 1923-4015
Performance of ICT Industry in Six Asian Countries
Mohd Fazli Mohd Sam1,2 & Yasuo Hoshino1,3 1 Graduate School of Business Administration, Aichi University, Nagoya, Japan 2 Faculty of Technology Management and Technopreneurship, University of Technical Malaysia Melaka, Melaka, Malaysia 3 Institute of Policy and Planning Sciences, University of Tsukuba, Tsukuba, Japan
Correspondence: Mohd Fazli Mohd Sam, Graduate School of Business Administration, Aichi University, 10-31 Tsutsui 2-Chome, Higashi-ku, Nagoya, Aichi-ken, 461-8641 Japan. Tel: 81-80-454-5606. E-mail: [email protected]
Received: September 29, 2013 Accepted: October 21, 2013 Online Published: November 8, 2013
doi:10.5430/ijba.v4n6p96 URL: http://dx.doi.org/10.5430/ijba.v4n6p96
Abstract
This study explores the performance of ICT industry through Sales Growth Rate and Profitability Ratio between ASEAN and East Asia and also through individual country. Data from Orbis Database (OVBD) were analyzed; 24 ICT companies in ASEAN region which involve Thailand, Malaysia, and Philippines; and 231 ICT companies in East Asia; Japan, China and South Korea by using t test and ANOVA techniques. Our empirical results shows that East Asia shows a good performance in Sales Growth Rate but low performance in Profitability Ratio compare to ASEAN in the ICT industry. By comparing the performance of each country, China shows positive performance in the Sales Growth while Malaysia has the low performance in Profitability Ratio; ROSF, ROCE and Korea with its ROA, Profit Margin and EBITDA. Various resources were used to support our findings such as Global Information Technology Report, China Internet Network Information Center, Asian Development Bank and also implying sales maximization theory in this study.
Keywords: performance, ICT, East Asia, ASEAN
1. Introduction
Information and Communication Technology (ICT) has rapidly developed across the globe which involve many industries. Accordingly, new knowledge and innovation have been created resulting in the continual development in the economy and society. The information and communication technology cluster consists of a large number of different companies, ranging from manufacturers to service providers. It is certain fact that the ICT industry and ICT-enabled innovation in non-ICT industries and services make an important contribution to the economic growth of advanced economies. Vu (2011) conducts a broad empirical examination to investigate the effect of ICT on growth of 102 countries in 1996 to 2005 and found that there are some new growths drivers have materialized and emerged during that period claimed that ICT was an important source of growth.
ICT is a general-purpose technology that extents to all areas of the economy, improving and becoming cheaper over time by enabling the new creation of services and goods (Bresnahan & Trajtenberg, 1995). The ICT industry is founded on innovation, and while the economic turmoil may challenge some, it can also overturn the established order and stimulate the emergence of new entrants with new technologies. The speed of ICT penetration has been astounding, particularly in the case of new technologies. Fagerberg & Verspagen (2002) argued that in the last decades, technological change developed rapidly in most today’s successful countries, with ICT-based solutions and demand for R&D infrastructure and skills has made the latecomers difficult to catch-up the pace.
Previous researchers have made significant developments in relating IT-enabled capabilities and information technology to firm performance (Kohli and Grover 2008). Mithas, et. al. (2012) finds that the impact of IT investments on sales and profitability is higher than advertising and R&D expenditures. Newly and developed industrialized economies has contributed to economic growth by the ICT industry (Lee, et. al., 2009). Lee and Blevins (1990) had compare with 400 manufacturing and non-manufacturing business performance in two developed countries (DCs), with that in two newly industrializing countries (NIC's) using financial data but none had measured the performance in ICT industry regarding in profitability ratio and sales growth.
Therefore, the main objective of this paper is to investigate the performance by analyzing sales growth ratio and

www.sciedu.ca/ijba International Journal of Business Administration Vol. 4, No. 6; 2013
Published by Sciedu Press 97 ISSN 1923-4007 E-ISSN 1923-4015
profitability ratio in ICT industry among six Asian countries and between ASEAN and East Asia region. This is the further research from the previous paper (Sam and Hoshino 2013). Thus, the results of this empirical research will give an important indicator of financial report of ICT companies determine the performance by analyzing the sales growth and the profitability ratio among the highly competitive market and less competitive market in the region.
2. Theoretical Background and Hypotheses
2.1 Information and Communication Technology Performance
Over recent decades, modern ICTs have transformed the way in which we live, work and play. Historically, the ICT industry have been viewed as long-term growth industries, riding a wave of innovation and technological development implying growth rates significantly above global GDP growth, even during difficult economic times. Several economies, such as China, Singapore, Japan, Korea and Malaysia had an impact of better-quality access to information communication on economic growth even before the development of ICT. With the good performance on economic growth, their organizations and community had better access to market information. Moreover, they gain from more effective communication with foreign associates and each other. The information and communication technology sector has been, and remains, head of industrial globalization (OECD, 2005).
ICT industry, international delocalization by leading multinational manufacturers mainly based in the Japan, United States and in some European countries had spread their manufacturing activities globally (Amighini, 2005). ICT, in particular, is familiar to play two roles in the economic growth process, first by contributing to the increase in overall investment, secondly by contributing to multi-factor productivity (MFP) growth (Pilat and Lee, 2001).
ASEAN is structuring a network of ICT skills competency hubs to promote partnership amongst these hubs to harness the benefits of ICT applications including training of ASEAN SMEs. ASEAN efforts to establish the Information Infrastructure continued with a view to promote security, interconnectivity, and integrity. National Information Infrastructure profiles database has been created to boost competition, rapid positioning of new technology and ICT investment in the region. ASEAN needs an integrated and strategic approach to achieve these outcomes. With the ASEAN ICT Masterplan 2015, it will provide a clear plan of action till the year 2015.
2.1.1 Malaysia
Malaysia is a rapidly developing economy in Asia. ICT is one of the strategy key focus areas in the 10th Malaysian Plan 2011-2015 for developing the country. By increasing the availability of ICT, infrastructure projects are bring into the workplaces, schools, universities and government offices. Government spending may become more constrained, because of commitments to tackle the budget deficit, but there will be growth areas. There are increasingly attractive opportunities in the IT services area as the government implements measures to make Malaysia a growing regional services and outsourcing hub. Using technologically assisted tools, has led to an increase in the adoption of IT by small business (Sam et. al., 2012).Cloud computing will also be a growth area and the government has named cloud computing as one of its top 10 strategic technology priorities.
2.1.2 Thailand
Information and communications technology expenditures include computer hardware; computer software; computer services; and communications services and wired and wireless communications equipment. ICT market in Thailand is the largest in ASEAN region and despite a serious impact from the recent floods since 2011, is projected to grow at a Compounded Annual Growth rate (CAGR) of 11% over the 2012-2016. Severe impact from the recent flood, sales by the vendors and IT distributors were down by 20-40 percent in the Thailand PC market. However, due to post-flood insurance payments, business demand may recover more rapidly.
2.1.3 Philippines
Philippines is a newly industrialized country in the Southeastern Asia. The nation's most important industries are food processing, textiles and garments, electronics and automobile parts. Labor shortages and rising wages are the challenges that Philippines need to face. Surveys had been done and suggested that many businesses including small and medium-sized enterprises (SMEs) plan to increase IT spending.
2.1.4 Japan
Japan's industrialized, free market economy is the second-largest in the world. Its economy is highly efficient and competitive in areas linked to international trade. ICT sector has an enormous impact on the economic growth of a country. In the ICT market, with fierce competition, Japanese government announced ‘IT New Reform Strategy’ and ‘U-Japan’. The objective of this strategy is to have a sustainable IT group and aim to make Japan top in IT by 2010. With the wide application of ICT in companies’ efforts and productivity gains, the economic can grow very well and the contribution rate of ICT to GDP growth in Japan has reached 40% (MIC, 2006).

www.sciedu.ca/ijba International Journal of Business Administration Vol. 4, No. 6; 2013
Published by Sciedu Press 98 ISSN 1923-4007 E-ISSN 1923-4015
2.1.5 Korea (South Korea)
The vitality of the digital economy is grounded in that ICT producing industries play a leading role in economic growth of Korea. Several researchers have explored the reasons of the wealth of Korea’s ICT industry (Nam et. al., 2009, Sung, 2007, Kim, 2004, Langdale, 1997). Many countries have specialized in smaller ranges of ICT goods and services (Koski et al., 2002) and Korea is one of those countries. Shin, J and Park, Y (2007) argued that narrow-range ICT specialization in production causes a great possibility of weakening the trade and losing comparative advantages. Identifying and developing core ICTs that act as growth engines for the future economy.
2.1.6 China
During the 1990s, with high growing exports in ICT parts and components, ICT production has been increasingly spread across the globe. However, China increased its market shares in ICT from assembly of imported materials to the direct manufacturing of ICT products. China managed to catch-up in high-tech sectors by developing new comparative advantages in the skill and technology demanding stages of production. These rapid developing industries such transportation, information and communication technology (ICT) and energy are the most important providers to China economic success. Ishman et. al., (1994) had mentioned in their paper that the major barriers to the adoption of ICT in China are their internal political, cultural and social environment, questionable attitudes towards computing technology, weakness in functional area knowledge and a low level of information systems ability.
2.2 The Networked Readiness Index
The Networked Readiness Index (NRI) produced by The World Economic Forum, in collaboration with INSEAD in their Global Information Technology Report has been measuring to which economies across the world influence in ICT for greater competitiveness. It has been helping legislators and relevant investors to track their economies’ progress. It had been the best practices in designing strategies and roadmaps for creating optimal ICT diffusion to enhance competiveness. Composition and computation of the Networked Readiness Index can be referred to Attachment A.
From the Global Technology Report, table 1 below shows the selected NRI according to the countries that being analyzed in this study. Korea had led all others in terms of Networked Readiness Index Ranking since year 2007 to 2012 but in 2006 Japan is on top compare to other countries. Meanwhile Thailand drops its position since 2006 from rank 37 to rank 77 in year 2012. Philippines fluctuate its ranking till 2012 but China shows the improvement in their ICT industry through their new economic growth theory and in development through a modernization industrial base phase.
Table 1. The networked readiness index rankings
2006–2007 2007–2008 2008–2009
Country Rank Score Rank Score Rank Score
Japan 14 5.27 19 5.14 17 5.19
Malaysia 26 4.74 26 4.82 28 4.76
Thailand 37 4.21 40 4.25 47 4.14
Philippines 68 3.55 81 3.56 85 3.6
China 59 3.68 57 3.9 46 4.15
South Korea 19 5.14 9 5.43 11 5.37
2009-2010 2010-2011 2012
Country Rank Score Rank Score Rank Score
Japan 21 4.89 19 4.95 18 5.25
Malaysia 27 4.65 28 4.74 29 4.8
Thailand 47 3.97 59 3.89 77 3.78
Philippines 85 3.51 87 3.57 86 3.64
China 37 4.31 36 4.35 51 2.11
South Korea 15 5.14 10 5.19 12 5.47
Source: The Global Information Technology Report and summarize by the authors.

www.sciedu.ca/ijba International Journal of Business Administration Vol. 4, No. 6; 2013
Published by Sciedu Press 99 ISSN 1923-4007 E-ISSN 1923-4015
2.3 Financial Performance
Financial statement analysis is a good techniques which necessarily to calculate and interpreting those financial ratios. Using vertical analysis technique shows financial situation within a single accounting period or horizontal analysis technique which reveals additional information about financial strengths and weaknesses. Assessing the financial performance is essential not only for shareholders but also for company management. It is helpful for measuring the proficiency and success level of company operations and to make plans for the future. Financial performance concept is considered under different meanings such as productivity, return, economic and output growth, using the financial ratios for both companies and related sectors can be suitable for performance evaluation (Yalcin et. al., 2012).
Ratio analysis is widely used to examine firm performance (Feroz et. al., 2003) and is commonly used in financial performance measurement which useful to summarize the financial data and compare the financial performance of the firms (Wild and Subramanyam, 2007). Traditional financial indicators are the most common used financial ratios in the performance evaluation that are usually related to profitability (Yalcin et. al., 2012).
Profitability ratios measure income relative to resources and sales, determining the ability of a company to generate earnings and effective employment of resources. It is considered that a company is doing well when a profitability ratio has a higher value relative to the same ratio from a previous period. Previous researcher determine the effect of determinants of profitability by using return on assets (ROA) and return on equity (ROE) by empirical evidence with similar statistical regression approach (Sayilgan and Yildirim, 2009, Tarawneh, 2006, Chirwa, 2003, Naceur and Goaied, 2001). The return on assets (ROA) and return on capital employed (ROCE) gives long-term perspective of profitability meanwhile the profit rates measured by sales give a short-term perspective of profitability because sales are annual flows (Singla, 2011).
Sales growth rate denotes the percentage change in the sales of a company in a given year with respect to the previous year sales. It tells whether the company’s sales increase or decrease during a specific year and also tells the size of change. Sales growth generally utilizes capacity more fully, which spreads fixed costs over more revenue resulting in higher profitability. If an industry has increasing economies of scale or learning curve effects, growing firms benefit from such effects, again increasing performance. Kaplan and Norton (1992, 1993, 1996) claim that to reach their financial objectives effectively, firms must use a wide diversity of goals, including sales growth.
Lee and Blevins (1990) in their studies by using variables such as Return on Equity (ROE), Return on Assets (ROA), Return on Investment (ROI), Return on Sales (ROS), Growth Rate of Sales (GRS), and Composite Measure of Business Performance (CMBP), compare with 400 corporations (Manufacturing and non-Manufacturing) business performance in two developed countries (DCs), Japan and the United States, with that in two newly industrializing countries (NIC's), South Korea and Taiwan from 1980 to 1987. In their analysis, they found that U.S. led all others in terms of popular profitability measures, ROE, ROA, ROS, and ROI meanwhile in growth rate of sales, the Korea has the highest followed by Taiwan, U.S. and Japan.
Hypothesis 1 (H1)
East Asia ICT companies Sales Growth is better than ASEAN ICT companies Sales Growth.
Hypothesis 2 (H2)
East Asia ICT companies Profitability is lower than ASEAN ICT companies Profitability.
From the hypotheses above, a conceptual framework can be built and shown as Figure 1 below.
Figure 1. Conceptual framework

www.sciedu.ca/ijba International Journal of Business Administration Vol. 4, No. 6; 2013
Published by Sciedu Press 100 ISSN 1923-4007 E-ISSN 1923-4015
2.4 Methodology
2.4.1 Scope of the Study
The main objective of this study is to compare the performance of ICT industry between ASEAN and East Asia by analyzing sales growth ratio and profitability by using financial database, Orbis Bureau Van Dijk Database (OBVD) from 2006-2010. From this study, we also could differentiate the performance in ICT industry between each country.
2.4.2 Sample
ASEAN are form by several country members; Malaysia, Thailand, Brunei Darussalam, Singapore, Philippines, Cambodia, Indonesia, Laos, Vietnam and Myanmar. In this research, only, Malaysia, Thailand, and Philippines were selected due to the limitation data availability in the Orbis database can only be found within these countries. Indeed, others countries in ASEAN which is not selected in this study do have ICT companies listed in the database but, the total population are very small and to find financial data in the consecutive years are hard to identify. Meanwhile, Japan, South Korea and China represent East Asia region were selected in this research.
24 companies are from ASEAN; Thailand, Malaysia, and Philippines and 231 companies are Japan, South Korea and China. Table 2 shows the number of listed and non-listed ICT companies for each region.
Table 2. Number of listed and non-listed ICT companies
Listed Company Non-listed Company
ASEAN 20 4
East Asia 67 164
Most of ICT companies ownership in China are belong to the local government which are different if compare to the rest of the country in this analysis. The data was extracted from the Orbis Database published between 2006 and 2010. It provides a list of ICT industry which consist Telecommunication Industry; Computer Programming, Consultancy, and related activities; and Information Services Activities. The sample was selected based on the availability of Profitability Ratio and Sales.
Financial performance data was not available to the public. One of the reasons that the samples are limited cause by disclosure financial information to the public which could risk their competitive position within the same industry (Hossain et. al., 2006; Watson et. al., 2002; and Ho and Wong, 2001).
2.4.3 Measures
All variables from Profitability Ratio and Sales Growth are derived from the Orbis database such as return on capital employed (ROCE); return on total assets (ROA); EBITDA, Profit Margin, Liquidity Ratio, Solvency Ratio and Current Ratio. Liquidity ratios shows company’s ability to pay off short term obligations as they come due, to convert short term assets into cash to cover debts. Solvency ratio shows company’s ability to face with medium and long term liabilities. This ratio measures company’s financial security relative to its creditors and financial institutions. The normal value of this ratio has to be higher than 1.5.The significance of the financial ratios also determines the strength and weakness sides of companies in terms of liquidity, growth, and profitability. This allow user to analyze related data and making decision from this information (Singh and Schmidgall, 2002).
2.4.4 Statistical Methods
SPSS statistics package 13.0 will be used to run the hypothesized model by using the t test and ANOVA technique.
3. Discussion and Empirical Results
The information contained in the financial statements is used and presents interest for different categories of users for example investors, managers, financial analysts, suppliers, creditors, stockholders and government agencies. By t test and ANOVA, we can determine the mean for profit margin in each region and each country that is going to be analyzed. Variables were selected from the profitability ratio in the OVBD database; Return on shareholder funds % (ROSF), Return on capital employed % (ROCE), Return on total assets % (ROA), Profit margin %, Solvency ratio, Liquidity ratio and Current ratio.
Table 3 shows the correlation coefficients for all the variables for ASEAN and East Asia group meanwhile in Table 4 show the correlation for each individual country. Higher correlations show that one variable is paired with the other variable. On the other hand, Low coefficients suggest that the variables have little or no co-linearity.

www.sciedu.ca/ijba International Journal of Business Administration Vol. 4, No. 6; 2013
Published by Sciedu Press 101 ISSN 1923-4007 E-ISSN 1923-4015
Table 3. Correlations among all the variables ASEAN and East Asia group
Table 4. Correlations among all the variables for each country

www.sciedu.ca/ijba International Journal of Business Administration Vol. 4, No. 6; 2013
Published by Sciedu Press 102 ISSN 1923-4007 E-ISSN 1923-4015

www.sciedu.ca/ijba International Journal of Business Administration Vol. 4, No. 6; 2013
Published by Sciedu Press 103 ISSN 1923-4007 E-ISSN 1923-4015
Table 5 below show the mean output for each region and individual country. It shows that that Liability in both analyses is not significant.
Table 5. Mean output for company age and liabilities by using ANOVA
Variables Country Mean df F Sig.
Company age
(ln)
Malaysia 1.134 5 41.283 0.000
Philippines 1.676
Thailand 1.217
China 1.417
Korea 1.029
Japan 1.053
Liabilities Malaysia 21710.320 5 1.041 0.394
Philippines 441866.240
Thailand 103635.319
China 1478336.241
Korea 802985.758
Japan 119563.524
Variables Country Mean df F Sig.
Company age
(ln)
ASEAN 1.323 1 8.335 0.004
East Asia 1.157
Liabilities ASEAN 174977.671 1 0.298 0.585
East Asia 655606.363
www.sciedu.ca/ijba International Journal of Business Administration Vol. 4, No. 6; 2013
Published by Sciedu Press 104 ISSN 1923-4007 E-ISSN 1923-4015
Table 6. Mean output for sales growth ratio by using t-test
Sales Growth 2006-2010 Sales Growth 2007-2010
Country Mean t df Sig.
(2-tailed)Mean t df
Sig.
(2-tailed)
ASEAN 2.1886 .936 95 .035 .3566 .130 80 .029
East Asia 7.1683 6.193 923 .000 4.2960 3.961 794 .000
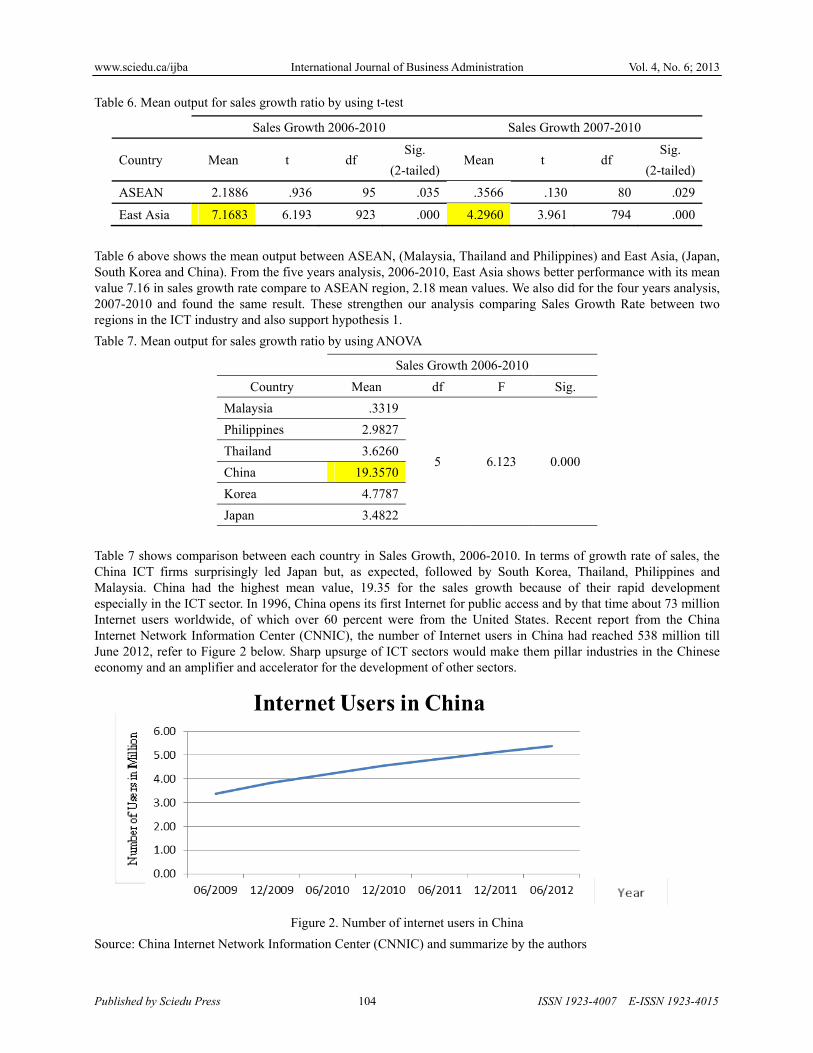
Table 6 above shows the mean output between ASEAN, (Malaysia, Thailand and Philippines) and East Asia, (Japan, South Korea and China). From the five years analysis, 2006-2010, East Asia shows better performance with its mean value 7.16 in sales growth rate compare to ASEAN region, 2.18 mean values. We also did for the four years analysis, 2007-2010 and found the same result. These strengthen our analysis comparing Sales Growth Rate between two regions in the ICT industry and also support hypothesis 1.
Table 7. Mean output for sales growth ratio by using ANOVA
Sales Growth 2006-2010
Country Mean df F Sig.
Malaysia .3319
5 6.123 0.000
Philippines 2.9827
Thailand 3.6260
China 19.3570
Korea 4.7787
Japan 3.4822
Table 7 shows comparison between each country in Sales Growth, 2006-2010. In terms of growth rate of sales, the China ICT firms surprisingly led Japan but, as expected, followed by South Korea, Thailand, Philippines and Malaysia. China had the highest mean value, 19.35 for the sales growth because of their rapid development especially in the ICT sector. In 1996, China opens its first Internet for public access and by that time about 73 million Internet users worldwide, of which over 60 percent were from the United States. Recent report from the China Internet Network Information Center (CNNIC), the number of Internet users in China had reached 538 million till June 2012, refer to Figure 2 below. Sharp upsurge of ICT sectors would make them pillar industries in the Chinese economy and an amplifier and accelerator for the development of other sectors.
Figure 2. Number of internet users in China
Source: China Internet Network Information Center (CNNIC) and summarize by the authors
www.sciedu.ca/ijba International Journal of Business Administration Vol. 4, No. 6; 2013
Published by Sciedu Press 105 ISSN 1923-4007 E-ISSN 1923-4015
Table 8. Output for profitability ratio 2006-2010 by using t-test
Region ASEAN East Asia
Variables Mean t df Sig.
(2-tailed)Mean t df
Sig. (2-tailed)
Return on shareholder funds
23.133 12.975 119 .000 12.901 12.855 1154 .000
Return on capital employed
20.483 14.409 119 .000 13.702 26.585 1154 .000
Return on total assets
13.029 12.159 119 .000 7.330 27.067 1154 .000
Profit margin
15.051 12.387 119 .000 7.323 22.084 1154 .000
EBIDTA 25.187 15.325 119 .000 11.900 34.087 1154 .000
Solvency ratio
56.684 34.987 119 .000 50.643 34.217 1154 .000
Current ratio
2.226 11.790 119 .000 2.227 34.217 1154 .000
Liquidity ratio
2.072 11.157 119 .000 2.048 26.843 1154 .000
Table 9. Output for profitability ratio 2006-2010 by using ANOVA
Variables Country Mean df F Sig.
Return on
shareholder
funds
Malaysia 8.695
5 6.595 0.000
Philippines 32.382
Thailand 28.774
China 18.241
Korea 10.157
Japan 14.188
Return on
capital
employed
Malaysia 9.367
5 11.627 0.000
Philippines 23.884
Thailand 27.720
China 17.664
Korea 12.882
Japan 12.577
Return on total
assets
Malaysia 6.431
5 24.055 0.000 Philippines 14.715
Thailand 17.582
China 10.398

www.sciedu.ca/ijba International Journal of Business Administration Vol. 4, No. 6; 2013
Published by Sciedu Press 106 ISSN 1923-4007 E-ISSN 1923-4015
Korea 5.698
Japan 8.165
Profit Margin Malaysia 8.157
5 71.171 0.000
Philippines 24.277
Thailand 14.003
China 16.833
Korea 3.929
Japan 7.062
EBITDA Malaysia 13.967
5 81.305 0.000
Philippines 40.467
Thailand 23.277
China 20.528
Korea 9.241
Japan 10.945
Current Ratio Malaysia 3.548
5 13.549 0.000
Philippines 1.233
Thailand 1.825
China 3.084
Korea 2.003
Japan 2.064
Liquidity Ratio Malaysia 3.304
5 6.934 0.000
Philippines 1.207
Thailand 1.650
China 2.672
Korea 1.793
Japan 2.085
Solvency Ratio Malaysia 63.336
5 23.215 0.000
Philippines 49.652
Thailand 56.241
China 58.881
Korea 45.725
Japan 53.799
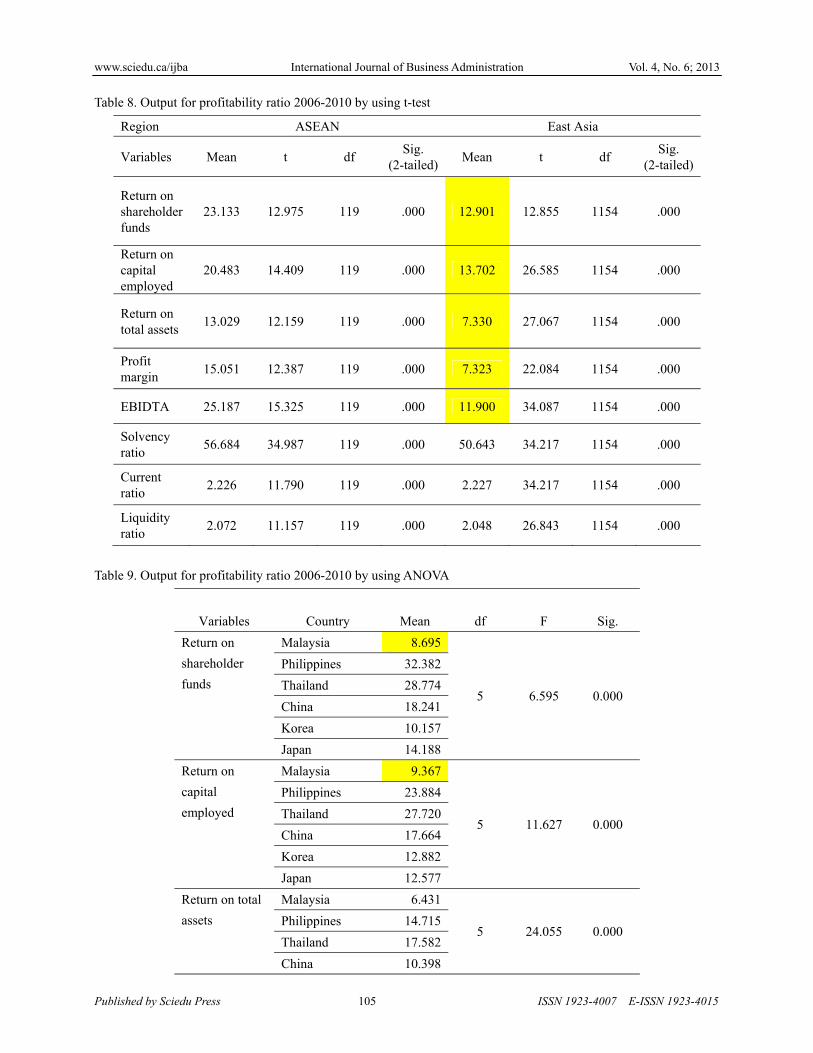
In terms of performance in profitability, Table 8 shows the analysis output for Profitability Ratio 2006-2010. ROSF, ROCE, ROA, Profit Margin and EBITDA in East Asia shows lower mean value compare to ASEAN region and support the hypothesis 2. The mean value gap is almost half when comparing between these two regions. As for the solvency ratio, East Asia shows lower mean value, 50.64 compare with ASEAN, 56.68. Meanwhile in current ratio and liquidity ratio, both regions show a good mean value.
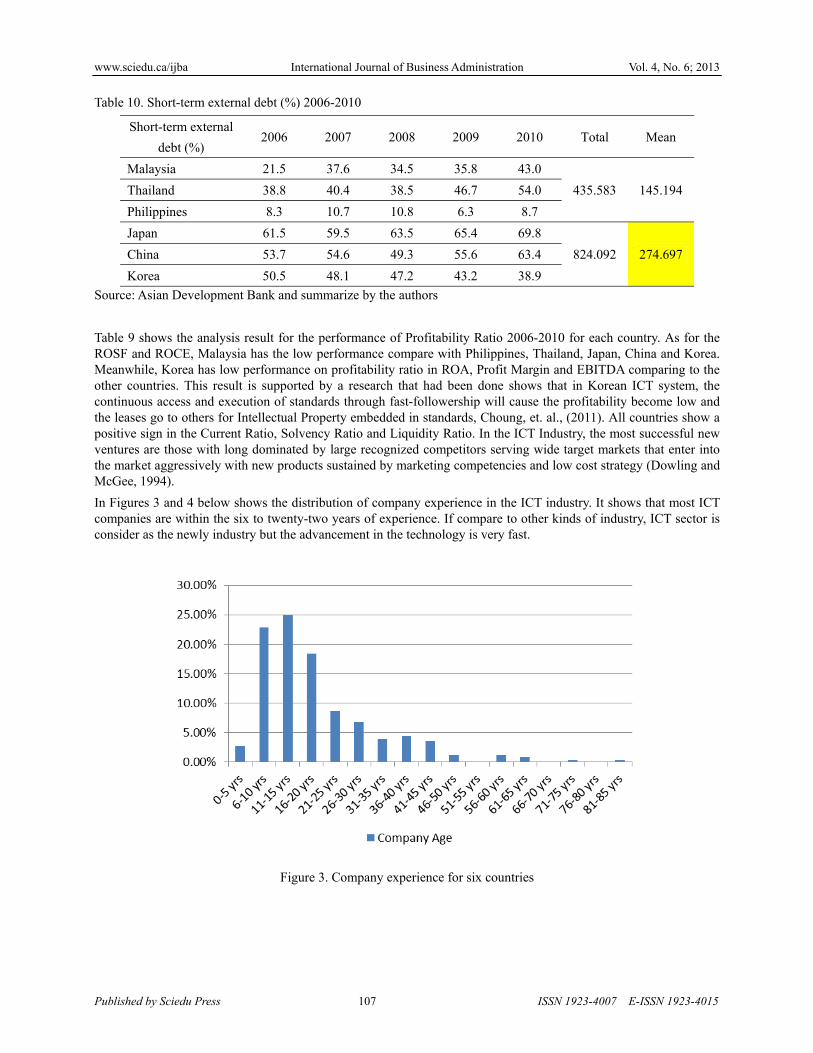
As we look on the aspect of the short-term external debt by each country and summarize into each region, East Asia short-term external debt is much higher than ASEAN. This can be referred to Table 10 below. With the higher shot-term external debt, the profitability will decrease and these support the findings in Table 8. Short-term external debt is inversely related to international reserve holdings in the ASEAN countries, indicating the role of short-term external debt as a substitute for international reserves, Nor, et. al., (2011).
www.sciedu.ca/ijba International Journal of Business Administration Vol. 4, No. 6; 2013
Published by Sciedu Press 107 ISSN 1923-4007 E-ISSN 1923-4015
Table 10. Short-term external debt (%) 2006-2010
Short-term external
debt (%) 2006 2007 2008 2009 2010 Total Mean
Malaysia 21.5 37.6 34.5 35.8 43.0
435.583 145.194Thailand 38.8 40.4 38.5 46.7 54.0
Philippines 8.3 10.7 10.8 6.3 8.7
Japan 61.5 59.5 63.5 65.4 69.8
824.092 274.697China 53.7 54.6 49.3 55.6 63.4
Korea 50.5 48.1 47.2 43.2 38.9
Source: Asian Development Bank and summarize by the authors
Table 9 shows the analysis result for the performance of Profitability Ratio 2006-2010 for each country. As for the ROSF and ROCE, Malaysia has the low performance compare with Philippines, Thailand, Japan, China and Korea. Meanwhile, Korea has low performance on profitability ratio in ROA, Profit Margin and EBITDA comparing to the other countries. This result is supported by a research that had been done shows that in Korean ICT system, the continuous access and execution of standards through fast-followership will cause the profitability become low and the leases go to others for Intellectual Property embedded in standards, Choung, et. al., (2011). All countries show a positive sign in the Current Ratio, Solvency Ratio and Liquidity Ratio. In the ICT Industry, the most successful new ventures are those with long dominated by large recognized competitors serving wide target markets that enter into the market aggressively with new products sustained by marketing competencies and low cost strategy (Dowling and McGee, 1994).
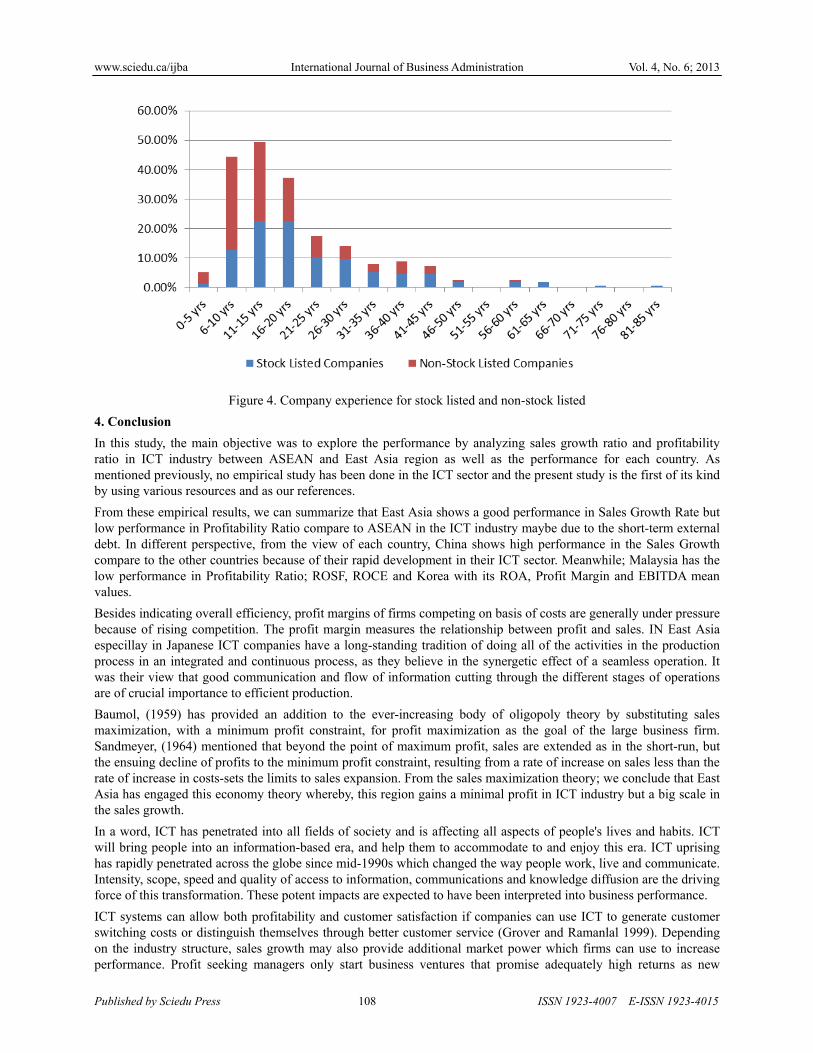
In Figures 3 and 4 below shows the distribution of company experience in the ICT industry. It shows that most ICT companies are within the six to twenty-two years of experience. If compare to other kinds of industry, ICT sector is consider as the newly industry but the advancement in the technology is very fast.
Figure 3. Company experience for six countries
www.sciedu.ca/ijba International Journal of Business Administration Vol. 4, No. 6; 2013
Published by Sciedu Press 108 ISSN 1923-4007 E-ISSN 1923-4015
Figure 4. Company experience for stock listed and non-stock listed
4. Conclusion
In this study, the main objective was to explore the performance by analyzing sales growth ratio and profitability ratio in ICT industry between ASEAN and East Asia region as well as the performance for each country. As mentioned previously, no empirical study has been done in the ICT sector and the present study is the first of its kind by using various resources and as our references.
From these empirical results, we can summarize that East Asia shows a good performance in Sales Growth Rate but low performance in Profitability Ratio compare to ASEAN in the ICT industry maybe due to the short-term external debt. In different perspective, from the view of each country, China shows high performance in the Sales Growth compare to the other countries because of their rapid development in their ICT sector. Meanwhile; Malaysia has the low performance in Profitability Ratio; ROSF, ROCE and Korea with its ROA, Profit Margin and EBITDA mean values.
Besides indicating overall efficiency, profit margins of firms competing on basis of costs are generally under pressure because of rising competition. The profit margin measures the relationship between profit and sales. IN East Asia especillay in Japanese ICT companies have a long-standing tradition of doing all of the activities in the production process in an integrated and continuous process, as they believe in the synergetic effect of a seamless operation. It was their view that good communication and flow of information cutting through the different stages of operations are of crucial importance to efficient production.
Baumol, (1959) has provided an addition to the ever-increasing body of oligopoly theory by substituting sales maximization, with a minimum profit constraint, for profit maximization as the goal of the large business firm. Sandmeyer, (1964) mentioned that beyond the point of maximum profit, sales are extended as in the short-run, but the ensuing decline of profits to the minimum profit constraint, resulting from a rate of increase on sales less than the rate of increase in costs-sets the limits to sales expansion. From the sales maximization theory; we conclude that East Asia has engaged this economy theory whereby, this region gains a minimal profit in ICT industry but a big scale in the sales growth.
In a word, ICT has penetrated into all fields of society and is affecting all aspects of people's lives and habits. ICT will bring people into an information-based era, and help them to accommodate to and enjoy this era. ICT uprising has rapidly penetrated across the globe since mid-1990s which changed the way people work, live and communicate. Intensity, scope, speed and quality of access to information, communications and knowledge diffusion are the driving force of this transformation. These potent impacts are expected to have been interpreted into business performance.
ICT systems can allow both profitability and customer satisfaction if companies can use ICT to generate customer switching costs or distinguish themselves through better customer service (Grover and Ramanlal 1999). Depending on the industry structure, sales growth may also provide additional market power which firms can use to increase performance. Profit seeking managers only start business ventures that promise adequately high returns as new
www.sciedu.ca/ijba International Journal of Business Administration Vol. 4, No. 6; 2013
Published by Sciedu Press 109 ISSN 1923-4007 E-ISSN 1923-4015
business increases in sales should improve profits meanwhile, old lines of business may be continued if they simply cover their marginal costs or if closing down costs more than continuing.
The limitation of our study is the financial information from the ICT industry is few. From the Orbis database there are hundreds of companies listed under ICT sector but few published their financial report maybe full disclosure of information could endanger their competitive position. This is been supported by Kohli and Devaraj (2003) who had suggested that the importance of sample size and modeling techniques in their studies. Therefore, improved modeling and richer datasets may have a better chance at sensing the impact of IT on profitability. Further studies can be applied through the analysis in R&D, firm size investment risk and also expand this research by comparing with the US and Europe countries.
Acknowledgement
This study supported by JSPS KAKENHI Grant Number 21530410, 24530500, Universiti Teknikal Malaysia Melaka (UTeM), Ministry of Higher Education (MOHE), Malaysia and Aichi University Institute of International Affairs. All errors and omissions are the responsibility of the authors.
References
Amighini, A. (2005). From Global to Regional International Production Networks in the Telecom Sector: Implications for Industrial Upgrading in East Asia. European Journal of East Asian Studies, 4, 115-142. http://dx.doi.org/10.1163/1570061054030369
Asian Development Bank. (2012). Key Indicators for Asia and the Pacific 2012. Retrieved from http://www.adb.org/publications/key-indicators-asia-and-pacific-2012
Baumol, W. J. (1959). Business Behaviour, Value and Growth. New York: The Macmillan Company, 164.
Bresnahan, T. F., & Trajtenberg, M. (1995). General purpose technologies ‘engines of growth’? Journal of Econometrics, 65, 83–108. http://dx.doi.org/10.1016/0304-4076(94)01598-T
China Internet Network Information Center (CNNIC). (2013). Retrieved from http://www1.cnnic.cn/IDR/BasicData/
Chirwa, E. W. (2003). Determinants of commercial banks in Malawi: a cointegration approach. Applied Financial Economics, 13, 565–571. http://dx.doi.org/10.1080/0960310022000020933
Choung, J. Y., Hameed, T., & Ji, I. (2011). Role of formal standards in transition to the technology frontier: Korean ICT systems. Telecommunications Policy, 35, 269–287. http://dx.doi.org/10.1016/j.telpol.2011.02.001
Dowling, M. J., & McGee, J. E. (1994). Business and technology strategies and new venture performance: A study of the telecommunications equipment industry. Management Science, 40, 1663–1677. http://dx.doi.org/10.1287/mnsc.40.12.1663
Dutta, S., & Bilbao-Osorio, B. (2012). Global Information Technology Report 2012. Living in a Hyperconnected World. Geneva: World Economic Forum and INSEAD.
Dutta, S., & Mia, I. (2007). Global Information Technology Report 2006-2007: Connecting to the Networked Economy. Basingstoke: Palgrave Macmillan.
Dutta, S., & Mia, I. (2009). Global Information Technology Report 2008-2009: Mobility in a Networked World. Basingstoke: Palgrave Macmillan.
Dutta, S., & Mia, I. (2010). Global Information Technology Report 2009-2010: ICT for Sustainability. Basingstoke: Palgrave Macmillan.
Dutta, S., & Mia, I. (2011). Global Information Technology Report 2010-2011: Transformations 2.0. Basingstoke: Palgrave Macmillan.
Dutta, S., López-Claros, A., & Mia, I. (2008). Global Information Technology Report 2007-2008: Fostering Innovation through Networked Readiness. Basingstoke: Palgrave Macmillan.
Fagerberg, J., & Verspagen, B. (2002). Technology gaps, innovation-diffusion and transformation: an evolutionary interpretation. Research Policy, 31, 1291-1304. http://dx.doi.org/10.1016/S0048-7333(02)00064-1
Feroz, E. H., Kim, S., & Raab, R. L. (2003). Financial statement analysis: a data envelopment analysis approach, Journal of Operational Research Society, 54, 48-58. http://dx.doi.org/10.1057/palgrave.jors.2601475
Grover, V., & Ramanlal, P. (1999). Six Myths of Information and Markets: Information Technology Networks, Electronic Commerce, and the Battle for Consumer Surplus. MIS Quarterly, 23, 465-495.

www.sciedu.ca/ijba International Journal of Business Administration Vol. 4, No. 6; 2013
Published by Sciedu Press 110 ISSN 1923-4007 E-ISSN 1923-4015
http://dx.doi.org/10.2307/249486
Ho, S. S. M., & Wong, K. S. (2001). A Study of Corporate Disclosure Practices and Effectiveness in Hong Kong. Journal of International Financial Management and Accounting, 12, 75-101. http://dx.doi.org/10.1111/1467-646X.00067
Hossain, M., Islam, K., & Andrew, J. (2006). Corporate Social and Environmental Disclosure in Developing Countries: Evidence from Bangladesh. The Asian pacific conference on International Accounting Issues, Hawaii, 1-22.
Ishman, M. D., Pegels, C. C., & Sanders, G. L. (1994). A window on information systems technology in China. Journal of Strategic Information Systems, 3, 299-311. http://dx.doi.org/10.1016/0963-8687(94)90035-3
Kaplan, R. S., & Norton, D. P. (1992). The Balanced Scorecard - Measures The Drive Performance. Harvard Business Review, 71–79.
Kaplan, R. S., & Norton, D. P. (1993). Putting The balanced Scorecard to Work. Harvard Business Review, 71, 134–137.
Kaplan, R. S., & Norton, D. P. (1996). Using The Balanced Scorecard As A Strategic Management System. Harvard Business Review, 85, 150–161.
Kim, Jong-Il. (2004). Information Technology and Firm Performance in Korea. National Bureau of Economic Research, 13, 327-349.
Kohli, R., & Devaraj, S. (2003). Measuring Information Technology Payoff: A Meta-Analysis of Structural Variables in Firm-Level Empirical Research. Information Systems Research, 14, 127-145. http://dx.doi.org/10.1287/isre.14.2.127.16019
Kohli, R., & Grover, V. (2008). Business Value of IT: An Essay on Expanding Research Directions to Keep Up with the Times. Journal of the Association for Information Systems, 9, 23-39.
Koski, H. A., Rouvinen, P., & Anttila-Yla, P. (2002). ICT clusters in Europe: the great central banana and the small Nordic potato. Information Economics and Policy, 14, 145–165. http://dx.doi.org/10.1016/S0167-6245(01)00064-6
Langdale, J. V. (1997). International competitiveness in East Asia: Broadband telecommunications and interactive multimedia. Telecommunications Policy, 21, 235–249. http://dx.doi.org/10.1016/S0308-5961(97)00004-9
Lee, J., & Blevins, D. E. (1990). Profitability and Sales Growth in Industrialized versus Newly Industrializing Countries. Management International Review, 30, 87-100.
Lee, S., Kim, M. S., & Park, Y. (2009). ICT co-evolution and Korean ICT strategy—An analysis based on patent data. Telecommunications Policy, 33, 253–271. http://dx.doi.org/10.1016/j.telpol.2009.02.004
Ministry of Internal Affairs and Communication (MIC). White Paper Information and Communication in Japan (2006).
Mithas, S.; Tafti, A.; Bardhan, I., & Goh, J. M. (2012). Information Technology and Firm Profitability: Mechanisms and Empirical Evidence. MIS Quarterly, 36, 205-224.
Naceur, S. B., & Goaied, M. (2001). The determinants of the Tunisian deposit banks’ performance. Applied Financial Economics, 11, 317-319. http://dx.doi.org/10.1080/096031001300138717
Nam, C., Kwon, Y., Kim, S., & Lee, H. (2009). Estimating scale economies of the wireless telecommunications industry using EVA data. Telecommunications Policy, 33, 29–40. http://dx.doi.org/10.1016/j.telpol.2008.10.005
Nor, E., Azali, M., & Law, S. H. (2011). International Reserves, Current Account Imbalance and Short Term External Debt: A Comparative Study. International Journal of Economics and Finance, 3, 83-94. http://dx.doi.org/10.5539/ijef.v3n4p83
OECD. (2005). Measuring Globalization: OECD Handbook on Economic Globalization Indicators. OECD, Paris.
Pilat, D., & Lee, F. C. (2001). Productivity growth in ICT-producing and ICT-using industries: A source of growth differentials in the OECD. Technology and Industry Working Papers, 2001/04, OECD Publishing.
Sam, M. F. M., & Hoshino, Y. (2013). Sales Growth, Profitability and Performance: Empirical Study of Japanese ICT Industries with Three ASEAN Countries. Interdisciplinary Journal of Contemporary Research in Business, 4, 138-156.
www.sciedu.ca/ijba International Journal of Business Administration Vol. 4, No. 6; 2013
Published by Sciedu Press 111 ISSN 1923-4007 E-ISSN 1923-4015
Sam, M. F. M., Hoshino, Y., & Tahir, M. N. H. (2012). The Adoption of Computerized Accounting System in Small Medium Enterprises in Melaka, Malaysia. International Journal of Business and Management, 7, 12-25. http://dx.doi.org/10.5539/ijbm.v7n18p12
Sandmeyer, R. L. (1964). Baumol’s Sales-Maximization Model: Comment. American Economic Review, 54, 1073-80.
Sayilgan, G., & Yildirim, O. (2009). Determinants of Profitability in Turkish Banking Sector: 2002-2007. International Research Journal of Finance and Economics, 28, 207-214.
Shin, J., & Park, Y. (2007). Building the national ICT frontier: The case of Korea. Information Economics and Policy, 19, 249-277. http://dx.doi.org/10.1016/j.infoecopol.2007.01.003
Singh, A. J., & Schmidgall, R. S. (2002). Analysis of financial ratios commonly used by US lodging financial executives. Journal of Retail & Leisure Property, 2, 201–213. http://dx.doi.org/10.1057/palgrave.rlp.5090210
Singla, H. K. (2011). Does Firm Size Affect Profitability? An Empirical Investigation of Indian Textile Industry. Paradigm, 15, 18-25.
Sung, N. (2007). Information technology, efficiency and productivity: evidence from Korean local governments. Applied Economics, 39, 1691–1703. http://dx.doi.org/10.1080/00036840600675620
Tarawneh, M. (2006). A Comparison of Financial Performance in the Banking Sector: Some Evidence from Omani Commercial Banks. International Research Journal of Finance and Economics, 3, 101-112.
Vu, K. M. (2011). ICT as a source of economic growth in the information age: Empirical evidence from the 1996–2005 period. Telecommunications Policy, 35, 357–372. http://dx.doi.org/10.1016/j.telpol.2011.02.008
Watson, A., Shrives, P., & Marston, C. (2002). Voluntary Disclosure of Accounting Ratios in the UK. British Accounting Review, 34, 289-313. http://dx.doi.org/10.1006/bare.2002.0213
Wild, J. J., & Subramanyam, K. R. (2007). Financial statement analysis, McGraw- Hill International, Singapore.
Yalcin, N., Bayrakdaroglu, A., & Kahraman, C. (2012). Application of Fuzzy Multi-Criteria Decision Making Methods for Financial Performance Evaluation of Turkish Manufacturing Industries. Expert Systems with Applications, 39, 350-364. http://dx.doi.org/10.1016/j.eswa.2011.07.024
www.sciedu.ca/ijba International Journal of Business Administration Vol. 4, No. 6; 2013
Published by Sciedu Press 112 ISSN 1923-4007 E-ISSN 1923-4015
Attachment A
Composition and computation of the Networked Readiness Index
NETWORKED READINESS INDEX
Networked Readiness Index = 1/3 Environment component subindex + 1/3 Readiness component subindex + 1/3 Usage component subindex
Environment subindex = 1/3 Market environment + 1/3 Political and regulatory environment + 1/3 Infrastructure environment
Notes
a The computation of the NRI is based on successive aggregations of scores, from the variables level (i.e., the lowest level) to the overall NRI score (i.e., the highest level). For example, the score a country achieves in the 3rd pillar, Infrastructure environment, accounts for one third of the Environment subindex. Similarly, the Usage subindex accounts for one third of the overall NRI score.
b The standard formula for converting hard data is the following:
6 x ((country score-sample minimum)/(sample maximum-sample minimum))+1
The sample minimum and sample maximum are, respectively, the lowest and highest country scores in the sample of countries covered by the NRI. In some instances, adjustments were made to account for extreme outliers. For those hard data variables for which a higher value indicates a worse outcome (e.g., total tax rate, time to enforce a contract), we rely on a normalization formula that, in addition to converting the series to a 1-to-7 scale, reverses it, so that 1 and 7 still correspond to the worst and best possible outcomes, respectively:
-6 x ((country score-sample minimum)/(sample maximum-sample minimum))+1
Sources:
The Global Information Technology Report, World Economic Forum
Dutta (2006- 2012)
www.sciedu.ca/ijba International Journal of Business Administration Vol. 4, No. 6; 2013
Published by Sciedu Press 113 ISSN 1923-4007 E-ISSN 1923-4015
Attachment B
List of Companies
Malaysia
1. KUB MALAYSIA BERHAD
2. HEITECH PADU BERHAD
3. IRIS CORPORATION BERHAD
4. COMINTEL CORPORATION BHD
5. MESINIAGA BERHAD
6. EFFICIENT E-SOLUTIONS BERHAD
7. WILLOWGLEN MSC BERHAD
8. EXTOL MSC BERHAD
Philippine
1. PHILIPPINE LONG DISTANCE TELEPHONE COMPANY
2. GLOBE TELECOM INC
3. LOPEZ HOLDINGS CORPORATION
4. ABS-CBN CORPORATION
5. GMA NETWORK INC
6. IPEOPLE INC
7. MANILA BROADCASTING COMPANY
Thailand
1. ADVANCED INFO SERVICE PCL
2. BEC WORLD PCL
3. ADVANCED INFORMATION TECHNOLOGY PCL
4. KRUNGTHAI COMPUTER SERVICES CO LTD
5. CS LOXINFO PCL
6. MFEC PCL
7. ADVANCED CONTACT CENTER CO LTD
8. BROADCAST THAI TELEVISION CO LTD
9. LOXLEY WIRELESS CO LTD
Japan
1. NIPPON TELEGRAPH AND TELEPHONE CORPORATION
2. NTT DOCOMO INC
3. KDDI CORPORATION
4. NTT DATA CORPORATION
5. OTSUKA CORPORATION
6. HIKARI TSUSHIN INC

www.sciedu.ca/ijba International Journal of Business Administration Vol. 4, No. 6; 2013
Published by Sciedu Press 114 ISSN 1923-4007 E-ISSN 1923-4015
7. COMSYS HOLDINGS CORPORATION
8. YAHOO JAPAN CORPORATION
9. KONAMI CORPORATION
10. NEC NETWORKS & SYSTEM INTEGRATION CORPORATION
11. TRANSCOSMOS INC
12. FUJI SOFT INC.
13. SCSK CORPORATION
14. TREND MICRO INCORPORATED
15. COMMUTURE CORPORATION
16. SOFTBANK CORP
17. INTERNET INITIATIVE JAPAN INC
18. WONDER CORPORATION
19. GMO INTERNET INC.
20. TOHOKUSHINSHA FILM CORPORATION
21. DTS CORP.
22. VIC TOKAI CORPORATION
23. F T COMMUNICATIONS CO LTD
24. COMPUTER ENGINEERING & CONSULTING LTD
25. CAC CORPORATION
26. INFOCOM CORPORATION
27. PANASONIC ELECTRIC WORKS INFORMATION SYSTEMS CO., LTD.
28. RYOYU SYSTEMS CO., LTD.
29. AGREX INC
30. JFE SYSTEMS INC.
31. ALPHA SYSTEMS INC
32. NIPPON SYSTEMWARE CO LTD
33. FUTURE ARCHITECT, INC.
34. CORE CORPORATION
35. I-NET CORP
36. MIROKU JYOHO SERVICE CO LTD
37. CROPS CORPORATION
38. INFORMATION DEVELOPMENT CO LTD
39. COMPUTER INSTITUTE OF JAPAN LTD
40. CRESCO LTD
41. IX KNOWLEDGE INCORPORATED
42. FORVAL TELECOM INC
43. HOKURIKU DENWA KOUJI CO LTD
44. WILLCOM Inc.
45. COMTEC INC
46. UCHIDA ESCO CO LTD
47. NIPPON COMPUTER DYNAMICS CO, LTD.

www.sciedu.ca/ijba International Journal of Business Administration Vol. 4, No. 6; 2013
Published by Sciedu Press 115 ISSN 1923-4007 E-ISSN 1923-4015
48. TOUKEI COMPUTER CO LTD
49. ISB CORPORATION
50. SOLXYZ CO., LTD.
51. CUBE SYSTEM INC
52. GMO CLOUD K.K.
53. JAPAN SYSTEM TECHNIQUES CO LTD
54. ASAHI INTELLIGENCE SERVICE CO LTD
55. CDS CO., LTD.
56. CROSS CAT CO LTD
57. SYSTEM RESEARCH CO., LTD.
58. IMAGICA ROBOT HOLDINGS INC.
59. SIOS TECHNOLOGY, INC.
60. YUKE'S CO., LTD.
61. ND SOFTWARE CO., LTD.
62. HONYAKU CENTER INC
63. JORUDAN CO., LTD.
64. SHOWA SYSTEM ENGINEERING CORPORATION
65. GAIAX CO., LTD.
66. KYCOM HOLDINGS CO., LTD.
67. MEDIASEEK. INC
68. DAIWA COMPUTER CO., LTD.
69. ASJ INC.
China
1. CHINA TELECOM CORPORATION LIMITED
2. CHINA UNITED NETWORK COMMUNICATIONS LIMITED
3. JIANGSU HONGTU HIGH TECHNOLOGY CO., LTD.
4. AISINO CO LTD
5. FIBERHOME TELECOMMUNICATION TECHNOLOGIES CO., LTD.
6. BEIJING TEAMSUN TECHNOLOGY CO., LTD.
7. CINDA REAL ESTATE CO., LTD.
8. DATANG GAOHONG DATA NETWORK TEHNOLOGY CO., LTD.
9. BEIJING CENTERGATE TECHNOLOGIES (HOLDING) CO., LTD.
10. NARI Technology Development Limited Company
11. SHANGHAI ORIENTAL PEARL CO., LTD.
12. CITIC GUOAN INFORMATION INDUSTRY CO., LTD.
13. DHC SOFTWARE CO., LTD.
14. BEIJING GEHUA CATV NETWORK CO., LTD.
15. CHINA GRENTECH CORPORATION LIMITED
16. SHENZHEN KINGDOM TECHNOLOGY CO., LTD.
17. MESNAC CO., LTD.

www.sciedu.ca/ijba International Journal of Business Administration Vol. 4, No. 6; 2013
Published by Sciedu Press 116 ISSN 1923-4007 E-ISSN 1923-4015
18. SHANGHAI HI-TECH CONTROL SYSTEM CO. LTD.
19. ZHEJIANG SUNWAVE COMMUNICATIONS CO., LTD.
20. ACCELINK TECHNOLOGIES COMPANY LIMITED
21. HANDSUN TECHNOLOGIES, INC.
22. SHENZHEN TOPWAY VIDEO COMMUNICATION COMPANY LIMITED
23. GUOMAI TECHNOLOGIES, INC.
24. BEIJING SHIJI INFORMATION TECHNOLOGY CO LTD
25. SHANGHAI FUDAN FORWARD SCIENCE AND TECHNOLOGY COMPANY LIMITED
26. YGSOFT INCORPORATION
27. DINGLI COMMUNICATIONS CORP LTD
28. BEIJING LANXUM TECHNOLOGY CO., LTD.
29. JIANGSU NANDASOFT TECHNOLOGY COMPANY LIMITED
30. ANHUI USTC IFLYTEK COMPANY LIMITED
31. CAPINFO COMPANY LIMITED
32. BEIJING THUNISOFT CORPORATION LIMITED
33. INTEGRATED ELECTRONIC SYSTEMS LAB COMPANY LIMITED
34. SHANGHAI WANGSU SCIENCE AND TECHNOLOGY CO., LTD.
35. TALKWEB INFORMATION SYSTEM COMPANY LIMITED
36. HUNAN COPOTE SCIENCE & TECHNOLOGY CO., LTD.
37. ANHUI WANTONG TECHNOLOGY CO., LTD.
38. ALLWIN TELECOMMUNICATION COMPANY LIMITED
39. HANGZHOU NEW CENTURY INFORMATION TECHNOLOGY CO LTD
40. HENAN DAYOU ENERGY CO., LTD.
41. HANGZHOU HUAXING CHUANGYE COMMUNICATION TECHNOLOGY CO LTD
42. SHENZHEN SUNWIN INTELLIGENT COMPANY LIMITED
43. XIAMEN 35.COM TECHNOLOGY CO LTD
44. SHANGHAI WINGSUNG INVESTMENT MANAGEMENT CO., LTD.
South Korea
1. KT CORPORATION
2. SK TELECOM CO.,LTD.
3. SK BROADBAND CO., LTD.
4. KOREAN BROADCASTING SYSTEM
5. HANWHA S & C CO.,LTD.
6. KTCS CORPORATION
7. KT NETWORKS CORPORATION
8. TBROAD HANVIT BROADCASTING CO.,LTD.
9. KT HITEL CO.,LTD.
10. INSUNG INFORMATION CO.,LTD.
11. S NET SYSTEMS INC.
12. SOLBORN,INC.

www.sciedu.ca/ijba International Journal of Business Administration Vol. 4, No. 6; 2013
Published by Sciedu Press 117 ISSN 1923-4007 E-ISSN 1923-4015
13. KT POWERTEL CO.,LTD.
14. KOLON BENIT CO.,LTD.
15. ANNEX TELECOM CO.,LTD.
16. SEJONG TELECOM INC.
17. SMARTRO CO.,LTD.
18. KIS INFORMATION & COMMUNICATION INC.
19. COMAS INC.
20. KT LINKUS INC.
21. COMMERCE PLANET CO.,LTD.
22. TBROAD NAKDONG BROADCASTING CO.,LTD.
23. KOREA INSTITUTE PATENT INFORMATION FOUNDATION
24. JINDOO I.S INC.
25. SEORONET CO.,LTD.
26. ECO1. CORP.
27. GOODUS INC.
28. SBS GOLF CO.,LTD.
29. SYSONE CO.,LTD.
30. PENTA SYSTEMS TECHNOLOGY INC.
31. NET KTI CO.,LTD.
32. KYOBO INFORMATION & COMMUNICATION CO.,LTD.
33. KOREA CABLE TV JEJU BROADCASTING CO.,LTD.
34. KOREA CABLE TV NAM-INCHEON BROADCASTING CO.,LTD.
35. NEX TELECOM CO.,LTD.
36. TBROAD GANGSEO BROADCASTING CO.,LTD.
37. SISNET CO.,LTD.
38. DATAGATE KOREA CO.,LTD.
39. SMART NET TECHNOLOGY CO.,LTD.
40. CJ HELLOVISION ARA BROADCASTING CO.,LTD.
41. HONAM BROCASTING COMPANY
42. MILLE21 CO.,LTD.
43. MICROQNIX CO.,LTD.
44. JCN ULSAN JUNGANG BROADCASTING NETWORK CO.,LTD.
45. DOWON UBTECH CO.,LTD.
46. GREEN CABLE TELEVISION STATION CO.,LTD.
47. CHEONGJU MUNHWA BROADCASTING CORP.
48. KOREAN STUDIES INFORMATION CO.,LTD.
49. TCN DAEGU CABLE-TV NETWORK CO.,LTD.
50. SALTWARE CO.,LTD.
51. CAST INFORMATION CO.,LTD.
52. ITCEN SYSTEMS CO.,LTD.
53. SECURE TECH INC.

www.sciedu.ca/ijba International Journal of Business Administration Vol. 4, No. 6; 2013
Published by Sciedu Press 118 ISSN 1923-4007 E-ISSN 1923-4015
54. I PARTNERS INC.
55. MTC&C CO.,LTD.
56. ONETEL CO.,LTD.
57. CHEONGJU BROADCASTING CO.,LTD.
58. BLUEDIGM INC.
59. KORNEC CO.,LTD.
60. TOPCASH CO.,LTD.
61. NET CO.,LTD.
62. CYBER MBA CO.,LTD.
63. JINHAKSA CORP.
64. DIAL COMMUNICATIONS CO.,LTD.
65. BRAIN NET CO.,LTD.
66. EXANADU CO.,LTD.
67. SEOKYONG NCS CO.,LTD.
68. THIAT INC.
69. NIZTELECOM CO.,LTD.
70. ACE TEL CO.,LTD.
71. ASADAL INC.
72. BIZ HUB CO.,LTD.
73. U PLUS SYSTEM CO.,LTD
74. SPIRE TECHNOLOGY INC.
75. ARONTI CO.,LTD.
76. DUPLEX CO.,LTD.
77. CBS I CO.,LTD.
78. GB CARD CO.,LTD.
79. SPACE LINK CORPORATION
80. HANMAC INTORMATION TECHNOLOGY CO.,LTD.
81. GRANT SYSTEM CO.,LTD.
82. NAMYANG INFORMATION & TECHNOLOGY CO.,LTD.
83. TILON CO.,LTD.
84. DELTA SYSTEM CO.,LTD.
85. EB NEWS CO.,LTD.
86. KNOWLEDGE & FUTURE CO.,LTD.
87. KISAC INC.
88. EDU MECA CO.,LTD.
89. M2MGLOBAL CO.,LTD.
90. GREEN GEOSPATIAL INFORMATION CO.,LTD.
91. DOWON GEOGRAPHIC INFORMATION CO.,LTD.
92. POMIT CO.,LTD.
93. POWERTEL TRS CO.,LTD.
94. HANBAEK SYSTEM CO.,LTD.

www.sciedu.ca/ijba International Journal of Business Administration Vol. 4, No. 6; 2013
Published by Sciedu Press 119 ISSN 1923-4007 E-ISSN 1923-4015
95. ATENAS CO.,LTD.
96. UCORE BIZ CO.,LTD.
97. KYUNGNAM DIGITALNET CO.,LTD.
98. CNN INFORMATION COMMUNICATION INC.
99. KOREA INFORMATION TECHNOLOGY CO.,LTD.
100. WINK CO.,LTD.
101. ULSAN INTERNET BROADCASTING CO.,LTD.
102. TBROAD DOBONGGANGBUK BROCASTING CO.,LTD.
103. KRTNET CORPORATION
104. LEENOS CORP.
105. HANSOL INTICUBE CO.,LTD.
106. MDS TECHNOLOGY CO.,LTD.
107. ICRAFT CO.,LTD.
108. DIGITAL OCEAN CORP.
109. NOWCOM CO.,LTD.
110. YD ONLINE CORP.
111. U ANGEL CORPORATION
112. SARAMIN HR CO.,LTD.
113. SIGNAL INFORMATION & COMMUNICATION CORPORATION
114. KYUNG BONG CO.,LTD.
115. HANNET CO.,LTD.
116. SEOHWA TELECOM CO.,LTD.
117. ELUON CORPORATION
118. INCUBE TECHNOLOGIES INC.
Abbreviation:
INC=Incorporation
PCL = Public Company Limited
CO LTD = Company Limited
CORP = Corporation
LTD = Limited