Performance of geopolymer concrete in fire · Performance of Geopolymer Concrete in Fire . AHMAD...
188
Performance of Geopolymer Concrete in Fire AHMAD ZURISMAN MOHD ALI This thesis is presented as part of the requirement for the Award of the Degree of Doctor of Philosophy Department of Civil and Construction Engineering Faculty of Science, Engineering and Technology Swinburne University of Technology August 2015
Transcript of Performance of geopolymer concrete in fire · Performance of Geopolymer Concrete in Fire . AHMAD...
Performance of Geopolymer Concrete in Fire
AHMAD ZURISMAN MOHD ALI
This thesis is presented as part of the requirement for the
Award of the Degree of
Doctor of Philosophy
Department of Civil and Construction Engineering
Faculty of Science, Engineering and Technology
Swinburne University of Technology
August 2015

ii
Abstract
Ordinary Portland Cement (OPC) concrete can be classified as a fire resistant
construction material. However, spalling may occur in fire especially in high strength
concretes. The need to address this spalling problem in fire has intensified since the
use of high rise buildings. Geopolymer is a cementless concrete binder which is based
on aluminosilicate reaction of fly ash, a power plant by-product and activated by
alkaline solution. Recent research has shown that geopolymer concrete has great
potential in resisting fire. In addition, without the presence of Portland cement in the
concrete has led to more sustainable construction material since cement is the second
highest CO2 emitter after fossil fuels.
In this research, the severity of large scale high strength concrete spalling under
hydrocarbon fire was investigated. The results show that high strength OPC concrete
severely spalled during the first 30 minutes of fire exposure in explosive manner. There
is a thermal diffusivity drop when the temperature is between 110oC and 155oC due to
water in concrete changing phase to steam. Maximum steam pressure corresponds to
155oC temperature is 0.44 MPa which shows that steam pressure alone is not a critical
factor for concrete spalling.
Further investigations on factors affecting concrete spalling show that larger specimen
spalled more than smaller scale specimen based on 3 m x 3 m walls, 1 m x 1 m walls,
columns and cylinders. Aggregates size effect was also observed with increasing
spalling with decreasing aggregate size. No obvious trend observed for different
aggregate types (granite and basalt).
For making geopolymer, fly ashes from Gladstone, Tarong and Microash were
examined for physical properties. Gladstone fly ash demonstrated the best workability
compared with Tarong and Microash. The reasons for workability differences were
investigated and the conclusion was agglomerated particle size distribution was the
cause
Effect of dry and wet condition on strength of geopolymer was investigated. Strength
reduction of 17% was observed.
The high strength geopolymer 1 m x 1 m wall panels and two sizes of cylinders (150,
100 mm) were tested. From hydrocarbon fire test, high strength geopolymer concrete
exhibited good fire resistance performance due to no explosive spalling observed. Two

iii
panels and all cylinders remained un-spalled. Less than 1% spalling (excluding
moisture loss) observed on 2 spalled panels. There are 11% - 65% of residual
strengths observed on fire tested specimens as compared to OPC which has no
remaining strength.
To investigate aggregate and geopolymer binder thermal incompatibility factor on
spalling, aerated geopolymer panels were tested. From hydrocarbon fire test, no
spalling observed was further proof of thermal incompatibility was the cause of spalling.
Under room temperature, bearing load, axial load, corner bearing and flexural tests on
aerated geopolymer panel were conducted. Results show that aerated geopolymer
panel has the capacity and strength to be used as structural wall in fire application.

iv
Declaration
This thesis contains no material that has been accepted for the award of any Degree or
Diploma in any University. To the best of my knowledge and belief, the thesis contains
no material previously published or written by another person except where due
reference is made in the text.
………………………………
Ahmad Zurisman Mohd Ali

v
Acknowledgement
I wish to express my sincere gratitude and appreciation to many people for their
support and encouragement throughout this research. First and foremost, I would like
to express my sincere thanks to my research supervisor, Professor Jay Sanjayan for
his wonderful assistance, invaluable guidance, encouragement and support during the
course of this research. This thesis would not have been possible to complete without
his help. Special thanks to my co-supervisor, Professor Kwesi Sagoe-Crentsil for his
advice, assistance and invaluable guidance.
I gratefully acknowledge Ministry of Education Malaysia and my employer, Universiti
Tun Hussein Onn Malaysia for providing me the financial support and opportunity to
carry out this research.
I would like to extend my gratitude to Smart Structure Lab staff, Michael Culton, Kia
Rasekhi and Sanjeet for their technical assistance throughout my laboratory works.
I would like to thank Dr Maurice Guerrieri from Centre of Risk and Safety Engineering
(CESARE), Victoria University, Werribee for his assistance on fire tests.
I am also indebted to Mr David Devenish from Commonwealth Scientific and Industrial
Research Organisation (CSIRO) Highett for helping me casting the geopolymer
concrete panels and Dr Rackel San Nicolas from Melbourne University for assisting me
on chemical laboratory works.
To my fellow research colleague, Hasnat, Chandani, Behzad, Gias, Myintzu, Fahad,
Nainesh and others, thanks for the moral support, listening time and stimulating
discussions.
Last but not least, my sincerest gratitude to wife, Siti Nazahiyah and my wonderful kids,
Ilham Amani and Irdina Amani for the unconditional love, understanding, sacrifice and
support they provide during all these years.

vi
Table of Content Abstract ....................................................................................................................... ii
Declaration ................................................................................................................. iv
Acknowledgement ...................................................................................................... v
Table of Content ........................................................................................................ vi
List of Figures ........................................................................................................... xii
List of Tables............................................................................................................ xvi
List of Abbreviations ............................................................................................. xviii
CHAPTER 1 ................................................................................................................. 1
Introduction ............................................................................................................... 1
1.1 Background ................................................................................................. 1
1.2 Aim of research ........................................................................................... 2
1.3 Research objectives .................................................................................... 2
1.4 Scope of the thesis ...................................................................................... 2
1.5 Thesis Organisation .................................................................................... 4
References ............................................................................................................ 6
CHAPTER 2 ................................................................................................................. 7
Literature Review ...................................................................................................... 7
2.1 Background ................................................................................................. 7
2.2 Geopolymer Binder in Concrete for Spalling Solution ................................ 11
2.3 Geopolymer Binder in Concrete for Environmental Benefits ...................... 12
2.4 Geopolymer History and Reaction Mechanisms ........................................ 13
2.5 Fly Ash ...................................................................................................... 17
2.6 Alkaline activator ....................................................................................... 20
2.7 Geopolymer workability ............................................................................. 21
2.8 Geopolymer compressive strength ............................................................ 22
2.9 Geopolymer under Environmental Exposure ............................................. 25
2.10 Geopolymer fire test .................................................................................. 26
References .......................................................................................................... 28

vii
CHAPTER 3 ............................................................................................................... 37
Hydrocarbon Fire testing of full size Portland Cement High Strength Concrete Wall
Panels ..................................................................................................................... 37
3.1 Introduction ............................................................................................... 37
3.2 Experimental Programme .......................................................................... 38
3.2.1 Material .............................................................................................. 38
3.2.2 Concrete Properties ........................................................................... 39
3.2.3 Test Setup ......................................................................................... 40
3.2.4 Compressive strength and moisture content ...................................... 41
3.2.5 Thermal Data Collection ..................................................................... 42
3.2.6 Spalling analysis ................................................................................ 44
3.2.7 Thermal diffusivity analysis ................................................................ 45
3.3 Result and Discussion ............................................................................... 46
3.3.1 Compressive Strength and Moisture Content ..................................... 46
3.3.2 Spalling .............................................................................................. 47
3.3.3 Temperature Result ........................................................................... 48
3.3.4 Thermal Diffusivity.............................................................................. 53
3.4 Conclusion ................................................................................................ 55
References .......................................................................................................... 56
CHAPTER 4 ............................................................................................................... 59
Specimen’s Size, Aggregate Size and Aggregate Type Effect on Spalling of Concrete
in Fire ...................................................................................................................... 59
4.1 Introduction ............................................................................................... 59
4.2 Experimental Programme .......................................................................... 60
4.2.1 Concrete Test Specimens .................................................................. 61
4.2.2 Hydrocarbon Fire Test ....................................................................... 65
4.2.3 Spalling Measurements ...................................................................... 67
4.2.4 Nominal Spalling Depth Analysis ........................................................ 67
4.3 Result and Discussion ............................................................................... 69

viii
4.3.1 Spalling .............................................................................................. 69
4.3.2 Nominal Depth ................................................................................... 71
4.3.3 Specimen’s size effect ....................................................................... 71
4.3.4 Aggregate Size Effect ........................................................................ 74
4.3.5 Aggregate Type Effect ...................................................................... 75
4.4 Conclusion ................................................................................................ 76
References .......................................................................................................... 78
CHAPTER 5 ............................................................................................................... 80
Investigation of the Effects of Fly Ash Types and Properties on the Workability of
Fresh Geopolymer................................................................................................... 80
5.1 Introduction ............................................................................................... 80
5.2 Experimental Program............................................................................... 82
5.2.1 Raw Material ...................................................................................... 82
5.2.2 Workability Test ................................................................................. 82
5.2.3 Investigation of the Relevant Physical Properties of Fly Ash .............. 83
5.2.4 Investigation of the Relevant Chemical Properties of Fly Ash ............. 85
5.3 Results and Discussions ........................................................................... 86
5.3.1 Workability Results............................................................................. 86
5.3.2 Analyses of the Measured Physical Properties of Fly Ash .................. 88
5.3.2.1 Particle Size Analyses .................................................................... 88
5.3.2.2 Particle Shape Analyses ................................................................. 94
5.3.3 Chemical Analyses............................................................................. 95
5.4 Conclusion ................................................................................................ 97
References ........................................................................................................ 100
CHAPTER 6 ............................................................................................................. 103
Strength of Geopolymers in Saturated and Dry Conditions.................................... 103
6.1 Introduction ............................................................................................. 103
6.2 Experimental Programme ........................................................................ 104
6.2.1 Material ............................................................................................ 104

ix
6.2.2 Specimens Details ........................................................................... 105
6.2.3 Drying and Saturation Method .......................................................... 105
6.2.4 Compressive Test ........................................................................... 106
6.2.5 Inductively Couple Plasma Test ...................................................... 106
6.3. Result and Discussion ............................................................................ 106
6.3.1 Compressive Strength ..................................................................... 106
6.3.2 Effect of Strength on Reduction of Strength in Saturated Geopolymer
109
6.3.3 Excess Sodium Silicate Factor ........................................................ 110
6.4 Conclusion .............................................................................................. 111
References ........................................................................................................ 112
CHAPTER 7 ............................................................................................................. 114
Hydrocarbon Fire testing of Geopolymer High Strength Concrete Wall Panels and
Cylinders ............................................................................................................... 114
7.1 Introduction ............................................................................................. 114
7.2 Experimental Programme ........................................................................ 115
7.2.1 Material ............................................................................................ 115
7.2.2 Geopolymer Concrete Mix ................................................................ 117
7.2.3 Geopolymer concrete casting ........................................................... 118
7.2.4 Geopolymer concrete properties ...................................................... 123
7.2.5 Hydrocarbon fire test setup .............................................................. 125
7.2.6 Thermal diffusivity ............................................................................ 127
7.2.7 Compressive strength ...................................................................... 128
7.3 Results and Discussion ........................................................................... 129
7.3.1 Spalling ............................................................................................ 129
7.3.2 Temperature Results ........................................................................ 131
7.3.3 Thermal Diffusivity............................................................................ 135
7.3.4 Residual Compressive Strength After Fire Exposure ........................ 136
7.4 Conclusions ............................................................................................ 138

x
References ........................................................................................................ 140
CHAPTER 8 ............................................................................................................. 142
Investigation on Aerated Geopolymer Wall Panels for Fire Applications ................ 142
8.1 Introduction ............................................................................................. 142
8.2 Experimental Programme ........................................................................ 143
8.2.1 Material ............................................................................................ 143
8.2.2 Aerated Geopolymer Panel Properties ............................................. 145
8.2.3 Room Temperature Test .................................................................. 146
8.2.3.1 Bearing Load Test ........................................................................ 147
8.2.3.2 Axial Load Test ............................................................................. 148
8.2.3.3 Corner Bearing Test ..................................................................... 148
8.2.3.4 Flexural Load Test ........................................................................ 149
8.2.4 Hydrocarbon Fire Test ..................................................................... 150
8.2.4.1 Test setup..................................................................................... 150
8.3 Results and Discussion ........................................................................... 152
8.3.1 Room Temperature Test .................................................................. 152
8.3.1.1 Bearing Load Test ........................................................................ 152
8.3.1.2 Axial Load Test ............................................................................. 154
8.3.1.3 Corner Bearing Test ..................................................................... 157
8.3.1.4 Flexural Load Test ........................................................................ 158
8.3.2 Hydrocarbon Fire Test ..................................................................... 161
8.3.2.1 Spalling ........................................................................................ 161
8.3.2.2 Temperature Results .................................................................... 162
8.4 Conclusions ............................................................................................ 164
References ........................................................................................................ 165
CHAPTER 9 ............................................................................................................. 167
Summary, Conclusions and Recommendations .................................................... 167
9.1 Summary................................................................................................. 167
9.2 Conclusions ............................................................................................ 168

xi
9.3 Recommendations .................................................................................. 170
xii
List of Figures Figure 2.1: Types of polysialates (Davidovits, 2002) ................................................... 15
Figure 2.2: Conceptual model for geopolymerisation (Duxson et al., 2007) ................. 16
Figure 2.3: SEM pictures (a) original fly ash, (b) fly ash activated with NaOH
(Fernández-Jiménez et al., 2005) ........................................................................ 16
Figure 2.4: Fly ash production (Flyash Australia, 2010) .............................................. 18
Figure 3.1: Reinforcement details of concrete wall panel (top view) ............................ 38
Figure 3.2: Concrete wall panel dimension and fire exposed area .............................. 39
Figure 3.3: Casting of Ordinary Portland Cement High Strength Concrete .................. 40
Figure 3.4: Casted Full-scale (3.36 m x 3.38 m) Portland Cement High Strength ........ 40
Concrete ..................................................................................................................... 40
Figure 3.5: TramexTM CME 4 moisture meter .............................................................. 42
Figure 3.6: Hydrocarbon and Standard Fire Temperature versus Time Profile ............ 42
Figure 3.7: Wall Panel and Furnace Setup .................................................................. 43
Figure 3.8: Hydrocarbon Fire Furnace ........................................................................ 43
Figure 3.9: Illustration of Thermal Couple’s Location................................................... 44
Figure 3.10: Thermal Couple Set Up ........................................................................... 44
Figure 3.11: Specimen After Fire Test ........................................................................ 47
Figure 3.12: Spalling Concrete Percentage ................................................................. 48
Figure 3.13: Temperature for specimens with 7 mm basalt aggregates ...................... 48
Figure 3.14: Temperature for specimens with 14 mm basalt aggregates .................... 49
Figure 3.15: Temperature for specimens with 20 mm basalt aggregates .................... 49
Figure 3.16: Temperature for specimens with 7 mm granite aggregates ..................... 50
Figure 3.17: Temperature for specimens with 14 mm granite aggregates ................... 50
Figure 3.18: Temperature across the thickness of the specimens with 7 mm basalt
aggregates........................................................................................................... 51
Figure 3.19: Temperature across the thickness of the specimens with 14 mm basalt
aggregates........................................................................................................... 51
Figure 3.20: Temperature across the thickness of the specimens with 20 mm basalt
aggregates........................................................................................................... 52
Figure 3.21: Temperature across the thickness of the specimens with 7 mm granite
aggregates........................................................................................................... 52
Figure 3.22: Temperature across the thickness of the specimens with 14 mm granite
aggregates........................................................................................................... 53

xiii
Figure 3.23: Thermal diffusivity vs Temperature ......................................................... 54
Figure 4.1: Specimens’ dimension .............................................................................. 63
Figure 4.2: Casting of Ordinary Portland Cement High Strength Concrete .................. 63
Figure 4.3: Reinforcement bar details (a) large panel (b) medium panel (c) column .... 65
Figure 4.4: Specimen Fire Test Setup (a) Large panels (b) Medium panels (c) Columns
(d) Cylinders ........................................................................................................ 67
Figure 4.5: Fire Exposed Area (a) Large panels (b) Medium panels (c) Columns (d)
Cylinders ............................................................................................................. 69
Figure 4.6: Images of specimens after fire test (a) Large Panel (b) Medium Panel
(c) Column (d) Cylinder ........................................................................................ 71
Figure 4.7: Nominal Spalling Depth. ............................................................................ 73
Figure 4.8: Nominal Spalling Depth for Maximum Aggregate Size .............................. 75
Figure 4.9: Nominal Spalling Depth for Maximum Aggregate Type ............................. 76
Figure 5.1: Measurement of d1 and d2. ........................................................................ 82
Figure 5.2: CILAS Particle Size Analyzer .................................................................... 84
Figure 5.3: ZEISS Supra 40VP Scanning Electron Microscope ................................... 84
Figure 5.4: Belsorp Max Adsorption Measurement ..................................................... 85
Figure 5.5: Fly ash density measurement equipment .................................................. 85
Figure 5.6: Varian 720-ES inductively coupled plasma equipment .............................. 86
Figure 5.7: Geopolymers with alkaline solution to fly ash ratio of 0.4 for (a) Gladstone.
............................................................................................................................ 87
(b) Tarong. (c) Microash ............................................................................................. 87
Figure 5.8: Particle size distribution graphs for (a) Gladstone fly ash. (b) Tarong fly ash.
(c) Microash ......................................................................................................... 90
Figure 5.9: Adsorption and desorption curves for (a) Gladstone fly ash (b) Tarong fly
ash (c) Microash .................................................................................................. 92
Figure 5.10: Images of Gladstone fly ash in loose grainy form (left) and solid form
(right). .................................................................................................................. 93
Figure 5.11: Scanning Electron Microscope (SEM) Images comparison for Gladstone
Power Station fly ash and Tarong Power Station fly ash. ..................................... 95
Figure 5.12: Mixtures of demineralized water and fly ash from (a) Gladstone Power
Station. (b) Tarong Power Station. (c) Microash .................................................. 97
Figure 6.1: Compressive Strength of Dry and Saturated Geopolymer ....................... 110
Figure 7.1: Aggregate Particle Size Distribution Graph ............................................. 116
Figure 7.2: Sand Particle Size Distribution Graph ..................................................... 116
Figure 7.3: Alkaline activator’s mixer ......................................................................... 119
Figure 7.4: High shear concrete mixer ...................................................................... 119

xiv
Figure 7.5: Dry components mixing process ............................................................. 120
Figure 7.6: Alkaline activator added into the mix ....................................................... 120
Figure 7.7: Geopolymer concrete in high shear concrete mixer ................................ 121
Figure 7.8: Geopolymer fresh concrete ..................................................................... 121
Figure 7.9: Cast geopolymer concrete panel ............................................................. 122
Figure 7.10: Geopolymer concrete panel being steam cured .................................... 122
Figure 7.11: Demoulded hardened geopolymer concrete panels .............................. 123
Figure 7.12: Geopolymer concrete dimensions (a) panel (b) cylinders ...................... 124
Figure 7.13: TramexTM CME 4 moisture meter .......................................................... 124
Figure 7.14: Reinforcement details for geopolymer concrete panel ........................... 125
Figure 7.15: Geopolymer concrete panels and cylinders furnace setup illustration ... 126
Figure 7.16: Images of panels (left) and cylinders (right) hydrocarbon fire test setup 126
Figure 7.17: ProceqTM SilverSchmidt rebound hammer ............................................ 128
Figure 7.18: Geopolymer concrete panels after 2 hours hydrocarbon fire exposure .. 129
Figure 7.19: Geopolymer concrete cylinders after 2 hours hydrocarbon fire exposure
.......................................................................................................................... 130
Figure 7.20: Temperature for panel 1 (P1) ................................................................ 131
Figure 7.21: Temperature for panel 3 (P3) ................................................................ 132
Figure 7.22: Temperature for panel 4 (P4) ................................................................ 132
Figure 7.23: Temperature across thickness for panel 1 ............................................. 133
Figure 7.24: Temperature across thickness for panel 3 ............................................. 134
Figure 7.25: Temperature across thickness for panel 4 ............................................. 134
Figure 7.26: Temperature across thickness comparison between geopolymer concrete
and Portland cement HSC ................................................................................. 135
Figure 7.27: Thermal diffusivity vs Temperature ....................................................... 136
Figure 7.28: Fire tested geopolymer concrete cylinders 150 mm diameter (left) and 100
mm diameter (right) after compressive strength test .......................................... 138
Figure 8.1: Sand Particle Size Distribution Graph ..................................................... 144
Figure 8.2: Aerated geopolymer panel cross section ................................................ 146
Figure 8.3: Reinforcement details for aerated geopolymer panel .............................. 146
Figure 8.4: TramexTM CME 4 moisture meter ............................................................ 147
Figure 8.5: Bearing load test setup ........................................................................... 147
Figure 8.6: Axial load test setup ................................................................................ 148
Figure 8.7: Corner bearing test setup ........................................................................ 149
Figure 8.8: Flexural load test setup ........................................................................... 149
Figure 8.9: Hydrocarbon temperature versus time curves ......................................... 150
Figure 8.10: Aerated geopolymer concrete panels furnace setup illustration ............. 151

xv
Figure 8.11: Image of aerated geopolymer panels fire test setup .............................. 151
Figure 8.12: Bearing load vs displacement graph for panel 1 .................................... 153
Figure 8.13: Bearing load vs displacement graph for panel 2 .................................... 153
Figure 8.14: Bearing load vs displacement graph for panel 3 .................................... 153
Figure 8.15: Photos of panels’ shear failure after bearing load test ........................... 154
Figure 8.16: Axial load vs displacement for panel 1 .................................................. 155
Figure 8.17: Axial load vs displacement for panel 2 .................................................. 155
Figure 8.18: Axial load vs displacement for panel 3 .................................................. 156
Figure 8.19: Buckling failure of panel 1 ..................................................................... 156
Figure 8.20: Localised failure at bottom of panels after axial load test ...................... 157
Figure 8.21: Photos of panels after corner bearing test ............................................. 158
Figure 8.22: Flexural load versus displacement for panels with Crust up .................. 159
Figure 8.23: Flexural load versus displacement for panels with Crust down .............. 159
Figure 8.24: Photos of panels’ cracks after flexural load test..................................... 161
Figure 8.25: Aerated geopolymer panels after 30 minutes hydrocarbon fire exposure
.......................................................................................................................... 162
Figure 8.26: Temperature for aerated geopolymer panel .......................................... 163
Figure 8.27: Temperature across thickness for panel 1 ............................................. 163

xvi
List of Tables Table 2.1: Bibliographic history of some important events/articles about alkali-activated
cements (Li et al., 2010) ...................................................................................... 13
Table 2.2: Chemical requirement for Class F and Class C fly ashes according to ASTM
618 (1994) ........................................................................................................... 18
Table 2.3: Average chemical content for fly ashes in Australia (Heidrich, 2003) .......... 19
Table 3.1: Concrete (per cubic meter) mix summary ................................................... 39
Table 3.2: Concrete Casting and Fire Test Details ...................................................... 41
Table 3.3: Compressive strength and moisture content summary ............................... 46
Table 4.1: Concrete (per cubic meter) mix summary ................................................... 61
Table 4.2: Specimens’ fire test details ......................................................................... 64
Table 4.3: Spalling Percentage Summary for All Specimens....................................... 72
Table 5.1: Relative slump summary ............................................................................ 88
Table 5.2: Average Diameter Summary ...................................................................... 89
Table 5.3: Adsorption test (BET Theory) results summary .......................................... 92
Table 5.4: Bulk density of fly ash ................................................................................ 93
Table 5.5: Water Absorption Test Results ................................................................... 93
Table 5.6: Chemical Component and slump-flow of Fly Ash ....................................... 96
Table 5.7: Chemical concentration for water filtered from fly ash and demineralized
water mixture ....................................................................................................... 97
Table 6.1: Chemical composition of fly ash (Kong and Sanjayan, 2010) ................... 105
Table 6.2: Result summary of geopolymers with 0.4 alkaline solution to fly ash ratio and
2.5 Na2SiO3 to NaOH ratio ................................................................................. 107
Table 6.3: Result summary of geopolymers with 0.4 alkaline solution to fly ash ratio and
1.75 Na2SiO3 to NaOH ratio ............................................................................... 107
Table 6.4: Result summary of geopolymers with 0.4 alkaline solution to fly ash ratio and
1.0 Na2SiO3 to NaOH ratio ................................................................................. 108
Table 6.5: Result summary of geopolymers with 0.57 alkaline solution to fly ash ratio
and 2.5 Na2SiO3 to NaOH ratio .......................................................................... 109
Table 6.6: ICP Test Results ...................................................................................... 110
Table 7.1: Chemical composition of Gladstone fly ash .............................................. 115
Table 7.2: Sodium silicate specification .................................................................... 117
Table 7.3: Geopolymer concrete mixture proportions ................................................ 118
Table 7.4: Moisture content and testing date details ................................................. 124
Table 7.5: Geopolymer concrete spalling summary .................................................. 130
Table 7.6: Compressive Strength and Density Summary .......................................... 136

xvii
Table 7.7: Residual compressive strength summary ................................................. 137
Table 8.1: Chemical component of Gladstone fly ash ............................................... 144
Table 8.2: Sodium silicate specification .................................................................... 145
Table 8.3: Panels weight and density summary ........................................................ 152
Table 8.4: Results of Bearing Load Tests ................................................................. 152
Table 8.5: Results of Axial Load Tests ...................................................................... 156
Table 8.6: Results of Corner Bearing Tests .............................................................. 157
Table 8.7: Results of Flexural Load Tests ................................................................. 159
Table 8.8: Calculated Maximum Loads for various d, f’c and fy ................................. 160
Table 8.9: Aerated geopolymer panel spalling summary ........................................... 162

xviii
List of Abbreviations
ft - tensile strength of concrete
fy - compressive strength of concrete
HSC - high strength concrete
ICP - inductively couple plasma
K - thermal diffusivity
LOI - loss on ignition
PS - polysialate
PSS - polysialate-siloxo
PSDS - polysialate-diloxo
PC - pulvarized coal
rp - relative slump
SEM - scanning electron microscopic
SF - slump-flow
t - time (minutes)
T - temperature (oC)
XRF - X-Ray fluorescence

1
CHAPTER 1
Introduction
1.1 Background
Concrete structures were designed to withstand various types of environmental
conditions categorised as from mild to very severe conditions. Fire represents one of
the most severe environmental conditions to which concrete structures may be
subjected to such as close conduit structure like tunnel (Kim et al., 2010; Khaliq and
Kodur, 2011). There are many reasons that can trigger fire event in a tunnel or high
rise building. Fire event in Tunnel Mont Blanc in 1999 was initiated from a breakdown
of a truck carrying margarine and flour. In 2010, a 28-story high-rise apartment caught
on fire ignited from welding spark killing at least 50 people. A recent fire event occurred
in 2012, when two buses collided in the 12.9 km Hsuehshan Tunnel, Taiwan causing a
passenger bus to catch fire after it was rear-ended by another bus. Generally,
concrete is regarded as a fire resistant construction material, especially when
compared to the alternatives such as steel and timber. However, concrete is
susceptible to a less known phenomenon termed spalling in fire. Spalling normally
occurs on concrete exposed to fire especially high strength concrete structure in which
widely used nowadays in high rise buildings and tunnels. (Sanjayan and Stocks, 1993).
The new breed of concrete binder considered to be the binder of the future due to less
CO2 emission, geopolymer is a cementless concrete binder. The name geopolymer

2
was coined by Davidovits in 1975 (Davidovits, 1991; Van Jaarsveld et al., 2002).
Geopolymer concrete is known as very high fire resistance material due to its ceramic-
like properties (Davidovits and Davidovics, 1991). Geopolymer concrete strength after
elevated temperature exposure can increase due to further geopolymerisation (Pan et
al., 2009). However, there is decrease in strength of geopolymer concrete after
elevated temperature exposure especially geopolymer concrete with coarse aggregate
due to thermal incompatibility between aggregates and binder which can contribute to
the decline in geopolymer concrete strength (Kong and Sanjayan, 2008).
To-date, the chemistry of geopolymer has been extensively focused by many studies.
Some investigations have been undertaken to study the material properties of
geopolymer concrete and structural behaviour of geopolymer concrete structural
elements such as beams and columns, high performance geopolymer concrete and
steel fibre reinforced geopolymer concrete. Only a few have investigated the
performance of geopolymer concrete in fire, let alone large scale size geopolymer
concrete and hydrocarbon fire exposure.
1.2 Aim of research
The aim of the research is to develop a fire resistant geopolymer concrete when
exposed to hydrocarbon fire.
1.3 Research objectives
The objectives of the research are listed below:
1) To investigate the performance of large scale high strength geopolymer
concrete panels and aerated geopolymer concrete in hydrocarbon fire.
2) To investigate the severity of large scale high strength Portland cement
concrete spalling when exposed to hydrocarbon fire.
3) To investigate several issues affecting high strength geopolymer concrete
casting in mass production.
1.4 Scope of the thesis
This research was undertaken in two main parts; Portland cement high strength
concrete part and geopolymer concrete part. In Portland cement high strength part, the
severity of high strength Portland cement concrete spalling was investigated by
exposing large scale 3 m square wall panel to hydrocarbon fire. The weight loss of
panels after fire test was measured and the spalling percentage was calculated based

3
on the weight loss. The panel’s temperatures were measured at several depths of wall
for further thermal properties analysis.
In addition, specimen size effect on spalling was investigated by comparing the spalling
of 3 m square panels with 1 m square panels, columns and cylinders. All panels were
cast with different maximum aggregate size (7 mm, 14 mm and 20 mm) and type
(basalt and granite) for investigation on aggregate size and type effect on spalling.
In geopolymer concrete part, 3 types of fly ash were initially selected as aluminosilicate
source of geopolymer concrete namely Gladstone fly ash (from Gladstone power
station), Tarong fly ash (from Tarong power station) and Microash. Since the
geopolymer concrete were cast in large scale production, workability of fresh
geopolymer was used as main criteria in selecting the fly ash. Therefore, Gladstone fly
ash was selected because fresh geopolymer exhibited the best workability compared to
Tarong and Microash. Factors affecting the workability of these fly ashes were
investigated out by examining the physical properties of the fly ashes such as mean
particle size, particle size distribution, pore volume, water absorption and density. The
effect of water to geopolymer mortar was investigated by examining the strength of
geopolymer paste in saturate and dry conditions. The high strength geopolymer
concrete mix was determined based on the outcome of fly ash workability and water
effect investigation.
The investigation on the performance of high strength geopolymer concrete was
carried out by exposing 1 m square wall panels and 2 sizes of cylinders (100 mm and
150 mm diameter) to hydrocarbon fire. Concrete spalling, temperature profile and
residual strength were measured. Thermal incompatibility between aggregate and
geopolymer effect on spalling was also investigated. Aerated geopolymer concrete
(without coarse aggregate) wall panels were tested for hydrocarbon fire exposure. In
addition, investigation on the suitability of aerated geopolymer concrete to be used as
structural member was carried out by testing the panels for axial load capacity, bearing
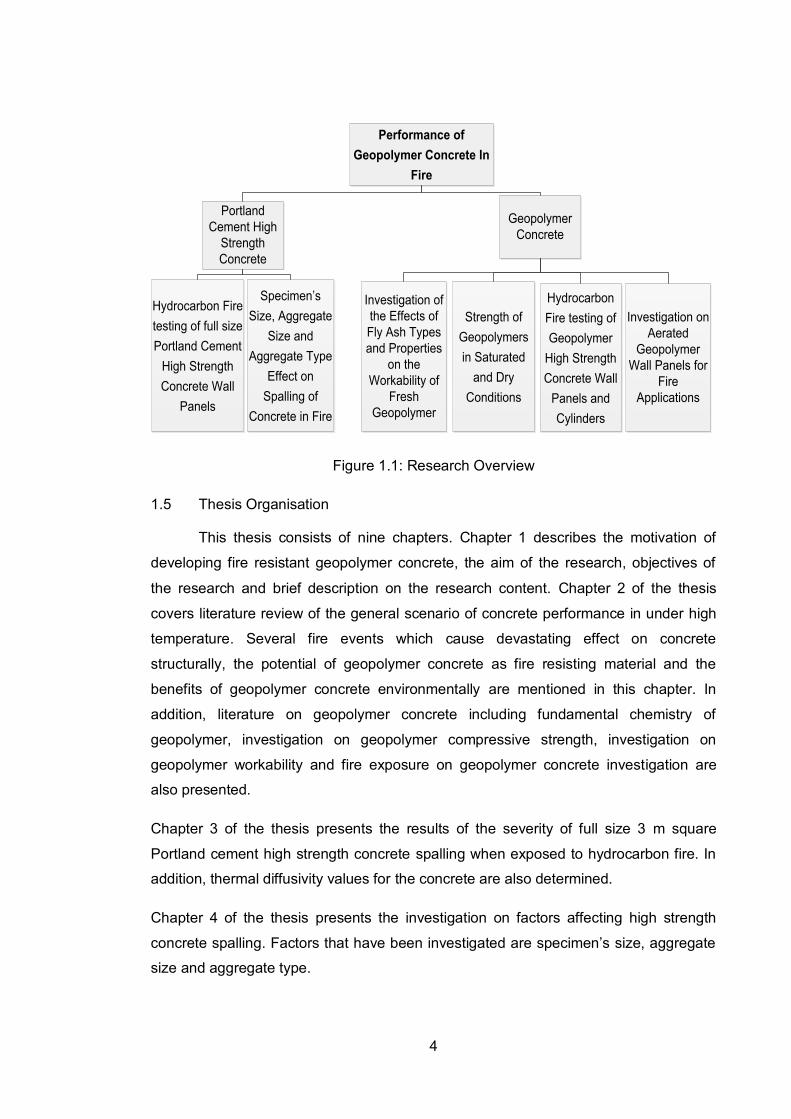
capacity, flexural strength and corner bearing capacity. The overview of the research is
illustrated in Figure 1.1
4
Performance of Geopolymer Concrete In
Fire
Portland Cement High
Strength Concrete
Hydrocarbon Fire testing of full size Portland Cement
High Strength Concrete Wall
Panels
Geopolymer Concrete
Specimen’s Size, Aggregate
Size and Aggregate Type
Effect on Spalling of
Concrete in Fire
Investigation of the Effects of Fly Ash Types and Properties
on the Workability of
Fresh Geopolymer
Strength of Geopolymers in Saturated
and Dry Conditions
Hydrocarbon Fire testing of Geopolymer
High Strength Concrete Wall
Panels and Cylinders
Investigation on Aerated
Geopolymer Wall Panels for
Fire Applications
Figure 1.1: Research Overview
1.5 Thesis Organisation
This thesis consists of nine chapters. Chapter 1 describes the motivation of
developing fire resistant geopolymer concrete, the aim of the research, objectives of
the research and brief description on the research content. Chapter 2 of the thesis
covers literature review of the general scenario of concrete performance in under high
temperature. Several fire events which cause devastating effect on concrete
structurally, the potential of geopolymer concrete as fire resisting material and the
benefits of geopolymer concrete environmentally are mentioned in this chapter. In
addition, literature on geopolymer concrete including fundamental chemistry of
geopolymer, investigation on geopolymer compressive strength, investigation on
geopolymer workability and fire exposure on geopolymer concrete investigation are
also presented.
Chapter 3 of the thesis presents the results of the severity of full size 3 m square
Portland cement high strength concrete spalling when exposed to hydrocarbon fire. In
addition, thermal diffusivity values for the concrete are also determined.
Chapter 4 of the thesis presents the investigation on factors affecting high strength
concrete spalling. Factors that have been investigated are specimen’s size, aggregate
size and aggregate type.

5
Aluminosilicate source (fly ash) for geopolymer was investigated and reported in
Chapter 5. This chapter presents the effect of physical properties of fly ash on
workability of geopolymer. The source of fly ash used in this research was decided
based on the outcome of this chapter.
Chapter 6 of the thesis presents the strength of geopolymer paste in both saturated
and dry condition. Geopolymer is basically an aluminosilicate reaction to produce gel
and hardening process through polymerization. Unlike hydration process in Portland
cement binder, geopolymer’s reaction does not involve free water during mixing stage.
Therefore, strength reduction when geopolymer immersed in water for saturation
process was investigated.
Chapter 7 of the thesis presents the performance of high strength geopolymer concrete
exposed to hydrocarbon fire. High strength geopolymer mix calculation and casting
procedure are also presented. High strength geopolymer concrete spalling,
temperature profile, thermal diffusivity graphs and residual strength are discussed and
reported in this chapter.
Chapter 8 of the thesis describes the investigation of aggregate and geopolymer binder
thermal incompatibility effect on spalling and the suitability of aerated geopolymer
concrete wall to be used as structural member in fire application. Aerated geopolymer
concretes wall without coarse aggregate were tested under room temperature (flexural,
bending, axial load and corner bearing) and in fire conditions.
Finally in Chapter 9 of the thesis, overall conclusions made in this research are
provided. In addition, recommendations of future work and discussions on enhancing
geopolymer concrete research are also presented.

6
References
Davidovits, J. (1991). "Geopolymers - Inorganic polymeric new materials." Journal of
Thermal Analysis 37(8): 1633-1656.
Davidovits, J. and Davidovics, M. (1991). Geopolymer. Ultra-high temperature tooling
material for the manufacture of advanced composites. International SAMPE
Symposium and Exhibition (Proceedings).
Khaliq, W. and Kodur, V. K. R. (2011). "Effect of High Temperature on Tensile Strength
of Different Types of High-Strength Concrete." ACI Materials Journal 108(4):
394-402.
Kim, J. H. J., Mook Lim, Y., Won, J. P. and Park, H. G. (2010). "Fire resistant behavior
of newly developed bottom-ash-based cementitious coating applied concrete
tunnel lining under RABT fire loading." Construction and Building Materials
24(10): 1984-1994.
Kong, D. L. Y. and Sanjayan, J. G. (2008). "Damage behavior of geopolymer
composites exposed to elevated temperatures." Cement and Concrete
Composites 30(10): 986-991.
Pan, Z., Sanjayan, J. G. and Rangan, B. V. (2009). "An investigation of the
mechanisms for strength gain or loss of geopolymer mortar after exposure to
elevated temperature." Journal of Materials Science 44(7): 1873-1880.
Sanjayan, G. and Stocks, L. J. (1993). "Spalling of high-strength silica fume concrete in
fire." ACI Materials Journal 90(2): 170-173.
Van Jaarsveld, J. G. S., Van Deventer, J. S. J. and Lukey, G. C. (2002). "The effect of
composition and temperature on the properties of fly ash- and kaolinite-based
geopolymers." Chemical Engineering Journal 89(1-3): 63-73.

7
CHAPTER 2
Literature Review
2.1 Background
Generally, concrete is regarded as a fire resistant construction material,
especially when compared to the alternatives such as steel and timber. However,
concrete is susceptible to a well-known phenomenon termed spalling in fire. Spalling is
a physical process of the breakdown of surface layers of concrete which crumble into
small pieces in response to high temperatures and/or mechanical pressure. Spalling of
concrete in fire is dislodgement of small pieces of concrete (chips up to 50 mm)
popping out from the surface of concrete, often explosive in nature. Explosive spalling
may have a very severe impact on the surrounding environment. Pieces of smashed
concrete can fly with high speed and explosive energy causing severe casualty (Ali et
al., 2001). For example, a fire in Channel tunnel (35 km railroad tunnel connecting
England and France) in 1996 caused severe damage to concrete tunnel rings owing to
the spalling of concrete and resulted in six-month closure for repairs costing US$1.5
million per day (Ulm et al., 1999). On 24 March 1999, a cargo truck carrying margarine
and flour in the Mont Blanc tunnel connecting France and Italy caught fire and stopped
at Kilometre 6.7 causing 39 human deaths and severely damaging 900 m long tunnel
roof due to spalling (Roh et al., 2008). A fire occurred in the Great Belt tunnel in
Denmark in 1995 also causing severe spalling of concrete tunnel rings (Hertz, 2003).
Steam pressure build-up in the pores of concrete in fire is believed to cause moisture
clog spalling, first proposed by Shorter and Harmathy (1961). Spalling was not

8
considered a major problem until the advent of high strength concrete (HSC) and its
widespread use since 1990’s. HSCs are significantly more vulnerable to spalling in fire.
Sanjayan and Stocks (1993) is the first published research work in international journal
identified this problem. Since HSC has become the dominant construction material,
there has been a renewed interest in spalling research. Highly reputed researchers in
the field of concrete have now cast doubts on the moisture clog spalling hypothesis.
Bazant (1997) hypothesized that spalling results from restrained thermal dilation close
to the heated surface, which leads to compressive stresses parallel to the heated
surface, leading to brittle fractures of concrete. This hypothesis is further developed by
Ulm et al. (1999) - chemoplastic softening model, Stabler and Baker (2000a and
2000b) - coupled thermo-mechanical damage model and Nechnech et al. (2002) -
elasto-plastic damage model.
National Research Council of Canada (NRC), as well as a number of organizations
world-wide, reported that factors affecting fire performance of high strength concrete
are concrete strength, concrete density, load intensity, moisture content, fire intensity,
aggregate type and specimen’s dimension (Kodur, 2000)
Spalling may also result from the thermal incompatibility between the aggregates and
the cement paste, in particular in concrete with silicious aggregates (Kong and
Sanjayan, 2010; Pan et al., 2012). The exact mechanism of spalling is still hotly
disputed.
Experimental results published by Crozier and Sanjayan (2000) showed that areas of
concrete surfaces under compressive stresses are more prone to spalling than the
ones under tensile stresses. This evidence supports the hypothesis of brittle fracture of
concrete under compressive stresses due to restrained thermal dilation. The fact that
HSC is highly brittle also supports this theory. HSC is predominantly used in structural
elements subjected high level of compressive stresses, e.g., the tunnel’s rings and
columns in high-rise buildings.

9
Due to the highly publicized events such as Channel and Great Belt fires, many
infrastructure owners are demanding the spalling issue to be addressed at the design
stage. Currently, it is addressed by providing some sort of fireproofing to concrete
tunnel rings and columns in high-rise buildings. These fireproofing add significant
expense to the construction costs due to materials cost and high manpower needed for
complicated installation procedures. In addition, sprayed type fire proofing on exposed
structural member does not enhance the architectural design of a building.
Spalling occurs in the initial stages of the fire, i.e., within 15 to 30 minutes (Sanjayan
and Stocks, 1993; Crozier and Sanjayan, 2000) – a critical period for fire control and
escape. Hydrocarbon fire in a tunnel can have catastrophic consequences due to the
tunnel collapse caused by concrete spalling, while fire fighters are assisting people to
escape.
Further, the large columns in lower storeys of high-rise buildings constructed during the
last decade are almost always constructed with high strength concrete, which are
susceptible to spalling of concrete in a fire (Sanjayan and Stocks, 1993). Lower storey
columns virtually carry the entire building and destruction of these columns in a fire can
have catastrophic consequences. Spalling results in rapid loss of the surface layers of
the concrete columns exposing the steel reinforcement, which quickly loses strength
when exposed to fire. Ali et al. (2001) reported that 17 out of 18 columns tested for fire
test spalled explosively.
Chan et al. (1999) conducted fire tests using standard’s fire curve on 100 mm cubic
concrete cube made with silica fume. All specimens spalled explosively and Chan et al.
(1999) concluded that moisture content and strength are the two main factors
governing explosive thermal spalling of concrete. Moisture content has a dominant
influence on spalling.
Noumowe et al. (2006) reported that 160 mm diameter cylinders and 100 x 100 x 400
mm prism self-compacted high strength concrete spalled during low heating rate
(0.5oC/min) with maximum 400oC temperature while normal high strength (vibrator

10
compacted) concrete remained un-spalled. Normal high strength concrete recorded
55% residual strength after the heating cycle. However, both self-compacted high
strength and normal high strength concrete spalled explosively when exposed to
standard fire curve.
Hernández-Olivares and Barluenga (2004) also reported similar outcome when 200 x
300 x 50 prism high strength concrete made with silica fume spalled when exposed to
standard fire temperature curve.
Noumowe et al. (2009) reported that 160 × 320 mm specimens of lightweight
aggregate concrete spalled during the heating phase. The explosion took place when
the temperature at the surface of the specimens was between 290 and 430°C and
concluded that combination of high thermal gradient (which induces high thermal
stresses) and low permeability (which induces high vapour pressure) is main concern
in the concrete spalling at high temperature.
Arioz (2007) reported that surface cracks of 70×70×70 mm concrete became visible
when the temperature reached 600°C. The cracks were very pronounced at 800°C and
increased extremely when the temperature increased to 1000°C. The weight of the
concrete specimens reduced significantly as the temperature increased. This reduction
was gradual up to 800°C. A sharp reduction in weight was observed beyond 800°C.
The increments of crack and weight reduction are due to chemical degradation of OPC
cement binder at 800°C temperature.
Most of researches investigated the damage of fire exposure to concrete on small lab
scale specimens and fire exposure are based on Standard Fire (or cellulosic fire)
specified by ISO 834 (International Standard, 1999). The size of these specimens are
not representing the level of concrete deterioration in terms of spalling and other
thermal properties when exposed to fire in actual condition. In addition, risk of spalling
is significantly raised when the rate of temperature rise is rapid (Copier, 1983). In a
hydrocarbon fire according to EN 1991, rate of heating is twice as the standard fire
(room temperature to 1000oC within 10 minutes) (BSI, 2005). Hydrocarbon fire

11
simulates fire event in a tunnel, petrochemical refineries plant, combustible chemical
storage warehouse, etc. Therefore, in this research, the performance of high strength
concrete exposed to fire was conducted in large scale high strength concrete wall
panels and results from large scale specimens were compared with small scale ones.
Fire temperature curve for fire exposure was based on hydrocarbon fire to maximise
the spalling risk. This research also investigates the size effect as discussed above
where there is no consensus as to how the size effects the spalling of concrete.
2.2 Geopolymer Binder in Concrete for Spalling Solution
During the last decade, remarkable achievements have been made through
geosynthesis and geopolymerisation. It is an excellent alternative to Portland cement
binder concrete due to the elastic properties of hardened geopolymer concrete and the
behaviour and strength of reinforced geopolymer concrete structural members are
similar to those observed in the case of Portland cement concrete (Rangan, 2008)
Geopolymers are very-low viscosity inorganic resins, hardened like thermosetting
resins, but have very high strength and fire resistance, and are ceramic-like in their
properties (Davidovits, 1991). An ultra-high temperature tooling material for the
manufacture of advanced composites was made using geopolymers, which performed
better than the ceramic tooling materials (Davidovits and Davidovics, 1991). During the
Grand Prix season 1994 and 1995, Benetton-Renault Formula 1 Sport Car designed a
unique thermal shield made out of carbon/geopolymer composite. It helped Michael
Schumacher to win twice the world championship and offered to his technical team to
become World Champion of car builders during these two years. Since then, most
Formula 1 teams are using geopolymer composite materials (www.geopolymer.org).
Lyon et al. (1997) reported that geopolymer composites is ideally suited for
construction, transportation and infrastructure where fire endurance is part of needed
requirement .
Low cost geopolymer resins can be produced by activation of fly ash. Geopolymer
concrete is produced by combining these resins with coarse and fine aggregates using
the conventional concrete technology methods. Since fly ash is an industrial by-product
from coal power stations (largely wasted by dumping in landfills), the cost of
manufacturing this concrete can be potentially lower than the conventional Portland
cement based concrete.

12
Research works reported so far in the literature indicate that geopolymers have
superior fire resistance when compared to conventional concretes (Kong et al., 2008;
Kong and Sanjayan, 2008; Pan et al., 2009). The superior fire resistance properties are
attributed to the ceramic-like properties of geopolymers, including the way it looks:
smooth, glassy and shiny (Palomo et al., 1999).
2.3 Geopolymer Binder in Concrete for Environmental Benefits
Production of 1 ton of Portland cement consumes 1½ tons of raw materials and
is responsible for the release of about 0.75 ton of CO2 into the atmosphere. Portland
cement production releases 6.5 million tons of CO2 in Australia. Worldwide,
greenhouse gas emission from the Portland cement production is about 3 billion tons
annually or about 7% of the total greenhouse gas emissions to the earth’s atmosphere.
Further, the production of Portland cement worldwide is increasing 3% annually
(Collins and Sanjayan, 2002; Hardjito et al., 2004). The amount of CO2 emissions due
to concrete using conventional Portland cement is the fourth largest contributor to
global carbon emissions after oil, coal and natural gas. Portland cement was found to
be the primary source of CO2 emissions generated by typical commercially produced
concrete mixes, being responsible for 74% to 81% of total Portland cement concrete
CO2 emissions (Flower and Sanjayan, 2007).
Utilisation of unused industrial by-products such as fly-ash, which otherwise are
dumped in landfills and contribute to land pollution, to make concrete without the use of
any Portland cement will not only reduce the cost of construction materials but also
reduce the greenhouse gas emissions arising from Portland cement manufacture.
Power stations around the world are currently still using coal as fuel to generate
electricity. These power stations produce enormous quantities of fly-ash residues every
year. In 2011, about 13 million tons per annum of fly ash is produced in Australia
(Cement Australia, 2011), in which only small quantity is used for cementitious
applications (e.g. Portland cement/fly ash blended cements, road stabilisation, low
strength fills, asphaltic fillers etc) (Heidrich, 2003). Worldwide, the production of fly ash
is 390 million tons per annum, but its utilisation was less than 14%. In the future, fly ash
production will increase, especially in countries such as China and India (Hardjito et al.,
2005). From China alone, 2.1Gt produced in 2011 which accounting for 58% of world
total cement production (Oss, 2011). Therefore, utilizing the fly ash in geopolymer

13
concrete as fire resistance construction materials in this research will not only have a
huge impact on concrete in fire development, but also provided a better sustainable
environment.
2.4 Geopolymer History and Reaction Mechanisms
Alkali-activated cement researches begin in 1939 with the work of Feret (slags
used for cement) and alkali-slag combinations work by Purdon in 1940 (Roy, 1999).
Glukhovsky (1959) used “soil cement” term for concrete binder which using “soil
silicates” In 1979, Davidovits introduced “geopolymer” terms for alkaline activated
material and the term is generally accepted to-date. Table 2.1 summarises the history
of alkali-activated cement (Roy, 1999; Li et al., 2010).
Table 2.1: Bibliographic history of some important events/articles about alkali-activated cements (Li et al., 2010) Author Year Significance
Feret 1939 Slags used for cement
Purdon 1940 Alkali-slag combination
Glukhovsky 1959 First called “alkaline cements”
Davidovits 1979 “Geopolymer” term
Forss 1983 F-cement (slag-alkali-superplastizer)
Davidovits and Sawyer 1985 Patent of “Pyrament’ cement
Krivenko 1986 DSc thesis, R20-RO-SiO2-H20
Deja and Maloplepsy 1989 Resistance to chlorides shown
Roy and Langton 1989 Ancient concretes analogs
Talling and Brandstetr 1989 Alkali-activated slag
Wu et al. 1990 Activation of slag cement
Roy et al. 1991 Rapid setting alkali-activated cements
Wang and Scivener 1995 Slag and alkali-activated microstructure
Fernandez-Jimenez and Puertas 1997 Kinetic studies of alkali-activated slag cements
Davidovits 1999 Chemistry of geopolymeric system
Palomo 1999 Alkali-activated fly ash – a cement for the future
Palomo and Palacios 2003 Immobilization of hazardous waste
Duxson 2007 Geopolymer technology: the current state of art
Provis and Deventer 2009 Geopolymers: structure, processing, properties
and industrial application

14
Table 2.1 only lists the major works in the chemical aspects of the alkali activated
cements and have missed some contributions by our group. Alkali activated research
commenced in Melbourne in 1995 with the investigation on microstructure and
durability of alkali activated cementitious paste (Bakharev and Patnaikuni, 1997). In
1997, Collins and Sanjayan (1998) used alkali activated cement primarily to find a way
to increase early age strength characteristics of slag concrete . The slag blended
cement with Portland cements are notoriously low in early age strength and therefore
have difficulty being used in precast applications. The group has also demonstrated
that alkali activated cements have superior sulphate resistance (Bakharev et al., 2002)
and acid resistance (Bakharev et al., 2003). Fire resistance properties of geopolymer
using fly ash showed excellent results. Some of the major publications in this area are:
Kong et al. (2008), Kong and Sanjayan (2010) and Pan and Sanjayan (2010). The
mechanical properties of geopolymer show that the properties are comparable to
Portland cement concretes (Pan et al., 2011).
The polymerisation process involves a chemical reaction under highly alkaline
conditions on Al-Si minerals (e.g. fly ash, kaolin, metakaolin), yielding polymeric Si-O-
Al-O bonds, as described by Davidovits (1991): Mn [ – ( Si – O2 ) z – Al – O ] n . wH2O,
where M is the alkaline element, the symbol – indicates the presence of a bond, z is 1,
2 or 3, and n is the degree of polymerisation.
Sialate is an abbreviation for silicon-oxo-aluminate in which the alkali is sodium (Na+),
potassium (K+), lithium (Li+) or calcium (Ca2+). Polysialates are chain and ring polymers
with Si4+ and Al3+ in IV-fold coordination with oxygen and range from amorphous to
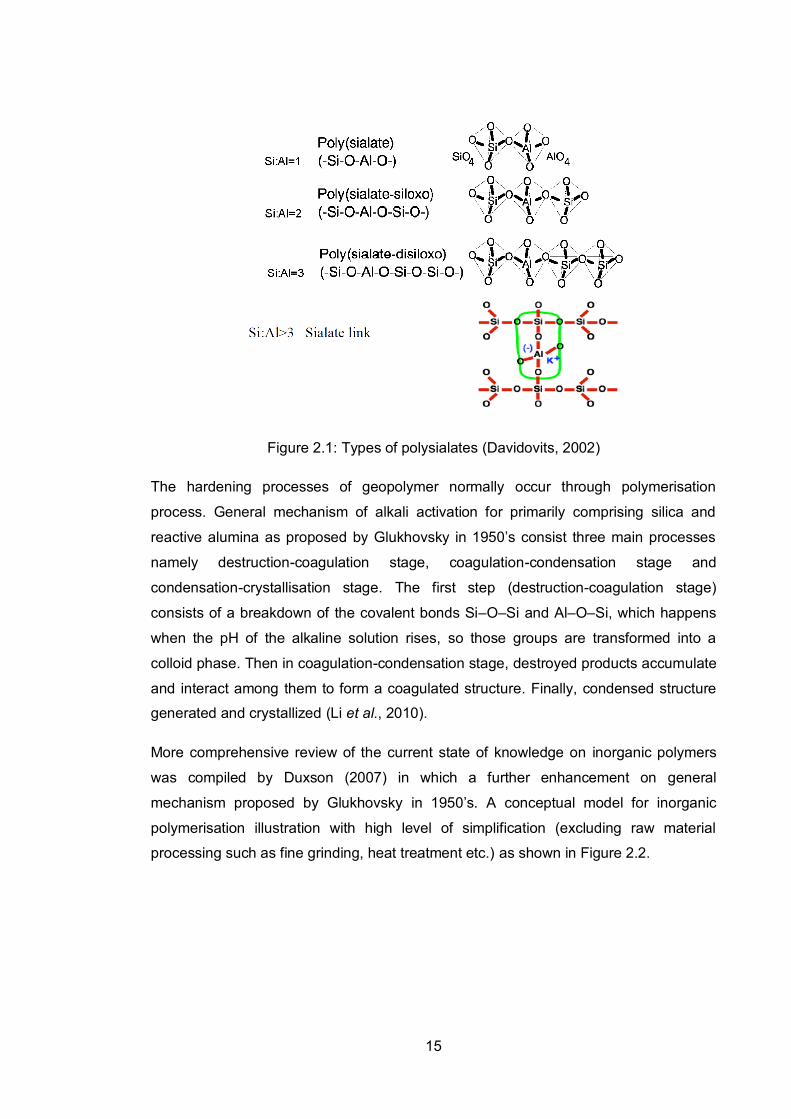
semi-crystalline (Davidovits, 1991). Types of polysialates identified in geopolymer are
polysialate (PS), polysialate-siloxo (PSS), polysialate-disiloxo (PSDS) as shown in
Figure 2.1
15
Figure 2.1: Types of polysialates (Davidovits, 2002)
The hardening processes of geopolymer normally occur through polymerisation
process. General mechanism of alkali activation for primarily comprising silica and
reactive alumina as proposed by Glukhovsky in 1950’s consist three main processes
namely destruction-coagulation stage, coagulation-condensation stage and
condensation-crystallisation stage. The first step (destruction-coagulation stage)
consists of a breakdown of the covalent bonds Si–O–Si and Al–O–Si, which happens
when the pH of the alkaline solution rises, so those groups are transformed into a
colloid phase. Then in coagulation-condensation stage, destroyed products accumulate
and interact among them to form a coagulated structure. Finally, condensed structure
generated and crystallized (Li et al., 2010).
More comprehensive review of the current state of knowledge on inorganic polymers
was compiled by Duxson (2007) in which a further enhancement on general
mechanism proposed by Glukhovsky in 1950’s. A conceptual model for inorganic
polymerisation illustration with high level of simplification (excluding raw material
processing such as fine grinding, heat treatment etc.) as shown in Figure 2.2.
16
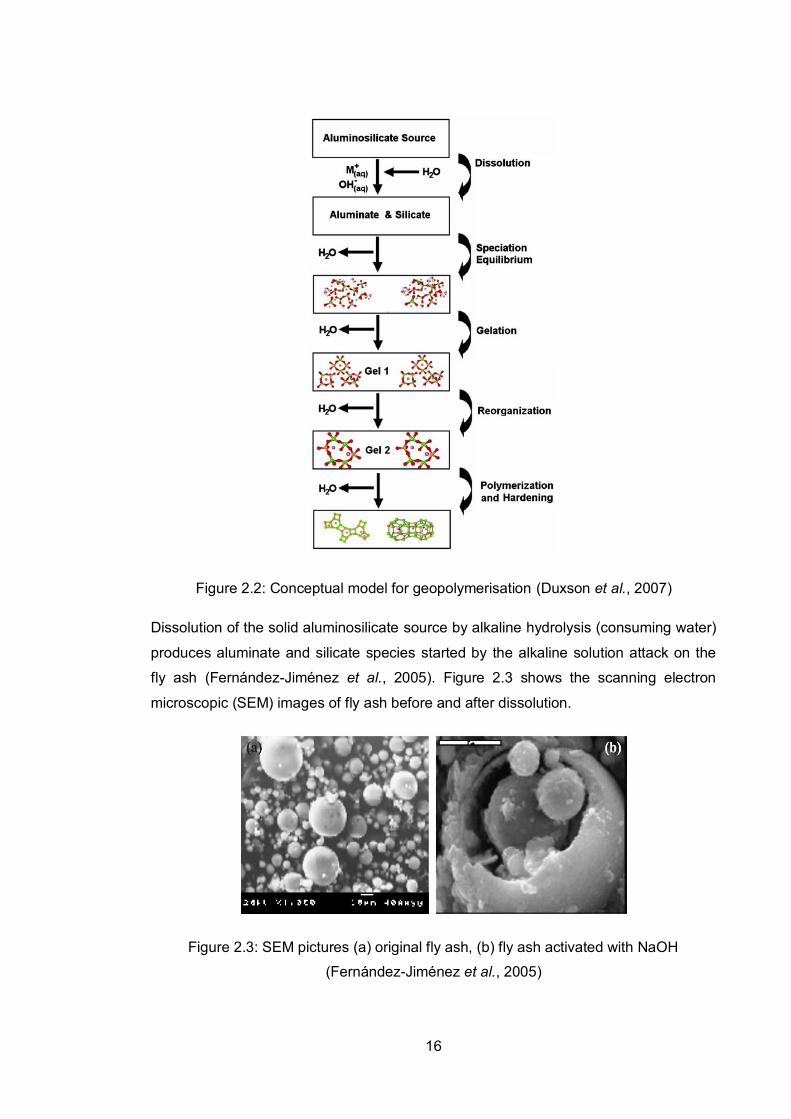
Figure 2.2: Conceptual model for geopolymerisation (Duxson et al., 2007)
Dissolution of the solid aluminosilicate source by alkaline hydrolysis (consuming water)
produces aluminate and silicate species started by the alkaline solution attack on the
fly ash (Fernández-Jiménez et al., 2005). Figure 2.3 shows the scanning electron
microscopic (SEM) images of fly ash before and after dissolution.
Figure 2.3: SEM pictures (a) original fly ash, (b) fly ash activated with NaOH
(Fernández-Jiménez et al., 2005)

17
Once in solution the species released by dissolution are incorporated into the aqueous
phase, which may already contain silicate present in the activating solution. A complex
mixture of silicate, aluminate and aluminosilicate species is thereby formed.
Supersaturated aluminosilicate solution is created at high rate due to rapid dissolution
of amorphous aluminosilicate at high pH. This supersaturated aluminosilicate solution
resulted in gel formation. The system continues to rearrange and reorganize after the
gel formation resulting in the three-dimensional aluminosilicate network commonly
attributed to geopolymers (Duxson et al., 2007).
2.5 Fly Ash
Fly ash also known as pulverised fuel ash, is a fine grey powder consisting
mostly of spherical glassy particles. It is residue product from burning coal in coal fired
power station. Fly ash is collected from the exhaust gases from the combustion
chambers with electrostatic precipitators or bag houses before the gases are released
to atmosphere (Flyash Australia, 2010; Cement Australia, 2011). Explanation of fly ash
production at a power station is shown in Figure 2.4.
Coal is injected into the furnace and ignited while in suspension. During combustion,
minerals in coal become fluid at high temperature and are then cooled. In a pulverized
coal (PC) fired boiler, the furnace operating temperatures are typically in excess of
1400°C. As the particles are heated, volatile matter is vaporized and combustion
occurs. Minerals undergo thermal decomposition, fusion, disintegration and
agglomeration. The final products of combustion are usually spherical ash particles,
which may subsequently undergo other processes such as coalescence with other
particles or expansion due to internal gas release. The formation of molten ash droplets
marks the highest temperature, and a significant fraction of the volatile forms of
elements will exist in the gas phase. The main formation mechanism for coarse ash
particles (>2 micrometer) is carryover of a proportion of the mineral matter in the feed
coal. A portion of the incombustible material is retained in the furnace as bottom ash.
The rest of the inorganic material leaves in the flue gases as fly ash. Rapid cooling in
the post-combustion zone results in the formation of spherical, amorphous (non-
crystalline) particles (Clarke, 1993; Kutchko and Kim, 2006).
18
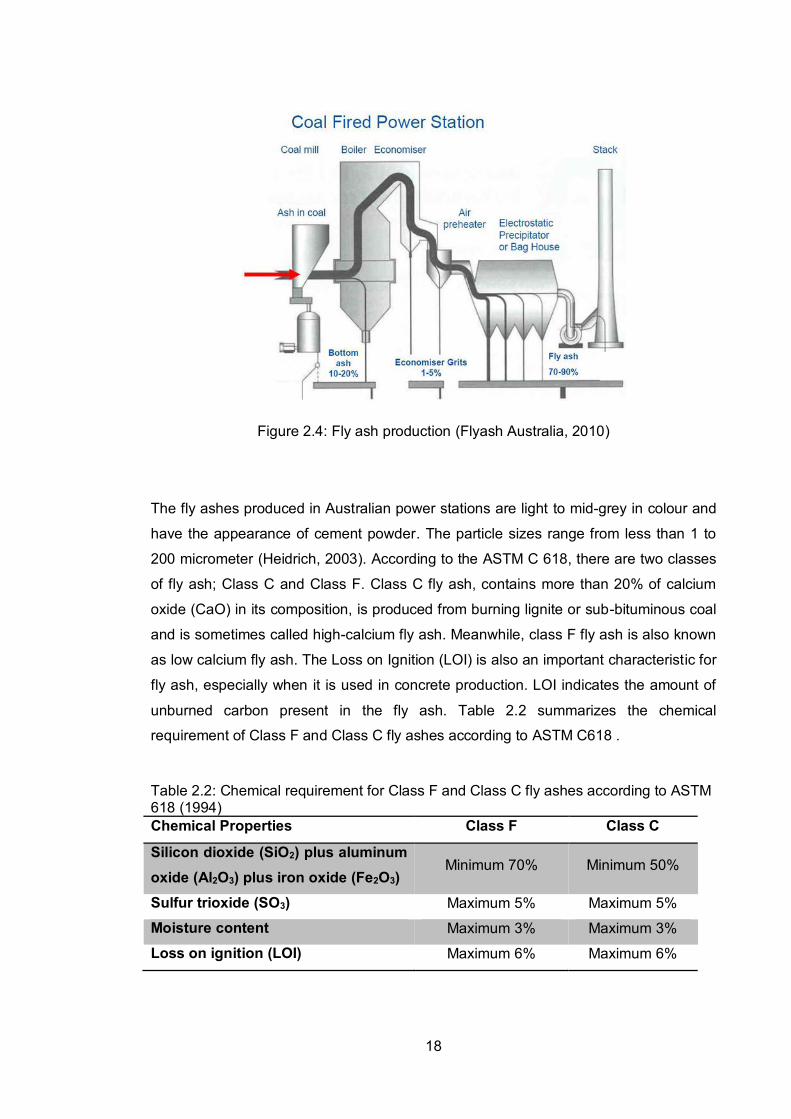
Figure 2.4: Fly ash production (Flyash Australia, 2010)
The fly ashes produced in Australian power stations are light to mid-grey in colour and
have the appearance of cement powder. The particle sizes range from less than 1 to
200 micrometer (Heidrich, 2003). According to the ASTM C 618, there are two classes
of fly ash; Class C and Class F. Class C fly ash, contains more than 20% of calcium
oxide (CaO) in its composition, is produced from burning lignite or sub-bituminous coal
and is sometimes called high-calcium fly ash. Meanwhile, class F fly ash is also known
as low calcium fly ash. The Loss on Ignition (LOI) is also an important characteristic for
fly ash, especially when it is used in concrete production. LOI indicates the amount of
unburned carbon present in the fly ash. Table 2.2 summarizes the chemical
requirement of Class F and Class C fly ashes according to ASTM C618 .
Table 2.2: Chemical requirement for Class F and Class C fly ashes according to ASTM 618 (1994) Chemical Properties Class F Class C
Silicon dioxide (SiO2) plus aluminum oxide (Al2O3) plus iron oxide (Fe2O3)
Minimum 70% Minimum 50%
Sulfur trioxide (SO3) Maximum 5% Maximum 5%
Moisture content Maximum 3% Maximum 3%
Loss on ignition (LOI) Maximum 6% Maximum 6%

19
The use of Class F pozzolan containing up to 12.0% loss on ignition may be approved
if either acceptable performance records or laboratory test results are made available.
The Loss on Ignition (LOI) is also an important characteristic for fly ash, especially
when it is used in concrete production. LOI indicates the amount of unburned carbon
present in the fly ash.
In terms of mineral composition, fly ash consists of a glassy matrix with noticeable
crystalline phases of quartz (SiO), magnesioferrite (MgFe2O4), hematite (Fe2O32),
anhydrite (CaSO), lime (CaO), and portlandite (Ca(OH)) (Hanjitsuwan et al., 2011).
In Australia, majority of fly ash produced is categorised as Class F mainly due to the
amount of silica and alumina range between 80 – 85%. Class F fly ash is pozzolanic
and reacts with various cementitous materials. Most of the fly ash being used to
enhance the properties of concrete (as admixture), OPC replacement as concrete
binder, road base binders and asphalt filler (Heidrich, 2003). Average chemical content
of 10 fly ashes in Australia is summarised in Table 2.3.
Most researches in Australia used fly ash from power plants in Western Australia and
Gladstone power plant in Queensland (Hardjito et al., 2004; Hardjito et al., 2005; Kong
and Sanjayan, 2008; Kong and Sanjayan, 2010; Pan et al., 2012; Giasuddin et al.,
2013; Deb et al., 2014; Nematollahi and Sanjayan, 2014)
Table 2.3: Average chemical content for fly ashes in Australia (Heidrich, 2003) Chemical Component Weight (%)
SiO2 61.1
Al2O3 26.2
Fe2O3 4.2
CaO 1.7
MgO 0.9
Na2O 0.8
K2O 1.1
SO3 0.2
Loss on Ignition (LOI) 2.6
In this research, there are fly ashes from Gladstone power plant and Tarong power
plant were initially used as geopolymer aluminosilicate source. Based on workability

20
test and further investigation on physical properties effect on workability, fly ash from
Gladstone power plant was used.
2.6 Alkaline activator
Basically, geopolymer can be produced by any strong alkali solution as the
alkaline activators (Rowles, 2004). Glukhovsky et al. (1980) classified alkaline activator
into six groups according to their chemical composition : (1) Caustic alkalis: MOH; (2)
Non-silicate weak acid salts: M2CO3, M2SO4, M3PO4, MF, etc; (3) Silicates: M2O·nSiO2
(4) Aluminates: M2O.nAl2O3; (5) Aluminosilicates M2O·Al2O3·(2-6)SiO2; and (6) Non-
silicate strong acid salts: M2SO4.
The type of alkaline solution plays an important role in the geopolymerisation process.
An investigation on three alkaline solutions are sodium hydroxide (NaOH), sodium
carbonate (Na2CO3) and sodium silicate solutions concludes that NaOH has the
highest compressive strength followed by sodium silicate solution and higher
concentration of Na2O corresponds to higher compressive strength (Fernández-
Jiménez et al., 2005).
Xu and Van Deventer (2000) reported that the ionic sizes of alkali-metal cation also
affect the dissolution rate when NaOH solution exhibits a higher dissolution rate with
aluminosilicate source materials as the smaller Na+ cation even though Na+ and K+
have the same electric charge. This is due to cation-anion pair interaction becoming
less significant as the cation size increases (Xu and Van Deventer, 2000).
Alkaline activator can be a single material such as sodium hydroxide, sodium silicate,
calcium hydroxide or combination of any silicate and hydroxide (Brough and Atkinson,
2002; Buchwald and Schulz, 2005).
NaOH is used because it is cheap, has low viscosity and is the most widely available
alkaline hydroxide. Also, the hydroxyl ion - in NaOH is an important element in starting
the geopolymerisation process (Provis and Van Deventer, 2009).

21
Sodium silicate (Na2SiO3) is a high viscosity chemical in liquid or powder form. It
influences the geopolymer mixture workability when a highly concentrated one is used
in liquid and a powder form. Na2SiO3 in the geopolymer system increase the final
strength of the paste and bind the material together to produce a dense paste (Jo et al.,
2007).
NaOH plus sodium silicate have been found to produce the fastest setting time and
promotes the collapse of both micropores and mesopores, thus increasing density and
strength (Jiang, 1997). The majority of research has found that activation with sodium
silicate or sodium silicate blended with NaOH has given the best strength (Pimraksa et
al., 2008; Adam et al., 2010; Guo et al., 2010; Nazari et al., 2011; Zhao and Sanjayan,
2011).
Therefore, this research used the combination of sodium silicate and sodium hydroxide
as alkaline activator.
2.7 Geopolymer workability
Workability is often referred as the ease with which a concrete can be
transported, placed and consolidated without any loss of stability or homogeneity. It is
greatly affected by the characteristics of the constituent materials of concrete (Leite et
al., 2013). The workability properties are measured for fresh concrete before it has set
and hardened.
High viscosity of sodium silicate and sodium hydroxide made geopolymer concrete less
workable compared to Portland cement concrete. Since geopolymer is based on
aluminosilicate reaction for producing gel and hardening, no free water were added into
fresh concrete and reduced the workability. Sathonsaowaphak et al. (2009) reported
that main factors affecting fresh geopolymer mortar workability were sodium
silicate/hydroxide ratio and sodium hydroxide concentration. The increase of both
sodium silicate/hydroxide ratio and sodium hydroxide concentration resulted in less
workable mortar mixes due to higher viscosity of sodium silicate and sodium hydroxide.
The setting time of geopolymer paste was found out to increase proportionally with the
increasing of sodium hydroxide concentration because of hardening and setting of the
paste is governed by geopolymerisation process. The geopolymerisation process

22
which usually occurred in a slower rate as compared with C-S-H and C-A-H dependent
cementitious system (Hanjitsuwan et al., 2014).
Even though there are a lot of commercial superplasticizers in the market that are
suitable that can be used in Portland cement concrete to improve the workability, only
polycarboxylate (PC) based superplasticizers were effective in increasing the
workability. This is due to its ether chain in its structure which resulted in steric
repulsion (Nematollahi and Sanjayan, 2014).
Most of researches on geopolymer workability focus on chemical reaction of alumina
and silica in which the basic of geopolymerisation process. However, there is still no
firm conclusion on the ratios of silicate/hydroxide, liquid/fly ash, the amount of water or
the concentration on hydroxide needed to obtained high workability. In this research,
the focus on factors affecting fly ash workability based on physical properties of fly ash
particle such as particle sizes, particle distribution, pore volume etc.
2.8 Geopolymer compressive strength
Compressive strength is the one of most important concrete property from
structural engineering point of view. In geopolymer concrete, there are several factors
affecting its compressive strength. Sukmak et al. (2013) studied the effect of sodium
silicate/sodium hydroxide and alkaline activator solution/fly ash ratios on compressive
strength of geopolymer bricks. With curing regime of 75oC for 48 hours, results showed
that optimum values for sodium silicate/sodium hydroxide and alkaline activator
solution/fly ash ratios are 0.7 and 0.6 respectively.
Ryu et al. (2013) studied on hydroxide concentration, hydroxide/silicate and curing
method and curing period influences on compressive strength of geopolymer mortar.
The results show that the combination of highest concentration of NaOH which is 9 M,
hydroxide/silicate ratio of 1 and 60oC for 24 hours curing regime provides the highest
compressive strength of geopolymer mortar. Further investigation on pore size of
geopolymer paste at 28 days indicates that the number of small pores increases with
higher molarity of the alkaline activator. The reduction of the porosity accompanying
the lowering strength observed in fly ash-based geopolymer can be explained by the
geopolymerisation process, which is the hardening mechanism of geopolymer based
on coal ash rich in Al and Si components.

23
Pimraksa et al. (2011) reported that concentration on NaOH and KOH as alkaline
activator directly influence the strength of geopolymer. Higher concentration on alkaline
activator molarity in which represents higher Na2O/Al2O3 and Na2O/SiO2 ratios
promoted the strength enhancement. The strengths increased with the increases in
curing temperature and time. Optimum curing regime suggested is 75oC for 5 days.
There was a significant increase in strength between Na2O/SiO2 ratio 0.75 and 1.0 but
strength increment was reduced when the ratio reached 1.25. The increase in strength
observed is attributed to an increase in the dissolution process, thus resulting in a
higher reaction rate and in fewer unreacted FA particles (Law et al., 2014).
Gorhan and Kurklu (2014) investigated the influence of sodium hydroxide (NaOH)
solution concentration, curing time and temperature on geopolymer mortars. NaOH
concentrations of 3, 6 and 9 M were used throughout the laboratory work. Based on
compressive strength results, NaOH concentration of 6 M with 85oC curing temperature
and 2 – 5 hours curing time produced the best compressive strength for geopolymer
mortars.
Ahmari and Zhang (2012) studied the feasibility of utilizing copper mine tailings for
production of eco-friendly bricks based on the geopolymerisation technology found out
that geopolymer bricks made from NaOH concentration of 15 M compressive strength
is higher than geopolymer bricks made from 10 M NaOH. The authors also reported
compressive strength increase for brick with higher NaOH/mining tailings ratio. This is
due to higher Na/Al and Na/Si ratio for those bricks which produced much thicker
geopolymer binder gels and bind the unreacted particles.
While many research papers reported on compressive strength increment with higher
hydroxide concentration particularly NaOH, research done by He et al. (2013) shows a
total contrast in compressive strength development. Several reasons such as Si and Al
ions leaching disruption due to high viscosity of NaOH and premature precipitation of
geopolymeric gels because of excessive OH- concentration are postulated for the

24
decrease of geopolymer composites compressive strength in higher NaOH
concentration.
Apart from hydroxide concentration effect on compressive strength of geopolymers,
ratio of silicate to hydroxide influence was investigated by some researches. Ridtirud et
al. (2011) reported that geopolymer mortars with sodium silicate/sodium hydroxide
ratio of 1.5 provide the highest compressive strength (45 MPa) compared to mortars
made with lower sodium silicate/sodium hydroxide ratios. The increasing trend is
mainly attributed to the increasing Na content in the mixture where Na+ ion plays a
critical role in the formation of geopolymer by acting as a charge balancing ions.
However, the authors also reported that the compressive strength of mortars with ratio
of sodium silicate/sodium hydroxide of 3 decreased as excess sodium silicate
hampered the evaporation of water and also disrupt the formation of three dimensional
networks of aluminosilicate geopolymers.
Some other researches highlighted the need of proper adjustment of silicate/hydroxide
ratio to improve the compressive strength of geopolymer concrete/mortar/brick
(Sathonsaowaphak et al., 2009; Guo et al., 2010; Nazari et al., 2011).
Kromjlenovic et al., (2010) concluded that the physical characteristic of fly ash, the
fineness, or particle size distribution was the key parameter in compressive strength of
geopolymer mortar. The compressive strength of geopolymers predominantly
depended on the content of FA fine particles (smaller than 43 um). In all cases, the
highest mortar compressive strength showed the FA which had the highest amount of
fine particles.
In this research, further investigation on various silicate/hydroxide ratios, liquid/fly ash
ratio, hydroxide concentration and fly ash source was carried out in order to achieve
high strength geopolymer concrete more than 50 MPa. This is because most of
literatures reported compressive strength of geopolymer concrete is less than 50 MPa.
The high strength classification of geopolymer concrete is based on high strength of
Portland cement concrete classification in accordance to IS EN 206 (European
Standard, 2013).

25
2.9 Geopolymer under Environmental Exposure
Concrete structures were designed to be able to withstand aggressive
environmental exposure. Fly ash-based geopolymer concrete is better than Portland
cement concrete in many aspects such as compressive strength, exposure to
aggressive environment, workability and exposure to high temperature (Al Bakri et al.,
2011). Giasuddin et al. (2013) discovered that geopolymer binder has the potential to
replace traditional oil well cements in CO2 geo-sequestration in saline aquifier. Results
show that the saline water cured geopolymer exhibited higher compressive strength
compared to normal water cured geopolymer.
Main phases of blended ash geopolymer concrete such as sodalite, gmelite and
natrolite were still intact even after 18 months of acid sulphuric exposure. This is due to
no ettringite detected as the Al ions participated in the formation of N-A-S-H gels, thus
making the available Al ions insufficient to form ettringite as in Portland cement binder
system (Ariffin et al., 2013).
There are compressive strength losses ranging from 53.3% to 78.4% when geopolymer
bricks are exposed to nitric acid (pH 4). The losses are caused by incomplete
geopolymerisation, modification of chemical composition of geopolymer gels and high
degree of unreacted alkali specimen (Ahmari and Zhang, 2013).
Other than acidic exposure, water (wetting and drying cycles) can introduce
deterioration problems in geopolymer. Unlike OPC, geopolymer reaction in producing
aluminosilicate gel and geopolymerisation hardening process do not involve any
hydration process. Therefore, water play no roles in hardened geopolymer structure
(Davidovits, 1989). Further investigation on strength reduction due to saturation
process was carried out in this research.

26
2.10 Geopolymer fire test
As mentioned in Section 2.2, geopolymer concrete has better fire resistance
compared with Portland cement concrete due to its ceramic-like properties (Davidovits,
1991). Cheng and Chiu (2003) investigated the fire resistance of geopolymer panel
with potassium hydroxide as alkaline activator and granulated blast furnace slag as
filler. Fire resistance test were conducted by exposing 10 mm thick geopolymer panel
to 1100oC flame, and measured the reverse-side temperatures. From the test,
geopolymer panel reverse side temperature is less than 350oC after 35 minutes fire
exposure.
Bakharev (2006) observed the thermal stability of the geopolymer materials prepared
with sodium containing activators was rather low and significant changes in the
microstructure occurred during curing process. However, geopolymer concrete
prepared using Gladstone fly ash and silicate-containing activator had better strength
than geopolymers prepared using potassium-containing activators. However, after fire
test (1000oC), geopolymer with sodium-silicate activator recorded high strength loss
while potassium-silicate activator had improved strength. This is mainly due to
presence of significant amount of crystalline phases after firing at 800°C.
Kong and Sanjayan (2008) investigated damage behaviour of geopolymer composite
exposed to elevated temperature. After 800oC temperature exposure, geopolymer gain
53% strength while geopolymer/aggregate composite strength decrease by 63%. This
is because the thermal incompatibility between geoppolymer binder and aggregate and
it is proved by dilametry measurement of geopolymer and aggregate (Kong and
Sanjayan, 2010).
The strength losses of geopolymer mortar decrease with increasing ductility, even
there are gain of strength in geopolymer with high levels of ductility. This correlation is
attributed to the fact that mortars with high ductility have high capacity to accommodate
thermal incompatibilities. It is believed that the two opposing processes occur in
mortars: (1) further geopolymerisation and/or sintering at elevated temperatures
leading to strength gain; (2) the damage to the mortar because of thermal

27
incompatibility arising from non-uniform temperature distribution. The strength gain or
loss occurs depending on the dominant process (Pan et al., 2009) .
Different pore structures of geopolymer concrete and Portland cement concrete
attributes to situation where no spalling was found in geopolymer concretes, whereas
the companion Portland cement concrete exhibited spalling. The sorptivity test found
that geopolymer concrete had a significantly higher sorption, therefore more connected
pores, than Portland cement concrete when compared at the same strength level
(Zhao and Sanjayan, 2011).
As mentioned in Section 2.1, testing large specimen in fire is essential in order to
enhance the knowledge of geopolymer concrete behaviour and thermal properties. It
provides a better representation of the actual condition. In addition, high strength of
geopolymer concrete and hydrocarbon fire exposure used in this research resulted
discovering the maximum potential of geopolymer concrete as fire resisting
construction material.
As reported by Kong and Sanjayan (2010) one of the main deterioration mechanisms in
fire is the thermal incompatibility between the geopolymer paste and aggregate. To
overcome this issue, concrete without aggregates was tested in this research. Aerated
geopolymer wall panels without coarse aggregates were fire tested and observations
were made.

28
References
Adam, A., Molyneaux, T., Patnaikuni, I. and Law, D. (2010). "Strength, sorptivity and
carbonation of geopolymer concrete." Challenges, Opportunities and Solutions
in Structural Engineering and Construction: 563-568.
Ahmari, S. and Zhang, L. (2012). "Production of eco-friendly bricks from copper mine
tailings through geopolymerization." Construction and building materials 29:
323-331.
Ahmari, S. and Zhang, L. (2013). "Durability and leaching behavior of mine tailings-
based geopolymer bricks." Construction and Building Materials 44: 743-750.
Al Bakri, M. M., Mohammed, H., Kamarudin, H., Niza, I. K. and Zarina, Y. (2011).
"Review on fly ash-based geopolymer concrete without Portland Cement."
Journal of engineering and technology research 3(1): 1-4.
Ali, F., O'Connor, D. and Abu-Tair, A. (2001). "Explosive spalling of high-strength
concrete columns in fire." Magazine of Concrete Research 53(3): 197-204.
Ariffin, M., Bhutta, M., Hussin, M., Mohd Tahir, M. and Aziah, N. (2013). "Sulfuric acid
resistance of blended ash geopolymer concrete." Construction and Building
Materials 43: 80-86.
Arioz, O. (2007). "Effects of elevated temperatures on properties of concrete." Fire
Safety Journal 42(8): 516-522.
ASTM (1994). ASTM C618: Standard Specification for Fly Ash and Raw or Calcined
Natural Pozzolan For Use as Mineral Admixture in Portland Cement Concrete.
West Conshohocken, Pennsylvania, American Society for Testing and
Materials. ASTM C618-92a.
Bakharev, T. (2006). "Thermal behaviour of geopolymers prepared using class F fly
ash and elevated temperature curing." Cement and Concrete Research 36(6):
1134-1147.
Bakharev, T. and Patnaikuni, I. (1997). Microstructure and durability of alkali activated
cementitious pastes. Proceedings of the fifth international conference on
structural failure, durability and retrofitting. Singapore Concrete Institute,
Singapore.

29
Bakharev, T., Sanjayan, J. G. and Cheng, Y. B. (2003). "Resistance of alkali activated
slag concrete to acid attack." Cement and Concrete Research 33(10): 1607-
1611.
Bakharev, T., Sanjayan, J. G. and Y.B.Cheng (2002). "Sulphate Attack on Alkali
Activated Slag Concrete”, Cement and Concrete Research." Cement and
Concrete Research 32(2): 211-216.
Bazant, Z. P. (1997). Analysis of pore pressure, thermal stress and fracture in rapidly
heated concrete. Proc., Int. Workshop on Fire Performance of High-Strength
Concrete.
Brough, A. R. and Atkinson, A. (2002). "Sodium silicate-based, alkali-activated slag
mortars: Part I. Strength, hydration and microstructure." Cement and Concrete
Research 32(6): 865-879.
BSI (2005). BS EN 1991-1-2: Actions on Structures. Part 1 -2: General Actions -
Actions on structures exposed to fire. Brussels, European Committee for
Standardization.
Buchwald, A. and Schulz, M. (2005). "Alkali-activated binders by use of industrial by-
products." Cement and Concrete Research 35(5): 968-973.
Cement Australia (2011). Sustainable Development – Fly ash.
Chan, S. Y. N., Peng, G.-F. and Anson, M. (1999). "Fire behavior of high-performance
concrete made with silica fume at various moisture contents." ACI Materials
Journal 96(3).
Cheng, T. W. and Chiu, J. P. (2003). "Fire-resistant geopolymer produced by
granulated blast furnace slag." Minerals Engineering 16(3): 205-210.
Clarke, L. B. (1993). "The fate of trace elements during coal combustion and
gasification: an overview." Fuel 72(6): 731-736.
Collins, F. and Sanjayan, J. G. (1998). "Early Age Strength and Workability of Slag
Pastes activated by NaOH and Na2CO3." Cement and Concrete Research
28(5): 655-664.
Collins, F. and Sanjayan, J. G. (2002). The challenge of the cement industry towards
the reduction of greenhouse emissions. IABSE Symposium Report.

30
Copier, W. (1983). "The spalling of normal weight and lightweight concrete exposed to
fire." ACI Special Publication 80.
Crozier, D. A. and Sanjayan, J. G. (2000). "Tests of load-bearing slender reinforced
concrete walls in fire." ACI Structural Journal 97(2): 243-251.
Davidovits, J. (1989). "Geopolymers and geopolymeric materials." Journal of Thermal
Analysis 35(2): 429-441.
Davidovits, J. (1991). "Geopolymers - Inorganic polymeric new materials." Journal of
Thermal Analysis 37(8): 1633-1656.
Davidovits, J. (2002). 30 years of successes and failures in geopolymer applications.
Market trends and potential breakthroughs. Keynote Conference on
Geopolymer Conference.
Davidovits, J. and Davidovics, M. (1991). Geopolymer. Ultra-high temperature tooling
material for the manufacture of advanced composites. International SAMPE
Symposium and Exhibition (Proceedings).
Deb, P. S., Nath, P. and Sarker, P. K. (2014). "The effects of ground granulated blast-
furnace slag blending with fly ash and activator content on the workability and
strength properties of geopolymer concrete cured at ambient temperature."
Materials & Design 62(0): 32-39.
Duxson, P., Fernández-Jiménez, A., Provis, J. L., Lukey, G. C., Palomo, A. and Van
Deventer, J. S. J. (2007). "Geopolymer technology: The current state of the art."
Journal of Materials Science 42(9): 2917-2933.
European Standard (2013). IS EN 206:2013 Concrete - Specification, performance,
production, and conformity. Brussel, Belgium, European Committee for
Standardization
Fernández-Jiménez, A., Palomo, A. and Criado, M. (2005). "Microstructure
development of alkali-activated fly ash cement: a descriptive model." Cement
and Concrete Research 35(6): 1204-1209.
Flower, D. J. M. and Sanjayan, J. G. (2007). "Green house gas emissions due to
concrete manufacture." International Journal of Life Cycle Assessment 12(5):
282-288.

31
Flyash Australia (2010). "http://www.flyashaustralia.com.au/whatisflyash.aspx.
http://www.flyashaustralia.com.au/whatisflyash.aspx (22/10/2014).
Giasuddin, H. M., Sanjayan, J. G. and Ranjith, P. (2013). "Strength of geopolymer
cured in saline water in ambient conditions." Fuel 107: 34-39.
Glukhovsky, V. (1959). "Soil silicates." Gostroiizdat Publish. Kiev, USSR.
Glukhovsky, V., Rostovskaja, G. and Rumyna, G. (1980). High strength slag-alkaline
cements. Proceedings of the 7th international congress on the chemistry of
cement, Paris.
Görhan, G. and Kürklü, G. (2014). "The influence of the NaOH solution on the
properties of the fly ash-based geopolymer mortar cured at different
temperatures." Composites Part B: Engineering 58: 371-377.
Guo, X., Shi, H. and Dick, W. A. (2010). "Compressive strength and microstructural
characteristics of class C fly ash geopolymer." Cement and Concrete
Composites 32(2): 142-147.
Hanjitsuwan, S., Chindaprasirt, P. and Pimraksa, K. (2011). "Electrical conductivity and
dielectric property of fly ash geopolymer pastes." International Journal of
Minerals, Metallurgy, and Materials 18(1): 94-99.
Hanjitsuwan, S., Hunpratub, S., Thongbai, P., Maensiri, S., Sata, V. and Chindaprasirt,
P. (2014). "Effects of NaOH concentrations on physical and electrical properties
of high calcium fly ash geopolymer paste." Cement and Concrete Composites
45: 9-14.
Hardjito, D., Sumajouw, D. M., Wallah, S. and Rangan, B. (2005). "Fly ash-based
geopolymer concrete." Australian Journal of Structural Engineering 6(1): 77.
Hardjito, D., Wallah, S. E., Sumajouw, D. M. J. and Rangan, B. V. (2004). "On the
development of fly ash-based geopolymer concrete." ACI Materials Journal
101(6): 467-472.
He, J., Jie, Y., Zhang, J., Yu, Y. and Zhang, G. (2013). "Synthesis and characterization
of red mud and rice husk ash-based geopolymer composites." Cement and
Concrete Composites 37: 108-118.

32
Heidrich, C. (2003). Ash Utilisation-An Australian Perspective. Proceedings of the 2003
international ash utilization symposium, Centre for Applied Energy Research,
University of Kentucky.
Hernández-Olivares, F. and Barluenga, G. (2004). "Fire performance of recycled
rubber-filled high-strength concrete." Cement and Concrete Research 34(1):
109-117.
Hertz, K. D. (2003). "Limits of spalling of fire-exposed concrete." Fire Safety Journal
38(2): 103-116.
International Standard, O. (1999). ISO 834-1999: Fire Resistance Tests: Elements of
building construction. Part 1: General Requirements. Geneva, Switzerland,
International Organization for Standardization. ISO 834-1999.
Jiang, W. (1997). Alkali-activated cementitious materials: Mechanisms, microstructure
and properties. 9817499. Ann Arbor.
Jo, B.-W., Park, S.-K. and Park, M.-S. (2007) "Strength and hardening characteristics
of activated fly ash mortars." Magazine of Concrete Research 59.
Kodur, V. (2000). Spalling in high strength concrete exposed to fire—concerns, causes,
critical parameters and cures. Proceedings, ASCE Structures Congress,
Philadelphia, PA.
Komljenović, M., Baščarević, Z. and Bradić, V. (2010). "Mechanical and microstructural
properties of alkali-activated fly ash geopolymers." Journal of hazardous
materials 181(1): 35-42.
Kong, D. L., Sanjayan, J. G. and Sagoe-Crentsil, K. (2008). "Factors affecting the
performance of metakaolin geopolymers exposed to elevated temperatures."
Journal of Materials Science 43(3): 824-831.
Kong, D. L. Y. and Sanjayan, J. G. (2008). "Damage behavior of geopolymer
composites exposed to elevated temperatures." Cement and Concrete
Composites 30(10): 986-991.
Kong, D. L. Y. and Sanjayan, J. G. (2010). "Effect of elevated temperatures on
geopolymer paste, mortar and concrete." Cement and Concrete Research
40(2): 334-339.

33
Kutchko, B. G. and Kim, A. G. (2006). "Fly ash characterization by SEM–EDS." Fuel
85(17–18): 2537-2544.
Law, D., Adam, A., Molyneaux, T., Patnaikuni, I. and Wardhono, A. (2014). "Long term
durability properties of class F fly ash geopolymer concrete." Materials and
Structures: 1-11.
Leite, M., Figueire do Filho, J. and Lima, P. (2013). "Workability study of concretes
made with recycled mortar aggregate." Materials and Structures 46(10): 1765-
1778.
Li, C., Sun, H. and Li, L. (2010). "A review: The comparison between alkali-activated
slag (Si+ Ca) and metakaolin (Si+ Al) cements." Cement and Concrete
Research 40(9): 1341-1349.
Lyon, R. E., Balaguru, P., Foden, A., Sorathia, U., Davidovits, J. and Davidovics, M.
(1997). "Fire-resistant aluminosilicate composites." Fire and Materials 21(2): 67-
73.
Nazari, A., Bagheri, A. and Riahi, S. (2011). "Properties of geopolymer with seeded fly
ash and rice husk bark ash." Materials Science and Engineering: A 528(24):
7395-7401.
Nechnech, W., Meftah, F. and Reynouard, J. M. (2002). "An elasto-plastic damage
model for plain concrete subjected to high temperatures." Engineering
Structures 24(5): 597-611.
Nematollahi, B. and Sanjayan, J. (2014). "Effect of different superplasticizers and
activator combinations on workability and strength of fly ash based
geopolymer." Materials & Design 57: 667-672.
Noumowe, A., Carré, H., Daoud, A. and Toutanji, H. (2006). "High-strength self-
compacting concrete exposed to fire test." Journal of materials in civil
engineering 18(6): 754-758.
Noumowe, A. N., Siddique, R. and Debicki, G. (2009). "Permeability of high-
performance concrete subjected to elevated temperature (600 °C)."
Construction and Building Materials 23(5): 1855-1861.
34
Oss, H. G. v. (2011). "Cement Statistics and Information.
http://minerals.usgs.gov/minerals/pubs/commodity/cement/ (21 October 2014).
Palomo, A., Grutzeck, M. W. and Blanco, M. T. (1999). "Alkali-activated fly ashes: A
cement for the future." Cement and Concrete Research 29(8): 1323-1329.
Pan, Z. and Sanjayan, J. G. (2010). "Stress-strain behaviour and abrupt loss of
stiffness of geopolymer at elevated temperatures." Cement and Concrete
Composites 32(9): 657-664.
Pan, Z., Sanjayan, J. G. and Kong, D. L. Y. (2012). "Effect of aggregate size on
spalling of geopolymer and Portland cement concretes subjected to elevated
temperatures." Construction & Building Materials 36: 365-372.
Pan, Z., Sanjayan, J. G. and Rangan, B. V. (2009). "An investigation of the
mechanisms for strength gain or loss of geopolymer mortar after exposure to
elevated temperature." Journal of Materials Science 44(7): 1873-1880.
Pan, Z., Sanjayan, J. G. and Rangan, B. V. (2011). Fracture Properties of geopolymer
paste and concrete. Magazine of Concrete Research 63:(10): 763 – 771.
Pimraksa, K., Chareerat, T., Chindaprasirt, P., Mishima, N. and Hatanaka, S. (2008).
Composition and microstructure of fly ash geopolymer containing metakaolin.
Excellence in Concrete Construction through Innovation: Proceedings of the
conference held at the Kingston University, United Kingdom, 9-10 September
2008.
Pimraksa, K., Chindaprasirt, P., Rungchet, A., Sagoe-Crentsil, K. and Sato, T. (2011).
"Lightweight geopolymer made of highly porous siliceous materials with various
Na2O/Al2O3 and SiO2/Al2O3 ratios." Materials Science and Engineering: A
528(21): 6616-6623.
Provis, J. L. and Van Deventer, J. S. J. (2009). Geopolymers : structure, processing,
properties and industrial applications. J. L. Provis and J. S. J. Van Deventer.
Boca Raton, Fla. : CRC
Oxford : Woodhead, Boca Raton, Fla. : Oxford.
Rangan, B. V. (2008). "Fly ash-based geopolymer concrete." Your Building
Administrator 2.

35
Ridtirud, C., Chindaprasirt, P. and Pimraksa, K. (2011). "Factors affecting the shrinkage
of fly ash geopolymers." International Journal of Minerals, Metallurgy, and
Materials 18(1): 100-104.
Roh, J. S., Yang, S. S., Ryou, H. S., Yoon, M. O. and Jeong, Y. T. (2008). "An
experimental study on the effect of ventilation velocity on burning rate in tunnel
fires—heptane pool fire case." Building and Environment 43(7): 1225-1231.
Rowles, M. R. (2004). The structural nature of aluminosilicate inorganic polymers: a
macro to nanoscale study. Curtin University of Technology, Department of
Applied Physics.: 248.
Roy, D. M. (1999). "Alkali-activated cements Opportunities and challenges." Cement
and Concrete Research 29(2): 249-254.
Ryu, G. S., Lee, Y. B., Koh, K. T. and Chung, Y. S. (2013). "The mechanical properties
of fly ash-based geopolymer concrete with alkaline activators." Construction
and Building Materials 47(0): 409-418.
Sanjayan, G. and Stocks, L. J. (1993). "Spalling of high-strength silica fume concrete in
fire." ACI Materials Journal 90(2): 170-173.
Sathonsaowaphak, A., Chindaprasirt, P. and Pimraksa, K. (2009). "Workability and
strength of lignite bottom ash geopolymer mortar." Journal of Hazardous
Materials 168(1): 44-50.
Shorter, G. and Harmathy, T. (1961). "Discussion on the fire resistance of prestressed
concrete beams." Proceedings of the Institution of Civil Engineers 20(2): 313-
315.
Stabler, J. and Baker, G. (2000). "Fractional step methods for thermo-mechanical
damage analyses at transient elevated temperatures." International Journal for
Numerical Methods in Engineering 48(5): 761-785.
Stabler, J. and Baker, G. (2000). "On the form of free energy and specific heat in
coupled thermo-elasticity with isotropic damage." International Journal of Solids
and Structures 37(34): 4691-4713.
Sukmak, P., Horpibulsuk, S. and Shen, S.-L. (2013). "Strength development in clay–fly
ash geopolymer." Construction and Building Materials 40: 566-574.

36
Ulm, F. J., Acker, P. and Lévy, M. (1999). "The "Chunnel" fire. II: Analysis of concrete
damage." Journal of Engineering Mechanics 125(3): 283-289.
Ulm, F. J., Coussy, O. and Bažant, Z. P. (1999). "The "chunnel" fire. I: Chemoplastic
softening in rapidly heated concrete." Journal of Engineering Mechanics 125(3):
272-281.
Xu, H. and Van Deventer, J. S. J. (2000). "The geopolymerisation of alumino-silicate
minerals." International Journal of Mineral Processing 59(3): 247-266.
Zhao, R. and Sanjayan, J. (2011). "Geopolymer and Portland cement concretes in
simulated fire." Magazine of concrete research 63(3): 163-173.

37
CHAPTER 3
Hydrocarbon Fire testing of full size Portland Cement High
Strength Concrete Wall Panels
3.1 Introduction
Concrete structures were designed to withstand various types of environmental
conditions from mild conditions to very severe conditions. Fire represents one of the
most severe environmental conditions to which concrete structures may be subjected
to especially in close conduct structure like tunnel (Kim et al., 2010; Khaliq and Kodur,
2011).
Spalling is one of the major risk in concrete when exposed to fire especially high
strength concrete structures (Sanjayan and Stocks, 1993). However, spalling of the
concrete at the soffit of the slab exposed the bottom bar and the flexural capacity of the
slab was drastically reduced (Hertz, 2003; Heo et al., 2010). Several researchers have
indicated that the explosive spalling of concrete especially in high strength concrete
should be considered as a failure due to its high velocity of spalling debris (Phan and
Carino, 1998; Yang and Peng, 2011) as well as loss of concrete section. There are
number of reasons why concrete spall in fire. Vapour pressure is one of the reasons
underlined by number of researches. Vapour pressure in highly impermeable concrete

38
with low diffusivity such as in high strength concrete may exceed the tensile stress and
cause explosive spalling (Anderberg, 1997; Phan and Carino, 1998; Yang and Peng,
2011). Thermal stress at high temperature due to high thermal gradient and low
thermal diffusivity is an issue closely related to concrete spalling as well (Harmathy,
1993). Khalifa (2000) described thermo-mechanical is one of a contributing factor in
concrete spalling as well. Thermal dilation gradient due to difference thermal expansion
between cement paste and aggregate can also result in initial fracture and energy
release from the fracture subsequently causing spalled concrete in fire (Bazant and
Kazemi, 1990; Pan et al., 2010; Kanéma et al., 2011). The results in this chapter
represent the performance of high strength concrete exposed to hydrocarbon fire
exposure. The amount of spalling, temperature of wall panel at various depth, thermal
diffusivity and pore pressure corresponding to thermal diffusivity were reported in this
chapter.
3.2 Experimental Programme
3.2.1 Material
Granite and basalt aggregates were used as aggregates for the wall
specimens. The coarse aggregate sizes varied and were 7 mm, 14 mm and 20 mm. In
all concrete mixes, the water to binder ratio was fixed at 0.3. The binder included 25%
to 30% of slag by weight. Superplasticizers were introduced to increase the workability
with targeted slump of 150 mm. Design strength for all concrete mixes was 80 MPa. All
concrete were tested for compressive strength at the age of 28 days. Table 3.1 shows
concrete mixes details. All specimens were cast at a precasting yard (Hollowcore Pty
Ltd). Surface moisture content was measured before the fire test. All specimens were
reinforced with mild strength steel 6 mm diameter bar and 100 mm spacing mesh.
Reinforcement bars were located at the middle of the concrete wall panel thickness.
Figure 3.1 shows the reinforcement details for the panels.
R6-100 cc
100 mm200 mm
3.38 m Figure 3.1: Reinforcement details of concrete wall panel (top view)
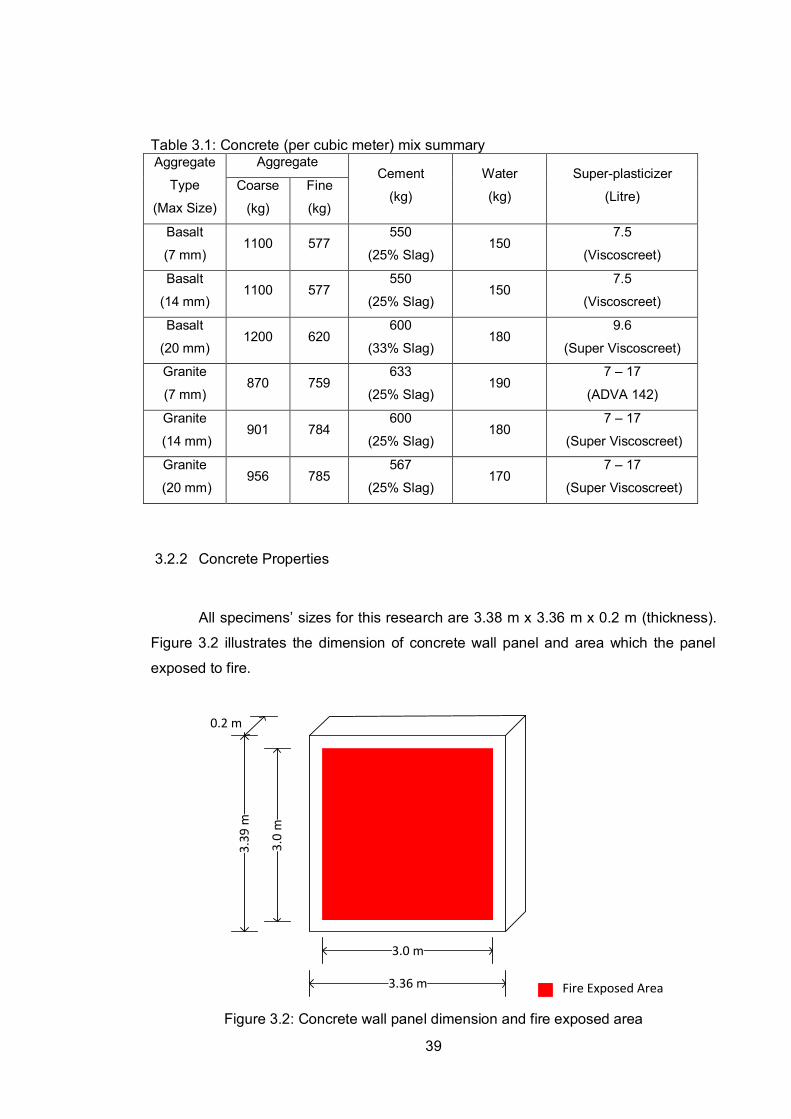
39
Table 3.1: Concrete (per cubic meter) mix summary Aggregate
Type
(Max Size)
Aggregate Cement
(kg)
Water
(kg)
Super-plasticizer
(Litre) Coarse
(kg)
Fine
(kg)
Basalt
(7 mm) 1100 577
550
(25% Slag) 150
7.5
(Viscoscreet)
Basalt
(14 mm) 1100 577
550
(25% Slag) 150
7.5
(Viscoscreet)
Basalt
(20 mm) 1200 620
600
(33% Slag) 180
9.6
(Super Viscoscreet)
Granite
(7 mm) 870 759
633
(25% Slag) 190
7 – 17
(ADVA 142)
Granite
(14 mm) 901 784
600
(25% Slag) 180
7 – 17
(Super Viscoscreet)
Granite
(20 mm) 956 785
567
(25% Slag) 170
7 – 17
(Super Viscoscreet)
3.2.2 Concrete Properties
All specimens’ sizes for this research are 3.38 m x 3.36 m x 0.2 m (thickness).
Figure 3.2 illustrates the dimension of concrete wall panel and area which the panel
exposed to fire.
3.36 m
3.0 m
3.3
9 m
3.0
m
Fire Exposed Area
0.2 m
Figure 3.2: Concrete wall panel dimension and fire exposed area

40
3.2.3 Test Setup
All specimens were cast at a precast factory and aged for at least at 28 days
before tests. Figure 3.3 shows the image of concrete casting at precasting yard
(Hollowcore Pty. Ltd.). Image of casted concrete wall panel is shown in Figure 3.4.
Compressive test were performed at the age of 28 days for all specimens. Fire tests
were carried out during the age between 44 days and 115 days for the investigation of
concrete age effect on spalling. Details of concrete casting and fire tests are
summarised in Table 3.2.
Figure 3.3: Casting of Ordinary Portland Cement High Strength Concrete
Figure 3.4: Casted Full-scale (3.36 m x 3.38 m) Portland Cement High Strength
Concrete

41
Table 3.2: Concrete Casting and Fire Test Details Aggregate Type
(Max. Size)
Casting Date
(dd/mm/yyyy)
Fire Test
Date
Age During Fire Test
(days)
Basalt
(7 mm) 3/8/2010 16/9/2010 44
Basalt
(14 mm) 5/8/2010 11/10/2010 67
Basalt
(20 mm) 20/7/2010 3/9/2010 67
Granite
(7 mm) 13/8/2010 8/11/2010 87
Granite
(14 mm) 12/8/2010 3/11/2010 83
Granite
(20 mm) 17/8/2010 10/12/10 115
3.2.4 Compressive strength and moisture content
Compressive strength test was carried out on 100 mm diameter x 200 mm
height concrete cylinder. The concrete cylinders were tested at the age of 28 days in
accordance to AS 1012.9-1999 (Standard Australia, 1999). Moisture content of
concrete wall panel was measured 1 hour before the fire test commenced. Moisture
content was measured by using TramexTM CME 4 moisture meter. Figure 3.5 shows
the moisture meter used to measure moisture content of concrete wall panel.

42
Figure 3.5: TramexTM CME 4 moisture meter
3.2.5 Thermal Data Collection
Although the standard fire in accordance to ISO 834:1999 (International
Standard, 1999) curve has been in use for many years, it soon became apparent that
the burning rates for certain materials e.g. fire in a tunnel, petrol gas and chemicals
were well in excess of the burning rate suggested in standard fire. As such, there was a
need for an alternative exposure for the purpose of carrying out tests on structures and
materials, thus the hydrocarbon curve was developed. The temperature for
hydrocarbon fire reaches up to 1000oC within 10 minutes as compared to 90 minutes
for standard fire. Figure 3.6 shows comparison of the hydrocarbon fire temperature
versus time curve and standard fire temperature versus time.
Figure 3.6: Hydrocarbon and Standard Fire Temperature versus Time Profile
Hydrocarbon fire temperature versus time in accordance to EN 1991-1-2 was the
temperature versus time curve used for exposing the specimens. Equation 3.1 is the
hydrocarbon fire temperature equation (BSI, 2005).
𝑇 = 1080(1 − 0.325𝑒−0.167𝑡 − 0.675𝑒−2.5𝑡) + 20 Equation 3.1
Where T = Temperature (oC)
t = Time (minutes)
0
400
800
1200
0 30 60 90 120 150 180
Tem
pera
ture
(o C)
Time (min)
Hydrocarbon and Standard Fire Temperature vs Time Curves
Hydrocarbon Fire (EN 1991-1-2)
Standard Fire (ISO 834-1999)
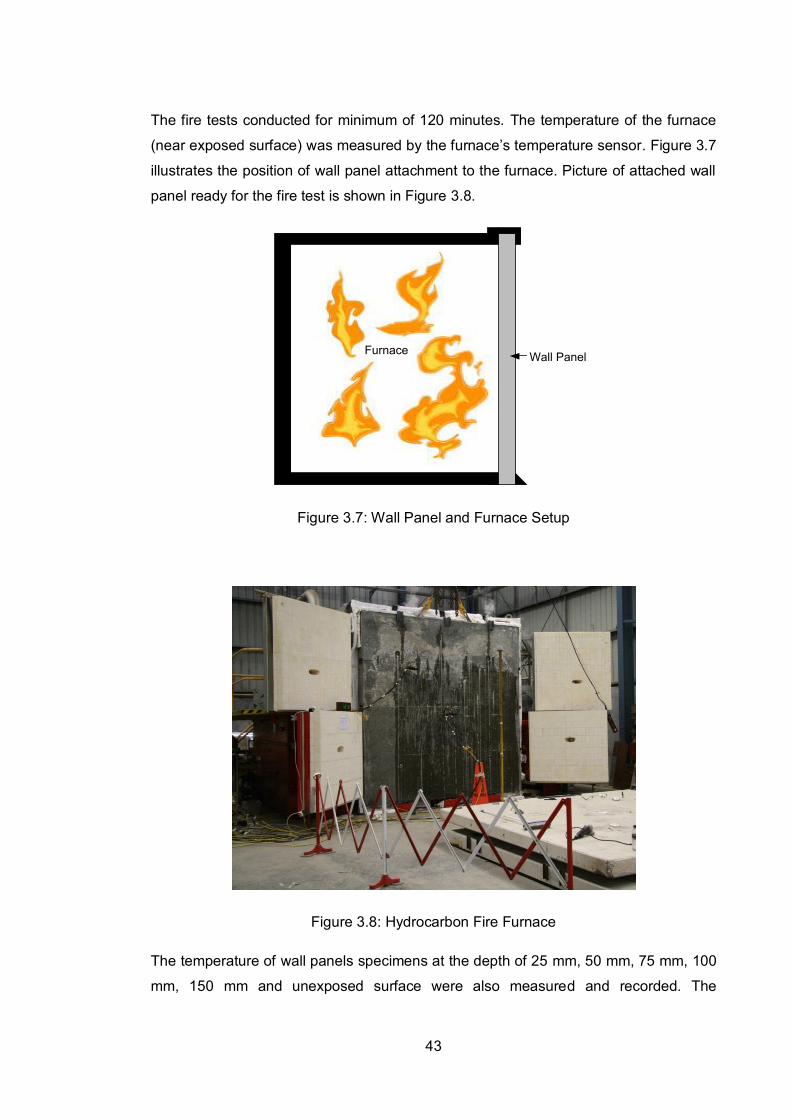
43
The fire tests conducted for minimum of 120 minutes. The temperature of the furnace
(near exposed surface) was measured by the furnace’s temperature sensor. Figure 3.7
illustrates the position of wall panel attachment to the furnace. Picture of attached wall
panel ready for the fire test is shown in Figure 3.8.
Furnace Wall Panel
Figure 3.7: Wall Panel and Furnace Setup
Figure 3.8: Hydrocarbon Fire Furnace
The temperature of wall panels specimens at the depth of 25 mm, 50 mm, 75 mm, 100
mm, 150 mm and unexposed surface were also measured and recorded. The

44
illustration of thermal couple’s locations and image of thermal couple set up are shown
in Figure 3.9 and Figure 3.10.
50 mm
25 mm
25 mm
25 mm
25 mm
200 mm
Thermal Couples
50 mmFire Exposed Surface
Figure 3.9: Illustration of Thermal Couple’s Location
Figure 3.10: Thermal Couple Set Up
3.2.6 Spalling analysis
The weight of the specimens was measured before and after the specimens
was exposed to fire. The weight difference is considered as the weight of spalled

45
concrete. The loss of concrete wall panel moisture content was also considered as part
of spalled concrete weight.
3.2.7 Thermal diffusivity analysis
Thermal diffusivity is a thermal conductivity divided by the volumetric heat
capacity measured in mm2/s. It is a material specific thermal property which describes
how quickly a material reacts to a change in temperature. It is also a measurement of
thermal inertia of solids. In order to predict cooling processes or to simulate
temperature fields, the thermal diffusivity values are essential. The higher thermal
diffusivity value will increase the heat propagation rate into the material and can be
classified as good heat conductor material. The ideal insulator materials with large heat
capacity will have a very low thermal diffusivity (Kaviany, 2011).
Thermal diffusivity for each specimen under fire test was calculated by using the Finite
Difference back calculation method at the depth of 50 mm measured from exposed
surface. Based on the temperature data from the fire test, thermal diffusivity value were
calculated on trial and error basis based on the general equation (Welty, 1974):
Equation 3.2
where K is thermal diffusivity
Central difference equation was used for second spatial derivative,
𝜕2𝑇
𝜕𝑥2 =𝑇𝑖+1
𝑛 −2𝑇𝑖𝑛+ 𝑇𝑖−1
𝑛
ℎ2 Equation 3.3
Where n = temperature at calculated time step
i = temperature at calculated thermal couple location (∆x = 50 mm)
h = total thickness for wall specimen
Forward equation was used for first time derivative,
tT
xT
12
2

46
𝜕𝑇
𝜕𝑡=
𝑇𝑖𝑛+1− 𝑇𝑖
𝑛
∆𝑡 Equation 3.4
where, ∆𝑡 = time interval
Therefore, the final equation for thermal diffusivity calculation was:
𝑇𝑖𝑛+1 = 𝐾∆𝑡 ⌊
𝑇𝑖+1𝑛 −2𝑇𝑖
𝑛+ 𝑇𝑖−1𝑛
ℎ2⌋ + 𝑇𝑖
𝑛 Equation 3.5
Trial value for thermal diffusivity, K substituted in Equation 3.5 and the correct value of
thermal diffusivity is determined when the temperature, 𝑇𝑖𝑛+1 calculated from thermal
diffusivity equation equates to the temperature from experimental data.
3.3 Result and Discussion
3.3.1 Compressive Strength and Moisture Content
Compressive strength of the concrete at the age of 28 days ranged between
69.4 MPa and 75.1 MPa. Therefore, the concrete can be classified as high strength
concrete. Average moisture content for concrete wall panels was 5%. Table 3.3
summarises the compressive strength of concrete and moisture content of wall panels.
Table 3.3: Compressive strength and moisture content summary
Aggregate Type
(Max Size)
Moisture Content
(%)
Compressive Strength at
28 days (MPa)
Basalt
(7 mm) 5.2 70.0
Basalt
(14 mm) 5.2 69.4
Basalt
(20 mm) 5.1 70.0
Granite
(7 mm) 4.8 70.7
Granite
(14 mm) 5.1 73.8
Granite
(20 mm) 4.8 75.1

47
3.3.2 Spalling
From the observation during fire exposure, concrete spalling occurred within the
first 30 minutes of fire exposure. The spalling happened in explosive manner. The
spalling of concrete weight was inclusive with the loss of moisture content from the fire
test. Specimen with 7 mm basalt aggregate exhibited the most severe spalling with
32.5% weight loss including 5.2% loss of moisture content. Figure 3.12 shows the
percentage of concrete spalling after the specimens were exposed to fire. Wall panels
with 14 mm and 20 mm basalt aggregates spalled 7.5% and 12.7% respectively.
Granite aggregate wall panels’ spalling percentages are 22.9%, 23.5 and 13.5% for 7
mm, 14 mm and 20 mm aggregate size respectively. From these results, it is an
indication that aggregate size is not exhibiting a clear trend to concrete spalling. It is
also observed that there is no clear trend between the amounts of spalling and the age
of concrete.
Figure 3.11: Specimen After Fire Test

48
Figure 3.12: Spalling Concrete Percentage
3.3.3 Temperature Result
The thermal analyses for this investigation were done by using the first 30
minutes thermal data obtained from the data logger due to the observation that no
concrete spalling was observed after 30 minutes of the test. All thermal data was
successfully recorded into the data logger except the thermal data for 20 mm granite
aggregates specimen. Unfortunately, the data gauges for the specimen with 20 mm
granite aggregates were damaged during the fire exposure and data logger could not
retrieve most of the data. Figures 3.13, 3.14, 3.15, 3.16 and 3.17 show that the
temperatures vs. time for the specimens at each depth during fire exposure.
Figure 3.13: Temperature for specimens with 7 mm basalt aggregates
0
10
20
30
40
7 mm 14 mm 20 mmSpal
ling
Con
cret
e (%
)
Aggregate Size
Basalt Aggregate
Granite Aggregate
0
200
400
600
800
1000
1200
0.00 10.00 20.00 30.00
Tem
par
atu
re (
oC
)
Time (Minutes)
Hydro Carbon FireTemp.Temp. at 0 mm
Temp. at 25 mm
Temp. at 50 mm
Temp. at 75 mm
Temp. at 100 mm
Temp. at 150 mm
Temp. at 200 mm
* Including 4.8% -
5.2% moisture
content loss.

49
Figure 3.14: Temperature for specimens with 14 mm basalt aggregates
Figure 3.15: Temperature for specimens with 20 mm basalt aggregates
0
200
400
600
800
1000
1200
0.00 10.00 20.00 30.00
Tem
par
atu
re (
oC
)
Time (Minutes)
Hydro Carbon FireTemp.Temp. at 0 mm
Temp. at 25 mm
Temp. at 50 mm
Temp. at 75 mm
Temp. at 100 mm
Temp. at 150 mm
0
200
400
600
800
1000
1200
0.00 10.00 20.00 30.00
Tem
par
atu
re (
oC
)
Time (Minutes)
Hydro Carbon FireTemp.Temp. at 0 mm
Temp. at 25 mm
Temp. at 50 mm
Temp. at 75 mm
Temp. at 100 mm
Temp. at 150 mm
Temp. at 200 mm

50
Figure 3.16: Temperature for specimens with 7 mm granite aggregates
Figure 3.17: Temperature for specimens with 14 mm granite aggregates
Figure 3.13 shows that temperature at 25 mm depth significantly increased after 10
minutes of fire exposure and identical with temperature at exposed surface. At this
stage, the concrete surrounding the thermal couple at 25 mm depth spalled and the
thermal couple is exposed directly to the fire.
Figures 3.18 – 3.22 show the temperature at every depth of the specimens for 10
minutes, 20 minutes and 30 minutes fire exposure. The graphs represent the
0
200
400
600
800
1000
1200
0.00 10.00 20.00 30.00
Tem
par
atu
re (
oC
)
Time (Minutes)
Hydro Carbon FireTemp.Temp. at 0 mm
Temp. at 25 mm
Temp. at 50 mm
Temp. at 75 mm
Temp. at 100 mm
Temp. at 150 mm
Temp. at 200 mm
0
200
400
600
800
1000
1200
0.00 10.00 20.00 30.00
Tem
par
atu
re (
oC
)
Time (Minutes)
Hydro Carbon FireTemp.Temp. at 0 mm
Temp. at 25 mm
Temp. at 50 mm
Temp. at 75 mm
Temp. at 100 mm
Temp. at 150 mm
Temp. at 200 mm

51
temperature gradient across the thickness of the specimen. Temperature gradient can
be related with thermal diffusivity of the specimen. Higher temperature gradient reflects
lower thermal diffusivity of the specimen. It proved that the spalling of high strength
concrete with low thermal diffusivity is due to high density of high strength concrete
itself (Sanjayan and Stocks, 1993; Phan and Carino, 1998; Khaliq and Kodur, 2011).
Figure 3.18: Temperature across the thickness of the specimens with 7 mm basalt
aggregates
Figure 3.19: Temperature across the thickness of the specimens with 14 mm basalt
aggregates
0
400
800
1200
0 50 100 150 200
Tem
per
atu
re (C
)
Distance From Exposed Surface (mm)
10 minute
20 minute
30 minute
0
400
800
1200
0 50 100 150 200
Tem
par
atu
re (o
C)
Distance from exposed surface (mm)
10 minute
20 minute
30 minute

52
Figure 3.20: Temperature across the thickness of the specimens with 20 mm basalt
aggregates
Figure 3.21: Temperature across the thickness of the specimens with 7 mm granite
aggregates
0
400
800
1200
0 50 100 150 200
Tem
per
atu
re (C
)
Distance From Exposed Surface (mm)
10 minute
20 minute
30 minute
0
400
800
1200
0 50 100 150 200
Tem
pe
ratu
re (C
)
Distance From Exposed Surface (mm)
10 minute
20 minute
30 minute
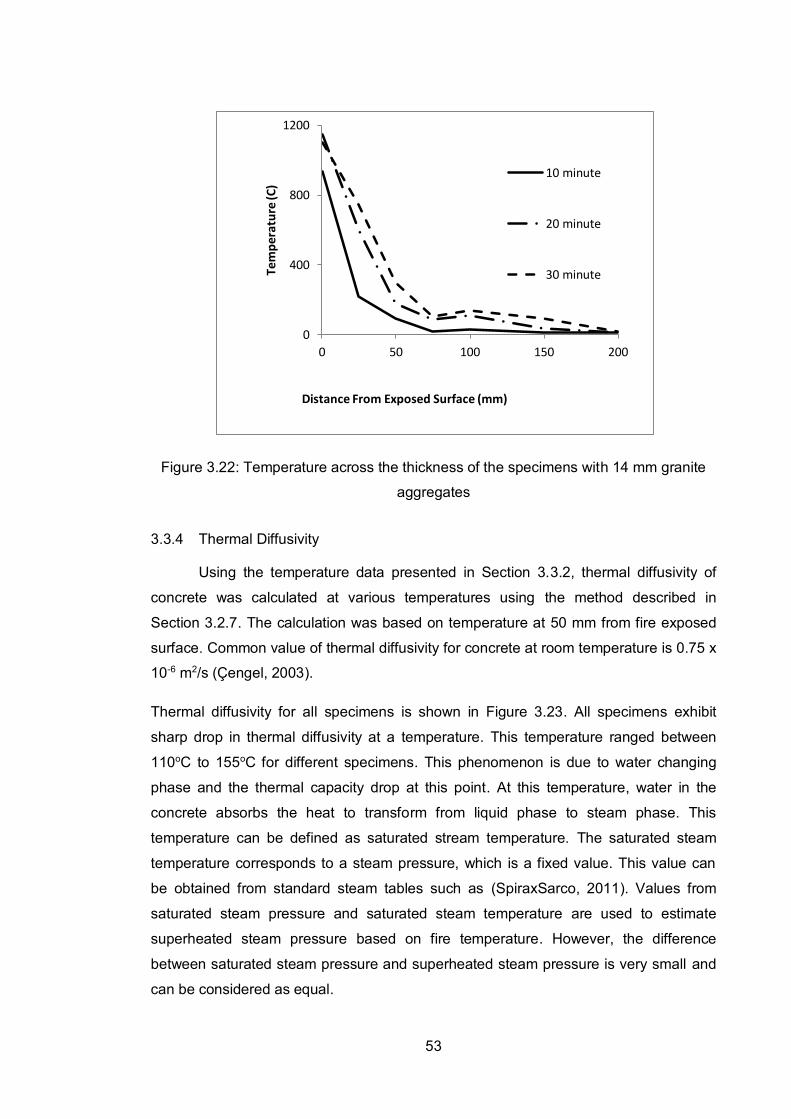
53
Figure 3.22: Temperature across the thickness of the specimens with 14 mm granite
aggregates
3.3.4 Thermal Diffusivity
Using the temperature data presented in Section 3.3.2, thermal diffusivity of
concrete was calculated at various temperatures using the method described in
Section 3.2.7. The calculation was based on temperature at 50 mm from fire exposed
surface. Common value of thermal diffusivity for concrete at room temperature is 0.75 x
10-6 m2/s (Çengel, 2003).
Thermal diffusivity for all specimens is shown in Figure 3.23. All specimens exhibit
sharp drop in thermal diffusivity at a temperature. This temperature ranged between
110oC to 155oC for different specimens. This phenomenon is due to water changing
phase and the thermal capacity drop at this point. At this temperature, water in the
concrete absorbs the heat to transform from liquid phase to steam phase. This
temperature can be defined as saturated stream temperature. The saturated steam
temperature corresponds to a steam pressure, which is a fixed value. This value can
be obtained from standard steam tables such as (SpiraxSarco, 2011). Values from
saturated steam pressure and saturated steam temperature are used to estimate
superheated steam pressure based on fire temperature. However, the difference
between saturated steam pressure and superheated steam pressure is very small and
can be considered as equal.
0
400
800
1200
0 50 100 150 200
Tem
pe
ratu
re (C
)
Distance From Exposed Surface (mm)
10 minute
20 minute
30 minute

54
Specimen with 14 mm granite aggregates saturated steam temperature is 110oC,
which is lowest saturated steam temperature. The saturated steam pressure
correspond to the temperature is 0.042 MPa. The saturated steam temperatures for
specimens with 14 mm granite aggregates, 7 mm basalt aggregates, 14 mm basalt
aggregates and 20 mm basalt aggregates are 113oC, 120oC, 130oC and 155oC
respectively. The highest saturated steam pressure that corresponds to the highest
saturated steam temperature (20 mm basalt aggregate) is 0.442 MPa. This is
significantly less than tensile strength (ft) of concrete, which is estimated to be about 3
MPa.
The tensile strength of concrete can be estimated using the Australian Standard,
AS3600 (Clause 3.113) formula (Standard Australia, 2009).
𝑓𝑡 = 0.6√𝑓𝑐 Equation 3.6
For 70 MPa compressive strength (fc) concrete, the tensile strength may be estimated
as 3.3 MPa. At temperatures ranging from 110 to 155 degrees Celcius the tensile
strength may decrease by no more than 10% which will bring down the tensile strength
to 3 MPa (Behnood and Ghandehari, 2009; Khaliq and Kodur, 2011; Kodur, 2014). This
strength is significantly larger than the steam pressure created by the saturated steam
pressure.
Figure 3.23: Thermal diffusivity vs Temperature
0.00
0.20
0.40
0.60
0.80
1.00
1.20
1.40
1.60
1.80
2.00
50 100 150 200 250 300
Dif
fusi
vity
(m
2/s
) x
10-6
Temperature (C)
7mm (Basalt)
14mm (Basalt)
20 mm (Basalt)
7mm (Granite)
14mm (Granite)

55
3.4 Conclusion
1 Full-scale high strength concrete wall panels spalled between 7.5% and 32.5%
when exposed to hydrocarbon fires. Concrete wall panels spalled explosively in
the first 30 minutes of fire exposure. There are no further concrete spalling
observed after this period.
2 Thermal diffusivity dropped sharply at temperatures which ranged from the
temperatures of 110oC and 155oC. This temperature can be described as phase
changing steam temperature. Heat was absorbed by water in the concrete to
change phases from liquid to steam.
3 Maximum saturated steam pressure induced by the steam corresponds to
maximum saturated steam temperature of 155°C is 0.442 MPa. This is
significantly less that tensile strength of concrete which is estimated to be 3
MPa. Hence, steam pressure itself is not a critical factor for concrete spalling.
However, it is suggested that combining steam pressure together with thermal-
mechanical mechanism such as expansion of aggregates and contraction of
cement paste may explain the spalling in fire.
56
References
Anderberg, D. Y. (1997). Spalling Phenomena of HPC and OC.L. T. Phan, N. J. Carino,
D. Duthinh and Garboczi. NIST Workshop on Fire Performance of High
Strength Concrete, Gaithersburg. 69-73.
Bazant, Z. P. and Kazemi, M. T. (1990). "Determination of fracture energy, process
zone longth and brittleness number from size effect, with application to rock and
conerete." International Journal of Fracture 44(2): 111-131.
Behnood, A. and Ghandehari, M. (2009). "Comparison of compressive and splitting
tensile strength of high-strength concrete with and without polypropylene fibers
heated to high temperatures." Fire Safety Journal 44(8): 1015-1022.
BSI (2005). BS EN 1991-1-2: Actions on Structures. Part 1 -2: General Actions -
Actions on structures exposed to fire. Brussels, European Committee for
Standardization.
Çengel, Y. A. (2003). Heat Transfer: A Practical Approach. McGraw-Hill Companies
Inc., New York, USA.
Harmathy, T. Z. (1993). Fire Safety Design and Concrete. F.K.Kong and R. H. E. CBE.
Concrete Design and Construction. Longman Scientific and Technical, Essex,
England.
Heo, Y. S., Sanjayan, J. G., Han, C. G. and Han, M. C. (2010). "Synergistic effect of
combined fibers for spalling protection of concrete in fire." Cement and
Concrete Research 40(10): 1547-1554.
Hertz, K. D. (2003). "Limits of spalling of fire-exposed concrete." Fire Safety Journal
38(2): 103-116.
International Standard, O. (1999). ISO 834-1999: Fire Resistance Tests: Elements of
building construction. Part 1: General Requirements. Geneva, Switzerland,
International Organization for Standardization. ISO 834-1999.
Kalifa, P., Menneteau, F.-D. and Quenard, D. (2000). "Spalling and pore pressure in
HPC at high temperatures." Cement and Concrete Research 30(12): 1915-
1927.

57
Kanéma, M., Pliya, P., Noumowé, A. and Gallias, J. L. (2011). "Spalling, Thermal, and
Hydrous Behavior of Ordinary and High-Strength Concrete Subjected to
Elevated Temperature." Journal of Materials in Civil Engineering 23(7): 921-
930.
Kaviany, M. (2011). Essential of Heat Transfer: Principals, Materials and Application.
Cambridge University Press, New York, USA.
Khaliq, W. and Kodur, V. K. R. (2011). "Effect of High Temperature on Tensile Strength
of Different Types of High-Strength Concrete." ACI Materials Journal 108(4):
394-402.
Kim, J. H. J., Mook Lim, Y., Won, J. P. and Park, H. G. (2010). "Fire resistant behavior
of newly developed bottom-ash-based cementitious coating applied concrete
tunnel lining under RABT fire loading." Construction and Building Materials
24(10): 1984-1994.
Kodur, V. (2014). "Properties of Concrete at Elevated Temperatures." ISRN Civil
Engineering 2014: 15.
Pan, Z., Sanjayan, J. G. and Rangan, B. V. (2010). Fracture Properties of geopolymer
paste and concrete. Magazine of Concrete Research 63:(1): 1-9.
Phan, L. T. and Carino, N. J. (1998). "Review of mechanical properties of HSC at
elevated temperature." Journal of Materials in Civil Engineering 10(1): 58-64.
Sanjayan, G. and Stocks, L. J. (1993). "Spalling of high-strength silica fume concrete in
fire." ACI Materials Journal 90(2): 170-173.
SpiraxSarco (2011). "Steam Tables. http://www.spiraxsarco.com/resources/steam-
tables.asp (19 September 2011).
Standard Australia, L. (1999). AS 1012.9: Methods of testing concrete. Method 9:
Determination of the compressive strength of concrete specimens. Sydney,
Australia, Sai Global Limited: 3.
Standard Australia, L. (2009). AS 3600-2009: Concrete Structures. Design Properties
of Materials. Sydney, Australia, SAI Global Limited. AS 3600-2009.
Welty, J. R. (1974). Engineering heat transfer. New York : Wiley, New York.

58
Yang, J. and Peng, G. F. (2011). The Mechanism of Explosive Spalling and Measures
to Resistant Spalling of Concrete Exposed to High Temperature by
Incorporating Fibers: a Review. L. J. Li. Advances in Building Materials, Pts 1-3.
Trans Tech Publications Ltd, Stafa-Zurich 168-170: 773-777.

59
CHAPTER 4
Specimen’s Size, Aggregate Size and Aggregate Type
Effect on Spalling of Concrete in Fire
4.1 Introduction
Spalling is one of the defects of concrete exposed to fire especially high
strength concrete structure and high strength concrete rather than normal strength
concrete is more prone to (Sanjayan and Stocks, 1993; Phan and Carino, 1998). Bailey
in 2002 categorized spalling into three categories; aggregate spalling, explosive
spalling and corner spalling in which he indicated that explosive spalling is the most
extremely violent and dangerous (Bailey, 2002). Number of factors affecting spalling of
high strength concrete have been reported which include moisture clog, vapour
pressure, pore pressure and thermal properties such as thermal stress mechanism,
thermal dilation and incompatibility between cement paste and aggregate (Anderberg,
1997; Kalifa et al., 2000; Yang and Peng, 2011; Pan et al., 2012).
Specimen size effect is one of the factors discussed in this chapter. Erdem (2014)
reported that the specimen size did not play an important role on the residual
mechanical properties of ECC when the specimens were heated up to 800oC although

60
the choice of specimen’s maximum size was limited by the size of the furnace . A slight
different focus on specimen size effect on mechanical properties did prove that
specimen’s size has significant effect on shear capacity and bearing capacity. The
tests results are in good agreement with Bazant’s size effect law (SEL) theory which
stated that strength decreases as the specimen size increase (Bazant and Sun, 1987;
Bažant, 2000; Ince and Arici, 2004).
Other than specimen size effect, aggregate size effect was also investigated in this
chapter. Similar study on aggregate size effect on spalling was carried out by Pan et.
al. (2012). This study shows aggregate size has a significant effect on spalling of
concrete especially when the maximum aggregate size is below 10 mm explosive
spalling was observed. Pan et al. (2012) explained the aggregate size effect on
spalling as due to higher fracture zone process for bigger aggregate size. On broader
scope, fracture zone process was reported as the main reason in many of the
aggregate size effects studies on mechanical performances such as compressive
strength, bending strength and shear strength investigations (Chen and Liu, 2004;
Meddah et al., 2010; Pan et al., 2010).
Apart from aggregate size, the effect of aggregate type was also investigated in this
chapter. Limited research has been done to investigate aggregate type effect on
spalling as a sole purpose but Chen et al. (2014) in their study on bonding behaviour
between basic oxygen furnace slag and asphalt binder reported that basalt and
aggregate and granite aggregate have similar properties and bonding behaviour. Kong
and Sanjayan (2008) reported thermal expansion for basalt aggregate and granite
aggregate does not differ much with linear expansion percentage in the range of 1.6%
to 1.8% at 700oC to 800oC temperature. This chapter mainly focused on the effect of
specimen’s size, aggregate size and aggregate type on spalling. Various sizes from
small cylinder (100 mm x 200 mm height) to large full scale wall panel (3.36 m x 3.38 m
x 0.2 m thickness) with different aggregate size and type were tested under
hydrocarbon fire to investigate the effect of specimen’s size, aggregate size and
aggregate type on spalling.
4.2 Experimental Programme
In all concrete mixes, the water to binder ratio was fixed at 0.3. The binder
included 25% to 30% of slag by weight. Superplasticizers were introduced to increase
the workability with targeted slump of 150 mm. Design strength for all concrete mixes

61
was 80 MPa. All concretes were tested for compressive strength at the age of 28 days
in accordance with AS 1012.9-1999 (Standard Australia, 1999). Table 4.1 shows
concrete mixes details.
Table 4.1: Concrete (per cubic meter) mix summary
Aggregate
Type
(Max Size)
Aggregate
Cement
(kg)
Water
(kg)
Super-
Plasticizer
(Liter)
Compressive
Strength at
28 days
(MPa)
Coarse
(kg)
Fine
(kg)
Basalt
(7 mm) 1100 577
550 (25% Slag)
150 7.5
(Viscoscreet) 70.0
Basalt
(14 mm) 1100 577
550 (25% Slag)
150 7.5
(Viscoscreet) 69.4
Basalt
(20 mm) 1200 620
600 (33% Slag)
180
9.6
(Super
Viscoscreet)
70.0
Granite
(7 mm) 870 759
633 (25% Slag)
190 7-17
(ADVA 142) 70.7
Granite
(14 mm) 901 784
600 (25% Slag)
180
7-17
(Super
Viscoscreet)
73.8
Granite
(20 mm) 956 785
567 (25% Slag)
170
7-17
(Super
Viscoscreet)
75.1
All specimens were cast at a precasting yard (Hollowcore Pty Ltd). Surface moisture
content was measured before the fire test.
4.2.1 Concrete Test Specimens
Specimen’s sizes were varied for specimen’s size effect. Basalt and granite
aggregate types were used for aggregate type effect investigation purposes. Maximum
aggregates sizes were varied from 7 mm, 14 mm and 20 mm to investigate the effect of
aggregate size on spalling. Specimen’s dimensions illustration and fire test detail were
summarized in Figure 4.1 and Table 4.2 respectively. Figure 4.2 shows image of
concrete casting at precasting yard.

62
3.38 m
3.36 m
0.2 m
(a) Large panel
1.075 m
1.075 m
0.2 m
(b) Medium Panel

63
400 mm
400 mm
1000 mm
(c) Column
100 mm
200 mm
(d) Cylinder
Figure 4.1: Specimens’ dimension
Figure 4.2: Casting of Ordinary Portland Cement High Strength Concrete

64
Table 4.2: Specimens’ fire test details
Specimen
Type/Dimension
Aggregate
Type
(Max. Size)
Ave.
Surface
Moisture
Content (%)
Casting Date
(dd/mm/yyyy)
Fire Test
Date
Age
During Fire
Test
(days)
Large Panel
Basalt
(7 mm) 5.2 3/8/2010 16/9/2010 44
Basalt
(14 mm) 5.2 5/8/2010 11/10/2010 67
Basalt
(20 mm) 5.1 20/7/2010 3/9/2010 67
Granite
(7 mm) 4.8 13/8/2010 8/11/2010 87
Granite
(14 mm) 5.1 12/8/2010 3/11/2010 83
Granite
(20 mm) 4.8 17/8/2010 10/12/10 115
Medium Panel
Basalt
(7 mm) 4.9 3/8/2010 1/5/2012 640
Basalt
(14 mm) 4.8 5/8/2010 1/5/2012 638
Basalt
(20 mm) 4.8 20/7/2010 10/4/2012 656
Granite
(7 mm) 4.9 13/8/2010 24/4/2012 630
Granite
(14 mm) 4.9 12/8/2010 10/4/2012 631
Granite
(20 mm) 4.9 17/8/2010 24/4/2012 626
Column All specimens
NA
Between
20/7/2010 to
17/8/2010
7/12/2010
Between
112 - 140
days
Cylinder All specimens
NA
Between
20/7/2010 to
17/8/2010
7/12/2010
Between
112 - 140
days

65
Large panels and medium panels were reinforced with 6 mm mild yield strength
reinforcement bar mesh with 100 mm spacing between bars in both directions. The
mesh was located at the middle of panel depth. Columns were reinforced by using four
8 mm mild yield strength bars with 6 mm bar for stirrup. Reinforcement arrangement for
large panel, medium panel and column are shown in Figure 4.3 (a-c).
R6-125 cc
100 mm200 mm
3380 mm (a)
R6-100 cc
100 mm200 mm
1075 mm (b)
400 mm
400 mm
50 mm
4R8
R6-325 cc
(c)
Figure 4.3: Reinforcement bar details (a) large panel (b) medium panel (c) column
4.2.2 Hydrocarbon Fire Test
Hydrocarbon fire temperature versus time in accordance to EN 1991-1-2 was
used for exposing the specimens. Equation 4.1 is the hydrocarbon fire temperature
equation (BSI, 2005).
𝑇 = 1080(1 − 0.325𝑒−0.167𝑡 − 0.675𝑒−2.5𝑡) + 20 (Equation 4.1)
where T = Temperature (oC)
t = time (minute)

66
The fire tests conducted for minimum of 120 minutes. The temperature of the furnace
(near exposed surface) were measured and recorded by the furnace’s temperature
sensor to the data logger.
(a)
(b)

67
(c)
(d)
Figure 4.4: Specimen Fire Test Setup (a) Large panels (b) Medium panels (c) Columns
(d) Cylinders
4.2.3 Spalling Measurements
The weight of the specimens were measured before and after the specimens
were exposed to fire. The weight difference is considered as the weight of spalled
concrete.
4.2.4 Nominal Spalling Depth Analysis
Nominal spalling depth is a method of presenting the severity of spalling.
Nominal spalling depth is an effective method to evaluate the severity of concrete
spalling which is proposed in this study. In nominal spalling depth analysis, spalling
depth was calculated based on the area in which the specimen was exposed to fire.
Nominal spalling depth is calculated as average depth of spalled concrete after fire

68
test. Nominal depth is calculated by dividing the volume of spalled concrete with fire
exposure area. Fire exposed areas for large panels, medium panels, columns and
cylinders are illustrated in Figure 4.5(a-d).
The nominal spalling depth concept is developed in this study so that
specimens of different shape and size can be directly compared without the results
being distorted by the weight of the large specimens in other previous methods such as
% weight loss.
3.36 m
3.0 m
3.3
9 m
3.0
m
Fire Exposed Area
0.2 m
(a) One side exposed to fire
1.075 m
1.0 m
1.0
75
m
1.0
m
Fire Exposed Area
0.2 m
(b) One side exposed to fire

69
0.4 m
1.0
m
0.4 m
Fire Exposed Area
(c) All four sides exposed to fire
100 mm
20
0 m
m
Fire Exposed Area
(d) the cylindrical surface exposed to fire
Figure 4.5: Fire Exposed Area (a) Large panels (b) Medium panels (c) Columns (d)
Cylinders
4.3 Result and Discussion
4.3.1 Spalling
Large panels and medium panels were observed to spall in explosive manner.
All of the spalling occurred in the first 10 minutes of fire test. No spalling observed after

70
10 minutes of fire test. The same phenomena were also reported by (Hertz, 2003).
Images of specimens after fire test are shown in Figure 4.6. Large panels have the
largest amount of spalling with percentage of concrete spalled ranging between 8%
and 33%. Average spalling for all large panels are 19%. Medium panels average
spalling are 10% ranging from 6% and 13%. Columns and cylinders average spalling
were 14% and 9% respectively. There is no concrete age effect on spalling observed.
Spalling percentage for all specimens is summarized in Table 4.3.
(a) (b)
(c) (d)

71
Figure 4.6: Images of specimens after fire test (a) Large Panel (b) Medium Panel
(c) Column (d) Cylinder
4.3.2 Nominal Depth
Figure 4.7 shows the summary of nominal spalling depth for all specimens.
Based on visual inspection on specimen after the fire tests, nominal spalling depth
analysis is the better way to represent the severity of spalling compared to weight loss
percentage due to spalling. This is illustrated by comparing the weight loss
percentages in Table 4.3 which has no observable trend with specimen size. This point
can be further illustrated by an example where if the thickness of the panel is doubled
the spalling amount would not double to maintain the spalling loss weight percentage.
In fact, beyond a certain thickness of a panel, the thickness has very little effect on the
spalling of exposed surface.
4.3.3 Specimen’s size effect
Figure 4.6 shows that there is a trend of spalling severity based on specimen’s size
when exposed to fire. Bigger specimen size caused bigger nominal spalling depth.
Large panel specimens have the biggest nominal spalling depth average of 47.3 mm.
The variability of spalling at this size was high with nominal spalling depth ranging from
18.9 mm to 82.0 mm. The maximum and minimum nominal spalling depths for medium
panels were 29.0 mm and 12.9 mm respectively. The average nominal spalling depth is
22.8 mm, a 51.8% reduction compared to large panel’s average nominal spalling
depth. As the size of specimen reduces to 400 x 400 mm x 1 m height, the average
nominal spalling depths were also reduced to 12.7 mm and when the specimen’s size
reduced to small scale 100 mm diameter cylinder, average nominal spalling depth
reduced to 2.1 mm. The consistencies of nominal spalling depth for cylinder specimens
were good with the range of nominal spalling depth being between 1.8 mm and 2.6
mm. This result shows that specimen’s size did have effect to severity of spalling and
good agreement with Bazant (1984) in his research on size effect to fracture process in
concrete (Bazant, 1984). The spalling of concrete is a fracture process therefore, the
size effect is important as evidenced by these experimental results.

72
Table 4.3: Spalling Percentage Summary for All Specimens. Specimen Details Results
Type Maximum Aggregate
Size Aggregate Type
Spalling Weight
(kg)
Spalling (%)
Nominal Depth (mm)
Large Panel
7 mm Basalt 1839.0 32.5 82.0
Granite 1295.1 22.9 57.7
14 mm Basalt 423.4 7.5 18.9
Granite 1324.5 23.4 59.1
20 mm Basalt 720.6 12.7 32.1
Granite 764.7 13.5 34.1
Medium Panel
7 mm Basalt 63.4 11.9 27.4
Granite 52.4 9.1 21.0
14 mm Basalt 64.0 11.1 25.7
Granite 72.3 12.6 29.0
20 mm Basalt 32.1 5.6 12.9
Granite 51.4 9.1 20.6
Column
7 mm Basalt 80.3 20.2 18.3
Granite 41.9 10.5 9.6
14 mm Basalt 94.1 23.6 21.5
Granite 53.0 13.3 12.1
20 mm Basalt 32.1 8.1 7.3
Granite 33.5 8.4 7.6
Cylinder
7 mm Basalt 0.32 8.1 1.8
Granite 0.38 9.8 2.2
14 mm Basalt 0.45 11.7 2.6
Granite 0.36 9.3 2.1
20 mm Basalt 0.36 9.1 2.0
Granite 0.32 8.1 1.8

73
Figure 4.7: Nominal Spalling Depth.
Figu
re 4
.7: N
omin
al S
pallin
g D
epth
. For
spe
cim
ens
ID, n
umbe
rs 7
, 14,
20
repr
esen
t max
imum
agg
rega
te s
ize
of 7
mm
, 14
mm
and
20 m
m re
spec
tivel
y. L
ette
rs G
and
B re
pres
ent b
asal
t agg
rega
te a
nd g
rani
te a
ggre
gate
resp
ectiv
ely.
4.3.
3 S
peci
men
Siz
e
Effe
ct

74
4.3.4 Aggregate Size Effect
Figure 4.8 shows the nominal spalling depth for every specimen with different
maximum aggregate size. Most of specimens with 7 mm maximum size aggregate and
14 mm maximum aggregate size have spalled more than 20 mm maximum aggregate
size.
Specimens with 14 mm maximum aggregate size does not exhibit consistent aggregate
size effect when compared with 7 mm maximum aggregate size specimens. Large
panel (granite), medium panel (granite), column (basalt) and cylinder (granite) for 14
mm maximum aggregates size spalled more than 7 mm maximum aggregate size.
However, the differences of spalling depth between 14 mm and 7 mm maximum
aggregates size are relatively small except for large panel (basalt). The differences are
1.4 mm for large panel (granite), 3.1 mm for medium panel (basalt), 8 mm for medium
panel granite, 3.2 mm for column (basalt), 2.5 mm for column (granite), 0.1 mm for
cylinder (basalt) and 0.8 mm for cylinder (granite).
The effect of aggregate size can be observed when the maximum aggregate size was
increased from 7 mm to 20 mm for all specimens. Unlike specimens with 14 mm
maximum aggregate size, spalling depth for all specimens with 20 mm maximum
aggregate size were less than specimens with 7 mm maximum aggregate size. Large
panel specimens show biggest effect for aggregate size in terms of spalling depth.
Nominal spalling depth for large panel (basalt) decreased from 82 mm to 32.1 mm
when maximum aggregate size increased from 7mm to 20 mm. Large panel (granite)
spalling depth were also reduced by 23.6 mm from 57.7 mm with the same maximum
aggregate size increment. Spalling depth reduction for medium panel (basalt), medium
panel (granite), column (basalt) and column (granite) were 6.8 mm, 0.4 mm, 11 mm
and 2 mm respectively. Cylinder specimens spalling depth were consistent between
1.8 mm to 2.6 mm. Pan et al. (2012) demonstrated with small cylinders similar effect of
aggregate size. The same effect was observed with various specimen sizes confirms
the aggregate size effect hypothesis. Pan et al. (2012) postulated that the main cause
for better resistance to spalling by large aggregate samples is the longer fracture
process zone which needs larger kinetic energy to produce crack. In slightly different
focus on aggregate size effect, some researches highlighted the performance of
mechanical properties such as bending strength and compressive strength increase as
the aggregates size increases (Chen and Liu, 2004; Meddah et al., 2010).

75
Figure 4.8: Nominal Spalling Depth for Maximum Aggregate Size
4.3.5 Aggregate Type Effect
Figure 4.9 shows nominal spalling depth comparison between specimens with
basalt aggregate and granite aggregate. Both basalt and granite are most common
igneous rock used as coarse aggregate in Australia. Basalt is a dark colored aggregate
with fine grain widely used as aggregate in concrete matrix, road base, road pavement
aggregate, railway ballast and many more. Polished basalt were also used for flooring
tiles purposes. Meanwhile granite is best known igneous rock. It is light in color with
large grains. The grains are large enough to be visible with unaided eye. Granite is also
widely used as aggregate in concrete matrix and other construction purposes. Chen et
al. (2014) found out that main properties for aggregate such as bulk specific gravity and
water absorption values are similar between basalt and granite aggregates .
From Figure 4.9, it is clear that there is not a clear trend for nominal spalling depth
between basalt aggregate specimens and granite aggregate specimens. Basalt
aggregate large panel with 14 mm and 20 mm maximum aggregate size spalled more
than granite aggregate large panel but different scenario with large panel with 7 mm
maximum aggregate size where granite aggregate panel spalled less than basalt
aggregate. The same phenomena happens to nominal spalling depth for medium
panels, columns and cylinders where no decisive conclusion can be made when basalt

76
aggregate were compared to granite aggregate. This is likely due to the fact that both
basalt and granite have similar thermal expansion coefficients. Thermal expansion
coefficient for concrete with basalt and granite as coarse aggregate are 9.5 and 9.3
microstrain/oC respectively (Naik et al., 2011).
Figure 4.9: Nominal Spalling Depth for Maximum Aggregate Type
4.4 Conclusion
1 Specimen size did have effect on the spalling of concrete under hydrocarbon
fire exposure. Nominal spalling depths of concrete increases as the specimen
size increases.
2 The aggregate size effect on spalling was prominent when the maximum
aggregate size increased from 7 mm to 20 mm. For specimens with 20 mm
maximum aggregate size spalling depth is less compared to specimens with 7
mm and 14 mm maximum aggregate size.
3 Aggregate type (basalt and granite) does not exhibit any clear trend on spalling
depth. This is likely to be due to similar thermal expansion properties of basalt
and granite.

77
4 Nominal spalling depth concept proposed in this study is an effective method of
representing the degree of spalling and is better than the percentage weight
loss method commonly used.

78
References
Anderberg, D. Y. (1997). Spalling Phenomena of HPC and OC.L. T. Phan, N. J. Carino,
D. Duthinh and Garboczi. NIST Workshop on Fire Performance of High
Strength Concrete, Gaithersburg. 69-73.
Bailey, C. (2002). "Holistic behaviour of concrete buildings in fire." Proceedings of the
Institution of Civil Engineers: Structures and Buildings 152(3): 199-212.
Bazant, Z. P. (1984). "SIZE EFFECT IN BLUNT FRACTURE: CONCRETE, ROCK,
METAL." Journal of Engineering Mechanics 110(4): 518-535.
Bažant, Z. P. (2000). "Size effect." International Journal of Solids and Structures 37(1–
2): 69-80.
Bazant, Z. P. and Sun, H.-H. (1987). "SIZE EFFECT IN DIAGONAL SHEAR FAILURE:
INFLUENCE OF AGGREGATE SIZE AND STIRRUPS." ACI Materials Journal
84(4): 259-272.
BSI (2005). BS EN 1991-1-2: Actions on Structures. Part 1 -2: General Actions -
Actions on structures exposed to fire. Brussels, European Committee for
Standardization.
Chen, B. and Liu, J. (2004). "Effect of aggregate on the fracture behavior of high
strength concrete." Construction and Building Materials 18(8): 585-590.
Chen, Z., Xie, J., Xiao, Y., Chen, J. and Wu, S. (2014). "Characteristics of bonding
behavior between basic oxygen furnace slag and asphalt binder." Construction
and Building Materials 64(0): 60-66.
Erdem, T. K. (2014). "Specimen size effect on the residual properties of engineered
cementitious composites subjected to high temperatures." Cement and
Concrete Composites 45(0): 1-8.
Hertz, K. D. (2003). "Limits of spalling of fire-exposed concrete." Fire Safety Journal
38(2): 103-116.
Ince, R. and Arici, E. (2004). "Size effect in bearing strength of concrete cubes."
Construction and Building Materials 18(8): 603-609.
79
Kalifa, P., Menneteau, F.-D. and Quenard, D. (2000). "Spalling and pore pressure in
HPC at high temperatures." Cement and Concrete Research 30(12): 1915-
1927.
Kong, D. L. Y. and Sanjayan, J. G. (2008). "Damage behavior of geopolymer
composites exposed to elevated temperatures." Cement and Concrete
Composites 30(10): 986-991.
Meddah, M. S., Zitouni, S. and Belâabes, S. (2010). "Effect of content and particle size
distribution of coarse aggregate on the compressive strength of concrete."
Construction and Building Materials 24(4): 505-512.
Naik, T. R., Kraus, R. N. and Kumar, R. (2011). "Influence of types of coarse
aggregates on the coefficient of thermal expansion of concrete." Journal of
Materials in Civil Engineering 23(4): 467-472.
Pan, Z., Sanjayan, J. G. and Kong, D. L. Y. (2012). "Effect of aggregate size on
spalling of geopolymer and Portland cement concretes subjected to elevated
temperatures." Construction & Building Materials 36: 365-372.
Pan, Z., Sanjayan, J. G. and Rangan, B. V. (2010). Fracture Properties of geopolymer
paste and concrete. Magazine of Concrete Research 63:(1): 1-9.
Phan, L. T. and Carino, N. J. (1998). "Review of mechanical properties of HSC at
elevated temperature." Journal of Materials in Civil Engineering 10(1): 58-64.
Sanjayan, G. and Stocks, L. J. (1993). "Spalling of high-strength silica fume concrete in
fire." ACI Materials Journal 90(2): 170-173.
Standard Australia, L. (1999). AS 1012.9: Methods of testing concrete. Method 9:
Determination of the compressive strength of concrete specimens. Sydney,
Australia, Sai Global Limited: 3.
Yang, J. and Peng, G. F. (2011). The Mechanism of Explosive Spalling and Measures
to Resistant Spalling of Concrete Exposed to High Temperature by
Incorporating Fibers: a Review. L. J. Li. Advances in Building Materials, Pts 1-3.
Trans Tech Publications Ltd, Stafa-Zurich 168-170: 773-777.

80
CHAPTER 5
Investigation of the Effects of Fly Ash Types and Properties
on the Workability of Fresh Geopolymer
5.1 Introduction
Workability is often referred as the ease with which a concrete can be
transported, placed and consolidated without any loss of stability or homogeneity. It is
greatly affect by the characteristics of the constituent materials of concrete (Leite et al.,
2013). The workability properties are measured for fresh concrete before it has set and
hardened. Adequate workability of a fresh concrete is essential in order to reduce the
amount of air voids in hardened concrete which are also affected by bad compacting
and bad consistencies (Neville, 2010 ). Strength of concrete is adversely and
significantly affected by the presence of voids in the compacted mass. In Portland
cement based concrete, amount of water in the mix is the main parameter that is used
to control workability. Higher water content causes greater workability.

81
The new breed of concrete binder considered to be the binder of the future due to less
CO2 emission, geopolymer is a cementless concrete binder which was coined by
Davidovits in 1975 (Davidovits, 1991; Van Jaarsveld et al., 2002).
Geopolymers are a new class of materials, whose potential remains to be fully
unlocked (Provis and van Deventer, 2009). Geopolymer cements provide an alternative
to the Portland cement used to manufacture concrete. The main raw material
commonly used to produce geopolymers is fly ash, which is found in the waste stream
from power generation facilities (Hardjito et al., 2004; Bakharev, 2005).
There have been many research works focused on the aluminate and silicate reaction
factors on geopolymer compressive strength (Davidovits, 1989; Palomo et al., 1999;
Hardjito et al., 2004; Duxson et al., 2007; Bakri et al., 2012). However, casting
geopolymer concrete in real life construction needs a specific attention to the
workability of the concrete itself. Among the other parameters that affect workability of
fresh concrete mix are shape of aggregates and binder’s particle size and distribution
(Leite et al., 2013; Deb et al., 2014). Alkaline solution properties such as viscosity of
sodium silicate, ratio of silicate to hydroxide and ratio of solution to fly ash were also
found out to influence workability of geopolymer (Chindaprasirt et al., 2007; Nath and
Sarker, 2014). Since fly ash is a by-product of coal generated power plant and different
power stations use different coal sources, the chemical and physical properties of one
fly ash to another are different (Hardjito et al., 2004). The workability differences
between fly ash from different power plants can be due to chemical property
differences or physical property differences. Tarong fly ash’s poor performances as
compared to other fly ash available in Australia was concluded to be due to high Si/Al
ratio (Keyte, 2008). This chapter mainly focused on fly ash physical properties effect on
geopolymer workability. Physical properties tests such as particle average diameter,
particle size distribution, particle shape, density, pore volume, specific surface, bulk
density and absorption tests for Tarong fly ash, Gladstone fly ash and Microash were
carried out to investigate the effects of fly ash types and properties on the workability of
fresh geopolymer.
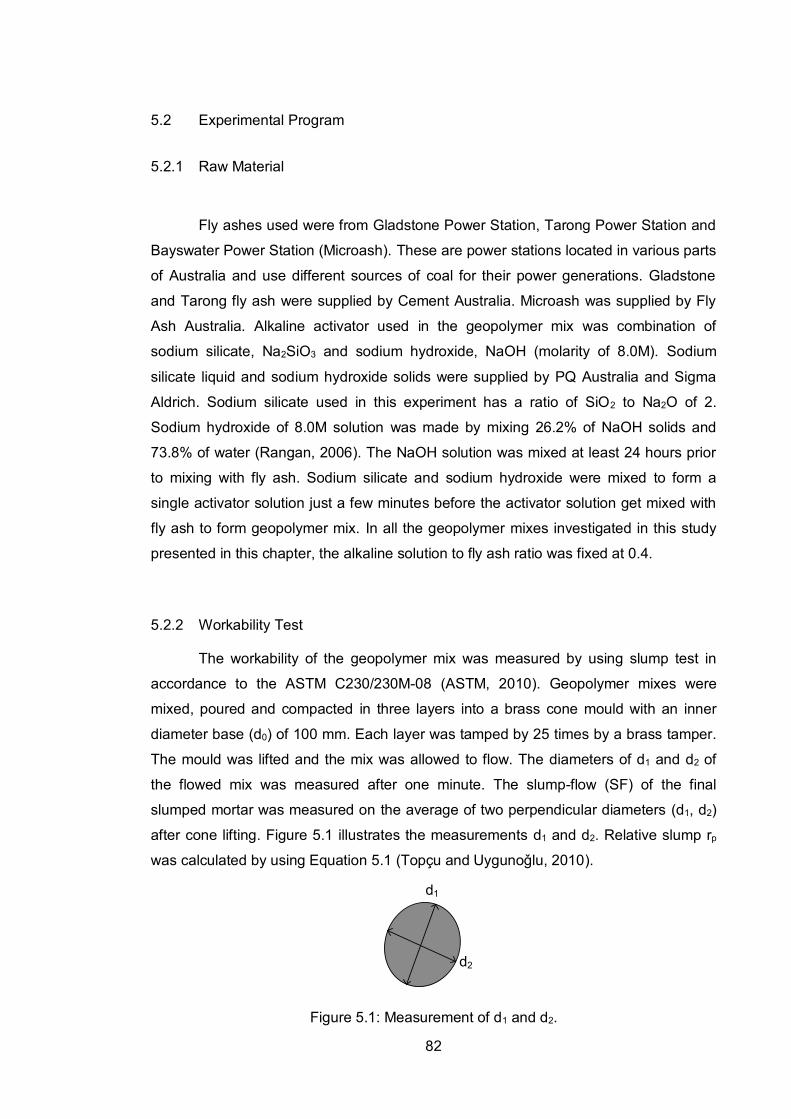
82
5.2 Experimental Program
5.2.1 Raw Material
Fly ashes used were from Gladstone Power Station, Tarong Power Station and
Bayswater Power Station (Microash). These are power stations located in various parts
of Australia and use different sources of coal for their power generations. Gladstone
and Tarong fly ash were supplied by Cement Australia. Microash was supplied by Fly
Ash Australia. Alkaline activator used in the geopolymer mix was combination of
sodium silicate, Na2SiO3 and sodium hydroxide, NaOH (molarity of 8.0M). Sodium
silicate liquid and sodium hydroxide solids were supplied by PQ Australia and Sigma
Aldrich. Sodium silicate used in this experiment has a ratio of SiO2 to Na2O of 2.
Sodium hydroxide of 8.0M solution was made by mixing 26.2% of NaOH solids and
73.8% of water (Rangan, 2006). The NaOH solution was mixed at least 24 hours prior
to mixing with fly ash. Sodium silicate and sodium hydroxide were mixed to form a
single activator solution just a few minutes before the activator solution get mixed with
fly ash to form geopolymer mix. In all the geopolymer mixes investigated in this study
presented in this chapter, the alkaline solution to fly ash ratio was fixed at 0.4.
5.2.2 Workability Test
The workability of the geopolymer mix was measured by using slump test in
accordance to the ASTM C230/230M-08 (ASTM, 2010). Geopolymer mixes were
mixed, poured and compacted in three layers into a brass cone mould with an inner
diameter base (d0) of 100 mm. Each layer was tamped by 25 times by a brass tamper.
The mould was lifted and the mix was allowed to flow. The diameters of d1 and d2 of
the flowed mix was measured after one minute. The slump-flow (SF) of the final
slumped mortar was measured on the average of two perpendicular diameters (d1, d2)
after cone lifting. Figure 5.1 illustrates the measurements d1 and d2. Relative slump rp
was calculated by using Equation 5.1 (Topçu and Uygunoǧlu, 2010).
d1
d2
Figure 5.1: Measurement of d1 and d2.

83
𝑟𝑝 = (𝑆𝐹
𝑑0)
2
− 1 (Equation 5.1)
Where,
𝑆𝐹 =𝑑1+𝑑2
2 mm
d0 = 100 mm
5.2.3 Investigation of the Relevant Physical Properties of Fly Ash
Various fly ash physical properties such as particle size distribution, mean
particle diameter, shape images, specific surface area, average pore diameter and
pore volume were measured and analysed. Particle size distribution and average
diameter were measured by using CILAS Particle Size Analyzer 1190. Figure 5.2
shows the image of CILAS Particle Size Analyzer 1190 equipment. Particle shape
analyses were carried out by using Zeiss Supra 40VP Scanning Electron Microscope
(SEM) analyses. Particle shape images were captured from SEM analyses. Samples
were thinly gold coated with a DYNAVAC (CS 300) deposition system prior to the SEM
analysis due to fly ash has non-conductive surface and without electrically
conductive surface, charging effect may arise during scanning. Picture of Zeiss
Supra 40VP equipment is shown in Figure 5.3. Fly ash specific surface area and pore
properties were measured based on nitrogen adsorption method by using Belsorp Max
equipment (Figure 5.4). Specific surface area and pore volume at atmospheric
pressure were calculated based on Brunauer-Emmett-Teller (BET) theory using
BELMasterTM Version 6.3.1.0 software which was developed by BEL Japan, Inc. BET
theory explained that specific surface area of fly ash is determined by measuring
physical adsorption of nitrogen gas on the surface of the solid (Brunauer et al., 1938).
The amount of adsorbed gas to a monomolecular layer on the surface corresponds to
specific surface area and pore volume values. Density of fly ash measurement was
carried out in accordance to Indian Standard IS 4031 Part 11:1988. Weighed quantity
of fly ash was scooped in La chatelier flask filled with kerosene (Figure 5.5). Displaced
volume of kerosene in the la chatelier flask was recorded. Density of fly ash is
calculated based on the mass of the fly ash and displaced volume (Indian Standard,
1988).

84
Figure 5.2: CILAS Particle Size Analyzer
Figure 5.3: ZEISS Supra 40VP Scanning Electron Microscope

85
Figure 5.4: Belsorp Max Adsorption Measurement
Figure 5.5: Fly ash density measurement equipment
5.2.4 Investigation of the Relevant Chemical Properties of Fly Ash
Fly ash from Gladstone, Tarong and Microash were tested using X-Ray
Fluorescence (XRF) analysis to determine the chemical component. They were tested
for main oxide components such as Al2O3, SiO2, CaO, MgO, MnO, Fe2O3 and others.
Geopolymer formation is due to alluminate and silicate reaction. Unlike cement which
used water for hydration process to produce Calcium-Silicate-Hydrate CSH gel,

86
geopolymer is based on reaction from activator solution with aluminate and silicate
source in fly ash for polymerization and hardening. It is postulated that any kind of
aluminate and silicate reaction do not take place since there are no heat introduced
during the initial mixing procedure. All the fly ashes were mixed with demineralized
water with the ratio of water to fly ash being set constant at 0.4. The workability of
these mixtures were measured similar with the procedure explained in Section 5.2.2.
Water from the geopolymer mixture was filtered by using filter paper. Inductively couple
plasma (ICP) analyses were conducted on the water to identify chemical component
which have already dissolved at initial stage of geopolymer mixing even without
aluminate and silicate reaction. ICP analyses were carried out using Varian 720-ES
equipment (Figure 5.6). The oxides selected as standard references were based on
chemical components obtained from XRF analyses.
Figure 5.6: Varian 720-ES inductively coupled plasma equipment
5.3 Results and Discussions
5.3.1 Workability Results
Geopolymer with Gladstone fly ash has the best workability compared to
geopolymer using Tarong fly ash and Microash. Figure 5.7 (a-c) shows the images of
geopolymer made of fly ash from Gladsone, Tarong and Microash. Gladstone fly ash
immediately changes its form into liquid paste when mixed with alkaline solution.
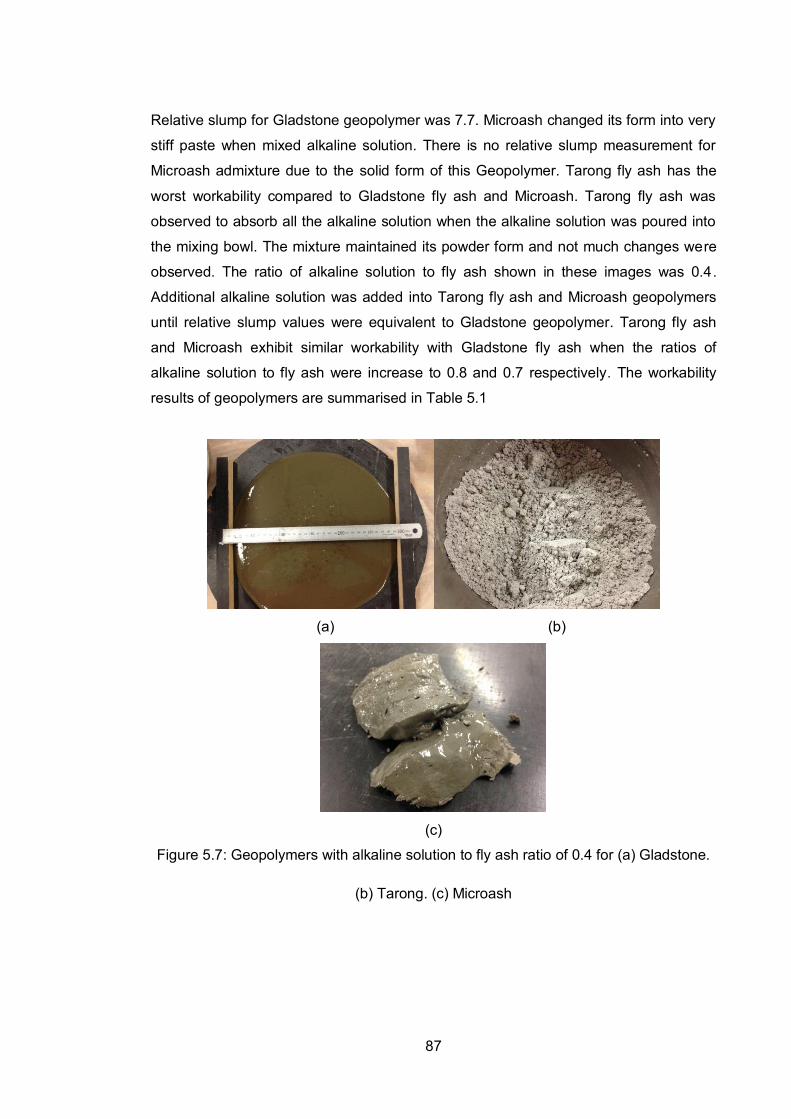
87
Relative slump for Gladstone geopolymer was 7.7. Microash changed its form into very
stiff paste when mixed alkaline solution. There is no relative slump measurement for
Microash admixture due to the solid form of this Geopolymer. Tarong fly ash has the
worst workability compared to Gladstone fly ash and Microash. Tarong fly ash was
observed to absorb all the alkaline solution when the alkaline solution was poured into
the mixing bowl. The mixture maintained its powder form and not much changes were
observed. The ratio of alkaline solution to fly ash shown in these images was 0.4.
Additional alkaline solution was added into Tarong fly ash and Microash geopolymers
until relative slump values were equivalent to Gladstone geopolymer. Tarong fly ash
and Microash exhibit similar workability with Gladstone fly ash when the ratios of
alkaline solution to fly ash were increase to 0.8 and 0.7 respectively. The workability
results of geopolymers are summarised in Table 5.1
(a) (b)
(c)
Figure 5.7: Geopolymers with alkaline solution to fly ash ratio of 0.4 for (a) Gladstone.
(b) Tarong. (c) Microash

88
Table 5.1: Relative slump summary
Fly Ash Alkaline Solution
to Fly Ash Ratio
Diameter 1 (d1)
mm
Diameter 2 (d2)
mm
Relative Slump
(rp)
Gladstone 0.4 290 300 7.7
Tarong 0.4 N/A N/A N/A
Tarong 0.8 290 292 7.5
Microash 0.4 N/A N/A N/A
Microash 0.7 310 320 8.9
5.3.2 Analyses of the Measured Physical Properties of Fly Ash
5.3.2.1 Particle Size Analyses
Tarong fly ash has the largest particle average diameter of 18.63 µm followed
by Gladstone fly ash and Microash. Gladstone fly ash and Microash average diameters
were 10.11 µm and 4.20 µm respectively. Largest average diameter of Tarong fly ash
resulted in lowest density of 2.09 g/cm3. Low density can be due to more voids
between particles which provide more volume and low in mass for Tarong fly ash. The
density for Gladstone fly ash and Microash were 2.29 and 2.43 g/cm3. Table 5.2
summarises the average diameter and density of all fly ash. Based on particle size
distribution graphs, Gladstone fly ash has the most evenly distributed particle size.
Biggest particle diameter for Gladstone fly ash is 100 µm and 50% of Gladstone fly ash
particle size ranging from 1 µm to 100 µm. Tarong fly ash particle size was not evenly
distributed as compared to Gladstone fly ash. Particles diameters for Tarong fly ash
ranged from 0.04 µm to 100 µm. More than 50% of Tarong fly ash particles diameters
were more than 10 µm. However, there was a gap for fly ash particles with diameter
between 1 µm and 5 µm. Less than 5% of particle fly ash with the diameter within this
range. There were 30% fly ash particles with diameter less than 1 µm. Microash
particle size exhibit more even distribution compared to Tarong fly ash. More than 85%
of its particles size ranged between 0.8 µm and 30 µm. The distribution of particle size
within this range was equivalent to the S-Curve Cumulative distribution. There were
less than 15% of Microash particles of diameter between 0.04 µm and 0.3 µm. There
was also a gap in which less than 5% of particles of fly ash are with particle diameter
within 0.3 µm and 0.6 µm. Figure 5.8 (a-c) show particle size distribution graphs for (a)
Gladstone fly ash (b) Tarong fly ash and (c) Microash.

89
Table 5.2: Average Diameter Summary
Fly Ash Fly Ash Average Diameter (µm)
Fly Ash Density (g/cm3)
Gladstone 10.11 2.29 Tarong 18.63 2.03
Microash 4.20 2.43
(a)
(b)

90
(c)
Figure 5.8: Particle size distribution graphs for (a) Gladstone fly ash. (b) Tarong fly ash.
(c) Microash
Figure 5.9 (a-c) shows the adsorption and desorption graphs for Gladstone fly ash,
Tarong fly ash and Microash. Pressure for adsorption and desorption of nitrogen gas
measurement ranged from atmospheric pressure (relative pressure = 0.999) to very
low pressure (relative pressure = 0.01). Relative pressure is the ratio of pressure in
sample cell to atmospheric pressure (/0). From Figure 5.9, absorption and desorption
curves for all fly ashes were similar. This indicates that the adsorption of nitrogen gas
on particle surface was accurate and acceptable. Based on the results obtained from
adsorption test, specific surface area was calculated using BET theory. Gladstone fly
ash, Tarong fly ash and Microash specific surface areas were 1.15 m2/g, 1.09 m2/g and
1.16 m2/g respectively. These results are in a good agreement with findings from
Pathan (2003).
BET theory analyses also provide values such as mean pore diameter and pore
volume at atmospheric pressure. These pores can be due to pores from the particle
itself or agglomeration of particles. From the pore volume and mean pore diameter
values analyses, there was a clear trend between pore volume and workability
observed. Gladstone fly ash has best workability and the lowest volume of pores and
mean pore diameter. It has pore volume of 3.39 mm3/g and 11.8 nm mean pore
diameter. Microash has larger pore volume compared to Gladstone fly ash. The pore
volume and mean diameter were 3.8 mm3/g and 12.9 nm respectively. Tarong fly ash
has the largest pore volume amongst other fly ash with 4.05 mm3/g and 14.7 nm mean
pore diameter. Its pore volume was 20% more than Gladstone fly ash and 8% higher

91
than Microash. It is clearly indicated that high workability geopolymer made from fly ash
with highest pore volume consumed more alkaline solution. The pore volume is
postulated to be the main factor for high porosity of the fly ash which resulted in high
solution demand and low workability. Table 5.3 summarises the results calculated from
the adsorption test.
(a)
(b)

92
(c)
Figure 5.9: Adsorption and desorption curves for (a) Gladstone fly ash (b) Tarong fly
ash (c) Microash
Table 5.3: Adsorption test (BET Theory) results summary
Fly Ash Specific Surface
(m2/g)
Mean Pore Diameter
(nm)
Pore Volume
(mm3/g)
Gladstone 1.15 11.8 3.39
Tarong 1.09 14.7 4.05
Microash 1.16 12.9 3.75
Further absorption and bulk density tests were carried out to consolidate the pore
volumes and porosity effect on workability. For bulk density, fly ash weight was
measured in a known volume container. Bulk density was calculated by dividing the
weight of fly ash with the volume. For absorption test, demineralised water was added
to fly ash in steps of very small amount until fly ash changed its form from loose grainy
particle into cohesive mass. Figure 5.10 shows the images of fly ash in loose grainy
form and cohesive mass. This is the point where it is considered that all the water was
absorbed by the fly ash. Demineralised water used in this test due to the insolubility of
fly ash in water (Cement Australia, 2011). The amount of water added was recorded
and the percentage of water mass to the fly ash mass was calculated. Results from
bulk density and absorption test were summarised in Table 5.4 and Table 5.5
respectively.
From Table 5.4, bulk density for Gladstone fly ash, Tarong fly ash and Microash were
1083 kg/m3, 714 kg/m3 and 905 kg/m3 respectively. The differences in the bulk density
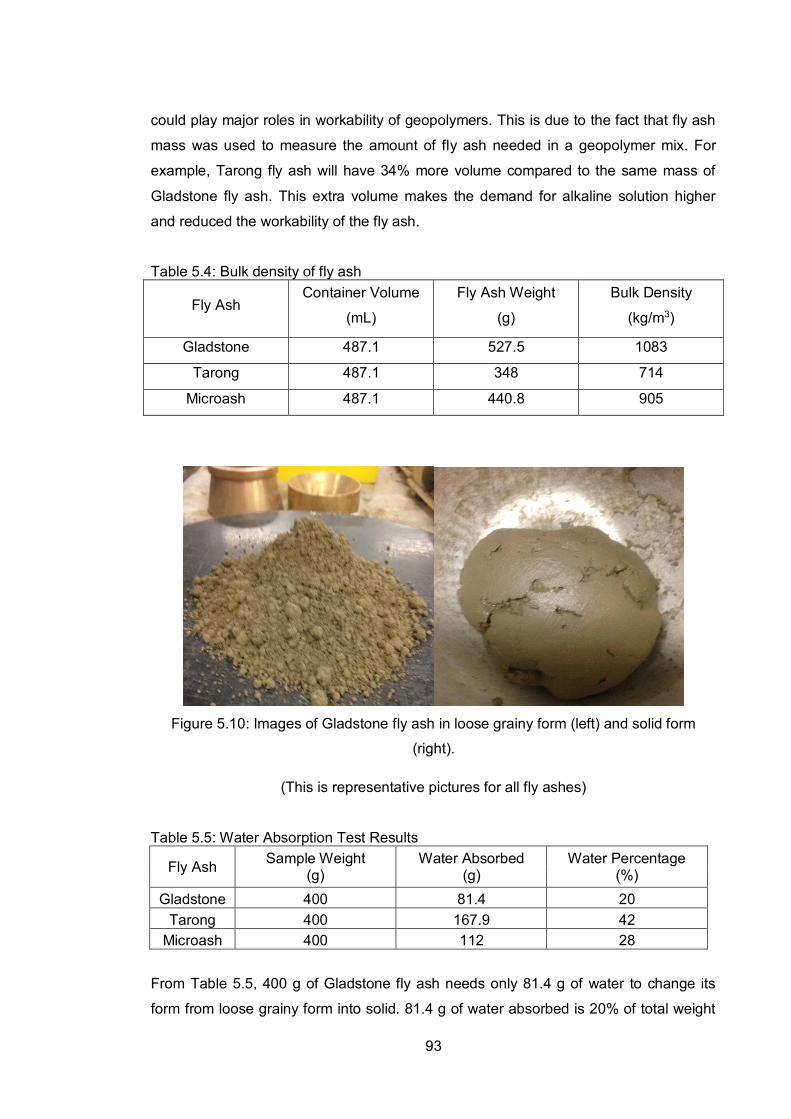
93
could play major roles in workability of geopolymers. This is due to the fact that fly ash
mass was used to measure the amount of fly ash needed in a geopolymer mix. For
example, Tarong fly ash will have 34% more volume compared to the same mass of
Gladstone fly ash. This extra volume makes the demand for alkaline solution higher
and reduced the workability of the fly ash.
Table 5.4: Bulk density of fly ash
Fly Ash Container Volume
(mL)
Fly Ash Weight
(g)
Bulk Density
(kg/m3)
Gladstone 487.1 527.5 1083
Tarong 487.1 348 714
Microash 487.1 440.8 905
Figure 5.10: Images of Gladstone fly ash in loose grainy form (left) and solid form
(right).
(This is representative pictures for all fly ashes)
Table 5.5: Water Absorption Test Results
Fly Ash Sample Weight (g)
Water Absorbed (g)
Water Percentage (%)
Gladstone 400 81.4 20 Tarong 400 167.9 42
Microash 400 112 28
From Table 5.5, 400 g of Gladstone fly ash needs only 81.4 g of water to change its
form from loose grainy form into solid. 81.4 g of water absorbed is 20% of total weight

94
of fly ash. The same amount of Microash absorbed 112 g of water for the ash changed
its form to solid. 112 g of water weight is 28% from fly ash weight. However, Tarong fly
ash absorbed 167.9 g of water and it is 42% from the fly ash weight. Results from
absorption test is in a good agreement with pore volume results obtained from
adsorption test and provide further evidence to conclude that porosity of fly ash plays
an important factor influencing the workability of fly ash.
5.3.2.2 Particle Shape Analyses
Figure 5.11 shows the comparison of images between Gladstone fly ash and
Tarong fly ash particle shapes on various magnifying scale. There was not much
difference or abnormality observed from SEM analyses. Both fly ash exhibited
spherical shape. However, it can be observed that Tarong fly ash particles were more
agglomerated compared to Gladstone fly ash. These images proved that
agglomeration of particles was the main cause of high pore volume in fly ash
(adsorption test) which leads to high porosity (absorption test) and low bulk density.
Gladstone Power Station Fly Ash Tarong Power Station Fly Ash

95
Figure 5.11: Scanning Electron Microscope (SEM) Images comparison for Gladstone
Power Station fly ash and Tarong Power Station fly ash.
5.3.3 Chemical Analyses
Table 5.6 summarises the chemical component obtained from XRF test. The
results were similar to XRF tests conducted by Keyte (2008) and Kong and Sanjayan
(2010) . Workability test was conducted to fly ash and demineralised water with water
to fly ash ratio of 0.4. From workability test, Gladstone fly ash still produced the best
workability followed by Microash. Gladstone fly ash immediately changes into liquid
paste form when mixed with demineralised water. Microash turns into a stiff paste
when mixed with the same amount of water. However, the Tarong fly ash still has the
worst workability compared to other fly ashes and the mixture maintain with its grainy
forms when mixed with water. The workability of fly ash and demineralised water
mixture were identical to fly ash and alkaline activator mixtures (geopolymer). Main
reaction in geopolymer was aluminosilicate source from fly ash such as Al2O3 and SiO2
and aluminate and silicate such as sodium silicate and sodium hydroxide from alkaline
solution to form gelation, polymerization and hardening (Duxson et al., 2007). However,
without the presence of any aluminate and silicate in these water mixtures, the reaction
was not taking place which rules out the dissolution effect of Al2O3 and SiO2 in
geopolymer workability. Figure 5.12 (a-c) shows the images of mixtures of fly ash and
water mixtures with 0.4 ratio of water to fly ash.
Further analyses were carried out to investigate chemical effects on workability.
Additional demineralised water was then mixed into fly ash until all of fly ash and water
mixture became more like liquid mixture. The ratio of 0.75 water to fly ash was
observed to be the optimum ratio for all fly ashes especially Tarong to change its form
into liquid like mixture. The water from the mixture was then filtered using paper filter 5
minutes after the water and fly ash were mixed to determine chemical content through

96
Inductively Couple Plasma (ICP) analysis. Results from ICP analysis are presented in
Table 5.7.
Table 5.6: Chemical Component and slump-flow of Fly Ash
Component (wt%)
Gladstone Tarong Microash Al2O3 25.56 23.22 17.66 BaO 0.09 0.03 0.05 CaO 4.3 0.07 0.49 Cr2O3 - - - Fe2O3 12.48 0.89 3.58 K2O 0.7 0.52 0.94 MgO 1.45 0.14 0.53 MnO 0.15 0.02 0.07 Na2O 0.77 0.06 0.16 P2O5 0.885 0.046 0.137 SO3 0.24 0.06 0.14 SiO2 51.11 73.15 75.16 TiO2 1.32 1.31 0.66
Loss on Ignition 0.57 0.75 0.62 Total 99.62 100.36 100.23
Si/Al Ratio 1.99 3.15 4.26 Relative Slump 7.5 N/A* N/A*
*Fly ash still in powder form. Therefore, slump measurement is unavailable.
From Table 5.7, no trace of aluminium oxide and sodium oxide was detected on filtered
water for all fly ashes. 5.7 to 5.85 part per million (ppm) of Ferrous oxide and
Magnesium oxide were detected in all fly ashes as well. Silicon oxide amount (ppm) for
Gladstone fly ash, Tarong fly ash and Microash were 15, 21 and 30 respectively. The
differences of the oxides amount for all of the fly ashes are too small to be considered
as an important factor. However, Calcium oxide amount traced in Gladstone fly ash
filtered water was high compared to Tarong fly ash and Microash. Concentration of 660
ppm calcium oxide for Gladstone fly ash filtered water followed by 260 ppm for Tarong
fly ash and 22 ppm for Microash. This is due to high amount of calcium oxide in
Gladstone fly ash referring to XRF analyses result. To further investigate whether
calcium oxide plays a major role in workability, additional calcium oxide was added into
Tarong fly ash and demineralised water mixture. In order to stimulate the amount of
calcium oxide in Gladstone fly ash, 5% of calcium oxide (by fly ash weight) was added
to the mix. However, there was no difference in workability observed. Therefore, it can
be concluded that neither calcium oxide nor any aluminosilicate component plays any
role in geopolymer mix workability.

97
(a) (b)
(c)
Figure 5.12: Mixtures of demineralized water and fly ash from (a) Gladstone Power
Station. (b) Tarong Power Station. (c) Microash
Table 5.7: Chemical concentration for water filtered from fly ash and demineralized water mixture
Fly Ash
Source
Chemical Concentration in ppm
SiO2 CaO FeO MgO Al2O3 Na2O
Gladstone 15 660 5.84 5.8 0 0
Tarong 21 260 5.71 5.7 0 0
Microash 30 22 5.85 5.8 0 0
5.4 Conclusion
1 Geopolymer from Gladstone fly ash has the best workability compared to
Tarong fly ash and Microash geopolymer. Gladstone Power Station fly ash
geopolymer mixture’s relative slump value was 7.7 with alkaline solution to fly
ash ratio of 0.4. Microash and Tarong fly need 0.7 and 0.8 ratio of alkaline

98
solution to fly ash respectively to achieve similar level of workability to
Gladstone geopolymer with 0.4 ratio.
2 High pore volume caused high porosity of fly ash and from absorption test,
Gladstone, Tarong and Microash absorbed 20%, 42% and 28% of water
respectively. The differential percentages of water absorbed between the fly ash
were similar with pore volume differential percentages. Therefore, it can be
concluded that high pore volume is the main factor affecting the workability of fly
ash
3 Bulk density values for all the fly ash indicate that Tarong fly ash volume was
34% higher than the Gladstone on the same mass. Low bulk density of Tarong
fly ash is postulated by high pore volume of the fly ash. This resulted in high
alkaline solution demand and low workability for Tarong fly ash.
4 Particle size distribution analyses show that Microash was the finest fly ash
followed by Gladstone Power Station fly ash and Tarong Power Station Fly ash
with average diameter of 4.20 µm, 10.11 µm, and 18.63 µm respectively.
According to this, Tarong fly ash should provide the highest workability since
large particles provide higher workability. Since the opposite effect was
observed, the particle size distribution can be discounted as an influencing
factor.
5 Gladstone, Tarong and Microash have pore volumes of 3.4, 4.05 and 3.75
mm3/g respectively. Pore volume can be due to pore from agglomeration and
pore from the particle surface itself.
6 SEM images provide further proofs that Tarong fly ash particles are
agglomerated compared to Gladstone even though both particle types exhibit
spherical shape. Agglomeration of fly ash particle reflected in high pore volume
of fly ash which caused high porosity of fly ash. Therefore, it can be concluded
that the porosity of fly ash is the main factor effecting workability.
7 Aluminosilicate reaction was not an influencing factor in geopolymer workability.
All fly ash mixed with demineralised water exhibit similar workability levels
compared with with fly ash mixed with alkaline solution.
8 Even though higher calcium oxide was found to have dissolved in Gladstone fly
ash mixture, there was not any improvement observed to the workability of
Tarong fly ash when additional calcium oxide was added to Tarong fly ash
geopolymer mixture. Therefore, it can be concluded that chemical properties do
not affect the workability of fly ash geopolymer since there was no major
differences between various chemicals found in the dissolution water except
calcium oxide.

99
100
References
ASTM (2010). C230/C230M – 08: Standard Specification for Flow Table for Use in
Tests of Hydraulic Cement. West Conshohocken, Pennsylvania 19428-2959,
United States, ASTM International.
Bakharev, T. (2005). "Geopolymeric materials prepared using Class F fly ash and
elevated temperature curing." Cement & Concrete Research 35(6): 1224-1232.
Bakri, A. M. M. A., Heah, C. Y., Kamarudin, H., Liew, Y. M., Luqman, M., Nizar, I. K.
and Ruzaidi, C. M. (2012). Processing and characterization of calcined kaolin
cement powder. Construction and Building Materials 30:(1): 794+.
Brunauer, S., Emmett, P. H. and Teller, E. (1938). "Adsorption of Gases in
Multimolecular Layers." Journal of the American Chemical Society 60(2): 309-
319.
Cement Australia (2011). "Fly Ash - Tarong.
http://www.cementaustralia.com.au/wps/wcm/connect/website/packaged-
products/resources/7490140045f9401681178f6685a73cbc/CA008+Tarong+Fly
+Ash.pdf (11 August 2014).
Chindaprasirt, P., Chareerat, T. and Sirivivatnanon, V. (2007). "Workability and
strength of coarse high calcium fly ash geopolymer." Cement and Concrete
Composites 29(3): 224-229.
Davidovits, J. (1989). "Geopolymers and geopolymeric materials." Journal of Thermal
Analysis 35(2): 429-441.
Davidovits, J. (1991). "Geopolymers - Inorganic polymeric new materials." Journal of
Thermal Analysis 37(8): 1633-1656.
Deb, P. S., Nath, P. and Sarker, P. K. (2014). "The effects of ground granulated blast-
furnace slag blending with fly ash and activator content on the workability and
strength properties of geopolymer concrete cured at ambient temperature."
Materials & Design 62(0): 32-39.
Duxson, P., Fernández-Jiménez, A., Provis, J. L., Lukey, G. C., Palomo, A. and Van
Deventer, J. S. J. (2007). "Geopolymer technology: The current state of the art."
Journal of Materials Science 42(9): 2917-2933.

101
Hardjito, D., Wallah, S. E., Sumajouw, D. M. J. and Rangan, B. V. (2004). "On the
development of fly ash-based geopolymer concrete." ACI Materials Journal
101(6): 467-472.
Indian Standard (1988). IS 4031: Methods of Physical Tests for Hydraulic Cement. Part
11: Determination of Density. New Delhi 110002 Bureau of Indian Standard.
Keyte, L. (2008). What's wrong with Tarong?: the importance of coal fly ash glass
chemistry in inorganic polymer synthesis.
Kong, D. L. Y. and Sanjayan, J. G. (2010). "Effect of elevated temperatures on
geopolymer paste, mortar and concrete." Cement and Concrete Research
40(2): 334-339.
Leite, M., Figueire do Filho, J. and Lima, P. (2013). "Workability study of concretes
made with recycled mortar aggregate." Materials and Structures 46(10): 1765-
1778.
Nath, P. and Sarker, P. K. (2014). "Effect of GGBFS on setting, workability and early
strength properties of fly ash geopolymer concrete cured in ambient condition."
Construction and Building Materials 66: 163-171.
Neville, A. M. (2010 ). Concrete technology J. J. Brooks. Prentice Hall Harlow, England
; New York : .
Palomo, A., Grutzeck, M. W. and Blanco, M. T. (1999). "Alkali-activated fly ashes: A
cement for the future." Cement and Concrete Research 29(8): 1323-1329.
Pathan, S. M., Aylmore, L. A. G. and Colmer, T. D. (2003). "Properties of Several Fly
Ash Materials in Relation to Use as Soil Amendments." Journal of
Environmental Quality 32(2): 687.
Provis, J. L. and van Deventer, J. S. J. (2009). Geopolymers - Structure, Processing,
Properties and Industrial Applications, Woodhead Publishing.
Rangan, B. V. (2006). "Fly ash-based geopolymer concrete [2]." Indian Concrete
Journal 80(2): 35.
Topçu, I. B. and Uygunoǧlu, T. (2010). "Influence of mineral additive type on slump-
flow and yield stress of self-consolidating mortar." Scientific Research and
Essays 5(12): 1492-1500.

102
Van Jaarsveld, J. G. S., Van Deventer, J. S. J. and Lukey, G. C. (2002). "The effect of
composition and temperature on the properties of fly ash- and kaolinite-based
geopolymers." Chemical Engineering Journal 89(1-3): 63-73.

103
CHAPTER 6
Strength of Geopolymers in Saturated and Dry Conditions
6.1 Introduction
Concrete is the most widely used construction material (Raijiwala and Patil,
2010). Concrete structures were designed to withstand various types of environmental
conditions from mild conditions to very severe conditions (Kim et al., 2010). Resistance
to environment exposure inclusive of water exposure for reinforced concrete was dealt
with adequate concrete cover (Standard Australia, 2009). However, alternatives to
Ordinary Portland Cement (OPC) are gaining popularity due to the threat of global
warming. Carbon emissions due to concrete manufacture range between 0.3 to 0.4 ton
of CO2 per cubic meter of concrete is falling behind to only fossil fuels (oil, coal and
natural gas) in terms of man-made global carbon emissions (Sanjayan, 2010). Hence,
the new breed of concrete binder using geopolymer, a name coined by Davidovits in
1975, is the binder for the concrete of the future due to less CO2 emission (Davidovits,
1991; Van Jaarsveld et al., 2002).
In normal OPC concrete, water is not an issue due to the nature that OPC
hardening is a hydration process. Pore pressure effects in OPC concrete have been
reported to cause a difference between saturated and dry conditions up to about 5%
(Wang et al., 2009). This effect is normally ignored since it is in the same order of
magnitude of variation of test results normally observed in concrete testing. Further,
this difference between strengths in saturated and dry conditions has not been
104
consistently observed. Some early researchers reported that the saturated concrete is
slightly weaker than the dry concrete (Wittmann, 1973; Haynes, 1976) and attributed
this to the pore pressure in concrete. However, later researchers challenged this pore
pressure concept and found that there were no distinct differences between saturated
and dry conditions (Morley, 1979; Zielinski et al., 1981). In the design of concrete
structures the effect of any strength differences that may possibly exist between
saturated and dry concrete is not a consideration.
According to Davidovits (1989), water plays no roles in geopolymerization due to
no presence of any water or OH- in geopolymer structure even though there is
presence of water due to polymeric bond reaction of Al-O and Si-O in geopolymer
(Davidovits, 1991). There are very few researches works published on water effect on
geopolymer concrete. Steffens et al. (2003) investigated the effect of both water and
alkaline silica reaction (ASR) on reactive retaining wall found out that geopolymer
concrete exposed to water is susceptible to delamination degradation. Resistance to
water is an important durability parameter that needs investigation in construction
materials. The results presented in this chapter aimed to investigate the drying
(vacuum drying) and saturated (saturation in vacuum conditions) cycle in geopolymer
and its effect on strength. The results show substantial difference between saturated
and dry samples that cannot be simply explained by pore pressure concept.
6.2 Experimental Programme
6.2.1 Material
Manufacture of geopolymer requires an aluminosilicate source (such as
metakaolin or fly ash) and activators. The aluminosilicate source for the geopolymer
used in this study was fly ash sourced from Pozzolanic Gladstone in Queensland,
Australia. Chemical composition for this fly ash is shown is Table 6.1. Alkaline activator
used was the combinations of sodium silicate, Na2SiO3 and sodium hydroxide, NaOH
(molarity of 8.0M). Sodium silicate used in this experiment has a ratio of SiO to Na2O of
2. Sodium hydroxide of 8.0M solution comprises 26.2% of NaOH solids and 73.8% of
water (Rangan, 2006). The NaOH solution was mixed at least 24 hours prior to mixing
with fly ash. Sodium silicate and sodium hydroxide were mixed into form one activator
solution just a few minutes before the activator solution get mixed with fly ash to form
geopolymer mix.

105
Table 6.1: Chemical composition of fly ash (Kong and Sanjayan, 2010) Chemical Component (wt%)
Al2O3 27.0 SiO2 48.8 CaO 6.2
Fe2O3 10.2 K2O 0.85 MgO 1.4 Na2O 0.37 P2O5 1.2 TiO 1.3 BaO 0.19 MnO 0.15 SrO 0.16 SO3 0.22 ZrO2 -
Loss On Ignition (LOI) 1.7
6.2.2 Specimens Details
All specimens had dimension of 38 mm x 73 mm (diameter x height) and cast in
PVC moulds. The ratios of Na2SiO3 to NaOH were 2.5, 1.75 and 1.0. Alkaline solution
to fly ash ratio was kept constant at 0.4. Further specimens with 0.57 alkaline solution
to fly ash ratio and 2.5 Na2SiO3 to NaOH ratio were made to investigate the effect of
saturation and dry conditions of high strength geopolymer. The geopolymers were
prepared by using a mortar mixer for 3 minutes. After mixing, the geopolymer mix was
cast in moulds and vibrated on vibrating table for at least 5 minutes to ensure that there
are no voids in the specimens. The specimens were then cured in moulds in oven for
24 hours at a temperature of 60oC and 100% relative humidity.
6.2.3 Drying and Saturation Method
Cured specimens were removed from their moulds and top of the specimens
were ground flat by using grinding machine because saturated specimens need be to
test for compressive strength whilst it is fully saturated. The specimens were ground
before being saturated in order to measure the amount of water absorbed by the
specimens. The heights of the specimens were marginally reduced by not more than
0.4 mm when the specimens were ground.
Preparation of Saturated Specimens: The ground specimens were then placed in a
vacuum machine at -0.08 MPa pressure for 24 hours to dry. Dried specimens weights
were measured and then they were immersed in water. Immersed specimens with

106
water were then placed in a different vacuum machine with -0.08 MPa pressure for
another 24 hours to ensure that the saturation process is complete. The fully saturated
specimens’ weight was measured to calculate the amount of water absorbed by the
specimen.
Preparation of Dry Specimens: The dry specimens were prepared by drying in vacuum
machine at -0.08 MPa for 24 hours at room temperature.
6.2.4 Compressive Test
All specimens were tested by using a 250 kN capacity loading machine in
displacement control at a rate of 1 mm/min until failure. Maximum compressive axial
force was recorded. Dry specimens and saturated specimens were tested at the same
time to eliminate the effect of age on specimen strength.
6.2.5 Inductively Couple Plasma Test
In order to test that hypothesis that the effect of saturation in water is due to
leaching of chemicals in the immersing water, the water that was used to immerse the
geopolymer specimens were tested for chemicals that may have leached during the
geopolymer immersion. Inductively couple plasma (ICP) test were conducted on the
water used to immerse the specimens. The water was tested for chemical
concentration in parts per million (ppm) unit.
6.3. Result and Discussion
6.3.1 Compressive Strength
In dry condition, specimens with 0.4 alkaline solution to fly ash ratio produced
average compressive strength of 92.8 MPa, 90 MPa and 74.5 MPa for 2.5, 1.75 and
1.0 sodium silicate to sodium hydroxide ratios respectively. These results
demonstrated the trend that higher strength can be achieved by using higher sodium
silicate to sodium hydroxide ratio.
In saturated condition, the strengths of the specimens were less than the dry
condition. The saturated strengths were 77 MPa, 76 MPa and 64.4 MPa for 2.5, 1.75
and 1.0 sodium silicate to sodium hydroxide ratios respectively. These are 17%, 15.2
and 13.6% less than the dry strengths. Higher strength losses were recorded in higher

107
sodium silicate to sodium hydroxide ratio. Table 2-4 show compressive strength of
geopolymers in dry and saturated conditions.
Table 6.2: Result summary of geopolymers with 0.4 alkaline solution to fly ash ratio and 2.5 Na2SiO3 to NaOH ratio
Condition Specimen
No.
Dry Weight
(g)
Saturated
Weight (g)
Water
Absorption
(%)
Compressive
Strength (MPa)
Dry
1 156.3 - - 94.99
92.76
2 156.5 - - 90.74
3 156 - - 93.63
4 155.9 - - 89.20
5 156.3 - - 95.22
Saturated
1 156.5 162.7 4.0 87.44
76.98
2 156.1 163.3 4.6 77.00
3 157.2 163.8 4.2 84.74
4 155.2 162.4 4.6 66.85
5 150.2 156.7 4.3 68.84
Strength Reduction Percentage (%) : 17.0
Table 6.3: Result summary of geopolymers with 0.4 alkaline solution to fly ash ratio and 1.75 Na2SiO3 to NaOH ratio
Condition Specimen
No.
Dry Weight
(g)
Saturated
Weight (g)
Water
Absorption
(%)
Compressive
Strength (MPa)
Dry
1 154.6 - - 90.85
89.62
2 153.9 - - 85.14
3 154.6 - - 95.23
4 154.5 - - 90.10
5 155.1 - - 86.79
Saturated
1 155.9 162.6 4.3 56.07
75.99
2 155.3 162 4.3 76.30
3 155.9 162.5 4.2 85.54
4 154.7 161.6 4.5 81.58
5 155.2 161.6 4.1 80.48
Strength Reduction Percentage (%) : 15.2

108
Table 6.4: Result summary of geopolymers with 0.4 alkaline solution to fly ash ratio and 1.0 Na2SiO3 to NaOH ratio
Condition Specimen
No.
Dry Weight
(g)
Saturated
Weight (g)
Water
Absorption
(%)
Compressive
Strength (MPa)
Dry
1 155.5 - - 74.26
74.54
2 156.5 - - 75.52
3 156.8 - - 75.57
4 156.8 - - 70.70
5 155.2 - - 76.64
Saturated
1 155.8 161.5 3.7 68.06
64.40 2 156 161.7 3.7 63.36
3 155.6 161.4 3.7 67.29
4 155.8 161.7 3.8 58.88
Strength Reduction Percentage (%) : 13.6
The results in Tables 6.2 to 6.4 show that increasing Na2SiO3/NaOH ratio
increases the strength loss due to saturation. Figure 6.1 summarized the strength of
dry and saturated geopolymers. However, it should be noted that increasing Na2SiO3 /
NaOH ratio also coincides with increasing strength. The higher strength geopolymer
are likely to be more brittle which may have been responsible for damage when the
specimens were dried and saturated which forces the specimens to undergo shrinkage
and expansion during this process.
To verify that the strength is not the causal factor, same strength specimens as
Na2SiO3/NaOH ratio =1.0 (74.5 MPa) were made with Na2SiO3 / NaOH ratio = 2.5. This
was achieved by trial and error of alkaline solution to fly ash ratio and it was found a
ratio of 0.57 provided the closest strength of 76 MPa. The results of these tests are
provided in Table 6.5. The strength losses due to saturation in these specimens were
closest to the results in Table 6.2, hence the effect of strength can be eliminated as an
influencing factor.

109
Table 6.5: Result summary of geopolymers with 0.57 alkaline solution to fly ash ratio and 2.5 Na2SiO3 to NaOH ratio
Condition Specimen
No.
Dry Weight
(g)
Saturated
Weight (g)
Water
Absorption
(%)
Compressive
Strength (MPa)
Dry
1 152.6 - - 84.39
76.53
2 148.9 - - 73.97
3 152.3 - - 80.21
4 152.8 - - 64.58
5 152.8 - - 79.48
Saturate
d
1 152.1 159.1 4.6 51.99
64.57
2 151.4 158.6 4.8 77.39
3 152.6 159.5 4.5 56.51
4 151.6 159.1 4.9 62.46
5 151.2 158.6 4.9 74.49
Strength Reduction Percentage (%) : 15.6
6.3.2 Effect of Strength on Reduction of Strength in Saturated Geopolymer
It is postulated that the strength reduction in saturated samples may be due to
the high brittleness of the higher strength geopolymer. This is possible since drying and
saturation requires expansion and shrinkage which in high brittle materials can cause
damage to the specimen. Higher strength geopolymers demonstrate higher brittleness
as in normal OPC concrete. To investigate the brittleness effect, same strength
specimens were prepared by using the same activator solution with a Na2SiO3/NaOH
ratio of 2.5. Ratio of alkaline solution to fly ash was increased to 0.57 to lower the
specimens’ strength. Sodium silicate to sodium hydroxide ratio was set to 2.5. The
average compressive strength for these specimens was 74.2 MPa. The results from
these specimens show that even with lower strength, the reduction in strength was
similar which was 15.6% as opposed to 17.0% strength reduction for high strength
specimens with 0.4 alkaline solutions to fly ash ratio and 2.5 sodium silicate to sodium

110
hydroxide ratio. This clearly indicates that high strength was not a factor in strength
reduction of geopolymer exposed with saturated condition.
Figure 6.1: Compressive Strength of Dry and Saturated Geopolymer
6.3.3 Excess Sodium Silicate Factor
With the elimination of high strength factor, the only one factor effecting
strength of geopolymer in saturated condition is the amount of sodium silicate in the
mixture. Excess silicate leached out from the specimens when immersed in water
resulting in loss of strength. The leaching out of sodium silicate in the water used to
immerse specimens was observed when the water is more viscous and physically
condition like sodium silicate liquid. Eighty six ppm of sodium silicate was measured
from Inductively Couple Plasma test. Table 6.6 shows the chemical concentrations
measured in immersed water.
Table 6.6: ICP Test Results Chemical Components Concentration in ppm
Na2SiO3 86
CaO 0
FeO 5.78
MgO 5.9
Al2O3 0
Na2O 0

111
6.4 Conclusion
1. There is compressive strength reduction ranging from 13.6% to 17% for
geopolymer exposed to drying and saturation condition. Geopolymer
specimens with 2.5 ratio of Na2SiO3/NaOH and 0.4 alkaline solution to fly ash
ratio provides the highest average compressive strength of 92.8 MPa and the
highest average strength reduction of 17%.
2. Geopolymer specimens with 1.0 ratio of Na2SiO3/NaOH and 0.4 alkaline
solution to fly ash ratio provides the lowest average compressive strength of
74.5 MPa and the lowest average strength reduction of 13.6%.
3. Dry strength of geopolymer is not the influencing factor in the strength
reduction. This was proven by same strength but different Na2SiO3/NaOH ratio
specimens. The trend of increasing Na2SiO3/NaOH with increasing strength
reductions remained for the same strength specimens.
4. The strength reduction is caused by sodium silicate leaching out from
specimens when immersed in water. This conclusion was reached by
eliminating strength as the cause of this and by measuring leaching chemicals
in the immersing water.
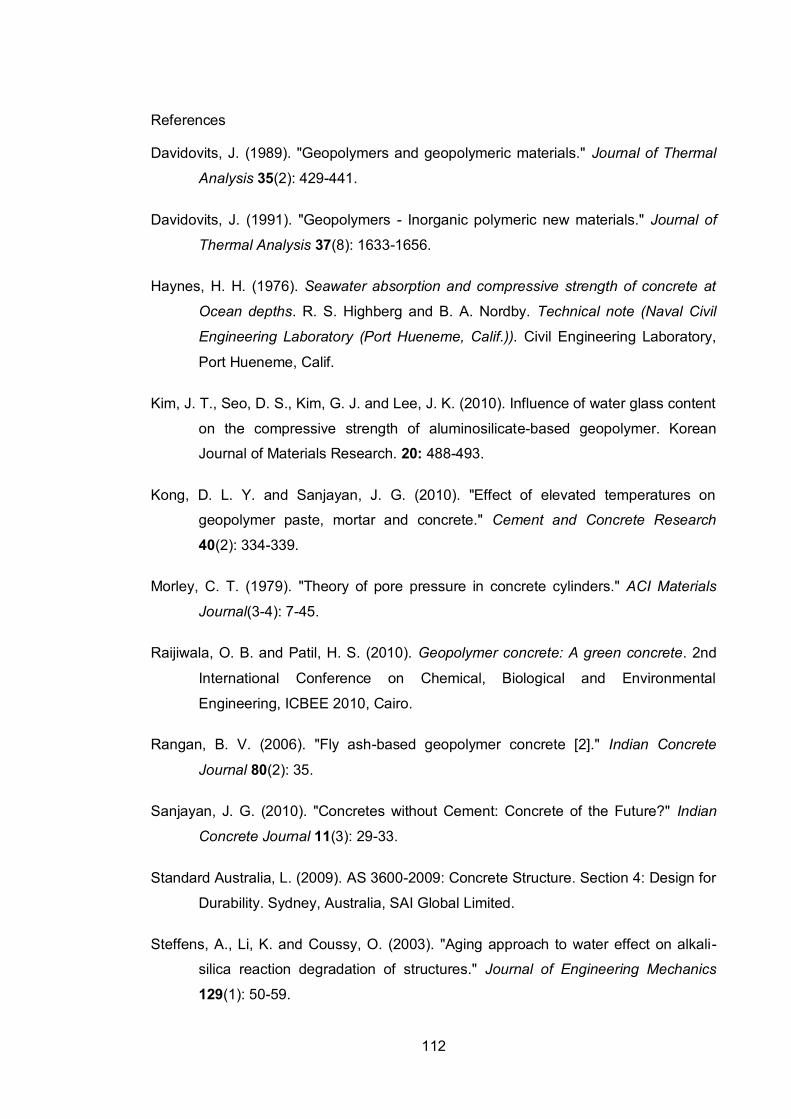
112
References
Davidovits, J. (1989). "Geopolymers and geopolymeric materials." Journal of Thermal
Analysis 35(2): 429-441.
Davidovits, J. (1991). "Geopolymers - Inorganic polymeric new materials." Journal of
Thermal Analysis 37(8): 1633-1656.
Haynes, H. H. (1976). Seawater absorption and compressive strength of concrete at
Ocean depths. R. S. Highberg and B. A. Nordby. Technical note (Naval Civil
Engineering Laboratory (Port Hueneme, Calif.)). Civil Engineering Laboratory,
Port Hueneme, Calif.
Kim, J. T., Seo, D. S., Kim, G. J. and Lee, J. K. (2010). Influence of water glass content
on the compressive strength of aluminosilicate-based geopolymer. Korean
Journal of Materials Research. 20: 488-493.
Kong, D. L. Y. and Sanjayan, J. G. (2010). "Effect of elevated temperatures on
geopolymer paste, mortar and concrete." Cement and Concrete Research
40(2): 334-339.
Morley, C. T. (1979). "Theory of pore pressure in concrete cylinders." ACI Materials
Journal(3-4): 7-45.
Raijiwala, O. B. and Patil, H. S. (2010). Geopolymer concrete: A green concrete. 2nd
International Conference on Chemical, Biological and Environmental
Engineering, ICBEE 2010, Cairo.
Rangan, B. V. (2006). "Fly ash-based geopolymer concrete [2]." Indian Concrete
Journal 80(2): 35.
Sanjayan, J. G. (2010). "Concretes without Cement: Concrete of the Future?" Indian
Concrete Journal 11(3): 29-33.
Standard Australia, L. (2009). AS 3600-2009: Concrete Structure. Section 4: Design for
Durability. Sydney, Australia, SAI Global Limited.
Steffens, A., Li, K. and Coussy, O. (2003). "Aging approach to water effect on alkali-
silica reaction degradation of structures." Journal of Engineering Mechanics
129(1): 50-59.

113
Van Jaarsveld, J. G. S., Van Deventer, J. S. J. and Lukey, G. C. (2002). "The effect of
composition and temperature on the properties of fly ash- and kaolinite-based
geopolymers." Chemical Engineering Journal 89(1-3): 63-73.
Wang, H., Jin, W. and Li, Q. (2009). "Saturation effect on dynamic tensile and
compressive strength of concrete." Advances in Structural Engineering 12(2):
279-286.
Wittmann, F. H. (1973). "Interaction of Hardened Cement Paste and Water." Journal of
the American Ceramic Society 56(8): 409-415.
Zielinski, A. J., Reinhardt, H. W. and Körmeling, H. A. (1981). "Experiments on
concrete under uniaxial impact tensile loading." Matériaux et Constructions
14(2): 103-112.

114
CHAPTER 7
Hydrocarbon Fire testing of Geopolymer High Strength
Concrete Wall Panels and Cylinders
7.1 Introduction
The needs for concrete structures to withstand fire condition are far more
demanding nowadays with numbers of concrete tunnels, petro-chemical’s plant and
other mega structures are being built all around the world. Due to high usage of
concrete as construction material, it is important to develop high fire resistance
concrete that can sustain structural integrity when exposed to fire event. Spalling
phenomena occurs during fire exposure in Portland cement high strength concrete and
factors influencing the amount of spalling have been extensively discussed in the
previous Chapters 2, 3 and 4.
Geopolymer concrete known as very high fire resistance material due to its ceramic-
like properties (Davidovits and Davidovics, 1991). Geopolymer concrete strength after
elevated temperature exposure can increase due to further geopolymerisation (Pan et
al., 2009). However, there are strength decrease of geopolymer concrete after elevated
temperature exposure especially geopolymer concrete with coarse aggregate. Thermal
incompatibilities due to difference thermal expansions between aggregates and binder

115
contributes to the decline in geopolymer concrete strength (Kong and Sanjayan, 2008).
The results in this chapter represent the performance of geopolymer high strength
concrete panel and cylinder exposed to hydrocarbon fire exposure. The amount of
spalling, temperature of wall panel at various depths, thermal diffusivity and residual
compressive strength after fire exposures are reported in this chapter.
7.2 Experimental Programme
7.2.1 Material
Aluminosilicate source for making geopolymer concrete in this study is fly ash.
The fly ash was sourced from Gladstone power station in Queensland. Gladstone fly
ash was selected because it has the best workability (Section 5.3.1) and most widely
used. Chemical composition of Gladstone fly ash is shown in Table 7.1.
Table 7.1: Chemical composition of Gladstone fly ash Chemical Component Weight (%)
Al2O3 25.56 BaO 0.09 CaO 4.3
Fe2O3 12.48 K2O 0.7 MgO 1.45 MnO 0.15 Na2O 0.77 P2O5 0.885 SO3 0.24 SiO2 51.11 TiO2 1.32 LOI* 0.57 Total 99.62
Sand for the geopolymer high strength concrete was sourced from Langwarrin quarry,
Melbourne. The sand absorbed 0.3% of water. Sand and coarse aggregate need to be
in saturated surface dry condition before mixing to prevent alkaline solution being
absorbed by sand and aggregate. Coarse aggregate maximum diameter was 14 mm
sourced from Oakland Junction, Hornsfel and supplied by ReadymixTM. Coarse
aggregate water absorption was 0.8%. Particle size distribution graphs for coarse
aggregate and sand are shown in Figure 7.1 and 7.2 respectively.

116
Figure 7.1: Aggregate Particle Size Distribution Graph
Figure 7.2: Sand Particle Size Distribution Graph
Sodium silicate and sodium hydroxide were used as alkaline activator for the
geopolymer high strength concrete. D grade sodium silicate was supplied by PQ
Australia. Table 7.2 shows the D grade sodium silicate specification. Sodium hydroxide
used has molarity of 8M. Sodium hydroxide was supplied by Orica Chemical with 99%
purity. Sodium hydroxide of 8.0M solution was made by mixing 26.2% of NaOH solids
and 73.8% of water (Rangan, 2006).
0
20
40
60
80
100
0.075 mm 2.36 mm 4.75 mm 6.7 mm 9.5 mm 13.2 mm
% P
assi
ng
Aggregate Particle Size Distribution Graph
Upper Limit
Aggregate Grading
Lower Limit
0
20
40
60
80
100
Pan 75 um 150 um 300 um 600 um 1.18 mm 2.36 mm 4.75 mm
% P
assi
ng
Sand Particle Size Distribution Graph
Upper Limit
Sand Grading
Lower Limit

117
Table 7.2: Sodium silicate specification Properties Specification
Na2O (% wt) 14.5 – 14.9
SiO2 (% wt) 29.1 – 29.7
Solids (% wt) 43.6 – 44.6
SiO2/ Na2O ratio 1.95 – 2.05
Density @ 20oC (g/cc) 1.50 – 1.53
Viscosity @ 20oC (cps) 250 – 450
7.2.2 Geopolymer Concrete Mix
Targeted compressive strength for geopolymer high strength concrete is 50
MPa. The geopolymer mix was determined by casting geopolymer paste in order to
obtain the optimum ratios of alkaline activator to fly ash and sodium silicate to sodium
hydroxide (Na2SiO3/NaOH). Geopolymer paste was made with alkaline activator to fly
ash ratio of 0.4. The Na2SiO3/NaOH ratio for alkaline solution was 2.5. The workability
of geopolymer paste was measured by using slump test in accordance to ASTM
C230/230M-08 (ASTM, 2010). Relative slump for geopolymer paste was 7.7 (Section
5.3.1).The geopolymer paste was moulded in a 35 mm (diameter) x 70 mm (height)
cylinder and cured for 24 hours at 60oC temperature in an oven. Average compressive
strength of geopolymer cylinders was 92.8 MPa. Sand was introduced in geopolymer
paste mix to form mortar. Ratio of sand to fly ash was 1.8. Similar curing regime was
carried out with geopolymer mortar. Average compressive strength for geopolymer
mortar was 74.5 MPa.
Coarse aggregates were then introduced in mortar mix to form geopolymer concrete.
The amount for coarse aggregate was calculated by using specific surface area
calculation. According to Neville (2010 ), specific surface areas for sand and coarse
aggregate with 14 mm diameter maximum size are 6.5 and 0.4 m2/kg respectively.
Based on these values, total sand surface area was calculated based on total sand
weight used in geopolymer mortar trial mix. The area was considered as total
aggregates surface area for geopolymer concrete. The area and weight ratios of
coarse aggregate to sand were 9 and 1.6 respectively. Sand and course aggregates
weights were calculated based on their respective specific surface area values.
Geopolymer concrete was cast in 100 mm (diameter) x 200 mm moulds and cured with
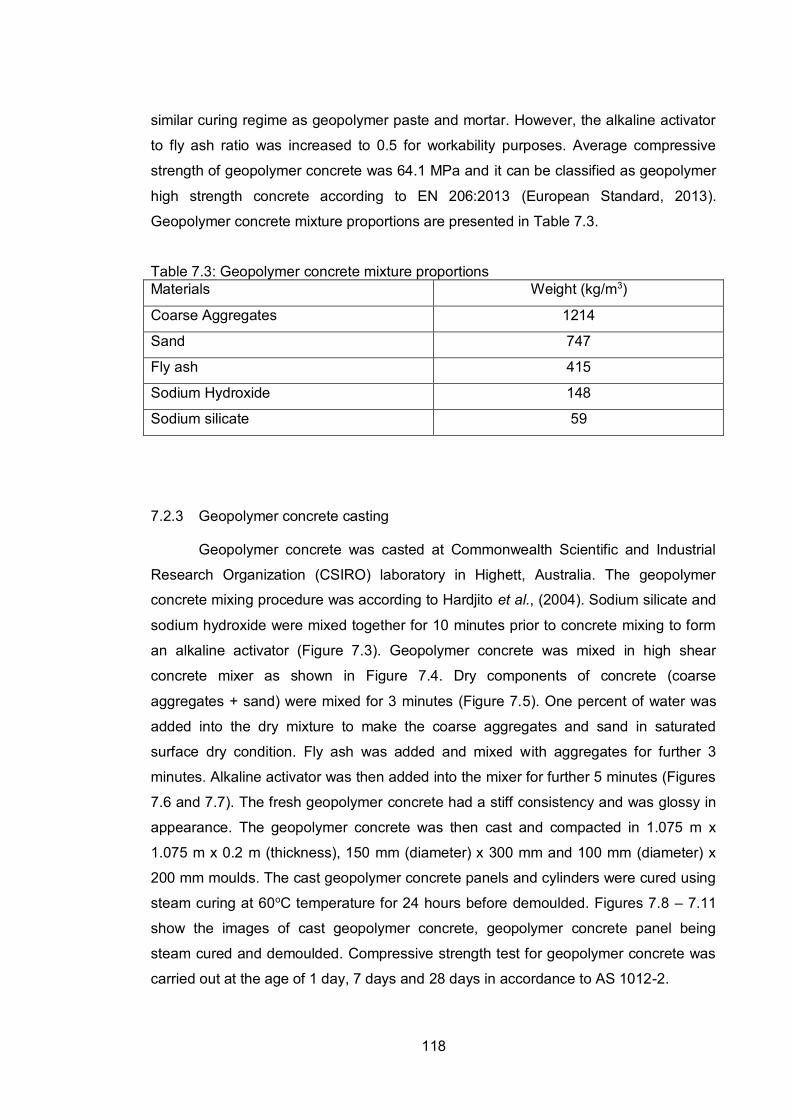
118
similar curing regime as geopolymer paste and mortar. However, the alkaline activator
to fly ash ratio was increased to 0.5 for workability purposes. Average compressive
strength of geopolymer concrete was 64.1 MPa and it can be classified as geopolymer
high strength concrete according to EN 206:2013 (European Standard, 2013).
Geopolymer concrete mixture proportions are presented in Table 7.3.
Table 7.3: Geopolymer concrete mixture proportions Materials Weight (kg/m3)
Coarse Aggregates 1214
Sand 747
Fly ash 415
Sodium Hydroxide 148
Sodium silicate 59
7.2.3 Geopolymer concrete casting
Geopolymer concrete was casted at Commonwealth Scientific and Industrial
Research Organization (CSIRO) laboratory in Highett, Australia. The geopolymer
concrete mixing procedure was according to Hardjito et al., (2004). Sodium silicate and
sodium hydroxide were mixed together for 10 minutes prior to concrete mixing to form
an alkaline activator (Figure 7.3). Geopolymer concrete was mixed in high shear
concrete mixer as shown in Figure 7.4. Dry components of concrete (coarse
aggregates + sand) were mixed for 3 minutes (Figure 7.5). One percent of water was
added into the dry mixture to make the coarse aggregates and sand in saturated
surface dry condition. Fly ash was added and mixed with aggregates for further 3
minutes. Alkaline activator was then added into the mixer for further 5 minutes (Figures
7.6 and 7.7). The fresh geopolymer concrete had a stiff consistency and was glossy in
appearance. The geopolymer concrete was then cast and compacted in 1.075 m x
1.075 m x 0.2 m (thickness), 150 mm (diameter) x 300 mm and 100 mm (diameter) x
200 mm moulds. The cast geopolymer concrete panels and cylinders were cured using
steam curing at 60oC temperature for 24 hours before demoulded. Figures 7.8 – 7.11
show the images of cast geopolymer concrete, geopolymer concrete panel being
steam cured and demoulded. Compressive strength test for geopolymer concrete was
carried out at the age of 1 day, 7 days and 28 days in accordance to AS 1012-2.

119
Figure 7.3: Alkaline activator’s mixer
Figure 7.4: High shear concrete mixer
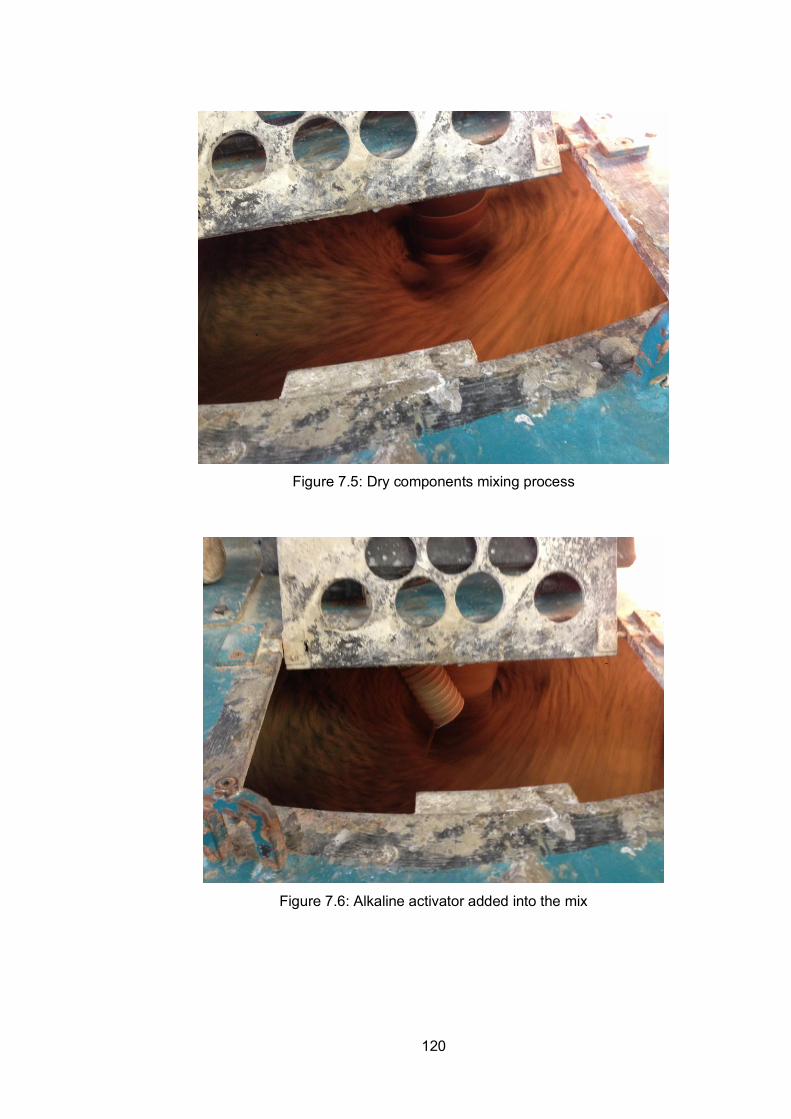
120
Figure 7.5: Dry components mixing process
Figure 7.6: Alkaline activator added into the mix
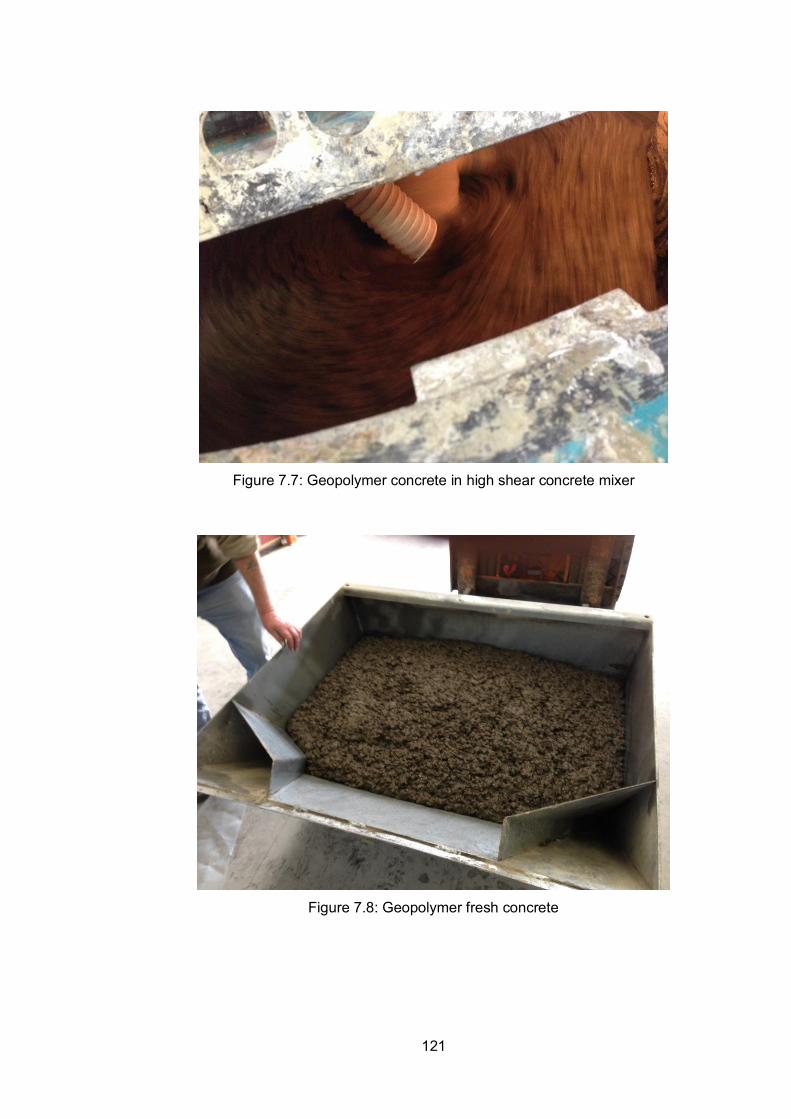
121
Figure 7.7: Geopolymer concrete in high shear concrete mixer
Figure 7.8: Geopolymer fresh concrete

122
Figure 7.9: Cast geopolymer concrete panel
Figure 7.10: Geopolymer concrete panel being steam cured
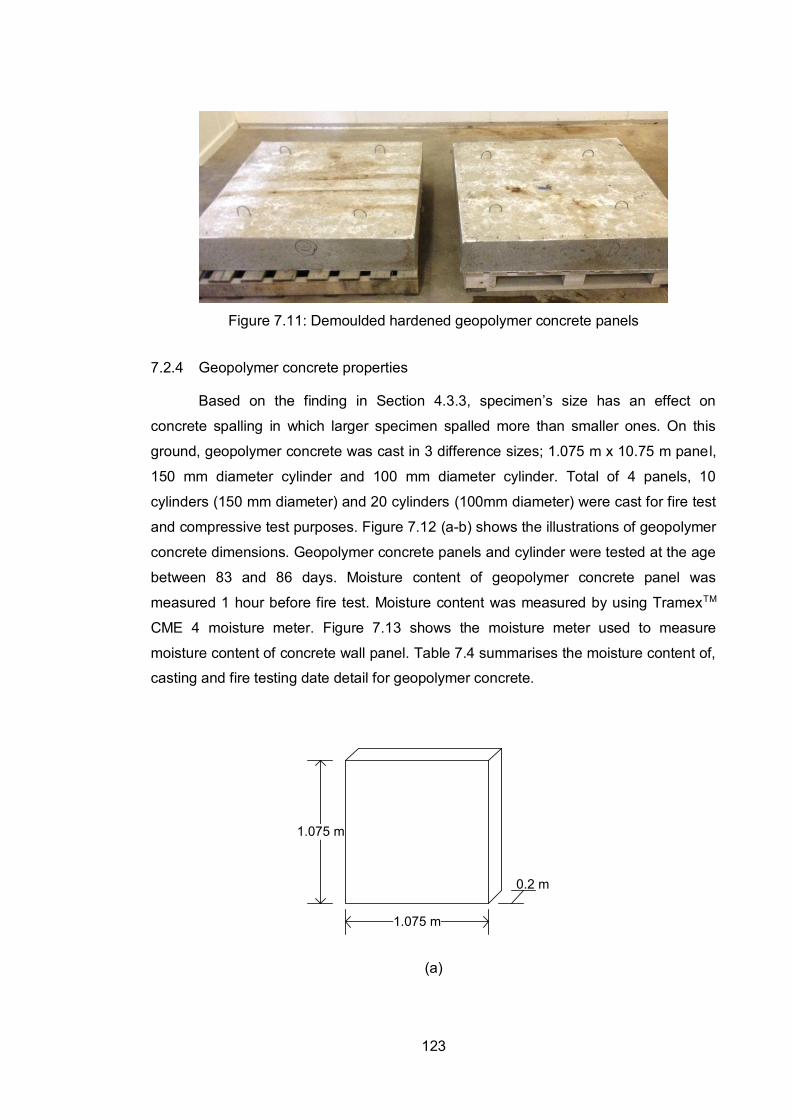
123
Figure 7.11: Demoulded hardened geopolymer concrete panels
7.2.4 Geopolymer concrete properties
Based on the finding in Section 4.3.3, specimen’s size has an effect on
concrete spalling in which larger specimen spalled more than smaller ones. On this
ground, geopolymer concrete was cast in 3 difference sizes; 1.075 m x 10.75 m panel,
150 mm diameter cylinder and 100 mm diameter cylinder. Total of 4 panels, 10
cylinders (150 mm diameter) and 20 cylinders (100mm diameter) were cast for fire test
and compressive test purposes. Figure 7.12 (a-b) shows the illustrations of geopolymer
concrete dimensions. Geopolymer concrete panels and cylinder were tested at the age
between 83 and 86 days. Moisture content of geopolymer concrete panel was
measured 1 hour before fire test. Moisture content was measured by using TramexTM
CME 4 moisture meter. Figure 7.13 shows the moisture meter used to measure
moisture content of concrete wall panel. Table 7.4 summarises the moisture content of,
casting and fire testing date detail for geopolymer concrete.
1.075 m
1.075 m
0.2 m
(a)

124
150 mm
300 mm
100 mm
200 mm
(b) Cylinders
Figure 7.12: Geopolymer concrete dimensions (a) panel (b) cylinders
Figure 7.13: TramexTM CME 4 moisture meter
Table 7.4: Moisture content and testing date details
Moisture
Content
(%)
Casting Date
(dd/mm/yyyy)
Fire Testing Date
(dd/mm/yyyy)
Age During
Fire Test
(days)
Panel 1 (P1) 4.1 02/09/2013 26/11/2013 86
Panel 2 (P2) 4.1 03/09/2013 26/11/2013 85
Panel 3 (P3) 4.0 04/09/2013 26/11/2013 84
Panel 4 (P4) 4.1 05/09/2013 26/11/2013 83
Cylinders N/A 02/09/2013 26/11/2013 86

125
Geopolymer concrete panels were reinforced with mild strength 6 mm diameter steel
bar and 100 mm spacing mesh. Reinforcement bars were located at the middle of the
concrete wall panel thickness. Figure 7.14 shows the reinforcement details for the
panels.
R6-100 cc
100 mm200 mm
1075 mm Figure 7.14: Reinforcement details for geopolymer concrete panel
7.2.5 Hydrocarbon fire test setup
Hydrocarbon fire temperature versus time in accordance to EN 1991-1-2 was
used for exposing the specimens. Standard fire curve is commonly used for testing for
fire exposures in buildings whereas the Hydrocarbon fire test is more suitable for
infrastructure applications where the concrete is likely to be exposed to fire originated
from hydrocarbons (eg. tunnels). More details for the reasons of using hydrocarbon fire
instead of standard fire in accordance to ISO 834:1999 was discussed in Section 3.2.5.
Equation 7.1 is the hydrocarbon fire temperature (BSI, 2005).
𝑇 = 1080(1 − 0.325𝑒−0.167𝑡 − 0.675𝑒−2.5𝑡) + 20 (Equation 7.1)
where T = Temperature (oC)
t = time (minute)
The fire tests were conducted for minimum of 120 minutes. The temperature of the
furnace (near exposed surface) were measured and recorded by the furnace’s
temperature sensor to the data logger.
Geopolymer concrete panels and cylinders were tested simultaneously. Panels and
cylinders furnace setup illustration and image are shown in Figure 7.15 and 7.16
respectively.
Thermocouples were installed in geopolymer concrete panel at the depth 25 mm, 50
mm, 75 mm, 100 mm, 125 mm, 150 mm, 175 mm and 200 mm measured from fire
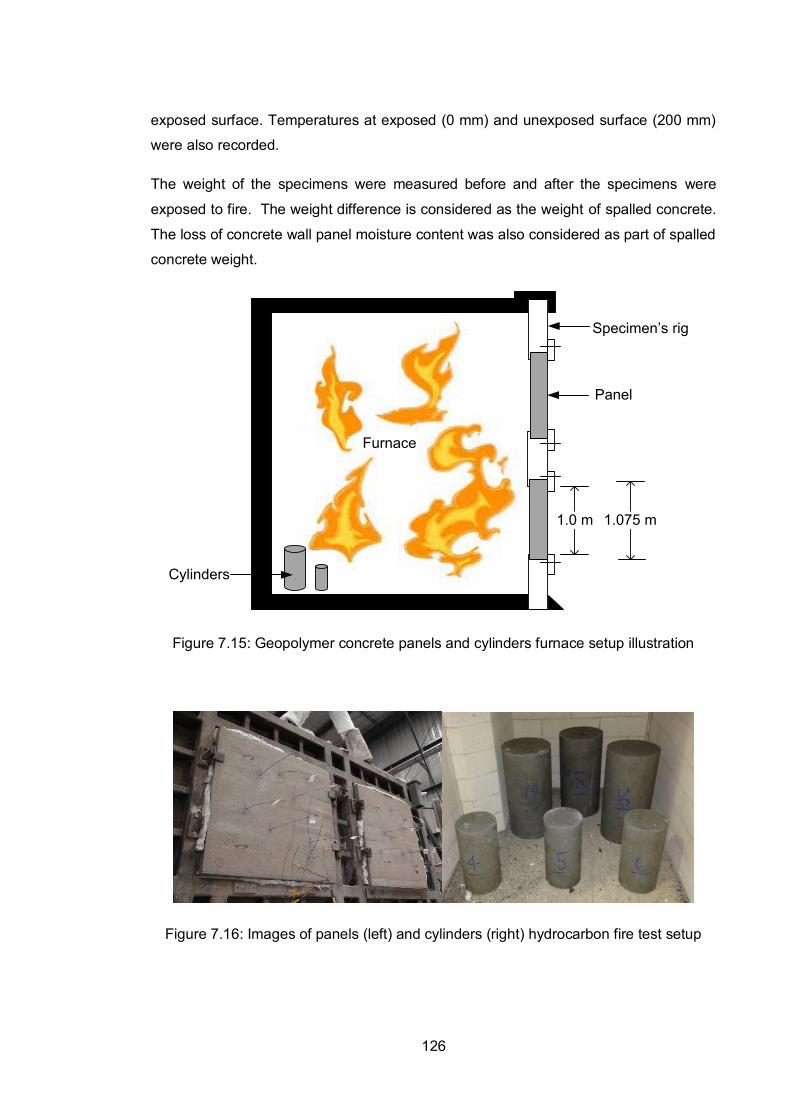
126
exposed surface. Temperatures at exposed (0 mm) and unexposed surface (200 mm)
were also recorded.
The weight of the specimens were measured before and after the specimens were
exposed to fire. The weight difference is considered as the weight of spalled concrete.
The loss of concrete wall panel moisture content was also considered as part of spalled
concrete weight.
Furnace
Panel
1.075 m1.0 m
Specimen’s rig
Cylinders
Figure 7.15: Geopolymer concrete panels and cylinders furnace setup illustration
Figure 7.16: Images of panels (left) and cylinders (right) hydrocarbon fire test setup

127
7.2.6 Thermal diffusivity
Thermal diffusivity is a thermal conductivity divided by the volumetric heat
capacity measured in mm2/s. It is a material specific thermal property which describes
how quickly a material reacts to a change in temperature. It is also a measurement of
thermal inertia of solids. The high thermal diffusivity in a material means the material
has high heat propagation rate and it can be classified as good heat conductor
material. Low thermal diffusivity value represents good fire resistant material due to
large heat storage capacity and/or low conductivity (Kaviany, 2011).
Thermal diffusivity for each specimen under fire test was calculated by using the Finite
Difference back calculation method at a depth of 25 mm measured from exposed
surface. Based on the temperature data from the fire test, thermal diffusivity values
were calculated on trial and error basis based on the general equation (Welty, 1974):
Equation 7.2
where K is thermal diffusivity
Central difference equation was used for second spatial derivative,
𝜕2𝑇
𝜕𝑥2 =𝑇𝑖+1
𝑛 −2𝑇𝑖𝑛+ 𝑇𝑖−1
𝑛
ℎ2 Equation 7.3
Where n = temperature at calculated time step
i = temperature at calculated thermal couple location (∆x = 50 mm)
h = total thickness for wall specimen
Forward equation was used for first time derivative,
𝜕𝑇
𝜕𝑡=
𝑇𝑖𝑛+1− 𝑇𝑖
𝑛
∆𝑡 Equation 7.4
where, ∆𝑡 = time interval
Therefore, the final equation for thermal diffusivity calculation was:
tT
xT
12
2

128
𝑇𝑖𝑛+1 = 𝐾∆𝑡 ⌊
𝑇𝑖+1𝑛 −2𝑇𝑖
𝑛+ 𝑇𝑖−1𝑛
ℎ2 ⌋ + 𝑇𝑖𝑛 Equation 7.5
Trial value for thermal diffusivity, K substituted in Equation 7.5 and the correct value of
thermal diffusivity is determined when the temperature, 𝑇𝑖𝑛+1 is calculated from thermal
diffusivity equation equates to the temperature from experimental data.
7.2.7 Compressive strength
Geopolymer concrete cylinders were tested at the age of 1 day, 7 days and 28
days. Geopolymer concrete almost reached full strength after 24 hours of 60oC heat
curing regime. Compressive strength test on cylinder was carried out in accordance to
AS 1012.9-1999.
Unspalled geopolymer concrete panels and cylinders after the fire test were also tested
for residual compressive strength. Compressive strength for fire tested geopolymer
concrete panels were carried out by using ProceqTM SilverSchmidt rebound hammer
(Figure 7.17). Fire tested 150 mm diameter and 100 mm diameter cylinders
compressive strength were tested as according to AS 1012.9-1999 (Standard Australia,
1999).
Figure 7.17: ProceqTM SilverSchmidt rebound hammer
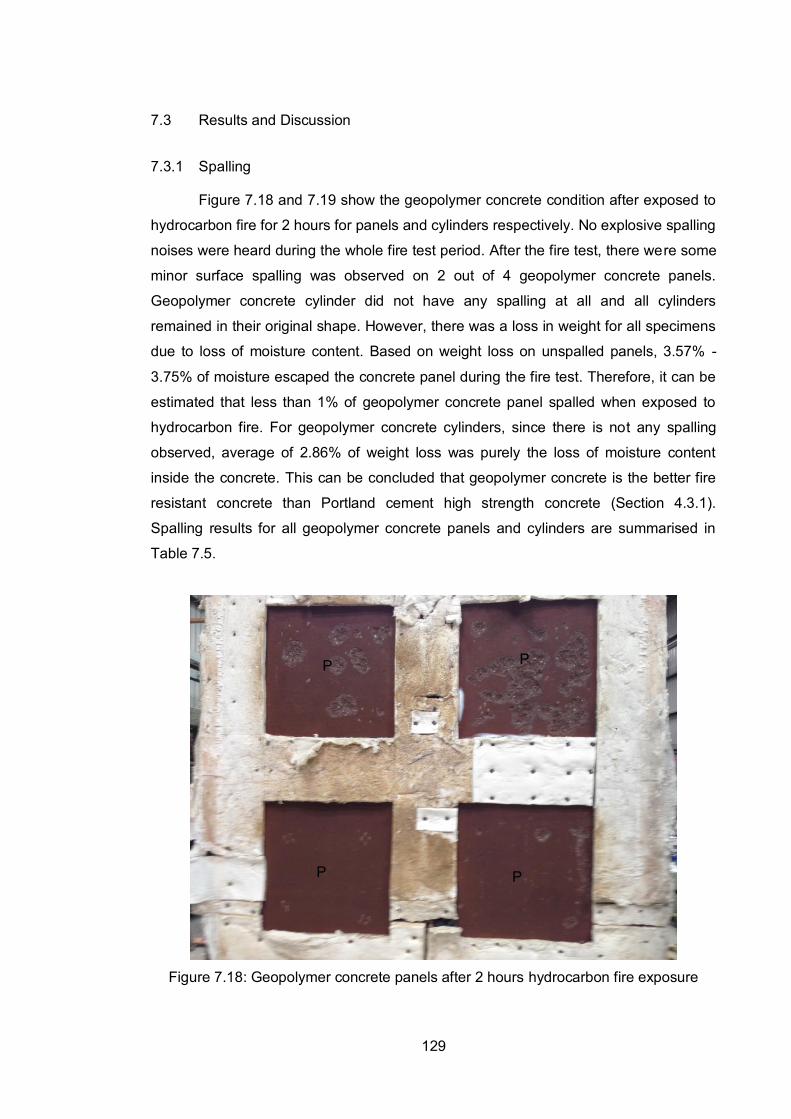
129
7.3 Results and Discussion
7.3.1 Spalling
Figure 7.18 and 7.19 show the geopolymer concrete condition after exposed to
hydrocarbon fire for 2 hours for panels and cylinders respectively. No explosive spalling
noises were heard during the whole fire test period. After the fire test, there were some
minor surface spalling was observed on 2 out of 4 geopolymer concrete panels.
Geopolymer concrete cylinder did not have any spalling at all and all cylinders
remained in their original shape. However, there was a loss in weight for all specimens
due to loss of moisture content. Based on weight loss on unspalled panels, 3.57% -
3.75% of moisture escaped the concrete panel during the fire test. Therefore, it can be
estimated that less than 1% of geopolymer concrete panel spalled when exposed to
hydrocarbon fire. For geopolymer concrete cylinders, since there is not any spalling
observed, average of 2.86% of weight loss was purely the loss of moisture content
inside the concrete. This can be concluded that geopolymer concrete is the better fire
resistant concrete than Portland cement high strength concrete (Section 4.3.1).
Spalling results for all geopolymer concrete panels and cylinders are summarised in
Table 7.5.
Figure 7.18: Geopolymer concrete panels after 2 hours hydrocarbon fire exposure
P
1
P
2 P
3v
P
4
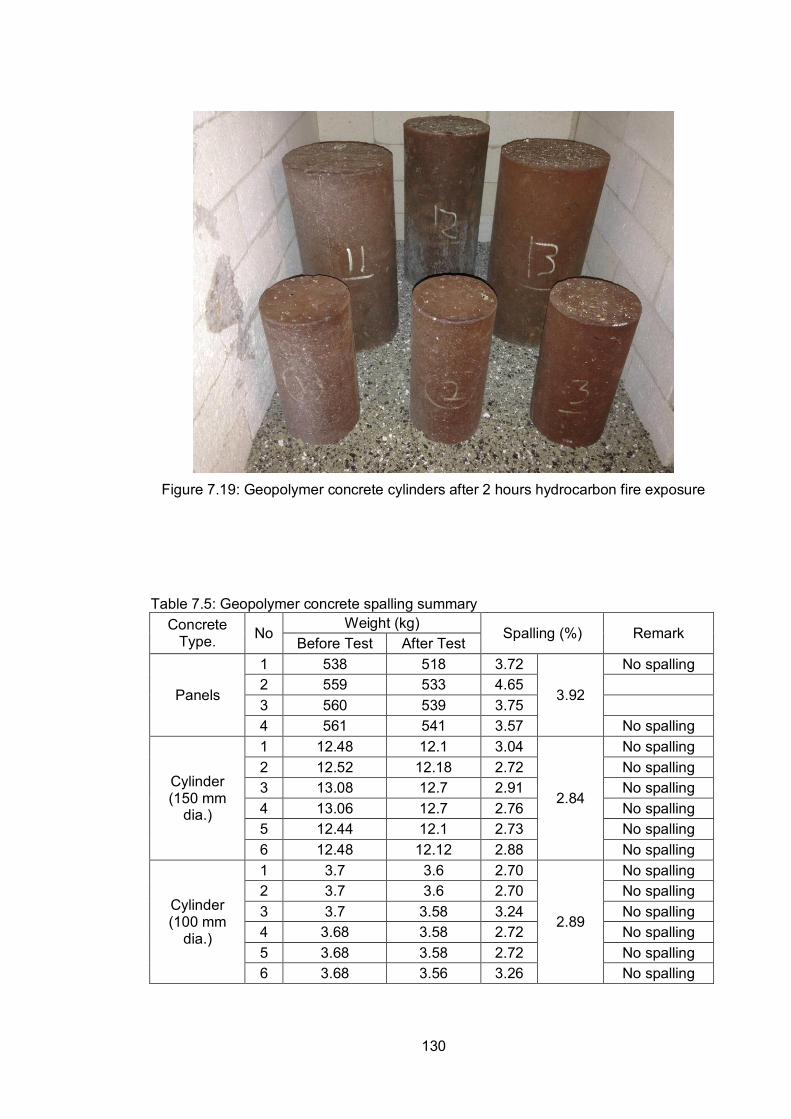
130
Figure 7.19: Geopolymer concrete cylinders after 2 hours hydrocarbon fire exposure
Table 7.5: Geopolymer concrete spalling summary Concrete
Type. No Weight (kg)
Spalling (%) Remark Before Test After Test
Panels
1 538 518 3.72
3.92
No spalling 2 559 533 4.65 3 560 539 3.75 4 561 541 3.57 No spalling
Cylinder (150 mm
dia.)
1 12.48 12.1 3.04
2.84
No spalling 2 12.52 12.18 2.72 No spalling 3 13.08 12.7 2.91 No spalling 4 13.06 12.7 2.76 No spalling 5 12.44 12.1 2.73 No spalling 6 12.48 12.12 2.88 No spalling
Cylinder (100 mm
dia.)
1 3.7 3.6 2.70
2.89
No spalling 2 3.7 3.6 2.70 No spalling 3 3.7 3.58 3.24 No spalling 4 3.68 3.58 2.72 No spalling 5 3.68 3.58 2.72 No spalling 6 3.68 3.56 3.26 No spalling

131
7.3.2 Temperature Results
Figures 7.20 – 7.22 show the geopolymer concrete temperature for every 25
mm depth of panels P1, P3 and P4. Unfortunately, several thermocouples for panel P2
malfunctioned and the data was not usable for any thermal analysis. From these
graphs, it is clear indication that geopolymer concrete has good heat resistant
properties. This can be observed from the temperature at depth more than 100 mm
from exposed surface ranging between 39oC to 45oC after 30 minutes of fire exposure
even though the temperature at exposed surface exceeds 1000oC.
Figure 7.20: Temperature for panel 1 (P1)
0
200
400
600
800
1000
1200
0 20 40 60 80 100 120
Tem
pera
ture
(C)
Time (minutes)
Temp at 0mmTemp at25 mmTemp at50 mmTemp at75 mmTemp at100 mmTemp at125 mmTemp at150 mmTemp at175 mmTemp at200 mm

132
Figure 7.21: Temperature for panel 3 (P3)
Figure 7.22: Temperature for panel 4 (P4)
The temperature gradient across panel’s depth was also high which represent the high
volume of heat capacity of geopolymer concrete. Figures 7.23 – 7.25 show the thermal
gradient of geopolymer concrete panel at first 10, 20 and 30 minutes. Figure 7.26
shows the temperature gradient across panel’s depth comparison between geopolymer
0
200
400
600
800
1000
1200
0 20 40 60 80 100 120
Tem
pera
ture
(C)
Time (minutes)
Temp at 0mmTemp at25 mmTemp at50 mmTemp at75 mmTemp at100 mmTemp at125 mmTemp at150 mmTemp at175 mmTemp at200 mm
0
200
400
600
800
1000
1200
0 20 40 60 80 100 120
Tem
pera
ture
(C)
Time (minutes)
Temp at 0mmTemp at25 mmTemp at50 mmTemp at75 mmTemp at100 mmTemp at125 mmTemp at150 mmTemp at175 mmTemp at200 mm

133
concrete and Portland cement concrete. It can be observed that temperature for
Portland cement HSC panels were higher compared to geopolymer concrete. It is
postulated that heat capacity of geopolymer concrete is higher than Portland cement
HSC. Furthermore, due to non-spalling nature of geopolymer concrete when exposed
to fire, the thickness of geopolymer concrete panels remain and thus provide more heat
resistance compared to spalled Portland cement HSC.
Figure 7.23: Temperature across thickness for panel 1
0
200
400
600
800
1000
1200
0 50 100 150 200
Tem
pera
ture
(C)
Distance From Exposed Surface (mm)
10 minute
20 minute
30 minute

134
Figure 7.24: Temperature across thickness for panel 3
Figure 7.25: Temperature across thickness for panel 4
0
200
400
600
800
1000
1200
0 50 100 150 200
Tem
pera
ture
(C)
Distance From Exposed Surface (mm)
10 minute
20 minute
30 minute
0
200
400
600
800
1000
1200
0 50 100 150 200
Tem
pera
ture
(C)
Distance From Exposed Surface (mm)
10 minute
20 minute
30 minute

135
Figure 7.26: Temperature across thickness comparison between geopolymer concrete
and Portland cement HSC
7.3.3 Thermal Diffusivity
Using the temperature data presented in Section 7.3.2, thermal diffusivity of
concrete was calculated at various temperatures using the method described in
Section 7.2.6. The calculation was based on temperature at the depth of 25 mm from
fire exposed surface. From the diffusivity graphs (Figure 7.23), the phenomenon as
described in Section 3.3.3 was observed where a drop in diffusivity values when the
temperature reaches between 105oC and 120oC. This phenomenon is due to water
changing phase and the thermal capacity drop at this point. At this temperature, water
in the concrete absorbs the heat to transform from liquid phase to steam.
Figure 7.27 also compares the thermal diffusivity of geopolymer concrete
panels and thermal diffusivity of same specimen’s size Portland cement high strength
concrete (HSC) with 14 mm maximum aggregate diameter. From the comparison, it is
clear that diffusivity of geopolymer concrete panel is lower than Portland HSC. Lower
diffusivity value is part of indication that geopolymer concrete has high heat storage
capacity. It makes geopolymer concrete more heat resistant than Portland HSC which
contributes to less spalling when exposed to hydrocarbon fire. The other factor that
may contribute to less spalling of geopolymer concrete is geopolymer binder itself.
Unlike hydration reaction in Portland cement which forms calcium-silicate-hydrate gel,
0
200
400
600
800
1000
1200
0 50 100 150 200
Tem
pera
ture
(C)
Distance From Exposed Surface (mm)
Geopolymer HSC (10 minutes)
Geopolymer HSC (20 minutes)
Geopolymer HSC (30 minutes)
Portland Cement HSC (10 minutes)
Portland Cement HSC (20 minutes)
Portland Cement HSC (30 minutes)

136
geopolymer is an aluminate and silicate reaction. It is postulated that geopolymer as a
binder does not shrink when exposed to fire and thus the reduced spalling amount.
Figure 7.27: Thermal diffusivity vs Temperature
7.3.4 Residual Compressive Strength After Fire Exposure
Geopolymer concrete achieved its strength at very early age. Under curing
regime of 60oC steam curing for 24 hours, the compressive strength of geopolymer
concrete was 54.1 MPa. Table 7.6 summarises density the compressive strength of
geopolymer concrete at the age of 1 day, 7 days and 28 days.
Table 7.6: Compressive Strength and Density Summary
Age No. Weight (g)
Density (kg/m3)
Compressive Strength (MPa)
1 day 1 3804 2422
2419 51.5
54.09 2 3808 2424 55.0 3 3789 2412 55.8
7 days 1 3808 2424
2430 56.2
56.06 2 3820 2432 56.0 3 3823 2434 56.0
28 days
1 3828 2437 2439
56.3 58.94 2 3840 2445 60.3
3 3827 2436 60.2 All geopolymer concrete panels and cylinders remained intact after 2 hours of
hydrocarbon fire exposure. Therefore, residual compressive strength of geopolymer
concrete could be measured. Residual compressive strength of a structure after fire
0.000.200.400.600.801.001.201.401.601.80
40 60 80 100 120 140 160 180 200 220
Diff
usiv
ity (m
2s-
1 ) x
10-
6
Temparature (C)
Diffusivity vs TemparaturePortland Cement HSC
Geopolymer HSC (1)
Geopolymer HSC (3)
Geopolymer HSC (4)
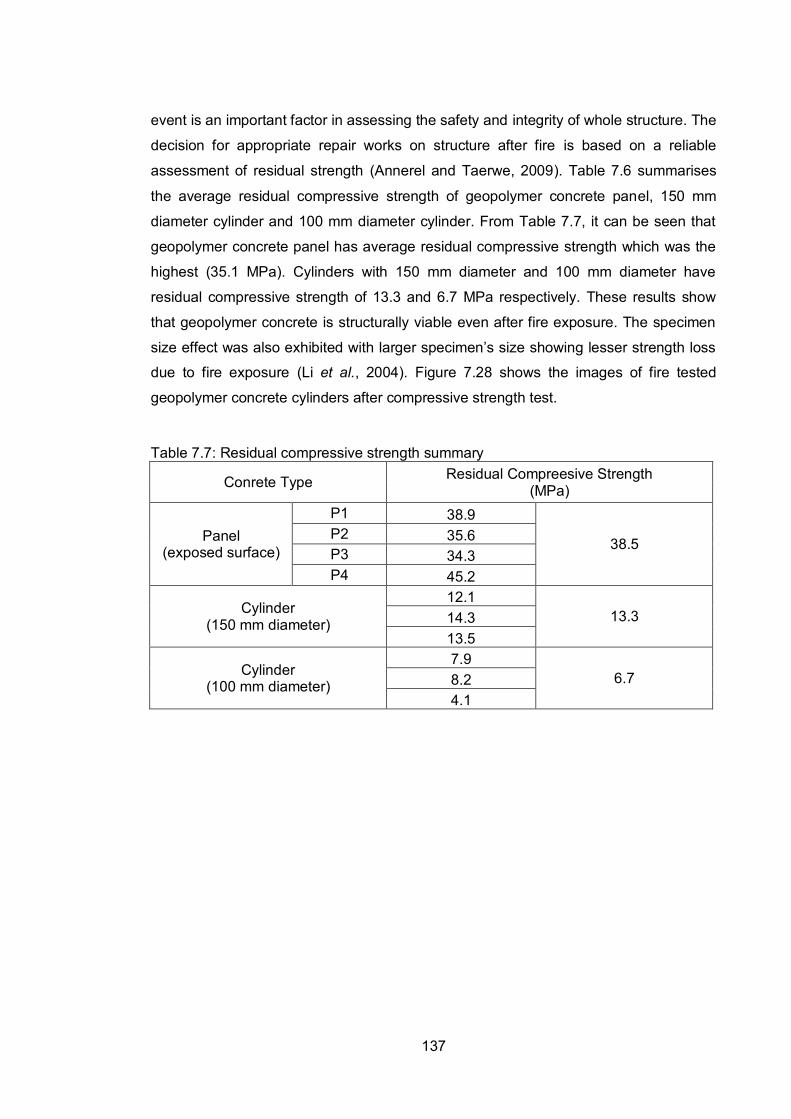
137
event is an important factor in assessing the safety and integrity of whole structure. The
decision for appropriate repair works on structure after fire is based on a reliable
assessment of residual strength (Annerel and Taerwe, 2009). Table 7.6 summarises
the average residual compressive strength of geopolymer concrete panel, 150 mm
diameter cylinder and 100 mm diameter cylinder. From Table 7.7, it can be seen that
geopolymer concrete panel has average residual compressive strength which was the
highest (35.1 MPa). Cylinders with 150 mm diameter and 100 mm diameter have
residual compressive strength of 13.3 and 6.7 MPa respectively. These results show
that geopolymer concrete is structurally viable even after fire exposure. The specimen
size effect was also exhibited with larger specimen’s size showing lesser strength loss
due to fire exposure (Li et al., 2004). Figure 7.28 shows the images of fire tested
geopolymer concrete cylinders after compressive strength test.
Table 7.7: Residual compressive strength summary
Conrete Type Residual Compreesive Strength (MPa)
Panel (exposed surface)
P1 38.9
38.5 P2 35.6 P3 34.3 P4 45.2
Cylinder (150 mm diameter)
12.1 13.3 14.3
13.5
Cylinder (100 mm diameter)
7.9 6.7 8.2
4.1

138
Figure 7.28: Fire tested geopolymer concrete cylinders 150 mm diameter (left) and 100
mm diameter (right) after compressive strength test
7.4 Conclusions
1 There were no explosive spalling observed during the whole length of
hydrocarbon fire test on geopolymer specimens. Panel 2 (P2) recorded the
highest geopolymer concrete spalling with 4.65% spalling percentage.
However, it is estimated that 3.57% - 3.75% of the weight loss was due to the
loss of moisture content during fire test. The estimation was based on loss of
weight for unspalled panels (P1 and P4). Thus, the spalling percentage of
geopolymer concrete was actually less than 1%. There was no spalling
observed on geopolymer concrete cylinders even though there were 2.84% and
2.86% weight loss for 150 mm diameter and 100 mm diameter respectively.
The weight loss was due to loss of moisture during fire test.
2 The diffusivity values for geopolymer concrete were lower than diffusivity values
for Portland cement high strength concrete (HSC). This is due to high
volumetric heat capacity of geopolymer concrete which can be related to better
heat resistant than Portland cement HSC.
3 There was residual compressive strength on geopolymer concrete after
hydrocarbon fire test. The fire tested geopolymer concrete panel, 150 mm

139
diameter cylinder and 100 mm diameter cylinder have 38.5, 13.3 and 6.7 MPa
compressive strength respectively. It proved that geopolymer concrete
structurally can withstand load even after being exposed to 2 hours of
hydrocarbon fire exposure. It can be concluded that geopolymer concrete is
good fire resistant construction material.

140
References
Annerel, E. and Taerwe, L. (2009). Approaches for the assessment of the residual
strength of concrete exposed to fire. Concrete Repair, Rehabilitation and
Retrofitting II - Proceedings of the 2nd International Conference on Concrete
Repair, Rehabilitation and Retrofitting, ICCRRR.
ASTM (2010). C230/C230M – 08: Standard Specification for Flow Table for Use in
Tests of Hydraulic Cement. West Conshohocken, Pennsylvania 19428-2959,
United States, ASTM International.
BSI (2005). BS EN 1991-1-2: Actions on Structures. Part 1 -2: General Actions -
Actions on structures exposed to fire. Brussels, European Committee for
Standardization.
Davidovits, J. and Davidovics, M. (1991). Geopolymer. Ultra-high temperature tooling
material for the manufacture of advanced composites. International SAMPE
Symposium and Exhibition (Proceedings).
European Standard (2013). IS EN 206:2013 Concrete - Specification, performance,
production, and conformity. Brussel, Belgium, European Committee for
Standardization
Hardjito, D., Wallah, S. E., Sumajouw, D. M. J. and Rangan, B. V. (2004). "On the
development of fly ash-based geopolymer concrete." ACI Materials Journal
101(6): 467-472.
Kaviany, M. (2011). Essential of Heat Transfer: Principals, Materials and Application.
Cambridge University Press, New York, USA.
Kong, D. L. Y. and Sanjayan, J. G. (2008). "Damage behavior of geopolymer
composites exposed to elevated temperatures." Cement and Concrete
Composites 30(10): 986-991.
Li, M., Qian, C. and Sun, W. (2004). "Mechanical properties of high-strength concrete
after fire." Cement and Concrete Research 34(6): 1001-1005.
Neville, A. M. (2010 ). Concrete technology J. J. Brooks. Prentice Hall Harlow, England
; New York : .

141
Pan, Z., Sanjayan, J. G. and Rangan, B. V. (2009). "An investigation of the
mechanisms for strength gain or loss of geopolymer mortar after exposure to
elevated temperature." Journal of Materials Science 44(7): 1873-1880.
Rangan, B. V. (2006). "Fly ash-based geopolymer concrete [2]." Indian Concrete
Journal 80(2): 35.
Standard Australia, L. (1999). AS 1012.9: Methods of testing concrete. Method 9:
Determination of the compressive strength of concrete specimens. Sydney,
Australia, Sai Global Limited: 3.
Welty, J. R. (1974). Engineering heat transfer. New York : Wiley, New York.

142
CHAPTER 8
Investigation on Aerated Geopolymer Wall Panels for Fire
Applications
8.1 Introduction
Concrete is susceptible to a phenomenon termed spalling in fire. Spalling of
concrete in fire is dislodgement of small pieces of concrete popping out from the
surface of concrete, often explosive in nature. Spalling occurs in the initial stages of the
fire, i.e., within 15 to 30 minutes (Sanjayan and Stocks, 1993; Crozier and Sanjayan,
2000). Spalling results in rapid loss of the surface layers of the concrete columns
exposing the steel reinforcement, which quickly loses strength when exposed to fire.
While many aspects of spalling behaviour of concrete are understood, some aspects of
the influence of various parameters in fire remain not fully understood. Further,
consensus has not been reached on the basic mechanism that causes the spalling.
Some research works indicate free water, vapour pressure and moisture gradients in
the concrete as main reason for explosive spalling (Anderberg, 1997; Hertz, 2003;
Kanema et al., 2011; Khaliq and Kodur, 2011). However, findings from Chapter 3 prove
that maximum stress that corresponds to maximum saturated steam temperature is low
and hence cannot to be considered as a main factor causing spalling.
The thermal incompatibility between the concrete binder and aggregates is the most
likely cause of strength loss in concrete specimens at elevated temperatures. The rate

143
of expansion of the aggregate with temperature is an influential factor in the
performance of concrete under elevated temperatures (Pan et al., 2009; Kong and
Sanjayan, 2010). The aggregate size is shown to have a significant effect on spalling of
concrete at high temperatures based on fracture process zone. Microcracks
accumulate around aggregates crack tip and a fracture process zone (lp) is created
along the main crack face (Pan et al., 2012).
Although geopolymer is chemically stable in high temperatures, the geopolymer
concrete deteriorates in fire due to the incompatibility between aggregates and the
binder. Therefore, in these trials, the aggregates were removed from the concrete mix
so that the aggregate effect can be eliminated. The results in this chapter represent the
performance of aerated geopolymer panels in room temperature and high temperature.
The room temperature properties such as bearing load capacity, axial load capacity,
corner bearing strength and flexural strength are reported in this chapter. Under high
temperature tests, spalling percentage, temperature in the panel and temperature
gradient when panels exposed to hydrocarbon fire are also presented and the
suitability of the panel to be used as fire resisting construction material was concluded.
8.2 Experimental Programme
8.2.1 Material
Aluminosilicate source for aerated geopolymer panel was fly ash. The fly ash
was sourced from Gladstone power station in Queensland. Gladstone fly ash was
selected because it has the best workability (Section 5.3.1). Chemical component of
Gladstone fly ash is shown in Table 8.1. Sand for the panels was sourced from
Langwarrin quarry, Melbourne. The sand was measured to have an absorption rate of
0.3% of water. Sand and coarse aggregate need to be in saturated surface dry
condition before mixing to prevent alkaline solution being absorbed by sand and
aggregate. Particle size distribution graph for sand is shown in Figure 8.1.

144
Table 8.1: Chemical component of Gladstone fly ash Chemical Component Weight (%)
Al2O3 25.56 BaO 0.09 CaO 4.3
Fe2O3 12.48 K2O 0.7 MgO 1.45 MnO 0.15 Na2O 0.77 P2O5 0.885 SO3 0.24 SiO2 51.11 TiO2 1.32 LOI* 0.57 Total 99.62
Figure 8.1: Sand Particle Size Distribution Graph
Sodium silicate and sodium hydroxide were used as alkaline activator for the aerated
geopolymer panel. Grade D sodium silicate was supplied by PQ Australia. Table 8.2
shows the D grade sodium silicate specification. Sodium hydroxide used has molarity
of 8M. Sodium hydroxide was supplied by Orica Chemical with 99% purity. Sodium
hydroxide of 8.0M solution was made by mixing 26.2% of NaOH solids and 73.8% of
water (Rangan, 2006). Aluminium powder was used to make the concrete aerated.
0
20
40
60
80
100
Pan 75 um 150 um 300 um 600 um 1.18 mm 2.36 mm 4.75 mm
% P
assi
ng
Sand Particle Size Distribution Graph
Upper Limit
Sand Grading
Lower Limit
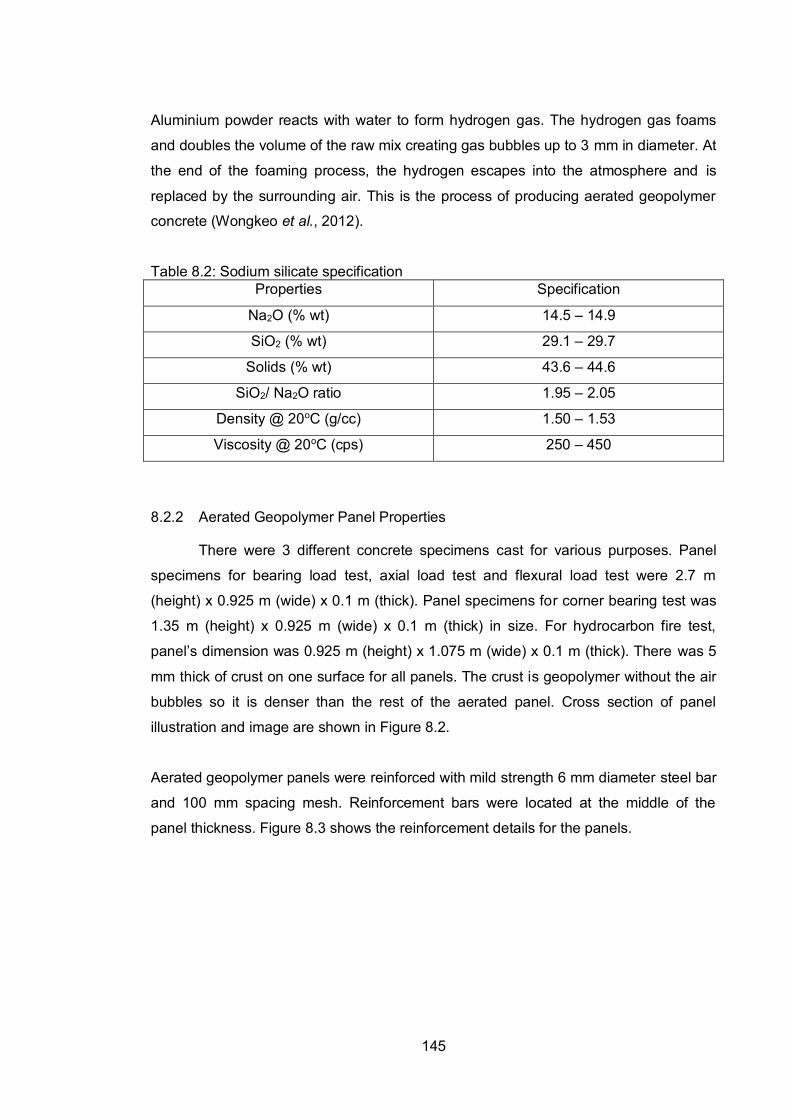
145
Aluminium powder reacts with water to form hydrogen gas. The hydrogen gas foams
and doubles the volume of the raw mix creating gas bubbles up to 3 mm in diameter. At
the end of the foaming process, the hydrogen escapes into the atmosphere and is
replaced by the surrounding air. This is the process of producing aerated geopolymer
concrete (Wongkeo et al., 2012).
Table 8.2: Sodium silicate specification Properties Specification
Na2O (% wt) 14.5 – 14.9
SiO2 (% wt) 29.1 – 29.7
Solids (% wt) 43.6 – 44.6
SiO2/ Na2O ratio 1.95 – 2.05
Density @ 20oC (g/cc) 1.50 – 1.53
Viscosity @ 20oC (cps) 250 – 450
8.2.2 Aerated Geopolymer Panel Properties
There were 3 different concrete specimens cast for various purposes. Panel
specimens for bearing load test, axial load test and flexural load test were 2.7 m
(height) x 0.925 m (wide) x 0.1 m (thick). Panel specimens for corner bearing test was
1.35 m (height) x 0.925 m (wide) x 0.1 m (thick) in size. For hydrocarbon fire test,
panel’s dimension was 0.925 m (height) x 1.075 m (wide) x 0.1 m (thick). There was 5
mm thick of crust on one surface for all panels. The crust is geopolymer without the air
bubbles so it is denser than the rest of the aerated panel. Cross section of panel
illustration and image are shown in Figure 8.2.
Aerated geopolymer panels were reinforced with mild strength 6 mm diameter steel bar
and 100 mm spacing mesh. Reinforcement bars were located at the middle of the
panel thickness. Figure 8.3 shows the reinforcement details for the panels.

146
Smoothed Surface
Aerated geopolymer
panel
Crust
0.1 m
5 mm
Figure 8.2: Aerated geopolymer panel cross section
R6-100 cc
50 mm100 mm
0.925 m Figure 8.3: Reinforcement details for aerated geopolymer panel
8.2.3 Room Temperature Test
Overall density of panel was measured based on total weight of the panel and
its volume. Moisture content of aerated geopolymer panel was measured 1 hour before
fire test. Moisture content was measured by using TramexTM CME 4 moisture meter.
Figure 8.4 shows the moisture meter used to measure moisture content of concrete
wall panel.

147
Figure 8.4: TramexTM CME 4 moisture meter
8.2.3.1 Bearing Load Test
This test was conducted to estimate the eccentric axial load capacity of the
panels when the panel is loaded vertically as shown in Figure 8.5. The load was
applied on the top with a 30 mm wide bearing strip with a load eccentricity of 25 mm
from the centre of the panel away from the crust. The bearing strip is a steel plate with
a thickness of 20 mm. The bottom of the panel was supported by a Granor rubber of
100 mm wide and 20 mm thick for the full width of the test panel. The reaction at the
bottom is expected to be distributed with the resultant being in line with the load at the
top. The load was applied under displacement control at the rate of 1 mm/min. The
load was applied until peak load is achieved.
30 mm
P
10 mm
Crust
Figure 8.5: Bearing load test setup

148
8.2.3.2 Axial Load Test
The axial load test was conducted to estimate the concentric axial load capacity
of the panels when the panel is loaded vertically as shown in Figure 8.6. The load was
applied on the top with a 100 mm wide bearing strip with a load eccentricity of 5 mm
from the centre of the panel away from the crust. The 5 mm (0.05D) is the minimum
eccentricity for loads recommended by AS3600 (Standard Australia, 2009). The
bearing strip is a steel plate with a thickness of 20 mm, i.e. two plates of 10 mm each.
The bottom of the panel was supported by a Granor rubber of 100 mm wide and 20
mm thick. The reaction at the bottom is expected to be distributed with the resultant
being in line with the load at the top. The load was applied under displacement control
at a rate of 1 mm/min. The load was applied until peak load is achieved.
55 mmP
Crust
Figure 8.6: Axial load test setup
8.2.3.3 Corner Bearing Test
Corner bearing tests were performed with a bearing pad at the top of 180 mm x
100 mm as shown in Figure 8.7. The panels tested were 1.35 m high and 0.925 m
wide. After the test was completed, the bearing pad was moved to the other corner and
the test was repeated. Therefore, there were four tests performed on 2 panels.

149
925 mm
1350 mm
180 mm
P
Figure 8.7: Corner bearing test setup
8.2.3.4 Flexural Load Test
Six flexural strength tests were conducted in a four point bending arrangement
as shown in Figure 8.8 with a span of 2.4 m. Three of the tests were conducted with
the crust on top and other three with the crust at the bottom. The load was applied with
a 100 mm Granor rubber and a steel square hollow section (SHS). The SHS wall
thickness is 7 mm. The load was applied under displacement control with a loading rate
of 1 mm/min.
2700 mm
800 mm 800 mm 800 mm
P/2 P/2
Figure 8.8: Flexural load test setup

150
8.2.4 Hydrocarbon Fire Test
8.2.4.1 Test setup
Hydrocarbon fire temperature versus time in accordance to EN 1991-1-2 was
used for exposing the specimens. The reason of using hydrocarbon fire instead of
standard fire in accordance to ISO 834:1999 was discussed in Section 3.2.5. Equation
8.1 is the hydrocarbon fire temperature (BSI, 2005) and temperature versus time curve
for hydrocarbon fire is shown in Figure 8.9.
𝑇 = 1080(1 − 0.325𝑒−0.167𝑡 − 0.675𝑒−2.5𝑡) + 20 (Equation 8.1)
where T = Temperature (oC)
t = time (minute)
Figure 8.9: Hydrocarbon temperature versus time curves
The fire tests were conducted for minimum of 120 minutes. The temperature of the
furnace (near exposed surface) were measured and recorded by the furnace’s
temperature sensor to the data logger.
Thermal couples were installed in geopolymer concrete panel at the depth 25 mm, 50
mm and 75 mm measured from fire exposed surface. Temperature at exposed (0 mm)
and unexposed surface (100 mm) were also recorded.
The weight of the specimens were measured before and after the specimens were
exposed to fire. The weight difference is considered as the weight spalled concrete.
0
200
400
600
800
1000
1200
0 30 60 90 120 150 180
Tem
pera
ture
(o C)
Time (min)
Hydrocarbon Temperature vs Time Curves

151
The loss of concrete wall panel moisture content was also considered as part of spalled
concrete weight.
Furnace
Panel
1.075 m1.0 m
Specimen’s rig
Figure 8.10: Aerated geopolymer concrete panels furnace setup illustration
Figure 8.11: Image of aerated geopolymer panels fire test setup
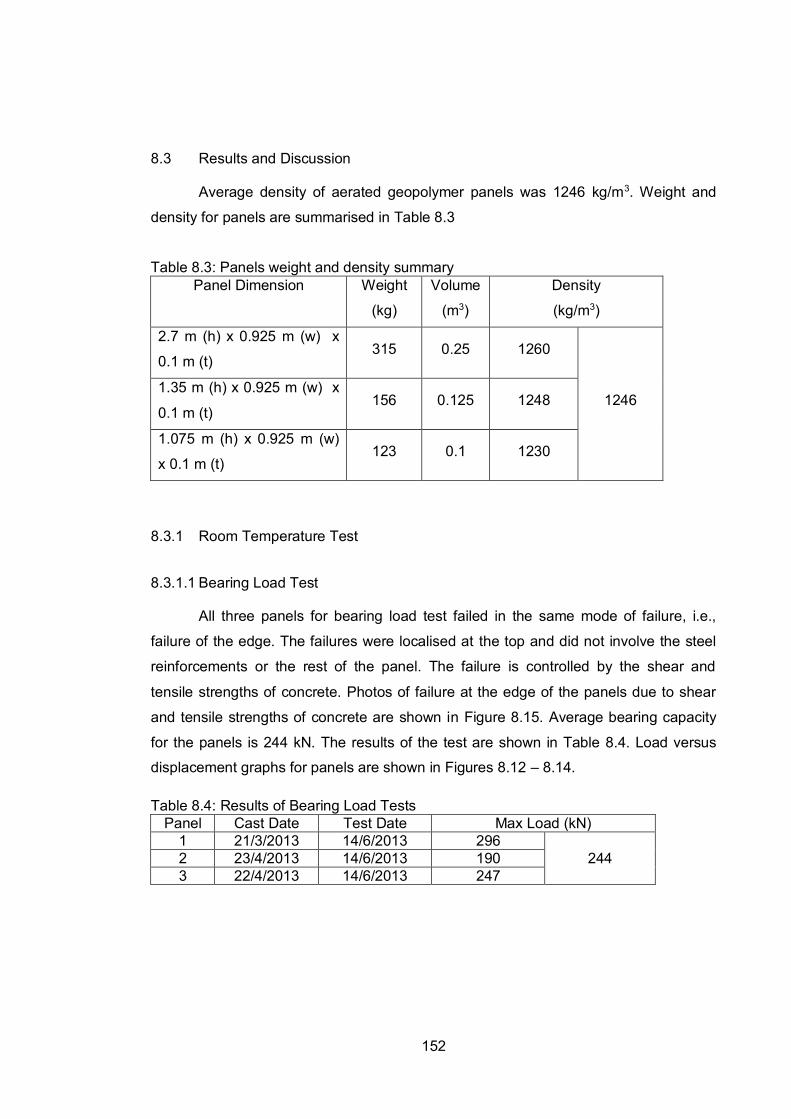
152
8.3 Results and Discussion
Average density of aerated geopolymer panels was 1246 kg/m3. Weight and
density for panels are summarised in Table 8.3
Table 8.3: Panels weight and density summary Panel Dimension Weight
(kg)
Volume
(m3)
Density
(kg/m3)
2.7 m (h) x 0.925 m (w) x
0.1 m (t) 315 0.25 1260
1246 1.35 m (h) x 0.925 m (w) x
0.1 m (t) 156 0.125 1248
1.075 m (h) x 0.925 m (w)
x 0.1 m (t) 123 0.1 1230
8.3.1 Room Temperature Test
8.3.1.1 Bearing Load Test
All three panels for bearing load test failed in the same mode of failure, i.e.,
failure of the edge. The failures were localised at the top and did not involve the steel
reinforcements or the rest of the panel. The failure is controlled by the shear and
tensile strengths of concrete. Photos of failure at the edge of the panels due to shear
and tensile strengths of concrete are shown in Figure 8.15. Average bearing capacity
for the panels is 244 kN. The results of the test are shown in Table 8.4. Load versus
displacement graphs for panels are shown in Figures 8.12 – 8.14.
Table 8.4: Results of Bearing Load Tests Panel Cast Date Test Date Max Load (kN)
1 21/3/2013 14/6/2013 296 244 2 23/4/2013 14/6/2013 190
3 22/4/2013 14/6/2013 247

153
Figure 8.12: Bearing load vs displacement graph for panel 1
Figure 8.13: Bearing load vs displacement graph for panel 2
Figure 8.14: Bearing load vs displacement graph for panel 3
0
50
100
150
200
250
300
350
0 1 2 3 4 5 6 7
Load
(kN
)
Displacement (mm)
Middle
Quarterfrom bottomQuarterfrom top
0
50
100
150
200
250
300
0 1 2 3 4 5 6 7
Load
(kN
)
Displacement (mm)
Middle
Quarter frombottom
Quarter fromtop
050
100150200250300350
-1 0 1 2 3 4 5 6 7
Load
(kN
)
Displacement (mm)
Middle
Quarter frombottomQuarter fromtop

154
Figure 8.15: Photos of panels’ shear failure after bearing load test
8.3.1.2 Axial Load Test
The Panel 1 failed by buckling of the wall as shown in the Figure 8.19. The
panels 2 and 3 had local failures similar to the bearing load tests failures except the
failures were localised at the bottom (Figure 8.20). The panel 1 had a small edge
failure around 420 kN, however, the failure was arrested from progressing and the final
failure occurred by buckling of the wall. This is likely to be due to some locally stronger
shear/tensile strength of the panel at the bottom. For the calculation of the variations,
the first minor failure observed at 420 kN will be taken. Average axial load capacity for
the panels is 408 kN. Figures 8.16 – 8.18 show load versus displacement graphs for
all panels. The results of the test are shown in Table 8.5.

155
Figure 8.16: Axial load vs displacement for panel 1
Figure 8.17: Axial load vs displacement for panel 2
0
100
200
300
400
500
600
700
800
-1 0 1 2 3 4 5 6 7 8 9 10 11 12 13
Load
(kN
)
Displacement (mm)
Middle
Quarter frombottom
Quarter fromtop
Local failure at the bottom commenced at 420 kN but the failure did not progress.
0
100
200
300
400
500
600
700
800
-1 0 1 2 3 4 5 6 7
Load
(kN
)
Displacement (mm)
Middle
Quarter frombottom
Quarter fromtop
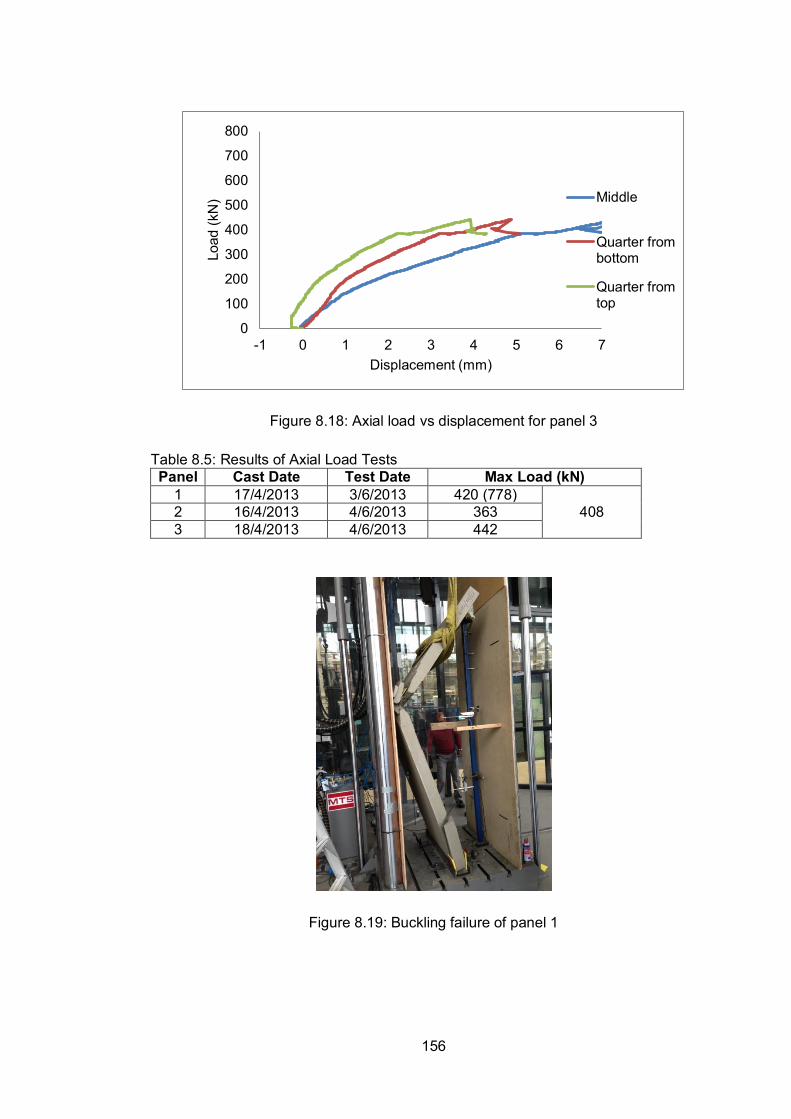
156
Figure 8.18: Axial load vs displacement for panel 3
Table 8.5: Results of Axial Load Tests Panel Cast Date Test Date Max Load (kN)
1 17/4/2013 3/6/2013 420 (778) 408 2 16/4/2013 4/6/2013 363
3 18/4/2013 4/6/2013 442
Figure 8.19: Buckling failure of panel 1
0
100
200
300
400
500
600
700
800
-1 0 1 2 3 4 5 6 7
Load
(kN
)
Displacement (mm)
Middle
Quarter frombottom
Quarter fromtop

157
Figure 8.20: Localised failure at bottom of panels after axial load test
8.3.1.3 Corner Bearing Test
Corner bearing load test failure had local failures similar to the axial load tests
failures (Figure 8.21). The failure is controlled by the shear and tensile strengths of
concrete. Average corner bearing capacity of the panels was 8.7 MPa. Results of
corner bearing tests are presented in Table 8.6.
Table 8.6: Results of Corner Bearing Tests Panel (Test #) Cast Date Test Date Max Load
(kN) Max Bearing Stress
(MPa) 1(1) 19/3/2013 19/6/2013 170 9.4
8.7 1(2) 19/3/2013 19/6/2013 157 8.7 2(3) 10/4/2013 19/6/2013 150 8.3 2(3) 10/4/2013 19/6/2013 147 8.2

158
Figure 8.21: Photos of panels after corner bearing test
8.3.1.4 Flexural Load Test
The flexural load versus displacement for panels with Crust up and Crust down
are shown in Figures 8.22 and 8.23 respectively. The first cracks were determined
when the first load drop was observed. The strength of concrete in the extreme fibre
location was assumed to be the flexural strength. Most of the cracks occur at mid-span
and near mid-span as shown in Figure 8.24. Average flexural strength recorded for
aerated geopolymer concrete was 1.4 MPa. The flexural strength of the panels
presented in Table 8.7 was calculated using the load at first crack. There is no
significant difference between Crust down and Crust up. Therefore, the all six samples
are considered together.
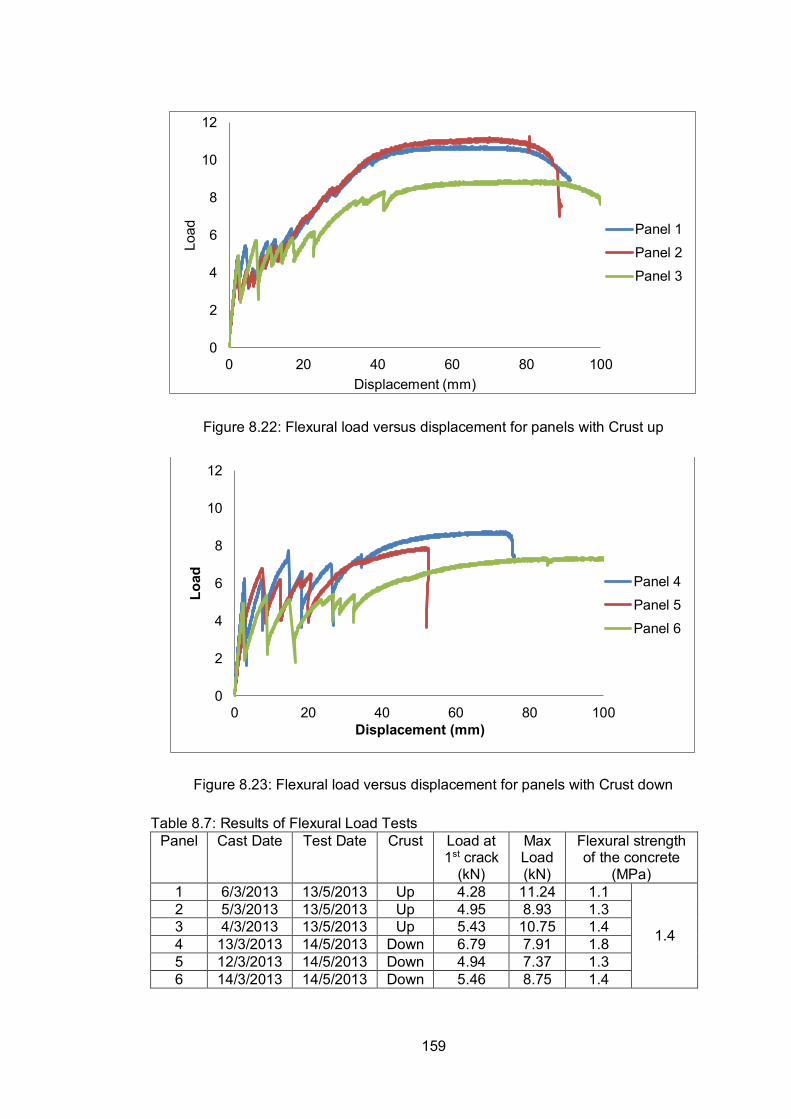
159
Figure 8.22: Flexural load versus displacement for panels with Crust up
Figure 8.23: Flexural load versus displacement for panels with Crust down
Table 8.7: Results of Flexural Load Tests Panel Cast Date Test Date Crust Load at
1st crack (kN)
Max Load (kN)
Flexural strength of the concrete
(MPa) 1 6/3/2013 13/5/2013 Up 4.28 11.24 1.1
1.4
2 5/3/2013 13/5/2013 Up 4.95 8.93 1.3 3 4/3/2013 13/5/2013 Up 5.43 10.75 1.4 4 13/3/2013 14/5/2013 Down 6.79 7.91 1.8 5 12/3/2013 14/5/2013 Down 4.94 7.37 1.3 6 14/3/2013 14/5/2013 Down 5.46 8.75 1.4
0
2
4
6
8
10
12
0 20 40 60 80 100
Load
Displacement (mm)
Panel 1
Panel 2
Panel 3
0
2
4
6
8
10
12
0 20 40 60 80 100
Load
Displacement (mm)
Panel 4
Panel 5
Panel 6

160
The following calculation shows the method that was used to calculate the flexural
strength for Panel 1.
The Maximum Bending Moment, M = (P/2)*0.8 = (4.28/2)*0.8 = 1.712 kNm
The flexural strength, ft = M/Z
Where Z = bD2/6 = 925*1002/6 = 1541.67 x 103 mm4
ft = 1.712*106 /1541.67 x 103 = 1.1 MPa
The maximum load recorded is sensitive to the position and strength of the steel
reinforcement. It is less sensitive to the compressive strength of the concrete and
entirely unrelated to the flexural strength of concrete. The variability in maximum load
observed is likely to be due to the variability in the position of the steel reinforcement.
To demonstrate this, a sensitivity analysis is presented in Table 8.8 that shows the
calculated maximum load using AS3600 formulae for three positions of steel
reinforcements, namely, in the middle, 50 mm (where it is supposed to be), and 40 mm
and 60 mm (where a +/- 10 mm movement that can occur during construction). The
strength of steel is likely to be between 550 MPa and 600 MPa since the characteristic
strength of steel is 500 MPa. The compressive strength of concrete is likely to be
around 10 MPa, but both 20 MPa and 30 MPa results are also shown to indicate the
insensitivity of the maximum load to compressive strength of concrete. The steel
reinforcements mesh used is SL62 - 6 mm bars at 200 mm spacing.
Table 8.8: Calculated Maximum Loads for various d, f’c and fy fy = 600 MPa fy = 550 MPa
da (mm) f’ca (MPa) 40 50 60 40 50 60
10 7.28 9.38 11.48 6.76 8.68 10.61 20 7.84 9.94 12.04 7.23 9.15 11.08 30 8.03 10.13 12.23 7.39 9.31 11.24
aReinforcement depth, d (mm); Concrete strength, f’c (MPa)
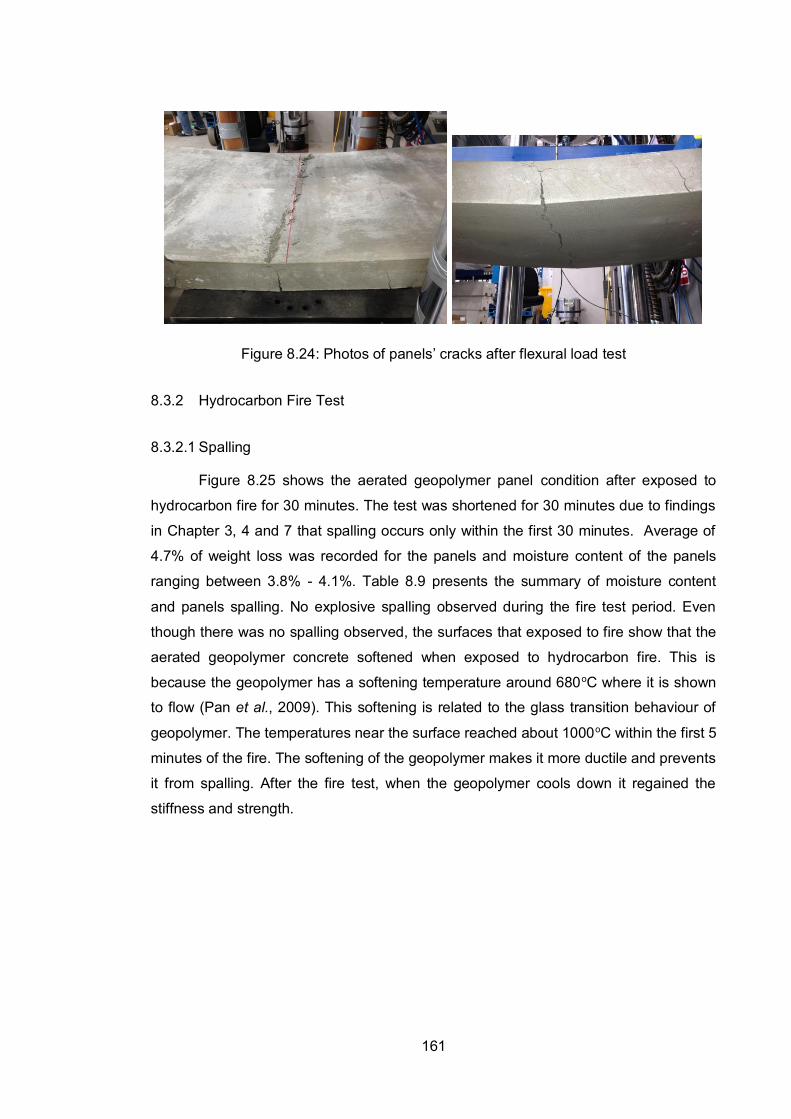
161
Figure 8.24: Photos of panels’ cracks after flexural load test
8.3.2 Hydrocarbon Fire Test
8.3.2.1 Spalling
Figure 8.25 shows the aerated geopolymer panel condition after exposed to
hydrocarbon fire for 30 minutes. The test was shortened for 30 minutes due to findings
in Chapter 3, 4 and 7 that spalling occurs only within the first 30 minutes. Average of
4.7% of weight loss was recorded for the panels and moisture content of the panels
ranging between 3.8% - 4.1%. Table 8.9 presents the summary of moisture content
and panels spalling. No explosive spalling observed during the fire test period. Even
though there was no spalling observed, the surfaces that exposed to fire show that the
aerated geopolymer concrete softened when exposed to hydrocarbon fire. This is
because the geopolymer has a softening temperature around 680oC where it is shown
to flow (Pan et al., 2009). This softening is related to the glass transition behaviour of
geopolymer. The temperatures near the surface reached about 1000oC within the first 5
minutes of the fire. The softening of the geopolymer makes it more ductile and prevents
it from spalling. After the fire test, when the geopolymer cools down it regained the
stiffness and strength.

162
Figure 8.25: Aerated geopolymer panels after 30 minutes hydrocarbon fire exposure
Table 8.9: Aerated geopolymer panel spalling summary
No Weight (kg) Moisture
Content (%) Weight Loss (%) Before Test After Test
Panels
1 125 118 4.1 5.6
4.7 2 122 117 3.8 4.1 3 122 117 3.8 4.1 4 123 117 3.8 4.9
8.3.2.2 Temperature Results
Figure 8.26 shows the aerated geopolymer panel temperature for every 25 mm
depth of panel. From this graph, it is a clear indication that aerated geopolymer panel
has a high heat resistant due to low density and cellular structure of the panel.
Temperature increment at depth more at 25 mm from exposed surface shows high
increment after 15 minutes of fire test.

163
Figure 8.26: Temperature for aerated geopolymer panel
The temperature gradient across panel’s depth was high due to the low density, high
porosity and cellular structure of the concrete itself. Figure 8.27 shows the temperature
profile (and thermal gradient) of aerated geopolymer panel at first 10, 20 and 30
minutes of fire exposure. This shows that the aerated geopolymer concrete wall is a
very effective insulating wall without any spalling observed. The use of aeration instead
of aggregates avoids any thermal incompatibility between aggregates and paste
problem hence the risk of spalling is reduced.
Figure 8.27: Temperature across thickness for panel 1
0
200
400
600
800
1000
1200
1400
0 5 10 15 20 25 30
Tem
per
atu
re (o
C)
Time (min)
Temp. at 0 mm
Temp. at 25 mm
Temp. at 50 mm
Temp. at 75 mm
Temp. at 100 mm
0
200
400
600
800
1000
1200
0 25 50 75 100
Tem
pera
ture
(C)
Distance From Exposed Surface (mm)
10 minute
20 minute
30 minute

164
8.4 Conclusions
1 Under room temperature tests, aerated geopolymer concrete panel bearing
load capacity, axial load capacity, corner bearing strength and flexural strength
are 244 kN, 408 kN, 8.7 MPa and 1.47 MPa respectively. The average density
of the panel was 1246 kg/m3.
2 No spalling was observed during 30 minutes of hydrocarbon fire exposure.
Average weight loss recorded for the panel was 4.7%. The weight loss is
inclusive of the 3.8% - 4.1% moisture content loss. It proves that thermal
incompatibility between coarse aggregate and binder is the main factor of
spalling in concrete with coarse aggregates.
3 Aerated geopolymer concrete is very suitable to be used as wall panel and can
be classified as a fire resistant construction material due to the load capacity
under room temperature and performance when exposed to hydrocarbon fire
exposure.

165
References
Anderberg, D. Y. (1997). Spalling Phenomena of HPC and OC.L. T. Phan, N. J. Carino,
D. Duthinh and Garboczi. NIST Workshop on Fire Performance of High
Strength Concrete, Gaithersburg. 69-73.
BSI (2005). BS EN 1991-1-2: Actions on Structures. Part 1 -2: General Actions -
Actions on structures exposed to fire. Brussels, European Committee for
Standardization.
Crozier, D. A. and Sanjayan, J. G. (2000). "Tests of load-bearing slender reinforced
concrete walls in fire." ACI Structural Journal 97(2): 243-251.
Hertz, K. D. (2003). "Limits of spalling of fire-exposed concrete." Fire Safety Journal
38(2): 103-116.
Kanema, M., Pliya, P., Noumowe, A. and Gallias, J. L. (2011). "Spalling, Thermal, and
Hydrous Behavior of Ordinary and High-Strength Concrete Subjected to
Elevated Temperature." Journal of Materials in Civil Engineering 23(7): 921-
930.
Khaliq, W. and Kodur, V. K. R. (2011). "Effect of High Temperature on Tensile Strength
of Different Types of High-Strength Concrete." ACI Materials Journal 108(4):
394-402.
Kong, D. L. Y. and Sanjayan, J. G. (2010). "Effect of elevated temperatures on
geopolymer paste, mortar and concrete." Cement and Concrete Research
40(2): 334-339.
Pan, Z., Sanjayan, J. G. and Kong, D. L. Y. (2012). "Effect of aggregate size on
spalling of geopolymer and Portland cement concretes subjected to elevated
temperatures." Construction & Building Materials 36: 365-372.
Pan, Z., Sanjayan, J. G. and Rangan, B. V. (2009). "An investigation of the
mechanisms for strength gain or loss of geopolymer mortar after exposure to
elevated temperature." Journal of Materials Science 44(7): 1873-1880.
Rangan, B. V. (2006). "Fly ash-based geopolymer concrete [2]." Indian Concrete
Journal 80(2): 35.

166
Sanjayan, G. and Stocks, L. J. (1993). "Spalling of high-strength silica fume concrete in
fire." ACI Materials Journal 90(2): 170-173.
Standard Australia, L. (2009). AS 3600-2009: Concrete Structures. Design Properties
of Materials. Sydney, Australia, SAI Global Limited. AS 3600-2009.
Wongkeo, W., Thongsanitgarn, P., Pimraksa, K. and Chaipanich, A. (2012).
"Compressive strength, flexural strength and thermal conductivity of autoclaved
concrete block made using bottom ash as cement replacement materials."
Materials & Design 35: 434-439.

167
CHAPTER 9
Summary, Conclusions and Recommendations
9.1 Summary
The performance of geopolymer concrete when exposed to hydrocarbon fire is
presented in this thesis. Full scale Portland cement high strength concrete wall panels
with the dimensions of 3.36 m (h) x 3.38 m (w) x 0.2 m (t) were fire tested under
hydrocarbon fire exposure for 2 hours. The results of these full scale tests are
presented in Chapter 3.
Further investigations of the specimen’s size, aggregate size and aggregate type effect
on the spalling of Portland cement high strength concrete were carried out. These
results are presented in Chapter 4. Variations of specimen’s sizes were tested by
testing large scale walls to small scale cylinders. For this work, 3.4 m square walls, 1 m
square walls, 400 mm square columns and 100 mm cylinders were tested. Aggregate
size effect was also tested by using 7 mm, 14 mm and 20 mm maximum aggregate
sizes. Two types of aggregates were tested, namely, basalt and granite types. A new
method of spalling parameter was introduced in this chapter namely spalling nominal
depth. Nominal depth is a parameter which represents the depth of spalled concrete
based on the amount of concrete spalling and the area of the specimen exposed to fire.
The severity of spalling for Portland cement high strength concrete was determined
and the next step of experimental work was to produce a concrete which have a good
fire resistance. Therefore, geopolymer concrete was selected due to its ceramic-like
168
properties. In Chapter 5, the fly ash which is the aluminosilicate source for geopolymer
concrete was determined based on workability judgement. Three types of fly ash from
three different sources were selected which are fly ash from Gladstone power station,
Tarong power station and Microash. Further investigations on fly ash physical and
chemical properties effect on fresh geopolymer workability were carried out.
Geopolymer is an aluminate and silicate reaction and not a hydration process like
Portland cement binder. Therefore, the strength of geopolymers in saturated and dry
conditions investigation is presented in Chapter 6. Several ratios of sodium silicate to
sodium hydroxide were tested in both saturated and dry condition. Two main factors
which are the leeching out of sodium silicate during saturation process and
geopolymer’s high strength were investigated.
In chapter 7, geopolymer high strength concrete was cast and exposed to hydrocarbon
fire. Geopolymer concrete mix was determined based on findings in Chapter 5 and 6.
The concrete specifications such as concrete dimensions, reinforcement details and
aggregate size were determined based on findings in Chapter 4. Geopolymer high
strength concrete was cast in three sizes which are 1.075 m (h) x 1.075 m (w) x 0.2 m
(t) panel, 150 mm (d) x 300 mm (h) cylinder and 100 mm (d) x 200 mm (h) cylinder.
The high strength geopolymer concrete wall panel casting procedures were also
presented in this chapter.
Further investigation on aerated geopolymer wall panels for fire application was carried
out (Chapter 8). Aerated geopolymer concrete can be widely used as wall panels due
to its lightweight. In this investigation, aerated geopolymer wall panels were exposed to
hydrocarbon fire.
9.2 Conclusions
Based on findings reported in this study, the following major conclusions are drawn:
1) Geopolymer concrete can be classified as a good fire resistance construction
materials based on spalling performance of both high strength and aerated
concrete when exposed to hydrocarbon fire. A maximum of 1% (excluding
water moisture loss) of spalling recorded for high strength geopolymer concrete
wall panel. No explosive spallings were observed for both high strength
geopolymer concrete and aerated geopolymer concrete.
2) Thermal diffusivity values of high strength geopolymer concrete ranged from
0.13 to 0.15 mm2s-1 when the temperature exceeds 120oC. This shows that the
insulating capacity of geopolymer concrete is larger than Portland cement high

169
strength concrete. Diffusivity values of Portland cement high strength for
temperature more than 120oC ranging from 0.5 to 0.7 mm2s-1. There were 6.7 –
38.5 MPa residual strength measured on high strength geopolymer concrete
after 2 hours of hydrocarbon fire exposure.
3) Portland cement high strength concrete spalled in an explosive manner when
exposed to hydrocarbon fire. Large panels spalled within the first 30 minutes of
fire exposure losing about 7% - 33% of the original weight. Thermal diffusivity
dropped sharply at temperatures which ranged from the temperatures of 110oC
and 155oC. This temperature can be described as phase changing steam
temperature. Maximum saturated steam pressure induced by the steam
corresponds to maximum saturated steam temperature of 155°C is 0.44 MPa.
This is significantly less that tensile strength of concrete which is estimated to
be 3 MPa. Hence, steam pressure itself is not a critical factor for concrete
spalling.
4) Specimen’s size and aggregate size do have effects on spalling of concrete.
The largest specimens with 3.36 m (h) x 3.38 m (w) x 0.2 m (t) dimension have
47.3 mm of average spalling nominal depth compared to 2.1 mm average
spalling nominal depth for 100 mm diameter cylinder. It shows that the lab scale
fire test is not representative of the severity of concrete spalling in actual fire
event. The aggregate size effect on spalling was prominent when the maximum
aggregate size increased from 7 mm to 20 mm. Specimens with 20 mm
maximum aggregate size spalling depth is less compared to specimens with 7
mm and 14 mm maximum aggregate size. In terms of aggregate type, there is
no clear trend observed on spalling for specimen with basalt and granite
aggregate.
5) Fly ash from Gladstone power station provides the best fresh geopolymer
workability compared to fly ash from Tarong power station and Microash.
Further investigations on physical properties of these fly ashes show that the
high porosity of Tarong fly ash due to particle agglomeration was the main
factor in low workability of the fresh geopolymer.
6) There is compressive strength reduction for geopolymer when exposed to
drying and saturation condition. Geopolymer specimens with 2.5 ratio of
Na2SiO3/NaOH and 0.4 alkaline solution to fly ash ratio provides the highest

170
average compressive strength of 92.8 MPa and the highest average strength
reduction of 17%. The strength reduction is caused by sodium silicate leeching
out from specimens when immersed in water. However, the strength reduction
of geopolymer is expected to be minimal when coarse aggregates and sand
were introduced to form geopolymer concrete.
9.3 Recommendations
There are several recommendations suggested for further research.
1) Future research needs to perform a hydrocarbon fire tests on a loaded
geopolymer high strength concrete. This will enhance the simulation of concrete
panel exposure to fire with the actual condition during a fire event.
2) Visualization of heat transfer by using heat camera during the fire test can
provides better knowledge on concrete thermal properties such as thermal
conductivity, thermal capacity and thermal diffusivity.
3) Workability improvement on high strength geopolymer concrete is an important
element in order to mass produce high strength geopolymer concrete. Better
workability of the concrete will enable geopolymer concrete to be mixed in
current concrete supplier facilities without altering any current Portland cement
mixing and delivering methods.
4) Utilization of fly ash other than the Gladstone fly ash such as Tarong fly ash,
brown coal ash and fly ash from power plants in Victoria can spread the
demand of high quality fly ash from Gladstone power plant. This is because the
demand from Gladstone fly ash expected to be very high in the near future.