Performance of Banking Sector Selected Companies Based … · A Project Report on Performance of...
38
A Project Report on Performance of Banking Sector Selected Companies Based on Macro and Micro Economic Variables A Project Report Submitted in Partial Fulfillment for the Award of the Degree of MASTER OF BUSINESS ADMINISTRATION JNTUH HYDERABAD Submitted By P. VIJAYALAKSHMI HT NO 11671E0134 MBA, JBIET [AUTONOMOUS] UNDER THE GUIDANCE OF INTERNAL GUIDE Mr. RAGHURAM REDDY JB INSTITUTE OF ENGINEERING & TECHNOLOGY (AUTONOMOUS) Accredited by NAAC, Approved by AICTE & Permanently affiliated to JNTUH Yenkapally, Moinabad (Mdl), Rangareddy (Dist) HYDERABAD-500075 (2011-2013)
Transcript of Performance of Banking Sector Selected Companies Based … · A Project Report on Performance of...
A Project Report on
Performance of Banking Sector Selected Companies Based on
Macro and Micro Economic Variables
A Project Report Submitted in Partial Fulfillment for the Award of the Degree of
MASTER OF BUSINESS ADMINISTRATION
JNTUH HYDERABAD
Submitted
By
P. VIJAYALAKSHMI
HT NO 11671E0134
MBA, JBIET [AUTONOMOUS]
UNDER THE GUIDANCE OF INTERNAL GUIDE
Mr. RAGHURAM REDDY
JB INSTITUTE OF ENGINEERING & TECHNOLOGY
(AUTONOMOUS)
Accredited by NAAC, Approved by AICTE & Permanently affiliated to JNTUH
Yenkapally, Moinabad (Mdl), Rangareddy (Dist)
HYDERABAD-500075
(2011-2013)

International Journal of Advance Research, Ideas and Innovations in Technology. ISSN: 2454-132X
© 2017, www.IJARIIT.com All Rights Reserved Page | 1054
STUDENT DECLARATION
DECLARATION I, P.VIJAYALAKSHMI, hereby declare that the project report titled ‘Performance of BANKING sector selected
companies based on macro and micro economic variables’, has been submitted to JNTUH through JBIET
AUTONOMOUS, in partial fulfillment of the requirement for the award of master’s degree in business
administration from JNTUH. I hereby declare that this project report has not been submitted to any other
institution for achieving any academic excellence.
P.VIJAYALAKSHMI
HT NO: 11671E0134
Place
Date

International Journal of Advance Research, Ideas and Innovations in Technology. ISSN: 2454-132X
© 2017, www.IJARIIT.com All Rights Reserved Page | 1055
ACKNOWLEDGEMENT
I express my sincere thanks to my supervisor Mr. Raghu Ram Reddy, Assistant professor for giving me moral
support, kind attention and valuable guidance to me throughout this project work.
It is my privilege to thank all Project Review Committee members for allowing me to do this project and
providing me all the facilities to do my project work.
I sincerely thank Principal Dr. V. N Rao, JBIET and I thank Dr. P. KAMESHWARI, HOD for her timely
suggestions, which helped me to complete this work successfully.
I thank both teaching and non-teaching staff members of MBA Department for their kind of cooperation and all
sorts of help to bring out this project work.
In all Sincerity,
P.VIJAYALAKSHMI (11671E0134)

International Journal of Advance Research, Ideas and Innovations in Technology. ISSN: 2454-132X
© 2017, www.IJARIIT.com All Rights Reserved Page | 1056
CONTENTS
Sl. No TITLE DESCRIPTION
1 CHAPTER 1
2 MEANING
3 NEEDS OF THE STUDY
4 OBJECTIVES OF THE STUDY
5 IMPORTANCE, PROS & CONS
6 SCOPE OF THE STUDY
7 LIMITATIONS
8 RESEARCH METHODOLOGY
9 REVIEW OF LITERATURE
10 CHAPTER 2
11 INDUSTRY PROFILE
BANKING SECTOR
12 COMPANY PROFILE
1. AXIS BANK
2. STATE BANK OF INDIA
3. YES BANK
4. UNION BANK OF INDIA
5. PUNJAB NATIONAL BANK
6. KOTAK MAHINDRA BANK
7. BANK OF BARODA
13 CHAPTER 3
14 DATA ANALYSIS AND INTERPRETATION
ANNUALIZED RETURNS OF BETA, TREYNOR, SHARPE RATIOS AND
JENSEN’S ALPHA
CHI-SQUARE TEST
GRAPHS FOR ANNUALIZED BETA, TREYNOR, SHARPE RATIOS AND
JENSEN’S ALPHA
PORTFOLIO’S OF BANKING SECTOR COMPANIES
GRAPHS OF BANKING SECTOR PORTFOLIO’S FOR THE PERIOD OF
APR TO JUN 2013
15 CHAPTER 4
16 FINDINGS
SUGGETIONS
17 CONCLUSIONS
18 BIBLIOGRAPHY
19 ANNEXURES

International Journal of Advance Research, Ideas and Innovations in Technology. ISSN: 2454-132X
© 2017, www.IJARIIT.com All Rights Reserved Page | 1057
Meaning of Title
This project is an effort to study the performance of BANKING sector companies listed in our title based on the
movement of equity share prices in cash markets which are an indication of the manner in which the information
is received, processed, assessed and reflected by the investing community in the country. Concepts like efficiency
market hypothesis which base themselves on the way in which the information about companies is internalized
by the capital markets are utilized for our study. As this is an experiential study two methods of activity are
implemented. A generalized risk diversified portfolio purchases and sales are made as well as a sector specific
intensive portfolio trades are also made for a period of 45 days. An investment methodology which incorporates
both the macro and micro economic variables is formulated and utilized for the purpose of selection of scripts
based on various informational inputs. The results of the portfolio are analyzed both on a daily basis and a period
basis using the following tools, viz: Treynor ratio, Sharpe ratio, and Jensen’s alpha, which are accepted as valid
barometers of the performance of a fund manager. The undersigned would be the fund manager for the limited
purpose of this project and the finally the alpha would indicate the success or failure of the experiment on which
this report is based.
Need for Research / RESEARCH GAP
There is a need to mix and match the best of fundamental analyses and technical analysis tools to arrive at a
universal investment strategy for which an effort is made here in this project
RESEARCH QUESTION
Whether the investment strategy as shown in the equation is valid in the Indian context.Return on investment -
=f(M,m, T) wherein the M indicates the macroeconomic indicators, m indicates the micro economic and firm
level indicators and T indicate the technical analysis tools which are used to time the market for entry or exit.
Definition of Our Investment Strategy
Return on investment is a factor of both macro and micro economic variables and timing of purchase and sale
based on various technical tools of investment.
ROI = F(M,m,T)
Macro Variables for Gauging/ Predicting the Market Mood
1. Movement of US market.
2. Movement of Japan market.
3. Movement of Hong Kong market.
4. Movement of Singapore market.
5. Movement of Europe market.

International Journal of Advance Research, Ideas and Innovations in Technology. ISSN: 2454-132X
© 2017, www.IJARIIT.com All Rights Reserved Page | 1058
6. Movement of the rupee dollar exchange rate.
7. FII money flow.
8. Movement of gold prices.
9. Movement of oil prices.
10. Movement of Treasury bill yield.
Micro Variables
1. Company financials and earning news
2. P/E ratio
3. Sales record or expectations
Technical Tools for Timing the Market
1. Spark lines graphs including yearly graph, monthly graph, and today graph
2. Moving average convergence divergence MACD
3. MFI – money flow index
4. Bollinger bands
5. Exponential Moving Average 20 day
6. RSI – relative strength index
7. Fast stochastic indicators like %K and its moving average of %D
8. Bar charts & candle charts
Outline of Proposed Steps in Data Analysis
This project makes use of the following concepts and tools:
Efficient market hypothesis
Portfolio formation or investment strategy
o Fundamental vs. technical analysis
o Technical analysis tools
Evaluation of portfolio – ratios
o Treynor ratio
o Sharpe ratio
o Jensen’s alpha

International Journal of Advance Research, Ideas and Innovations in Technology. ISSN: 2454-132X
© 2017, www.IJARIIT.com All Rights Reserved Page | 1059
OBJECTIVE OF STUDY
1. To test the efficiency of the market, weak form, semi strong form, strong form efficiency
2. To identify the cause effect or covariance between fundamental factors and market price movement and
arrival of some workable rules
3. The market expectation price vs. actual realized or published return
4. To link period of holding with the amount of return and evaluate the capacity of trader based on Jensen’s
alpha.
5. Performance of investor and portfolio evaluation based on Treynor ratio, Sharpe ratio, and Jensen’s
alpha.
HYPOTHESIS
NULL HYPOTHESIS
The investment strategy arrived at as above does not give a return which is better than the market indices. [If the
alpha for the overall/sectoral portfolio is zero or negative]
ALTERNATE HYPOTHESIS
The investment strategy as above gives a positive alpha i.e. a return which is better than the market indices. [If
the alpha for overall/sectoral portfolio is positive]
Research Design: This is an experiential virtual CUM real trading project based on ODIN platform of IDBI
CAPITAL LTD.
SCOPE OF STUDY
Portfolio made up of scripts purchased from all sectors to indicate diversified portfolio as well as scrips from
the chosen sector to represent the sectoral portfolio and compare the performance thereof with the return of the
market indices for the relevant period.
The Detailed Procedure of Calculation Adopted By the Researcher:
Return Profile - Company Wise
Return for - Day 1 Portfolio
Return for - Sectoral sub-Portfolio for the Day
BETA FOR ONE YEAR
RISK FREE RATE: 10 YEAR TREASURY BILLS YIELD
STANDARD DEVIATION

International Journal of Advance Research, Ideas and Innovations in Technology. ISSN: 2454-132X
© 2017, www.IJARIIT.com All Rights Reserved Page | 1060
INDEX RETURN – RETURN OF THE MARKET
Chi square result
[Observed – expected/ observed]
Treynor Ratio
Sharpe Ratio
Jensen’s Alpha
PERIOD OF STUDY: April to June 2013
SAMPLE: Judgmental sample made up of scripts purchased and sold based on above investment strategy
adopted by the researcher.
DATA COLLECTION
PRIMARY DATA
Prices of purchase and sale made on the stock exchange via the broker IDBI CAPITAL and their statistical and
mathematical procedure.
SECONDARY DATA
Market financial information, company financial information, sectoral financial and economic information,
news and current event information from all sources available.
LIMITATION OF STUDY DONE
The study was conducted for a short period representing the period allotted for our project.
The study was limited by the tools used as detailed in our investment strategy.
REVIEW OF LITERATURE
INTORDUCTION
Review of literature has vital relevance with any research work due to Literature review the possibility of a
repetition of study can be eliminated and Another dimension can be selected for the study. The literature review
helps Researcher to remove limitations of existing work or may assist to extend Prevailing study.
Several types of research have been conducted to analyze the different aspects of Performance of commercial
banks in India and abroad. But there are very few research and literature available on the subject related to
financial reforms and its impact on Indian banks. The available literature and research are divided into four major
parts according to the area of research i.e. literature.

International Journal of Advance Research, Ideas and Innovations in Technology. ISSN: 2454-132X
© 2017, www.IJARIIT.com All Rights Reserved Page | 1061
Related to:
1. Review of Literature related to Performance Appraisal of Banks.
2. Review of Literature related to Policy Framework and Recommendations for Banks.
3. Review of Literature related to Impact of Reforms on Indian Banks.
4. Review of Literature related to Service Quality of Indian Banks2.
The above mentioned literature have been obtained from following four major sources such as (i) Ph.D. research
conducted in India, (ii) The research / studies carried over by the institutions like RBI, ICRA Limited and business
magazines like Financial Express, Business Today, Money Outlook, Business India, etc. and (iii) Research
Studies of individual scholars published in Journals and magazines and (iv) websites of RBI, Govt. of India and
websites of various banks. The present study is undertaken in the light of the methodology adopted and
conclusions emerged in the earlier studies relating to the performance evaluation, financial reforms and their
impact on the Indian Banking sector. And a comparison between the two.
REVIEW RELATED TO DEVELOPMENT & PERFORMANCE
MEASURES
Prashanta Athma (2000), in his Ph.D. research submitted at Osmania University Hyderabad,
“Performance of Public Sector Banks – A Case Study of State Bank of Hyderabad made an attempt to evaluate
the performance of Public Sector Commercial Banks with special emphasis on State Bank of Hyderabad. The
period of the study for evaluation of performance is from 1980 to 1993-94, a little more than a decade. In this
study, Athma outlined the Growth and Progress of Commercial Banking in India and. analyzed the trends in
deposits, various components of profits of SBH, examined the trends in Asset structure, evaluated the level of
customer satisfaction and compared the performance of SBH with other PSBs, Associate Banks of SBI and SBI.
Statistical techniques like Ratios, Percentages, Compound Annual rate of growth and averages are computed for
the purpose of meaningful comparison and analysis. The major findings of this study are that since nationalization,
the progress of banking in India has been very impressive. All three types of Deposits have continuously grown
during the study period, though the rate of growth was highest in fixed deposits. A comparison of SBH
performance in respect of resource mobilization with other banks showed that the average growth of deposits of
SBH is higher than any other bank group. Profits of SBH showed an increasing trend indicating a more than
proportionate increase in spread than in burden. Finally, the majority of the customers have given a very positive
opinion about the various statements relating to counter service offered by SBH.

International Journal of Advance Research, Ideas and Innovations in Technology. ISSN: 2454-132X
© 2017, www.IJARIIT.com All Rights Reserved Page | 1062
Zacharias Thomas (1997) Ph.D. Thesis, ‘Performance effectiveness of Nationalized Bank
A Case Study of Syndicate Bank’, submitted to Cochin University (1997), Thesis studied the performance
effectiveness of Nationalized Bank by taking Syndicate Bank as a case study in his Ph.D. thesis. Thomas has
examined various aspects like growth and development of banking industry, achievements of Syndicate Bank in
relation to capital adequacy, quality of assets, Profitability, Social Banking, Growth, Productivity, Customer
Service and also made a comparative analysis of 'the Performance Effectiveness of Syndicate Bank in relation to
the Nationalized bank. A period of ten years from 1984 to 1993-94 is taken for the study. This study is undertaken
to review and analyze the performance effectiveness of Syndicate Bank and other Nationalized banks in India
using an Economic Managerial-Efficiency Evaluation Model (EMEE Model) developed by the researcher.
Thomas in this study found that Syndicate Bank got 5th Position in Capital adequacy and quality of assets, 15th
in Profitability, 14th Position in Social Banking, 8th in Growth, 7th in Productivity and 15th position in Customer
Service among the nationalized banks. Further, he found that five nationalized banks showed low health
performance, seven low priority performance and eleven low efficiency performance in comparison with
Syndicate Bank.
Vashisht (2004) studied recent global developments, which has transformed the environment in which
commercial banks operate. Globalization has expanded economic interdependence and interaction of countries
greatly. Under the regime of the globalized environment, the financial performance of the commercial banks has
changed and the commercial banks will face a new challenge and also new opportunities in the coming years.
ABOUT IDBI CAPITAL
IDBI Capital Market Services Ltd. (IDBI Capital) is a wholly owned subsidiary of IDBI Ltd. and a leading
Indian securities firm.
About Idbi Bank Ltd Which is the Holding Company Of Idbi Capital Ltd
IDBI Bank Ltd is one of India's largest commercial Banks. The Bank is a Universal Bank with their operations
driven by a cutting edge core Banking IT platform. The Bank operates in four segments, namely Wholesale
Banking, Retail Banking, Treasury Services and Other Banking Operations.
IDBI Bank Ltd was incorporated in the year 1964 as a wholly owned subsidiary of Reserve Bank of India with
the name Industrial Development Bank of India. It changed its name to Industrial Development Bank of India
Ltd. In 2005, Industrial Development Bank of India Ltd merged their banking subsidiary IDBI Bank with
themselves. The name of the bank was changed to IDBI Bank Ltd with effect from May 07, 2008.

International Journal of Advance Research, Ideas and Innovations in Technology. ISSN: 2454-132X
© 2017, www.IJARIIT.com All Rights Reserved Page | 1063
They formalized tie-ups with IDBI Capital Market Services Ltd, a 100% subsidiary of the Bank, with Motilal
Oswal Securities Ltd to offer state-of-the-art internet-based trading facility in Equities,
Futures and Options markets. They have six wholly-owned subsidiaries, namely IDBI Home finance Ltd, IDBI
Gilts Ltd, IDBI Intec Ltd, IDBI Capital Market Services Ltd, IDBI Asset Management Ltd and IDBI MF Trustee
Company Ltd.
Products and Services offered by IDBI CAPITAL
IDBI Capital offers a full suite of products and services to individual, institutional and corporate clients namely:
Stock Broking-Institutional and Retail (Through investment portal) Distribution of Financial Products Merchant
Banking Corporate Advisory Services Debt Arranging & Underwriting Managing Client Assets-Pension/PF fund
manager Research Services IDBI Capital is highly regarded for safety and trust and enjoys a credit rating of
"AAA" by CARE for its medium-term borrowings and P1+ by ICRA for its short-term borrowings. With over 50
lakh IDBI Flexi-Bond holders spread over 800 towns, IDBI has become a household name.
CHAPTER 2: INDUSTRY PROFILE AND COMPANY PROFILES
Sector Analysis: BANKING SECTOR
A bank is a financial institution and a financial intermediary that accepts deposits and channels those deposits
into lending activities, either directly or through capital markets. A bank connects customers that have capital
deficits to customers with capital surpluses.
Due to their critical status within the financial system and the economy generally, banks are highly regulated in
most countries. They are generally subject to minimum capital requirements which are based on an international
set of capital standards, known as the Basel Accords.
Banking in India originated in the last decades of the 18th century. The first banks were The General Bank of
India, which started in 1786, and Bank of Hindustan, which started in 1790; both are now defunct. The oldest
bank in existence in India is the State Bank of India, which originated in the Bank of Calcutta in June 1806, which
almost immediately became the Bank of Bengal. This was one of the three presidency banks, the other two being
the Bank of Bombay and the Bank of Madras, all three of which were established under charters from the British
East India Company. For many years the Presidency banks acted as quasi-central banks, as did their successors.
The three banks merged in 1921 to form the Imperial Bank of India, which, upon India's independence, became
the State Bank of India in 1955.

International Journal of Advance Research, Ideas and Innovations in Technology. ISSN: 2454-132X
© 2017, www.IJARIIT.com All Rights Reserved Page | 1064
Structure of Indian Banking
As per Section 5(b) of the Banking Regulation Act 1949: “Banking” means the accepting, for the purpose of
lending or investment, of deposits of money from the public, repayable on demand or otherwise, and
withdrawal by cheque, draft, order or otherwise.”
All banks which are included in the Second Schedule to the Reserve Bank of India Act, 1934 are scheduled
banks. These banks comprise Scheduled Commercial Banks and Scheduled Cooperative Banks.
Scheduled Commercial Banks in India are categorized into five different groups according to their ownership
and/or nature of the operation. These bank groups are:
(i) State Bank of India and its Associates,
(ii) Nationalized Banks,
(iii) Regional Rural Banks,
(iv) Foreign Banks and
(v) Other Indian Scheduled Commercial Banks (in the private sector).
Besides the Nationalized banks (majority equity holding is with the Government), the State Bank of India (SBI)
(majority equity holding being with the Reserve Bank of India) and the associate banks of SBI (majority holding
being with State Bank of India), the commercial banks comprise foreign and Indian private banks. While the State
bank of India and its associates, nationalized
Banks and Regional Rural Banks are constituted under respective enactments of the Parliament; the private sector
banks are banking companies as defined in the Banking Regulation Act. These banks, along with regional rural
banks, constitute the public sector (state owned) banking system in India.
The Public Sector Banks in India are back bone of the Indian financial system. The cooperative credit institutions
are broadly classified into urban credit cooperatives and rural credit cooperatives. Scheduled Co-operative Banks
consist of Scheduled State Co-operative Banks and Scheduled Urban Co-operative Banks.
Regional Rural Banks (RRB’s) are state sponsored, regionally based and rural oriented commercial banks. The
Government of India promulgated the Regional Rural Banks Ordinance on 26th September 1975, which was later
replaced by the Regional Rural Bank Act 1976. The preamble to the Act states the objective to develop rural
economy by providing credit and facilities for the development of agriculture, trade, commerce, industry and
other productive activities in the rural areas, particularly to small and marginal farmers, agricultural laborers,
artisans and small entrepreneurs.

International Journal of Advance Research, Ideas and Innovations in Technology. ISSN: 2454-132X
© 2017, www.IJARIIT.com All Rights Reserved Page | 1065
Bank Nationalization
The Government of India issued an ordinance and nationalized the 14 largest commercial banks with effect from
the midnight of July 19, 1969. Within two weeks of the issue of the ordinance, the Parliament passed the Banking
Companies (Acquisition and Transfer of Undertaking) Bill, and it received the presidential approval on 9 August
1969.
The need for the nationalization was felt mainly because private commercial banks were not fulfilling the social
and developmental goals of banking which are so essential for any industrializing country. Despite the enactment
of the Banking Regulation Act in 1949 and the nationalization of the largest bank, the State Bank of India, in
1955, the expansion of commercial banking had largely excluded rural areas and small-scale borrowers.
A second dose of nationalization of 6 more commercial banks followed in 1980. The stated reason for the
nationalization was to give the government more control of credit delivery. With the second dose of
nationalization, the Government of India controlled around 91% of the banking business of India. Later on, in the
year 1993, the government merged New Bank of India with Punjab National Bank. It was the only merger between
nationalized banks and resulted in the reduction of the number of nationalized banks from 20 to 19. After this,
until the 1990s, the nationalized banks grew at a pace of around 4%, closer to the average growth rate of the
Indian economy.
List of Nationalized Banks in India in 2012
1. Allahabad Bank
2. Andhra Bank
3. Bank of Baroda
4. Bank of India
5. Bank of Maharashtra
6. Canara Bank
7. Central Bank of India
8. Corporation Bank
9. Dena Bank
10. Indian Bank
11. Indian Overseas Bank
12. Oriental Bank of Commerce
13. Punjab and Sind Bank
14. Punjab National Bank
15. State Bank of Bikaner & Jaipur
16. State Bank of Hyderabad
17. State Bank of India (SBI)
18. State Bank of Indore
19. State Bank of Mysore
20. State Bank of Patiala
21. State Bank of Travancore
22. Syndicate Bank

International Journal of Advance Research, Ideas and Innovations in Technology. ISSN: 2454-132X
© 2017, www.IJARIIT.com All Rights Reserved Page | 1066
23. UCO Bank
24. Union Bank of India
25. United Bank of India
26. Vijaya Bank
Reserve Bank of India
The Reserve Bank of India is the central bank of the country. Central banks are a relatively recent innovation and
most central banks, as we know them today, were established around the early twentieth century. The Reserve
Bank of India was set up on the basis of the recommendations of the Hilton Young Commission. The Reserve
Bank of India Act, 1934 (II of 1934) provides the statutory basis of the functioning of the Bank, which commenced
operations on April 1, 1935.
The Bank was constituted to:
• Regulate the issue of banknotes
• Maintain reserves with a view to securing monetary stability and
• To operate the credit and currency system of the country to its advantage.
The Bank began its operations by taking over from the Government the functions so far being performed by the
Controller of Currency and from the Imperial Bank of India, the management of Government accounts and public
debt. The existing currency offices at Calcutta, Bombay, Madras, Rangoon, Karachi, Lahore and Cawnpore
(Kanpur) became branches of the Issue Department. Offices of the Banking Department were established in
Calcutta, Bombay, Madras, Delhi and Rangoon.
Burma (Myanmar) seceded from the Indian Union in 1937 but the Reserve Bank continued to act as the Central
Bank for Burma till Japanese Occupation of Burma and later up to April, 1947. After the partition of India, the
Reserve Bank served as the central bank of Pakistan up to June 1948 when the State Bank of Pakistan commenced
operations. The Bank, which was originally set up as a Shareholder’s bank was nationalized in 1949.
The Reserve Bank of India was nationalized with effect from 1st January, 1949 on the basis of the Reserve Bank
of India (Transfer to Public Ownership) Act, 1948. All shares in the capital of the Bank were deemed transferred
to the Central Government on payment of a suitable compensation.
An interesting feature of the Reserve Bank of India was that at its very inception, the Bank was seen as playing a
special role in the context of development, especially Agriculture. When India commenced its plan endeavors,
the development role of the Bank came into focus, especially in the sixties when the Reserve Bank, in many ways,
pioneered the concept and practice of using finance to catalyze development.

International Journal of Advance Research, Ideas and Innovations in Technology. ISSN: 2454-132X
© 2017, www.IJARIIT.com All Rights Reserved Page | 1067
The Bank was also instrumental in institutional development and helped set up institutions like the Deposit
Insurance and Credit Guarantee Corporation of India, the Unit Trust of India, the Industrial Development Bank
of India, the National Bank of Agriculture and Rural Development, the Discount and Finance House of India etc.
to build the financial infrastructure of the country.
With liberalization, the Bank's focus shifted back to core central banking functions like Monetary Policy, Bank
Supervision, and Regulation, and Overseeing the Payments System and onto developing the financial markets.
Regulation of Banks by RBI
The Reserve Bank of India has been empowered under the Banking Regulation Act, 1949 to regulate and
supervise banks' activities in India and their branches abroad. While the regulatory provisions of this Act prescribe
the policy framework to be followed by banks, the supervisory framework provides the mechanism to ensure
banks' compliance with the policy prescription.
While the Department of Banking Operations and Development exercises regulatory powers in respect of
commercial banks and Local Area Banks (LABs), Regional Rural Banks/District and State Co-operative Banks
and Urban Cooperative Banks are regulated by Rural Planning and Credit Department and Urban Banks
Department, respectively.
Important Legislations Pertaining to Banking Sector are:
Core Legislations:
1. The Banking Regulation Act, 1949
2. The Reserve Bank of India Act, 1934
Acts Governing Specific Functions:
1. Public Debt Act, 1944
2. Government Securities Act 2006
3. Securities Contract (Regulation) Act, 1956
4. Indian Coinage Act, 1906
5. Foreign Exchange Management Act, 1999
6. Payment and Settlement Systems Act, 2007
Acts governing Banking Operations
1. Companies Act, 1956
2. Banking Companies (Acquisition and Transfer of Undertakings) Act, 1970
3. Bankers’ Books Evidence Act, 1891
4. The Negotiable Instruments Act, 1881
5. The Prevention of Money Laundering Act, 2002
6. Securities and Exchange Board of India Act, 1992

International Journal of Advance Research, Ideas and Innovations in Technology. ISSN: 2454-132X
© 2017, www.IJARIIT.com All Rights Reserved Page | 1068
Acts Governing Individual Institutions
1. The State Bank of India Act, 1954
2. The Industrial Development Bank (Transfer of Undertaking and Repeal) Act, 2003
3. The Industrial Finance Corporation (Transfer of Undertaking and Repeal) Act, 1993
4. National Bank for Agriculture and Rural Development Act, 1981
5. National Housing Bank Act, 1987
6. Deposit Insurance and Credit Guarantee Corporation Act, 1961
7. Regional Rural Banks Act, 1976
PEST ANALYSIS
TECHNOLOGICAL ENVIROMENT
Technology plays a very important role in bank’s internal control mechanisms as well as services offered by them.
It has in fact given new dimensions to the banks as well as services that they cater to and the banks are
enthusiastically adopting new technological innovations for devising new products and services.
The latest developments in terms of technology in computer and telecommunication have encouraged the
bankers to change the concept of branch banking to anywhere banking. The use of ATM and Internet banking has
allowed ‘anytime, anywhere banking’ facilities. Automatic voice recorders now answer simple queries, currency
accounting machines make the job easier and self-service counters are now encouraged. Credit card facility has
encouraged an era of cashless society. Today MasterCard and Visa card are the two most popular cards used the
world over. The banks have now started issuing smartcards or debit cards to be used for making payments. These
are also called as an electronic purse. Some of the banks have also started home banking through
telecommunication facilities and computer technology by using terminals installed at customers home and they
can make the balance inquiry, get the statement of accounts, give instructions for fund transfers, etc. Through
ECS we can receive the dividends and interest directly to our account avoiding the delay or chance of losing the
post.
Today banks are also using SMS and Internet as a major tool of promotions and giving great utility to its
customers. For example, SMS functions through simple text messages sent from your mobile. The messages are
then recognized by the bank to provide you with the required information.
All these technological changes have forced the bankers to adopt customer-based approach instead of
product-based approach.

International Journal of Advance Research, Ideas and Innovations in Technology. ISSN: 2454-132X
© 2017, www.IJARIIT.com All Rights Reserved Page | 1069
ECONOMICAL ENVIROMENT
Banking is as old as authentic history and the modern commercial banking are traceable to ancient times. In India,
banking has existed in one form or the other from time to time. The present era in banking may be taken to have
commenced with the establishment of a bank of Bengal in 1809 under the government charter and with
government participation in share capital. Allahabad bank was started in the year 1865 and Punjab national bank
in 1895, and thus, others followed
Every year RBI declares its 6 monthly policy and accordingly, the various measures and rates are
implemented which has an impact on the banking sector. Also, the Union budget affects the banking sector to
boost the economy by giving certain concessions or facilities. If in the Budget savings are encouraged, then more
deposits will be attracted towards the banks and in turn, they can lend more money to the agricultural sector and
industrial sector, therefore, booming the economy. If the FDI limits are relaxed, then more FDI is brought in India
through banking channels.
POLITICAL/ LEGAL ENVIROMENT
Government and RBI policies affect the banking sector. Sometimes looking into the political advantage of a
particular party, the Government declares some measures to their benefits like waiver of short-term agricultural
loans, to attract the farmer’s votes. By doing so the profits of the bank get affected. Various banks in the
cooperative sector are open and run by the politicians. They exploit these banks for their benefits. Sometimes the
government appoints various chairmen of the banks.
Various policies are framed by the RBI looking at the present situation of the country for better control
over the banks.
SOCIAL ENVIROMENT
Before nationalization of the banks, their control was in the hands of the private parties and only big business
houses and the effluent sections of the society were getting benefits of banking in India. In 1969 government
nationalized 14 banks. To adopt the social development in the banking sector it was necessary for speedy
economic progress, consistent with social justice, in the democratic political system, which is free from the
domination of law, and in which opportunities are open to all. Accordingly, keeping in mind both the national
and social objectives, bankers were given direction to help economically weaker section of the society and also
provide need-based finance to all the sectors of the economy with flexible and liberal attitude.

International Journal of Advance Research, Ideas and Innovations in Technology. ISSN: 2454-132X
© 2017, www.IJARIIT.com All Rights Reserved Page | 1070
Now the banks provide various types of loans to farmers, working women, professionals, and traders. They also
provide education loan to the students and housing loans, consumer loans, etc.
Banks having big clients or big companies have to provide services like personalized banking to their
clients because these customers do not believe in running about and waiting in queues for getting their work done.
The bankers also have to provide these customers with special provisions and at times with benefits like food and
parties. But the banks do not mind incurring these costs because of the kind of business these clients bring to the
bank. Banks have changed the culture of human life in India and have made life much easier for the people.
SPorter's 5 Forces for Banking Sector
The threat of New Entrants:
In the first of the five forces, new competitors in the industry can raise the level of competition, reducing its
attractiveness to current members. The threat of new entrants largely depends on the height of the barriers to
entry. Very high entry barriers exist in certain industries, such as shipbuilding, while other industries are quite
easy to enter, such as real estate or restaurants. Some of the key barriers to entry include:
• Economies of scale
• Capital and/or investment requirements
• Customer’s costs to switch
• Access to industry distribution channels
• Likelihood of retaliation from existing industry players
The threat of Substitutes:
The presence of substitute products can also decrease industry attractiveness and profitability by limiting price
levels. The threat of substitute products is correlated with:
• Buyers' willingness to substitute products/services
• the relative price and performance of substitutes
• the cost of switching to one of the substitutes
Bargaining Power of Suppliers:
Suppliers are defined as the businesses that supply materials & other products to the businesses within an
industry. The cost of items purchased from suppliers, such as raw materials and component parts, can have a
significant impact on a company's bottom line. If suppliers gain strong bargaining power over an individual
company, the company's industry becomes less attractive. The bargaining power of suppliers will be high when:
• There are many buyers and few dominant suppliers
• There are undifferentiated, highly valued products in the industry

International Journal of Advance Research, Ideas and Innovations in Technology. ISSN: 2454-132X
© 2017, www.IJARIIT.com All Rights Reserved Page | 1071
• Suppliers threaten to integrate forward into the industry, illustrated by brand-name manufacturers threatening
to set up their own retail outlets
• Buyers do not threaten to integrate backwards into the supply chain
• The industry does not play a key customer group role to the suppliers
Bargaining Power of Buyers:
Buyers are the people and/or organizations who create the demand in an industry. The bargaining power of
buyers is greater in the following instances:
• There are few dominant buyers and many sellers in the industry
• Products are standardized
• Buyers threaten to integrate backward into the industry
• Suppliers do not threaten to integrate forward into the buyer's industry
• the industry is not a main supplying group for the buyers
Intensity of Rivalry
The fifth of the five forces, the intensity of rivalry between competitors in an industry, depends chiefly on:
• The structure of competition - a rivalry is more intense where there are many small or closely-sized
competitors; a rivalry is less intense when an industry has a clear market leader
• The structure of industry costs – an industry with high fixed costs motivates competitors to cut prices
• Degree of differentiation - industries where products are commodities, such as steel or coal, experience a
greater degree of rivalry; industries where competitors can clearly differentiate their products find less rivalry
• Switching costs - rivalry is lowered where buyers face high switching costs, as when there is a high cost
associated with the decision to buy a product from an alternative supplier
• Strategic objectives - when competitors are pursuing aggressive growth strategies, rivalry becomes more
intense; when competitors are milking the profits in a mature industry, the degree of rivalry is lower
• Exit barriers - when the barriers (such as the cost to close down factories) to leaving an industry are high, then
competitors tend to show a greater degree of rivalry.
International Journal of Advance Research, Ideas and Innovations in Technology. ISSN: 2454-132X
© 2017, www.IJARIIT.com All Rights Reserved Page | 1072
COMPANY PROFILES Profiles of following companies which form part of the portfolio is included:
1. AXIS BANK
2. SBI
3. YES BANK
4. UNION BANK
5. PNB
6. KOTAK MAHINDRA
7. BANK OF BARODA
AXIS BANK
INTRODUCTION
Axis bank was the first new private banks to have begun operations in 1994, after the government of India
allowed new private banks to be established.
The bank was promoted jointly by the administrator of the specified undertaking of the
UNITED TRUST OF INDIA (UTI-I).
LIFE INSURANCE CORPORATION OF INDIA (LIC).
GENERAL INSURANCE CORPORATION OF INDIA (GIC).
The bank today is capitalized to the extent of Rs.359.76 Crores with the public holding (other than
promoters) at 57.79%.
Axis Bank was the first of the new private banks to have begun operations in 1994, after the Government of India
allowed new private banks to be established. The Bank was promoted jointly by the Administrator of the specified
undertaking of the Unit Trust of India (UTI - I), Life Insurance Corporation of India (LIC) and General Insurance
Corporation of India (GIC) and other four PSU insurance companies, i.e. National Insurance Company Ltd., The
New India Assurance Company Ltd., The Oriental Insurance Company Ltd. and United India Insurance Company
Ltd.
The Bank as on 31st December, 2011 is capitalized to the extent of Rs. 412.57 crores with the public holding
(other than promoters and GDRs) at 53.63%. The Bank's Registered Office is at Ahmedabad and its Central Office
is located at Mumbai. The Bank has a very wide network of more than 1281 branches (including 169 Service
Branches/CPCs as on 31st March, 2011). The Bank has a network of over 7591 ATMs (as on 30th September,
2011) providing 24 hrs a day banking convenience to its customers.

International Journal of Advance Research, Ideas and Innovations in Technology. ISSN: 2454-132X
© 2017, www.IJARIIT.com All Rights Reserved Page | 1073
This is one of the largest ATM networks in the country. The Bank has strengths in both retail and corporate
banking and is committed to adopting the best industry practices internationally in order to achieve excellence.
SWOT ANALYSIS
STRENGTHS
Support of various promoters.
High level of services.
Knowledge of Indian market.
WEAKNESSESS
Not have a good image.
Market capitalization is very low.
Not been fully able to position it correctly.
OPPURTUNITIES
Growing Indian banking sectors.
People are becoming more service oriented in the global market.
THREATS
From various competitors
Foreign banks
Government banks
Future market trends.
STATE BANK OF INDIA
INTRODUCTION
The State Bank of India is the oldest and largest bank in India, with more than $250 billion (USD) in
assets.
It is the second-largest bank in the world in a number of branches; it opened its 10,000th branch in 2008.
The bank has 84 international branches located in 32 countries and approximately 8,500 ATMs.
Additionally, SBI has controlling or complete interest in a number of affiliate banks, resulting in the
availability of banking services at more than 14,600 branches and nearly 10,000 ATMs.
International Journal of Advance Research, Ideas and Innovations in Technology. ISSN: 2454-132X
© 2017, www.IJARIIT.com All Rights Reserved Page | 1074
SWOT ANALYSIS
STRENGTHS
The biggest bank in the country
Has a separate act for itself. Thus, a special privilege.
Biggest branch network in the country
First public sector to move to CBS
WEAKNESSESS
Huge amount of staff
Expected to experience high level of attrition due to retirement of its top management
Still carries the image of the old Govt. sector bank.
OPPURTUNITY
Pool in talent to replace the going top management to serve the next generation
Make better use of its CRM
Expansion into rural areas
THREATS
Consolidation among private banks
New bank licenses by RBI
Foreign banks that have sophisticated products.
COMPETITORS
ICICI
PNB
Bank of Baroda
YES BANK LTD
YES, Banks one of the fastest growing Indian private sector banks with a total business size of over 800,000
million.
The bank provides a full gamut of products and services in the field of corporate and institutional banking,
financial markets, investment banking, corporate finance, business and transaction banking, retail and wealth
management to its clients from across the country.

International Journal of Advance Research, Ideas and Innovations in Technology. ISSN: 2454-132X
© 2017, www.IJARIIT.com All Rights Reserved Page | 1075
STRENGTHS
The capital adequacy ratio of YBL at 17.9% is well above minimum requirements of 9% which supports
the long term soundness and sustainability of its business.
YBL's annualized RoA has been at or above 1.5% over last 4 years and its annualized RoE has been at or
above 20% over last 4 years. This stands in testimony to the bank’s lucrative business model.
Over the years, YBL has brought down the cost to income ratios to 36%-38%,, which is far below the
industry average Cost to income ratio of approx. 45% and retains high profitability per employee as
compared to peers.
WEAKNESSESS
Although YBL has made significant strides over the last few years, it is still a very small player in the
banking space. It suffers from low market share as its network of branches (~360) is still relatively
smaller than its peers in both the public and the private sector.
Being a new Bank in the industry, YBL’s brand awareness among retail customers is lower than its
peers who have been in the business for a significantly longer time.
YBL also has a relatively lower Current and Saving Account (CASA) base against its peers due to
higher exposure to corporate banking.
OPPURTUNITY
Savings rate deregulation by the RBI has offered YBL an opportunity to gain significant savings account
market share by offering better rates and services to customers.
YBL’s entry into a new product or segments like retail assets offers significant potential for the Bank to
build on its expanding custom base. The ability to cross sell the product to retail customers would enhance
the profitability of the Bank over the long run.
The large middle class population of India, with increasing incomes and banking needs along with a huge
unbanked population below the age of 25 offers an enormous retail opportunity for banks in India. Smaller
towns and rural India still provide a huge untapped potential for expansion
THREATS
The tight monetary policy adopted by the RBI with a view to tame inflation could dampen corporate credit
off taking. Overall business could also be impacted due to a reduction in asset quality and rise in NPAs.
Expansion may lead to increase in costs and an overall reduction in operating profit accompanied by a
decrease in quality of assets with exposure to retail in the future.
Recent regulatory changes including revised priority sector norms, adoption of BASEL III norms could
result in lower profitability for the banking system in general, thereby also impact YBL.

International Journal of Advance Research, Ideas and Innovations in Technology. ISSN: 2454-132X
© 2017, www.IJARIIT.com All Rights Reserved Page | 1076
UNION BANK OF INDIA
INTRODUCTION Union bank was established in 1991 and was backed by a major Middle Eastern Group. Union Bank expands and
strengthens itself through acquisitions. With enhanced accessibility and superior operational capabilities, the aim
is to provide the customer with a memorable banking experience.
BRANCH EXPANSION
During the year 2002, the bank has expanded its branch network with the aim to increase accessibility for its
customers as per their own convenience.
A total of 8 new branches were opened in various cities of the country. These include branches in existing and
new cities thereby taking the final toll to 42 branches in 17 cities. With a correspondent banking network of over
500 banks in 87 countries, Union Bank is rapidly gaining ground in the global financial market.
The existing, as well as new branches, successfully prepare the grounds to utilize new banking systems including
online real time connectivity and an automated front office system enabling to deliver the service in accordance
with highest quality standards.
SWOT ANALYSIS
STRENGTHS
Financial products for agricultural sector
Products aligned to Government schemes
Emphasis on Customer Satisfaction
Union bank of India has over 27,700 employees
It has representative offices in Abu Dhabi, United Arab Emirates, and Shanghai, Peoples Republic of
China, Australia and a branch in Hong Kong.
Online Tele banking facility is available to all its Core Banking Customers - individual as well as corporate
WEAKNESSESS
Nominal International presence as compared to leading players
Advertising is lesser which leads to lower brand presence
OPPURTUNITIES
Small scale business banking.
More global penetration through International banking.
Acquisition of smaller local banks.

International Journal of Advance Research, Ideas and Innovations in Technology. ISSN: 2454-132X
© 2017, www.IJARIIT.com All Rights Reserved Page | 1077
THREATS
Economic crisis.
Highly competitive environment.
Stringent Banking Norms.
COMPETITORS
Indian bank
Corporation Bank
Dena bank
PUNJAB NATIONAL BANK
INTRODUCTION
1. PNB has a wide variety of products and services that meet diverse requirements of its vast customer base.
2. In the light of growing importance of financial inclusion, the bank has introduced PNB Mitra- a no-frills savings
bank account that can be opened either by an individual or jointly.
3. A number of deposit and loan schemes are available to customers such as housing loans, car finance, customer
finance, personal and several types of educational loans.
4. It has an international credit card, issued in collaboration with Hong Kong and Shanghai Banking Corporation.
5. HSBC is the issuer bank for the co-branded credit card and it undertakes all front-end and back-end operations
relating to the co-branded credit card.
6. Punjab National Bank has formulated the Gold Card Scheme for its exporter clients based on the scheme drawn
up by Reserve Bank of India.
7. The scheme ensures easy availability of export credit on best terms to credit worthy exporters with a good track
record.
8. The card offered by PNB is known as PNB Expo Gold Card.
9. The bank offers 12-hour banking services in 77 branches across India.
SWOT ANALYSIS
STRENGTHS
Diversified operations with 5100 branches
Strong I. T support with “best fit” approach
Schemes for small and medium scale businesses
It is the second largest state-owned commercial bank in India with about 5000 branches across 764 cities
Its 56,000+ workforce serves over 37 million customers

International Journal of Advance Research, Ideas and Innovations in Technology. ISSN: 2454-132X
© 2017, www.IJARIIT.com All Rights Reserved Page | 1078
WEAKNESSESS
Less penetration in the urban areas
Inadequate advertising and branding as compared to other banks
Legal issues regarding employees caused a bad name for PNB
OPPURTUNITIES
Small scale business banking across India
Expansion in other countries for international banking
Installation of more ATM’s and better customers services
THREATS
Economic crisis and economic fluctuations
Highly competitive environment
Stringent Banking Norms by the RBI and the Government.
COMPETITORS
Indian bank
Andhra Bank
Canara bank
ICICI Bank
HDFC Bank
SBI
KOTAK MAHINDRA
HISTORY OF KOTAK MAHINDRA
The Kotak Mahindra group was born in1985 as Kotak capital management finance limited.
In 1986 the company changed its name to Kotak Mahindra finance limited.
In 2003 it converted into Kotak Mahindra bank.
It is the first company in the Indian banking history to be converted from a financial institution bank.
SWOT ANALYSIS
STRENGTHS
Strong brand image.
Dedicated sales team.
Value added services.
Mainly concern on customer services.
Deals in innovative products better than others and focuses on quality.

International Journal of Advance Research, Ideas and Innovations in Technology. ISSN: 2454-132X
© 2017, www.IJARIIT.com All Rights Reserved Page | 1079
Provide phone banking, mobile banking, it makes work easier.
Providing home banking facility.
WEAKNESSESS
New in market
Less number of ATM’S
A limited number of branches.
OPPURTUNITIES
Large untapped market.
Distinguish product (for different customers).
THREATS
Presence of very strong competitors.
Aggressive marketing by competitors.
Various investments schemes with high returns.
New and upcoming banks in retail.
BANK OF BARODA
INTRODUCTION Bank of Baroda was incorporated in 1908 as a privately owned institution.
The bank expanded its operations through merger and acquisition before it was nationalized in 1969.
The government of India has a shareholding of 53.81% in BOB.
BOB is among the five largest banks in India, with total assets of 2.8 trillion (tn) as on march 31st 2010.
The bank's domestic network consists of 3100 branches as on the same date.
It has the second largest international presence among the Indian banks with 78 overseas offices across 25
countries for 24% of its total business.
SWOT ANALYSIS
STRENGTHS
One of the biggest names in public sector banking.
No. of services and products offered by the bank.
CBS implementation in its branches.
International presence adds to the credibility.

International Journal of Advance Research, Ideas and Innovations in Technology. ISSN: 2454-132X
© 2017, www.IJARIIT.com All Rights Reserved Page | 1080
WEAKNESSESS
Lesser branches across the country when compared with SBI and PNB.
Due to focus on international branches, local focus sometimes gets diluted.
OPPURTUNITIES
International branches give scope to expand into other economies.
Expansion in the rural areas to include the unbanked and under banked.
Bob Caps can contribute more to the revenues.
THREATS
New banking licenses by RBI.
Foreign banks.
COMPETITORS
SBI'
PNB
ICICI
DATA ANALYSIS
Punjab National Bank
TREYNOR RATIO
Date Nifty Close
Company close
Company Open Return X Return Y
31-May-12 9441 755.5 724 0.095292 0.069887
29-Jun-12 10340.65 808.3 795 0.004202 -0.10046
31-Jul-12 10384.1 727.1 732.9 -0.0379 -0.06952
31-Aug-12 9990.5 676.55 678 0.146769 0.242037 BETA
28-Sep-12 11456.8 840.3 845 -0.01641 -0.12127 1.002996
31-Oct-12 11268.8 738.4 724.5 0.078988 0.062974
30-Nov-12 12158.9 784.9 770.25 0.025936 0.110078 TREYNORS RATIO 10.85415
31-Dec-12 12474.25 871.3 844.1 0.018787 0.046827
31-Jan-13 12708.6 912.1 832 -0.0961 -0.13337
28-Feb-13 11487.35 790.45 814 -0.01093 -0.09178
28-Mar-12 11361.85 717.9 713.35 0.10559 0.069648
30-Apr-13 12561.55 767.9 786 -1 -1

International Journal of Advance Research, Ideas and Innovations in Technology. ISSN: 2454-132X
© 2017, www.IJARIIT.com All Rights Reserved Page | 1081
SHARP RATIO
Date Nifty Close Company close Company Open Portfolio
31-May-12 9441 755.5 724 31.5
29-Jun-12 10340.65 808.3 795 13.3
31-Jul-12 10384.1 727.1 732.9 -5.8
31-Aug-12 9990.5 676.55 678 -1.45
28-Sep-12 11456.8 840.3 845 -4.7
31-Oct-12 11268.8 738.4 724.5 13.9
30-Nov-12 12158.9 784.9 770.25 14.65
31-Dec-12 12474.25 871.3 844.1 27.2
31-Jan-13 12708.6 912.1 832 80.1
28-Feb-13 11487.35 790.45 814 -23.55
28-Mar-12 11361.85 717.9 713.35 4.55
30-Apr-13 12561.55 767.9 786 -18.1
MEAN 782.558333
AVG 10.96667
SD 67.4952484
SHARP RATIO 0.161295305
JENSENS ALPHA
Date Nifty Close Portfolio Index(RM)
31-May-12 9441 31.5 0.095292
29-Jun-12 10340.65 13.3 0.004202
31-Jul-12 10384.1 -5.8 -0.0379
31-Aug-12 9990.5 -1.45 0.146769
28-Sep-12 11456.8 -4.7 -0.01641 COVARIANCE 1.982637
31-Oct-12 11268.8 13.9 0.078988
30-Nov-12 12158.9 14.65 0.025936 VARIANCE 750.0324
31-Dec-12 12474.25 27.2 0.018787
31-Jan-13 12708.6 80.1 -0.0961 BETA 0.002643
28-Feb-13 11487.35 -23.55 -0.01093
28-Mar-12 11361.85 4.55 0.10559 RF 0.08
30-Apr-13 12561.55 -18.1 -1
RM-RF -0.13715
AVERAGE 10.96667 -0.05715 B(RM-RF) -0.00036
RF+B(RM-RF) 0.079637
JENSENS ALPHA RP-(RF+B(RM-RF)) -
0.13679
International Journal of Advance Research, Ideas and Innovations in Technology. ISSN: 2454-132X
© 2017, www.IJARIIT.com All Rights Reserved Page | 1082
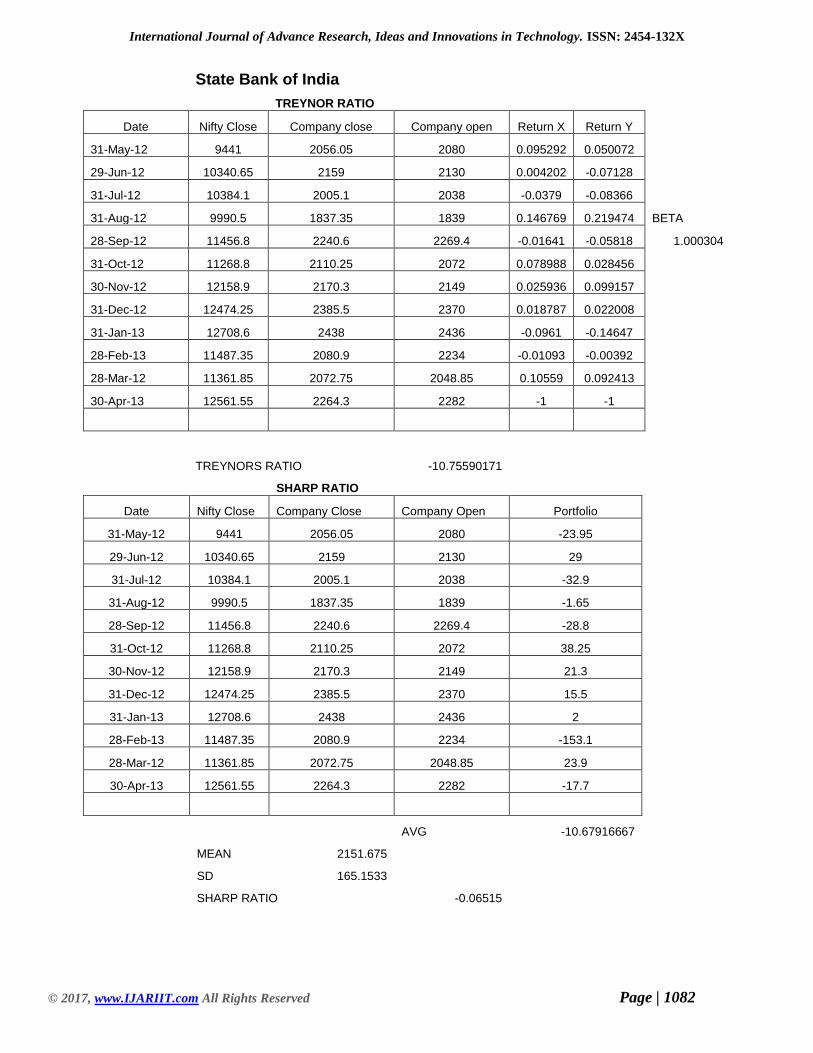
State Bank of India
TREYNOR RATIO
Date Nifty Close Company close Company open Return X Return Y
31-May-12 9441 2056.05 2080 0.095292 0.050072
29-Jun-12 10340.65 2159 2130 0.004202 -0.07128
31-Jul-12 10384.1 2005.1 2038 -0.0379 -0.08366
31-Aug-12 9990.5 1837.35 1839 0.146769 0.219474 BETA
28-Sep-12 11456.8 2240.6 2269.4 -0.01641 -0.05818 1.000304
31-Oct-12 11268.8 2110.25 2072 0.078988 0.028456
30-Nov-12 12158.9 2170.3 2149 0.025936 0.099157
31-Dec-12 12474.25 2385.5 2370 0.018787 0.022008
31-Jan-13 12708.6 2438 2436 -0.0961 -0.14647
28-Feb-13 11487.35 2080.9 2234 -0.01093 -0.00392
28-Mar-12 11361.85 2072.75 2048.85 0.10559 0.092413
30-Apr-13 12561.55 2264.3 2282 -1 -1
TREYNORS RATIO -10.75590171
SHARP RATIO
Date Nifty Close Company Close Company Open Portfolio
31-May-12 9441 2056.05 2080 -23.95
29-Jun-12 10340.65 2159 2130 29
31-Jul-12 10384.1 2005.1 2038 -32.9
31-Aug-12 9990.5 1837.35 1839 -1.65
28-Sep-12 11456.8 2240.6 2269.4 -28.8
31-Oct-12 11268.8 2110.25 2072 38.25
30-Nov-12 12158.9 2170.3 2149 21.3
31-Dec-12 12474.25 2385.5 2370 15.5
31-Jan-13 12708.6 2438 2436 2
28-Feb-13 11487.35 2080.9 2234 -153.1
28-Mar-12 11361.85 2072.75 2048.85 23.9
30-Apr-13 12561.55 2264.3 2282 -17.7
AVG -10.67916667
MEAN 2151.675
SD 165.1533
SHARP RATIO -0.06515

International Journal of Advance Research, Ideas and Innovations in Technology. ISSN: 2454-132X
© 2017, www.IJARIIT.com All Rights Reserved Page | 1083
JENSENS ALPHA
Date Nifty Close Company Close Index(RM)
31-May-12 9441 -23.95 0.095292
29-Jun-12 10340.65 29 0.004202
31-Jul-12 10384.1 -32.9 -0.0379
31-Aug-12 9990.5 -1.65 0.146769 COVARIANCE 1.46354783
28-Sep-12 11456.8 -28.8 -0.01641
31-Oct-12 11268.8 38.25 0.078988 VARIANCE 2585.977481
30-Nov-12 12158.9 21.3 0.025936
31-Dec-12 12474.25 15.5 0.018787 BETA 0.000565955
31-Jan-13 12708.6 2 -0.0961
28-Feb-13 11487.35 -153.1 -0.01093 RM-RF -
0.137147603
28-Mar-12 11361.85 23.9 0.10559
30-Apr-13 12561.55 -17.7 -1 B(RM-RF) -7.76194E-
05
AVG -10.67916667 -0.05715 RF+B(RM-RF) 0.079922381
JENSENS ALPHA RP-(RF+B(RM-RF)) -10.7591 YES BANK
TREYNOR RATIO
Date Nifty
Close Company
close Company
open Return X Return Y
31-May-12 9441 329.85 321 0.095292 0.028953
29-Jun-12 10340.65 339.4 336 0.004202 0.076016
31-Jul-12 10384.1 365.2 359.85 -0.0379 -0.09981
31-Aug-12 9990.5 328.75 330.05 0.146769 0.162129 BETA
28-Sep-12 11456.8 382.05 381.9 -0.01641 0.077346 1.015832
31-Oct-12 11268.8 411.6 407.3 0.078988 0.074466
30-Nov-12 12158.9 442.25 444 0.025936 0.050311
31-Dec-12 12474.25 464.5 463 0.018787 0.124112
31-Jan-13 12708.6 522.15 520.05 -0.0961 -0.09605
28-Feb-13 11487.35 472 495.05 -0.01093 -0.09131
28-Mar-12 11361.85 428.9 444 0.10559 0.16962
30-Apr-13 12561.55 501.65 506 -1 -1
TREYNORS RATIO -1.711241424
SHARP RATIO
Date Nifty Close Company
close Company open Portfolio
31-May-12 9441 329.85 321 8.85
29-Jun-12 10340.65 339.4 336 3.4
31-Jul-12 10384.1 365.2 359.85 5.35
31-Aug-12 9990.5 328.75 330.05 -1.3
28-Sep-12 11456.8 382.05 381.9 0.15
31-Oct-12 11268.8 411.6 407.3 4.3
30-Nov-12 12158.9 442.25 444 -1.75
31-Dec-12 12474.25 464.5 463 1.5
31-Jan-13 12708.6 522.15 520.05 2.1
28-Feb-13 11487.35 472 495.05 -23.05
28-Mar-12 11361.85 428.9 444 -15.1
30-Apr-13 12561.55 501.65 506 -4.35
AVG -1.658333333
MEAN 415.6916667
SD 67.15035651
SHARP RATIO 0.02588718

International Journal of Advance Research, Ideas and Innovations in Technology. ISSN: 2454-132X
© 2017, www.IJARIIT.com All Rights Reserved Page | 1084
JENSENS ALPHA
Date Nifty Close Company close Index(RM)
31-May-12 9441 8.85 0.095292
29-Jun-12 10340.65 3.4 0.004202
31-Jul-12 10384.1 5.35 -0.0379
31-Aug-12 9990.5 -1.3 0.146769 COVARIANCE 0.204365184
28-Sep-12 11456.8 0.15 -0.01641
31-Oct-12 11268.8 4.3 0.078988 VARIANCE 81.24219697
30-Nov-12 12158.9 -1.75 0.025936
31-Dec-12 12474.25 1.5 0.018787 BETA 0.002515505
31-Jan-13 12708.6 2.1 -0.0961
28-Feb-13 11487.35 -23.05 -0.01093 RM-RF -0.137147603
28-Mar-12 11361.85 -15.1 0.10559
30-Apr-13 12561.55 -4.35 -1 B(RM-RF) -0.000344996
AVG -1.658333333 -0.05715 RF+B(RM-RF) 0.079655004
JENSENS ALPHA RP-(RF+B(RM-RF)) -1.73799
UNION BANK
TREYNOR RATIO
Date Nifty Close Company close Company open Return X Return Y
31-May-12 9441 201.65 195.8 0.095292 0.036945
29-Jun-12 10340.65 209.1 206.05 0.004202 -0.19751
31-Jul-12 10384.1 167.8 169.95 -0.0379 -0.06585
31-Aug-12 9990.5 156.75 152.5 0.146769 0.325997 BETA
28-Sep-12 11456.8 207.85 207 -0.01641 -0.0587 1.043383
31-Oct-12 11268.8 195.65 195 0.078988 0.240225
30-Nov-12 12158.9 242.65 234 0.025936 0.130641
31-Dec-12 12474.25 274.35 275.8 0.018787 -0.07035
31-Jan-13 12708.6 255.05 240.85 -0.0961 -0.16801
28-Feb-13 11487.35 212.2 225 -0.01093 0.027333
28-Mar-12 11361.85 218 210.55 0.10559 0.122936
30-Apr-13 12561.55 244.8 247.1 -1 -1
TREYNORS RATIO 2.01987233

International Journal of Advance Research, Ideas and Innovations in Technology. ISSN: 2454-132X
© 2017, www.IJARIIT.com All Rights Reserved Page | 1085
SHARP RATIO
Date Nifty Close Company close Company open Portfolio
31-May-12 9441 201.65 195.8 5.85
29-Jun-12 10340.65 209.1 206.05 3.05
31-Jul-12 10384.1 167.8 169.95 -2.15
31-Aug-12 9990.5 156.75 152.5 4.25
28-Sep-12 11456.8 207.85 207 0.85
31-Oct-12 11268.8 195.65 195 0.65
30-Nov-12 12158.9 242.65 234 8.65
31-Dec-12 12474.25 274.35 275.8 -1.45
31-Jan-13 12708.6 255.05 240.85 14.2
28-Feb-13 11487.35 212.2 225 -12.8
28-Mar-12 11361.85 218 210.55 7.45
30-Apr-13 12561.55 244.8 247.1 -2.3
AVG 2.1875
MEAN 215.4875
SD 34.44687032 SHARP RATIO 0.061181175
JENSENS ALPHA
Date Nifty Close Company close Index(RM)
31-May-12 9441 5.85 0.095292
29-Jun-12 10340.65 3.05 0.004202
31-Jul-12 10384.1 -2.15 -0.0379
31-Aug-12 9990.5 4.25 0.146769 COVARIANCE
28-Sep-12 11456.8 0.85 -0.01641 0.40600654
31-Oct-12 11268.8 0.65 0.078988 VARIANCE
30-Nov-12 12158.9 8.65 0.025936 46.64823864
31-Dec-12 12474.25 -1.45 0.018787 BETA
31-Jan-13 12708.6 14.2 -0.0961 0.008703577
28-Feb-13 11487.35 -12.8 -0.01093 RM-RF
28-Mar-12 11361.85 7.45 0.10559 -0.137147603
30-Apr-13 12561.55 -2.3 -1 B(RM-RF)
-0.001193675
AVG 2.1875 -0.05715 RF+B(RM-RF)
0.078806325
JENSENS ALPHA RP-(RF+B(RM-RF))
2.108694
KOTAK MAHINDRA
TREYNOR RATIO
Date Nifty Close Company
close Company
open Return X Return Y
31-May-12 9441 563.5 544.9 0.095292 0.051109
29-Jun-12 10340.65 592.3 576.85 0.004202 -0.09548
31-Jul-12 10384.1 535.75 539 -0.0379 0.071582
31-Aug-12 9990.5 574.1 590.8 0.146769 0.13003 BETA
28-Sep-12 11456.8 648.75 648.5 -0.01641 -0.06936 0.978151
31-Oct-12 11268.8 603.75 600 0.078988 0.110476
30-Nov-12 12158.9 670.45 657 0.025936 -0.03043
31-Dec-12 12474.25 650.05 649.15 0.018787 0.046612
31-Jan-13 12708.6 680.35 677 -0.0961 -0.0305
28-Feb-13 11487.35 659.6 654.9 -0.01093 -0.01001
28-Mar-12 11361.85 653 640 0.10559 0.07366
30-Apr-13 12561.55 701.1 707.1 -1 -1

International Journal of Advance Research, Ideas and Innovations in Technology. ISSN: 2454-132X
© 2017, www.IJARIIT.com All Rights Reserved Page | 1086
TREYNORS RATIO 3.964964126
SHARP RATIO
Date Nifty Close Company
close Company
open Portfolio
31-May-12 9441 563.5 544.9 18.6
29-Jun-12 10340.65 592.3 576.85 15.45
31-Jul-12 10384.1 535.75 539 -3.25
31-Aug-12 9990.5 574.1 590.8 -16.7
28-Sep-12 11456.8 648.75 648.5 0.25
31-Oct-12 11268.8 603.75 600 3.75
30-Nov-12 12158.9 670.45 657 13.45
31-Dec-12 12474.25 650.05 649.15 0.9
31-Jan-13 12708.6 680.35 677 3.35
28-Feb-13 11487.35 659.6 654.9 4.7
28-Mar-12 11361.85 653 640 13
30-Apr-13 12561.55 701.1 707.1 -6
AVG 3.958333333
MEAN 627.725
SD 52.10446456 SHARP RATIO 0.074433801
JENSENS ALPHA
Date Nifty
Close Company
close Index(RM)
31-May-12 9441 18.6 0.095292
29-Jun-12 10340.65 15.45 0.004202
31-Jul-12 10384.1 -3.25 -0.0379
31-Aug-12 9990.5 -16.7 0.146769 COVARIANCE 0.823437068
28-Sep-12 11456.8 0.25 -0.01641
31-Oct-12 11268.8 3.75 0.078988 VARIANCE 101.8403788
30-Nov-12 12158.9 13.45 0.025936
31-Dec-12 12474.25 0.9 0.018787 BETA 0.008085566
31-Jan-13 12708.6 3.35 -0.0961
28-Feb-13 11487.35 4.7 -0.01093 RM-RF -0.137147603
28-Mar-12 11361.85 13 0.10559
30-Apr-13 12561.55 -6 -1 B(RM-RF) -0.001108916
AVG 3.958333333 -0.05715 RF+B(RM-RF) 0.078891084
JENSENS ALPHA RP-(RF+B(RM-RF)) 3.879442

International Journal of Advance Research, Ideas and Innovations in Technology. ISSN: 2454-132X
© 2017, www.IJARIIT.com All Rights Reserved Page | 1087
BANK OF BARODA
TREYNOR RATIO
Date Nifty Close Company close Company open Return X Return Y
31-May-12 9441 688.75 683 0.095292 0.064102
29-Jun-12 10340.65 732.9 728 0.004202 -0.10479
31-Jul-12 10384.1 656.1 677.95 -0.0379 -0.03696
31-Aug-12 9990.5 631.85 629 0.146769 0.262641 BETA
28-Sep-12 11456.8 797.8 785 -0.01641 -0.09044 1.005065
31-Oct-12 11268.8 725.65 716.25 0.078988 0.05781
30-Nov-12 12158.9 767.6 745.95 0.025936 0.128778
31-Dec-12 12474.25 866.45 860 0.018787 0.0015
31-Jan-13 12708.6 867.75 831.05 -0.0961 -0.19833
28-Feb-13 11487.35 695.65 739.5 -0.01093 -0.02911
28-Mar-12 11361.85 675.4 664.9 0.10559 0.034868
30-Apr-13 12561.55 698.95 703 -1 -1
TREYNORS RATIO 3.340581393
SHARP RATIO
Date Nifty Close Company close Company open Portfolio
31-May-12 9441 688.75 683 5.75
29-Jun-12 10340.65 732.9 728 4.9
31-Jul-12 10384.1 656.1 677.95 -21.85
31-Aug-12 9990.5 631.85 629 2.85
28-Sep-12 11456.8 797.8 785 12.8
31-Oct-12 11268.8 725.65 716.25 9.4
30-Nov-12 12158.9 767.6 745.95 21.65
31-Dec-12 12474.25 866.45 860 6.45
31-Jan-13 12708.6 867.75 831.05 36.7
28-Feb-13 11487.35 695.65 739.5 -43.85
28-Mar-12 11361.85 675.4 664.9 10.5
30-Apr-13 12561.55 698.95 703 -4.05
AVG 3.4375
MEAN 733.7375
SD 77.09813736
SHARP RATIO 0.043548393
JENSENS ALPHA
Date Nifty
Close Company close Index(RM)
31-May-12 9441 5.75 0.095292
29-Jun-12 10340.65 4.9 0.004202
31-Jul-12 10384.1 -21.85 -0.0379
31-Aug-12 9990.5 2.85 0.146769 COVARIANCE 0.624875607
28-Sep-12 11456.8 12.8 -0.01641
31-Oct-12 11268.8 9.4 0.078988 VARIANCE 414.5191477
30-Nov-12 12158.9 21.65 0.025936
31-Dec-12 12474.25 6.45 0.018787 BETA 0.001507471
31-Jan-13 12708.6 36.7 -0.0961
28-Feb-13 11487.35 -43.85 -0.01093 RM-RF -0.137147603
28-Mar-12 11361.85 10.5 0.10559
30-Apr-13 12561.55 -4.05 -1 B(RM-RF) -0.000206746
AVG 3.4375 -0.05715 RF+B(RM-RF) 0.079793254 JENSENS ALPHA RP-(RF+B(RM-RF)) 3.357707

International Journal of Advance Research, Ideas and Innovations in Technology. ISSN: 2454-132X
© 2017, www.IJARIIT.com All Rights Reserved Page | 1088
FINDINGS
Fundamental factors
There is a positive correlation between the macro factors and the return of the daily portfolio.
Micro factors have helped in identifying the correct scripts for purpose of buying and selling.
Technical tools have helped in timing the market to yield a better than the market return.
One Year Performance of AXIS BANK
BETA is
Standard deviation is
Sharpe ratio is
Treynor ratio is
Jensen’s alpha is
Therefore from the above calculations, we can observe that the alpha is positive. Hence null hypothesis is
rejected and the alternative hypothesis is accepted.
One Year Performance of SBI
BETA is 1.0003036
Standard deviation is 165.1533
Sharpe ratio is -0.06515
Treynor ratio is -10.7559
Jensen’s alpha is -10.7591
Therefore from the above calculations, we can observe that the alpha is negative. Hence null hypothesis is
accepted and the alternative hypothesis is rejected.
One Year Performance of YES BANK
BETA is 1.015832
Standard deviation is 67.150357
Sharpe ratio is -0.0258872
Treynor ratio is -1.71124
Jensen’s alpha is -1.73799
Therefore from the above calculations, we can observe that the alpha is Negative. Hence null hypothesis is
accepted and the alternative hypothesis is rejected.
One Year Performance of UNION BANK
BETA is 1.043383
Standard deviation is 34.44687
Sharpe ratio is 0.0611812
Treynor ratio is 2.019872
Jensen’s alpha is 2.108694
Therefore from the above calculations, we can observe that the alpha is positive. Hence null hypothesis is
rejected and the alternative hypothesis is accepted.
International Journal of Advance Research, Ideas and Innovations in Technology. ISSN: 2454-132X
© 2017, www.IJARIIT.com All Rights Reserved Page | 1089
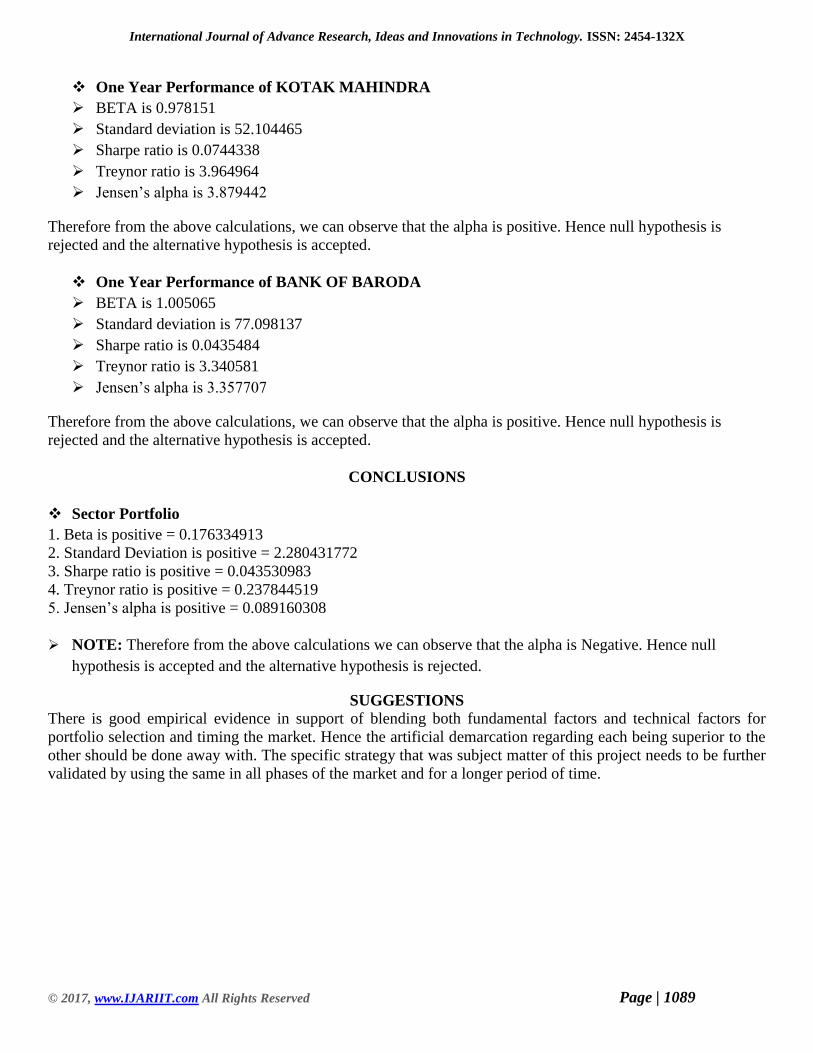
One Year Performance of KOTAK MAHINDRA
BETA is 0.978151
Standard deviation is 52.104465
Sharpe ratio is 0.0744338
Treynor ratio is 3.964964
Jensen’s alpha is 3.879442
Therefore from the above calculations, we can observe that the alpha is positive. Hence null hypothesis is
rejected and the alternative hypothesis is accepted.
One Year Performance of BANK OF BARODA
BETA is 1.005065
Standard deviation is 77.098137
Sharpe ratio is 0.0435484
Treynor ratio is 3.340581
Jensen’s alpha is 3.357707
Therefore from the above calculations, we can observe that the alpha is positive. Hence null hypothesis is
rejected and the alternative hypothesis is accepted.
CONCLUSIONS
Sector Portfolio
1. Beta is positive = 0.176334913
2. Standard Deviation is positive = 2.280431772
3. Sharpe ratio is positive = 0.043530983
4. Treynor ratio is positive = 0.237844519
5. Jensen’s alpha is positive = 0.089160308
NOTE: Therefore from the above calculations we can observe that the alpha is Negative. Hence null
hypothesis is accepted and the alternative hypothesis is rejected.
SUGGESTIONS
There is good empirical evidence in support of blending both fundamental factors and technical factors for
portfolio selection and timing the market. Hence the artificial demarcation regarding each being superior to the
other should be done away with. The specific strategy that was subject matter of this project needs to be further
validated by using the same in all phases of the market and for a longer period of time.

International Journal of Advance Research, Ideas and Innovations in Technology. ISSN: 2454-132X
© 2017, www.IJARIIT.com All Rights Reserved Page | 1090
Bibliography
BIBLIOGRAPHY: Reference Author Title Format Volume Journal Volume Particular Page 1. Website
www.nse.com
2. Website
www.bse.com
3. Website
www.RBI.in.co
4. Website
www.monycontrol.com
5. Website
Http//in .finance.yhoo.com
6. Website
www.monybhai.com
7. Website
www.idbipaisabulldar.com
8. Website
http://www.Scholars.google.com
9. Economic crisis of 2013 - Wikipedia, the free encyclopedia.mht
10. Abdalla, I. S. A. and V. Murinde (1997), “Exchange Rate and Stock Price Interactions in Emerging Financial
Markets: Evidence on India, Korea, Pakistan, and the Philippines,” Applied Financial Economics 7, 25-35.
11. Abdalla, I. S. A. and V. Murinde (1996) Exchange rate and stock prices interactions in emerging financial
markets: Evidence on India, Korea, Pakistan, and Philippines. Applied Financial Economics, 7, 25-35.
12. Ajayi, R. A. and M. Mougoue (1996), “On the Dynamic Relation between Stock Prices and Exchange Rates,”
13. Bhattacharya B and Mukherjee J. (2002), “Causal relationship between stock market and exchange rate, foreign
exchange reserves and value of trade balance: A case study for India” www.igidr.ac.in
14. Ando, A. and F. Modigliani (1963), “The Life Cycle Hypothesis of Saving: Aggregate Implications and tests,”
American Economic Review, Vol. 53, No. 1.