December 19, 2014 Banking Sector Sector Update Banking sector ...

Performance of Banking Sector in India
Synopsis
Submitted in fulfilment of the requirements for the degree of
Doctor of Philosophy
By
Madhvi
Enrolment Number: 136801
Under the supervision of
Dr. Amit Srivastava
DEPARTMENT OF HUMANITIES AND SOCIAL SCIENCES
JAYPEE UNIVERSITY OF INFORMATION TECHNOLOGY
WAKNAGHAT - 173234, H.P., INDIA
June, 2018

1
CONTENT
S. No. TOPIC Page No.
TOPIC
CONTENT 1
1. INTRODUCTION 2
2. REVIEW OF LITERATURE 3
3. OBJECTIVES OF THE STUDY 7
4. PERFORMANCE AND EFFICIENCY OF DIFFERENT BANKING
SECTORS IN INDIA 8
5. NPA AND PROVISIONING EFFECT ON PERFORMANCE OF
DIFFERENT BANKS IN INDIA 16
6.
NON-PERFORMING ASSETS AND SWING TRADING IN CAPITAL
MARKET 21
7. FINDINGS OF THE STUDY 24
8. CONCLUSION 25
9. LIMITATIONS OF THE STUDY 25
10. REFERENCES OF SELECTED PAPERS 26
11. PUBLICATIONS 27
12. CONFERENCES 28

2
1. INTRODUCTION
A bank is a financial institution which offers its financial and other monetary services to its
customers and users. A bank is usually considered as an organization which serves basic and
essential banking services like cash deposits and lending loans to its customers. NBFC‟s are
also there which gives many financial services without becoming a legal meaning of bank.
Financial industry is having number of subsections; banks are one of this subsections which
is very wide in itself. Indian banking system discussed as a system which provides liquidity
services, cash management facilities to their users, account management services, portfolio
management services (Vithhal, 2014). Indian banking system should not only be stress free
but should be well enough to compete with latest technology along with challenging internal
and external factors. Since long span of time banking system in India has achieved
exceptional attainments to its credit. Banks are very important and prominent contributor of
financial system in India (Vivek, 2016). Every bank protects money, deposits, and securities
and provides credit options and other payment services including payment services, cheque
facility, money orders etc. investments and insurance products are also now part of banking
services. In spite of providing insurance services, investments services banks still continue to
maintain its primary role as an accepting and lending funds to their customers.
The Financial crunch in the year 1997 and 2009 realized the world to have a healthy and
controlled banking system to have a strong economy and its development. Liberalization on
banking system came into existence through reforms in Indian Banking Sector in 1991.
Banking system in India has been developed I three distinct phases since 1786 (Lu, 2013).
1. Early Phase ( 1786- 1969)
1100 small banks were there in India at that time. Banking Companies Act 1949 was
established to have a smooth functioning of commercial banks. Central Bank of India
(RBI) became Central banking Authority and authorize to control and supervise
Banking Sector in India (Thagunna, 2013).
2. Post Nationalized Period (1969-1991)
SBI was established to act as a key agent of reserve bank of India and manage all
banking activities in India. During early phase of banking system 14 big banks were

3
nationalized to create public confidence in banking sector which gave surety and
assurance of protection and sustainability to banking sector (Qingu, 2013).
3. Post Liberalization Period ( 1991-till now)
In this era mobile banking, ATM, online banking were came into existence in order to
bring liberalization in banking industry which made banking system more efficient,
convenient and transparent ( Qingu, 2013).
Development of banking industry is still going on and in its transition. PSUs constitute 75%
of whole banking sector in India. Where Private Banks has promoted online banking and
enriched the experience of people with latest technology. And they are likely to expand on
India.
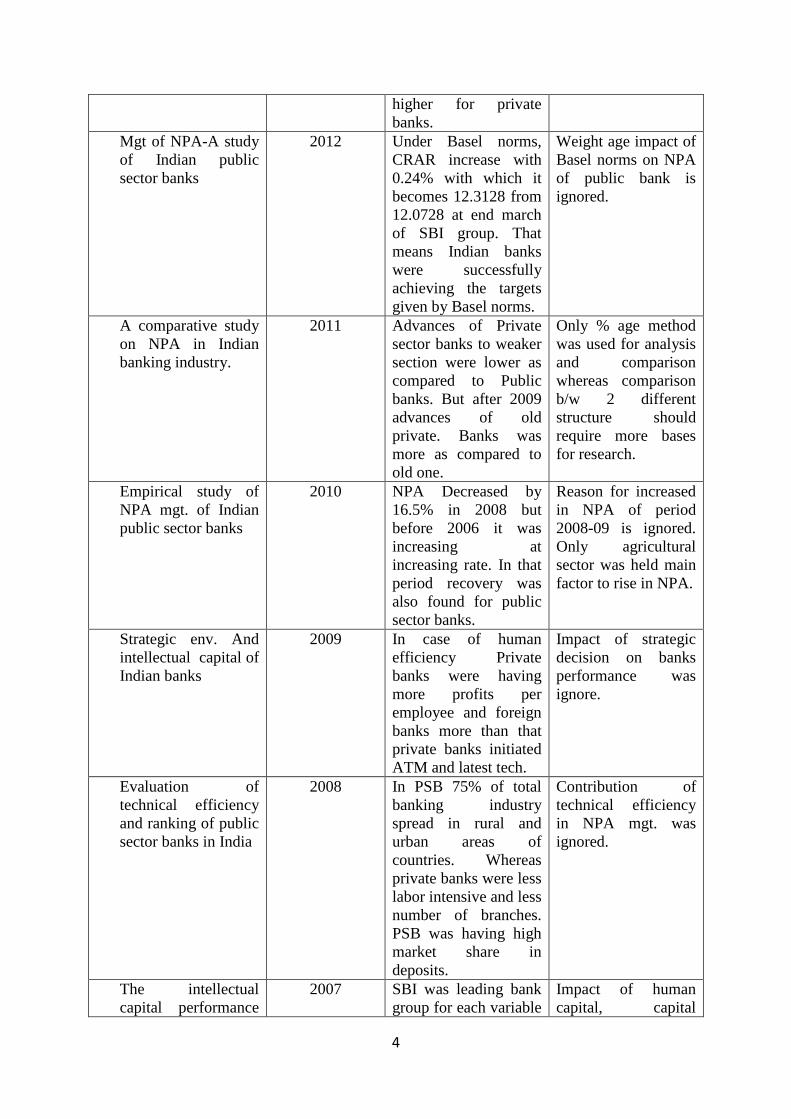
2. REVIEW OF LITERATURE:
Title Year Findings Research Gap
Mgt of NPA in bank:
a comparative study
of commercial &
cooperative banks
with reference to
selected banks in
Pune.
2013 All PSB were having
more than 9% CRAR
which is matter of
concern for Indian
economy.
Random sampling
was not accurate
sample giving option
to measure NPA,
which could be bias.
A Study Of NPA On
Selected Public And
Private Sector Banks
2013 NPA ratio decreased
from 11.95% at end of
march 2003 to 3.28%
march end at
2012.PNB was having
low NPA as compared
to others
Secondary is not well
enough to know
reason for variation
in NPA level.
Management of NPA
in Indian banks-A
qualitative analysis
2012 After 2007 global
crisis, competition and
prudential norms
reduce the growth of
NPA. Operating
expenses were higher
for private sector.
Advances were higher
in public banks
whereas capital and
reserve surplus were
Role of technical
efficiency, human
capital, operating
efficiency is ignored.
Financial crisis on
different sector
differently has been
ignored.
4
higher for private
banks.
Mgt of NPA-A study
of Indian public
sector banks
2012 Under Basel norms,
CRAR increase with
0.24% with which it
becomes 12.3128 from
12.0728 at end march
of SBI group. That
means Indian banks
were successfully
achieving the targets
given by Basel norms.
Weight age impact of
Basel norms on NPA
of public bank is
ignored.
A comparative study
on NPA in Indian
banking industry.
2011 Advances of Private
sector banks to weaker
section were lower as
compared to Public
banks. But after 2009
advances of old
private. Banks was
more as compared to
old one.
Only % age method
was used for analysis
and comparison
whereas comparison
b/w 2 different
structure should
require more bases
for research.
Empirical study of
NPA mgt. of Indian
public sector banks
2010 NPA Decreased by
16.5% in 2008 but
before 2006 it was
increasing at
increasing rate. In that
period recovery was
also found for public
sector banks.
Reason for increased
in NPA of period
2008-09 is ignored.
Only agricultural
sector was held main
factor to rise in NPA.
Strategic env. And
intellectual capital of
Indian banks
2009 In case of human
efficiency Private
banks were having
more profits per
employee and foreign
banks more than that
private banks initiated
ATM and latest tech.
Impact of strategic
decision on banks
performance was
ignore.
Evaluation of
technical efficiency
and ranking of public
sector banks in India
2008 In PSB 75% of total
banking industry
spread in rural and
urban areas of
countries. Whereas
private banks were less
labor intensive and less
number of branches.
PSB was having high
market share in
deposits.
Contribution of
technical efficiency
in NPA mgt. was
ignored.
The intellectual
capital performance
2007 SBI was leading bank
group for each variable
Impact of human
capital, capital

5
of Indian banking
sector
among banks and
mostly all foreign
banks follows that.
employed on NPA
was ignored.
Performance
benchmarking and
strategic homogeneity
of Indian banks
2002 DEA was proved
successful in Taiwan,
Australia, UK, and
Canada. Performance
of public banks
improves over years
except few banks.
Public banks were
good performer as
compared to foreign
banks.
Performance
efficiency for
individual sector
separately was
ignored.
Are Non-Performing
assets Gloomy from
Indian Perspective?
1999 Due to NPA Interest
income ,profitability
,cost of capital gets
affected
Only factors
affecting NPA has
been stressed and
methods for recovery
has been ignored.
FOREIGN STUDIES
Foreign banks entry
and bank
performance in GCC
countries
2016 Foreign banks were
linked with lower
before tax profits, non-
interest income, and
average loan interest
and loan loss
provision. That
increased result entry
of foreign bank does
not increase the
overhead cost in short
run.
Effect on
productivity and
marketability of
Indian bank due to
entry of foreign
bank was ignored.
Determinants of
banks profitability
2014 The effect of specific
characteristic of bank
and macroeconomic
determinants in two
ratio(ROE,NIM).
Loans, credit risk, cost
have +ve impact on
bank performance
whereas NIM have-ve
relation with
profitability.
The effects of
ownership structure
on bank profitability
in Kenya
2013 Banks in sample
produce same level of
o/p of Approx 46-67%
.large banks were used
more efficient in
overall technical
Relation b/s
Productivity and size
of bank was ignored.

6
terms. Which was
followed by small
banks then medium
size banks?
The impact of
foreign bank
strategies on the
behaviour and
performance of czech
and slovak bank in
the financial crisis.
2013 Cost income were –ve
related with banks
performance and
coefficient of size was
having –ve impact on
ROA. Reserve loan
variable has -ve
impact on banks
performance.
Bank size and
efficiency in
developing countries:
intermediation
approach vs value
added approach and
impact of non-
traditional activities
2013 -ve growth of -2.3%
world trade also
decline. But raiffeisen
bank international
despite of crisis
performed better due
to their strategy
composed of reduction
in cost, risk mgt.
collection of debts.
Financial crisis
impact on different
bank performance
was avoided.
Determinants of
Islamic and
conventional banks
performance in GCC
countries
2012 Profitability of banks
is influence by loans,
total equity, inflation
rate and operational
efficiency.
Consequences of the
foreign bank
implantation in
developing countries and
its impact on local
efficiency
2010 Domestic bank found
it difficult to get
adjusted in new env.
Degradation of
efficiency level shows
that banks were failed
to effectively use of
I/P for reducing cost.
Impact of foreign
banks entry on
domestic was not
measured.
Are foreign banks in
developing banks are
more productive?
The case if Taiwan
2010 Productivity of
domestic banks was
higher as compare to
foreign banks, Taiwan
foreign banks were not
having better
technology advantage,
managers of domestic
banks work hard to
learn more mew
methods
Relationship b/w
productivity before
reforms and after
reforms was
avoided.
Data was collected
only for 4 years
which cannot
reliable
Growth strategy and
bank profitability:
case of housing bank
2010 Domestic investors
range from a low of
13452147 to high of

7
75450689 with mean
of 48632450 and std
dv. Of 14452457.
Domestic ownership
have +ve and
significant impact on
profitability.
Banking supervision and
nonperforming loans: a
cross country analysis
2009 Countries like Egypt,
Nigeria, Philippines,
morocco suffered from
bad loans. While
others like Finland,
Australia, and Spain
were having less
number of bad loans.
Supervisory role
surveillance does not
directly affect NPL
but only create
working env.
Relationship b/w
capital adequacy
ratio on performance
of foreign bank,
domestic bank was
ignored.
Study was done only
for 4 years.
Key drivers for
soundness of the
banking sector:
lessons for
developing countries
2006 Infrastructure, IC has
positive but
insignificant effect on
soundness of bank.
Institution and
integrity have +ve
impact on soundness
of bank.
Impact on return of
infrastructure, IC,
innovation on
different sized bank
was not studied
3. OBJECTIVES OF THE STUDY
The present study analyses the performance of banks in India with context to its efficiency,
productivity, bank failure and bank stock performance. Therefore, the following objective has
been finalized:To study the performance and efficiency of different banking sector in India
with reference to different inputs / outputs.
1 To study the NPA provision creation effect on banking performance and how by using
financials of bank, its failure can be predicted in advance.
2 To study the impact of NPA on short-term performance of the Equity Share Price of the
Bank and determining its efficacy for the Trading Opportunities in the Capital Market

8
Objective first, focused on highlighting the efficiency and performance of banking sector in
India with relation to their productivity. For that CAMEL is used to analyze financial health
of the banks and, to validate its results DEA model has been used to know the efficiency
score through key inputs and outputs of banks. 2nd
objective measures the portion from every
bank profits that they sacrifice from their revenues and profits at the cost of provision
creation otherwise this would have been increase profits in banks‟ balance sheet. NPA was
found the prime reason for any bank failure, this study has proposed a model, by using which
bank can predict the early signs of their bankruptcy that would help them to take corrective
actions in advance, because according to IBC code 2016 organizations will be given very less
time for recovery or windup. In the third objective impact of NPA performance on bank stock
performance has been studied and attempt has been made to use that impact or relation in the
capital market as a trading opportunity in capital market. Because creation of NPA locked the
shareholder‟s fund and any trend in bank stock price impacts on shareholder‟s wealth.
4. PERFORMANCE AND EFFICIENCY OF DIFFERENT BANKING SECTORS IN
INDIA
This objective is divided into two parts, first, to study the overall financial health of banks
using CAMEL method which is considered best to analyze financial position of any
organization. In the second part Data Envelopment Analysis has been used to study the
efficiency in the form of productivity in order to compare financials (CAMEL) and
productivity (DEA) of the banks. In addition to this, an effort has been made to study the
banks performance by predicting the banks‟ profits and NPA using historical trends and
comparing with the actual result. The present study is contributing to existed study by
involving all major banks from all banking sector and has tried giving result in form of
dominating sector on performance basis from all. Which is being presented as comparative
study and that will provide a base structure to study further in current research.
The present study is different from previous done studies in the way that, the authors
considered on one sector public, private or foreign .Therefore the present study is supposed to
provide better results as compared to earlier studies because it captures all the three of
leading banking sector collectively in one study tested on CAMEL and DEA parameters
which has not been considered so far.

9
4.1. METHODOLOGY
20 leading banks in India from the public sector, 14 banks from the private sector and 7 banks
foreign banks have been selected for this study. CAMEL is a ratio-based model used to
evaluate the financial performance of banks with the help of different criteria, viz. Capital
Adequacy, Asset Quality, Management Quality, Earnings and Liquidity. The present study is
a descriptive research study based on analytical research design. To measure the capital
adequacy, bank supervisors currently use the capital-risk asset ratio.
Further to validate banks productivity and efficiency DEA (Data Envelopment Analysis) has
been done which helps in analysing the productivity efficiency of any organization. DEA can
deal with multiple inputs vs. multiple output relations in a single framework; it has been
becoming a method of choice for efficiency evaluation in recent days. DEA modelling allows
the analyst to select inputs and outputs in accordance with a managerial focus. DEAOS
software has been used for the same. For NPA and profitability prediction Neural network 7.5
version was used. For performance analysis (CAMEL) data has been used for the year 2001-
2013 whereas for DEA, years from 2002- 2014 has been taken.
4.1.1. VARIABLES USED
Table 4.1: Capital Ratio Analysis
Ratios Formula Criteria
CAR
CAR= Tier one Capital+Tier Two Capital
Risk Weighted Assets
≥ 8%
(Source: Credit Analysis of Financial Institution)
Table 4.2: Asset Quality Ratio Scale
Ratios Formula Criteria
Net NPA Ratio Net NPA
Total Advance
≤ 1%
(Source: Credit Analysis of Financial Institution)

10
Table 4.3: Business per Employee Ratio Scale
Assigned
Scale
Scale 1
(Very Good)
Scale 2
(Satisfactory)
Scale 3
(Fair)
Scale 4
(Marginal)
Scale 5
(Worst)
Business per
Employee
≥ 4 Crore ≤ 4 Crore ≥ 3 Crore ≤ 3 Crore ≥ 2
Crore
≤ 2 Crore ≥ 1
Crore
≤ 1 Crore
(Source: Credit Analysis of Financial Institution)
Table 4.4: Earning Ratio
Ratio Formula Criteria
Return on Asset Net Interest Income
Assets Growth Rate
≥ 1%
(Source: Credit Analysis of Financial Institution)
Table 4.5: Liquidity Ratio
Ratio Formula Criteria
Credit Deposit Ratio Total Credit
Total Deposits
≤ 80%
(Source: Credit Analysis of Financial Institution)
Table 4.6: The CAMEL‟s Composite Rating
Rating
Scale
Rating
Range
Rating
Analysis
Exposure
Limits
Rating Interpretation
1 1.0-1.4 Outstanding 1st Limit The bank outperforms the average bank in all respects
and by easily measurable differences.
2 1.6-2.4 Superior 2nd
Limit Measurably better than the average bank, but not quite
outstanding in all respects
3 2.6-3.4 Average 3rd
Limit A well-run, good bank that just meets all of the major
standards.
4 3.6-4.4 Under-
perform
NR The bank demonstrates a major weakness that if not
corrected, could lead to as very severe or
unsatisfactory condition that will threaten its
existence. This would also include major financial and
or managerial surprises
5 4.6-5.0 Doubtful NR The bank‟s financial health is substandard, with asset
quality impairing over half of the bank‟s primary
capital. If not corrected further deterioration will lead
to regulatory control and a high probability of failure.
(Source: Credit Analysis of Financial Institution)
DEA Model
The following model was specified:
Outputs: Y1 = Advances
11
Y2 = Interest Income
Inputs: X1 = Number of employees
X2 = Deposits
Number of employees is considered as input because without human resource all efforts
made in form of acquiring land, loans, fixed assets are worthless. Human resource is having
the capability to converge maximum output from minimum input. Total deposits (a Liability
item on balance sheet) are considered as an input from economics point of view because
banks are supposed to perform intermediation function to transform loans out of the deposits.
Interest income is considered as one of the output because that is mostly taken as a parameter
to evaluate the banking performance in context of contribution to banks current earnings.
Loan is being accepted as output having the same reason deposits is accepted as input.
Efficiency =1 considered efficient
Efficiency score nearest to 1 considered efficient
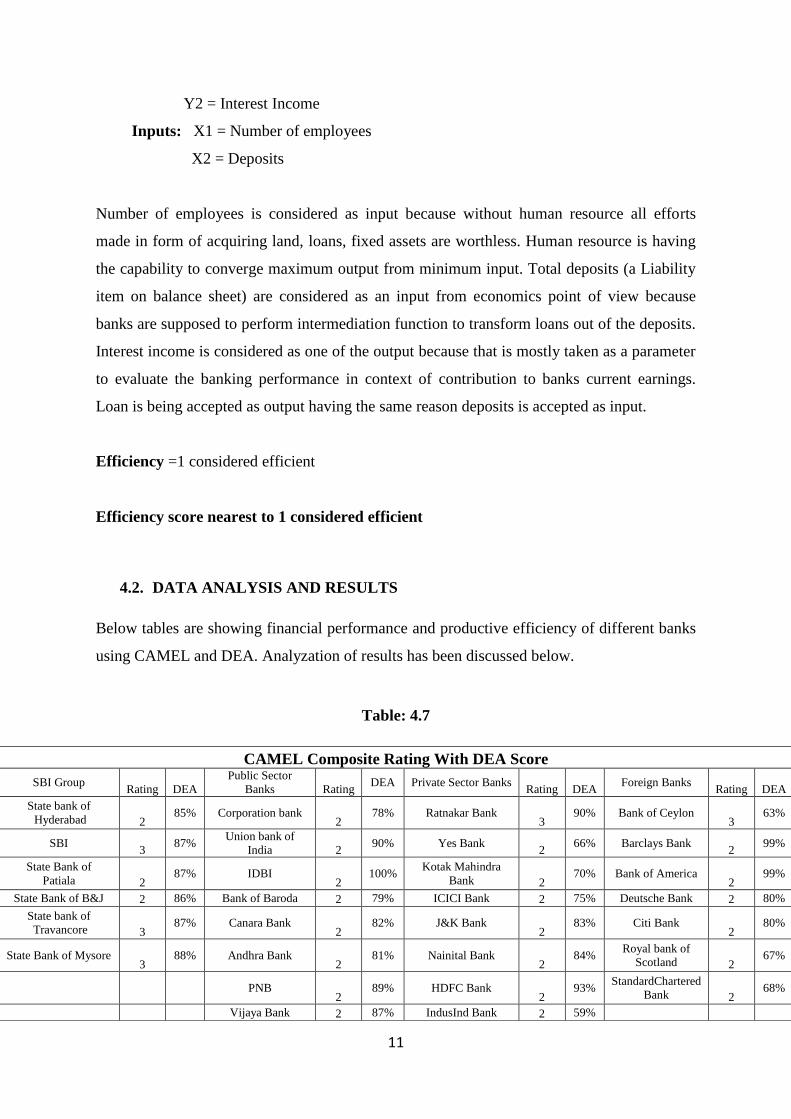
4.2. DATA ANALYSIS AND RESULTS
Below tables are showing financial performance and productive efficiency of different banks
using CAMEL and DEA. Analyzation of results has been discussed below.
Table: 4.7
CAMEL Composite Rating With DEA Score
SBI Group Rating DEA
Public Sector
Banks Rating DEA Private Sector Banks
Rating DEA Foreign Banks
Rating DEA
State bank of
Hyderabad 2 85% Corporation bank
2 78% Ratnakar Bank
3 90% Bank of Ceylon
3 63%
SBI 3
87% Union bank of
India 2 90% Yes Bank
2 66% Barclays Bank
2 99%
State Bank of
Patiala 2 87% IDBI
2 100%
Kotak Mahindra
Bank 2 70% Bank of America
2 99%
State Bank of B&J 2 86% Bank of Baroda 2 79% ICICI Bank 2 75% Deutsche Bank 2 80%
State bank of
Travancore 3 87% Canara Bank
2 82% J&K Bank
2 83% Citi Bank
2 80%
State Bank of Mysore 3
88% Andhra Bank 2
81% Nainital Bank 2
84% Royal bank of
Scotland 2 67%
PNB
2 89% HDFC Bank
2 93%
StandardChartered
Bank 2 68%
Vijaya Bank 2 87% IndusInd Bank 2 59%

12
Table: 4.8
1. Capital Adequacy Ratio
SBI
Group Rating Rank
DEA
Score
Public
Sector Rating Rank
DEA
Score
Private
Sector Rating Rank
DEA
Score
Foreign
Banks Rating Rank
DEA
Score
State bank
of Hyderabad
1 1 85 Corporation
bank 1 1 78
Ratnakar
Bank 1 1 99
Bank of
Ceylon 1 1 63
SBI 1 2 87 Union bank
of India 1 2 90 Yes Bank 1 2 66
Barclays
Bank 1 2 99
State Bank
of Patiala 1 3 87 IDBI 1 3 100
Kotak
Mahindra Bank
1 3 70 Bank of
America 1 3 99
State Bank
of B&J 1 4 86
Bank of
Baroda 1 4 79
ICICI
Bank 1 4 75
Deutsche
Bank 1 4 80
State bank
of Travancore
1 5 87 Canara
Bank 1 5 82
J&K
Bank 1 5 83
Citi
Bank 1 5 80
Table: 4.9
2. Asset Quality
SBI
Group Rating Rank
DEA
Score
Public
Sector Rating Rank
DEA
Score
Private
Sector Rating Rank
DEA
Score
Foreign
Banks Rating Rank
DEA
Score
State Bank of Patiala 2 1
87% Andhra Bank 1 1
86% Nainital
Bank 1 1 84%
Bank of America 1 1
99%
State bank
of
Hyderabad 2 2
85% Corporation
bank 1 2
78% Yes
Bank 1 2
66% Deutsche
Bank 1 2
80%
State bank
of Travancore 2 3
87%
Oriental
bank of commerce 2 3
86% HDFC
Bank 1 3
93%
Standard
Chartered Bank 1 3
68%
State Bank
of B&J 2 4 86% IDBI
2 4 100%
J&K
Bank 1 4 83% Citi Bank
2 4 80%
State Bank
of Mysore 2 5
88% PNB
2 5
89% Axis
Bank 2 5
96% Royal
bank of
Scotland 2 5
67%
Oriental bank of
commerce 2 86% City Union Bank
2 91%
Allahabad Bank 2 81% Axis Bank 2 96%
Punjab And
Sind Bank 3 84% South Indian Bank
2 86%
Bank of India
3 83%
Development
credit Bank 2 89%
UCO bank 3 85% ING Vyasya Bank 3 92%
Central bank
of India 3 79% DhanLaxmi Bank
3 86%

13
Table: 4.10
3. Management Efficiency
SBI Group Rating Rank DEA
Score
Public
Sector Rating Rank
DEA
Score
Private
Sector Rating Rank
DEA
Score
Foreign
Banks Rating Rank
DEA
Score
State bank of
Hyderabad
3 1 85% IDBI 1 1 100% ICICI
Bank 1 1 75%
Barclays
Bank 1 1 99%
State Bank
of B&J 3 2 86%
Oriental bank of
commerce
2 2 86% Axis Bank 1 2 96% Bank of
America 1 2 99%
State Bank
of Patiala 3 3 87%
Corporation
bank 2 3 78%
HDFC
Bank 1 3 93%
Deutsche
Bank 1 3 80%
State bank of
travancore
4 4 87% Andhra
Bank 3 4 86%
IndusInd
Bank 1 4 59% Citi Bank 1 4 80%
SBI 4 5 87% Canara Bank 3 5 82%
Kotak
Mahindra
Bank
3 5 70%
Standard
Chartered
Bank
2 5 68%
Table: 4.11
4. Earning Efficiency
SBI Group Rating Rank DEA
Score
Public
Sector Rating Rank
DEA
Score
Private
Sector Rating Rank
DEA
Score
Foreign
Banks Rating Rank
DEA
Score
SBI 1 1 87% PNB 1 1 89% ICICI
Bank 1 1 75% Citi Bank 1 1 80%
State bank of
Hyderabad
1 2 85% Canara
Bank 1 2 82%
HDFC
Bank 1 2 93%
Standard Chartered
Bank
1 2 68%
State Bank of
Patiala
1 3 87% Bank
of
Baroda
1 3 79% Axis
Bank 1 3 96%
Royal bank of
Scotland
1 3 67%
State bank
of
travancore
1 4 87%
Bank
of
India
1 4 83%
Kotak
Mahindra
Bank
1 4 70% Deutsche
Bank 1 4 80%
State Bank of B&J
1 5 86% IDBI 1 5 100% Yes Bank 1 5 66% Barclays
Bank 1 5 99%
Table: 4.12
5. Liquidity Position
SBI Group Rating Rank DEA
Score
Public
Sector Rating Rank
DEA
Score
Private
Sector Rating Rank
DEA
Score
Foreign
Banks Rating Rank
DEA
Score
SBI 5 1 87% IDBI 5 1 100% Ratnakar
Bank 5 1 90%
Barclays
Bank 5 1 99%
State Bank
of Mysore 5 2 88%
Andhra
Bank 5 2 86%
ICICI
Bank 5 2 75%
Bank of
America 5 2 99%
State bank
of
travancore
5 3 87% PNB 5 3 89%
Kotak
Mahindra
Bank
5 3 70%
Standard
Chartered
Bank
5 3 68%
State Bank
of B&J 5 4 86%
Union bank of
India
5 4 90% IndusInd
Bank 5 4 59%
Deutsche
Bank 5 4 80%

14
State Bank
of Patiala 5 5 87%
Bank
of India
5 5 83% HDFC
Bank 5 5 93% Citi Bank 5 5 80%
Table 4.13: NPA Prediction for the Year 2016
Banks Prediction Good/Bad Residual
State Bank of India 567460 Good -206
Allahabad Bank 101830 Good -18251
Andhra Bank 67972 Good 793
Bank of Baroda 162817 Good -203
Bank of India 219743 Good 2190
Canara Bank 110971 Good 19428
Central Bank of India 127588 Good -8858
Corporation Bank 45537 Bad 25530
IDBI Bank Ltd. 129557 Good -2707 Oriental Bank of
Commerce 77432 Good -770
Punjab & Sind Bank 26644 Good 4178
Punjab National Bank 244150 Good 12798
UCO Bank 115361 Good -12710
Vijaya Bank 28023 Good -3590
Union Bank of India 65757 Good -228
City Union Bank -1608 Bad 4967
Dhanalakshmi Bank 2280 Bad 3303
UTI Bank 46457 Good -5355
Development Credit Bank -2184 Bad 4045
HDFC Bank 25747 Good 8637
Kotak Mahindra Bank 8205 Bad 4167
ICICI Bank 151717 Good -770
IndusInd Bank 4801 Good 828
Yes Bank -4056 Bad 7190
Table 4.14: Net Profit prediction for the year 2017
Banks Prediction Good/Bad Residual
State Bank of India 1,04,841.00 Good 0.00
Allahabad Bank -30,367.12 Good -984.88
Andhra Bank 22,472.83 Good -5,039.83
Bank of Baroda 1,38,314.00 Good 0.00
Bank of India 1,38,314.00 Bad -2,94,145.00
Canara Bank 11,209.59 Good 0.41

15
Central Bank of
India -24,287.67 Bad -103.33
Corporation Bank 56,121.00 Good 0.00
IDBI Bank Ltd. -11,636.79 Bad -39,944.21
Oriental Bank of
Commerce -10,940.00 Good 0.00
Punjab & Sind
Bank 39,881.16 Bad -19,773.16
Punjab National
Bank 13,248.00 Good 0.00
UCO Bank 1,725.53 Bad -20,232.53
Vijaya Bank 50,172.50 Bad 24,876.50
Union Bank of
India 3,41,146.21 Good 2,14,063.79
City Union Bank 37,528.14 Good 12,748.86
Dhanalakshmi
Bank 18,027.54 Bad -20,121.54
UTI Bank 3,67,928.00 Good 0.00
Development
Credit Bank 19,891.25 Good 76.75
HDFC Bank 1,45,496.00 Good 0.00
Kotak Mahindra
Bank 3,41,145.32 Good 4.68
ICICI Bank 9,80,109.00 Good 0.00
IndusInd Bank 25,602.41 Good 3,076.59
Yes Bank 28,293.14 Good 3,04,716.86
Table 4.7 shows composite score of CAMEL rating with DEA productive efficiency score. It
was found that private banks were having higher CAMEL rating as compared to other
categories that show that financial health of private banks is better than others sectors. As
Composite score and DEA score was not able to give clear picture for comparison so, for
further analysis we divided results into different variable separately and used ranking method
for more clarity from table 4.8 to 4.12.
Results of different variable with productivity analysis is discussed which shows following
outcomes.
C- All sector were having good financial health in case of capital adequacy but in
ranking it was observed that lower rank banks of public banks were having high
efficiency score as compared to high rank bank of private banks which shows the
good productivity of public banks.
16
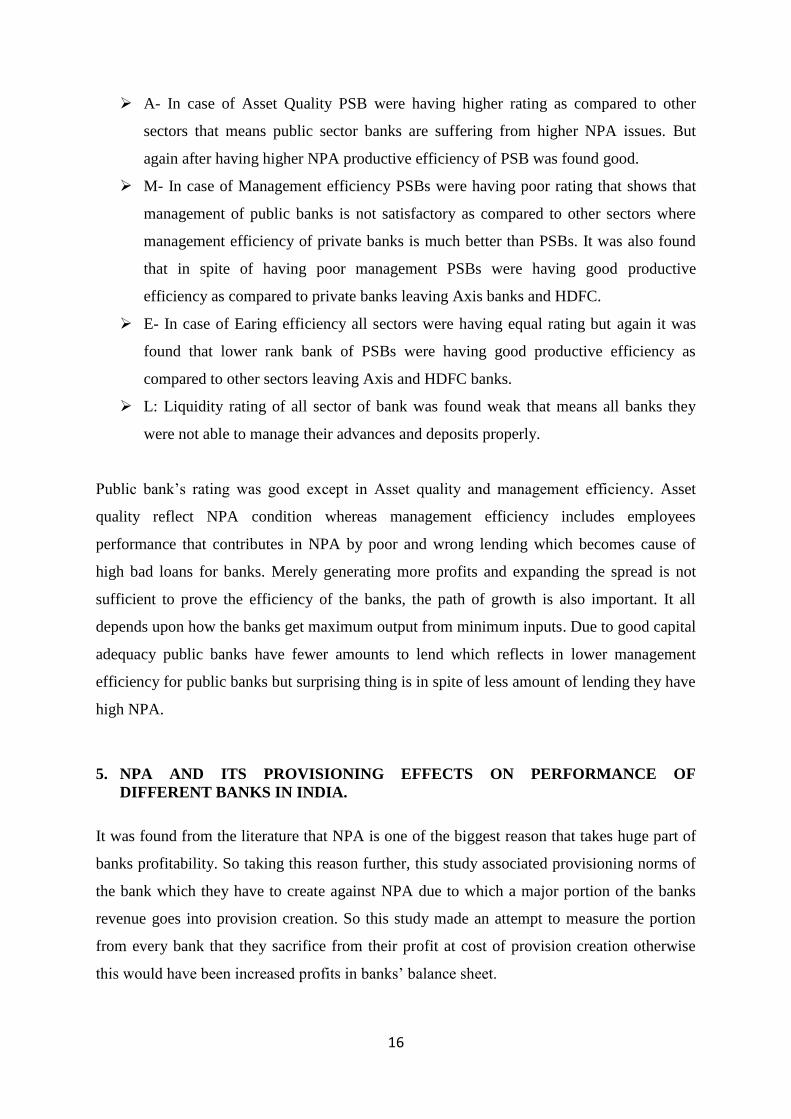
A- In case of Asset Quality PSB were having higher rating as compared to other
sectors that means public sector banks are suffering from higher NPA issues. But
again after having higher NPA productive efficiency of PSB was found good.
M- In case of Management efficiency PSBs were having poor rating that shows that
management of public banks is not satisfactory as compared to other sectors where
management efficiency of private banks is much better than PSBs. It was also found
that in spite of having poor management PSBs were having good productive
efficiency as compared to private banks leaving Axis banks and HDFC.
E- In case of Earing efficiency all sectors were having equal rating but again it was
found that lower rank bank of PSBs were having good productive efficiency as
compared to other sectors leaving Axis and HDFC banks.
L: Liquidity rating of all sector of bank was found weak that means all banks they
were not able to manage their advances and deposits properly.
Public bank‟s rating was good except in Asset quality and management efficiency. Asset
quality reflect NPA condition whereas management efficiency includes employees
performance that contributes in NPA by poor and wrong lending which becomes cause of
high bad loans for banks. Merely generating more profits and expanding the spread is not
sufficient to prove the efficiency of the banks, the path of growth is also important. It all
depends upon how the banks get maximum output from minimum inputs. Due to good capital
adequacy public banks have fewer amounts to lend which reflects in lower management
efficiency for public banks but surprising thing is in spite of less amount of lending they have
high NPA.
5. NPA AND ITS PROVISIONING EFFECTS ON PERFORMANCE OF
DIFFERENT BANKS IN INDIA.
It was found from the literature that NPA is one of the biggest reason that takes huge part of
banks profitability. So taking this reason further, this study associated provisioning norms of
the bank which they have to create against NPA due to which a major portion of the banks
revenue goes into provision creation. So this study made an attempt to measure the portion
from every bank that they sacrifice from their profit at cost of provision creation otherwise
this would have been increased profits in banks‟ balance sheet.

17
NPA is one of biggest reason for bankruptcy because that increase banks liability and make
bank survival in dark. In current scenario RBI has taken decisions to shut down some bank
business in coming years and some banks needs to get merged with other banks for their
survival.so taking this picture further, study has proposed a model to predict bank failure in
its early stage using its financials, that will actually be a helpful for organization to identify
early sign of bankruptcy so that firm can take corrective actions in advance and to stabilize its
performance. Current study will validate few decisions taken by RBI on bank failure model.
5.1. METHODOLOGY:
CAMEL
Bank Failure Model
The computation will be in such a way that after calculating rating of each component
(CAMEL), rating is being combined and average of sum has been calculated. Rating from
1.0-1.4 comes under outstanding category and that indicate that bank is able to perform all of
its functions fully with future protection of solvency. Whereas rating range 4.6- 5.0 comes
under doubtful performance that indicates that banks financial health is in danger and it is on
the way of bankruptcy expressing high probability of bank failure. So it is not at all
recommended for bank to reach at this rating scale. Banks that comes in rating scale of 4 or 5
should not considered by investors as an investment option.
Thus the purpose of study is to observe banks different level of efficiency with the help of
CAMEL and build a model that can predict bank failure which will be early warning system
for banking industry
Discriminant Analysis involves the determination of a linear equation like regression that will
predict which group the case belongs to. The form of the equation or function is:
D = v1X1 + v2 X2 + v3 X3+……………………+ vi Xi + a
Where
D= Discriminant Function
v = Discriminant coefficient or weight for that variable
X= Variable Score (Independent)

18
a = Constant
i = number of predictive variables
Result Score Evaluation
Bankruptcy Model
Z' > 2.9 -“Safe” Zone
1.23 < Z' < 2. 9 -“Grey” Zone
Z' < 1.23 -“Distress” Zone
_ve - Enter bankruptcy Stage
Failure model which basically works on multivariate discriminant analysis, is applied on 13
banks which are merged with different banks from year 2006 to 2016. As those merged banks
are considered as the banks which are not performing well and are financially unstable banks
but still have scope to improve if associated with other bank. Here 2 groups are created one
group is „1‟ one which is considered as group of below average banks (merged bank) or
financially troubled banks. Another group is „2‟ Two which is a group of financially unstable
banks. RBI is planning to windup these banks in coming years. Here 13 banks are used in this
MDA analysis.
Table: A
Different Bank Group:
Group 1 Group 2
Below Average(Merged) About to Fail
State Bank of Hyderabad Uco bank
State Bank of Mysore Indian Overseas Bank
State Bank of Patiala Central bank of India
State Bank of Travancore Dena Bank
INGVyasya Bank of Maharashtra
Bank of Rajasthan
Centurian Bank
Bharat Overseas bank

19
5.2. DATA ANALYSIS AND RESULTS
Graph 5.1 Graph 5.2
Graph 5.3 Graph 5.4
Table 5.1 Table 5.2
Signs Throgh Mean Discriminant Score
20
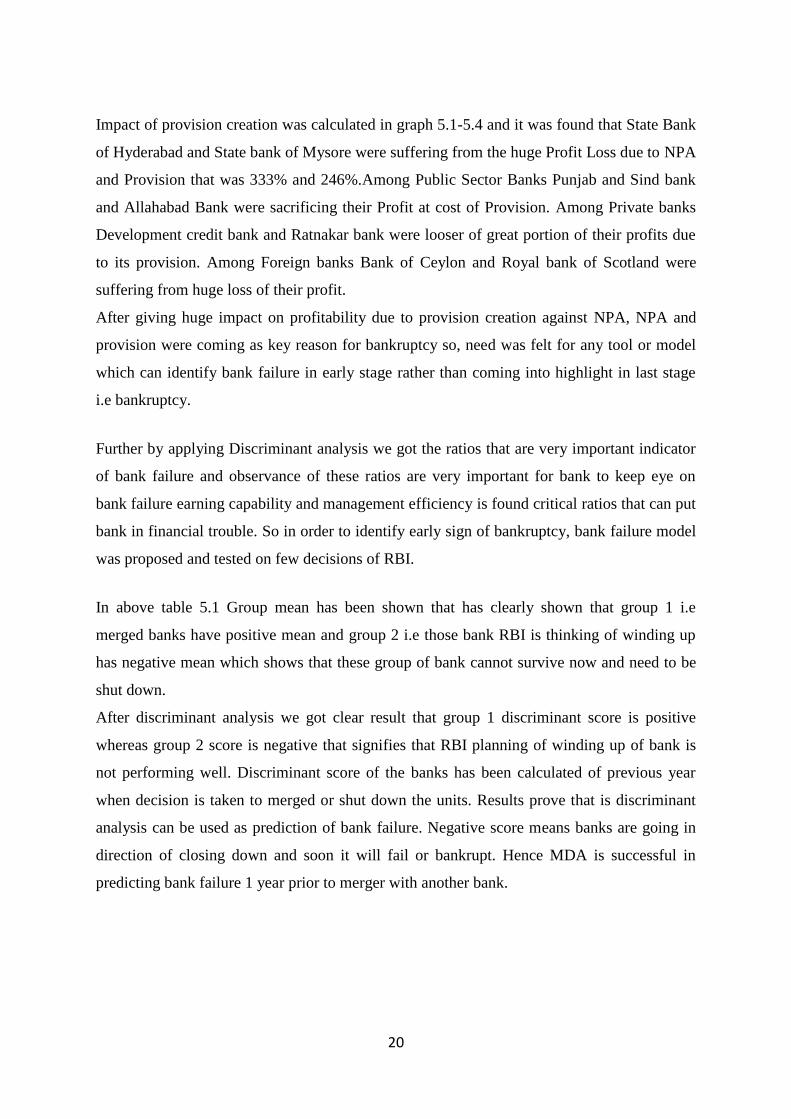
Impact of provision creation was calculated in graph 5.1-5.4 and it was found that State Bank
of Hyderabad and State bank of Mysore were suffering from the huge Profit Loss due to NPA
and Provision that was 333% and 246%.Among Public Sector Banks Punjab and Sind bank
and Allahabad Bank were sacrificing their Profit at cost of Provision. Among Private banks
Development credit bank and Ratnakar bank were looser of great portion of their profits due
to its provision. Among Foreign banks Bank of Ceylon and Royal bank of Scotland were
suffering from huge loss of their profit.
After giving huge impact on profitability due to provision creation against NPA, NPA and
provision were coming as key reason for bankruptcy so, need was felt for any tool or model
which can identify bank failure in early stage rather than coming into highlight in last stage
i.e bankruptcy.
Further by applying Discriminant analysis we got the ratios that are very important indicator
of bank failure and observance of these ratios are very important for bank to keep eye on
bank failure earning capability and management efficiency is found critical ratios that can put
bank in financial trouble. So in order to identify early sign of bankruptcy, bank failure model
was proposed and tested on few decisions of RBI.
In above table 5.1 Group mean has been shown that has clearly shown that group 1 i.e
merged banks have positive mean and group 2 i.e those bank RBI is thinking of winding up
has negative mean which shows that these group of bank cannot survive now and need to be
shut down.
After discriminant analysis we got clear result that group 1 discriminant score is positive
whereas group 2 score is negative that signifies that RBI planning of winding up of bank is
not performing well. Discriminant score of the banks has been calculated of previous year
when decision is taken to merged or shut down the units. Results prove that is discriminant
analysis can be used as prediction of bank failure. Negative score means banks are going in
direction of closing down and soon it will fail or bankrupt. Hence MDA is successful in
predicting bank failure 1 year prior to merger with another bank.

21
5.3 CONCLUSION:
As RBI has introduced IBC (Insolvency and bankruptcy code 2016), which will give very
less time to organizations to recover of liquidate the business, so in that case it is very
important for banks to identify failure signs in advance, so that they can take corrective in
advance. This study has verified bank failure model on testing the ratios of weak bank on the
basis of decision taken by the RBI that has proved that bank failure model can be used by
bank to know early sign of bankruptcy.
This paper concludes, that overall rating of banks give the clear picture of performance of
Indian banking industry. Axis Bank and Yes bank are top rated, Whereas DCB bank and
Dhanlaxmi bank come under below performer rating and rest of bank comes under average
performer rating. That shows that performance of banks in India is not satisfactory where
banks included in sample are topmost banks in India that raise big question on efficiency of
Indian banking sector. The discriminant model gives 5 such ratios from set of 35 ratios
prescribed by RBI while evaluating performance of banks in India. Further analysis is done to
check whether these ratios are capable to predict bank failure or not. As analysis is done on
the basis of 5 ratios, MDA score of banks 1 year prior to merger is negative in case of bank
RBI is proposing to shut down. MDA is applied on same set of ratios of bank to whom RBI
has merged with other banks and the results are positive. Hence it can be concluded that
MDA model is useful in predicting bank failure 1 year prior to merger or closing down.
6. NON-PERFORMING ASSETS AND SWING TRADING IN CAPITAL MARKET
Till now in the study NPA was found very crucial component in banks performance which
banks have to declare quarterly, semester wise and yearly so, Literature gave rise to one
question that when banks declare their results how crucial that information can be for stock
price of the same bank for the trading opportunities.
This study examines the relationship between NPA announcements by banks and the
impulsive movement in bank stock price brought out by these announcements. NPA basically
locked the shareholders fund in it and performance of NPA impacts the performance of bank
stock price. Primary focus of this study is to know the impact of NPA movement on bank
share performance on which basis attempt has been made to create a swing trading model
based on back testing the data for the banking stocks listed on the Indian bourses.

22
The main objective of this study is two-fold. Firstly, it delves into investigating the relation
between NPA movement and its impact on share price movement before and after 2 days of
NPA declaration by the bank. Secondly, it tries to refine this knowledge in to an objectively
defined trading plan for a short term trader
6.1 METHODOLOGY
To achieve this objective we created a database spanning ten years (2006 to 2016) and
collected the daily share prices of eight banks listed on Bombay Stock Exchange (BSE). The
relationship between share price and changes in NPA is studied on the basis of correlation
studies and panel-data analysis. Although correlation studies does not establish any
significant relationship, but the result of panel-data analysis clearly shows a negative
relationship between the two. The result is further utilized to develop swing trading model
and get benefit out of it. The novelty of the present study is that it clearly guides the swing
traders as to how to earn benefit because of fluctuations in share price due to announce of
NPA result.
6.2 TOOLS:
Correlation
Back Testing
Panel Data Analysis
Table: 6.1
Summary of Correlation and Win/Lose Traded
SBI PNB BOB Axis Bank HDFC ICICI Kotak
Mahindra
IDBI
Correlation -0.36 -0.44 -0.55 0.003 0.21 -0.13 -0.34 -0.08
Win
Trade
Lose
Trade
Win
Trade
Lose
Trade
Win
Trade
Lose
Trade
Win
Trade
Lose
Trade
Win
Trade
Lose
Trade
Win
Trade
Lose
Trade
Win
Trade
Lose
Trade
Win
Trade
Lose
Trade
No. Of
Trades 7 3 8 2 6 4 6 4 7 3 5 5 7 3 3 6
Return 50% 6% 56% 4% 67% 8% 22% 7% 18% 15% 30% 9% 43% 5% 6% 12% Total
Return 44% 52% 59%
15% 3% 21% 38% -6%

23
Above table explains the correlation between change in NPA and change in Share price. It
was found in the study that all public sector banks except IDBI having negative bit
insignificant relation and in case of Axis bank and HDFC were found positive but
insignificant relationship.
It was further tested in model that if a swing trader makes trade on the basis of given
correlation what return along with different trades he will get. To improve on this model we
have also back-tested the more profound 2% stop loss scenario to improve upon the Risk-
Reward profile for the trader. So in brief, the strategy we suggest for this wing trading model
can be defined as follows:
1. Understand the correlation between NPA and 4-day stock movement for your banking
stock.
2. On the basis of above correlation, +ve or –ve, trade this stock on the next result event.
3. Do not focus on the magnitude of the correlation only caveat being that it should not
be close to zero.
4. After entering the trade, hold the stock for 4 days and exit on the close of this 4th
day.
5. Do not set any profit target but it is advisable to put a loss target of 2%.
It was found in case of SBI that if trader on the basis of negative correlation, go with short
trade if NPA increases and vice-versa, his winning trade will be more than losing trade with
44% return. In case of other banks as well except IDBI, all the banks were giving positive
returns on basis of win lose trade.
It was found in the model that if correlation was very insignificant (close to 0) the return
based on the above rules provide paltry returns whereas trades where we observe significant
correlation (close to +/- 1) we can expect generating fair returns. That shows that if a swing
trader on the basis of given correlation make a trade and take the position 2 days prior of
NPA results to 2 days after he/she can generate positive returns on these stocks.
6.3 CONCLUSION:
The money locked up in NPAs has a direct impact on shareholders‟ investment, profitability
and market capitalization of the bank as Indian banks are highly dependent on income from
interest on funds lent. This analysis has been emphasized for the period of 2006- 2016. In this
period the NPA of SBI was on a rise and the stock prices were as usual in there waves.
Similar observations could be made for other banking stocks as well. Through this study we

24
can safely conclude that NPA may not be a strong or the only criteria for judging the health
of any particular bank and making an investment decision solely based on this but we can use
NPA as a catalyst in generating positive returns as this can be used to identify and exploit the
herd mentality of the crowd and the emotional impact, though short term, this crowd brings in
to the stock market due to its actions prodding out more due to emotions than based on facts
and data.
7 FINDINGS AND DISCUSSIONS OF THE STUDY
Public banks were having good productive efficiency with reference to input output. But in
case of separate variables analysis of camel rating which reflects financial health of banks, it
was found that all banks are having good capital adequacy ratio. In case of public banks high
capital adequacy ratio leads to lower management efficiency due to less availability of funds
as most of funds have been reserved in form of capital adequacy. Poor management can also
lead to bad loans by wrong lending decisions that we can see on asset ratio and management
efficiency ratio but shocking results were found when even after lower circulation of funds
PSB are having higher NPA and when earnings ratio was compared among sectors all sectors
were found satisfactory. It was also found in the study when performance of all three sectors
was compared, foreign banks are somehow having different agenda tilted towards in
investments so comparison of foreign banks with public and private banks is not advisable.
So with reference so first objective public sector banks were found efficient but merely
generating more profits and expanding the spread is not sufficient to prove the efficiency of
the banks, the path of growth and NPA management is also important. It all depends upon
how the banks get maximum output from minimum inputs. So all sectors were rated well but
PSBs were found poor in asset quality (NPA) and lower management performance.
In context of second objective, study has work as in indicator of bankruptcy and it was found
that Public sector banks sacrifice huge portion of their profits for the NPA provision creation
as compared to private banks which became biggest reason for their failure in CAMEL ratio.
NPAs upon banks erode current profit through provisioning requirements which result in
reducing the interest income and profit. Bank failure model was proposed and tested on the
decisions taken by RBI was found useful in predicting bank failure and if banks are regularly
using this model they can get sign of bankruptcy in advance and can cure it specially in case
of public sector banks.

25
With reference to third objective, this study has developed a back testing model which has
been done first time in India and it found NPA performance as a reliable information in
generating positive returns as this can be used to identify and exploit the herd mentality of the
crowd and the emotional impact, though short term, this crowd brings in to the stock market
due to its actions prodding out more due to emotions than based on facts and data. The money
locked up in NPAs has a direct impact on shareholders' investment, profitability and market
capitalization of the bank as Indian banks are highly dependent on income from interest on
funds lent. When we tested NPA and stock price relationship with its efficacy in trading
opportunity through back testing model in capital market, possibility for swing trader to
predict the return and its magnitude of return using this developed model was found possible.
8 CONCLUSION OF THE STUDY:
Public banks are very important segment of financial sector, somehow being government
bank they have more social responsibility towards the society, which affects their
performance level. Public banks were found more efficient in case of productivity as
compared to others but still not performing well. Current study has validated bankruptcy
model which will help banks to know early sign of failure in advance which will protect them
from bad effects of IBC 2016. Banks are under too much pressure to implement Basel III
norm till 31st march 2019 which is also affecting their decision as banks have to show CAR
of Rs. 120 lakh Crore rupees. The money locked up in NPAs has a direct impact on
shareholders' investment, profitability and market capitalization of the bank as Indian banks
are highly dependent on income from interest on funds lent. When we tested NPA and stock
price relationship with its efficacy in trading opportunity through back testing model in
capital market, possibility for swing trader to predict the return and its magnitude of return
using this developed model was found possible. Banks needs to do keep proper watch on
their financials; proper use of its financials and less window dressing can give them clear
picture about their survivorship.
9 LIMITATIONS OF THE STUDY AND SCOPE FOR FUTURE RESEARCH
The study has few limitations like, it focus on only banks existing in India. Methodology that
has been used in this study on banks in India like back testing model for trading opportunity
26
and bank failure model raise question that will these models works in foreign country same
way they have worked in banks in India. So, further research can be done using same models
and approaches on foreign countries and comparing it with banks in India. Window dressing
in bank‟s financials can disturb the results of the study.
10. REFERENCES OF SELECTED PAPERS
Aftab, M., Ahamad, S., Ullah, W., & Sheikh, R. A. (2011). The Impact of Bank
Efficiency on Share Performance: Evidence from Pakistan. African Journal of
Business Management, 5 (10), 3975-3980.
Abdelkader, Boudriga (2009). Banking Supervision and Nonperforming Loans: A
Cross‐Country Analysis. Journal of Financial Economic Policy, 1(4), 286 – 318.
Altunbas, Y., Carco, S., Gardener, E. P., & Molyneux, P. (2007). Examining the
Relationships between Capital, Risk and Efficiency in European Banking. European
Financial Management, 13(1), 49-70.
Aryeetey. E (1996). The Formal Financial Sector in Ghana after the Reforms. ODI
working paper 86.
Chhikar, Kodan. (2013). Analysis of Non-performing Assets in Indian Banking
Industry. Indian Journal of Finance and Economic Management, 1(1), 113-136.
Cornett. M., & Tehranian, H. (1992). Changes In Corporate Performance Associated
With Bank Acquisitions. Journal of Financial Economics 31. 211-234.
Darrat. F, Topuz. (2002). Assessing Cost and Technical Efficiency of Banks in
Kuwait. ERF‟s 8th Annual Conference, Cairo.
Gülin (2013). Efficiency And Stock Performance Of Banks In Transition Countries: Is
There A Relationship. International Journal of Economics And Financial Issues, 3(2)
355-369.
Gormley. A (2007). Banking Competition in Developing Countries: Does Foreign
Bank Entry Improve Credit Access. John M. Olin School of Business.
Grigorian, D. A., & Manole, V. (2002). Determinants of Commercial Bank
Performance in Transition: An Application of Data Envelopment Analysis. IMF
Working Paper WP/02/146 .
Hardy, D., & Patti, E. (2001). Bank Reforms and Banks Efficiency in Pakistan. IMF
Working Paper, WP/01/138

27
Manjule (2013). Non-Performing Assets (NPA) - A Challenge for Indian Public
Sector Banks, Research Journali‟s Journal of Finance, 1 (2).
Rao. K (2015). Non-Performing Asset Impact on Banking Equity Values - A Study.
IRJA-Indian Research Journal, 2(2).
Rakshit. Debdas (2012). NPA Management of Rural Cooperative Banks of West
Bengal: An Overview. Business Spectrum, 1 (3).
Wachasunder. (2016). A Study on Impact of Non-Performing Assets on SBI Equity
Values From the Year 2011 – 12 to 2015 – 16. Journal of Information, Knowledge
and Research in Business Management and Administration, 4(1). 108-111.
Yadav. Ram (2012). Productivity Efficacy in New Paradigm of Banking-A Study of
Indian Banks. Compendium 12 test: Layout 1.
11. PAPER PUBLICATIONS:
1. Madhvi, and Srivastava, A. (2017). Prediction of Bank Failure Using Financial
Ratios. International Journal of Economic Research, 14(16) III, 421-430, ISSN 0972-
9380 (UGC, Scopus)
2. Madhvi, and Srivastava, A. (2017). An Analysis of Efficiency and Profitability of
Indian Banks Using DEA Approach. International Journal of Applied Business and
Economic Research, 15 (23) II, 331-339. ISSN 0972-7302. (UGC, Scopus)
3. Madhvi, Gautam, A., and Srivastava, A. (2017). Is NPA and Stock Return Related:
An Empirical Study of Back Testing Model. Purushartha, 10 (1), 89-96, ISSN 0975-
024X (UGC, Scopus)
4. Madhvi, and Srivastava, A. (2017). Is NPA Provisioning Boon Or Bane For Indian
Banking Sector? Journal of Advance Management Research, 5 (4), 176-189, ISSN
2393-9664 (UGC)
5. Madhvi, and Srivastava, A. (2017). Measuring Efficiency of Commercial Banks in
India - A DEA Study. British Journal of Economics, Finance and Management
Sciences, 13 (2), 82-92, ISSN 2048-125X.
6. Madhvi, and Srivastava, A. (2016). A Comparative Study on Dominance and
Performance of Banks in India Using Camel Method. SDIMT- Management Review,
3 (1), 70-75, ISSN 2320-5814.

28
12. CONFERENCES ATTENDED:
International Conference at FORE School of Management, New Delhi, 28-29th
Nov.
2014.
Paper Presented: “A Comparative Study on Dominance and Performance of Banks in
India Using Camel Method”
International Conference on “Crypto currency – The Art and Science of Trading and
Mining the beast”- Emirates Institutes for Banking and Financial Services, Dubai,
UAE. March, 2018.