Performance of a Supercritical CO2 Bottoming Cycle for ...
27
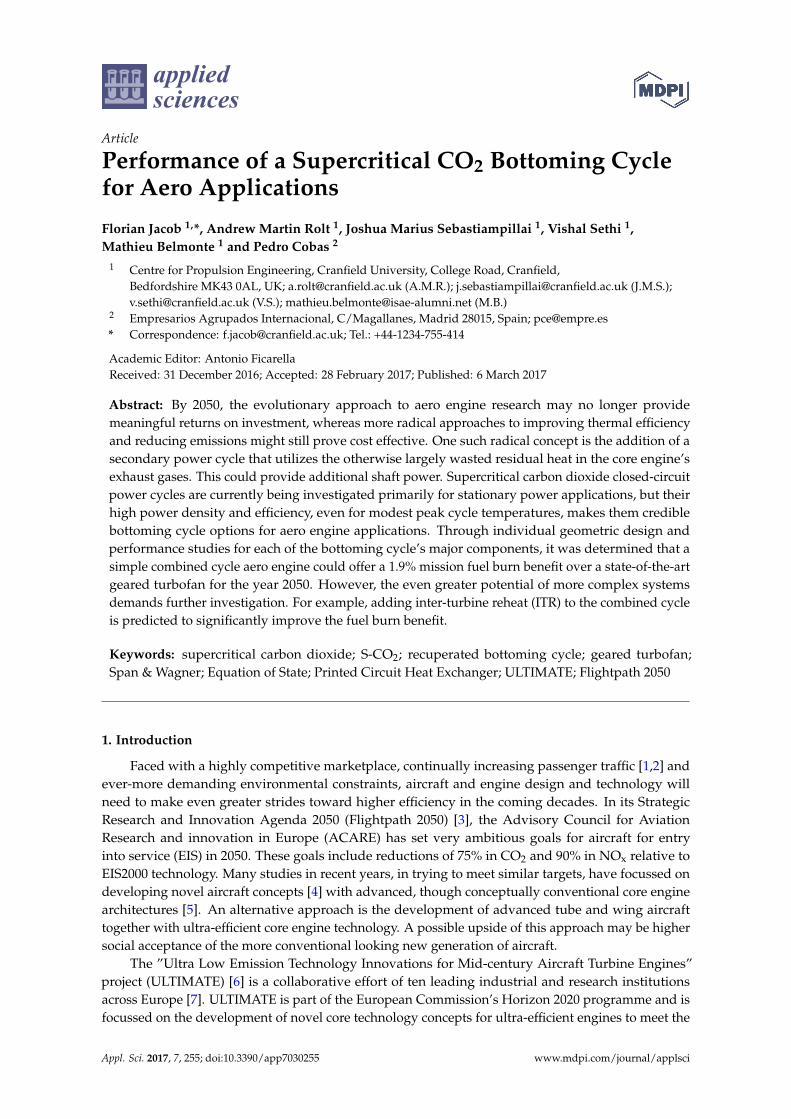
applied sciences Article Performance of a Supercritical CO 2 Bottoming Cycle for Aero Applications Florian Jacob 1, *, Andrew Martin Rolt 1 , Joshua Marius Sebastiampillai 1 , Vishal Sethi 1 , Mathieu Belmonte 1 and Pedro Cobas 2 1 Centre for Propulsion Engineering, Cranfield University, College Road, Cranfield, Bedfordshire MK43 0AL, UK; a.rolt@cranfield.ac.uk (A.M.R.); j.sebastiampillai@cranfield.ac.uk (J.M.S.); v.sethi@cranfield.ac.uk (V.S.); [email protected] (M.B.) 2 Empresarios Agrupados Internacional, C/Magallanes, Madrid 28015, Spain; [email protected] * Correspondence: f.jacob@cranfield.ac.uk; Tel.: +44-1234-755-414 Academic Editor: Antonio Ficarella Received: 31 December 2016; Accepted: 28 February 2017; Published: 6 March 2017 Abstract: By 2050, the evolutionary approach to aero engine research may no longer provide meaningful returns on investment, whereas more radical approaches to improving thermal efficiency and reducing emissions might still prove cost effective. One such radical concept is the addition of a secondary power cycle that utilizes the otherwise largely wasted residual heat in the core engine’s exhaust gases. This could provide additional shaft power. Supercritical carbon dioxide closed-circuit power cycles are currently being investigated primarily for stationary power applications, but their high power density and efficiency, even for modest peak cycle temperatures, makes them credible bottoming cycle options for aero engine applications. Through individual geometric design and performance studies for each of the bottoming cycle’s major components, it was determined that a simple combined cycle aero engine could offer a 1.9% mission fuel burn benefit over a state-of-the-art geared turbofan for the year 2050. However, the even greater potential of more complex systems demands further investigation. For example, adding inter-turbine reheat (ITR) to the combined cycle is predicted to significantly improve the fuel burn benefit. Keywords: supercritical carbon dioxide; S-CO 2 ; recuperated bottoming cycle; geared turbofan; Span & Wagner; Equation of State; Printed Circuit Heat Exchanger; ULTIMATE; Flightpath 2050 1. Introduction Faced with a highly competitive marketplace, continually increasing passenger traffic [1,2] and ever-more demanding environmental constraints, aircraft and engine design and technology will need to make even greater strides toward higher efficiency in the coming decades. In its Strategic Research and Innovation Agenda 2050 (Flightpath 2050) [3], the Advisory Council for Aviation Research and innovation in Europe (ACARE) has set very ambitious goals for aircraft for entry into service (EIS) in 2050. These goals include reductions of 75% in CO 2 and 90% in NO x relative to EIS2000 technology. Many studies in recent years, in trying to meet similar targets, have focussed on developing novel aircraft concepts [4] with advanced, though conceptually conventional core engine architectures [5]. An alternative approach is the development of advanced tube and wing aircraft together with ultra-efficient core engine technology. A possible upside of this approach may be higher social acceptance of the more conventional looking new generation of aircraft. The ”Ultra Low Emission Technology Innovations for Mid-century Aircraft Turbine Engines” project (ULTIMATE) [6] is a collaborative effort of ten leading industrial and research institutions across Europe [7]. ULTIMATE is part of the European Commission’s Horizon 2020 programme and is focussed on the development of novel core technology concepts for ultra-efficient engines to meet the Appl. Sci. 2017, 7, 255; doi:10.3390/app7030255 www.mdpi.com/journal/applsci
Transcript of Performance of a Supercritical CO2 Bottoming Cycle for ...
applied sciences
Article
Performance of a Supercritical CO2 Bottoming Cyclefor Aero Applications
Florian Jacob 1,*, Andrew Martin Rolt 1, Joshua Marius Sebastiampillai 1, Vishal Sethi 1,Mathieu Belmonte 1 and Pedro Cobas 2
1 Centre for Propulsion Engineering, Cranfield University, College Road, Cranfield,Bedfordshire MK43 0AL, UK; [email protected] (A.M.R.); [email protected] (J.M.S.);[email protected] (V.S.); [email protected] (M.B.)
2 Empresarios Agrupados Internacional, C/Magallanes, Madrid 28015, Spain; [email protected]* Correspondence: [email protected]; Tel.: +44-1234-755-414
Academic Editor: Antonio FicarellaReceived: 31 December 2016; Accepted: 28 February 2017; Published: 6 March 2017
Abstract: By 2050, the evolutionary approach to aero engine research may no longer providemeaningful returns on investment, whereas more radical approaches to improving thermal efficiencyand reducing emissions might still prove cost effective. One such radical concept is the addition of asecondary power cycle that utilizes the otherwise largely wasted residual heat in the core engine’sexhaust gases. This could provide additional shaft power. Supercritical carbon dioxide closed-circuitpower cycles are currently being investigated primarily for stationary power applications, but theirhigh power density and efficiency, even for modest peak cycle temperatures, makes them crediblebottoming cycle options for aero engine applications. Through individual geometric design andperformance studies for each of the bottoming cycle’s major components, it was determined that asimple combined cycle aero engine could offer a 1.9% mission fuel burn benefit over a state-of-the-artgeared turbofan for the year 2050. However, the even greater potential of more complex systemsdemands further investigation. For example, adding inter-turbine reheat (ITR) to the combined cycleis predicted to significantly improve the fuel burn benefit.
Keywords: supercritical carbon dioxide; S-CO2; recuperated bottoming cycle; geared turbofan;Span & Wagner; Equation of State; Printed Circuit Heat Exchanger; ULTIMATE; Flightpath 2050
1. Introduction
Faced with a highly competitive marketplace, continually increasing passenger traffic [1,2] andever-more demanding environmental constraints, aircraft and engine design and technology willneed to make even greater strides toward higher efficiency in the coming decades. In its StrategicResearch and Innovation Agenda 2050 (Flightpath 2050) [3], the Advisory Council for AviationResearch and innovation in Europe (ACARE) has set very ambitious goals for aircraft for entryinto service (EIS) in 2050. These goals include reductions of 75% in CO2 and 90% in NOx relative toEIS2000 technology. Many studies in recent years, in trying to meet similar targets, have focussed ondeveloping novel aircraft concepts [4] with advanced, though conceptually conventional core enginearchitectures [5]. An alternative approach is the development of advanced tube and wing aircrafttogether with ultra-efficient core engine technology. A possible upside of this approach may be highersocial acceptance of the more conventional looking new generation of aircraft.
The ”Ultra Low Emission Technology Innovations for Mid-century Aircraft Turbine Engines”project (ULTIMATE) [6] is a collaborative effort of ten leading industrial and research institutionsacross Europe [7]. ULTIMATE is part of the European Commission’s Horizon 2020 programme and isfocussed on the development of novel core technology concepts for ultra-efficient engines to meet the
Appl. Sci. 2017, 7, 255; doi:10.3390/app7030255 www.mdpi.com/journal/applsci
Appl. Sci. 2017, 7, 255 2 of 27
goals of Flightpath 2050. These concepts aim to reduce the extent of “The Big Three” loss sources ofmodern aero engines: the combustor loss, the core exhaust loss and the bypass flow loss [6]. Table 1lists the overall goals of Flightpath 2050. It also shows the shares of those goals that are to be achievedthrough improved aircraft and engine designs overall and how much of those benefits are supposed toarise from the novel concepts of ULTIMATE.
Table 1. Flightpath 2050 goals and target contributions of ULTIMATE concepts.
Category OverallFlightpath 2050
AircraftSpecific
From ULTIMATETechnologies Concept Alone
Energy consumption and CO2 emissions −75% −68% −15%Total Mission and Cruise NOx −90% −87% −20%
Noise per operation −65% (15 dB) −15 dB −3 dB
One such technological concept to mitigate the core exhaust losses is to add a closed-circuitBottoming Cycle, featuring supercritical carbon dioxide (S-CO2) as its working fluid. Bottoming Cyclesare already proven to enable a step change in efficiency for gas turbines, when applied to stationarypower generation plants. In a combined cycle gas turbine (CCGT) power plant, part of the residualheat in the turbine’s exhaust gases is transferred to a secondary power cycle that uses the low gradeheat to generate additional shaft power. The vast majority of these Bottoming Cycles use steam asthe working fluid. As a result, state-of-the-art CCGTs can achieve a thermal efficiency in excess of61% [8], an approximate increase of 20%, which would be impossible in a standalone gas turbine cycle.In stationary power applications, combined cycle power plants dramatically outperform recuperatedgas turbines. Whether the same will be true for weight and drag constrained aero engine designs, isyet to be determined.
Bottoming Cycles for aero application have been a largely overlooked concept to date, as mostof the studies predicted the machinery and heat exchangers involved would be too large and heavy.In 1996, Bolland et al. [9] proposed an Air Bottoming Cycle (ABC) to enhance the efficiency of anaero-derivative LM2500PE in off-shore application. While successful in raising the efficiency from36.1% for the LM2500PE to 46.6% in the combined cycle, the bottoming cycle had a “power density” ofonly 43 kW/t. This is more than two orders of magnitude below the power density of the main engine.Bolland et al. prioritised cycle efficiency over compactness and designed high effectiveness heatexchangers which would be too big for aero applications. Even with smaller heat exchangers, the lowpower density of an ABC could be a limiting factor at low peak temperatures. Lundbladh et al. [10]recently investigated a turbofan with an integrated open air bottoming cycle, which promised apotential efficiency gain of 5%–8% relative to a projected EIS2025 turbofan. This translated into areduction in thrust specific fuel consumption (TSFC) of 3.7% at cruise, but the study did not calculate aweight increase or estimate a fuel burn benefit. Lundbladh et al. did however estimate the weight for asteam bottoming cycle option and found it cancelled out all of the efficiency benefits.
Clemente et al. [11] showed Organic Rankine Cycles (ORC) can feature good cycle efficiencieswith low grade heat sources. However, they note that most organic fluids feature critical points(“The critical point is the point at which the saturated liquid and the saturated vapour states are identical.” asper [12]) below 600 K or often even 450 K. Consequently, to avoid exceeding the fluid’s critical pointwhen paired with heat sources between 650 and 900 K, the heat exchangers’ effectiveness will need tobe limited. This means only a fraction of the available heat energy will be recovered even if the massflow of the bottoming cycle is increased. This, combined with the highly flammable nature of mostorganic fluids, challenges their feasibility in aero applications, where safety and compactness are vital.Finally, many popular organic fluids have a large global warming potential (GWP). R245fa for examplehas approximately 950 times the GWP of CO2 [13]. Nonetheless, the power density of ORCs is goodfor low grade heat applications and Perullo et al. [14] proposed an ORC bottoming cycle for a turbofan.That particular bottoming cycle did not produce additional shaft power for the main engine, but was

Appl. Sci. 2017, 7, 255 3 of 27
designed to replace the conventional power generators for the environmental control system (ECS) ofthe aircraft and provide anti-icing. The study only predicted a 0.9% fuel burn reduction though thismight have risen to 2.3%, if the new components could have been designed to be weight neutral tothe reference engine, an unlikely scenario. Another study of an ORC added to an aero engine waspresented by Petit et al. [15]. Here, the ORC cycle did not recover waste heat from the exhaust, butwas conceptualised as an alternative intercooling concept, that also produced shaft power. The studyestimated a possible 3% benefit in TSFC over conventional intercooling concepts, though the likelyconsiderable impact of the installation’s increase was not determined.
Supercritical CO2 cycles have been investigated since the 1960s [16], but technical limitations, bothcomputational and physical, prevented major strides on the subject until the turn of the millennium.Since then, numerous studies have investigated and conceptualised various S-CO2 cycles: as standalonepower cycles for nuclear applications [17], in concentrated solar power plants [18] or for waste heatrecovery [19]. Many of these studies were conducted using established performance simulation toolssuch as NPSS [20], which were expanded in their functionality through supercritical CO2 fluid propertyfunctions. These tools often do not include accurate physical representations of the components bydefault, but rather work under simplified assumptions such as prescribed effectivenesses and pressurelosses in the heat exchangers. The creation of more detailed, though still computationally inexpensive,external models is therefore often necessary to improve the accuracy of the results. First test rigs are inoperation, or under construction [21], to prove the concept, validate the simulation tools and furtheranalyse the steady-state [22] and transient [23] behaviour of S-CO2 cycles. To date, the authors knowof only one published paper describing an investigation of S-CO2 bottoming cycles for aero engineapplication [24]. This predicts a 2.8% TSFC improvement relative to a GE90-94b-like engine model,but no fuel burn advantage on account of the excessive weight of the cooler. However, the study alsoacknowledges that its proposed heat exchanger geometry is just a first attempt and a sub-optimaldesign. This study clearly highlights the need for preliminary design tools that allow for trade-offstudies of physical component parameters, such as tube geometry and count.
Hence, the purpose of this study is to outline an approach to adequately size and evaluate anS-CO2 bottoming cycle that provides additional shaft power to the low pressure shaft, while adheringto the significant size and weight restrictions of an aero application. Special emphasis is given to thedetailed modelling of the involved compact heat exchangers. The detail of the models, combined withthe rare application of S-CO2 in an aero engine clearly distinguishes this study from previous works.Through parametric studies, a recuperated S-CO2 bottoming cycle (RBC) is derived that providesa mission fuel burn benefit of approximately 2% over a projected year 2050 ultra-high bypass ratiogeared turbofan engine (TF2050). The cycle features an approximate power density of 1.39 MW/t,making it over 30 times more power dense than the ABC of Bolland et al. and much more suitablefor an aero engine. Further possible improvements on the concept and methodology are proposed.Figure 1 below illustrates the approximate layout of a geared turbofan engine featuring an RBC. Notethat to improve visibility of the graphic the dimensions of the bottoming cycle are not perfectly to scale.
Appl. Sci. 2017, 7, 255 3 of 27
control system (ECS) of the aircraft and provide anti-icing. The study only predicted a 0.9% fuel burn reduction though this might have risen to 2.3%, if the new components could have been designed to be weight neutral to the reference engine, an unlikely scenario. Another study of an ORC added to an aero engine was presented by Petit et al. [15]. Here, the ORC cycle did not recover waste heat from the exhaust, but was conceptualised as an alternative intercooling concept, that also produced shaft power. The study estimated a possible 3% benefit in TSFC over conventional intercooling concepts, though the likely considerable impact of the installation’s increase was not determined.
Supercritical CO2 cycles have been investigated since the 1960s [16], but technical limitations, both computational and physical, prevented major strides on the subject until the turn of the millennium. Since then, numerous studies have investigated and conceptualised various S-CO2 cycles: as standalone power cycles for nuclear applications [17], in concentrated solar power plants [18] or for waste heat recovery [19]. Many of these studies were conducted using established performance simulation tools such as NPSS [20], which were expanded in their functionality through supercritical CO2 fluid property functions. These tools often do not include accurate physical representations of the components by default, but rather work under simplified assumptions such as prescribed effectivenesses and pressure losses in the heat exchangers. The creation of more detailed, though still computationally inexpensive, external models is therefore often necessary to improve the accuracy of the results. First test rigs are in operation, or under construction [21], to prove the concept, validate the simulation tools and further analyse the steady-state [22] and transient [23] behaviour of S-CO2 cycles. To date, the authors know of only one published paper describing an investigation of S-CO2 bottoming cycles for aero engine application [24]. This predicts a 2.8% TSFC improvement relative to a GE90-94b-like engine model, but no fuel burn advantage on account of the excessive weight of the cooler. However, the study also acknowledges that its proposed heat exchanger geometry is just a first attempt and a sub-optimal design. This study clearly highlights the need for preliminary design tools that allow for trade-off studies of physical component parameters, such as tube geometry and count.
Hence, the purpose of this study is to outline an approach to adequately size and evaluate an S-CO2 bottoming cycle that provides additional shaft power to the low pressure shaft, while adhering to the significant size and weight restrictions of an aero application. Special emphasis is given to the detailed modelling of the involved compact heat exchangers. The detail of the models, combined with the rare application of S-CO2 in an aero engine clearly distinguishes this study from previous works. Through parametric studies, a recuperated S-CO2 bottoming cycle (RBC) is derived that provides a mission fuel burn benefit of approximately 2% over a projected year 2050 ultra-high bypass ratio geared turbofan engine (TF2050). The cycle features an approximate power density of 1.39 MW/t, making it over 30 times more power dense than the ABC of Bolland et al. and much more suitable for an aero engine. Further possible improvements on the concept and methodology are proposed. Figure 1 below illustrates the approximate layout of a geared turbofan engine featuring an RBC. Note that to improve visibility of the graphic the dimensions of the bottoming cycle are not perfectly to scale.
Figure 1. Rough schematic of a geared turbofan engine with a recuperated S-CO2 bottoming cycle (RBC).
2. Materials and Methods
Figure 1. Rough schematic of a geared turbofan engine with a recuperated S-CO2 bottoming cycle (RBC).
Appl. Sci. 2017, 7, 255 4 of 27
2. Materials and Methods
All simulations were carried out in the commercially available “Propulsion Object OrientedSimulation Software” (PROOSIS 3.6.14, Empresarios Agrupados Internacional, Madrid, Spain) [25].PROOSIS does not feature S-CO2 as a working fluid by default, so the fluid property tables andthe related real gas fluid functions had to be integrated. Following compression of the S-CO2, it ispre-heated in the recuperator, utilising the heat from the S-CO2 turbine’s exhaust flow. Thereafter, thehigh pressure flow temperature is further raised in the main heat exchanger (MHX), recovering partof the main engine’s low pressure turbine exhaust heat. Subsequently the S-CO2 is expanded in theturbine and cooled in the recuperator. Finally, the pre-cooler rejects the remaining heat energy to a partof the bypass flow of the main engine, to restore the compressor inlet conditions and close the cycle.
Standard PROOSIS simulation tools include quasi-1D representations of turbomachinerycomponents through component maps, but do not include geometric representations of the heatexchangers. To improve the fidelity of the simulations, S-CO2-specific maps were implemented forthe compressor and turbine, and the heat exchanger’s component codes were extended to includegeometric calculations to better represent the thermodynamic performance.
The overall installation weight of the bottoming cycle is likely to be greater than 400 kg.To maximise the fuel burn benefits that arise from the TSFC reductions, the shaft power generated inthe RBC is transferred to the low pressure shaft of the geared turbofan engine (TF2050) via a reductiongearbox. The TF2050 was also modelled in PROOSIS, so the potential fuel burn benefit of adding abottoming cycle to it could be estimated. The cycle parameters of the TF2050 were projected forwardto an assumed State of the Art in 2050 as listed in Table 2.
Table 2. Cruise performance parameters of the reference TF2050.
Parameter Value Parameter Value
Altitude 10,668 m ηfan,BP 0.95Mach number 0.82 ηIPC 0.92
Fn 49 kN ηHPC 0.91BPR 20.7 ηHPT 0.91OPR 64.4 ηLPT 0.95
T4 1580 K TSFC 12.88 g/(kN·s)
In order to avoid the complexity and resulting stability problems of a combined cycle model,engine trade factors were derived to quantify the TSFC changes due to the interaction of the bottomingcycle with the TF2050.
The following parameters were considered:
• Pressure losses and temperature reductions in the core exhaust gases due to the MHX• Pressure losses and temperature increases in the pre-cooler bypass duct air• Provision of additional power to the low pressure turbine (LPT) shaft
By changing the optimum core cycle, the RBC will facilitate the design of lower specific thrustengines without needing a larger LPT or smaller high pressure compressor (HPC) blades. The lowerspecific thrust design option has not been captured in a trade factor as of yet, possibly leading to anunderestimation of the fuel burn benefit. The evaluation of possible lower specific thrust designs willbe part of later combined cycle optimisation studies. Mission fuel burn benefits are calculated byutilising aircraft trade factors that relate the TSFC and weight changes to fuel burn. Power transmissionlosses are not accounted for, but assuming an efficiency of 99%, the losses will be of the order of 10 kWand will have very little effect on overall performance. A dedicated transmission model is beingdeveloped for the bottoming cycle and will be applied in future studies.
To reduce the computational effort associated with this investigation, the procedure to determinethe RBC’s design was split into three distinct stages.

Appl. Sci. 2017, 7, 255 5 of 27
1. Run three parametric studies of the bottoming cycle, where only the design parameters of one ofthe heat exchangers is varied at a time.
2. Run parametric studies with the bottoming cycle parameters (see Table 3).3. Run sensitivity studies of further RBC design parameters not yet investigated.
Stage one is furthermore split into two steps. First the influences of the most influential designparameters are investigated individually. The results of those studies are presented graphically andused to narrow the range of those parameters investigated in a “full design space” study for eachcomponent, where all those parameters are varied simultaneously to find the most promising design.The individual design studies were still conducted using the complete RBC model to capture theinterdependencies of each component’s performance on the others. A higher effectiveness MHXfor example not only means a higher MHX cold-side outlet temperature, but also a higher MHXinlet temperature, as the recuperator sees a larger temperature difference in a cycle with the samepressure ratio.
Table 3. Investigated bottoming cycle parameters.
Parameter Range Parameter Range
Tcmp,in (K) 305.15–320.15 Wcmp,in [kg/s] 15–30Pcmp,in (MPa) 7.5–8.5 PR [-] 2.2–4
Appendix A includes a list of all defining boundary conditions for these parametric studies.Beside the fixed boundary conditions such as the LPT exhaust gas temperature and mass flow, the tablealso lists the initial assumptions for each of the defining design variables of the RBC’s components andan indication of whether or not that specific variable was investigated. The parameter ranges of theinvestigated variables are listed in the description of each component model. If a parameter of a modelis not listed in Appendix A, such as the radial dimensions of the MHX for example, it means that thatparameter is an output of the model and not an input variable.
During stage one, the MHX design is investigated first, as its performance determines the heatduty and boundary conditions of the other components. The recuperator and the pre-cooler designsare then determined. The cycle’s sensitivity to changes in turbomachinery efficiencies is illustrated inFigure 2b based on the final RBC design, as they are the most influential parameters that remainedfixed during stage one and two. The effects of component weight uncertainties are also indicated inthe discussion.
2.1. S-CO2 Fluid Property Model
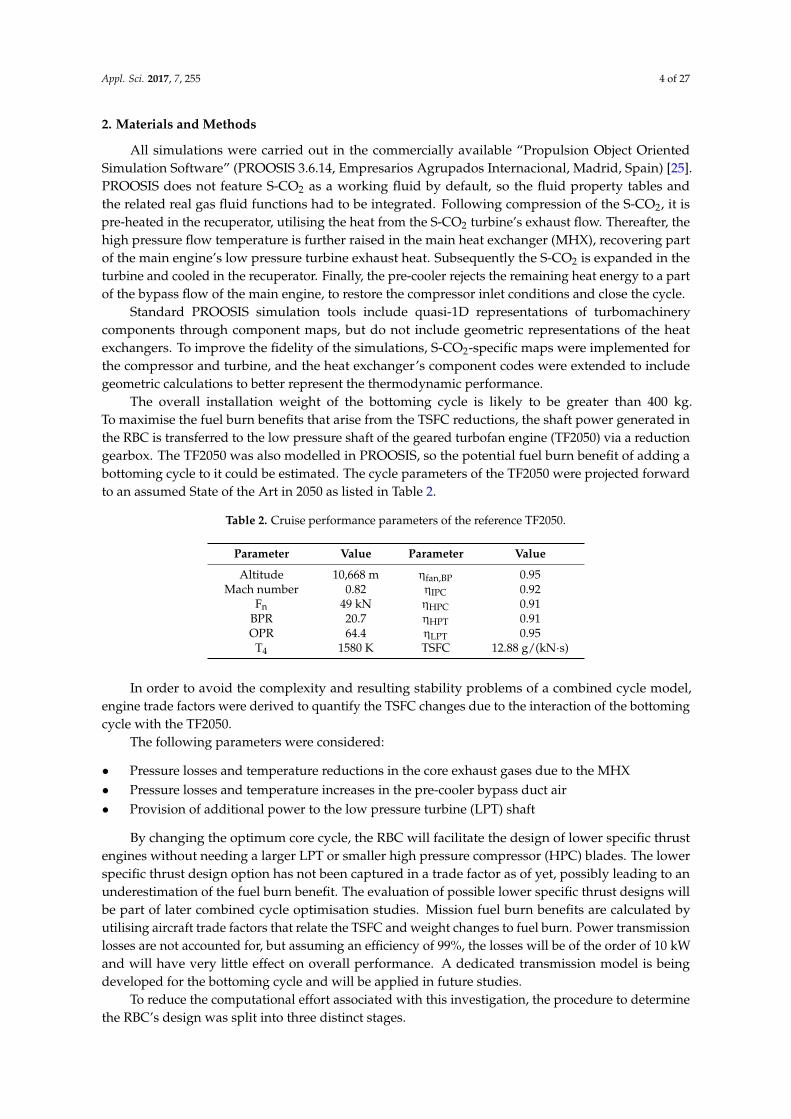
The strong real gas behaviour of S-CO2 near its critical point, exemplified through rapid changesin specific heat for small changes in temperature and pressure (see Figure 2c), considerably reduces thecompressor work necessary for a given pressure ratio. This contributes to the high power density of theS-CO2 cycle. However, that behaviour also complicates simulations using 0 and 1D-simulation tools.Over the years, several equations of state (EOS) have been proposed to capture the real gas propertiesof S-CO2, but each has its limitations. Two of the most commonly used EOS are the Peng-RobinsonEOS (PREOS) [26,27] and the Span & Wagner EOS (SWEOS) [28]. The latter is widely regarded as themost precise EOS for carbon dioxide. The SWEOS is the basis of REFPROP for CO2. REFPROP is acommercial tool offered by the US National Institute of Standards and Technology (NIST), and thelight version (REFPROPmini) was used to create look-up tables for the subsequent simulations. Thetables have varying resolutions down to 0.1 K and 1 Pa near the critical point, which allows forlinear interpolation between the points for simulation purposes while retaining reasonable precision.Figure 2a illustrates the differences in results given by PREOS and REFPROP around and beyond thecritical point.
Appl. Sci. 2017, 7, 255 6 of 27
Appl. Sci. 2017, 7, 255 6 of 27
(a) (b)
(c)
Figure 2. (a) Comparison of Peng-Robinson Equation of State (PREOS) [26,27] and Span & Wagner Equation of State (SWEOS) [28] near the critical point of S-CO2; (b) sensitivity of RBC thermal efficiency to compressor and turbine isentropic efficiencies; and (c) specific heat variation of S-CO2 near the critical point.
2.2. Turbomachinery
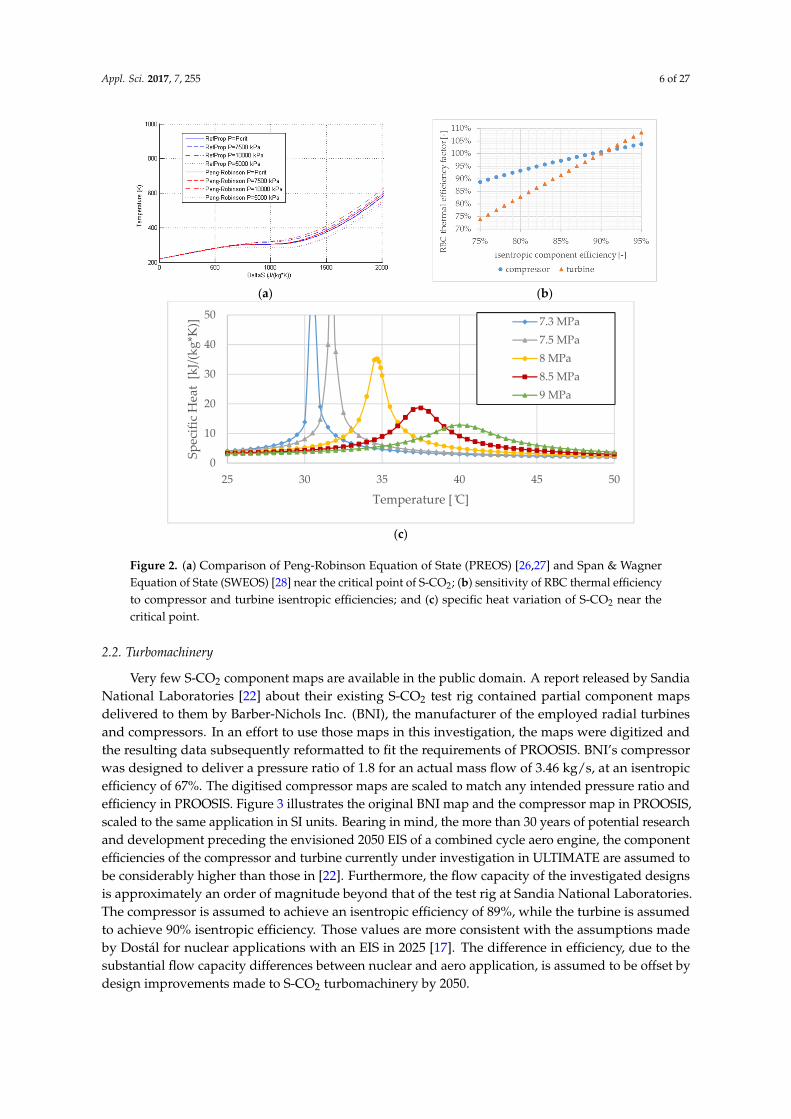
Very few S-CO2 component maps are available in the public domain. A report released by Sandia National Laboratories [22] about their existing S-CO2 test rig contained partial component maps delivered to them by Barber-Nichols Inc. (BNI), the manufacturer of the employed radial turbines and compressors. In an effort to use those maps in this investigation, the maps were digitized and the resulting data subsequently reformatted to fit the requirements of PROOSIS. BNI’s compressor was designed to deliver a pressure ratio of 1.8 for an actual mass flow of 3.46 kg/s, at an isentropic efficiency of 67%. The digitised compressor maps are scaled to match any intended pressure ratio and efficiency in PROOSIS. Figure 3 illustrates the original BNI map and the compressor map in PROOSIS, scaled to the same application in SI units. Bearing in mind, the more than 30 years of potential research and development preceding the envisioned 2050 EIS of a combined cycle aero engine, the component efficiencies of the compressor and turbine currently under investigation in ULTIMATE are assumed to be considerably higher than those in [22]. Furthermore, the flow capacity of the investigated designs is approximately an order of magnitude beyond that of the test rig at Sandia National Laboratories. The compressor is assumed to achieve an isentropic efficiency of 89%, while the turbine is assumed to achieve 90% isentropic efficiency. Those values are more consistent with the assumptions made by Dostál for nuclear applications with an EIS in 2025 [17]. The difference in efficiency, due to the substantial flow capacity differences between nuclear and aero application, is assumed to be offset by design improvements made to S-CO2 turbomachinery by 2050.
0
10
20
30
40
50
25 30 35 40 45 50
Spec
ific
Hea
t [k
J/(kg
*K)]
Temperature [ ̊C]
7.3 MPa7.5 MPa8 MPa8.5 MPa9 MPa
Figure 2. (a) Comparison of Peng-Robinson Equation of State (PREOS) [26,27] and Span & WagnerEquation of State (SWEOS) [28] near the critical point of S-CO2; (b) sensitivity of RBC thermal efficiencyto compressor and turbine isentropic efficiencies; and (c) specific heat variation of S-CO2 near thecritical point.
2.2. Turbomachinery
Very few S-CO2 component maps are available in the public domain. A report released by SandiaNational Laboratories [22] about their existing S-CO2 test rig contained partial component mapsdelivered to them by Barber-Nichols Inc. (BNI), the manufacturer of the employed radial turbinesand compressors. In an effort to use those maps in this investigation, the maps were digitized andthe resulting data subsequently reformatted to fit the requirements of PROOSIS. BNI’s compressorwas designed to deliver a pressure ratio of 1.8 for an actual mass flow of 3.46 kg/s, at an isentropicefficiency of 67%. The digitised compressor maps are scaled to match any intended pressure ratio andefficiency in PROOSIS. Figure 3 illustrates the original BNI map and the compressor map in PROOSIS,scaled to the same application in SI units. Bearing in mind, the more than 30 years of potential researchand development preceding the envisioned 2050 EIS of a combined cycle aero engine, the componentefficiencies of the compressor and turbine currently under investigation in ULTIMATE are assumed tobe considerably higher than those in [22]. Furthermore, the flow capacity of the investigated designsis approximately an order of magnitude beyond that of the test rig at Sandia National Laboratories.The compressor is assumed to achieve an isentropic efficiency of 89%, while the turbine is assumedto achieve 90% isentropic efficiency. Those values are more consistent with the assumptions madeby Dostál for nuclear applications with an EIS in 2025 [17]. The difference in efficiency, due to thesubstantial flow capacity differences between nuclear and aero application, is assumed to be offset bydesign improvements made to S-CO2 turbomachinery by 2050.

Appl. Sci. 2017, 7, 255 7 of 27
Appl. Sci. 2017, 7, 255 7 of 27
(a) (b)
Figure 3. Comparison of the compressor map of BNI: (a) reproduced with permission from [22], Barber Nichols Inc., 2016; and that in Propulsion Object Oriented Simulation Software (PROOSIS) (b).
The dependency of the thermal efficiency of the bottoming cycle on the design point isentropic efficiencies of the turbine and compressor is illustrated in Figure 2b. The turbine efficiency has a noticeably greater impact on the performance of the bottoming cycle than the compressor, which is to be expected as it does more work. The assumed component efficiencies have not been scaled with pressure ratio in the presented studies, as too few data are available on those relations specific to S-CO2. The design pressure ratio of the RBC varies between two and four in the present study.
2.3. Main Heat Exchanger
The main heat exchanger (MHX) is positioned downstream of the LPT of the main engine and transfers parts of the otherwise largely wasted residual heat to the S-CO2 bottoming cycle. The involute spiral heat exchanger design, developed by Zhao et al. at Chalmers University in the LEMCOTEC project, was implemented. Figure 4 shows schematically the U-bend design with continuous tubes, but the modelled design had separate inboard and outboard flowing tubes connected by cross-over ducts. Note, the involute spiral heat exchanger was originally designed as an intercooler and has been repurposed for this study. The detail available on the design and performance of the heat exchanger in [29–31] enabled it to be adapted for the MHX duty with turbine exhaust gases and S-CO2.
(a) (b)
Figure 4. Illustrations of the involute spiral two-pass cross flow intercooler concept in 3D, reproduced with permission from [32], T. Grönstedt, 2017 (a); and the arrangement of the elliptical tubes in (b).
All correlations contained in [29,30] were originally derived from CFD experiments featuring air as the medium on both sides. This makes them non-ideal for application to S-CO2. However,
Figure 3. Comparison of the compressor map of BNI: (a) reproduced with permission from [22], BarberNichols Inc., 2016; and that in Propulsion Object Oriented Simulation Software (PROOSIS) (b).
The dependency of the thermal efficiency of the bottoming cycle on the design point isentropicefficiencies of the turbine and compressor is illustrated in Figure 2b. The turbine efficiency has anoticeably greater impact on the performance of the bottoming cycle than the compressor, which isto be expected as it does more work. The assumed component efficiencies have not been scaled withpressure ratio in the presented studies, as too few data are available on those relations specific to S-CO2.The design pressure ratio of the RBC varies between two and four in the present study.
2.3. Main Heat Exchanger
The main heat exchanger (MHX) is positioned downstream of the LPT of the main engine andtransfers parts of the otherwise largely wasted residual heat to the S-CO2 bottoming cycle. The involutespiral heat exchanger design, developed by Zhao et al. at Chalmers University in the LEMCOTECproject, was implemented. Figure 4 shows schematically the U-bend design with continuous tubes,but the modelled design had separate inboard and outboard flowing tubes connected by cross-overducts. Note, the involute spiral heat exchanger was originally designed as an intercooler and has beenrepurposed for this study. The detail available on the design and performance of the heat exchangerin [29–31] enabled it to be adapted for the MHX duty with turbine exhaust gases and S-CO2.
Appl. Sci. 2017, 7, 255 7 of 27
(a) (b)
Figure 3. Comparison of the compressor map of BNI: (a) reproduced with permission from [22], Barber Nichols Inc., 2016; and that in Propulsion Object Oriented Simulation Software (PROOSIS) (b).
The dependency of the thermal efficiency of the bottoming cycle on the design point isentropic efficiencies of the turbine and compressor is illustrated in Figure 2b. The turbine efficiency has a noticeably greater impact on the performance of the bottoming cycle than the compressor, which is to be expected as it does more work. The assumed component efficiencies have not been scaled with pressure ratio in the presented studies, as too few data are available on those relations specific to S-CO2. The design pressure ratio of the RBC varies between two and four in the present study.
2.3. Main Heat Exchanger
The main heat exchanger (MHX) is positioned downstream of the LPT of the main engine and transfers parts of the otherwise largely wasted residual heat to the S-CO2 bottoming cycle. The involute spiral heat exchanger design, developed by Zhao et al. at Chalmers University in the LEMCOTEC project, was implemented. Figure 4 shows schematically the U-bend design with continuous tubes, but the modelled design had separate inboard and outboard flowing tubes connected by cross-over ducts. Note, the involute spiral heat exchanger was originally designed as an intercooler and has been repurposed for this study. The detail available on the design and performance of the heat exchanger in [29–31] enabled it to be adapted for the MHX duty with turbine exhaust gases and S-CO2.
(a) (b)
Figure 4. Illustrations of the involute spiral two-pass cross flow intercooler concept in 3D, reproduced with permission from [32], T. Grönstedt, 2017 (a); and the arrangement of the elliptical tubes in (b).
All correlations contained in [29,30] were originally derived from CFD experiments featuring air as the medium on both sides. This makes them non-ideal for application to S-CO2. However,
Figure 4. Illustrations of the involute spiral two-pass cross flow intercooler concept in 3D, reproducedwith permission from [32], T. Grönstedt, 2017 (a); and the arrangement of the elliptical tubes in (b).
All correlations contained in [29,30] were originally derived from CFD experiments featuringair as the medium on both sides. This makes them non-ideal for application to S-CO2. However,all correlations have non-dimensional representations of the geometry and the Prandtl numbers ofS-CO2 in the investigated range do not differ too much from those of air in Zhao’s studies (0.8 to 1.5for S-CO2 vs. 0.8–0.9 for air). Furthermore, as Equation 3 is valid for a range of 0.5 < Pr < 2000 [17],

Appl. Sci. 2017, 7, 255 8 of 27
the correlations are assumed to be accurate enough for the current investigations. Care has to be takenduring the design of the cold-side free flow area, to ensure the design adheres to the Reynolds numberlimits stated in [29]. From the designs investigated by Zhao et al. in [30], the option featuring a radialtube spacing of db = 2b and an axial tube spacing of da = a was chosen, where a and b represent thelarge and small axes of the elliptic tube profile. The aspect ratio of the tube cross-section is fixed in allstudies to a
b = 8 (see Figure 4 for reference). This high aspect ratio, combined with the high internalpressure, requires that the tubes have internal webs to stiffen them. The tube wall thickness is setto 0.2 mm, but this might need to be increased when a dedicated mechanical integrity model is inplace. For now, the risk of weight increase due to thicker tube walls and webs is highlighted in thediscussion section.
Dedicated correlations define the pressure losses for the heat exchanger inlet, outlet and cross-overducts, and inside the tubes. The heat transfer and pressure losses for each of the two passes of theMHX are calculated separately. The equations below reflect the most important correlations from [30],relating the non-dimensional flows inside and outside the tubes to their heat transfer coefficients (HTC)and pressure losses. For the correlations of the remaining sections of the MHX see [29].
If Re > 20001√fD
= −1.8 ∗ log10
(6.9Re
+
(ε
dh ∗ 3.7
)1.11)
(1)
If Re < 2000 fD =64Re
(2)
Nu =( fD/8) ∗ (Re − 1000) ∗ Pr
1 + 12.7 ∗√(
fD8
)∗(
Pr2/3 − 1) (3)
j = 0.003469 ∗ e−7.117∗10−5∗Re + 0.003461 ∗ e−3.793∗10−6∗Re (4)
Nu = j ∗ Re ∗ Pr1/3 (5)
f = 0.01044 ∗ e−6.806∗10−5∗Re + 0.008109 ∗ e−2.908∗10−6∗Re (6)
∆p =
( .mh/A f f ,h
)2
2 ∗ ρi∗(
f ∗ Aw ∗ ρiA f f ,h ∗ ρm
+(
1 + σ2)∗(
ρiρo
− 1))
(7)
∆p = fDLtube ∗ ρin ∗ Uin
2
2 ∗ dh(8)
Nu =htc ∗ dh
k(9)
1UA
=1
htc,h ∗ Ah+
1htc,c ∗ Ac
(10)
Qp = UA ∗ ∆T (11)
Equation (1) is the correlation of the Darcy friction factor for turbulent flow in a pipe as derivedby Haaland [33], where ε symbolises the surface roughness of the tube. The Darcy friction factor issubsequently used in the adaptation of the Gnielinski equation [34] in Equation (3), to derive theNusselt number and ultimately the heat transfer coefficient on the S-CO2 side in Equation (9). TheColburn factor for the air flow around the tubes is calculated using the CFD-derived correlation inEquation (4), which in turn is used to calculate the HTCs using Equation (9). The HTCs are calculatedbased on average flow conditions on either side of a heat exchanger pass. The hot-side pressure lossacross each pass is calculated according to Equations (6) and (7). The cold-side pressure loss acrosseach pass is calculated using Equations (1), (2) and (8). The cold-side friction factors for Reynolds

Appl. Sci. 2017, 7, 255 9 of 27
numbers between 2000 and 5000 are interpolated between those given by Equations (1) and (2) toimprove the stability of the model.
The heat transfer coefficients on the cold (S-CO2) side of the MHX are approximately 25 timeslarger than the turbine exhaust gas or hot-side heat transfer coefficients. This is largely due to thegreat pressure differential between the two sides. The low hot-side HTCs limit the potential UA ofthe heat exchanger (see Equation (8)) and by extension the amount of heat energy Qp that can betransferred in each pass. The influence of the thermal resistance of the tube walls is not accounted for,as the tube diameters and wall thicknesses are small (see Table 4). However, the effect of low hot-sideHTCs can be mitigated by increasing heat transfer surface areas. The two options available to increaseheat transfer surfaces are: employing longer tubes, or adding fins. Longer tubes would lead to largerradial dimensions of the heat exchanger, possibly increasing the overall engine drag and weight. Analternative to simply increasing the tube length per pass would be to alter the MHX and the pre-coolerto include four passes instead of two passes. The pressure losses inside the tubes would increase,but the four-pass arrangement would be more compact and have a less severe impact on the engineoverall geometry. The four pass arrangement would however lead to larger hot-side pressure losses,as would adding fins, though the latter would not increase the pressure losses inside the tubes. Theadditional blockage of the flow area due to the fins might also make maintenance and cleaning moredifficult. Either approach to increasing the external surface areas will impact heat transfer, pressurelosses and weight at the same time. As the models currently do not include detailed representationsof either option, the presented parametric studies are all representative of finless two-pass designs.Extending the current model to simulate fins and/or a four-pass design is part of the on-going research.The possible effect of increasing heat transfer surface areas is highlighted in the discussion through“what-if” scenarios.
Heat exchanger effectiveness is an outcome of the current model and calculated according toEquation (15). Effectiveness is calculated rather than imposed, in part because component weight isjust as important as performance in aero applications, and geometry provides a better designandle.Heat exchanger effectiveness is a common metric to characterise performance. The effectiveness isoften calculated as the ratio of the actually transferred heat energy to the maximum transferableheat energy (see [35] and Equations (13) and (14)). In cases where the specific heat capacity cp on atleast one side of the heat exchanger varies greatly within the component, this relation will producedifferent results depending on which flow conditions are used to calculate Cmin so, the effectivenessvalues can be misleading. In this study “temperature effectiveness” is calculated instead, accordingto Equation (15). Each heat exchanger provides two temperature effectiveness figures, one for eachside. The temperature effectiveness quoted here will refer to the cold-sides in both the MHX and thepre-cooler. Though the effect of heat capacity variations is not captured in detail by this approach,in this case it provides a more coherent answer than using the effectiveness calculations according toKays and London.
Qov = Qp1 + Qp2 (12)
Cmin = min(
cp2,h ∗.
mh, cp1,c ∗.
mc
)(13)
ε =Qov
Cmin ∗ (Tin,h − Tin,c)(14)
εtemp =Tout,c − Tin,c
Tin,h − Tin,c(15)
Table 4 lists the investigated geometric and thermodynamic parameters of the MHX modelincluding their ranges. The table furthermore states fixed values for other important model parametersthat have not been chosen as design space variables during the investigation. The turbine exhaustdiffuser has not been sized or included in the current model.

Appl. Sci. 2017, 7, 255 10 of 27
The involute spiral heat exchanger, although a very compact design, still requires a considerableexhaust gas-side frontal area. It is not possible to mount the heat exchanger at an angle to the mainengine axis and redirect the exhaust gas flow outward as in MTU’s original Lancette heat exchanger,because of the involute arrangement of the tubes. Further development of the tube geometry for thiscase or the application of a completely different design could improve the radial dimensions of theMHX. The design of the MHX, similar to that of the pre-cooler, will get easier once a combined cyclesystem is modelled that also incorporates inter-turbine reheat and/or intercooling and reduces coreengine mass flow.
Table 4. Main heat exchanger (MHX) design parameters.
Parameter Units Range Remarks
MN f r,h - 0.1–0.2 Mach numbers below 0.12 would be more efficient, but leadto excessive MHX dimensions
Ncolumns - 4–10 One column always encompasses the staggered columnbehind the first as well (see Figure 4b)
atube m 0.005–0.013 Major internal axis of the elliptical tubes
x - 0.6–1 Percentage of the LPT exit inner annulus diameter, used tocalculate inner annulus diameter of hot-side frontal area
ρmat kg/m3 4330 Ti-6Al-4V Grade 5 [36] assumed, to minimise weight
tubeth m 0.0002 Tube wall thickness assumed at 0.2 mm, according to [5]
diduct,in m 0.3 Inner annulus diameter of cold-side inlet duct, second orderinfluence on pressure losses
2.4. Closed Circuit Recuperator
S-CO2 cycles profit strongly from the addition of a recuperator to enhance their efficiency. In manyinstances more than half of the total heat energy input to the compressor exit flow is achieved in therecuperator and more than 60% is not uncommon (e.g., see [37]). Although the standalone thermalefficiency is not the primary focus of the bottoming cycle, it will still have a considerable effect on theshaft power output. A secondary incentive for a recuperator is that the flow on both sides is S-CO2.This means the heat transfer coefficients are high and the imbalance between the two sides is much less.Not only would the S-CO2 cycle be less efficient if no recuperator were employed, and the pre-coolerwould need to be considerably larger. This would increase the installation dimensions and weight ofthe bottoming cycle, as well as the flow distortion of the main engine bypass flow. The recuperator’sinfluence on the S-CO2 cycle performance is greater for cycles with higher turbine entry temperatures,these cause larger gaps between the compressor and turbine outlet temperatures. During cruise,the design point of the bottoming cycle, the LPT exhaust gas temperatures (EGT) of the TF2050 onlyreach about 615 K. Because this gives relatively low TET in the bottoming cycle, the parametric studiesincluded a scenario without a recuperator. Table 5 states the ranges of all the investigated parameters.
Table 5. Recuperator design parameters.
Parameter Units Range Remarks
H m 0.2–0.4 HeightL m up to 1 LengthW m 0.2–0.4 Widthdc,c m 0.001–0.004 Cold-side channel diameterdc,h m 0.001–0.004 Hot-side channel diameter
εabs,c, εabs,h m 1 × 10⁻⁵ Hot- and cold-side absolute surface roughnessρmat kg/m3 4330 Ti-6Al-4V Grade 5 [36] assumed, to minimise weight

Appl. Sci. 2017, 7, 255 11 of 27
In an effort to minimise the footprint of the recuperator and therefore maximise the benefits arisingfrom having two high density fluids, the recuperator is designed as a printed circuit heat exchanger(PCHE) [38]. Diffusion bonding stacks of corrugated plates makes PCHEs easy to customise and theyfeature great thermo-mechanical strain tolerances. Due to their very small flow channels, PCHEs alsodeliver high effectiveness for small size. The small flow channels limit access to the core of the componentfor inspection, but fouling should not be a problem in the closed-circuit system. PCHEs are the mostcommonly used design for recuperators in S-CO2 application at the moment, with only plate fin heatexchangers (PFHE) offering similar qualities. Unfortunately, PFHEs seem not yet to have been employedin applications with pressures above about 20 MPa, making them a riskier choice today.
The recuperator model was adapted from Chapter 3 of [17], where Dostál explains all the necessaryheat transfer and pressure loss correlations to cover flow conditions from pure laminar flow all theway to fully developed turbulent flow. The model currently operates in such a way, that the volume ofthe recuperator is imposed through module width, length and height (see Figure 5). These dimensionsonly characterise the matrix and do not include the inlet and outlet manifolds. To approximate theweight of the manifolds, the recuperatoreight is increased by 10%. The additional heat transfer thathappens inside the manifolds is not accounted for. Furthermore, the channel and plate dimensionsare inputs to the model. The plate thickness t, and the pitch of the channels pc is estimated relativeto the channel diameter (see Equations (16) and (17)). Based on the full geometric definition of therecuperator, the model then calculates the corresponding pressure drops and the heat transfer.
Appl. Sci. 2017, 7, 255 11 of 27
system. PCHEs are the most commonly used design for recuperators in S-CO2 application at the moment, with only plate fin heat exchangers (PFHE) offering similar qualities. Unfortunately, PFHEs seem not yet to have been employed in applications with pressures above about 20 MPa, making them a riskier choice today.
The recuperator model was adapted from Chapter 3 of [17], where Dostál explains all the necessary heat transfer and pressure loss correlations to cover flow conditions from pure laminar flow all the way to fully developed turbulent flow. The model currently operates in such a way, that the volume of the recuperator is imposed through module width, length and height (see Figure 5). These dimensions only characterise the matrix and do not include the inlet and outlet manifolds. To approximate the weight of the manifolds, the recuperator weight is increased by 10%. The additional heat transfer that happens inside the manifolds is not accounted for. Furthermore, the channel and plate dimensions are inputs to the model. The plate thickness , and the pitch of the channels is estimated relative to the channel diameter (see Equations (16) and (17)). Based on the full geometric definition of the recuperator, the model then calculates the corresponding pressure drops and the heat transfer.
The heat transfer in an S-CO2 recuperator should not be calculated using mean flow properties across the whole component. The great variations in specific heat capacity close to the critical point would be disregarded by such an approach, possibly making the results diverge from the actual performance by more than 50% [38]. This effect is more pronounced the greater the targeted recuperator effectiveness (particularly above 92%). A common strategy in modelling the recuperator is, therefore, to split the component into discrete sections (nodes) along the flow path and calculate the performance of each node individually. The number of calculated nodes used to simulate realistic recuperator performance not only influences the precision, but also the stability and computational time of the model and is therefore subject to debate in the industry. For high effectiveness recuperators (above 92%), 40 nodes are commonly used. Because the recuperators for aero application are likely to feature effectiveness values of less than 60%, due to the weight implications of larger PCHEs, the number of nodes can be reduced to 10 to improve model stability.
Figure 5. Simplified schematic of the recuperator’s geometric parameters.
2.5. Pre-Cooler
The pre-cooler is the heat sink of the bottoming cycle, restoring the desired compressor inlet conditions. In that function, some of the boundary conditions for the pre-cooler are similar to those of an aero engine intercooler, with approximately 4 MW of heat energy to be dispersed to part of the bypass flow. By analogy, the involute spiral multi-pass counter-cross-flow heat exchanger has been chosen as the preferred geometric and thermal design option. However, two distinct differences lead to a final design with fewer longer tubes than an equivalent air-air intercooler with the same tube hydraulic diameter. First, the S-CO2 inlet pressure is considerably higher than the IPC delivery air
= + 0.0004 (16) = 2 + 0.0005 (17)
Figure 5. Simplified schematic of the recuperator’s geometric parameters.
The heat transfer in an S-CO2 recuperator should not be calculated using mean flow propertiesacross the whole component. The great variations in specific heat capacity close to the critical pointwould be disregarded by such an approach, possibly making the results diverge from the actualperformance by more than 50% [38]. This effect is more pronounced the greater the targeted recuperatoreffectiveness (particularly above 92%). A common strategy in modelling the recuperator is, therefore,to split the component into discrete sections (nodes) along the flow path and calculate the performanceof each node individually. The number of calculated nodes used to simulate realistic recuperatorperformance not only influences the precision, but also the stability and computational time of themodel and is therefore subject to debate in the industry. For high effectiveness recuperators (above 92%),40 nodes are commonly used. Because the recuperators for aero application are likely to featureeffectiveness values of less than 60%, due to the weight implications of larger PCHEs, the number ofnodes can be reduced to 10 to improve model stability.
pc = dc + 0.0004 (16)
t =dc2
+ 0.0005 (17)
2.5. Pre-Cooler
The pre-cooler is the heat sink of the bottoming cycle, restoring the desired compressor inletconditions. In that function, some of the boundary conditions for the pre-cooler are similar to those

Appl. Sci. 2017, 7, 255 12 of 27
of an aero engine intercooler, with approximately 4 MW of heat energy to be dispersed to part ofthe bypass flow. By analogy, the involute spiral multi-pass counter-cross-flow heat exchanger hasbeen chosen as the preferred geometric and thermal design option. However, two distinct differenceslead to a final design with fewer longer tubes than an equivalent air-air intercooler with the sametube hydraulic diameter. First, the S-CO2 inlet pressure is considerably higher than the IPC deliveryair that would normally flow inside an intercooler (~80 bar for S-CO2 vs. <5 bar for air at cruise).This considerably reduces the required hot-side free-flow area and therefore the number of tubes perpass. Additionally, the S-CO2 inlet temperature is most likely lower than that of the IPC delivery air,reducing the temperature delta between the two streams. These two effects combined with a relativelysmall, high-pressure S-CO2 mass flow of approximately 20 kg/s necessitate long heat exchanger tubesin order to fulfil the required heat transfer duty. The two-pass S-CO2 pre-cooler may therefore feature alarger cold-side outer annulus diameter, while also being shorter in the downstream air flow direction.This would reduce the air-side pressure drop, but increase blockage in the bypass duct. An alternativeto reduce the diameter of the pre-cooler arrangement and still achieve the necessary tube lengths, is tochange the pre-cooler from a two-pass to a four-pass design. This option is not yet investigated.
Mathematically the pre-cooler and MHX models are very similar. The tubes are once againarranged with a radial tube spacing of db = 2b and an axial tube spacing of da = a. The heattransfer and pressure loss correlations are consequently the same as in the MHX and adapted fromZhao et al. [30]. The Prandtl number variation for S-CO2 flows is slightly greater than that in theMHX with values between 0.8 and 2.5 in the S-CO2. Nonetheless, the non-dimensional equations ofZhao et al. are assumed to be applicable in this case.
Although smaller than in the MHX, the imbalance of the heat transfer coefficients between thehot and cold sides of the pre-cooler is still considerable, with an approximate factor of 16 betweenthem. As in the MHX, a temperature effectiveness is more appropriate for the pre-cooler than the morecommonly used definitions of Kays and London, due to considerable changes in cp on the S-CO2 side.The cold-side temperature effectiveness of the pre-cooler is calculated according to (18).
ε =Tout,c − Tin,c
Tin,h − Tin,c(18)
Table 6 lists the investigated and fixed design variables of the pre-cooler during the subsequentstudies. The bottoming cycle model calculates the necessary air mass flow interacting with thepre-cooler. To avoid excessively large pre-cooler installations that would greatly increase nacellediameters and drag penalties, an upper limit of 2.1 m was applied for the outer diameter of thecold-side frontal area. The air-side diffuser has not been sized and included in the current model.In the pre-cooler model, the necessary tube wall thickness was estimated from the data given in [36],though these thicknesses are now recognized to be optimistic for elliptical tubes without internal webs.The implications of increased pre-cooler weights due to thicker tube walls are discussed further on.
Table 6. Pre-Cooler design parameters.
Parameter Units Range Remarks
MN f r,c - 0.1–0.25 The upper bound of 2.1 m for the cold-side frontal areaouter diameter disqualifies many of the lower MN cases
Ncolumns - 1–8 One cumn always encompasses the staggered columnbehind the first as well (see Figure 4b)
btube m 0.00085–0.002 Minor eernal axis of the elliptical tubes
di f r,c m 1–1.6 Inner aulus diameter of cold-side frontal area
ρmat kg/m3 4330 Ti-6-4V Grade 5 [36] assumed, to minimise weight

Appl. Sci. 2017, 7, 255 13 of 27
3. Results
Parametric studies were run for each of the three heat exchangers. Prior to the full designspace studies of each one, according to Tables 4–6, sensible boundaries for each parameter had to bedetermined through single-parameter studies. Extracts from those studies are presented for each heatexchanger, before selecting the final designs based on their potential fuel burn benefits.
3.1. Main Heat Exchanger
The three most influential parameters on the performance of the MXH are the hot-side inletMach number, the number of columns of tubes per pass and the length of the tube major axis. Notethat the tube minor axis changes pro rata with the major axis, as the aspect ratio of the tubes is keptconstant. The plots in Figure 6 illustrate the studies of those parameters. The investigation of thehot-side inlet Mach numbers emphasizes, that the band of feasible values is relatively small. Althoughreducing Mach numbers results in higher effectiveness values for the MHX, it results in an exponentialincrease in weight. Reducing the inlet Mach number from 0.1 to 0.05 only increases the temperatureeffectiveness by about 1.2 percentage points, which does not justify almost doubling the weight. At theother end of the scale, designs featuring higher inlet Mach numbers are not only penalised throughlower effectiveness values, they also have very high hot-side pressure losses. That drop in hot-sidepressure ratio can greatly diminish the fuel burn benefits of the RBC, even though the RBC enablessmaller core engine mass flows. The observed trends led to a narrowing of the investigated Machnumbers to between 0.1 and 0.2. The cold-side pressure losses are relatively stable at less than 2%,but increase slightly with lower hot-side inlet Mach numbers, due to the longer heat exchanger tubes.
Increasing the number of columns per pass clearly increases the effectiveness and temperaturerise of the MHX, as is visible in Figure 6b. It is therefore likely that the most fuel efficient combinedcycle engine will feature four or more columns per pass in the MHX. However, component weight andhot-side pressure losses rise simultaneously, and the asymptotic nature of the effectiveness impliesthat having more than 10 columns may not be feasible. The S-CO2 pressure ratio is relatively stableacross the whole range of simulations, but the higher flow Mach numbers, which arise from smallertube counts in the MHX, do lead to slightly higher pressure losses for those designs.
Appl. Sci. 2017, 7, 255 13 of 27
The three most influential parameters on the performance of the MXH are the hot-side inlet Mach number, the number of columns of tubes per pass and the length of the tube major axis. Note that the tube minor axis changes pro rata with the major axis, as the aspect ratio of the tubes is kept constant. The plots in Figure 6 illustrate the studies of those parameters. The investigation of the hot-side inlet Mach numbers emphasizes, that the band of feasible values is relatively small. Although reducing Mach numbers results in higher effectiveness values for the MHX, it results in an exponential increase in weight. Reducing the inlet Mach number from 0.1 to 0.05 only increases the temperature effectiveness by about 1.2 percentage points, which does not justify almost doubling the weight. At the other end of the scale, designs featuring higher inlet Mach numbers are not only penalised through lower effectiveness values, they also have very high hot-side pressure losses. That drop in hot-side pressure ratio can greatly diminish the fuel burn benefits of the RBC, even though the RBC enables smaller core engine mass flows. The observed trends led to a narrowing of the investigated Mach numbers to between 0.1 and 0.2. The cold-side pressure losses are relatively stable at less than 2%, but increase slightly with lower hot-side inlet Mach numbers, due to the longer heat exchanger tubes.
Increasing the number of columns per pass clearly increases the effectiveness and temperature rise of the MHX, as is visible in Figure 6b. It is therefore likely that the most fuel efficient combined cycle engine will feature four or more columns per pass in the MHX. However, component weight and hot-side pressure losses rise simultaneously, and the asymptotic nature of the effectiveness implies that having more than 10 columns may not be feasible. The S-CO2 pressure ratio is relatively stable across the whole range of simulations, but the higher flow Mach numbers, which arise from smaller tube counts in the MHX, do lead to slightly higher pressure losses for those designs.
(a) (b)
0
0.5
1
1.5
2
2.5
3
0.5
0.6
0.7
0.8
0.9
1
1.1
0.05 0.1 0.15 0.2 0.25
rel.w
eigh
t and
tem
pera
ture
rise
[-]
Pres
sure
Rat
ios
and
effe
ctiv
enes
s [-]
Hot-side inlet Mach number [-]
PR_cold eff PR_hot weight rel dT
0
0.5
1
1.5
2
2.5
3
0.5
0.6
0.7
0.8
0.9
1
1.1
3 5 7 9 11 13 15
rel.w
eigh
t and
tem
pera
ture
rise
[-]
Pres
sure
Rat
ios
and
effe
ctiv
enes
s [-]
Number of columns per pass [-]
PR_cold eff PR_hot weight rel dT
Figure 6. Cont.

Appl. Sci. 2017, 7, 255 14 of 27
Appl. Sci. 2017, 7, 255 14 of 27
(c)
Figure 6. Parametric studies of the MHX of: (a) the hot-side inlet Mach number; (b) the number of columns per pass; and (c) the tube dimensions.
The length of the tube’s major axis appears to be less influential than initially assumed (see Figure 6c). Most performance parameters of the MHX appear almost constant, with the exception of component weight. The scatter is due to the MHX component code, which rounds the number of rows of tubes in each module to an integer and recalculates the inner annulus diameter. The range of tube major axis lengths was reduced to between 5 and 13 mm to minimise weight.
The thermal boundary conditions applied during the full design-space study of the MHX and the parameter values that were identified as the most fuel burn efficient are listed in Table 7. The fuel-burn value indicates that the design does not improve the overall engine performance. The main reason is that the initially assumed values for the pre-cooler were too aggressive, especially the air-side inlet Mach number of 0.15. The pre-cooler’s poor performance therefore considerably penalises the combined cycle’s performance.
Table 7. Parameters of the final MHX design at cruise.
Cycle Parameter Value MHX Parameter Value air 32 kg/s , 0.11 , 615 K 4 , 36.1 kPa 0.005 m
PRRBC 3.5 RBC shaft power 0.80 MW S-CO2 20 kg/s MHX weight 269.7 kg , , 305.15 K ∆fuel burn +0.53% , , 7.5 MPa - -
3.2. Closed Cycle Recuperator
The overall geometry of the counter-flow recuperator matrix is defined through the height, weight and length of its cuboid. The recuperator is calculated as one component, but it would be easy to split into multiple smaller units that achieve the same overall performance and can be arranged circumferentially around the RBC’s shaft. The fourth and fifth main parameters are the channel diameters for the two fluid flows. The individual parameter studies for the recuperator were conducted based upon the initial design assumptions stated in Appendix A. The “full” study, which varied all the main recuperator design parameters together, improved on the previously identified best MHX design.
0
0.5
1
1.5
2
2.5
3
0.60.65
0.70.75
0.80.85
0.90.95
11.05
0.005 0.01 0.015 0.02 0.025 rel.
wei
ght a
nd te
mpe
ratu
re ri
se [-
]
Pres
sure
Rat
ios
and
effe
ctiv
enes
s [-]
Tube major axis [m]
PR_cold eff PR_hot weight rel dT
Figure 6. Parametric studies of the MHX of: (a) the hot-side inlet Mach number; (b) the number ofcolumns per pass; and (c) the tube dimensions.
The length of the tube’s major axis appears to be less influential than initially assumed(see Figure 6c). Most performance parameters of the MHX appear almost constant, with the exceptionof component weight. The scatter is due to the MHX component code, which rounds the number ofrows of tubes in each module to an integer and recalculates the inner annulus diameter. The range oftube major axis lengths was reduced to between 5 and 13 mm to minimise weight.
The thermal boundary conditions applied during the full design-space study of the MHX and theparameter values that were identified as the most fuel burn efficient are listed in Table 7. The fuel-burnvalue indicates that the design does not improve the overall engine performance. The main reasonis that the initially assumed values for the pre-cooler were too aggressive, especially the air-sideinlet Mach number of 0.15. The pre-cooler’s poor performance therefore considerably penalises thecombined cycle’s performance.
Table 7. Parameters of the final MHX design at cruise.
Cycle Parameter Value MHX Parameter Value.
mair 32 kg/s MN f r,h 0.11Tair,in 615 K Ncolumns 4Pair,in 36.1 kPa atube 0.005 m
PRRBC 3.5 RBC shaft power 0.80 MW.
mS-CO2 20 kg/s MHX weight 269.7 kgTcmp,in,S−CO2 305.15 K ∆fuel burn +0.53%Pcmp,in,S−CO2 7.5 MPa - -
3.2. Closed Cycle Recuperator
The overall geometry of the counter-flow recuperator matrix is defined through the height,weight and length of its cuboid. The recuperator is calculated as one component, but it wouldbe easy to split into multiple smaller units that achieve the same overall performance and can bearranged circumferentially around the RBC’s shaft. The fourth and fifth main parameters are thechannel diameters for the two fluid flows. The individual parameter studies for the recuperator wereconducted based upon the initial design assumptions stated in Appendix A. The “full” study, whichvaried all the main recuperator design parameters together, improved on the previously identifiedbest MHX design.
Figure 7a illustrates, that while the module height has little influence on the component pressureratios above a value of 0.15 m, it does have a strong influence on the component’s relative weight.
Appl. Sci. 2017, 7, 255 15 of 27
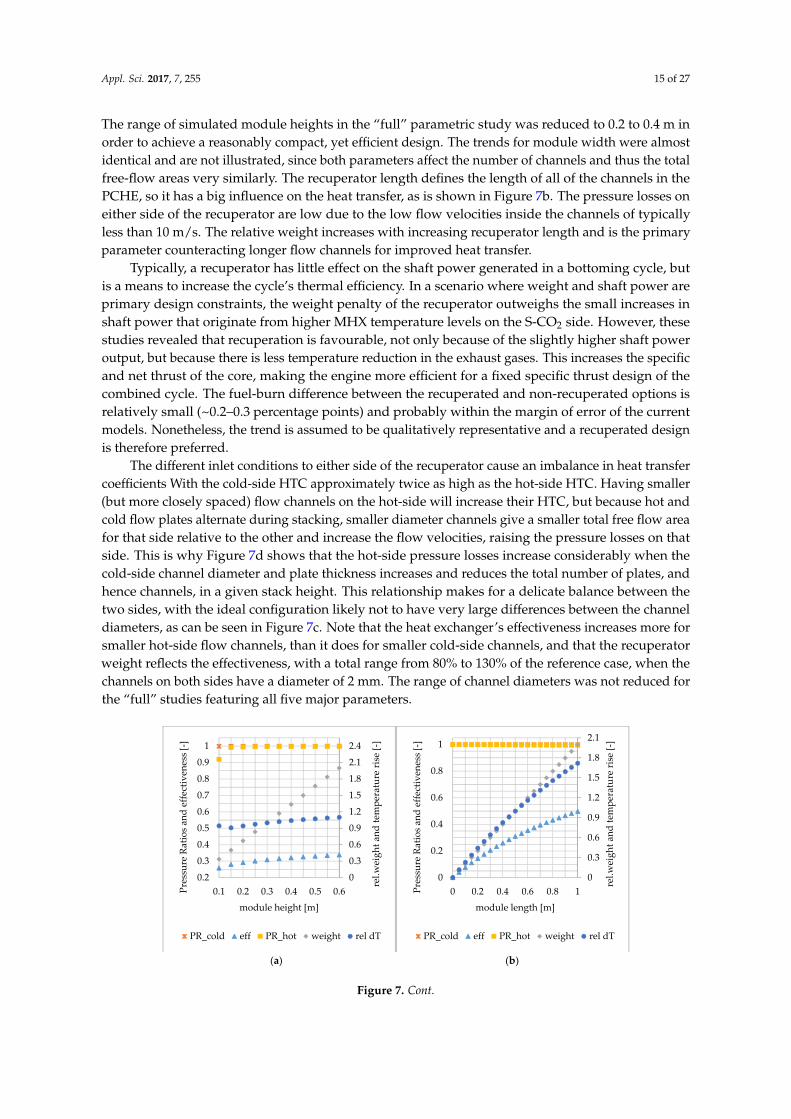
The range of simulated module heights in the “full” parametric study was reduced to 0.2 to 0.4 m inorder to achieve a reasonably compact, yet efficient design. The trends for module width were almostidentical and are not illustrated, since both parameters affect the number of channels and thus the totalfree-flow areas very similarly. The recuperator length defines the length of all of the channels in thePCHE, so it has a big influence on the heat transfer, as is shown in Figure 7b. The pressure losses oneither side of the recuperator are low due to the low flow velocities inside the channels of typicallyless than 10 m/s. The relative weight increases with increasing recuperator length and is the primaryparameter counteracting longer flow channels for improved heat transfer.
Typically, a recuperator has little effect on the shaft power generated in a bottoming cycle, butis a means to increase the cycle’s thermal efficiency. In a scenario where weight and shaft power areprimary design constraints, the weight penalty of the recuperator outweighs the small increases inshaft power that originate from higher MHX temperature levels on the S-CO2 side. However, thesestudies revealed that recuperation is favourable, not only because of the slightly higher shaft poweroutput, but because there is less temperature reduction in the exhaust gases. This increases the specificand net thrust of the core, making the engine more efficient for a fixed specific thrust design of thecombined cycle. The fuel-burn difference between the recuperated and non-recuperated options isrelatively small (~0.2–0.3 percentage points) and probably within the margin of error of the currentmodels. Nonetheless, the trend is assumed to be qualitatively representative and a recuperated designis therefore preferred.
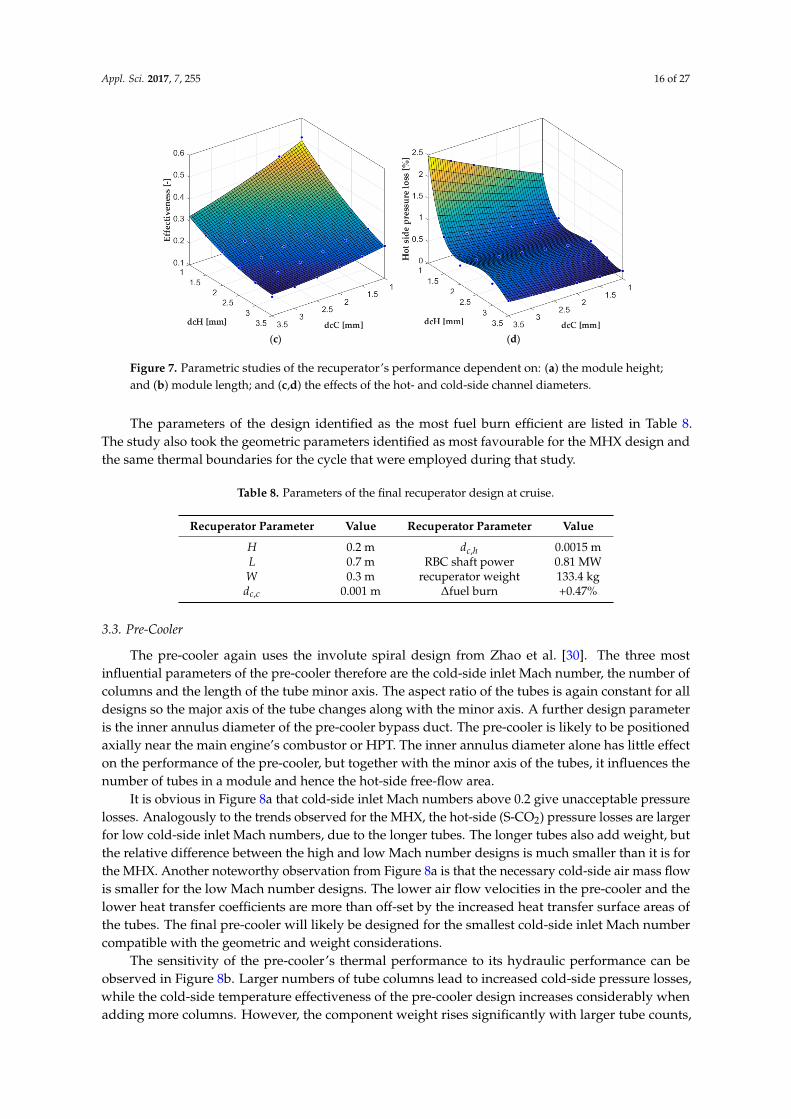
The different inlet conditions to either side of the recuperator cause an imbalance in heat transfercoefficients With the cold-side HTC approximately twice as high as the hot-side HTC. Having smaller(but more closely spaced) flow channels on the hot-side will increase their HTC, but because hot andcold flow plates alternate during stacking, smaller diameter channels give a smaller total free flow areafor that side relative to the other and increase the flow velocities, raising the pressure losses on thatside. This is why Figure 7d shows that the hot-side pressure losses increase considerably when thecold-side channel diameter and plate thickness increases and reduces the total number of plates, andhence channels, in a given stack height. This relationship makes for a delicate balance between thetwo sides, with the ideal configuration likely not to have very large differences between the channeldiameters, as can be seen in Figure 7c. Note that the heat exchanger’s effectiveness increases more forsmaller hot-side flow channels, than it does for smaller cold-side channels, and that the recuperatorweight reflects the effectiveness, with a total range from 80% to 130% of the reference case, when thechannels on both sides have a diameter of 2 mm. The range of channel diameters was not reduced forthe “full” studies featuring all five major parameters.
Appl. Sci. 2017, 7, 255 15 of 27
Figure 7a illustrates, that while the module height has little influence on the component pressure ratios above a value of 0.15 m, it does have a strong influence on the component’s relative weight. The range of simulated module heights in the “full” parametric study was reduced to 0.2 to 0.4 m in order to achieve a reasonably compact, yet efficient design. The trends for module width were almost identical and are not illustrated, since both parameters affect the number of channels and thus the total free-flow areas very similarly. The recuperator length defines the length of all of the channels in the PCHE, so it has a big influence on the heat transfer, as is shown in Figure 7b. The pressure losses on either side of the recuperator are low due to the low flow velocities inside the channels of typically less than 10 m/s. The relative weight increases with increasing recuperator length and is the primary parameter counteracting longer flow channels for improved heat transfer.
Typically, a recuperator has little effect on the shaft power generated in a bottoming cycle, but is a means to increase the cycle’s thermal efficiency. In a scenario where weight and shaft power are primary design constraints, the weight penalty of the recuperator outweighs the small increases in shaft power that originate from higher MHX temperature levels on the S-CO2 side. However, these studies revealed that recuperation is favourable, not only because of the slightly higher shaft power output, but because there is less temperature reduction in the exhaust gases. This increases the specific and net thrust of the core, making the engine more efficient for a fixed specific thrust design of the combined cycle. The fuel-burn difference between the recuperated and non-recuperated options is relatively small (~0.2–0.3 percentage points) and probably within the margin of error of the current models. Nonetheless, the trend is assumed to be qualitatively representative and a recuperated design is therefore preferred.
The different inlet conditions to either side of the recuperator cause an imbalance in heat transfer coefficients With the cold-side HTC approximately twice as high as the hot-side HTC. Having smaller (but more closely spaced) flow channels on the hot-side will increase their HTC, but because hot and cold flow plates alternate during stacking, smaller diameter channels give a smaller total free flow area for that side relative to the other and increase the flow velocities, raising the pressure losses on that side. This is why Figure 7d shows that the hot-side pressure losses increase considerably when the cold-side channel diameter and plate thickness increases and reduces the total number of plates, and hence channels, in a given stack height. This relationship makes for a delicate balance between the two sides, with the ideal configuration likely not to have very large differences between the channel diameters, as can be seen in Figure 7c. Note that the heat exchanger’s effectiveness increases more for smaller hot-side flow channels, than it does for smaller cold-side channels, and that the recuperator weight reflects the effectiveness, with a total range from 80% to 130% of the reference case, when the channels on both sides have a diameter of 2 mm. The range of channel diameters was not reduced for the “full” studies featuring all five major parameters.
(a) (b)
0
0.3
0.6
0.9
1.2
1.5
1.8
2.1
2.4
0.2
0.3
0.4
0.5
0.6
0.7
0.8
0.9
1
0.1 0.2 0.3 0.4 0.5 0.6
rel.w
eigh
t and
tem
pera
ture
rise
[-]
Pres
sure
Rat
ios
and
effe
ctiv
enes
s [-]
module height [m]
PR_cold eff PR_hot weight rel dT
0
0.3
0.6
0.9
1.2
1.5
1.8
2.1
0
0.2
0.4
0.6
0.8
1
0 0.2 0.4 0.6 0.8 1
rel.w
eigh
t and
tem
pera
ture
rise
[-]
Pres
sure
Rat
ios
and
effe
ctiv
enes
s [-]
module length [m]
PR_cold eff PR_hot weight rel dT
Figure 7. Cont.
Appl. Sci. 2017, 7, 255 16 of 27
Appl. Sci. 2017, 7, 255 16 of 27
(c) (d)
Figure 7. Parametric studies of the recuperator’s performance dependent on: (a) the module height; and (b) module length; and (c,d) the effects of the hot- and cold-side channel diameters.
The parameters of the design identified as the most fuel burn efficient are listed in Table 8. The study also took the geometric parameters identified as most favourable for the MHX design and the same thermal boundaries for the cycle that were employed during that study.
Table 8. Parameters of the final recuperator design at cruise.
Recuperator Parameter Value Recuperator Parameter Value 0.2 m , 0.0015 m 0.7 m RBC shaft power 0.81 MW 0.3 m recuperator weight 133.4 kg , 0.001 m ∆fuel burn +0.47%
3.3. Pre-Cooler
The pre-cooler again uses the involute spiral design from Zhao et al. [30]. The three most influential parameters of the pre-cooler therefore are the cold-side inlet Mach number, the number of columns and the length of the tube minor axis. The aspect ratio of the tubes is again constant for all designs so the major axis of the tube changes along with the minor axis. A further design parameter is the inner annulus diameter of the pre-cooler bypass duct. The pre-cooler is likely to be positioned axially near the main engine’s combustor or HPT. The inner annulus diameter alone has little effect on the performance of the pre-cooler, but together with the minor axis of the tubes, it influences the number of tubes in a module and hence the hot-side free-flow area.
It is obvious in Figure 8a that cold-side inlet Mach numbers above 0.2 give unacceptable pressure losses. Analogously to the trends observed for the MHX, the hot-side (S-CO2) pressure losses are larger for low cold-side inlet Mach numbers, due to the longer tubes. The longer tubes also add weight, but the relative difference between the high and low Mach number designs is much smaller than it is for the MHX. Another noteworthy observation from Figure 8a is that the necessary cold-side air mass flow is smaller for the low Mach number designs. The lower air flow velocities in the pre-cooler and the lower heat transfer coefficients are more than off-set by the increased heat transfer surface areas of the tubes. The final pre-cooler will likely be designed for the smallest cold-side inlet Mach number compatible with the geometric and weight considerations.
The sensitivity of the pre-cooler’s thermal performance to its hydraulic performance can be observed in Figure 8b. Larger numbers of tube columns lead to increased cold-side pressure losses, while the cold-side temperature effectiveness of the pre-cooler design increases considerably when adding more columns. However, the component weight rises significantly with larger tube counts,
Figure 7. Parametric studies of the recuperator’s performance dependent on: (a) the module height;and (b) module length; and (c,d) the effects of the hot- and cold-side channel diameters.
The parameters of the design identified as the most fuel burn efficient are listed in Table 8.The study also took the geometric parameters identified as most favourable for the MHX design andthe same thermal boundaries for the cycle that were employed during that study.
Table 8. Parameters of the final recuperator design at cruise.
Recuperator Parameter Value Recuperator Parameter Value
H 0.2 m dc,h 0.0015 mL 0.7 m RBC shaft power 0.81 MWW 0.3 m recuperator weight 133.4 kgdc,c 0.001 m ∆fuel burn +0.47%
3.3. Pre-Cooler
The pre-cooler again uses the involute spiral design from Zhao et al. [30]. The three mostinfluential parameters of the pre-cooler therefore are the cold-side inlet Mach number, the number ofcolumns and the length of the tube minor axis. The aspect ratio of the tubes is again constant for alldesigns so the major axis of the tube changes along with the minor axis. A further design parameteris the inner annulus diameter of the pre-cooler bypass duct. The pre-cooler is likely to be positionedaxially near the main engine’s combustor or HPT. The inner annulus diameter alone has little effecton the performance of the pre-cooler, but together with the minor axis of the tubes, it influences thenumber of tubes in a module and hence the hot-side free-flow area.
It is obvious in Figure 8a that cold-side inlet Mach numbers above 0.2 give unacceptable pressurelosses. Analogously to the trends observed for the MHX, the hot-side (S-CO2) pressure losses are largerfor low cold-side inlet Mach numbers, due to the longer tubes. The longer tubes also add weight, butthe relative difference between the high and low Mach number designs is much smaller than it is forthe MHX. Another noteworthy observation from Figure 8a is that the necessary cold-side air mass flowis smaller for the low Mach number designs. The lower air flow velocities in the pre-cooler and thelower heat transfer coefficients are more than off-set by the increased heat transfer surface areas ofthe tubes. The final pre-cooler will likely be designed for the smallest cold-side inlet Mach numbercompatible with the geometric and weight considerations.
The sensitivity of the pre-cooler’s thermal performance to its hydraulic performance can beobserved in Figure 8b. Larger numbers of tube columns lead to increased cold-side pressure losses,while the cold-side temperature effectiveness of the pre-cooler design increases considerably whenadding more columns. However, the component weight rises significantly with larger tube counts,

Appl. Sci. 2017, 7, 255 17 of 27
so the final design is unlikely to feature more than four outboard and inboard tube columns. It isvery unlikely that the pre-cooler would feature only one pair of tube columns, as the tubes wouldhave to be very long to achieve the necessary heat transfer. This would increase the hot-side pressurelosses dramatically, as can be seen in Figure 8b. Excessive hot-side pressure losses have an immediatedetrimental effect on the performance of the whole RBC cycle, as they reduce the possible expansionratio of the turbine, and thus the shaft power produced by the RBC.
Figure 8c illustrates the expected trend that smaller tube diameter designs perform betterthermally. However, the hot-side pressure losses increase noticeably for a tube minor axis belowone millimetre, making a tube minor axis up to 1.4 mm more favourable from a cycle perspective.A larger tube minor axis, and therefore major axis, means that the pre-cooler will need more air massflow and longer tubes to off-set the reduced heat transfer coefficients, if all other input parameterssuch as the inlet Mach numbers are kept constant. This is why component weight and relative air massflows increase considerably with increasing tube size.
Appl. Sci. 2017, 7, 255 17 of 27
so the final design is unlikely to feature more than four outboard and inboard tube columns. It is very unlikely that the pre-cooler would feature only one pair of tube columns, as the tubes would have to be very long to achieve the necessary heat transfer. This would increase the hot-side pressure losses dramatically, as can be seen in Figure 8b. Excessive hot-side pressure losses have an immediate detrimental effect on the performance of the whole RBC cycle, as they reduce the possible expansion ratio of the turbine, and thus the shaft power produced by the RBC.
Figure 8c illustrates the expected trend that smaller tube diameter designs perform better thermally. However, the hot-side pressure losses increase noticeably for a tube minor axis below one millimetre, making a tube minor axis up to 1.4 mm more favourable from a cycle perspective. A larger tube minor axis, and therefore major axis, means that the pre-cooler will need more air mass flow and longer tubes to off-set the reduced heat transfer coefficients, if all other input parameters such as the inlet Mach numbers are kept constant. This is why component weight and relative air mass flows increase considerably with increasing tube size.
(a) (b)
(c)
Figure 8. Parametric studies of the Pre-cooler of: (a) the cold-side inlet Mach number; (b) the number of columns per pass; and (c) the tube dimensions
The parameters of the pre-cooler design identified as the most fuel-burn efficient are listed in Table 9. The study was also conducted using the geometric parameters identified as most favourable
0
0.5
1
1.5
2
2.5
3
0
0.2
0.4
0.6
0.8
1
1.2
0.1 0.14 0.18 0.22
rel.w
eigh
t, te
mp.
rise
, air
mas
s flo
w [-
]
Pres
sure
Rat
ios
and
effe
ctiv
enes
s [-]
Cold-side inlet Mach number [-]PR_cold effPR_hot weightrel dT rel W_cold
0
0.5
1
1.5
2
2.5
3
0
0.2
0.4
0.6
0.8
1
1.2
1 3 5 7 rel.w
eigh
t, te
mp.
rise
, air
mas
s flo
w [-
]
Pres
sure
Rat
ios
and
effe
ctiv
enes
s [-]
Number of columns per pass [-]
PR_cold eff PR_hot
weight rel dT rel W_cold
0
0.5
1
1.5
2
2.5
3
0
0.2
0.4
0.6
0.8
1
1.2
0.85 1.1 1.35 1.6 1.85
rel.w
eigh
t, te
mp.
rise
, air
mas
s flo
w [-
]
Pres
sure
Rat
ios
and
effe
ctiv
enes
s [-]
Tube minor axis [mm]
PR_cold eff PR_hot
weight rel dT rel W_cold
Figure 8. Parametric studies of the Pre-cooler of: (a) the cold-side inlet Mach number; (b) the numberof columns per pass; and (c) the tube dimensions.
The parameters of the pre-cooler design identified as the most fuel-burn efficient are listed inTable 9. The study was also conducted using the geometric parameters identified as most favourable
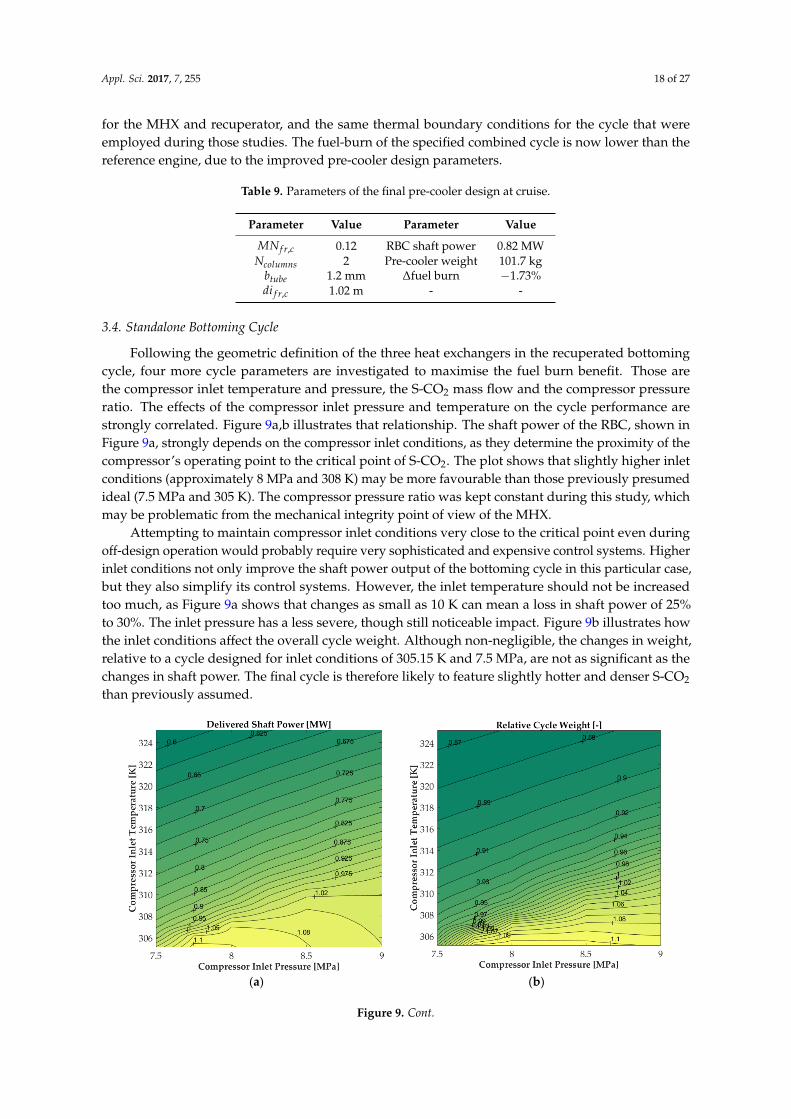
Appl. Sci. 2017, 7, 255 18 of 27
for the MHX and recuperator, and the same thermal boundary conditions for the cycle that wereemployed during those studies. The fuel-burn of the specified combined cycle is now lower than thereference engine, due to the improved pre-cooler design parameters.
Table 9. Parameters of the final pre-cooler design at cruise.
Parameter Value Parameter Value
MN f r,c 0.12 RBC shaft power 0.82 MWNcolumns 2 Pre-cooler weight 101.7 kg
btube 1.2 mm ∆fuel burn −1.73%di f r,c 1.02 m - -
3.4. Standalone Bottoming Cycle
Following the geometric definition of the three heat exchangers in the recuperated bottomingcycle, four more cycle parameters are investigated to maximise the fuel burn benefit. Those arethe compressor inlet temperature and pressure, the S-CO2 mass flow and the compressor pressureratio. The effects of the compressor inlet pressure and temperature on the cycle performance arestrongly correlated. Figure 9a,b illustrates that relationship. The shaft power of the RBC, shown inFigure 9a, strongly depends on the compressor inlet conditions, as they determine the proximity of thecompressor’s operating point to the critical point of S-CO2. The plot shows that slightly higher inletconditions (approximately 8 MPa and 308 K) may be more favourable than those previously presumedideal (7.5 MPa and 305 K). The compressor pressure ratio was kept constant during this study, whichmay be problematic from the mechanical integrity point of view of the MHX.
Attempting to maintain compressor inlet conditions very close to the critical point even duringoff-design operation would probably require very sophisticated and expensive control systems. Higherinlet conditions not only improve the shaft power output of the bottoming cycle in this particular case,but they also simplify its control systems. However, the inlet temperature should not be increasedtoo much, as Figure 9a shows that changes as small as 10 K can mean a loss in shaft power of 25%to 30%. The inlet pressure has a less severe, though still noticeable impact. Figure 9b illustrates howthe inlet conditions affect the overall cycle weight. Although non-negligible, the changes in weight,relative to a cycle designed for inlet conditions of 305.15 K and 7.5 MPa, are not as significant as thechanges in shaft power. The final cycle is therefore likely to feature slightly hotter and denser S-CO2
than previously assumed.
Appl. Sci. 2017, 7, 255 18 of 27
for the MHX and recuperator, and the same thermal boundary conditions for the cycle that were employed during those studies. The fuel-burn of the specified combined cycle is now lower than the reference engine, due to the improved pre-cooler design parameters.
Table 9. Parameters of the final pre-cooler design at cruise.
Parameter Value Parameter Value, 0.12 RBC shaft power 0.82 MW 2 Pre-cooler weight 101.7 kg
1.2 mm ∆fuel burn −1.73% , 1.02 m - -
3.4. Standalone Bottoming Cycle
Following the geometric definition of the three heat exchangers in the recuperated bottoming cycle, four more cycle parameters are investigated to maximise the fuel burn benefit. Those are the compressor inlet temperature and pressure, the S-CO2 mass flow and the compressor pressure ratio. The effects of the compressor inlet pressure and temperature on the cycle performance are strongly correlated. Figure 9a,b illustrates that relationship. The shaft power of the RBC, shown in Figure 9a, strongly depends on the compressor inlet conditions, as they determine the proximity of the compressor’s operating point to the critical point of S-CO2. The plot shows that slightly higher inlet conditions (approximately 8 MPa and 308 K) may be more favourable than those previously presumed ideal (7.5 MPa and 305 K). The compressor pressure ratio was kept constant during this study, which may be problematic from the mechanical integrity point of view of the MHX.
Attempting to maintain compressor inlet conditions very close to the critical point even during off-design operation would probably require very sophisticated and expensive control systems. Higher inlet conditions not only improve the shaft power output of the bottoming cycle in this particular case, but they also simplify its control systems. However, the inlet temperature should not be increased too much, as Figure 9a shows that changes as small as 10 K can mean a loss in shaft power of 25% to 30%. The inlet pressure has a less severe, though still noticeable impact. Figure 9b illustrates how the inlet conditions affect the overall cycle weight. Although non-negligible, the changes in weight, relative to a cycle designed for inlet conditions of 305.15 K and 7.5 MPa, are not as significant as the changes in shaft power. The final cycle is therefore likely to feature slightly hotter and denser S-CO2 than previously assumed.
(a) (b)
Figure 9. Cont.

Appl. Sci. 2017, 7, 255 19 of 27
Appl. Sci. 2017, 7, 255 19 of 27
(c) (d)
Figure 9. Effect of the compressor inlet temperature and pressure on: the produced shaft power (UP) (a); and the cycle weight (b). The influence of: the S-CO2 mass flow (c); and pressure ratio (d).
The S-CO2 mass flow of the final cycle is likely to be between 18 and 23 kg/s for the current component designs, as can be derived from Figure 9c. Lower mass flows trade considerable losses in shaft power against modest improvements in weight and bypass flow disturbance. Higher mass flows on the other hand, lead to minor improvements in shaft power while resulting in larger and heavier cycles.
Either way, the power-to-weight ratio of the bottoming cycle decreases. The required air flow in the pre-cooler increases noticeably with increasing S-CO2 mass flow and the amount of heat that needs to be rejected. The geometric implications of having a larger air mass flow in the pre-cooler will impose another constraint on the feasible S-CO2 mass flow. Furthermore, the RBC’s thermal efficiency is lower in the higher mass flow designs, because the peak temperature in the cycle drops.
When trying to maximise shaft power, the range of compressor pressure ratios depicted in Figure 9d may be too narrow. However, a pressure ratio of four is currently assumed to be the maximum possible with the projected technology levels, as the components and their casings may otherwise get too heavy. Thermal and mechanical loads may already be too high with the current designs, which is why more detailed mechanical design tools are under development. The thermal efficiency of the RBC also increases with increasing pressure ratio, which is why the required pre-cooler air mass flow reduces slightly.
The ideal cycle parameters for the given thermal boundary conditions and the fixed geometric designs of the three heat exchangers are listed in Table 10. The total weight of the RBC stated in Table 10 includes a 100-kg contingency for the connecting ducts and the turbomachinery weights. This value is a crude estimate and will be updated through physical models for these components in subsequent investigations.
Table 10. Final RBC specifications at cruise.
Parameter Value Parameter Value , 308 K , , 0.2% , 8.1 MPa , , 7 K cmp,in 19 kg/s , 32.1% PR 4 , 4.7%
60.5% , 37 K , 4.1% , 97 kg/s , 135 K , 2.7% , 0.5% , 78 K
0
0.5
1
1.5
2
2.5
3
0
0.2
0.4
0.6
0.8
1
1.2
15 17 19 21 23 25 27 29
rel.w
eigh
t, ai
r mas
s flo
w [-
]
RBC
ther
mal
effi
cien
cy [-
] and
UP
[MW
]
S-CO2 mass flow [kg/s]
UP eff weight rel W_cold
0
0.5
1
1.5
2
2.5
3
0
0.2
0.4
0.6
0.8
1
1.2
2 3 4
rel.w
eigh
t, ai
r mas
s flo
w [-
]
RBC
ther
mal
effi
cien
cy [-
] and
UP
[MW
]
S-CO2 Compressor Pressure Ratio [-]
UP eff weight rel W_cold
Figure 9. Effect of the compressor inlet temperature and pressure on: the produced shaft power (UP)(a); and the cycle weight (b). The influence of: the S-CO2 mass flow (c); and pressure ratio (d).
The S-CO2 mass flow of the final cycle is likely to be between 18 and 23 kg/s for the currentcomponent designs, as can be derived from Figure 9c. Lower mass flows trade considerable lossesin shaft power against modest improvements in weight and bypass flow disturbance. Higher massflows on the other hand, lead to minor improvements in shaft power while resulting in larger andheavier cycles.
Either way, the power-to-weight ratio of the bottoming cycle decreases. The required air flowin the pre-cooler increases noticeably with increasing S-CO2 mass flow and the amount of heat thatneeds to be rejected. The geometric implications of having a larger air mass flow in the pre-cooler willimpose another constraint on the feasible S-CO2 mass flow. Furthermore, the RBC’s thermal efficiencyis lower in the higher mass flow designs, because the peak temperature in the cycle drops.
When trying to maximise shaft power, the range of compressor pressure ratios depicted inFigure 9d may be too narrow. However, a pressure ratio of four is currently assumed to be themaximum possible with the projected technology levels, as the components and their casings mayotherwise get too heavy. Thermal and mechanical loads may already be too high with the currentdesigns, which is why more detailed mechanical design tools are under development. The thermalefficiency of the RBC also increases with increasing pressure ratio, which is why the required pre-coolerair mass flow reduces slightly.
The ideal cycle parameters for the given thermal boundary conditions and the fixed geometricdesigns of the three heat exchangers are listed in Table 10. The total weight of the RBC stated inTable 10 includes a 100-kg contingency for the connecting ducts and the turbomachinery weights.This value is a crude estimate and will be updated through physical models for these components insubsequent investigations.

Appl. Sci. 2017, 7, 255 20 of 27
Table 10. Final RBC specifications at cruise.
Parameter Value Parameter Value
Tcmp,in 8 K dPcold,S−CO2,Rec 0.2%Pcmp,in 8.1 MPa dTcold,S−CO2,Rec 7 K
Wcmp,in 19 kg/s εair,Pre 32.1%PR 4 dPair,Pre 4.7%
εMHX 60.5% dTair,Pre 37 KdPair,MHX 4.1% Wair,Pre 97 kg/sdTair,MHX 135 K dPS−CO2,Pre 2.7%
dPS−CO2,MHX 0.5% dTS−CO2,Pre 78 KdTS−CO2,MHX 142 K RBC ηth 18.8%
εRec 50.1% Shaft power 0.84 MWdPhot,S−CO2,Rec 0.8% total weight 604.5 kgdThot,S−CO2,Rec 11 K ∆fuel-burn −1.90%
4. Discussion
The geometric design and the performance of a recuperated bottoming cycle for a projected year2050 geared turbofan engine was determined in an effort to conceptualise an aero engine capableof fulfilling the Flightpath 2050 goals. Previous studies have focused on ORCs [14] and open aircycles [10]. The current novel design features supercritical carbon dioxide as a working fluid, as didDe Servi et al. [24]. The addition of a bottoming cycle, which recycles part of the core engine’s exhaustheat and provides shaft power to the low pressure shaft of the main engine, makes the combinedcycle engine approximately 1.9% more fuel burn effective than the reference TF2050. Although anon-negligible benefit, this will not be sufficient to reach the Flightpath 2050 goals. However, aconsiderable part of the RBC’s potential for fuel burn reduction has not yet been capitalised on. TheRBC will increase the specific power of the main engine’s core and may facilitate lower specific thrustdesigns, with fewer penalties from extreme HPC exit conditions or large LPT expansion ratios. In fact,the optimum OPR of the main engine will likely be lower than that of the TF2050 due to the resultingfavourable LPT exhaust gas conditions, alleviating some of the problem of excessive HPC or LPTdesigns. These effects will be investigated in combined cycle studies, with coupled TF2050 andbottoming cycle models. The creation of the integrated combined cycle engine model is the next step.
It is very likely that further parametric studies and combined cycle optimisations will find moreefficient designs. The current RBC design has been derived by exploring the designs of the threeheat exchangers and the turbomachinery sequentially. Apart from the installed weight, the geometricconstraints imposed by the main engine have only been included as absolute limits. Full parametric oroptimisation studies that investigate the design parameters of all those components and the TF2050together, will be able to more adequately capture the dependencies of each of the components’ designs.The effect of designing the pre-cooler and MHX to feature four instead of two passes may also prove toincrease the combined cycle efficiency of the engine, despite some increase in external pressure losses.
Beside optimisations, there are two areas of this engine concept’s further development that needto be explored for its more definite evaluation. The first is the extension of the current RBC model’scapabilities. Four main features will be developed further:
• thermal and hydraulic performance of finned tubes in the MHX and pre-cooler;• simple mechanical integrity models for the heat exchangers, especially the tubes;• mean line design and improved weight estimation of the turbomachinery;• estimation of the nacelle diameter increases due to the heat exchanger geometries and the
corresponding drag penalties.
The issue of the tube thicknesses walls needs addressing and there are a number of options to doso. The elliptical tubes could be strengthened through an internal support structure or webs, similar to

Appl. Sci. 2017, 7, 255 21 of 27
the elliptical tubes of MTU’s Lancette heat exchanger [39]. The need for larger external heat transfersurface areas makes a case for finned elliptical tubes [40], which could have the added benefit of thefins stiffening the tubes themselves, reducing the necessary wall thickness. As a third option, the tubegeometry could be altered towards lower aspect ratio elliptical tubes or even circular tubes, either withor without fins. These tube shapes will enable thinner walls, though that mechanical benefit will betraded against the likely higher drag and larger internal hydraulic diameters, resulting in lower heattransfer. However, if the tube arrangement were to be changed, together with the tube shape, and ifthe fins were larger, then finned circular tubes in a non-staggered arrangement may prove to be a moreattractive option. An exploration of a number of these options is currently underway and will not onlyhelp to down-select a preferred design, but will also generate an analytical model to appropriately sizethe tube walls for that design.
The second area of future development is the investigation of the synergies bottoming cycles mayhave with other novel core technologies for aero engines. The bottoming cycle’s shaft power outputis largely constrained by the relatively low exhaust gas temperature of the TF2050 at cruise. In aneffort to increase the bottoming cycle’s efficiency and at the same time reduce the main engine’s coresize, the addition of inter-turbine reheat (ITR) in the main engine will be investigated. Inter-turbinecombustion has been shown to improve the efficiency of stationary gas turbines in Alstom’s GT24/26,especially at part-load and in combination with a bottoming cycle that utilises the increased exhaustgas temperatures. If ITR were employed in the TF2050, the core mass flow would be reduced andhence the HP component efficiencies would be penalised. The bypass ratio would also increase for agiven specific thrust, reducing the transfer efficiency of the engine. The fuel-burn benefit of a combinedcycle TF2050 with ITR will likely exceed 1.9%, as the increased efficiency of the bottoming cycle andweight reductions in the core engine and the bottoming cycle are likely to outweigh these penalties.ITR should furthermore help reducing NOx, as the peak temperature in the main combustor could bereduced. Inter-turbine combustion can also remedy the EGT-lowering effect of increased OPR in anintercooled main engine. It should therefore be worth investigating a combined cycle engine featuringITR, intercooling and an S-CO2 bottoming cycle.
Table 11 highlights the approximated effects of greater external heat transfer surface areas forthe MHX and the pre-cooler in two case studies (Cases 2 and 3). All parameters not mentioned inTable 11 were kept constant. Case 1 represents the RBC configuration presented in this study. Case 2illustrates the maximum achievable benefit the RBC could provide, if the heat transfer surface areas ofthe MHX and pre-cooler could be increased by 200% and 100%, respectively, and if there would beno weight or pressure loss penalty. Case 2 is an unrealistic yet illustrative scenario. However, if theadditional heat transfer surfaces doubled the weight increase of the MHX and pre-cooler, and if therespective external pressure losses were increased by two percentage points, then the fuel burn benefitof the larger heat transfer surface configuration over Case 1 would drop from 3.2% to 0.5%. Case 3 alsoindicates the weight and pressure loss penalties that should not be exceeded, for “enhanced” externaltransfer surface designs to still be profitable.
Table 11. Approximate influence of improved design boundaries at cruise.
Parameter Case 1 Case 2 Case 3
EGT (K) 615.34 615.34 615.34WS-CO2 (kg/s) 19 19 19
Shaft power (MW) 0.84 1.22 1.22MHX hot-side area increase (%) 0 200 200
Pre-cooler air-side area increase (%) 0 100 100Additional dPair,MHX (%) 0 0 2Additional dPair,Pre (%) 0 0 2
Weight increase of MHX andPre-cooler (%) 0 0 100
Fuel burn benefit over TF (%) 1.9 5.1 2.4

Appl. Sci. 2017, 7, 255 22 of 27
The S-CO2 turbomachinery component efficiencies assumed herein are ambitious, but shouldnot be untenable considering the 35-year prelude to the estimated entry into service of the engines.Studies into S-CO2 cycles for the close- to mid-term future [19,41] assume isentropic efficiencies of85% and 90% for the compressor and turbine respectively, though for larger mass flows. Figure 2bin Section 2.1 illustrated the sensitivity of the cycle to the turbomachinery efficiencies. The fuel burnbenefit of the bottoming cycle augmented engine would reduce from 1.9% to 1.62%, if the compressorefficiency were 85% rather than 89%, if all other input parameters were kept constant.
Besides dedicated models for finned tubes and four-pass configurations for the MHX and thepre-cooler, mechanical integrity models are under development to more realistically estimate wallthicknesses of elliptical heat exchanger tubes. The potential effects of over-optimistic componentweights due to underestimated tube wall thicknesses can be inferred from the trends in Table 11.
The current investigation illustrates the effects of the most important design parameters of the RBCcomponents. There are numerous additional parameters such as surface finish in the heat exchangers,the inlet and outlet duct shapes and the positioning of all the components. These parameters will beaccounted for in future sensitivity studies. Possibly the most influential of these parameters are thematerial choices. The heat exchangers are all assumed to be made of the light, but relatively expensive,Ti-6Al-4V [36]. The thermal boundary conditions of the components would allow for stainless steels tobe used, but the bottoming cycle weight would increase by up to 70%, possibly making the designsuntenable. Changing the material of a single component would alter the percentage of the overall RBCweight that that component accounts for. This may then necessitate the redesign of other componentsfor optimum performance.
The goals of Flightpath 2050 specify emissions as well as fuel burn reduction targets. Bottomingcycles do not alter the combustion processes or the combustor’s design, but they reduce the amountof fuel burnt. Reductions in CO2 emissions depend on the consumption of Jet-A1 and thereforecorrelate to any fuel burn improvements made, but NOx may be reduced further, particularly if ITRis employed and the main combustor flame temperature is reduced. No CFD studies or rig testshave been conducted yet on the effect of the heat exchangers on engine noise, but the lower core EGTcombined with a muffling effect of the heat exchanger matrix behind the LPT, could reduce noise fromthe core of the engine.
Overall, it can be stated that the addition of an S-CO2 bottoming cycle to a geared turbofan enginepromises considerable performance benefits that may be further increased through synergies withother novel core concepts.
5. Conclusions
The presented design approach was successful in that it helped identify an S-CO2 bottomingcycle that promises a 1.9% fuel burn reduction over an advanced geared turbofan engine with 2050EIS technology. However, this is only a small first step toward meeting the challenging goals set byULTIMATE and it must be built upon in further work. The combined cycle parameters are not yetfully optimised and there is the potential for bigger performance improvements. These will need to beunderwritten by more in-depth feasibility assessments, including off-design performance modellingand thermo-mechanical design studies. The current investigations have shown the necessity for earlyand detailed modelling of the heat exchangers when attempting to optimise such cycles. Parametricstudies have revealed interdependencies of geometric and cycle parameters that greatly influencethe performance of the whole engine. They have also identified further opportunities to improve themodels and the concept as a whole.
While the goal of 15% fuel burn reduction over the reference engine seems very ambitious,progress towards that goal can be expected from more integrated simulations of combined cycles withthe further addition of inter-turbine reheat and/or intercooling. The combination of these technologiesin a final engine configuration should also help to reduce NOx emissions and engine noise.
Appl. Sci. 2017, 7, 255 23 of 27
Supplementary Materials: The computer models for these studies are proprietary under Grant AgreementNo. 633436 of the European Union’s Horizon 2020 research and innovation programme, and underCranfield University’s contractual obligations. They cannot be made available at this time. Supplementarydata will be uploaded onto the “Cranfield Online Research Depository” (CORD) under the DOI:10.17862/cranfield.rd.c.3654767. Access to these data will be restricted for three years after work under the Grant Agreementis completed.
Acknowledgments: This project has received funding from the European Union’s Horizon 2020 research andinnovation programme under Grant Agreement No. 633436. The costs for publishing in open access have beenclaimed from those funds, as open access publications are prioritised by the European Commission. The authorsare grateful to Cranfield University and Chalmers University of Technology for permission to publish this paper.The authors’ special gratitude to Xin Zhao and Carlos Xisto of Chalmers University for their work and inputon the involute spiral heat exchanger design. Further thanks to Pavlos Zachos and Eduardo Anselmi Palmafrom Cranfield University for their input on S-CO2 bottoming cycles. The authors would also like to thank EAInternacional for the provision of “PROOSIS”, a Propulsion Object-Oriented Simulation Software.
Author Contributions: Mathieu Belmonte implemented the fluid properties of S-CO2 and the basic functionalityof the S-CO2 components in PROOSIS during his time at Cranfield University as a visiting researcher. Florian Jacoboriginally conceived the concept of an S-CO2 bottoming cycle on an aero engine under the tutelage ofVishal Sethi, implemented the geometric models of the components and conducted the presented parametricstudies. Florian Jacob wrote the paper with considerable guidance and input from Andrew Martin Rolt,Joshua Marius Sebastiampillai and Vishal Sethi. The provision of PROOSIS by Pedro Cobas was instrumental tothis work.
Conflicts of Interest: The authors declare no conflict of interest. The funding sponsors had no role in the designof the study; in the collection, analyses, or interpretation of data; in the writing of the manuscript, and in thedecision to publish the results.
Nomenclature
Abbreviation Acronym Description UnitsABC Air Bottoming Cycle -A f f ,h Hot-side free-flow area m2
atube Tube major axis mbtube Tube minor axis mdP Pressure loss %dc,c Cold-side channel diameter mdh Hydraulic diameter mdi f r,c Cold-side, frontal inner diameter mECS Environmental Control System -EGT Exhaust gas temperature Kε Effectiveness after Kays and London %εabs Absolute Surface roughness mεtemp Temperature Effectiveness %ηfan,BP Isentropic efficiency of fan bypass section -Fn Net Thrust kNfD Darcy friction factor -H Height mHTC, htc Heat transfer coefficient W/(m2·K)IC Intercooling -ITR Inter-turbine reheat -j Colburn factor -L Length mLPT Low pressure turbine -Ltubes Tube length mMHX Main Heat Exchanger -MN f r,h Hot-side inlet Mach number -Mrec Recuperator weight kg.
mcmp,in Compressor inlet mass flow kg/s
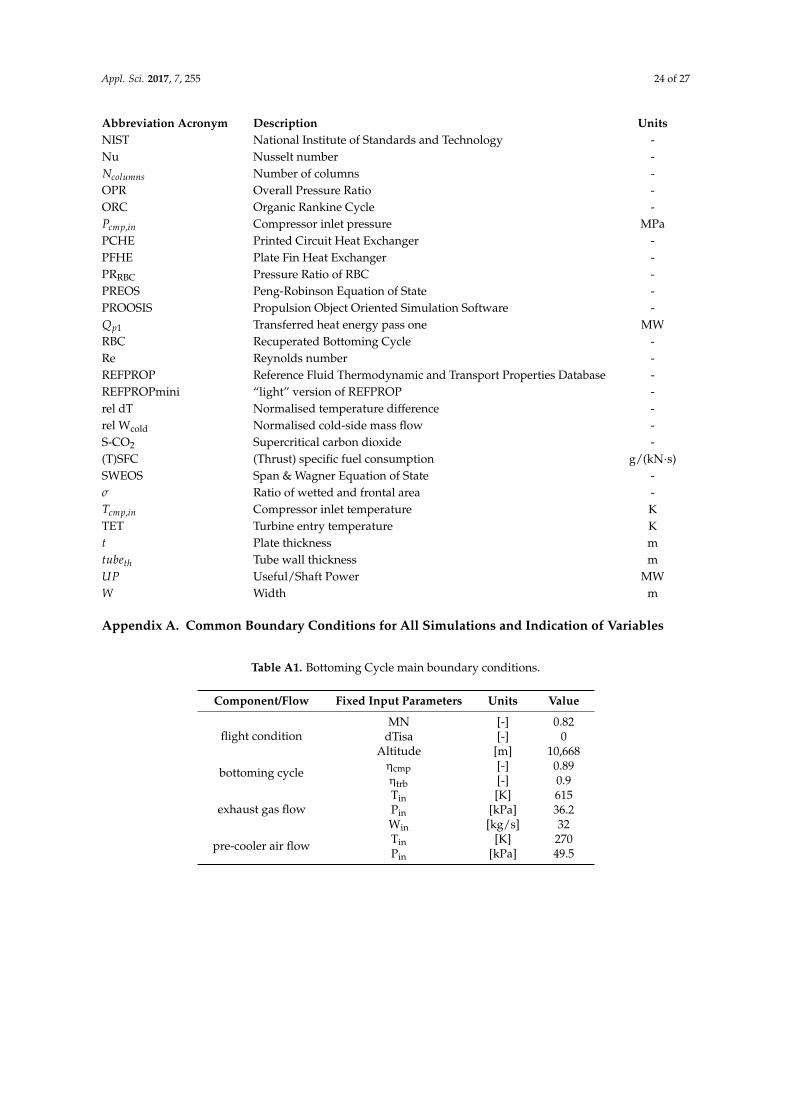
Appl. Sci. 2017, 7, 255 24 of 27
Abbreviation Acronym Description UnitsNIST National Institute of Standards and Technology -Nu Nusselt number -Ncolumns Number of columns -OPR Overall Pressure Ratio -ORC Organic Rankine Cycle -Pcmp,in Compressor inlet pressure MPaPCHE Printed Circuit Heat Exchanger -PFHE Plate Fin Heat Exchanger -PRRBC Pressure Ratio of RBC -PREOS Peng-Robinson Equation of State -PROOSIS Propulsion Object Oriented Simulation Software -Qp1 Transferred heat energy pass one MWRBC Recuperated Bottoming Cycle -Re Reynolds number -REFPROP Reference Fluid Thermodynamic and Transport Properties Database -REFPROPmini “light” version of REFPROP -rel dT Normalised temperature difference -rel Wcold Normalised cold-side mass flow -S-CO2 Supercritical carbon dioxide -(T)SFC (Thrust) specific fuel consumption g/(kN·s)SWEOS Span & Wagner Equation of State -σ Ratio of wetted and frontal area -Tcmp,in Compressor inlet temperature KTET Turbine entry temperature Kt Plate thickness mtubeth Tube wall thickness mUP Useful/Shaft Power MWW Width m
Appendix A. Common Boundary Conditions for All Simulations and Indication of Variables
Table A1. Bottoming Cycle main boundary conditions.
Component/Flow Fixed Input Parameters Units Value
flight conditionMN [-] 0.82
dTisa [-] 0Altitude [m] 10,668
bottoming cycle ηcmp [-] 0.89ηtrb [-] 0.9
exhaust gas flowTin [K] 615Pin [kPa] 36.2Win [kg/s] 32
pre-cooler air flow Tin [K] 270Pin [kPa] 49.5
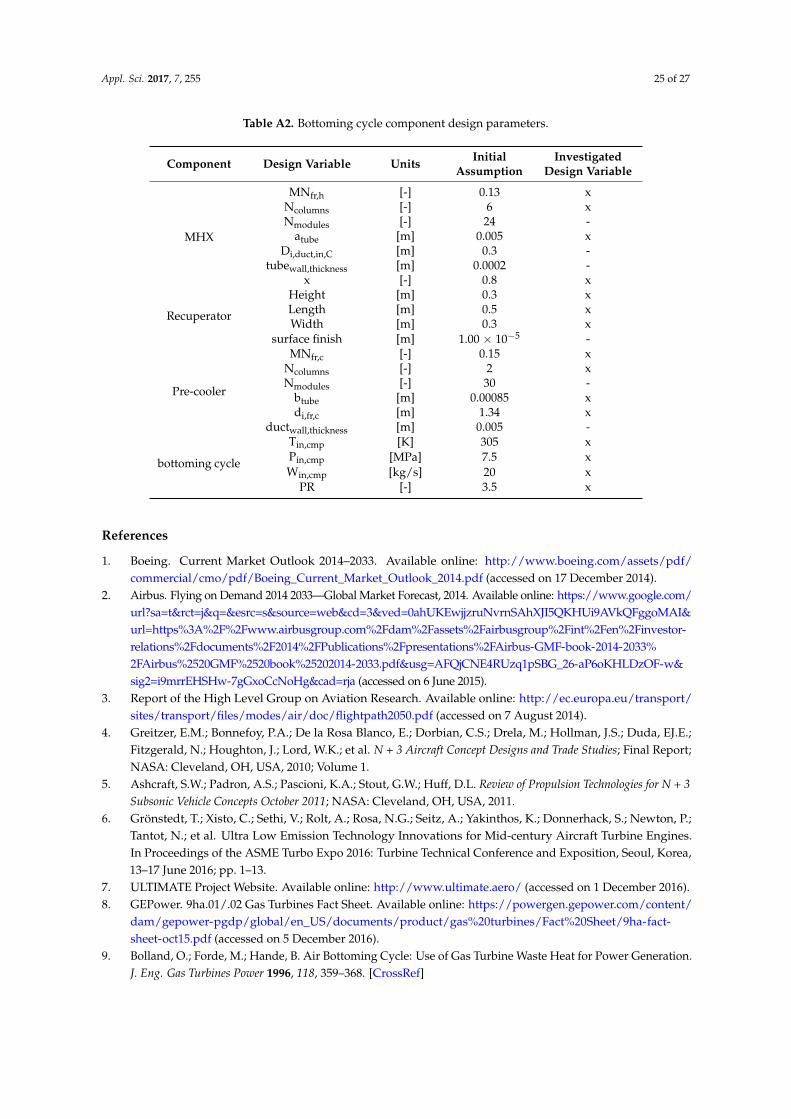
Appl. Sci. 2017, 7, 255 25 of 27
Table A2. Bottoming cycle component design parameters.
Component Design Variable Units InitialAssumption
InvestigatedDesign Variable
MHX
MNfr,h [-] 0.13 xNcolumns [-] 6 xNmodules [-] 24 -
atube [m] 0.005 xDi,duct,in,C [m] 0.3 -
tubewall,thickness [m] 0.0002 -x [-] 0.8 x
Recuperator
Height [m] 0.3 xLength [m] 0.5 xWidth [m] 0.3 x
surface finish [m] 1.00 × 10⁻⁵ -
Pre-cooler
MNfr,c [-] 0.15 xNcolumns [-] 2 xNmodules [-] 30 -
btube [m] 0.00085 xdi,fr,c [m] 1.34 x
ductwall,thickness [m] 0.005 -
bottoming cycle
Tin,cmp [K] 305 xPin,cmp [MPa] 7.5 xWin,cmp [kg/s] 20 x
PR [-] 3.5 x
References
1. Boeing. Current Market Outlook 2014–2033. Available online: http://www.boeing.com/assets/pdf/commercial/cmo/pdf/Boeing_Current_Market_Outlook_2014.pdf (accessed on 17 December 2014).
2. Airbus. Flying on Demand 2014 2033—Global Market Forecast, 2014. Available online: https://www.google.com/url?sa=t&rct=j&q=&esrc=s&source=web&cd=3&ved=0ahUKEwjjzruNvrnSAhXJI5QKHUi9AVkQFggoMAI&url=https%3A%2F%2Fwww.airbusgroup.com%2Fdam%2Fassets%2Fairbusgroup%2Fint%2Fen%2Finvestor-relations%2Fdocuments%2F2014%2FPublications%2Fpresentations%2FAirbus-GMF-book-2014-2033%2FAirbus%2520GMF%2520book%25202014-2033.pdf&usg=AFQjCNE4RUzq1pSBG_26-aP6oKHLDzOF-w&sig2=i9mrrEHSHw-7gGxoCcNoHg&cad=rja (accessed on 6 June 2015).
3. Report of the High Level Group on Aviation Research. Available online: http://ec.europa.eu/transport/sites/transport/files/modes/air/doc/flightpath2050.pdf (accessed on 7 August 2014).
4. Greitzer, E.M.; Bonnefoy, P.A.; De la Rosa Blanco, E.; Dorbian, C.S.; Drela, M.; Hollman, J.S.; Duda, EJ.E.;Fitzgerald, N.; Houghton, J.; Lord, W.K.; et al. N + 3 Aircraft Concept Designs and Trade Studies; Final Report;NASA: Cleveland, OH, USA, 2010; Volume 1.
5. Ashcraft, S.W.; Padron, A.S.; Pascioni, K.A.; Stout, G.W.; Huff, D.L. Review of Propulsion Technologies for N + 3Subsonic Vehicle Concepts October 2011; NASA: Cleveland, OH, USA, 2011.
6. Grönstedt, T.; Xisto, C.; Sethi, V.; Rolt, A.; Rosa, N.G.; Seitz, A.; Yakinthos, K.; Donnerhack, S.; Newton, P.;Tantot, N.; et al. Ultra Low Emission Technology Innovations for Mid-century Aircraft Turbine Engines.In Proceedings of the ASME Turbo Expo 2016: Turbine Technical Conference and Exposition, Seoul, Korea,13–17 June 2016; pp. 1–13.
7. ULTIMATE Project Website. Available online: http://www.ultimate.aero/ (accessed on 1 December 2016).8. GEPower. 9ha.01/.02 Gas Turbines Fact Sheet. Available online: https://powergen.gepower.com/content/
dam/gepower-pgdp/global/en_US/documents/product/gas%20turbines/Fact%20Sheet/9ha-fact-sheet-oct15.pdf (accessed on 5 December 2016).
9. Bolland, O.; Forde, M.; Hande, B. Air Bottoming Cycle: Use of Gas Turbine Waste Heat for Power Generation.J. Eng. Gas Turbines Power 1996, 118, 359–368. [CrossRef]

Appl. Sci. 2017, 7, 255 26 of 27
10. Lundbladh, A.; Grönstedt, T.; Genrup, M.; Platell, P. High Power Density Work Extraction from TurbofanExhaust Heat. In Proceedings of the 22nd International Symposium on Air Breathing Engines, Phoenix, AZ,USA, 25–30 October 2015; pp. 1–10.
11. Clemente, S.; Micheli, D.; Reini, M.; Taccani, R. Bottoming Organic Rankine Cycle for a Small Scale GasTurbine: A Comparison of Different Solutions. Appl. Energy 2013, 106, 355–364. [CrossRef]
12. Cengel, Y.A.; Boles, M.A. Thermodynamics—An Engineering Approach, 5th ed.; McGraw-Hill Education:Berkshire, UK, 2005.
13. Energy Information Administration (EIA). Emission of Greenhouse Gases - Other Gases. 2003. Availableonline: http://www.eia.gov/oiaf/1605/archive/gg03rpt/other_gases.html (accessed on 25 December 2016).
14. Perullo, C.A.; Mavris, D.N.; Fonseca, E. An Integrated Assessment of an Organic Rankine Cycle Concept.In Proceedings of the ASME Turbo Expo 2013: Turbine Technical Conference and Exposition, San Antonio,TX, USA, 3–7 June 2013; pp. 1–8.
15. Petit, O.; Xisto, C.; Zhao, X.; Grönstedt, T. An Outlook for Radical Aero Engine Intercooler Concepts.In Proceedings of the ASME Turbo Expo 2016: Turbine Technical Conference and Exposition, Seoul,South Korea, 13–17 June 2016; pp. 1–11.
16. Feher, E.G. The Supercritical Thermodynamic Power Cycle. Energy Convers. 1968, 8, 85–90. [CrossRef]17. Dostál, V. A Supercritical Carbon Dioxide Cycle for Next Generation Nuclear Reactors. 2004. Available
online: http://hdl.handle.net/1721.1/17746 (accessed on 6 July 2015).18. Bauer, M.L.; Vijaykumar, R.; Lausten, M.; Stekli, J. Pathways to cost competitive concentrated solar
power incorporating supercritical carbon dioxide power cycles. In Proceedings of the 5th InternationalSymposium–Supercritical CO2 Power Cycles, San Antonio, TX, USA, 28–31 March 2016; pp. 1–22.
19. Moroz, L.; Burlaka, M.; Rudenko, O.; Joly, C. Evaluation of Gas Turbine Exhaust Heat Recovery UtilizingComposite Supercritical CO2 Cycle. In Proceedings of the International Gas Turbine Congress, Tokyo, Japan,15–20 November 2015; p. 7.
20. Lytle, J.K. The Numerical Propulsion Simulation: An Overview System. In Proceedings of the ComputationalAerosciences Workshop, Moffett Field, CA, USA, 15–17 February 2000.
21. Anselmi Palma, E.; Zachos, P.; Collins, R.; Hassan, M. Development of an Experimental S-CO2 loop forBottoming Cycle Applications. In Proceedings of the 1st European Seminar on Supercritical CO2 (sCO2)Power Systems, Vienna, Austria, 29–30 September 2016.
22. Pasch, J.; Conboy, T.; Fleming, D.; Rochau, G. Supercritical CO2 Recompression Brayton Cycle: CompletedAssembly Description. Available online: http://prod.sandia.gov/techlib/access-control.cgi/2012/129546.pdf (accessed on 3 May 2015).
23. Clementoni, E.M.; Cox, T.L.; King, M.A. Initial Transient Power Operation of a Supercritical Carbon DioxideBrayton Cycle with Thermal-hydraulic Control. Available online: http://www.swri.org/4org/d18/sCO2/papers2016/Testing/060paper.pdf (accessed on 2 May 2016).
24. DeServi, C.M.; Azzini, L.; Pini, M.; Gangoli Rao, A.; Colonna, P. Exploratoy Assessment of a combined-cycleengine concept for aircraft propulsion. In Proceedings of the 1st Global Power and Propulsion Forum, Zurich,Switzerland, 16–18 January 2017; p. 11.
25. Empresarios Agrupados, A.I.E. EcoSimPro/PROOSIS website. 2016. Available online: http://www.ecosimpro.com/ (accessed on 17 December 2016).
26. EUtech Scientific Engineering GmbH. Thermolib User Manual. Available online: https://www.thermolib.de/media/thermolib/downloads/Thermolib-UserManual.pdf (accessed on 10 October 2015).
27. Peng, D.; Robinson, D. A New Two-Constant Equation of State. Ind. And Eng. Chem. Fundam. 1976, 15, 59–64.[CrossRef]
28. Span, R.; Wagner, W. A New Equation of State for Carbon Dioxide Covering the Fluid Region from theTriple-Point Temperature to 1100 K at Pressures up to 800 MPa. J. Phys. Chem. Ref. Data 1996, 25. [CrossRef]
29. Zhao, X.; Grönstedt, T.; Kyprianidis, K.G. Assessment of the Performance Potential for a Two-pass Cross-flowIntercooler for Aero Engine Applications. In Proceedings of 2013 International Society for AirbreathingEngines (ISABE), Busan, South Korea, 9–13 September 2013.
30. Zhao, X.; Grönstedt, T. Conceptual Design of a Two-pass Cross-flow Aeroengine Intercooler. Proc. Inst. Mech.Eng. G J. Aerosp. Eng. 2015, 229, 2006–2023. [CrossRef]

Appl. Sci. 2017, 7, 255 27 of 27
31. Zhao, X.; Grönstedt, T. Aero Engine Intercooling Optimization using a Variable Flow Path. In Proceedingsof the 22nd International Symposium on Air Breathing Engines, Phoenix, AZ, USA, 25–30 October 2015;pp. 1–11.
32. Donnerhack, S. Intercooler and Recuperated Engines; LEMCOTEC Workshop for the Aeronautics Industry:Potsdam, Germany, 2016.
33. Haaland, S.E. Simple and Explicit Formulas For the Friction Factor in Turbulent Pipe Flow. J. Fluids Eng.1983, 105, 89–90. [CrossRef]
34. Gnielinski, V. New Equations for Heat and Mass Transfer in Turbulent Pipe and Channel Flow.Jahrestreffen Verfahrensingenieure 1973, 41, 8–16.
35. Kays, W.M.; London, A. Compact Heat Exchangers, 3rd ed.; McGraw-Hill: New York, NY, USA, 1984.36. FineTubes Ltd. High Strength Tubing Solutions for Critical Aerospace Applications. Available online:
http://www.finetubes.co.uk/uploads/docs/15041_U.K._Aero_data_Sc2.pdf (accessed on 13 December 2016).37. Shiferaw, D.; Carrero, J.M.; Le Pierres, R. Economic Analysis of S-CO2 Cycles with PCHE Recuperator
Design Optimisation. In Proceedings of the 5th International Symposium–Supercritical CO2 Power Cycles,San Antonio, TX, USA, 29–31 March 2016; pp. 1–13.
38. Musgrove, G.O.; Shiferaw, D.; Sullivan, S.; Chordia, L.; Portnoff, M. Tutorial: Heat Exchangers forSupercritical CO2 Power Cycle Applications. In Proceedings of the 5th International Symposium–Supercritical CO2 Power Cycles, San Antonio, TX, USA, 29–31 March 2016; pp. 82–91.
39. Goulas, A.; Donnerhack, S.; Flouros, M.; Misirlis, D.; Vlahostergios, Z.; Yakinthos, K. Thermodynamics CycleAnalysis, Pressure Loss, and Heat Transfer Assessment of a Recuperative System for Aero-Engines. J. Eng.Gas Turbines Power 2015, 137. [CrossRef]
40. Schulenberg, F.J. Finned Elliptical Tubes and Their Application in Air-Cooled Heat Exchangers. J. Eng. Ind.1966, 88, 179–190. [CrossRef]
41. Moroz, L.; Pagur, P.; Rudenko, O.; Burlaka, M.; Joly, C. Evaluation for Scalability of a Combined Cycle UsingGas and Bottoming Cycle SCO2 Turbines. In Proceedings of the ASME Power & Energy, San Diego, CA,USA, 28 June–2 July 2015; pp. 1–10.
© 2017 by the authors. Licensee MDPI, Basel, Switzerland. This article is an open accessarticle distributed under the terms and conditions of the Creative Commons Attribution(CC BY) license (http://creativecommons.org/licenses/by/4.0/).