Performance Monitoring Outturn Report 2019-20
55
Appendix 1 – Council Performance Report Outturn 2019/20
Transcript of Performance Monitoring Outturn Report 2019-20

Appendix 1 – Council Performance Report Outturn 2019/20

Contents Performance Indicator Tables Explanatory Note ................................................................... 1
Portfolio Performance Summary ........................................................................................... 2
Adult Social Care & Health Portfolio ...................................................................................... 4
1. Key Portfolio Priorities ................................................................................................... 4
2. Progress Against Portfolio Priorities............................................................................... 4
3. Performance Indicator Summary ................................................................................... 6
3.1 Overview of Portfolio Performance .............................................................................. 7
3.2 What is performing well ............................................................................................... 7
3.3 What requires improvement and what is being done about it ....................................... 8
Developing Young People Portfolio ....................................................................................... 9
1. Key Portfolio Priorities ................................................................................................... 9
2. Progress Against Portfolio Priorities............................................................................... 9
3. Performance Indicator Summary ................................................................................. 11
3.1 Overview of Portfolio Performance ............................................................................ 12
3.2 What is performing well ............................................................................................. 12
3.3 What requires improvement and what is being done about it ..................................... 13
Protecting Young People Portfolio....................................................................................... 15
1. Key Portfolio Priorities ................................................................................................. 15
2. Progress Against Portfolio Priorities............................................................................. 15
3. Performance Indicator Summary ................................................................................. 17
3.1 Overview of Portfolio Performance ............................................................................ 18
3.2 What is performing well ............................................................................................. 18
3.3 What requires improvement and what is being done about it ..................................... 18
Public Health, Leisure & Libraries Portfolio ......................................................................... 21
1. Key Portfolio Priorities ................................................................................................. 21
2. Progress Against Portfolio Priorities............................................................................. 21
3. Performance Indicator Summary ................................................................................. 25
3.1 Overview of Portfolio Performance ........................................................................ 26
3.2 What is performing well ......................................................................................... 26
3.3 What requires improvement and what is being done about it ................................ 26
Economic Regeneration & Housing Portfolio ....................................................................... 28
1. Key Portfolio Priorities ................................................................................................. 28
2. Progress Against Portfolio Priorities............................................................................. 28
3. Performance Indicator Summary ................................................................................. 30
3.1 Overview of Portfolio Performance ........................................................................ 31
3.2 What is performing well ............................................................................................. 31

3.3 What requires improvement and what is being done about it ..................................... 32
Environmental Services Portfolio......................................................................................... 33
1. Key Portfolio Priorities ................................................................................................. 33
2. Progress Against Portfolio Priorities............................................................................. 33
3. Performance Indicator Summary ................................................................................. 35
3.1 Overview of Portfolio Performance ............................................................................ 36
3.2 What is performing well ............................................................................................. 36
3.3 What requires improvement and what is being done about it ..................................... 36
Community Safety Portfolio ................................................................................................. 38
1. Key Portfolio Priorities ................................................................................................. 38
2. Progress Against Portfolio Priorities............................................................................. 38
3. Performance Indicator Summary ................................................................................. 42
3.1 Overview of Portfolio Performance ............................................................................ 43
3.2 What is performing well ............................................................................................. 43
3.3 What requires improvement and what is being done about it ................................ 44
Corporate Services, Estates & Communication/Finance/Leaders Portfolios ........................ 46
1. Key Portfolio Priorities ................................................................................................. 46
2. Progress Against Portfolio Priorities............................................................................. 46
3. Performance Indicator Summary ................................................................................. 50
3.1 Overview of Portfolio Performance ............................................................................ 51
3.2 What is performing well ............................................................................................. 51
3.3 What requires improvement and what is being done about it ..................................... 51

1
Performance Indicator Tables Explanatory Note
There are two different types of performance table contained within this report:
1. Summary Performance table – this provides an at glance view of performance in relation to Tier 1 indicators in each portfolio at outturn 2019/20; and
2. Individual Portfolio Performance tables – this presents outturn 2019/20 data for both Tier 1 and Tier 2 measures in each portfolio. Further quarter’s data will be added in to subsequent reports over the year.
A Red, Amber, Green (RAG) rating is used on the Summary table, as well as for the year-end past performance outturn figures and outturn data on the individual Portfolio tables. Where there is data but no colour, this indicates that a target was not previously set as the indicator was not hitherto reported to Cabinet. The RAG rating indicates whether performance has met or exceeded target (green), did not meet target but was within a 5% tolerance (amber), or did not meet target by more than 5% (red).
The Direction of Travel (DOT) symbol compares performance at outturn 2019/20 to outturn 2018/19. This indicates whether the latest reported performance data is either an improvement on the data from when last reported (arrow pointing up), the same as the last reported data (dash symbol), or worse than the last reported data (arrow pointing down).
The colour of the DOT symbol correlates as to whether target was met (as set out above). For example, a green arrow pointing down would show that an indicator was on target for the month/quarter, but performance was down on the last reported period.
On the individual portfolio tables, the ‘% Variance from Target’ column shows the percentage variance between the outturn data and the annual target.
The Comparative Performance column provided in both the Summary and Individual Portfolio tables provides a judgment (where available) on the performance of an indicator compared to a suitable family comparator group. On this column, the following applies: Green = First Quartile; Yellow = Second Quartile; Amber = Third Quartile; Red = Fourth Quartile.
However, some caution should be applied to comparative performance data. The quartile positions given for St Helens - compared to peer authorities - is at a given moment in time, often when the last nationally verified and published information was made available. In most instances within this report the latest comparative data relates to 2018/19. It is possible that since this time the relative performance of St Helens and its comparator authorities may have subsequently changed.
Equally, although ‘first quartile’ is the preferred outcome, in some instances the quartile comparative position does not necessarily equate to a judgement on good or bad performance. It should therefore be viewed in the context of the performance of other linked measures. For example, top quartile performance in terms of a low rate of children subject to a Child Protection Plan would need to be viewed within the context of other measures such as referral rates and Section 47 rates.

2
Portfolio Performance Summary
Although subject to future review, the Tier 1 performance measures are those associated
with the objectives of the Council Plan 2018-20. The table below provides an overview of
performance for those measures at outturn 2019/20. Further information on performance
indicators can be found on the PI database.
Portfolio Reference Performance IndicatorPerformance vs.
TargetDOT
Comparative
Performance
ASC-02 Satisfaction with ASC services N/A
ASC-18 Permanent admissions to residential care
ASC-20a All delayed transfer of care
Community Safety SC-01 Repeat MARAC N/A
CS-02 Sickness Absence
CS-14a Satisfaction with Council Contact Centre N/A
CS-01 Council Tax collection
CS-03 Business Rate collection
E&S-01 Early Learning Goals development
E&S-03 KS2 national expected standard or higher
E&S 13 KS4 Progress 8
E&S-25a NEET & Not Known
G&P-01 Rate of employment
G&P-06 Town Centre retail vacancies N/A
G&P-09 Increases in dwelling stock N/A
G&P-30New build employment floor space
completed (sqm)N/A
HS-01Number of long term empty homes with
regard to New Homes BonusN/A
ENV-01
The amount of direct greenhouse gas
emissions from local authority own estate
and operations
N/A
ENV-02Percentage of household waste sent for
recycling
ENV-09Number of people killed or seriously
injured in road traffic accidentsN/A
ENV-11Percentage of principal roads where
maintenance should be considered
CYP-01 Children in need (CIN)
CYP-02 Looked after children (LAC)
CYP-40
(new)
Children subject to a Child Protection
Plan (CPP)
CYP-41
(new)Referrals to children's social care
PH-06Percentage of children in reception year
who are overweight or obese
PH-25 (new) Mortality rate due to suicide
PH-48 Admissions for alcohol specific conditions
PH-52 (new) Emergency hospital admissions for falls N/A
Tier 1 Performance - 2019/20
Corporate
Services, Estates
and
Communications
& Finance
Developing Young
People
Economic
Regeneration &
Housing
Adult Social Care
and Health
Protecting Young
People
Environmental
Services
Public Health,
Leisure &
Libraries

3
On or better than
target
Off target within 5%
Worse than target
First Quartile
Second Quartile
Third Quartile
Fourth Quartile
Better than the last
reported outturn
Worse than the last
reported outturn
No change from last
reported outturn
First reported period
KEY - Comparative Target
KEY - Direction of Travel (DOT)
KEY - Performance vs Target

4
Adult Social Care & Health Portfolio
1. Key Portfolio Priorities
• Support the domiciliary care, supported living and residential care market to develop the necessary capacity and sustainability to meet the needs of adults requiring social and health care provision
• Continued sound financial management to deliver the savings plan (whilst prioritising the needs of people in most need)
• Implement `St Helens Cares’ place-based model of care (locality working) and embed a single point of contact through which all health, social care and community services can be targeted
2. Progress Against Portfolio Priorities
• The Adult Social Care and Health Portfolio is committed to continuous improvement and to that end in Quarter 3 invited the LGA to scrutinise their performance through the TEASC Towards Excellence in Adult Social Care self-assessment tool. This involved producing a revised self- assessment and meeting with the LGA to review and consider areas for further development.
• Verbal feedback from the process indicated that the LGA considered performance within St Helens to be broadly robust, with no specific concerns. Challenges facing the Local Authority and Adult Social Care services were acknowledged as; the future funding of services and the increasing demographic demand placed on services.
• The department considers the successful provision of care to be a high priority. Focussing particularly on nursing care home provision 2 Care Home Summits were held between key officers from the LA and clinicians from the CCG to understand the challenges and way forward for this sector. An action plan has been developed with the activities outlined built into business planning.
• A `Market Position Statement’ was finalised in October 2019. The Market Position statement will identify gaps or areas for development in Adult Social Care Provider services and will inform commissioning intentions for 2020. Going forward as part of reset and recovery there will be a need to rethink and revisit the role of adult social care and commissioning intentions in what will be a significantly changed market environment.
• The Quality Monitoring team continue to monitor on a weekly basis care homes rated as inadequate (one at the end of 2019/20 but currently none). Both the LA and CCG are working with the home to address CQC’s required actions.
• An enhanced Care Home Scheme commenced in April 2019 which aligns General Practitioners with specific care homes. Each GP provides a proactive and supportive service to their aligned home and coordinates care for permanent and temporary residents using a Multi-Disciplinary Team approach.
• The End of Life Domiciliary Care service is fully operational and providing 600 hours of support to individuals at end of life every week. The End of Life Contract has brought capacity to a key area within the care sector enabling service users with life limiting conditions to be appropriately cared for.
• A `remodelling of supported living’ project group is leading the delivery of the largest Adult Social Care saving proposal (£1.29 million) but delivery of this project was not completed in year. In mitigation, packages of care are still being reviewed. Other alternative proposals are under consideration as a part of reset and recovery activity.
• The four Clinical Primary Care Network Directors were appointed in the four localities in the borough. Relationship meetings have taken place with the Clinical

5
Directors and a refreshed programme of work commenced in light of their remit and its contribution to Locality developments.
• Over the year the Council has been taking the necessary steps to measure and understand the impact of BREXIT. This has included a formal survey sent to all care providers ascertaining their views on BREXIT and following up with a session at a provider forum on 18th September 2019, which was well attended. Providers have fed back that they anticipate impact on staffing will be minimal but there are concerns around the supply of medication, consumables, food and fuel. This work complements that going on in the wider council, regional and national forums.
• Contact Cares was officially opened at a launch event in September 2019. A review of Contact Cares operation and impact will be revisited as part of reset and recovery.
• The financial position for Adult Social Care has worsened over the year due to several factors. The key issues are the increasing cost of commissioned services, the requirement to pick up financial responsibility for service users moving under the Transforming Care initiative and the ongoing growth arising from demand and demographic pressures. The previous Chief Executive of St Helens Council wrote to the programme lead for Transforming Care to formally challenge the inadequate funding being pass-ported from specialist commissioning to local areas for individuals resettled back to St Helens under this programme. Prior to any individual moving back to St Helens the cost of their support package is scrutinised and reduced wherever possible. Annual grant applications to the Transforming Care programme are submitted to offset the total cost of each community package of support.
• The Portfolio has continued to take a robust approach to dealing with the financial position and in providing scrutiny with a view to finding solutions. This is in conjunction with the wider savings strategy. An Adult Services finance group has been established to reset the department's savings strategy in light of the emerging issues arising from Covid-19 and the wider financial challenge for the authority.
• The Portfolio has managed to identify significant savings, which will contribute to the strategy objective of financial sustainability. Adult Services continue to focus on the savings strategy:
o Built into day to day business’ packages of care continue to be reviewed to ensure appropriate, cost effective, need is being met.
o A programme of work to deliver savings is ongoing and will reflect the prioritisation of savings by way of achievability and value, and overall reflects the commitment of the portfolio to control cost and assume financial responsibility.
o The Portfolio completed a systematic review of financial assessments to ensure that historical information is updated and that the appropriate level of available income will be collected.
o The spending review signposted increased funding of £4.4 million and an ability to levy an adult social care precept. This will be considered within the wider context of council savings.
o The Integrated Finance and Performance Board was established to monitor St Helens Cares and the integrated commissioning fund is now firmly established in its first year of operation.
o The programme of work to further health and social care integration is being taken forward and the council continues to play an active role in this

6
3. Performance Indicator Summary

7
3.1 Overview of Portfolio Performance
A total of 11 key performance indicators have been identified for the Adult Social Care & Health Portfolio in 2019/20. At year end, 6 indicators are meeting or better than target, 2 are not meeting target and 3 are within a 5% tolerance from target.
When compared to the last reported performance outturn, 3 indicators have shown improvement. However, the latest available picture of comparative performance remains strong. The comparative performance position reflects the latest data for 2018/19 released in December. The comparators used are the 23 local authorities within the ADASS North West family group.
3.2 What is performing well
• Almost 89% of services users were satisfied with Adult Social Care services received.
• More than 81% of carers remain satisfied with Adult Social Care services overall, an improvement on the previous year’s position.
• The measure examining delayed transfers of care (All) was better than target. St Helens continues to be one of the best performing councils in the North West for this measure. This is positive performance and illustrates the impact St Helens Cares and Community Services have in ensuring timely discharges from hospital. St Helens Cares, Contact Cares and the Area Teams work together to manage bed flow and ensure individuals can quickly access intermediate/transitional care or return home, to be supported by reablement and or domiciliary care services. Contact Cares has developed a flexible and integrated workforce that can be deployed quickly to meet changing need. In recent years there has been an increase in intermediate care beds and transitional tenancies within the borough. Additionally, effective Domiciliary Care procurement has ensured, people are accessing the correct packages and are appropriately supported on their return home. Despite strong comparative performance, there are some significant challenges going forward. Principally in terms of the increasing volume of people accessing services and, securing sufficient bed availability for people with complex and long-term issues.
• The number of people permanently admitted to residential or nursing care has met target, at 669 individuals per 100,000 population. Key reasons for the continued reductions in people entering permanent residential and nursing care include:
- Increase in appropriate and cost-effective domiciliary care packages (56,000 additional hours compared to 2018/19)
- Maximisation of reablement and intermediate care services
- The effective use of Careline and housing adaptations
- Maximisation of Extra Care Units
- Clear identification of needs, to ensure individuals are correctly accommodated
- Strong integration/good working relationships with health partners, around end of life care and use of CHC funding
• Over 90% of older people discharged from hospital were in their own home or residential or nursing home 91 days later. This is another indicator which, shows the effectiveness of the local reablement services and the aim of ensuring people’s independence within their own home. Performance also in part demonstrates the effectiveness of our working relationships with health partners and fast track arrangements for end of life care being used appropriately.

8
• The number of people with learning disabilities supported to live at home or in a community setting continues to exceed target with 97% of adults with a learning disability living in `settled accommodation’.
• The percentage of adults with learning disabilities in employment also continues to exceed target.
• 90% of people did not need to access long-term services, demonstrating the success of short-term services put in place to support individuals. This indicator demonstrates the effectiveness of St Helens short term care support. Contact Cares, as a front door service, is now playing a significant role in diverting people away from long term care support. This has been achieved through changes to assessment and referral processes to refocus on the aspiration of keeping people in their own home, with the required support when it is safe for them to do so. As well as, directing them to the most appropriate services for their needs.
• Almost 85% of adults received self-directed support in 2019/20, an improvement on the 78% outturn performance the previous year.
3.3 What requires improvement and what is being done about it
• The biennial Carers Survey showed a reduction in the percentage of carers finding it easy to find information and support. Although performance is still strong compared to regional and national averages the department will work with the Carers Centre to understand and improve this decline in performance.
• 16% of adults aged 16-64 years old were admitted to permanent residential or nursing care in 2019/20. This is a decline in performance and the department will review whether more intensive support should be commissioned to support individuals in supported living settings.

9
Developing Young People Portfolio
1. Key Portfolio Priorities
• Improving the quality of education provision within the borough to improve educational outcomes, raise aspiration and ensure all children are able to achieve their potential.
• Work with schools and education providers to close the attainment gap between vulnerable pupils, see below, and their peers:
o Disadvantaged Pupils
o Pupils with Special Educational Needs (SEN)
• Respond effectively to the growing Special Educational Needs demand and the outcomes of the recent Ofsted/CQC SEND inspection.
• Work to reduce the numbers of young people Not Engaged in Education, Employment for Training (NEET).
2. Progress Against Portfolio Priorities
• The Early Years Hub continued to provide support for Early Years settings with termly network meetings with input from health, social care and SEND teams. A number of training courses have been provided on improving early years practice including a well-attended conference.
• The Childcare Sufficiency Assessment 2019 was completed with the findings indicating that overall there is sufficient early years and childcare provision within St Helens and there is a good distribution of the different types of provision. The vast majority (87%) of 2, 3 and 4-year olds access their funding entitlements in ‘good’ or ‘outstanding’ Ofsted rated provision.
• The Learning Partnership is now firmly established with four work streams aimed at meeting key priorities. The work streams of Curriculum; Wellbeing & Early Help; Sharing Practice and Ambition and Aspiration all now have action plans with lead head teachers and key local authority officers to facilitate improvement.
• The School Effectiveness Strategy 2019-2022 was published. The strategy was co-produced by Head Teachers and local authority officers across health, social care and education as part of the Learning Partnership. Work streams against each priority area have been established and are being led by a Headteacher and local authority officer. Progress towards actions is being monitored termly.
• The current banding of all schools was established in Quarter 3 following early identification and letters to head teachers and chairs of governors. Local Authority officers have been identified to provide bespoke support for schools in Bands B and C.
• Narrowing the attainment gap for disadvantaged students has been a priority in school reviews and achievement and improvement meetings. The continuing professional development offer has included training on overcoming disadvantage, youth mental health training, understanding the impact of adverse childhood experiences and employing trauma-based approaches, and literacy and numeracy catch up programmes. The gap between disadvantaged students and their peers has been shown to have reduced by 4 % for reading, writing and maths combined at the end of key stage 2 provisional 2019 data.
• Early Intervention work for young people in Year 11 who are at risk of becoming NEET was identified as a priority for action. The volume of young people falling into this category from last year has increased by approximately 50%. Therefore, a decision was taken to identify and engage with this cohort earlier than in previous

10
years. There are 99 Year 11 leavers in this category and many have multiple/complex barriers. A NEET Preventative Officer role was created to support schools to identify those young people at risk and to implement strategies to engage them and keep them in education/training. A bid was submitted to Liverpool City Region to fund a further preventative worker; the outcome of which remains pending. The Young Person’s Engagement and Tracking Service has been re-commissioned with increased investment and capacity to re-engage young people who have disengaged from Education, Employment and Training. The Service will focus on key vulnerable groups.
• Head Teachers and local authority officers have continued to work well with a secondary out-of-borough Teaching School and are shaping continuing professional development focused on curriculum design, middle and senior leadership and pedagogy. Subject network meetings, which proved successful in the previous academic year, were held across a greater range of subject areas.
• ‘Team Around the School’, a local network consisting of schools and other family support services to remove barriers for vulnerable children, has been trialled in three high schools.
• The Ofsted/CQC SEND Improvement Plan has been audited and gained high assurance. A SEND peer review led by the Teaching School is supporting three schools in both the process of reviewing and evaluating but also in looking directly at the provision within schools for children with Special Educational Needs and/or Disabilities. They will have the opportunity to share successful practice but also advice and support each other, with the insight of the Teaching School Lead, as to how best improve provision. A SEND multi agency/parent carer workshop was held in January 2020 to reflect on progress and define priorities for the next 3 years. The first draft of the SEND strategy developed from the workshop has been considered at the newly established SEND Partnership Board which met for the first time on 1st June. The meeting of this Board was delayed due to the impact of COVID. There will now be a period of further engagement with children and young people, parent, carers and stakeholders to finalise a borough wide strategy.

11
3. Performance Indicator Summary
Q1 Q2 Q3 Q4
16/17
Outturn
17/18
Outturn
18/19
OutturnJune Sep Dec Mar
E&S-01The percentage of children attaining at least a 'good' level of
development in the Early Learning GoalsHigher 66 67 69 71 - - - 70 -1.41% 4th Quartile
E&S-03The percentage of pupils at the end of KS2 achieving the national
expected standard or higher in Reading, Writing and MathematicsHigher 53 58 63 64 - - - 66 3.12% 3rd Quartile
E&S 13Average grade attained per pupil in St. Helens across 8 subjects at
KS4, relative to the national average (Progress 8).Higher - -0.44 -0.39 -0.2 - - - -0.25 -20.00% 3rd Quartile
E&S-25aPercentage of young people academic age 16-17 not in education,
employment or training and not known combinedLower 6.3 6.5 6.1 6.1 6.3 32.0 5.98 5.8 6.45% 2nd Quartile
E&S-15a
Percentage point gap between disdavantaged pupils and their peers
in achieving the pass threshold (Grade 5+) in English and Maths at
KS4
Lower - 26 28.8 25 - - - 26.3 -5.20% 3rd Quartile
E&S-16aPercentage of children in care achieving the pass threshold (Grade
5+) in English and Maths at KS4Higher - 10 4 20 - - - 10 -50.00% Not available
E&S-18 Percentage of persistent absentee secondary pupils (10% threshold) Lower 13.3 13.8 13.7 12 - - - 13.85 -15.42% 1st Quartile
E&S-26Proportion of the population aged 16-64 qualified to at least level 2 or
higher.Higher 69.3 70.4 72.8 72 - - - 73.9 2.64% 1st Quartile
E&S-27Proportion of the population aged 16-64 qualified to at least level 3 or
higher.Higher 46.1 46.6 51.3 48 - - - 53.9 12.29% 1st Quartile
E&S-29Percentage of schools with 'outstanding' or 'good' Ofsted inspection
ratings (Primary)Higher 94 89 80 83 - - - 83 0% 4th Quartile
E&S-30Percentage of schools with 'outstanding' or 'good' Ofsted inspection
ratings (Secondary)Higher 67 56 56 67 - - - 56 -16.42% 2nd Quartile
E&S-31Percentage of schools with 'outstanding' or 'good' Ofsted inspection
ratings (Special)Higher 100 100 100 100 - - - 100 0% 1st Quartile
E&S-42Percentage of Year 1 pupils meeting the required standard of phonic
decodingHigher 78 79 81 82 - - - 82 0% 2nd Quartile
E&S-48 KS1 - KS2 progress score in Mathematics Higher -0.4 -0.5 -0.6 -0.3 - - - 0 100% 3rd Quartile
E&S-49
Percentage of children in care at the end of Key Stage 2 achieving
the national expected standard or higher in Reading, Writing and
Mathematics
Higher 14 48 20 40 - - - 41 2.50% 2nd Quartile
E&S-52Percentage point gap between boys and girls achieving the expected
standard in Reading, Writing and Mathematics (KS2)Lower 10 7 8 7 - - - 8 -14.29% 1st Quartile
E&S-53Percentage gap between boys and girls achieving the threshold
(Grade 5+) in English and Maths (KS4)Lower - 3 4.6 3 - - - 5.6 -86.67% 2nd Quartile
Tie
r 2
Tie
r 1
Comparative
Performance
Developing Young People - 2019/20
Tier Ref Performance Indicator
Higher /
Lower is
better?
Past Performance19/20
Target
% Variance from
Target
DOT
(symbol)

12
3.1 Overview of Portfolio Performance
There is a total of 17 key performance indicators within the Developing Young People Portfolio. Of this number, 9 are achieving or exceeding target, while 8 are below target, although one of these is within a 5% variance. 12 of the 17 indicators are showing improvement in terms of variance from target since last reported, whilst 2 have remained the same.
The comparator data used for the PIs largely relates to the academic year 2018/19. The comparators used are the DfE Children’s Services Statistical Neighbours group.
3.2 What is performing well
• The validated data for academic year 2018/19 saw an increase in the percentage of children attaining at least a ‘good’ level of development in the early learning goals. 99% of all Early Years settings/provision continue to be rated as either good or outstanding by Ofsted and 100 % of all childminders are at least good.
• Outcomes at key stage 1 in phonics, reading, writing and maths have remained broadly in line with national averages and the gap between non-SEND and SEND has reduced.
• Band B schools in receipt of support and intervention last academic year have made progress in reading, writing and maths at a rate, which is greater than national. Improvements at key stage 1 were substantial.
• At key stage 2, the percentage of children achieving age related expectations has improved and is now at the national level. The percentage of children in care achieving these expectations also increased markedly. The gap between disadvantaged children and their peers reduced by 4% and the gap between SEND children and their peers reduced slightly.
• 83% of primary schools are now rated as ‘outstanding’ or ‘good’ by Ofsted. An additional primary school during Quarter 3 moved from Requires Improvement to Good, which improved the overall performance of this measure.
• 100% of special schools remain rated as ‘outstanding’ or ‘good’ by Ofsted. One special school was subject to an Ofsted inspection during the year and retained a good judgement under this challenging new framework.
• In 2019 St Helens secondary schools achieved a collective Progress 8 (P8) score of -0.25, an improvement on the performance reported in the previous year (-0.39). The overall Progress 8 score in 2019 represents an improvement compared to the previous years. Performance remains below the North West and National average.
• The percentage of young people 16-17 not in education, employment, or training, or whose status was not known continued to reduce to 5.8% (a 3-month average for November, December and January). Verified regional and national comparative data is yet to be published but St Helens outturn for 2019/20 for NEET and Not Known is anticipated to be better than the North West average and close to the England average. The data identifies that in January 2020 there where a total of 202 16-17-year olds not in education, employment or training or whose status was not known.
• St Helens has seen increases in the percentage of people qualified to Level 2 and Level 3, narrowing the gap with the North West average. St Helens performance in now in the top quartile of its comparator group for both measures.

13
3.3 What requires improvement and what is being done about it
What requires Improvement?
• Whilst a good level of development and outcomes at key stage 1 and 2 are broadly in line with the national average, there needs to remain a focus on improving outcomes across all areas so that St Helens schools are above national average. There needs to be a focus on the more able.
• The gap between boys and girls, SEND and Non-SEND, disadvantaged and non-disadvantaged, still needs to be narrowed considerably across all key stages.
• Band B schools need to be further supported to improve on outcomes and to achieve a good judgement in their next Ofsted inspection.
• In 2019 St Helens secondary schools achieved a collective Progress 8 (P8) score of -0.25, an improvement on the performance reported in the previous year (-0.39). The overall Progress 8 score in 2019 represents an improvement compared to the previous years. Improving Progress 8 score remains a priority for all secondary schools. The gap between national and St Helens remains too wide.
• St Helens secondary schools need to swiftly readjust to the new Ofsted framework. The early reports under this framework have indicated that this poses some challenges locally – particularly linked to the 2-year Key Stage 3 adopted by the majority of schools. The two inadequate secondary schools need to rapidly improve.
• There has been a marginal increase in recorded persistent absence, although performance remains better than the North West average and on a par with the national average.
What is being done about it?
• An EYFS Conference was delivered through the Early Years Hub and has focused on improving language, literacy and numeracy for the most vulnerable / disadvantaged in order to narrow the gaps.
• We are continuing to support early years’ practitioners to close the gender gap, not only at the end of EYFS but at key points throughout the child’s ‘Early Years’ journey.
• Where disadvantage gaps are greater than national, Band B schools have been challenged and supported through the school review process. The school review process examines strategies that schools are employing both to raise the bar for all children and ensure appropriate targeted support to narrow attainment gaps to bring them in line with or better than national.
• The action plans from eight primary schools have been collated and actions taken to address areas of relative weakness have been scrutinised.
• All primary schools identified as part of the School Effectiveness Strategy as ‘Band B’ have had termly reviews involving school effectiveness officers and consultants. Full review reports have been written to include strengths of each school; areas for development and subsequent recommendations. Where appropriate this targets key groups to address any underperformance and inequalities
• Two Primary Aspirational Leaders of Schools (PALS) training workshops took place this academic year for head teachers of Band B schools covering subjects such as the new Ofsted framework; raising attainment and equalities in the curriculum. All sessions have been well received with positive evaluations. These will continue to be part of the school support strategy with the training and content tailored based on the needs of the schools.
• The School Effectiveness Team has liaised with Teaching Schools to identify primary schools that fulfil DfE criteria for additional National Leader of Education

14
support through their funding programme. This enables the schools to have bespoke individualised funded support.
• Six St Helens Primary Schools are engaged in a support programme to raise standards in early reading, raising the quality of provision for all pupils.
• Primary English and maths consultants have worked with subject leaders in schools in Band B with notes of visit written up for each in order to improve the quality of subject leadership in raising standards for all.
• Training for Learning Assistants in effectively supporting children through intervention has been established with the English consultant. This is a specific strategy to narrow the gaps by further upskilling the wider workforce.
• Maths and English subject leaders termly meetings are planned for primary schools with a focus on raising standards particularly for the more able.
• Eight of the nine secondary schools accepted an invite to an Achievement and Improvement meeting during which they were challenged on outcomes and actions they are taking to address areas of concern. One meeting was deferred due to an Ofsted inspection but, following publication of their report, will be invited to attend on an alternative date.
• Three of the nine secondary schools have been subject to a school review – and subsequently provided with a number of actions to support them on their improvement journey. A fourth school, going forward will also be included within the review cycle due to results last academic year.
• One secondary school deemed inadequate in February 2018 remains subject to an academy order. This school has been in receipt of considerable support this quarter funded through an Emergency Funding Bid which was commissioned by the Local Authority. This support has been through a Teaching School and is both for generic issues such as safeguarding and pedagogy as well as subject specific support. Progress and Achievement Board meetings have now been set up for this school to hold them to account for their progress.
• A further secondary school deemed to be inadequate in December 2019 is now being supported to meet the requirements from an Academy order. This includes formulating a Statement of Action and a meeting has been led with the parents to consult and inform.
• Head Teachers and local authority officers continue to work well with a secondary out-of-borough Teaching School and are shaping continuing professional development. Subject network meetings, which proved successful last academic year, are being held across a greater range of subject areas to upskill leaders and provide a mechanism of support to raise the bar for all pupils.
• All actions taken through the School Effectiveness Strategy are driven by the overarching goal to raise standards and achievement for all; narrowing gaps and address social inequality through improving access to a broad, rich and ambitious curriculum. This Strategy continues to drive school improvement and aims to narrow the identified gaps.

15
Protecting Young People Portfolio
1. Key Portfolio Priorities
• Deliver effective, safe, personalised children’s social care services by,
o Responding to the outcomes of the recent Ofsted focussed inspection;
o Establishing a child centred, ambitious culture within children’s social care to safely manage and where appropriate reduce demand for social care and safeguarding services, whilst ensuring effective financial and resource management;
o Strengthening arrangements to support early intervention and effective prevention through Early Help;
o Continuing to embed the remodelled approach to safeguarding;
o Strengthening effective thresholds across children’s social care;
o Improving outcomes and experiences for children in need and children on protection plans;
o Improving outcomes for care leavers.
2. Progress Against Portfolio Priorities
• We continue to have a Children’s Improvement Board that was initially set up to oversee the Improvement plan developed in response to the Ofsted focussed visits in July and November 2018. The Children’s Improvement Board now oversee the refreshed improvement plan that has been put in place since the Ofsted ILAC’s inspection in which the local authority was given an overall ‘Inadequate’ judgement. The independent Chair of the Improvement Board oversees improvement activities and brings appropriate scrutiny and challenge to officers, members and partners. The independent Chair of the Improvement Board is required to provide progress reports to the DfE on a six-weekly basis and report to the Minister on a six-monthly basis.
• We continue to embed a culture that places children at the centre of everything that we do. Demand on service continues to be high and achieving a skilled and stable workforce continues to be a priority for us, having a skilled and stable workforce is key to our continuous development and improvement in practice and services to children and families. We are beginning to see an improving picture in terms of recruiting and retaining social workers. However, this continues to be impacted by a number of factors, including regional and national challenges. which are; increased demand for experienced Social Workers, lower numbers entering the profession than leaving (4% versus 16%, DfE statistics) and the increased demand for agency workers which supports Local Authorities response to the increased demand / seasonal trends and activity within statutory Social Work.
• In July 2019 Cabinet agreed considerable further investment in social work and early help services. This will support our focus on ensuring children and families receive the right help and support at the right time and reduce demand at all levels of need. We are now accelerating the implementation of our Edge of Care Service, partnering with Innovate CYPS and developing our capacity to offer targeted and specialist support to children and families to enable children to remain within their own families when it is safe to do so and to re-unify children with their families who have been in the care of the local authority.
• A new Early Help Strategy for children and families was developed and approved following extensive consultation between partner agencies. The strategy reflects the needs of the borough and will allow the provision of support to a child or young

16
person and their family as soon as a difficulty emerges rather than waiting for it to reach crisis point.
• Descriptions of Need are now better understood and being more consistently applied across the service this was recognised in feedback offered during the Ofsted ILACs inspection. The Safeguarding Partnership is leading work to strengthen understanding and application of Descriptions of Need across the partnership.
• We continue to work to improve social work practice in relation to children in need and children on child protection plans, and we are focusing on improving the quality of assessments and plans including planning for permanence. Greater support for newly qualified social workers has been put in place, whilst social worker caseloads and supervision are being kept under close review. A Workforce Learning and Development Strategy is in place and workforce development plans are being finalised.
• A revised Staying Put Policy was produced and approved to ensure that the Council has a clear approach to the options available to young people who have been cared for by the Local Authority who wish to continue to reside with Foster Carers into adulthood.
• In the context of demand growth for specialist SEND provision, a strategic review of High Needs Planning has been commissioned to engage with stakeholders including schools, parents and carers to find more effective ways of meeting needs if the system as a whole is to remain effective. The Commission was due to report in April 2020, some delays have occurred due to COVID; drafts have been received and further comment made. It is anticipated that the final report will have been agreed and received by the end of July 2020.
• We continue to observe continuous development and improvement in services for Care Leavers and early indication is a recent practice audit supports this. The service development plan is overseen by a multi-agency Care Leaver board, we are focusing on improving the quality of Pathway Planning and ensuring more young people are supported to access education, employment or training. Whilst the number of Care Leavers not in education, employment or training (remains comparable to the national figures) we recognise the need to raise aspiration and engagement in future employment with the young people leaving our care.
• The Council has recognised the need to raise aspiration and engagement in future employment with the young people leaving our care. An experienced Education, Employment & Training Co-ordinator has commenced in role in the Care Leavers Team in order to provide additional support to the young people who are currently not engaged with the aim of improving employment outcomes for this group.

17
3. Performance Indicator Summary
Q1 Q2 Q3 Q4
16/17
Outturn
17/18
Outturn
18/19
OutturnJune Sep Dec Mar
CYP-01 Rate of Children in Need per 10,000 0-17 population Lower 511 429 492.9 495 490.2 540.2 494.6 478 3.43% 4th Quartile
CYP-02Number of looked after children per 10,000 children within the
BoroughLower 117 121 129 131 134.5 142.1 143.8 134.8 -2.90% 4th Quartile
CYP-40
(new)
Rate of children subject to a Child Protection Plan per 10,000 under
18 year oldsLower 63.2 34.7 59.5 55 59.5 59.8 62.2 56.3 -2.36% 3rd Quartile
CYP-41
(new)
Rate of referrals to children's social care per 10,000 under 18 year
oldsLower 564 506 589.7 600 147.3 377.8 594 805.4 -34.23% 3rd Quartile
CYP-04 Rate of S47s per 10,000 population (cumulative) Lower 151 148 288.4 195 54.3 117.4 186.1 255.2 -30.87% 4th Quartile
CYP-09Percentage of re-referrals to Children's Social Care within 12 months
of the previous referralLower 17 18 16 19 28.9 23.6 22 23.5 -23.68% 2nd Quartile
CYP-18Percentage of children becoming the subject of a Child Protection
Plan for a second or subsequent timeLower 23.5 9.9 19.3 18 29.4 30.4 26 25.9 -43.89% 2nd Quartile
CYP-23Average number of days between entering care and being placed for
adoptionLower 559 553 480 450 517 529 577 572 -27.11% 4th Quartile
CYP-24Average time (in days) between a LA receiving court authority to place
a child and the LA deciding on a match to an adoptive familyLower 280 303 222 150 249 254 270 272 -81.33% 4th Quartile
CYP-27a
(new)
Percentage of former care leavers aged 19-21 in suitable
accommodationHigher 90 92.9 89 95 90 95 86 90 -5.26% 1st Quartile
CYP-28aPercentage of former care leavers aged 19-21 in employment,
education or trainingHigher 37 49 49 61 52 48 41 47 -22.95% 3rd Quartile
CYP-29Percentage of Education, Health and Care (EHC) plans completed
within a 20 week periodHigher 47 68.6 15.5 40 41 56 60 69 72.50% 4th Quartile
CYP-42
(new)
Percentage of S47s progressing on to an Initial Child Protection
Conference (ICPC)Lower 46.8 37 36.3 41 36.5 40.6 39.9 35 14.63% 2nd Quartile
CYP-43
(new)Number of foster carers recruited by St Helens Council Higher 2 1 6 10 1 2 4 4 -60.00% N/A
Tier
Higher /
Lower is
better?
Tie
r 1
Ref Performance Indicator
Past PerformanceDOT
(symbol)
Comparative
Performance
Protecting Young People - 2019/20
% Variance
from Target
19/20
Target
Tie
r 2

18
3.1 Overview of Portfolio Performance
A total of 14 key performance indicators have been identified for the Protecting Young People Portfolio in 2019/20. The outturn position shows that of these 3 are reported as exceeding target (Green) and 11 not meeting target (Red). Of the indicators not meeting target 3 are within a 5% tolerance of variance from target (Amber). A total of 6 of the indicators are showing an improvement in performance compared to the previous year’s outturn. The latest available comparative picture of performance has been updated and relates to verified nationally published data for the financial year 2018/19. The comparators used are the DfE Children’s Services Statistical Neighbours group.
3.2 What is performing well
• The number of Children in Need (CIN) at 31st March 2020 has decreased when compared to the position at the end of the previous year. The total number of children and young people open to and receiving support from statutory children's social care was 1,759, a rate of 478 children per 10,000 aged under 18. This is the provisional end of year total and is potentially subject to some change. Whilst the recent short-term trend in St Helens is one of a decreasing number of children in need compared to the position reported in the earlier part of the financial year, it remains the case that the rate of CIN reported for St Helens, remain well above comparable regional and national averages. The introduction of additional social work capacity, in the form of an additional social work duty team, is in part helping the department to meet the challenge of a demand by ensuring additional support is available to support families early to reduce the escalation of concerns.
• Numbers of children supported on a Child Protection Plan (CPP) are now more closely aligned to the comparable Statistical Neighbours average. At the 31 March 2020 a total of 207 children and young people are being supported with a CPP, a rate of 56.3 children per 10,000 aged under 18 years. The rate of children supported on a CP Plan has increased over the past 12 months with the current number of children on a CPP now standing above comparable 2018-19 national averages (44) but just below regional (57) and in line statistical neighbour averages (55). Over the recent past, the St Helens CP population numbers have altered markedly from being well below comparable national averages (June 2018). This suggests thresholds for making a child subject to a child protection plan are being applied accurately.
• Despite increasing demand, there has been significant improvement during 2019/20 in the number of Education, Health and Care Plans (EHCPs) completed within statutory timescales. Improved oversight, additional staffing and case tracking is bringing about further improvement and currently in terms of compliance within the 20 weeks’ target for completion, this stands at 69%. For the 6 months October 2019 to March 2020, 101 EHCPs were finalised, of which just 2 were not completed within 20 weeks, which means that 98% of plans were issued within time and for 4 out of the 6 months the team achieved 100% in time.
3.3 What requires improvement and what is being done about it
• Numbers of Children Looked After remain very high. At the end of March 2020, St Helens had 496 children in care and a Children Looked After (CLA) population, which equates to 134.8 when expressed as a rate per 10,000 under 18-year olds, that continues to be well above than comparable regional and national averages. The numbers of children cared for at 31st March 2020 (496) is higher than the number of children in care at the end of the previous 2018/19 financial year (466), an increase of 6%. However, recent months have seen a decrease in the rate of children coming into care and increased rates of children discharged from care and a subsequent gradual reduction in the numbers of children in care from a high of 534 at the end of October 2019 to the 494 children reported at 31st March 2020. The challenge of an increasing number of Looked After Children is not unique to St

19
Helens but the authority’s overall CLA rate continues to remain amongst the highest regionally. The department is undertaking significant work including the development of a LAC Reduction Strategy, working to increase the number of children who exit care and achieve permanence via a plan of adoption and/or Special Guardianship Order or other orders and the introduction of an Edge of Care service that offers targeted and specialist support to children and families to enable children to remain in their own families.
• Over the course of 2019/20, a total of 281 children and young people became the subject of a Child Protection (CP) Plan with 73 of the children in the group (25.9% of children) having previously been on a CP Plan at some time in the past. The percentage of children who were the subject of a CP Plan for a second or subsequent time is higher than the activity reported in the previous year (19.8%) and above the most recently published 2018-19 comparable regional (22%), statistical neighbour (19%) and national (21%) average. A significant proportion of the children subject of a second-time plan live in households where domestic abuse is a feature. Work to support and address this will be undertaken as part of the response to the borough’s Domestic Abuse Strategy.
• The rate of referrals to St Helens Children's Social Care increased. In the 2019/20 a total of 2,964 were received. The number of referrals, when expressed as a rate, equates to 805.4 children per 10,000 aged under 18. The volume of incoming referrals received between April 2019 and March 2020 represents a 37% increase on the previous financial year. The volume of referrals received is, therefore, higher than that reported in the previous year and above the projected referral activity rate. The rate of referrals reported for St Helens in the 2019/20 financial year is, therefore, well above the local target and well above comparable regional and national incoming referral rates. This remains an area of concern for the Improvement Board, continuing to indicate the problem of consistency of application of thresholds within the borough. Work is ongoing within the Partnership to address the matter.
• The rate of re-referrals to St Helens Children's Social Care also increased. Of the above referrals to St Helens Children's Social Care received within the year 697 (or 23.5%) were re-referrals that occurred within 12 months of the current referral. The proportion of re-referrals reported is above the rate reported in 2018/19, but similar to the most recently published 2018-19 comparable regional (23%) and national (23%) averages. Close oversight and scrutiny continues to be placed on re-referral activity. Current indications are that of the understanding and application of thresholds. Heads of Service are currently in the process of reviewing the file audit process to further strengthen and improve the audit and oversight process. Re-referrals remain as an area of scrutiny for the Improvement Board, and a report on such is an agenda item on the July.20 Board agenda.
• Numbers of Section 47 enquiries, an investigation carried out where there is reasonable cause to suggest a child is suffering or likely to suffer significant harm, remain high. Over 2019/20 a total of 939 Section 47 enquiries (provisional) were initiated, a rate of 255 children per 10,000 aged under 18. In 2018/19 the number and rate of section 47 enquiries initiated within St Helens increased significantly and was significantly higher than comparable regional, statistical neighbour and national averages. The number of Section 47 enquiries initiated within 2019/20 continues to demonstrate a level of child protection activity that, whilst lower than the previous year, continues to be well above comparable national rates of child protection activity. As a consequence of being an outlier in this area of practice, an audit is being undertaken to better understand the issues and to inform the actions required. The findings will be presented to the Improvement Board.
• Although there has been an increase in the numbers of children adopted when compared to the previous year, the timeliness of the adoption process has worsened, and local targets have not been met. This applies both to the cumulative

20
2017-2020 performance for the average number of days between a child entering care and being placed for adoption, (572 days for the 55 children adopted over the three year period) and the cumulative 3 year performance for the average number of days between the local authority receiving court authority to place a child and deciding on a match to an adoptive family (272 days). Improving permanency arrangement from the front door to adoption to ensure that the full range of permanence options are achieved in a timely way for all our children in care is a key priority. A review of permanency planning was undertaken, a Permanency Panel established to track and monitor progress, and a permanency training programme is operating to ensure adoption of best practice. Further work continues in relation to early permanence, this is supported by our Partners in Practice, as approved by the DfE and timeliness, quality and outcomes are monitored by the Improvement Board.
• The percentage of care leavers in suitable accommodation increased marginally during the year to 90% but remains broadly in line with the most recently published national performance. The percentage of care leavers in employment, education and training decreased marginally from 49% to 47%, below the most recently published national performance of 51%. %. This will remain an area of focus as there is an expectation that the impact of COVID will affect this cohort of young people.
• A total of 4 foster carers were recruited over the course of 2019/20, 2 less than the previous year. The Fostering Service is however currently making positive strides in recruitment, having approved 4 households since April 2020. There are also a further 9 household at varying stages in the approval process. The service now has an active presence on Facebook and is in the final stages of having a live chat feature on its website to increase engagement with the public. A dedicated recruitment and retention officer is handling all initial enquiries and supporting applicants through their approval process. Procedures and timescales are being scrutinised closely to look for areas of improvement.
21
Public Health, Leisure & Libraries Portfolio
1. Key Portfolio Priorities
• To continue to implement plans for the areas for the St Helens People’s Plan, which include:
o Alcohol
o Falls
o Self-Harm and Suicide Prevention
• To take account of Public Health contribution to the new priorities agreed in July 2019 for The People’s Board of:
o Mental Health, Children’s Confidence and Resilience, Domestic Abuse and Cancer
• To further develop programmes of work to support St Helens Cares on Early Intervention and Prevention, which will include key priorities for Public Health on:
o Community Resilience
o Healthy Weight
o Physical Activity
• To support work across Cheshire and Merseyside, including key priorities in the NHS Sustainability and Transformation Plan (STP) and those of CHAMPs Public Health Network.
• Development of the Business Intelligence function within St. Helens Cares.
• Development of the Arts and Culture offer as part of the Borough Vision.
• To develop a 5-year Library Strategy and provide services that remain relevant to local needs and are financially sustainable within the resources available.
• To provide leisure and recreation services that contribute to the quality of life in local communities and support better health and well-being for all people.
2. Progress Against Portfolio Priorities
• Suicide prevention
A number of actions were progressed to reduce suicide and self-harm. These include an innovative primary care pilot, which will identify patients at increased risk and provide support; the ‘OK to Ask’ campaign, which was rolled out on World suicide day in September; work within the community to raise awareness about mental wellbeing and resilience and a month-long calendar of suicide prevention activities.
A motion was approved at full Council in January 2020 to encourage councillors and partners to work with the council to promote the ’OK to Ask’ campaign, the council committed to providing training in all electoral wards and to ask the Minister to visit St. Helens around the work of suicide prevention in the borough.
In March the launch of ‘Offload’ to support men with mental health issues continued despite lockdown due to COVID. The support was offered virtually and in a different format from the face to face sessions planned
Across Cheshire and Merseyside, the sub-regional real-time surveillance system, which identifies suspected suicides much more quickly than was previously possible, has now been underway for two years. A recent academic review for Public Health England identified the system as an example of good practice nationally.

22
• Reducing Alcohol Harm
Key actions to reduce alcohol harm in our population included:
The ‘Building Bridges’ Innovation Fund project, delivered by CGL (Change Grow Live), to support Children of Alcohol Dependent parents is working with our Children’s Services ‘Front Door’ to identify and support families where alcohol is an issue. There are exciting plans in place to extend this work into schools. A visit in February by Public Health England and NHS England to monitor progress found the project to be inspirational.
Work is underway with commissioners and St Helens & Knowsley NHS Hospitals Trust to transform the Alcohol Liaison Service at Whiston Hospital into a first-class Alcohol Care Team, as specified in the NHS Long Term Plan.
Joint working between Public Health, Place services, Police and local businesses was progressed to promote a vibrant and safe night-time economy through exploring the standards required of the ‘Purple Flag’ and ‘Best Bar None’ quality schemes.
• The Community Falls Prevention Team
The Community Falls Prevention team completed Falls Prevention training with all Care Home Managers in the borough and all homes have been encouraged to analyse falls so that patterns can be identified. Care Homes have also received Nursing and Residential Triage (NART) training to reduce avoidable 999 calls. Work continues in the community to prevent falls and support people who have had a fall.
We have also commenced work with the Scouts to raise awareness of Falls so that they can prevent their older relatives from having a fall.
• Community Wellbeing
Social prescribing has been rolled out within all the four Primary Care Networks. The negotiations with the primary care networks concluded towards the end of February. At the beginning of lockdown for COVID 19 the social prescribing team worked closely with Contact Cares about how they could help to support people who are isolating and feel lonely may need additional support.
We have now trained 11 Mental Health First Aiders (MHFA) for the Council and CCG and 8 in the community. Funding is available for staff to be trained as trainers and to recruit additional MHFAs, within the Council and community.
In terms of children’s confidence and resilience, we have secured additional funding via the Police Violence Reduction Unit to train processionals about the impact of Adverse Childhood Experiences. Public Health and the CCG are working with Barnardo’s and CAMHs to review the provision of mental health services and move towards the THRIVE model, with greater focus on prevention.
• Integrated Wellbeing Service
The new Integrated Wellbeing Service combines healthy living services, Smokefree St Helens and weight management. The service commenced in August with an official launch in 2020. It is specified to address key population health outcomes, with obesity being a priority.
The St Helens Healthy Weight Strategy has been developed and approved, with a specific focus upon children and families, particularly Early Years. Action includes embedding health into all of our policies and decisions, developing environments that support healthier eating and physical activity, a focus on ‘Early Years’ opportunities for healthier foods including continuing to increase breastfeeding and work with maternity, health visiting and nurseries on supporting healthier environments.

23
In the first weeks of lockdown the service saw an increase in referrals for smoking cessation support.
• St Helens Cares Business Intelligence
The St Helens Cares Business Intelligence Function continued to develop, with recent activity including working with Graphnet to identify the best use of the St Helens Shared Care Record for intelligence, and development of the St Helens Cares Integrated Performance Dashboard. The team won the award for Innovation of the Year at the NW Healthcare Finance Managers Association conference in June.
• Covid-19 Response
At the end of 2019/20, Public Health actions were increasingly focussed on the response to the potential, and then actual, impact of the new coronavirus pandemic. This meant working in a rapidly evolving situation where the requirements and data changed day by day. Key actions in February and March included:
o Set up of a wider Covid-19 response group
o Membership of a range of Merseyside Resilience Forum cells to aid response across the city region. These include the Strategic Co-ordinating Group, Vulnerable People, Volunteer/Shielding and data and intelligence.
o Modelling the potential impact of coronavirus to local and sub-regional areas from a variety of sources, including PHE and Imperial College research, to inform local demand planning in the council and NHS. Estimates varied depending on the success of a range of potential actions. This also included support or the development of local modelling by researchers from the Universities of Lancaster and Liverpool.
o Support for the council’s work to provide essential supplies to people unable to access food or medicines, such as those unable to leave home as they were shielded.
This work continued and expanded into the next financial year, to include topics such as the development of test, trace, isolate and control actions to reduce disease transmission. Other topics included helping identify the potential numbers of patients leaving hospital needing respite care.
• Libraries and Arts
The Business Plan for Year Two of the Arts in Libraries - Cultural Hubs Programme was approved by the Arts Council. Feedback on the Year One Annual Report for Cultural Hubs was extremely positive.
The Council has commissioned Counterculture Partnership LLP to develop an Arts Strategy to set the strategic direction of the arts and its wider role in the development of the borough over the next 10 years. St Helens has a great many assets on which to build and the strategy will ensure that the arts in St Helens continue to thrive; that the contribution that the arts and creativity can make to wider agendas are recognised and maximised in order to develop St Helens as a unique place to live and work.
St Helens was represented in the Artist/Arts Organisation of the Year Category at Liverpool City Region Culture and Creativity Awards, where the Heart of Glass won the award.
The findings of the user and non-user research project along with performance data, and the wider Council Asset Strategy are being incorporated into the draft 5-year Library Strategy which is scheduled to be presented to members for consideration before wider public consultation on the proposals is undertaken.

24
The plans for a new Town Centre Library at the World of Glass were approved and work commenced in March. The Covid-19 pandemic however forced the suspension of work and a delay in the supply chain. Work is now underway again and the Library will open later in 2020. Linked to the new Town Centre Library, the service has undertaken a review of opening hours and will introduce new standardised opening hours across all libraries that align with the times and days most popular with users. The new hours will be introduced when the libraries re-open.
• Leisure and Sports Development
Work was undertaken on the production of a Sport and Physical Activity Strategy 2020-2025 for the borough to be completed in 2020. The refurbishment of Newton le Willows Health and Fitness progressed well. Phase One, the fitness suite and immersive cycle studio opened on 9 September. Phase 2 of the redevelopment of Newton Health and Fitness Centre opened on 2nd December. New facilities include a spacious and bright reception with self-serve entry and a new Costa Coffee shop, the adventure play, party rooms and new dry changing rooms. Customer feedback on the quality and range of equipment has been very positive. Membership and use of the facility continue to grow until the closure of all leisure centres in March due to Covid-19.
During the academic year 2018/19, 143 competitions were delivered as part of the school sport programme, engaging 10,501 pupils from the borough’s schools. This represents an annual 37.5% increase in the number of competitions and a 53% increase in the number of pupils taking part. Last academic year saw the highest number of successful applications for the National School Games Mark across the borough, with 37 schools achieving the award at one of the four levels.
Sports Development working in partnership with the YMCA and Saints Foundation secured funds from the Big Lottery for the Y Sports Project. The project was shortlisted to the final 3 of the National Youth Matters Awards in the category of Best Health and Well Being Project. The project will engage with 50,000 young people aged 10 to 18 years, offering free weekly sports and physical activity sessions, holiday programmes and sessions for young people with additional needs.

25
3. Performance Indicator Summary
Q1 Q2 Q3 Q4
16/17
Outturn
17/18
Outturn
18/19
OutturnJune Sep Dec Mar
PH-06 Percentage of children in reception year who are overweight or obese Lower 28.1 26.9 28.6 28.1 N/A N/A N/A 28.2 -0.36% 4th quartile
PH-25
(New)
Mortality rate due to suicide and injury of undetermined intent per
100,000 populationLower 15.8 17.9 15.9 17 14.9 15.5 13.3 14.4 15.29% 4th quartile
PH-48Admission episodes for alcohol specific conditions, all ages, per
100,000 populationLower 1,118 1,110 1,125 1,045 275 580 853 1,059 -1.34% 4th quartile
PH-52
(new)
Emergency hospital admissions for falls for aged 65+ per 100,000
population Lower 2,707 2,692 2,484 2,484 2627 2566 2620 2,438 1.85% N/A
CC-01 Number of library visits per 1,000 population Higher 4464 3238 3,289 3100 754 1,613 2,367 3,058 -1.35% 3rd Quartile
CC-02 Number of active library members per 1,000 population Higher 204 194 135 130 145 142 142 141 8.46% 1st Quartile
CC-16 Number of visits to sports centres Higher 1,142,776 1,088,131 1,297,825 1,250,000 275,042 537,803 895,426 1,200,295 -3.97% N/A
PH-04Under 18 conception rate per 1,000 15-17 year old (3 year rolling
average)Lower 33.4 29.6 29.3 28.3 31 31.2 32.5 32.8 -15.90% 4th Quartile
PH-05 Percentage of infants being breastfed at 6-8 weeks Higher 22.4 21.8 24.3 24.5 24.3 27.1 29.2 28.1 14.69% 4th Quartile
PH-12 Percentage of children in Year 6 who are overweight or obese Lower 40 38.4 38.1 37 N/a N/A N/A 36.6 1.10% 3rd Quartile
PH-15 Smoking status at time of delivery Lower 15.6 15 16.1 14.8 N/a N/A N/A 16.4 -10.81% 3rd Quartile
PH-22Under 18 admissions to hospital for alcohol specific reasons per
100,000 populationLower 99 98.8 93.7 83 94.2 86.1 77.9 73.4 11.57% 4th Quartile
Comparative
Performance
Tie
r 2
Public Health, Leisure & Libraries - 2019/20
Tier Ref Performance Indicator
Higher /
Lower is
better?
Past Performance19/20
Target
% Variance
from Target
DOT
(symbol)
Tie
r 1

26
3.1 Overview of Portfolio Performance
There is a total of 12 performance measures reported over the course of 2019/20, of these 6 have exceeded target. Of the 6 indicators that failed to meet target 4 were within a 5% tolerance of target. A total of 8 indicators showed improvement in performance in 2019/20 compared to the previous year’s outturn. Comparatively the majority of measures remain in the bottom and third quartile, reflecting the challenges inherent in improving the health of local communities.
3.2 What is performing well
• The number of active library members increased over the course of 2019/20, with online membership applications and use of online library services increasing monthly. The introduction of a new e-book provider, Borrowbox, has improved the accessibility and range of the offer. The number of library visits over the year was only marginally below target by 42 visits and would have exceeded target had the service not been on lockdown from the 24th of March.
3.3 What requires improvement and what is being done about it
• Although St Helens is still significantly higher than the England average, the rate of mortality due to suicide and undetermined injury continues to fall, which is positive. The latest local provisional data is a 3 year-rolling-rate up to the end of December 2019 equating to 67 deaths. This is more positive than the position 12 months previous when the rate equated to 74 deaths. As this measure is a three year-rate, it can naturally move more slowly than other indicators, however the number of deaths recorded in 2018 and 2019 reduced by a third compared with 2016 and 2017. There will be a review of the suicide prevention action plan with external support from the Association of Directors of Public Health and the LGA. There are a range of current and recent actions on suicide prevention to further reduce numbers. These include the primary care pilot to identify patients at increased risk and the OK To Ask campaign. This was alongside a month-long calendar of suicide prevention activities.
• The admissions rate of people aged over 65 due to falls has been calculated from a 12- month average between December 2018 to November 2019, as this is the most recent available. The falls admission rate of 2,438 per 100,000 is lower (better) than the target of 2,484 per 100,000, which is also the 2018-19 outturn. There has been close support for care homes to reduce falls, as well as support for individuals, as outlined earlier in the report.
• The rate of alcohol specific hospital admissions saw an increase over the year, exceeding the previous year’s outturn. St Helens rate is almost twice that of the latest published England rate and much higher than the North West rate. St Helens has the fifth highest rate in the North West and the sixth highest in England. The provisional outturn for the rate of alcohol specific hospital admissions for under 18s, has shown improvement, with the decrease between quarter 1 and quarter 4 equating to 24 fewer admissions. However, the latest verified published rate in 2018/19 for St. Helens remains significantly higher than the regional (45.9) and national (31.6) averages. The alcohol harm reduction action plan has now been signed off by the People's Board. The plan covers prevention, identifying and reducing alcohol risk (including in the hospital setting), better treatment services for those who need them, support for children and young people, and enforcement. In terms of young people, the provisional outturn for the rate of alcohol specific hospital admissions for under 18s, has shown improvement, with the decrease between quarter 1 and quarter 4 equating to 24 fewer admissions. However, the latest verified published rate in 2018/19 for St. Helens remains significantly higher than the regional (45.9) and national (31.6) averages.
• The latest data from 2018 shows that the 3-year rolling rate for teenage conceptions increased on the previous 3-year rate. In 2018 there were a total of 101 conceptions,

27
compared to 103 in 2017. St Helens has the third highest single year rate in the country. In December 2019 the national lead from Public Health England attended St. Helens multiagency task group to advise on priority actions. A strategy and action plan have been drafted. Initial actions include:
o We have developed a local system to be able to estimate up to date trends as the Public Health England data is 15 - 18 months behind.
o We have identified the schools with the highest number of pregnancies, and we are working with them and local services to increase interventions.
o We are working with four 'early adopter' schools and the faith sector on implementing the new national guidance on Relationship and Sex Education in preparation for mandatory roll out to all schools from September 2020.
o The Family Nurse Partnership have completed some insight work with teenage parents about access to contraception and attitudes towards teenage pregnancy to help inform the strategy.
• The percentage of children overweight or obese in Year 6 is in the third quintile of areas at 36.6% in 2018/19, with the proportion significantly higher than the England average of 34.3%. However, there has been a decrease in the proportion since 2015/16 (40% to 36.6%) which is positive, and the St Helens’ value is now statistically similar to the North West average of 35.9%. Similarly, the percentage of children experiencing overweight or obesity in Reception year is still high but has seen marginal decreases since 2017/18. The rate for Year 6 children also remains high but has seen a decrease since 2016/17 (40% to 36.6%), although St Helens’ rate is still above the North West average of 35.9%. The recently approved Healthy Weight Strategy will focus on childhood obesity. The new Integrated Wellbeing Service formed in August 2019 and has a significant focus on reducing childhood obesity. The 2019 Physical Activity Campaign and initiatives targeting schools, nurseries, high streets and services that engage with early years are also ongoing. A project focusing on the priority area of Four Acre is targeting healthy weight in children and adults.
• Smoking at time of delivery remains a challenge with over 16% of mothers smoking during pregnancy. The recommendations of ‘Saving Babies Lives’ highlight smoking in pregnancy as a key priority to reduce infant mortality and support healthier pregnancies and babies. Reducing smoking in pregnancy is now a top priority for local midwives, and work is underway to ensure adequate training, support pathways for pregnant women who smoke, and recording practices are in place to reduce smoking in pregnancy. A dedicated task group is in place which feeds into the wider Saving Babies Lives forum.
• The latest available data shows that 28.1% of St Helens mothers are continuing to breastfeed their babies 6-8 weeks from birth. This is one of the highest rates recorded for St Helens, although this remains significantly below the national average rate of 48.2%. Actions to improve performance have included baby cafes, volunteer peer support and the successful ‘Your Milk Your Story’ social media campaign. Since the pandemic, antenatal support has been provided virtually. This has been well received, with breastfeeding at 6-8 weeks increasing by 10% between January and April 2020.
• The outturn for the number of visits to leisure centres was 49, 705 visits down on the original target of 1,250,000. 2019/20 was a challenging year for leisure centres due to a number of factors including the Newton Health and Fitness refurbishment project, the unplanned 6-month closure at Parr Swimming Pool and the Covid-19 pandemic which impacted attendance in the final weeks of the year. Had these factors not occurred the year-end outturn would have been significantly over achieved its target. Full post Covid19 recovery plans are in place ready for the re-opening of the facilities.

28
Economic Regeneration & Housing Portfolio
1. Key Portfolio Priorities
• Work collaboratively to develop and implement an approach to promoting greater economic development activity, inclusive growth, employment and investment within the borough.
• Prepare and gain approval for a new Local Plan for St. Helens that will establish the borough’s future planning priorities and allocate sites for housing, employment, retail, whilst adopting a ‘Brownfield First approach.
• Work collaboratively to maximise the borough’s transportation assets and further establish St. Helens reputation as a well-connected location.
• Deliver St. Helens Town Centre Strategy to rejuvenate the town centre and improve opportunities for shopping, leisure and living.
2. Progress Against Portfolio Priorities
• Inward Investment and Employment Opportunities
The Council continued to work collaboratively to provide new opportunities for growth and investment in the borough and actively worked with a significant number of developers to bring forward economic development and housing schemes. Significant arrivals include Amazon (Haydock), Widd Signs (Bold), and Synergy LMS (Mere Grange). The Ways to Work employment and skills programme continued to support inward investors in recruiting residents. Work continued with colleagues across Children’s Services, to support Care Leavers into employment and training.
There are currently 133 businesses signed up as Invest St Helens Ambassadors who are raising the profile of St Helens and changing the way we do business. The Future Generation Programme is an innovative offer developed by the Invest St Helens platform and the Ambassadors to improve the lives of young people by raising aspiration and linking schools, businesses and young people to the future economy. Recent work has included:
o Provision of traineeships, career advice, interview preparation and work experiences.
o Development of a Traineeship Programme for Care Leavers.
o Delivery of a 12-week confidence building programme for all ages of Looked After Children and Care Leavers.
o £6,000 raised to deliver Christmas for Care Leavers 2019.
• High speed Broadband
Work with Liverpool City Region partners continued on the development of a high-speed digital fibre optic network in the borough to support business growth and investment. Capital funding from the Single Investment Fund was released for some initial infrastructure work of this multi-phase project.
• Local Plan and development
Significant progress has been made in relation to the new Local Plan followed by a period of public consultation. Work continued over the course of 2019/20 on the development of the Local Plan, for submission to the Planning Inspectorate. In an Extraordinary Cabinet meeting held on 6 March 2020, the Council decided to delay submission of the Local Plan in order to determine the land use planning implications of the Council entering into a strategic, long-term regeneration partnership. Future updates on the progress of the Local Plan are expected in summer 2020.

29
The Council is required by statute to update and publish its Brownfield register of housing land each year. Work is still currently being undertaken to review and update the Brownfield register and to publish the information as soon as possible.
The Council continues to work with developers to bring forward a number of significant Brownfield sites in the borough for housing schemes. These include Worsley Brow and the former Cowley Hill works with the potential to bring forward over 2,000 new units. Planning permission has been submitted for over 1,000 dwellings, on Brownfield land, at the Cowley Hill works on College Street.
Work is in progress with Liverpool City Region partners, through the Housing and Spatial Planning Board, to develop and agree a ‘pipeline’ of housing sites that will be prioritised to secure investment from Homes England. The sites will be prioritised in accordance with the Housing Ambitions for the Liverpool City Region 2019 - 2024 Statement approved in September 2019. A report has been taken to the Housing and Spatial Planning Board and the Board will consider the schemes put forward on the 9th July 2020.
The outline application for the development of Parkside and the A49 link road were approved in December but plans for development have been called in by the Secretary of State. A hybrid planning application has come in for employment land at Omega West, in Bold, this has the potential to develop approximately 2 million square foot of employment floorspace.
• Infrastructure
Work continues to deliver over £80 million of transportation investment in the borough with support from developers, the Department for Transport and the Liverpool City Region Combined Authority. Plans are underway to develop a further £200 million of infrastructure projects, which will improve connectivity within St Helens.
Investment in infrastructure has also advanced with the completion of both the Sutton Hall / Eltonhead Road and Windle Island projects, which collectively saw an investment of over £10m through the Liverpool City Region Combined Authority and the Council.
Studies have been completed on proposed transport infrastructure developments at Junction 23 on the M6 and in Lea Green. The station, cycling and walking infrastructure developments at Lea Green were due to go to consultation in Spring 2020. This has now been delayed due to Covid-19. Some soft consultation has been ongoing, however further public engagement is now planned for September 2020. Works are still scheduled to start in 2021, after full funding approval.
• Town Centre Strategy and regeneration
A landmark 20-year partnership between the Council and English Cities Fund to regenerate St Helens Town Centres and ensure development across the borough was announced in March 2020. A phased Development Strategy will be produced with envisaged development comprising of leisure, housing and retail opportunities. Masterplans will initially focus on St Helens and Earlestown town centres. Proposals will be worked up over the first 6 months of 2020/21, taking account of the implications for the submission draft of the Local Plan. The partnership will complement the work of the Town Deal Board, established in September 2019 following the announcement of St Helens being one of 100 places to develop proposals to access the Government’s £3.6 billion Towns Fund.

30
3. Performance Indicator Summary
Q1 Q2 Q3 Q4
16/17
Outturn
17/18
Outturn
18/19
OutturnJune Sep Dec Mar
G&P-01 Rate of employment (working age) Higher 71.3 70.1 72.7 73 74.1 75.6 75.3 74.5 2.05% 1st Quartile
G&P-06 Town Centre retail vacancies as a proportion of total stock Lower 10.9 11.8 13.4 14 13.8 20.2 17.9 20.9 49.3% N/A
G&P-09 Number of net increases in dwelling stock Higher 487 408 775 570 291 491 629 758 32.98% N/A
G&P-30 New build employment floor space completed (sqm) Higher N/A 766 10,838 25,000 N/A 136,619 N/A 144,512 478.05% N/A
HS-01 Number of long term empty homes with regard to New Homes Bonus Lower 935 936 944 1,100 - - - 933 15.18% N/A
G&P-05 Number of new business registrations Higher 725 705 635 730 N/A N/A N/A 635 -13.01% N/A
G&P-12Percentage of major planning applications determined within 13
weeks or within an agreed extension in timeHigher 100 100 100 100 100 100 100 100 0.00% 1st Quartile
G&P-12a
(new)
Percentage of minor and other applications determined within 8
weeksHigher N/A N/A N/A 94 96.5 96.6 97.0 96.8 2.98% N/A
HS-02 Number of long term empty homes in the borough Lower 1,193 1,285 1,257 1,450 - - - 1166 19.59% N/A
HS-03
Number of private sector vacant dwellings that are returned into
occupation or demolished as a direct result of action by the local
authority
Higher 161 93 116 100 20 43 67 102 2.00% N/A
HS-09 Number of households assisted to reduce fuel poverty Higher 496 506 666 450 194 414 635 861 91.33% N/A
Tie
r 2
Comparative
Performance
Economic Regeneration & Housing - 2019/20
Tier Ref Performance Indicator
Higher /
Lower is
better?
Past Performance19/20
Target
% Variance
from Target
DOT
(symbol)
Tie
r 1
31
3.1 Overview of Portfolio Performance
A total of 11 key performance indicators were identified for the Economic Regeneration & Housing Portfolio in 2019/20. At year end, 9 indicators are meeting or better than target and 2 are not meeting target. 6 of the indicators have shown improved performance compared to the previous year’s outturn.
The latest available comparative employment data relates to Jan - Dec 2019. The comparative planning data is the latest nationally published data for the financial year 2018/19.
3.2 What is performing well
• The employment rate in St Helens was better than target at 74.5%, almost 2% better than the previous year. The rate is comparable to the regional average and compares strongly to our statistical neighbours. Data relates to the period Jan-Dec 19. The impact of the Covid-19 pandemic on the economy is not yet fully known, although it is likely that the employment rate will be severely impacted going forward.
• New build employment floorspace completed has significantly exceeded target at 144, 512m2. In 2019/20 completed developments included a 46,264m² unit for B8 storage or distribution use at Penny Lane North (Haydock Green), two units for B8 use at Florida Farm (M6 Major) totalling 82,748m² and a 5,808m² unit for B8 use at Andover Road, Haydock.
• The number of new dwellings completed is above the target for the year. However, this is seen as a short-term trend, due to the private build to rent schemes that have been completed within the borough. These include a number of units at Juniper Grove and Abbotsfield.
• The determination of both major and minor / other planning applications continues to show strong performance.
• The total number of long-term empty homes and long-term empty homes linked to the new Homes Bonus have reduced. The reduction mainly reflects a high number of long-term vacant properties no longer included in this figure that are benefitting from a short-term Council Tax exemption following change of ownership to encourage the refurbishment and reoccupation of the properties within 6 months of sale.
• The number of private sector dwellings returned to occupation or demolished was 102, this includes 67 long-term vacant properties brought back in to use, of which 10 have been demolished and 14 were previously coded second homes.
• Strong support from the Affordable Warmth and Welfare team continued to assist households to reduce fuel poverty. A total of 861 households have been assisted during the period April to March 2020. The support provided included assistance to access heating and insulation measures and income maximisation advice.

32
3.3 What requires improvement and what is being done about it
• Vacancy rates within St Helens Town Centre continue to prove challenging and will likely be exacerbated by the continuing Covid-19 Pandemic. However, the partnership with the English Cities Fund will see a Development Strategy produced, identifying leisure, housing and retail opportunities across the borough, including the Town Centre.
• The number of new business registrations in 2018 (latest available data) was 635, no change on the previous year. St. Helens business start-up rate remains at some distance from regional and national rates. The total number of enterprises in the borough has decreased from 4,560 in 2018 to 4,495 in 2019 (IDBR, NOMIS). The development of a St Helens Economic Recovery Plan and programme of interventions will be implemented to support St Helens’ economic recovery and business growth in the medium and long-term linked to the Liverpool City Region Economic Recovery Plan workstreams.
33
Environmental Services Portfolio
1. Key Portfolio Priorities
• The delivery of the Capital and Revenue Engineering programmes for Transport and Highways remains key to achieving the Transport Plan and growth objectives. Investing further in street lighting services to reduce energy costs is also a priority.
• To modernise the Waste and Recycling collection service, to increase recycling rates and improve service delivery.
• To consider relevant safety measures around schools following the review of School Crossing Patrols and to identify options for improvement where necessary.
• Work to deliver sustainable development and maintain the environmental quality of the borough.
• To consider and develop a long-term strategy for the provision, funding and usage of the borough’s parks and open spaces in the future.
• To modernise services through the implementation of digitisation and to assess the continuing suitability and cost effectiveness of Hardshaw Brook Depot.
• To implement 2017-2020 budget savings proposals and to increase commercialisation to maximise income from external work, contracts and service level agreements.
2. Progress Against Portfolio Priorities
• Modernisation of Recycling and Waste collection service
Progress continued towards the implementation of the Recycling and Waste Collection service modernisation plan approved by Cabinet in October 2018.
New job descriptions and pay/conditions for Team Leaders were implemented, with all staff notified in writing. Work has commenced on recruitment to initiate direct employment of workforce staff rather than relying on agency supply workers. A recruitment process for front-line recycling staff has commenced.
Several different systems of “In Cab Technology” are currently being assessed.
The Waste Management Fund approved £2.2 million for the replacement of 15 recycling wagons. The procurement and delivery of 15 new Romaquip recycling vehicles was completed.
New livery and branding options for the recycling service have been designed.
• Review of Parks and Green spaces
The Parks Vision and Strategic Framework outlining a proposal for their future provision and management was initially produced by the former Executive Director of Place in collaboration with Mersey Forest and a cross sector group of council officers. There is now a requirement to review the report with the new Executive Director of Place and Members.
Borough wide reductions to grass cutting regimes and operational modernisation changes to street cleansing were implemented in line with agreed budget savings for 2017-20 and identification of further required savings are considered within the Parks and Green Spaces review. Work has taken place to increase commercialisation within the trade waste service and a report recommending modernisation of this service is expected to be ready for consideration next quarter.
The Council received funding of almost £135,000 as part of a successful joint competitive bid for Merseyside for tree planting from the Urban Tree Challenge Fund

34
(UTCF). Over the next two years over 300 new urban trees will be planted in St Helens parks and streets.
Digitisation
Collaborative work through the Trading Services Digitisation Sub Group continued in partnership with Corporate IT and service representatives. Key elements of digitisation within Trading Services is the development of Mobile applications and integrating mobile devices into the services and improving systems and communication.
The operational specification for a Fly Tipping reporting app was finalised, and a testing session was carried out in the field to allow operatives the opportunity to provide feedback on its functionality. Further work is still required to ensure completion of the development and roll out of the app, which has been delayed due to Covid-19 and other development priorities within IT. It is envisaged work will begin again in the second quarter of 2020/21.
• Highways and Maintenance
The Council approved a Capital and Revenue Programme for Transport and Highways of over £14 million for 2019/20, ensuring the maintenance of the transport network to the highest standard and to improve and enhance our existing infrastructure.
Over 13.7km of carriageway resurfacing for planned maintenance was completed during the year plus resurfacing incorporated in junction improvement schemes at Windle Island [2.5km resurfacing & 1km of New Build] and A570/Sutton Hall Roundabout [1.5km resurfacing & 0.6km of New Build].
The footway reconstruction programme reconstructed about 7.8km of footway, as well as work to enhance road markings and undertake significant junction improvement works.
Progress continued on the delivery of the capital and revenue engineering programmes for transport and highways. Major capital projects currently in progress include:
o The desilting of Rainford Brook from College Street to Park Road has been partially completed with further works planned for October 2020 due to habitat constraints in the summer months. The scheme will assist with reducing the severity and frequency of flooding that occurs in the area.
o The construction phase for Pewfall junction improvements (A580/A58) commenced in early February and will be completed in October 2020. The works will increase capacity at the junction and improve road safety.
o Two major road safety schemes, A570 Sherdley Roundabout and Warrington Road (A57) /Clockface Road / School Lane, commenced in late February and both are programmed for completion in October 2020.
The upgrade to LED streetlighting across the borough is progressing well. The next phase of the installation will see a further 3,400 LED units fitted, meaning that approximately 20,000 of the 23,870 streetlights across the borough will have been upgraded. The benefits are significant in terms of improving the overall quality of lighting, reducing carbon emissions and generating energy cost savings.
A programme of works has commenced to ensure that Hardshaw Brook Depot remains functional and can provide the necessary facilities for all operational activities. Work continues to address the long-term sustainability of this facility and a number of alternative options are currently being considered.
The 2020/21 Portfolio Budget savings proposals have been identified and approved for implementation from the 1st of April 2020.

35
3. Performance Indicator Summary
Q1 Q2 Q3 Q4
16/17
Outturn
17/18
Outturn
18/19
OutturnJune Sep Dec Mar
ENV-01The amount of direct greenhouse gas emissions from local authority
own estate and operations (tonnes of CO2e)Lower 18.32 17.56 14.3 13.5 N/A 13.5 N/A 13.5 0 N/A
ENV-02Percentage of household waste arisings which have been sent for
recyclingHigher 39.68 36.35 36.53 37 35.4 37.1 37.20 38.39 3.76% 4th Quartile
ENV-09Number of people killed or seriously injured in road traffic accidents
during the calendar yearLower 65 47 74 45 N/A N/A N/A 66.00 -35.55% N/A
ENV-11Percentage of principal roads where maintenance should be
considered.Lower 1 2 2 5 N/A N/A N/A 2.0 60.0% 1st quartile
ENV-03 Kilograms of residual household waste collected per household Lower 510 498.8 494.3 470 493.2 484.2 486.5 468.1 0.41% 2nd Quartile
ENV-06Percentage of relevant land and highways that is assessed as having
deposits of litter at an acceptable levelHigher 96 91.8 95 95 96 93 94 95 0% N/A
ENV-07 Number of flytipping incidents Lower 2,070 2,005 1,959 1,900 497 961 1,336 1,817 4.37% 3rd Quartile
ENV-10The number of children killed or seriously injured in road traffic
accidents across MerseysideLower 80 75 68 59 N/A N/A N/A 66 -11.86% N/A
ENV-20
(New)
Percentage of respondents satisfied with St Helens highways
(National Highways and Transport Annual Survey).Higher N/A 49 54 53 - - - 54 1.89% N/A
Tie
r 2
Comparative
Performance
Environmental Services - 2019/20
Tier Ref Performance Indicator
Higher /
Lower is
better?
Past Performance19/20
Target
% Variance
from Target
DOT
(symbol)
Tie
r 1

36
3.1 Overview of Portfolio Performance
A total of 9 key performance indicators were identified for the Environmental Services Portfolio in 2019/20. At year end, 7 indicators are meeting or better than target.
Of the 9 indicators, 6 have shown improved performance compared to the previous year’s outturn, whilst 3 maintained the same level of performance.
The latest available comparative picture of performance relates to verified nationally published data for the financial year 2018/19. The comparators used are CIPFA Nearest Neighbours Model.
3.2 What is performing well
• Overall greenhouse gas emissions from the Council’s own estate and operations has decreased by almost 50% compared to the baseline year (2009/10). A 6% reduction was seen compared to last year.
• The levels of land and highways at an acceptable level of cleanliness has met target, despite reduced resources. New methods of working are being considered and deployed.
• The provisional number of fly-tipping incidents has met target. However, there are 187 outstanding investigations, which may see the target exceeded. The final verified figure will be reported in due course.
• The SCANNER survey assessed that 2% of the Principal Road Network (PRN) in St. Helens should be considered for maintenance in 2019/20. This is the same as the previous two years. The Liverpool City Region Combined Authority is moving towards an alternative accredited survey method called Annual Engineer’s Inspection (AEI). A new performance measure to assess maintenance of the PRN using the AEI survey will be established for 2020/21.
• 54% of those surveyed were satisfied overall with St. Helens highways. The survey examines areas such as highways maintenance, cycling and walking routes, congestion, road safety and public transport. There are 6 subsection indicators and 2 have slightly improved, 2 stayed the same and 2 have reduced slightly. Improved satisfaction was seen in relation to accessibility and highway maintenance. There were slightly reduced levels of satisfaction in relation to public transport and road safety.
3.3 What requires improvement and what is being done about it
• Recycling performance continued to improve with a further increase by year end. At 38.4%, performance is almost 2% better than the previous year. The overall household waste collected has also reduced compared to the previous year. Improved performance is attributed to a food waste project implemented in April 2019, with an extra 500 tonnes of food waste recycled in 2019/20. The latest nationally published data shows St Helens performance as 4th quartile within its comparator family group. However, this published figure does not take account of recycling from St Helens’ household waste reception centres which are included in Merseyside Recycling and Waste Authority figures. If these tonnages were to be included St Helens comparative performance would shift to within the 3rd quartile.
The recycling service was suspended at the start of lockdown to allow the service to prioritise household and medical waste collections as it faced increased pressure on staff resources. Measured in tonnage, prior to lockdown and the service being suspended the Council collected 281 tonnes per week, based on an average four-week collection period. Residents were encouraged to store clean recyclable materials for a phased return to service. When the service resumed, the volume of recycling waste collected in the first week across the borough almost doubled, demonstrating residents’ willingness to engage with the recycling process.

37
• The 2019/20 unvalidated outturn for numbers of people killed or seriously injured in road traffic accidents in St Helens totals 66, a 10% improvement on the previous year's figure of 74, but some way from the target of 45. There does not appear to be any common reason for the incidents and no clusters or hot spots that can be readily engineered out. The Merseyside Road Safety Partnership, of which we are members, are reviewing the City Region Road Safety Strategy which may take a different approach by focusing on groups that are causing the injuries rather than the vulnerable groups at risk of having an accident; although this has worked well as the overall trend across the region is still down. The previous year's regional total was 499 and there is a 7% reduction in 2019/20 to 463. The regional target is 400 by 2020 which is looking achievable. The unvalidated 2019/20 outturn for the number of children killed or seriously injured in road traffic accidents for the Liverpool City Region was 66. All were serious with no fatalities. The trend has been downward since 2016/17. Although not meeting the expected target, the number of children killed or seriously injured has decreased from the previous year (68).

38
Community Safety Portfolio
1. Key Portfolio Priorities
• To deliver the year 1 priorities identified in the 5-year Homelessness Strategy 2018-23 setting out the borough’s approach for tackling homelessness, including delivery of outreach services for vulnerable homeless groups, implementation of a pilot Housing First model in partnership with the Combined Authority and to implement a review of hostel accommodation for single people.
• To undertake a review of the Housing Allocations Policy to ensure that it is legally compliant with the requirements of the Homelessness Reduction Act and continues to meet the housing needs of the borough.
• Work to raise property and management standards in the private rented sector through the use of the powers available to the Council, ensure private rented properties are safe and healthy and to return long term vacant properties back into use.
• To work with partners to implement the Domestic Abuse Strategy 2018-23;
• To develop a revised Crime and Disorder Strategy for the borough based on a comprehensive needs analysis and to put in place effective governance arrangements to deliver the Strategy and support the priorities of the People’s Board.
• To support Merseyside Police in tackling violent and serious crime through the establishment of a pan-Merseyside Violence Reduction Unit.
• To deliver the savings required from the Supporting People Programme in accordance with the Council’s Budget Strategy.
• To support victims of crime and vulnerable people to assist community integration and cohesion.
• To deliver the priorities identified in the Annual Youth Justice Plan to prevent and reduce re-offending, promote public protection and provide effective support to effectively safeguard vulnerable children and young people.
• To implement the statutory Guidance for Taxi Licensing.
2. Progress Against Portfolio Priorities
• Housing and homelessness
Recruitment to the Housing Trailblazer posts was completed and the team is now working to implement referral pathways with agencies to prevent homelessness amongst those who have been identifies as being most at risk including, those discharged from the regular armed forces, prison release, hospital discharge cases, young people leaving care and rough sleepers.
A £100k Rough Sleeper Initiative (RSI) funding was secured from the Ministry of Housing, Communities and Local Government (MHCLG) for 2019/20 to support initiatives to tackle levels of rough sleeping in the borough. Funding has been used to develop a 3 bed ‘crash pad’ at the YMCA and to part fund a Rough Sleeper Co-ordinator with Halton Council. Towards the end of March 2020, the Council responded to the Government’s ask to bring every rough sleeper in. Every rough sleeper in the borough was given the opportunity of accommodation through the use of crash pads, Salvation Army facilities and commercial hotels.
Funding has been secured by the Combined Authority from MHCLG to undertake reviews of the Housing Allocations policies of all the local authorities across Merseyside. The aim of the review is to ensure that all policies are consistent with

39
the requirements of the Homelessness Reduction Act 2018 and to explore options for having a common set of criteria that will apply across the city region.
The Council was successful in bidding for £35K of Cold Weather Provision Funding from MHCLG which was used to establish an Enhanced Sit Up Service at the Salvation Army. This allowed rough sleepers to access emergency accommodation over the Winter months up to March 2020.
A successful bid was submitted to MHCLG for further Rough Sleeper Initiative funding for 2020/21.
Work continued on developing and implementing the Housing First Model across the Liverpool City Region with the recruitment of the Housing First Team by the Combined Authority. Each local authority has referred local information on Rough Sleepers to the Combined Authority and work has started on identifying those who may be eligible for housing and support through the Housing First approach. In total 92 potential applicants have been identified across the City Region, 11 of whom are from St Helens. Discussions began about implementing localised Housing First teams which when fully established in St Helens would be able to support 30 service users.
To support the Housing First initiative, the Combined Authority have commissioned an Assertive Outreach Service for rough sleepers which began in December 2019. This service targets those rough sleepers who are currently not engaging with services. A Homelessness Lived Experience Group was also established.
In the Private Rented Sector, a bid for the Rogue Landlords Enforcement Grant was successful, which will provide housing standards officers with body cameras. Work continues to improve conditions in rented properties and to bring long-term problematic vacant properties back in to use. In 2019/20, a total of 102 vacant properties were brought back into use, of this number 67 were long-term vacant properties.
• Crime and Disorder
Merseyside Police secured Home Office funding for 2019/20 to establish a multi-agency Violence Reduction Unit to tackle knife crime and serious violent crime. saw Safer St Helens community safety partnership awarded £67,000. In addition to this, additional ‘surge’ funding of £4.2m was secured by Merseyside Police to tackle these issues. Although the majority of this funding was targeted at funding additional policing cover, some funding was secured to fund community-based initiatives aimed at diverting young people away from criminal activity, which included:
o A focus on working with schools to prevent exclusions through sport
o Mobilization of community and voluntary groups to provide opportunities for young people
o Work alongside professionals and partners in Adverse Childhood Experiences to allow for a trauma-informed approach to be taken
o Delivery of an Outdoor Education pilot and outreach
Throughout the summer, Merseyside Police undertook a number of targeted campaigns. These involved Operation Sceptre in July to tackle knife crime, Operation Greenall to tackle youth anti-social behaviour and underage drinking and National Firearms Surrender.
At the end of the financial year, Community Safety reported on the impact of the VRP programme locally, including positive outcomes in engaging young people at risk of engaging in violence. However, the final weeks of service delivery were significantly impacted by the closure of schools and direct services due to Covid 19.

40
A commissioned project with Liverpool John Moore’s University on Behavioural Insights has been carried forward into 2020/21.
Hate Crime training for elected members was completed. A number of elected members agreed to act as Hate Crime Ambassadors. To promote reporting of hate crime libraries became reporting centres for those who wish to report hate crimes/incidents.
Operation Target included a range of activities to address Anti-Social Behaviour (ASB):
o Increased ASB outreach and diversionary activities
o Increased ASB sessional staff hours, to increase engagement with young people in parks and other hot spots across the borough
o 70 young people attended a cinema event
o During Halloween and bonfire period work was carried out alongside Police and Social Workers to deliver an Operation SafeSpace, to support young people at risk of becoming involved in ASB and/or at risk of exploitation.
• Domestic Abuse Strategy
In October 2019, St Helens Council held a Domestic Abuse Summit, bringing together partners across the borough to commence a discussion regarding how organisations can work together to tackle the issue of domestic abuse in our communities. Following the Summit, the St Helens People’s Board identified domestic abuse as one of the three priority areas for action. St Helens Council led on the development of a new Strategy, a partnership plan to tackle domestic abuse and ‘stop the silence’. To ensure that the Strategy is inclusive of the aims and objectives across the partnership, extensive consultation took place with a number of fora and a multi-agency group to collectively develop the priorities within the new Strategy and provided the Case Studies and statistics that also inform the new document. The Strategy was approved by Cabinet in March 2020.
The Strategy sets out a series of actions to challenge perceptions of abuse and raise awareness, highlighting issues such as coercive control, child to parent abuse and domestic abuse experienced by older people. The Strategy also recognises the need to safeguard children from the impact of domestic abuse and to ensure that timely and effective support is available for victims and their families. The Strategy also highlights the need to address the perpetrators of abuse by providing support for those who acknowledge their behaviour and to effectively hold to account serial perpetrators of abuse.
To assist the delivery of the Strategy, the service has appointed a Domestic Abuse Prevention Officer to focus on multi agency working and training in this area.
• Youth Justice
A restructure of the St Helens Youth Justice Service was approved in June 2019 to ensure that the service has the necessary capacity to support the health and education needs of young people supported by the service and to provide additional support for children who are looked after and for victims of crime through a Restorative Justice and Victim Liaison Coordinator post. The restructure is now complete with all posts recruited to. Work continues to finalise a speech and language therapy service pathway.
The Strategic Youth Justice Plan 2019/20 was approved by the Council in September 2019. The Plan sets out the priorities for the service which are to: prevent offending; reduce re-offending; protect the public and support victims and provide for the safety and welfare of children and young people in the Criminal Justice System.

41
• Asylum Seekers and Vulnerable Persons
The Council, via the Combined Authority has secured £40k funding over the next two years to deliver a community grant award scheme to fund services to support refugees, asylum seekers and vulnerable migrants. This funding is supplemented by a 50% match funding contribution from the Syrian Vulnerable Persons Relocation Scheme. The funding is being used to support not for profit organisations to help meet the language, health and wellbeing, communications and culture needs of refugees, asylum seekers and vulnerable migrants as well as support awareness campaigns within this community on hate crime and the reporting of this.
• Governance
Work commenced on the development of a Strategic Needs Assessment in relation to Crime and Disorder, along with analysing the findings of the recent Crime & ASB Resident Survey, both of which will inform the development of the new Safer St Helens Strategy. A workshop was held with partner agencies to review the current governance arrangements for the Community Safety Partnership. Both the reporting structure and the operational sub-groups have been reviewed and a report on the proposed revised arrangements is scheduled to go to the People’s Board on the 22nd of July for approval.

42
3. Performance Indicator Summary
Q1 Q2 Q3 Q4
16/17
Outturn
17/18
Outturn
18/19
OutturnJune Sep Dec Mar
Tie
r
1 SC-01Percentage rate in repeat victimisation for those domestic violence
cases being managed by a MARACLower 26.2 27.5 29.2 43 53.7 47.9 42.4 38.5 10.47% N/A
HS-06Number of households that are families with children living in
temporary accommodation. Lower 44 44 61 64 16 30 46 63 1.56% N/A
HS-08a
(New)
Average number of weeks spent in B&B accommodation for all
households who are in priority need and owed the main housing duty
under the Homelessness Reduction Act 2017
Lower N/A 1 10.4 10 0 0 0 0 100.00% N/A
HS-08b
(new)
Total number of weeks spent in temporary accommodation provided
by the LA (not B&B/refuge) for all households who have been
assessed as being owed the relief duty under the Housing Act 1996,
where these duties ended during the quarter and the Council
discharged their duty to the household
Lower N/A N/A N/A 10 12.1 13.3 12.6 12.7 -27.00% N/A N/A
SC-03Percentage of Community Safety Survey respondents reporting
feeling safe or fairly safe in their local areaHigher 72 73 60 78 N/A N/A N/A 50.6 -35.12% N/A
SC-07 Number of hate crime incidents report to agencies Higher 265 211 245 270 83 156 251 314 16.29% N/A
SC-08 Number of incidents of anti-social behaviour Lower 7466 6065 4470 5400 1,049 2,253 3,287 4,196 22.29% N/A
SC-12 The percentage of children re-offending Lower 43.1 57 50.8 45.3 42.4 47.6 47.6 40.7 10.20% 3rd Quartile
SC-13Number of Priority Families achieving significant and sustained
progressHigher 42 119 234 1,710 N/A N/A N/A 1,666 -2.60% N/A
SC-17The number of LAC receiving a substantive outcome as a percentage
of all youth justice substantive outcomesLower 13 17 26 20 - - - 29 -45.00% N/A
Comparative
Performance
Tie
r 2
Community Safety - 2019/20
Tier Ref Performance Indicator
Higher /
Lower is
better?
Past Performance19/20
Target
% Variance
from Target
DOT
(symbol)

43
3.1 Overview of Portfolio Performance
A total of 10 key performance indicators have been identified for the Community Safety Portfolio in 2019/20. At outturn 6 of the 10 indicators performed better than target, whilst 4 of the indicators failed to meet target, but with 1 within the 5 % tolerance.
3.2 What is performing well
• The rate of repeat victimisation for those domestic violence cases managed through the MARAC was 38.5% in 2019/20, which equates to 290 out of 753 cases. Performance was better than target, although the rate is higher than the previous year (215 out of 737, or 29.2% of cases). Performance remains within the range of the expected repeat rates for an established MARAC as specified by Safe Lives. Further analysis is however being undertaken to examine the increase in the repeat rate and work is also underway to examine the increase in referrals and repeat cases due to coercive and controlling behaviour. A Domestic Abuse (DA) Prevention Officer has been appointed and will focus on this area as well as reducing other aspects of DA.
• Over the course of the year there was a further reduction in the reported incidents of anti-social behaviour (ASB). A total of 4,196 incidents were reported, a 6% reduction on the number reported in the previous year. Activity during this year has included the diversionary activities delivered via the Violence Reduction Unit initiatives as well as traditional outreach services delivered during the Winter / Early Spring period. However, due to Covid 19 the ability to evaluate the impact on ASB of local projects has been limited. The end of this period also commenced the ‘lockdown’ period and a significant change to the nature of the ASB reported to the Council and its partners.
• The partnership achieved its goal of increasing the reporting of hate crime over the course of the year. A total of 314 incidents were reported, 69 more than in the previous year. Further joint working with the Hate Crime Co-ordinator from Merseyside Police took place including planning to front line services to ensure that the partnership is co-ordinated in their responses to this issue. This included supporting a leaflet drop in an area of the borough organised by the Office of the Police & Crime Commissioner and issuing a press release in response to local reports of stickers on street signage. The Service also continued to develop the #Betterthanthat campaign which was launched during the first quarter of 2020/21.
• The effective homelessness prevention work, has resulted in Housing Services performing better than target in respect of the number of families with children living in temporary accommodation and no households in priority need and owed the main homelessness duty who have needed to be placed in B&B accommodation. The Housing Options & Advice Service is working closely with the Under One Roof Choice-Based Lettings Team and Torus to identify and alleviate blockages to accessing social housing, and to work to open up routes to the private rented sector to accelerate the move on from temporary accommodation.
• The percentage of children re-offending has seen significant improvement, reducing to 40.7%. This is the latest nationally reported data for the period April 2017 to March 2018. Success is attributed to a change in focus to work around prevention and building community resilience, delivering bespoke training to care homes and social workers and promoting the national protocol to reduce the criminalisation of looked after children to ensure they do not enter the youth justice system unnecessarily.
• Although marginally below target, St Helens Priority Families indicator performed strongly. St Helens commenced the National Troubled Families Programme (known locally as Families First St Helens) in January 2015, agreeing to work with and ‘turn around’ the lives of 1710 families. For every family attached the Authority would

44
receive a payment of £1,000, whilst a further £800 was available via Payment by Results and would be available when progress against the 6 headline criteria’s (Crime/Anti-Social Behaviour, Poor School Attendance, Worklessness, Vulnerable Child, Domestic Violence and Health) could be evidenced. By the end of the programme St Helens was able to evidence progress for a total of 1,666 families (97.4%) within St Helens, bringing an additional £1,332,800 to the Local Authority, with a shortfall of 44 Families (a loss of £35,200).
3.3 What requires improvement and what is being done about it
• The total number of weeks spent in temporary accommodation provided by the LA (not B&B or refuge) for households assessed as being owed the main homelessness duty, has not met target. Steps have been taken to ensure regular meetings with housing providers to minimise delays in allocations, targets have been amended to reflect potential delay by RSLs and policies have been reviewed, so as to minimise the impact on the clients.
• The annual Community Safety Survey (CSS) shows that perceptions around feelings of safety have reduced by 9.4% in 2019/20 to 50.6%. However, the number of respondents was much greater in 2019/20 compared to the previous year. In 2019/20, 623 respondents felt very safe or fairly safe in their local area compared to 183 in 2018/19. Analysis will be conducted into the decrease in perceptions of safety and a Communications Strategy will be developed to try to increase perceptions of safety within communities,
• In 2019/20, a total of 63 St Helens children received a substantive outcome and of these 18 were Looked After Children of St Helens, giving an outturn for the year of 29%. This compares to 26% in 2018/19 and therefore indicates a worrying increase. The disproportionate number of children in care in the criminal justice system was identified as a key local issue some years ago and the Youth Justice Service reports performance in this area regularly to the Partnership Board. Every Looked After Children (LAC) case that comes through the Court or from Police is scrutinised by the Head of Service to ensure that outcomes are defensible and proportionate and escalated appropriately within the partnership it is felt that they are not.
In response to the National Protocol for the reduction of unnecessary criminalisation of LAC, the Youth Justice Service have taken action to ensure that the 10-point plan is utilised by Police and Care Homes in every LAC case that comes to court. Training has been delivered within the local care environment in an effort to reduce the number of children being prosecuted for behaviour that would not warrant police involvement, were this to take place in a family home environment. Children that are arrested are appropriately supported through the process, with staff fully sighted on the support that should be offered.
In the last year two pieces of guidance have been developed which are specifically designed to help inform care staff and foster carers in their initial decision to involve the police at all when dealing with incidents within the Care environment. The Youth Justice Service have also collaborated with the Care Leavers Association and children’s social care to develop a localised strategy and action plan aimed at Reducing Offending by Children Looked After (ROCLA). This is to be underpinned by the views and experiences of our current Looked After Children ensuring the Partnership can develop a more localised and focused response to helping our most vulnerable children to desist from criminal justice involvement. This received formal approval at the last Care Leavers Board and is currently underway. The Head of Service has also met with chief police officers for the area in order to look at how we can strengthen police understanding across Merseyside to ensure that our children living in out of area placements are supported more consistently when brought into an out of area police custody suite for questioning or charge. To this end, we prepared a briefing for Police Decision Makers which has since been shared across

45
Merseyside to try and create more consistency and uniformity for how children looked after are dealt with by Police.

46
Corporate Services, Estates &
Communication/Finance/Leaders Portfolios
1. Key Portfolio Priorities
• Ensure the continuation of sound financial management practices, standards and statutory duties, the delivery of a revised financial strategy, and the implementation of agreed savings proposals.
• Ensure the effective maintenance of strong governance arrangements, covering strategic planning, performance management, risk management, and internal audit.
• Provide innovative and responsive support across the wider organisation to assist the delivery of the Council’s strategic objectives and the ‘One Council’ modernisation programme.
• Develop the Council’s internal and external communications through all relevant channels as a listening and responsive organisation.
• Engaging better with the community and ensuring the delivery of responsive and effective customer services.
• Support a modern, well trained, motivated and effective workforce.
• Consider the effectiveness of current overview and scrutiny functions to ensure that future arrangements are effective and aligned with the Council structure and priorities.
• Continue to identify the opportunities and challenges stemming from the Council’s involvement and participation in the Liverpool City Region Combined Authority and promote the Council’s wider profile for the benefit of St. Helens and its communities
2. Progress Against Portfolio Priorities
Over the course of 2019/20 the Portfolio continued to focus on ensuring the sound governance of the Council and to meeting all statutory and legal duties, whilst adding value to the wider organisation through the support provided to a programme of modernisation to ensure the future delivery of efficient and effective local public services. Some of the key areas of activity included
• Finance
Work continued on the development of the Council’s Financial Strategy. The previous Resource Forecast was revisited, and a sensitivity analysis was ongoing around factors within the budget model to identify possible best and worse-case scenarios going forward. This incorporated potential additions to the base budget to address demand pressures and proposed revisions to structures within Children’s Services. This position was further informed by the Government Spending Round in September and the provisional and final Finance Settlement respectively in December and February. Work was ongoing in providing support in relation to budget savings options for Members to inform political decisions around the future budget. Public consultation on the budget for 2020/21 was undertaken in January and February. A number of Budget Reports were presented to Cabinet over the course of the year and a final one-year revenue and capital budget for 2020/21 was approved by Cabinet and Council respectively in February and March. Strong financial management practice continued resulting in an unqualified opinion on the Council’s Statement of Accounts and a sound external auditors Value for Money judgement.

47
• LGA Engagement
Engagement continued with representatives from the Local Government Association, staff and Members to ensure the production of revised formats for both financial and performance reports to Cabinet. Following engagement with the LGA, new quarterly report formats were produced for the Quarterly Financial Report and the Quarterly Performance Report. The reports continued to evolve over the course of the year.
• Organisational Capacity and Structure
The review of workforce capacity commenced with the initial priority focus on Children’s Services. A Children’s Services Workforce Dashboard has been produced and a similar exercise commenced in Adult’s Services. Potential providers have been approached and demos held with a view to procuring a new HR system with more sophisticated workforce planning tools.
Phase 1 of a revised Council Senior Management Structure covering the Executive Leadership Team, Corporate and People’s services was agreed by Council in December. Phase two will focus on the structure for Place Services and People’s Safeguarding. Kath O’Dwyer was appointed as the Council’s new Chief Executive in December and further appointments for the Assistant Chief Executive and Strategic Director of Place services were made in January. A designated Director of Children's Services post was established in February 2020 and this is currently being delivered on an interim basis whilst recruitment is underway. A wider organisational assessment is underway in response to Covid19 reset and recovery and restructuring plans are being developed for the new Council model.
• ‘One Council’ Modernisation Programme
A 'One Council' modernisation programme was developed to act as a delivery plan to help the council modernise, while placing the resident or customer at the heart of what we do. The programme was broken down into eight manageable work-streams, which were progressed over the course of the year.
The modernisation programme continued with the appointment of an interim programme manager and with planning sessions with work-stream leads commencing in November. A ‘One Council Plan on a Page’ overview workplan was produced and work continued to determine the detailed outcomes sought across the 8 programme workstreams. Progress against a number of these workstreams in summarised below.
o Work on the review and refresh of the Council Plan commenced with facilitated workshops with both Members and senior officers taking place to shape priorities and objectives. This led to the production of a draft plan which was approved subject to future consultation with the community and partners. The draft plan will also be subject to review during 2020/21 to take account of reset and recovery activity linked to the Covid-19 crisis.
o Improvements to strategic communications continue with approval granted for investment in a new council website, intranet and a customer relationship management system. Work is also underway on a new Communication Strategy. The new weekly newsletter ‘All about us’ is becoming more embedded and its use promoted across all sections of the Council, with good feedback received from staff. The Council’s reach and engagement on Facebook has been expanded and a new corporate Instagram account was launched.
o Development of a Customer Services Journey Improvement Plan commenced. Baseline and trend analysis of the Customer Journey was completed. A workshop with a number of stakeholders was held and a Draft Customer Journey report completed and circulated to key officers and

48
Members with conclusions and proposed recommendations. A new draft Customer Service Strategy and Customer Service Standards policies are currently being finalised.
o Work continued on the modernisation of HR policies and procedures, with refinements made to induction processes and IT arrangements for new starters. A ‘Welcome to St Helens’ section of the Council website is being developed to provide open access to all induction documentation.
o The strategic review of IT has now been completed. Business Partnering arrangements were explored and proposals developed. 12 independently facilitated IT focus groups were completed with a cross section of over 100 staff attending from across the Council. A report and learning were compiled, and work has continued to progress the action plan. Key actions include improving the service desk, improving communications and business relations with users and modernising a number of IT applications.
o The implementation of agile working progressed with work continuing on the Asset Strategy and workforce accommodation. The completion of the rollout of Surface Pros, the transfer to Microsoft Outlook and the implementation of O365 across the workforce were all successfully completed ahead of schedule and in place to enable home working during the Covid-19 pandemic. The mapping of business needs has been completed and is being evaluated to inform a Strategic Asset Management plan. Work is ongoing to examine the feasibility of turning Wesley House into an agile workspace and the roll out of agile working technology across the council has continued at pace with an end date during Autumn anticipated.
o The Employee Wellbeing Survey was successfully completed, with strong levels of participation from staff and the results collated. Analysis has been completed and a number of key themes have emerged, which will inform the new Organisational Development Strategy and revised Council values and beliefs. Discussions are underway with external providers to facilitate support on a culture and values review and the introduction of Leadership and Management training. Approval was gained for the appointment of a Head of Organisational Development.
o Terms of reference for the Workplace Health and Wellbeing Board were established. The group continue to work on a Workplace Mental Wellbeing Strategy and Action Plan. The roll out of Mental Health First Aiders commenced and the Managing Stress programme for managers was undertaken with positive feedback. The Workplace Health and Wellbeing Board has continued to consult and engage on reward and recognition strategies for employees alongside well-being initiatives across the Council. A draft enhanced employment offer was approved by Executive Directors, which was rolled out to staff in February 2020.
o The reconfiguration of Scrutiny Panels will be revisited with the new Chair of the Overview and Scrutiny Commission as part of the consideration of the revised statutory guidance on Overview and Scrutiny. The Scrutiny Annual Report was completed and presented to Council in October.
• Covid-19 Response
In the run up to the end of March 2020 and the announcement of the national lockdown, the Council reacted at speed to implement Government policy and national guidance to limit the spread of the virus, protect the health of all our residents and ensure the most vulnerable in our communities are safe and cared for. New governance structures were quickly established including a Covid-19 Strategic Group, which is coordinating the Council response to the pandemic in the context of the Merseyside Resilience Forum and its constituent groups.

49
Response phase planning was quickly implemented across services to provide an effective range of support for residents and communities. Important information was regularly communicated to the public and staff via a range of channels. All staff except those in essential services were asked to work remotely and staff voluntarily redeployed to support the response.
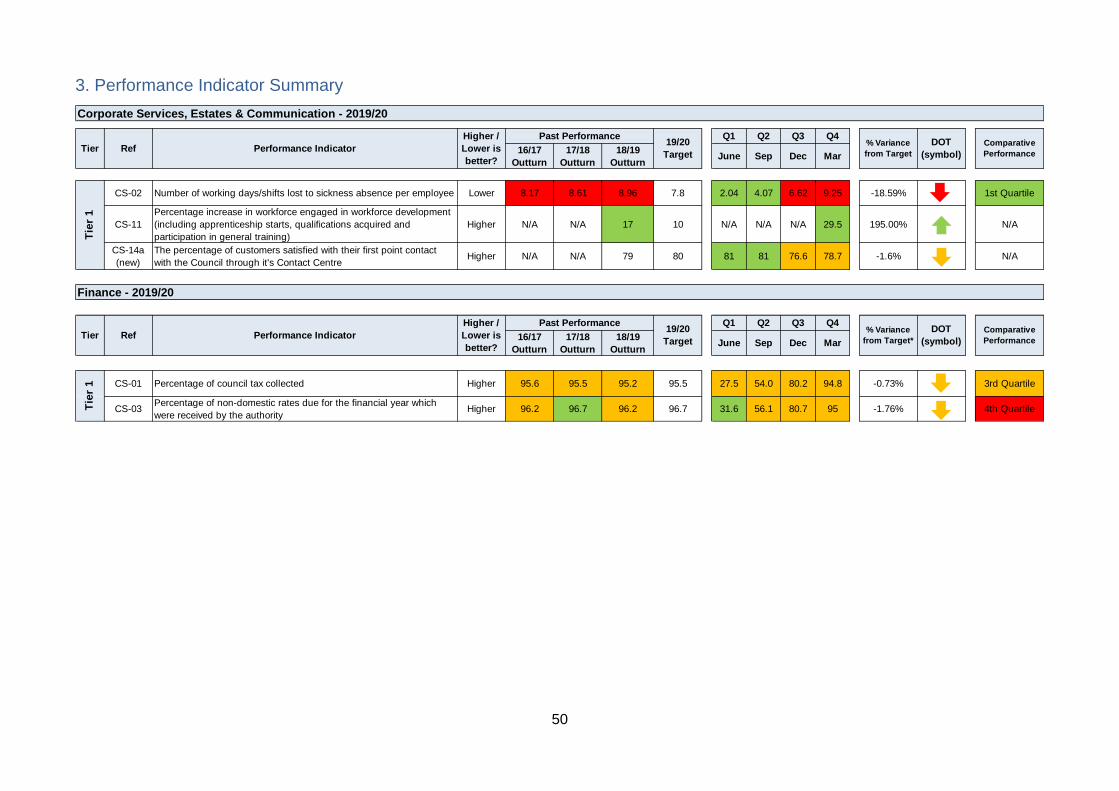
50
3. Performance Indicator Summary
Q1 Q2 Q3 Q4
16/17
Outturn
17/18
Outturn
18/19
OutturnJune Sep Dec Mar
CS-02 Number of working days/shifts lost to sickness absence per employee Lower 8.17 8.61 8.96 7.8 2.04 4.07 6.62 9.25 -18.59% 1st Quartile
CS-11
Percentage increase in workforce engaged in workforce development
(including apprenticeship starts, qualifications acquired and
participation in general training)
Higher N/A N/A 17 10 N/A N/A N/A 29.5 195.00% N/A
CS-14a
(new)
The percentage of customers satisfied with their first point contact
with the Council through it's Contact CentreHigher N/A N/A 79 80 81 81 76.6 78.7 -1.6% N/A
Q1 Q2 Q3 Q4
16/17
Outturn
17/18
Outturn
18/19
OutturnJune Sep Dec Mar
CS-01 Percentage of council tax collected Higher 95.6 95.5 95.2 95.5 27.5 54.0 80.2 94.8 -0.73% 3rd Quartile
CS-03Percentage of non-domestic rates due for the financial year which
were received by the authorityHigher 96.2 96.7 96.2 96.7 31.6 56.1 80.7 95 -1.76% 4th QuartileT
ier
1T
ier
1
Finance - 2019/20
Tier Ref Performance Indicator
Higher /
Lower is
better?
Past Performance19/20
Target
% Variance
from Target*
DOT
(symbol)
Comparative
Performance
Corporate Services, Estates & Communication - 2019/20
Tier Ref Performance Indicator
Higher /
Lower is
better?
Past Performance19/20
Target
% Variance
from Target
DOT
(symbol)
Comparative
Performance

51
3.1 Overview of Portfolio Performance
A total of 5 key performance indicators have been identified across the Portfolios in 2019/20. At year end 4 of the 5 indicators have not met target, 3 of which are within a 5% tolerance of target. One of the 5 indicators has shown improvement.
The comparator data used for the tax collection measures is nationally published data for 2018/19 financial year. The HR comparative performance data relates to 2016/17. The comparators used are the CIPFA Nearest Neighbours Model.
3.2 What is performing well
• There was a 29.5% increase in numbers of the workforce engaged in workforce development. The year saw significant increases in corporate and departmental training undertaken. There will be a need to sustain this improvement going forward and ensure there are effective organisational development plans in place to engage, support and develop the workforce to address the short, medium and long-term consequences of COVID-19. The Training Section is currently being restructured to ensure that resources are aligned to effectively support and progress the Council wide Organisational Development approach.
3.3 What requires improvement and what is being done about it
• The average number of days lost to sickness absence per employee at the end of 2019/20 was 9.25 days, worse than the same period the previous year (8.96 days). Sickness absences in the Quarter 3 (ending December 2019) and Quarter 4 (ending March 2020) were higher than projected at the start of the year. This was a result of an increase in "winter type" illnesses, such as coughs, chest infections and other respiratory problems, together with flu like symptoms and fevers. In a number of cases these absences lasted for longer than would have normally be anticipated and affected some employees who otherwise had good attendance levels. March was also affected by absences related to similar type illnesses, which could then be attributed to Covid-19. Support to identified service areas and the reinforcement of the effective application of the Attendance Management policy, including appropriate escalation continues to assist in the effective control of regular attendance. The Policy is currently subject to its scheduled review and is being amended to ensure that it remains fit for purpose to enable attendance to be effectively managed.
• Almost 79% of people responding to the Customer Service Survey were satisfied with their first point of contact with the Council through the Contact Centre. Key reasons for dissatisfaction were that the customer’s problem was not resolved, a response from the council was not received or the customer had to contact the Council more than once to chase an issue. There is an ongoing challenge to improve customer satisfaction through the One Resident strand of the One Council modernisation programme. The delivery of the new CRM system will assist in the provision of better intelligence to improve customer service and relations.
• The Council Tax collection rate at the end of 2019/20 is 0.7% below target and 0.4% down on the previous year. The debit is increasing year on year and the Council Tax Reduction scheme cases still having an effect. These affect the in-year collection rate as it takes time to set up direct deductions from benefit, as a liability order has to be obtained first, but should be collected over future years. A dedicated recovery team has been created and work has been undertaken to identify and protect the most vulnerable residents and adapt our collection processes appropriately. The main focus is to collect the Council Tax in a timely manner.
• The Non-Domestic Rate collection rate at the end of 2019/20 is down 1.7% against target and 1.2% down on the previous year. This is due to several reasons. The collection rate is now less reliant on the large good payers, such as Pilkington that can skew performance upwards. In year performance also reduced by some late assessments which were not fully collected within year, including Amazon and Superbowl, which account for nearly 1% in the

52
reduction of the rate from the previous year. Business administrations including Ena Shaw also impacted on the final collection rate. The normal proactive recovery push at year-end was also compromised by the Covid-19 lockdown. The economic environment is increasingly challenging, with some businesses struggling or closing. Some ratepayers chose to defer their March instalment. Although in relation to the latest available published comparative data St Helens is bottom quartile within its comparator group, the margins between the quartiles remain small. In response the service continues to work with Legal services to enforce recovery of outstanding debt and take steps to combat tax avoidance and evasion.