
Performance Monitoring Of The Apache Web Serverbochmann/Curriculum/Pub/Theses/Master-these… · 1...
77
1 Performance Monitoring Of The Apache Web Server By Radha Subrahmanyan Student Number: 1232357 An engineering report submitted to the School of Information Technology and Engineering at the University of Ottawa in Partial fulfillment of the requirements for the degree of Masters in Engineering Ottawa, Ontario 1999
Transcript of Performance Monitoring Of The Apache Web Serverbochmann/Curriculum/Pub/Theses/Master-these… · 1...

1
Performance Monitoring
Of The
Apache Web Server
By
Radha Subrahmanyan
Student Number: 1232357
An engineering report submitted to the School of Information
Technology and Engineering at the University of Ottawa in
Partial fulfillment of the requirements for the degree of
Masters in Engineering
Ottawa, Ontario 1999

2
I hereby declare that I am the soul author of this engineering report. Iauthorize the University of Ottawa to lend this report to otherinstitutions or individuals for the purpose of scholarly research.
Radha Subrahmanyan
I further authorize the University of Ottawa to reproduce this report byphotocopying or by other means, in total or in part, at the request ofother institutions or individuals for the purpose of scholarly research.
Radha Subrahmanyan

3
Abstract
Any electronic commerce application is often composed of a set of co-operating
pieces of software that may or may not be on the same machine. For a popular
EC service, it is obvious to note that there is a need for more than one EC server,
i.e. replicated servers. A system consisting of several servers should contain a
central entity, or broker as it is referred to in this report, that should keep track of
how the servers are performing. Since an e-commerce application is very
dynamic, the server performance would vary in time. This report describes the
design and construction of a software system that monitors the performance data
on each server and collects this data at regular intervals at the central broker.
The broker can then decide which servers should handle the incoming client
transactions. As a result, the client requests are handled by the server that can
provide the best performance, thus improving the overall efficiency of the multi-
server system.

4
Acknowledgments
First I would like to thank my supervisor, Dr. Gregor von Bochmann, whose
patience limits must have been set at new levels during the preparation of this
work. I learned many things from him, even though, most of them implicitly rather
than explicitly. I would like to thank my colleagues in the Distributed Systems
Research Group for their cooperation and friendship and I think I should specially
mention Khalil El-Khatib from the University of Ottawa and Mohamed-Vall O. M.
Salem from the University of Montreal.
I would also like to express my gratitude to my family especially my husband,
Ashok, without whose valuable help and technical guidance, this work would
have been impossible.
Radha Subrahmanyan

5
List of Figures
FIGURE 1: OVERALL SYSTEM SETUP.......................................................................................................13
FIGURE 2: SYSTEM MODULES.................................................................................................................14
FIGURE 3: APACHE SERVER IMPLEMENTATION.......................................................................................22
FIGURE 4: ARM API INSTRUMENTATION................................................................................................24
FIGURE 5: GLOBAL SHARED MEMORY AND EVENT.................................................................................32
FIGURE 6: SHARED MEMORIES AND EVENTS FOR APACHE CHILDREN....................................................37
FIGURE 7: ORDER OF EVENTS BETWEEN THE AGENT AND THE BROKER .................................................57
FIGURE 8: SIMPLISTIC FINITE STATE MACHINE DIAGRAM FOR THE AGENT STATES .................................59

6
List of Contents
ABSTRACT ........................................................................................................................................... 1
ACKNOWLEDGMENTS...................................................................................................................... 4
LIST OF FIGURES ............................................................................................................................... 5
LIST OF CONTENTS ........................................................................................................................... 6
1 INTRODUCTION .......................................................................................................................... 8
1.1 OBJECTIVE ................................................................................................................................ 91.2 GENERAL REQUIREMENTS OF THE PROJECT................................................................................. 91.3 WORK PERFORMED...................................................................................................................111.4 CONSTRAINTS...........................................................................................................................111.5 HOW TO READ THIS REPORT.......................................................................................................12
2 SYSTEM OVERVIEW..................................................................................................................13
2.1 CONTEXT OF EC SERVERS WITH THE BROKER.............................................................................132.2 ARCHITECTURAL DIAGRAM.......................................................................................................142.3 FUNCTIONS OF THE MONITORING AGENT ....................................................................................15
2.3.1 Collecting raw data..........................................................................................................152.3.2 Building performance report ...........................................................................................152.3.3 Calculating the monitoring parameters ...........................................................................16
2.4 QOS BROKER PROTOTYPE .........................................................................................................16
3 RAW DATA COLLECTION........................................................................................................18
3.1 AN INTRODUCTION TO THE ARM API........................................................................................183.1.1 Overview of the ARM API Function Calls .......................................................................19
3.2 INTRODUCTION TO THE APACHE SERVER ...................................................................................213.2.1 Overview of the Apache implementation ..........................................................................213.2.2 Instrumentation of the Apache with ARM API function calls..........................................23
3.3 INITIALIZATION OF THE MONITORING AGENT .............................................................................253.3.1 IPC between the agent and the server ..............................................................................27
4 INTERFACE BETWEEN THE AGENT AND THE ARM-INSTRUMENTED APACHE.........29
4.1 COMMUNICATION THROUGH SHARED MEMORY AND RELATED EVENT..........................................294.1.1 Implementation of the ARM-instrumented Apache using Shared Memory .....................294.1.2 Implementation of the agent using Shared Memory ........................................................37
4.2 COMMUNICATION USING PIPES ..................................................................................................394.2.1 Implementation of the ARM-instrumented Apache using Pipes......................................394.2.2 Implementation of the agent using Pipes ........................................................................41
4.3 CALCULATING PERFORMANCE PARAMETERS..............................................................................454.3.1 Calculation of mean response time ..................................................................................454.3.2 Calculation of the load on the server ...............................................................................464.3.3 Calculation of the capacity of the server ..........................................................................464.3.4 Calculation of the utilization of server .............................................................................464.3.5 Calculation of the think time of clients ............................................................................46
5 INTERFACE BETWEEN THE MONITORING AGENT AND THE QOS BROKER ............49
5.1 MESSAGE PARAMETERS ............................................................................................................495.1.1 Monitoring agent identification parameters.....................................................................495.1.2 Server parameters ............................................................................................................505.1.3 Performance report parameters .......................................................................................50

7
5.2 MONITORING SESSION PARAMETERS..........................................................................................515.3 MESSAGES SENT FROM THE MONITORING AGENT .......................................................................535.4 MESSAGES SENT FROM THE QOS BROKER ..................................................................................555.5 ORDER OF EVENTS BETWEEN THE BROKER AND THE AGENT ........................................................575.6 THE STATES OF THE MONITORING AGENT...................................................................................585.7 IMPLEMENTATION OF THE INTERFACE BETWEEN THE BROKER AND AGENT...................................60
6 MANUAL TEST SCENARIO.......................................................................................................64
7 CONCLUSIONS............................................................................................................................66
8 APPENDIX A – MONITORING AGENT CODE ........................................................................67
9 APPENDIX B – ARM INSTRUMENTED APACHE SERVER CODE (LOGAGENT.C) ..........68
10 APPENDIX C – PROTOTYPE QOS BROKER CODE...........................................................70
11 APPENDIX D – GENERAL USER GUIDELINES ..................................................................73
12 APPENDIX E – COMPILING THE MODULES .....................................................................76
REFERENCES......................................................................................................................................77
8
1 Introduction
It is hard to imagine conducting business around the globe nowadays without
computer systems, networks, and software. We distribute and search for
information, communicate with each other, and transact business. The
computers themselves get faster, smaller, and less expensive while the networks
are faster, have more capacity, and are more reliable. However, no matter how
much applications change, administrators and analysts responsible for the
applications care about the same questions they have always cared about, such
as,
• Are transactions succeeding or failing?
• If transactions fail, where is the failure? What is the cause of the failure?
• What is the response time experienced by the end user?
• Where are the bottlenecks? Which sub-transactions of the user transaction
are taking too long?
• Who uses the application and how many of which transactions are they
using?
• How can the application or environment be tuned to be more robust and to
perform better?
Such data are especially valuable in today’s rapidly growing electronic commerce
applications. This project aims at collecting such information from within an
application and passing it on to a central entity which then, based upon this

9
knowledge, reschedules the client requests, thus improving the overall
performance of the system.
1.1 Objective
The main objective of this project is to build a system to monitor the performance
of a Web server by monitoring server-specific information such as the load on the
server, or user-specific information such as the server utilization, the mean
response time over a specified interval, the time between successive requests
from a given client as received by the server etc. This has been achieved by
implementing a software program called the monitoring agent on the same
machine as the server. This program taps the server to obtain some key pieces
of information about the server and then calculates the above parameters. Upon
collecting this information, a separate entity called QoS broker, which runs on a
separate machine, can take steps to better schedule the subsequent client
requests among the available servers in order to achieve maximum resource
utilization and minimum response time for the overall system.
1.2 General Requirements of the project
As mentioned earlier, there are 3 major entities involved in building the
performance monitoring system for the Web server under consideration. These
modules are the server, a monitoring agent, and a QoS broker. The following
gives the requirements for these three entities for the proper functioning of the
monitoring system.

10
1. The performance monitoring system will use the ARM API function calls
(about which we learn in detail in Section 3.1.1) which are inserted in the form
of probes within the application in order to collect some raw application
performance data. The idea is to make the application almost unaware of the
introduction of these probes, i.e. the application functioning should be
unaffected by the incorporation of these measurement probes.
2. The information collected should be used to calculate application parameters.
This is done by another entity, called the monitoring agent, which could sit on
the same machine as the application itself.
3. The monitoring agent should use a generic performance reporting protocol
based on UDP/IP, to transmit the performance parameters, in the form of
“performance reports” to the QoS broker. The performance parameters to be
calculated are the load on the server, the mean response time for user
transactions, the server utilization, time between successive requests from
the same client, which is termed “think time” for that client, and so on. The
broker then reschedules the client requests based on these performance
reports.
4. The Performance Reports should be as accurate and reliable as possible.
5. The Monitoring agent should send these performance reports periodically to
the QoS broker, with the periodic interval suggested by the QoS broker.
6. The Monitoring agent must also handle asynchronous queries from the QoS
broker, other than sending the periodic reports, if such a necessity should
arise.

11
1.3 Work Performed
Based on the requirements as mentioned above, I designed a performance
monitoring system for the Apache Web server, using the ARM measurement
interface. This involved identifying the parts of the server code, which deal with
user transactions and inserting the ARM API function probes at these points. I
then designed a monitoring agent, which collects the raw data from the Apache
server and uses them to calculate server performance parameters. Some
examples of the raw data collected are: the time at which a transaction starts, the
time at which it stops, how many transactions are currently getting processed etc.
These data are used to calculate server parameters like response time,
utilization, load and so on. I also designed a QoS broker prototype (a more
complete implementation of which will be done by my colleague, Mohamed-Vall
O. M. Salem) which gathers the “performance reports” from the monitoring agent.
Mohamed and myself mutually agreed upon the protocol used for communication
between the monitoring agent and the QoS broker, as well as on the server
parameters that are needed for eventually allocating the client requests to the
various servers.
1.4 Constraints
As mentioned earlier, the objective of this project is to implement a performance
monitoring system for a Web Server. Although the implementation itself has been
made very generic, it has been built specifically for the Apache Web Server. The
reason for this is that the Apache source code is available as freeware. In order
to measure the capabilities of the Apache server, monitoring points (probes)
12
have been inserted within the Apache code. This is done using the Application
Response Measurement (ARM) API functions available through Tivoli Systems
(IBM) and Hewlett-Packard, also as freeware. Also this implementation has been
done specifically for a Windows NT environment and will therefore need to be
ported for other non-Windows platforms. Thus this entire project is limited to the
above-mentioned environment only.
1.5 How to read this report
Section 2 of this report gives an overview of the project. It then explains the raw
data collection in Section 3. In Section 4, the interface between the agent and the
Apache server is explained in great details. In Section 5, the interface between
the agent and the QoS broker is explained in detail. The report then explains in
Section 6 how the system is tested with a sample test scenario. After a brief
section on conclusions and some ideas on how this work can be extended to
include different types of server performance parameters for different types of
server, in Section 7, there are the appendices. The appendices contain the
source codes of the three modules, and some explanation on how to compile and
use the system. The references point the reader to some useful books and web-
sites.
The reader is advised to read Sections 1, 2 and 3 in sequence. Sections 4 and 5
and the appendices could be read in any order. Happy reading….

13
2 System Overview
2.1 Context of EC servers with the broker
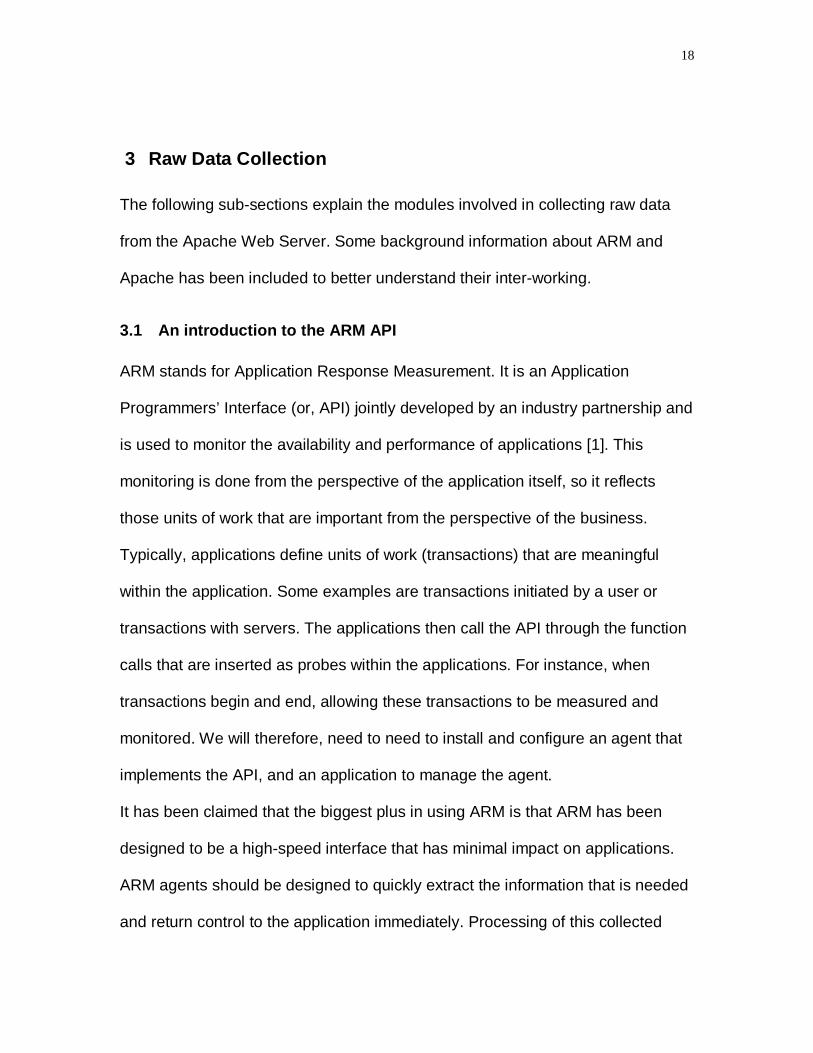
Figure 1 shows the hardware setup for the overall system. As seen here, the
QoS broker first receives the client requests. The broker gets performance
reports from the various servers and based upon these performance reports the
broker schedules the user requests. The performance reports are built by a
monitoring agent which can reside on the same machine as the server itself.
After this negotiation, the server handles the client requests. The monitoring
helps improve the overall response times of client requests by adjusting the load
of each server.
QoS broker
Negotiation
Negotiation
Negotiation
Monitoring
Monitoring
Monitoring
Server 1
Server 2
Server n
Client
Client
Client
Client
Request / Response
Figure 1: Overall system setup

14
2.2 Architectural Diagram
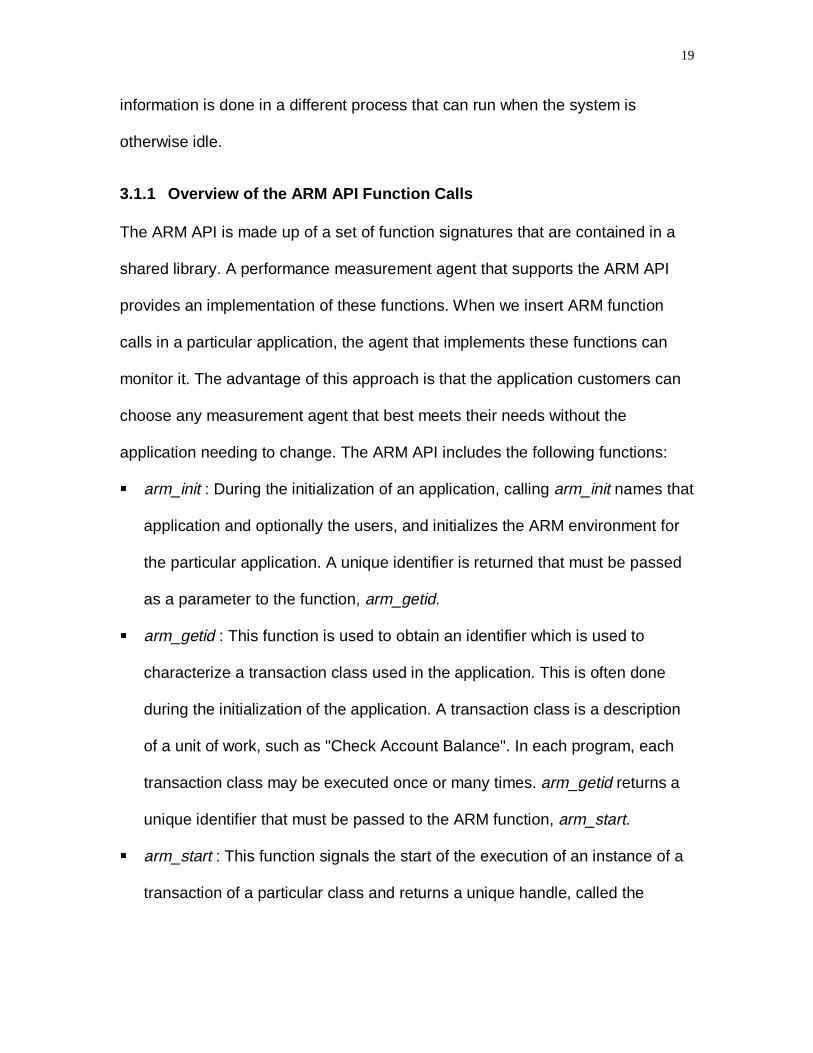
Figure 2 below shows the entire system that consists of the monitored
application, i.e. Apache Web server, the monitoring agent, which resides on the
same machine as the application itself and the QoS broker which resides on a
separate machine.
On the same machine
Apacheserverapplication
Monitoringagent
Pipes / SharedMemories
QoSbroker
UDP/IPsockets
Figure 2: System Modules
The parameters that need to be measured from the Apache Web server (see
Section 1.2) are gathered using ARM API function calls as probes within the
server code. The monitoring agent, which resides on the same machine as the
application, gathers this “raw data” from the application and consolidates it in the
form of performance reports that are sent to the QoS broker. The inter-process
communication (IPC) between the Apache server and the monitoring agent is
either by means of shared memories and associated events, or through pipes,
depending on what has been selected at compile time. The IPC between the
QoS broker and the monitoring agent is through UDP/IP sockets. The interface
between the two entities is defined using a proprietary protocol, termed
“performance reporting protocol”, and was mutually agreed upon by Mohamed-
15
Vall O. M. Salem from the University of Montreal and myself. Later in the report,
we shall look into the details of these system modules as well as the interfaces
between them.
2.3 Functions of the monitoring agent
The functions of the monitoring agent, or agent for short, can be broadly
classified as follows:
2.3.1 Collecting raw data
The very first function of the monitoring agent is to collect Apache performance-
related raw data. This is done using the ARM API function calls within the
Apache code as has been mentioned earlier in the report.
2.3.2 Building performance report
The raw data collected are used to further calculate the performance parameters,
such as the load on the server, the utilization, the mean response times, etc.
These performance parameters are used to form “performance reports” and the
reports are passed on to the QoS broker. Thus the monitoring agent has to
communicate on one end with the application and on the other end, it passes
calculated parameters about the application to the QoS broker. The agent sends
the same reports to the broker whenever it receives an asynchronous status
query from the broker.
16
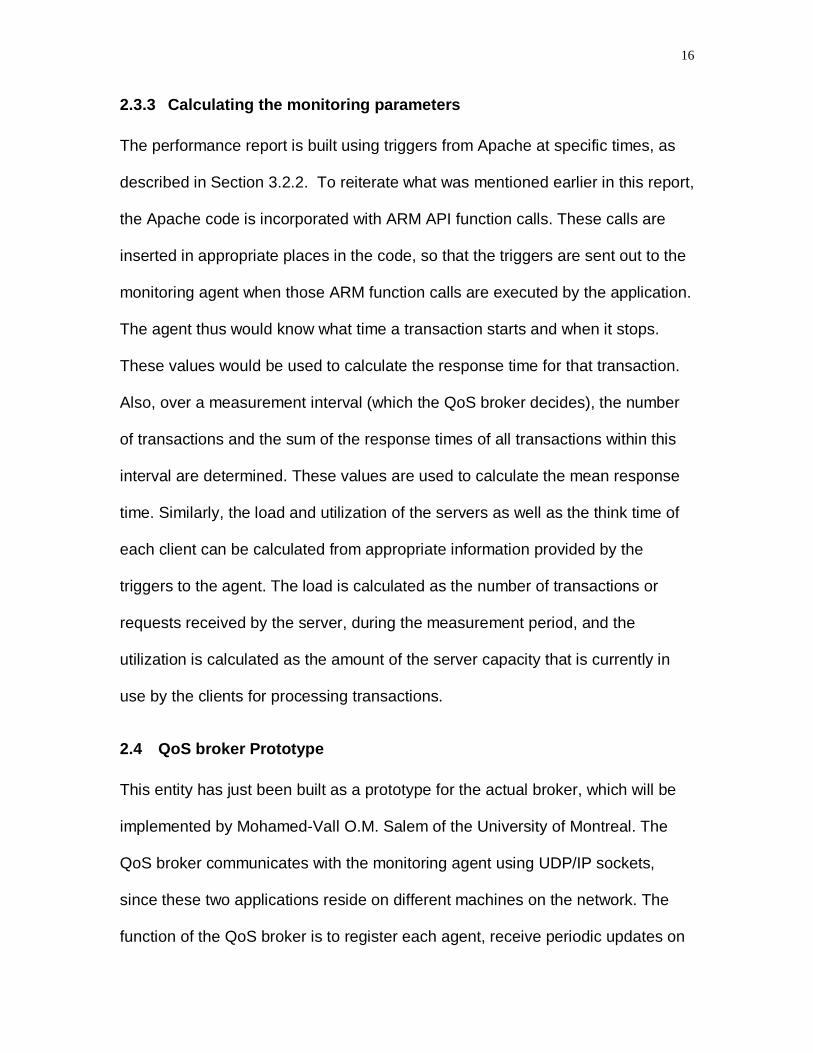
2.3.3 Calculating the monitoring parameters
The performance report is built using triggers from Apache at specific times, as
described in Section 3.2.2. To reiterate what was mentioned earlier in this report,
the Apache code is incorporated with ARM API function calls. These calls are
inserted in appropriate places in the code, so that the triggers are sent out to the
monitoring agent when those ARM function calls are executed by the application.
The agent thus would know what time a transaction starts and when it stops.
These values would be used to calculate the response time for that transaction.
Also, over a measurement interval (which the QoS broker decides), the number
of transactions and the sum of the response times of all transactions within this
interval are determined. These values are used to calculate the mean response
time. Similarly, the load and utilization of the servers as well as the think time of
each client can be calculated from appropriate information provided by the
triggers to the agent. The load is calculated as the number of transactions or
requests received by the server, during the measurement period, and the
utilization is calculated as the amount of the server capacity that is currently in
use by the clients for processing transactions.
2.4 QoS broker Prototype
This entity has just been built as a prototype for the actual broker, which will be
implemented by Mohamed-Vall O.M. Salem of the University of Montreal. The
QoS broker communicates with the monitoring agent using UDP/IP sockets,
since these two applications reside on different machines on the network. The
function of the QoS broker is to register each agent, receive periodic updates on

17
the performance of the application associated with that agent and when
necessary, to query the agent asynchronously. This protocol between the agent
and the QoS broker was agreed upon mutually by the author and Mohamed-Vall
O.M. Salem.
18
3 Raw Data Collection
The following sub-sections explain the modules involved in collecting raw data
from the Apache Web Server. Some background information about ARM and
Apache has been included to better understand their inter-working.
3.1 An introduction to the ARM API
ARM stands for Application Response Measurement. It is an Application
Programmers’ Interface (or, API) jointly developed by an industry partnership and
is used to monitor the availability and performance of applications [1]. This
monitoring is done from the perspective of the application itself, so it reflects
those units of work that are important from the perspective of the business.
Typically, applications define units of work (transactions) that are meaningful
within the application. Some examples are transactions initiated by a user or
transactions with servers. The applications then call the API through the function
calls that are inserted as probes within the applications. For instance, when
transactions begin and end, allowing these transactions to be measured and
monitored. We will therefore, need to need to install and configure an agent that
implements the API, and an application to manage the agent.
It has been claimed that the biggest plus in using ARM is that ARM has been
designed to be a high-speed interface that has minimal impact on applications.
ARM agents should be designed to quickly extract the information that is needed
and return control to the application immediately. Processing of this collected
19
information is done in a different process that can run when the system is
otherwise idle.
3.1.1 Overview of the ARM API Function Calls
The ARM API is made up of a set of function signatures that are contained in a
shared library. A performance measurement agent that supports the ARM API
provides an implementation of these functions. When we insert ARM function
calls in a particular application, the agent that implements these functions can
monitor it. The advantage of this approach is that the application customers can
choose any measurement agent that best meets their needs without the
application needing to change. The ARM API includes the following functions:
� arm_init : During the initialization of an application, calling arm_init names that
application and optionally the users, and initializes the ARM environment for
the particular application. A unique identifier is returned that must be passed
as a parameter to the function, arm_getid.
� arm_getid : This function is used to obtain an identifier which is used to
characterize a transaction class used in the application. This is often done
during the initialization of the application. A transaction class is a description
of a unit of work, such as "Check Account Balance". In each program, each
transaction class may be executed once or many times. arm_getid returns a
unique identifier that must be passed to the ARM function, arm_start.
� arm_start : This function signals the start of the execution of an instance of a
transaction of a particular class and returns a unique handle, called the
20
transaction instance identifier, to be passed to the two other function,
arm_update and arm_stop.
� arm_update : This is an optional function that can be called any number of
times after arm_start and before arm_stop. arm_update gives information
about the transaction instance, such as a "heartbeat" after a group of records
has been processed.
� arm_stop : arm_stop signals the end of the transaction instance.
� arm_end : At termination of the application calling arm_end cleans up the
ARM environment for that application. There should be no problem if this call
is not made, but memory may be wasted because the monitoring agent keeps
some memory even though it is no longer needed.
The ARM Software Developers’ Kit (SDK) comes with a NULL shared library for
the above functions. This NULL library can be used to test the instrumentation of
the particular application. The library always returns zero for all the functions, but
it is used to ensure that the proper parameters are passed in each of the above
function calls. Apart from this NULL library, SDK also comes with a logging
agent, logagent.c. Since this file is available as a source code, it needs to be
compiled separately. This file provides a little bit more information than the NULL
library, since it provides logging but it still can not be used as a measurement
agent for testing the ARM instrumentation of the application.
There are three basic tasks involved in instrumenting an application with the
ARM API.
1. Define the key business transactions within the application.
21
2. Modify the application to include calls to the ARM API. The NULL libraries
and logging agent in the ARM SDK can be used for initial testing. The key is
to decide where to place calls to the ARM API, by doing a good job defining
the key business transactions.
3. Replace the NULL libraries or logging agent from the SDK with an ARM-
compliant agent so that the application can be monitored as desired.
3.2 Introduction to the Apache Server
The Apache Project is a collaborative software development effort aimed at
creating a robust, commercial-grade, featureful, and freely available source code
implementation of an HTTP (Web) server [2]. The project is jointly managed by a
group of volunteers located around the world, using the Internet and the Web to
communicate, plan, and develop the server and its related documentation. These
volunteers are known as the Apache Group. In addition, hundreds of users have
contributed ideas, code, and documentation to the project. Project Apache exists
to provide a robust and commercial-grade reference implementation of the HTTP
protocol. It is a platform upon which individuals and institutions can build reliable
systems, both for experimental purposes and for mission-critical purposes.
Apache has been shown to be substantially faster than many other free servers.
And it is always better to have a mostly-fast free server, than an extremely fast
server that costs millions of dollars. In a recent survey, Apache has been
declared as the most popular WWW server on the Internet.
3.2.1 Overview of the Apache implementation
22
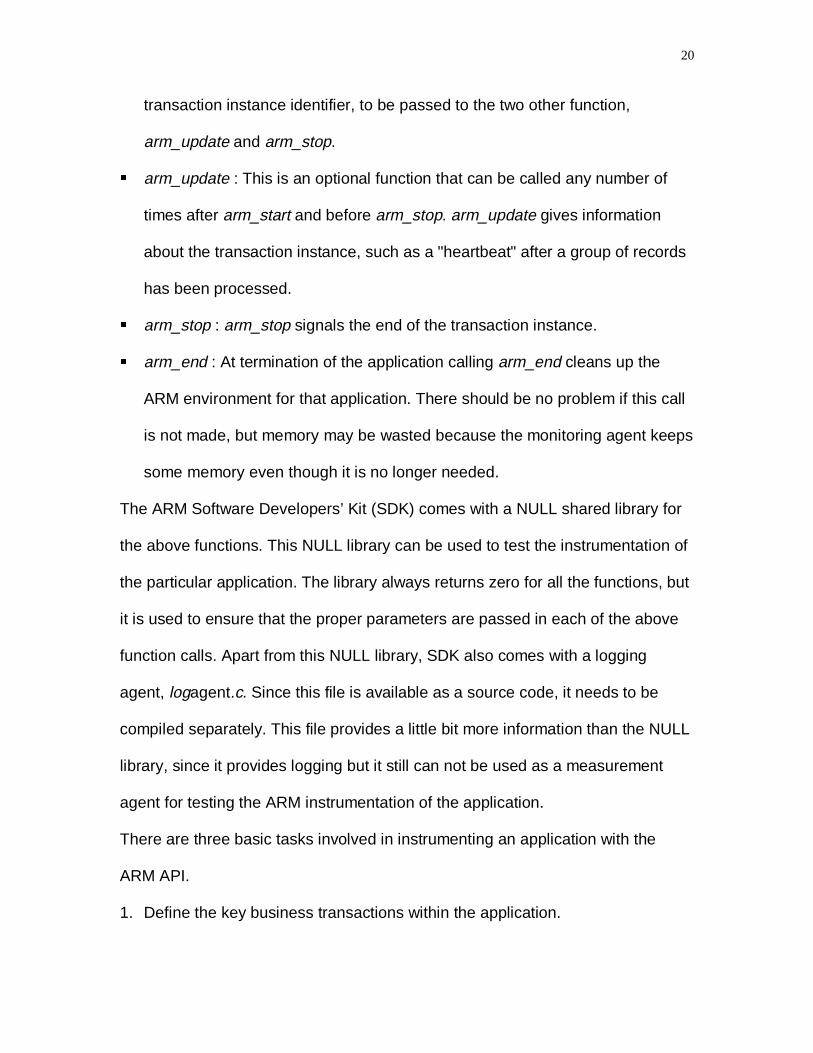
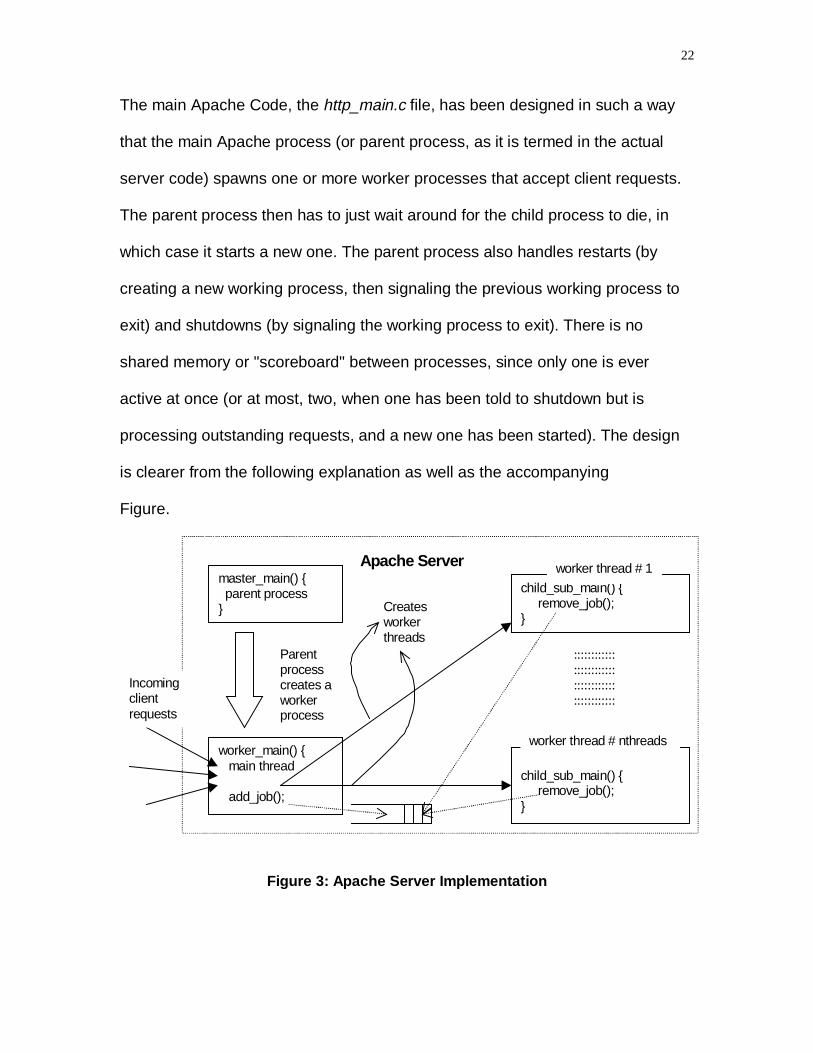
The main Apache Code, the http_main.c file, has been designed in such a way
that the main Apache process (or parent process, as it is termed in the actual
server code) spawns one or more worker processes that accept client requests.
The parent process then has to just wait around for the child process to die, in
which case it starts a new one. The parent process also handles restarts (by
creating a new working process, then signaling the previous working process to
exit) and shutdowns (by signaling the working process to exit). There is no
shared memory or "scoreboard" between processes, since only one is ever
active at once (or at most, two, when one has been told to shutdown but is
processing outstanding requests, and a new one has been started). The design
is clearer from the following explanation as well as the accompanying
Figure.
master_main() { parent process}
worker_main() { main thread
add_job();
Parentprocesscreates aworkerprocess
child_sub_main() { remove_job();}
worker thread # 1
child_sub_main() { remove_job();}
worker thread # nthreads
Createsworkerthreads
::::::::::::::::::::::::::::::::::::::::::::::::
Incomingclientrequests
Apache Server
Figure 3: Apache Server Implementation

23
The parent process operates within the master_main () function. Within the
worker process, there is one main thread and a static, but configurable, number
of worker threads or child threads, which execute the client requests. The main
thread runs within the worker_main() function, and the first thing this function
does is create the worker threads, which operate in the child_sub_main()
function. The main thread then goes into a loop within worker_main() where it
does a select() on the listening sockets. The select times out once per second so
that the thread can check for an "exit" signal from the parent process. If this
signal is set, the thread will exit, but only after it has accepted all incoming
requests already in the listen queue. When a new client request becomes
available, the main thread does a select and places the newly available socket
onto a list of jobs (using the add_job() function). Then any one of the fixed
number of worker threads takes the top job off the job list with remove_job() and
handles that connection to completion. After the request has been processed,
the thread is free to take another job from the job list. However the jobs are
scheduled in an order so that each worker thread gets to execute jobs after the
remaining threads have taken their share of jobs from the job list.
3.2.2 Instrumentation of the Apache with ARM API function calls
24
}
master_main() { parent process}
worker_main() { main thread arm_init() arm_getid(); listen() arm_start() add_job(); :::::::::::::::: :::::::::::::::: arm_end()}
Parentprocesscreates aworkerprocess
child_sub_main() { remove_job(); process request arm_stop();}
worker thread # 1
child_sub_main() { remove_job(); process request arm_stop();}
worker thread # nthreads
Createsworkerthreads
::::::::::::::::::::::::::::::::::::::::::::::::
Incomingclientrequests
Apache Server
arm_init(){}
arm_getid(){}
arm_start(){}
arm_stop(){}
arm_end()
Logagent.c
Figure 4: ARM API Instrumentation
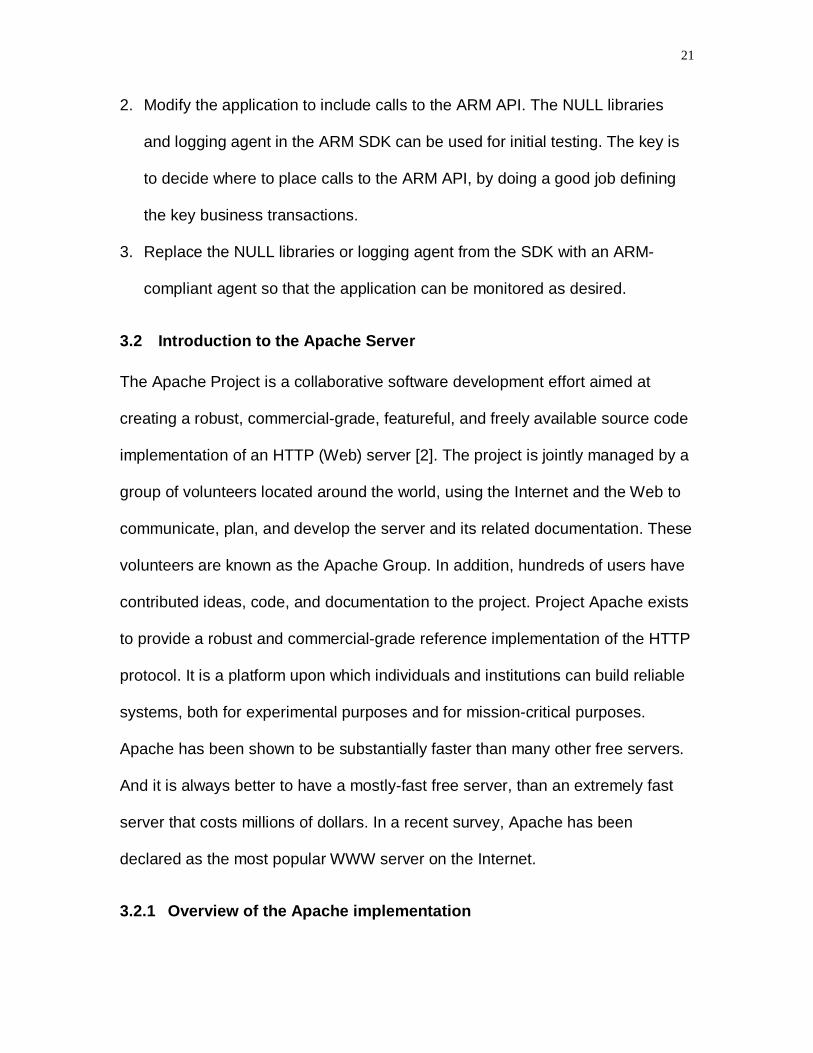
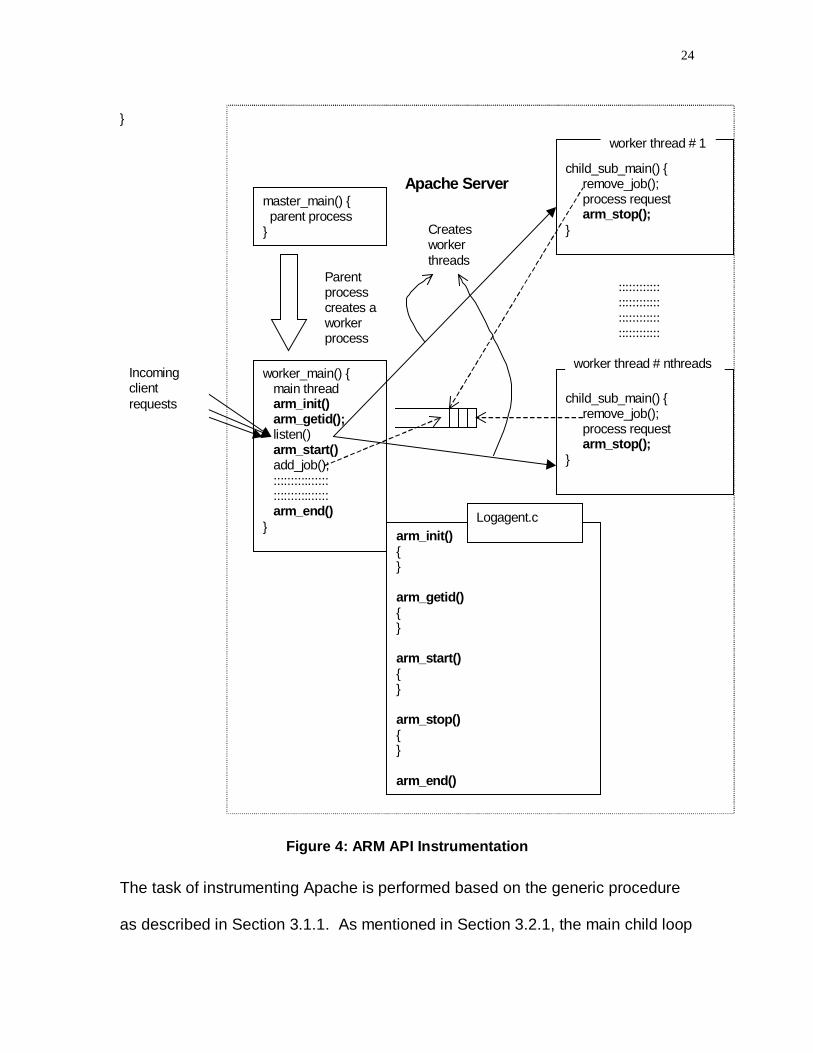
The task of instrumenting Apache is performed based on the generic procedure
as described in Section 3.1.1. As mentioned in Section 3.2.1, the main child loop

25
operates within the worker_main() function, and within this function, the actual
worker threads are created which execute the client requests. The ARM function
calls, arm_init () and arm_end () are therefore inserted within the worker_main()
function. These two calls mark the application for an ARM environment. The next
function call to be inserted within the server code of Apache is the arm_getid ().
The next step is to identify the transactions so that the function calls arm_start (),
arm_stop () and arm_update (), can be inserted in appropriate places. Again, as
is clear from the previous sub-section, the function that takes care of actually
executing the user transactions, is the child_sub_main () function. This is the
function where the arm_start () and arm_stop () function calls are inserted. There
has been no specific use for the arm_update () function in this application, and
hence it has not been used as a part of the instrumentation.
3.3 Initialization of the Monitoring agent
The monitoring agent is a separate entity that can and in most cases, resides on
the same machine as the server itself. The functions of the agent were
mentioned earlier in Section 2.3.
Upon initialization, the agent reads the configuration parameters from the
Windows Registry. These parameters are stored in the key
“HKEY_LOCAL_MACHINE\Software\CITR\monitoring agent “. The configuration
parameters are
� AgentQueryPort
This is the UDP port number of the agent to which the broker sends its
asynchronous status query requests. As will be learnt later in this report, the
26
broker sends these query messages anytime, if it needs to know the status of
the server at times other than the ones at which the periodic performance
reports are sent by the agent.
� ApacheClusterName
This is the public name of the cluster of servers to which a particular server
belongs. This name is a virtual address used by clients when they
communicate with the broker to refer to the cluster of real servers.
� ApacheServerName
This is the real IP address and port number on which the server monitored by
the agent receives requests from clients.
� PipeName
This is the pipe name used by the server to write its data and for the agent to
read from. In this project, the agent does not send any information to the
server using this pipe, so it is a uni-directional pipe. The pipe name suggests
whether the pipe is used between processes on one machine (which is the
case in this project) or it is a networked pipe.
� QoSBrokerName
The IP address of the broker to which the agent sends its registration
message, to start the communication between the agent and the broker.
� QoSBrokerPort
This is the TCP port number to which the agent sends its first message, the
registration message, for further communication between the two entities.
� RegisterTimeOut

27
This is the time, after which an agent has to re-send its registration message
to the broker, if it does not get a registration acknowledgement message from
the broker for the registration message sent earlier.
� ThinkTimeOut
This is the time at which the agent passes on the mean think time values to
the broker. It can be set equal to the reporting time interval. More about how
the think time is calculated is given in Section 4.3.5.
Further details on setting configuration parameters from the Registry are
described in Appendix D.
Also upon initialization, the agent creates two threads named the
“ApacheHandler” thread and the “BrokerHandler” thread. As is obvious from the
two names, the former handles the communication between the agent and the
Apache server and the latter handles the communication between agent and
broker.
The following sub-sections discuss the IPC between the agent and the server.
3.3.1 IPC between the agent and the server
The agent has to communicate with the server to obtain the raw data in order to
calculate the server-specific parameters like load, utilization etc. Since the agent
resides on the same machine as the server itself, the Inter-Process
Communication (or IPC) can be either through shared memories or pipes, as
mentioned in Section 2.2.
The IPC mechanism can be selected at compile time. The advantage of using
shared memory is of course the speed since the two applications sit on the same
28
machine and the fastest mode of communication would be accessing memory.
But it might introduce synchronization problems in the sense that after the server
writes into a specific named memory, the agent has to read from that memory
before the server updates the information by rewriting onto it. The server also
sets an event after writing into the memory so that the agent can wake up to this
event and do the reading. In case the agent gets delayed in reading from a
shared memory, the server will not know about this and during the next turn, it
will rewrite into the same memory.
On the other hand, the advantage of using pipes is that this synchronization
problem does not arise at all, and pipes can be used even for networked IPC
applications. Hence if in the future, the agent is moved to a different machine
from that of the server, the pipe name is all that needs to be changed to indicate
that the IPC is now between processes on different machines. However it might
not be as fast as reading and writing from memory.

29
4 Interface between the agent and the ARM-instrumented
Apache
As mentioned earlier, the communication between the agent and the Apache
server, is either by means of a shared memory followed by event triggering or
through pipes. The following two sub-sections describe both procedures in some
detail:
4.1 Communication through shared memory and related event
4.1.1 Implementation of the ARM-instrumented Apache using Shared
Memory
The main C file within the Apache is http_main.c and here is where we insert the
necessary ARM probe function calls. The particular functions within the
http_main.c, into which the various ARM calls are inserted, were explained
earlier in Section 3.2.2. The actual implementation of these ARM functions is
done in another file called Logagent.c, which was provided as part of the ARM
SDK and which had a skeletal structure for the ARM functions. The specific
implementation that was required for this project was then used to replace the
native Logagent.c.
Upon initialization, the Apache code will encounter the very first ARM call,
arm_init (), which had been inserted earlier within the worker_main() function of
http_main.c file. This function creates a global shared memory with a specific
name called “ApacheServerMain” and also provides a handle to this shared

30
memory called “hMapFile” and a pointer to this shared memory called
“lpMapAddress. The handle is returned by the operating system when the shared
memory object is created, but for an application designer, the pointer to the
shared memory object is required. This shared memory contains a structure with
information on
(i) the number of children generated,
(ii) the application id for this Apache application and,
(iii) the transaction id.
Now the value of application id is obtained directly from the return value of
arm_init (), and the value for transaction id is obtained as a return value from
arm_getid (), which is also inserted within the worker_main() function. However
the value for the number of children is not obtained directly from either of these
functions. This value is available from the main function within the Apache
implementation, called “http_main.c”. This function has an integer variable by the
name “nthreads” and this gives us the value of the number of child threads
generated by Apache once it starts up. Thus we introduce a pointer called
“globalData” which points to the same structure “ARMGlobalData”. While calling
arm_init () from http_main.c, we pass this structure as a parameter for the data.
In the implementation for arm_init () in Logagent.c, we first check to see if the
size of the data that we received from the arm_init () call in http_main.c is the
same as that of the structure “ARMGlobalData”, and if so, we initialize the pointer
“globalData” to the value obtained as data from the arm_init () function call in
http_main.c. So now we have information on the number of child threads

31
(obtained from the integer value of nthreads from http_main.c). Also since
arm_init () returns the application id and arm_getid () returns the transaction id,
we have all the values necessary to be put into the global shared memory. Now
as mentioned before, “lpMapAddress” is the pointer to this global shared memory
“ApacheServerMain”. So now we give values to the various fields of the structure
pointed to by “lpMapAddress”. Thus we insert values for the number of children,
the application id and the transaction id, obtained respectively from http_main.c,
arm_init () return value and arm_getid () return value.
In Logagent.c, we then create the event that would trigger the Monitoring agent
to wake up and read the data put into the “ApacheServerMain”. This event’s
handle is called “hGlobalDataAvail” and the event itself is called
“ApacheGlobalDataAvail”. Since we get the transaction id only as a return value
from the arm_getid (), this event is created in the function arm_getid ().

32
Apache Serverhttp_main.c, Logagent.c
applid = arm_init();tranid = arm_getid();
Monitoring agentMultiServerThread_v2.cpp
Global Shared Memory
Event to trigger the Agent
hGlobalDataAvail
ApacheServerMain{ int NumOfChildren; int ApplId; int TranId; int QoSThreshold;}1. Server writes
into shared memory
4. Agent readsfrom the sharedmemory
2. Server sets thecorrespondingevent
3. Agent wakes upto thecorrespondingevent
Figure 5: Global Shared Memory and Event
Next based on the value of the number of children, Apache generates shared
memories and events to trigger the monitoring agent to read from these shared
memories, for each child, so that there are as many shared memories and
associated events as there are number of children. The child shared memories
are suggestively given the names “ApacheChildSharedMem0”,
“ApacheChildSharedMem1”, “ApacheChildSharedMem2”, and so on until
“ApacheChildSharedMem (NumOfChildren – 1)”. The associated events for the
children are also given obvious names “ApacheChildEvent0”,
“ApacheChildEvent1”, etc.
These child shared memories are formed by creating an array with a pointer
called “childInfo” and with the number of elements of the array equal to the
33
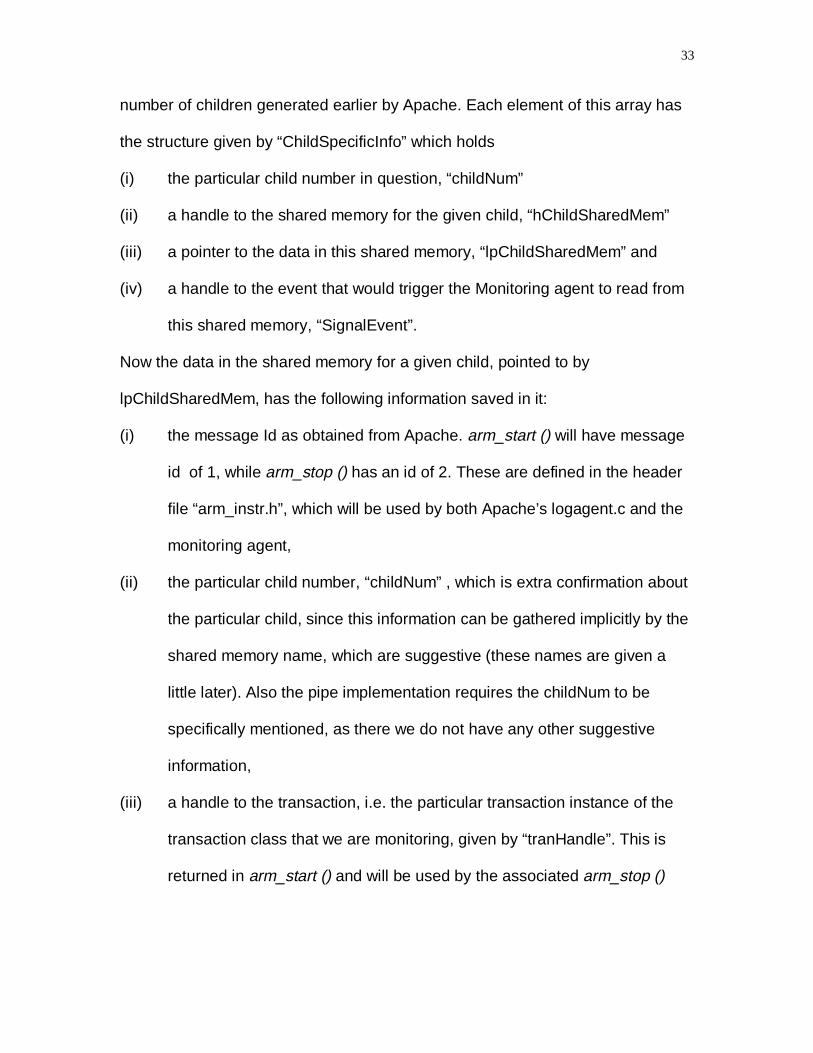
number of children generated earlier by Apache. Each element of this array has
the structure given by “ChildSpecificInfo” which holds
(i) the particular child number in question, “childNum”
(ii) a handle to the shared memory for the given child, “hChildSharedMem”
(iii) a pointer to the data in this shared memory, “lpChildSharedMem” and
(iv) a handle to the event that would trigger the Monitoring agent to read from
this shared memory, “SignalEvent”.
Now the data in the shared memory for a given child, pointed to by
lpChildSharedMem, has the following information saved in it:
(i) the message Id as obtained from Apache. arm_start () will have message
id of 1, while arm_stop () has an id of 2. These are defined in the header
file “arm_instr.h”, which will be used by both Apache’s logagent.c and the
monitoring agent,
(ii) the particular child number, “childNum” , which is extra confirmation about
the particular child, since this information can be gathered implicitly by the
shared memory name, which are suggestive (these names are given a
little later). Also the pipe implementation requires the childNum to be
specifically mentioned, as there we do not have any other suggestive
information,
(iii) a handle to the transaction, i.e. the particular transaction instance of the
transaction class that we are monitoring, given by “tranHandle”. This is
returned in arm_start () and will be used by the associated arm_stop ()

34
(iv) the time at which Apache encountered an arm_start (), given by
“startTime”
(v) the time at which Apache encountered an arm_stop () (these values are
necessary to calculate the response time per transaction)
(vi) the total time, in milliseconds, elapsed since the system started up, until
there is an arm_start (), given by “StartTickCount” and
(vii) the time elapsed, in milliseconds, from system startup until there is an
arm_stop (), given by “StopTickCount”. The last two values are necessary
since the startTime and stopTime, give the time in a typical clock format
and this would mean that we would have to deal with the low-order wrap-
rounds at hours, minutes, seconds and milliseconds as well as a high
order wrap-round like days, months and years. If the time is given in
milliseconds, one will not need to worry about this conversion.
(viii) the time in milliseconds, that a job spends in the queue, “TimeInQueue”.
This value is calculated within Apache’s functions, add_job() and
remove_job(). The difference in the times at which a job enters the job
(with add_job() ) and the one at which one of the worker threads removes
it (with remove_job() ).
(ix) the client IP address in a regular long integer format
(x) the client IP address in the dotted typical string format
Upon encountering an arm_start (), the particular child will open the named
shared memory associated to its child number, and write the valid data into this
memory. The data written here will include the type of message indicated by the

35
message Id (which will be TRAN_START associated to arm_start ()), the child
number, the start handle (returned by the arm_start () and to be used by
arm_stop () ), the start time which is given by the local time of the system at the
time this arm_start () was encountered along with the date, and the stop time
which here will be null, since the child has not yet encountered the arm_stop ()
function call.
The message id associated with the ARM call arm_start (), given in the header
file “arm_instr.h” is called TRAN_START.
Right after writing this data into the child’s associated shared memory, the child
also sets the associated named event. Now this same shared memory and
named event are known to the monitoring agent too, so that the agent can wake
up to the named event and read the data from the named shared memory. We
will look at this again when we get into the details of the agent implementation.
Upon encountering arm_stop (), the same procedure is repeated, i.e. the child
related information is written into the child’s particular shared memory and then
the associated named event is set. The names of the shared memories and
associated events used here are the same as the one used for arm_start (),
which means that the same memory is updated with the new and extra
information and the same event is set for a second time. In the information
written into the shared memory, the data that is changed from the one written
before by arm_start () are:

36
(i) the message id is now corresponding to arm_stop (), which is
TRAN_STOP. As before this information is given in the header file
“arm_instr.h”.
(ii) the stopTime information i.e. the time at which Apache encounters the
arm_stop ()
(iii) the StopTickCount which gives the value of the milliseconds elapsed from
system start-up until the time at which Apache encounters arm_stop ().
The other values like the childNum, tranHandle and startTime remain the same
as before.
This is done for each of the ‘nthreads’ child threads generated by the worker
Apache. Thus each child writes its related information of arm_start () and
arm_stop (), when it encounters them, into its part of shared memory and each of
the children has its own named event.
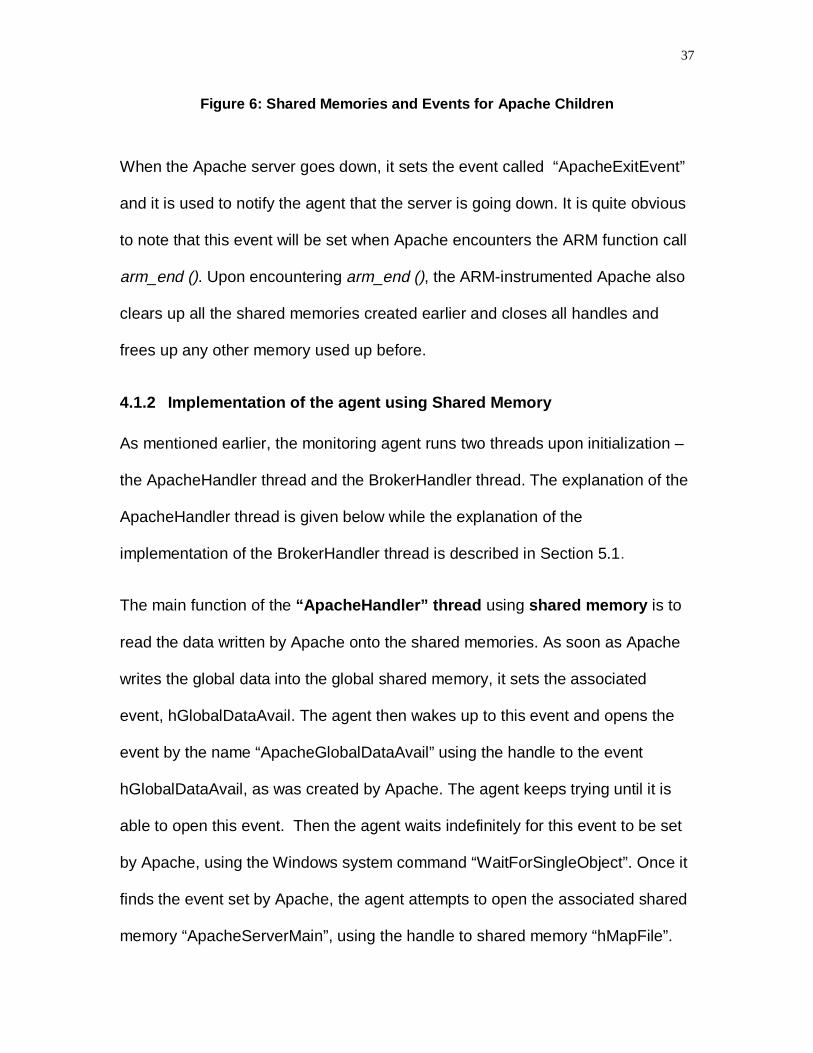
ARM- e dApa c h ewr i t e s i nt ot he Sha r e dMe mor i e sa nd s e t s t her e l a t e de ve nt s
Me a s u r i ngAge nt wa ke su p t o t hee ve nt s a ndr e a ds f r o mt he Sha r e dMe mo r i e s
ApacheChildSharedMem0 ApacheChildEvent0
ApacheChildEvent1ApacheChildSharedMem1
ApacheChi ldSharedMem (nthreads – 2)
ApacheChi ldSharedMem (nthreads - 1)
ApacheChildEvent (nthreads – 2)
ApacheChildEvent (nthreads - 1)
::::::::::::::::::::::::::::::::::::::::::::::::::
::::::::::::::::::::::::::::::::::::::::::::::::::
37
Figure 6: Shared Memories and Events for Apache Children
When the Apache server goes down, it sets the event called “ApacheExitEvent”
and it is used to notify the agent that the server is going down. It is quite obvious
to note that this event will be set when Apache encounters the ARM function call
arm_end (). Upon encountering arm_end (), the ARM-instrumented Apache also
clears up all the shared memories created earlier and closes all handles and
frees up any other memory used up before.
4.1.2 Implementation of the agent using Shared Memory
As mentioned earlier, the monitoring agent runs two threads upon initialization –
the ApacheHandler thread and the BrokerHandler thread. The explanation of the
ApacheHandler thread is given below while the explanation of the
implementation of the BrokerHandler thread is described in Section 5.1.
The main function of the “ApacheHandler” thread using shared memory is to
read the data written by Apache onto the shared memories. As soon as Apache
writes the global data into the global shared memory, it sets the associated
event, hGlobalDataAvail. The agent then wakes up to this event and opens the
event by the name “ApacheGlobalDataAvail” using the handle to the event
hGlobalDataAvail, as was created by Apache. The agent keeps trying until it is
able to open this event. Then the agent waits indefinitely for this event to be set
by Apache, using the Windows system command “WaitForSingleObject”. Once it
finds the event set by Apache, the agent attempts to open the associated shared
memory “ApacheServerMain”, using the handle to shared memory “hMapFile”.
38
Once the agent opens the shared memory, it starts trying to read data from this
shared memory, by mapping the view of the shared memory in a read-only
format using the pointer “lpMapAddress”. Once the data is read, the values for
the number of children, the application and transaction ids are copied into the
local variable structure “GlobalApacheData”. Now that the agent knows the
number of child threads, it has to allocate memory for the handles to the
‘nthreads’ child events as well as for two extra handles – one for the agent exit
event and the other for the Apache exit event. Thus a total of (nthreads + 2)
handles to events are created. Next the agent allocates memory for the child-
specific information structures. Again there will be ‘nthreads’ of these so that we
have an array called “childInfo” with ‘nthreads’ elements, each representing
information specific to a child. The child specific information, in this case,
consists of
(i) the handle to the child shared memory and
(ii) the pointer to the shared memory structure within
As can be noted, the child specific information here is different from what we had
in Apache, where we also had the handles to events included in the information.
Here however, the agent needs to wait for the events to be set and we use the
Windows system command “WaitForMultipleObjects” to wake up to any of these
events and this command expects a pointer to an object-handle array. So we
separate the handles to the events from the child specific information structure as
we had it in the ARM-ed Apache’s Logagent.c file. Now that the memory for
handles to events and pointers to shared memories are created, the agent opens
39
the events and then maps the view of the child specific files into a local address
space. Now the agent waits for any of these (nthreads + 2) events to be
triggered, using the Windows system command “WaitForMultipleObjects”. If the
triggered event is the ApacheExitEvent or agentExitEvent then the agent upmaps
views of the shared files (memories) for the children as well as the global file,
closes all handles and frees up all other used up memories. The agent then exits
the ApacheHandler thread. On the other hand, if any of the ‘nthreads’ child
events are triggered, then depending on which child event it is, the appropriate
information is gathered. Details about the parameters within this information were
given earlier in Section 4.1.1.
4.2 Communication using pipes
4.2.1 Implementation of the ARM-instrumented Apache using Pipes
The pipes implementation of the ARM-instrumented Apache is within the
AgentHandler Thread. The first thing that is done by this thread is the creation of
a named pipe, \\\\.\\pipe\\ApacheServerPipe. The pipe is made bi-directional so
that both pipe client (agent) and pipe server (Apache server) can read from and
write onto the pipe. The other modes set for this pipe include
� specifying that the data to be written to the pipe is a stream of messages (not
bytes),
� also data can be read from this pipe in the form of messages as opposed to
bytes, and,

40
� the pipe is made a blocking one so that any operation on the pipe is not
completed until there is data to be read from the pipe (in the ReadFile
operation), until data has been written to the pipe (in the case of the WriteFile
operation) or a client is connected (in the case of the ConnectNamedPipe
operation). Use of this mode can mean waiting indefinitely in some situations
for a client process to perform an action.
Also the value for the maximum number of instances for this pipe is indicated as
one (1). The thread then gets Apache to connect to the new client, the monitoring
agent.
The thread then enters an infinite loop waiting to read messages from the pipe.
The very first message on the pipe would be REGISTER_AGENT message sent
by the agent, in order for the agent to register with the Apache server. The
Apache server will then respond with a REGISTER_ACK message to
acknowledge the receipt the register message from the agent. With this ack
message, the Apache server also passes information on the number of child
threads within Apache (g_ApacheData.NumOfChildren), the application id
(g_ApacheData.appId), the transaction id (g_ApacheData.tranId) and the QoS
Threshold (g_ApacheData.QoSThreshold). As in the case of shared memory, the
structure of these messages is ARMGlobalData and is defined in the common
header file, “arm_instr.h”. The value for applId is obtained from the ARM function
call, arm_init (), the value for tranId is obtained from the ARM function call,
arm_getid () and the value for the number of child threads is obtained directly
41
from the Apache server code, since this is statically created once the server
comes up.
Upon encountering the ARM function call, arm_start (), the value for the number
of seconds elapsed since the system started up, is written onto the pipe. A
similar value will be written when the Apache server code encounters the ARM
function call, arm_stop (). The difference between these two values will give the
response time for that transaction, since arm_start () and arm_stop () are
inserted at the beginning and end of the actual client transaction. Also passed
along with this is the time and date at which the transaction starts with the time in
the typical clock format of hours, minutes, seconds, milliseconds and date in the
form of day, day of the week, month and year. So armed with this information,
the agent will be able to figure out what time and date any transaction starts, and
how much time elapses for Apache server to respond to that transaction. And
finally, upon encountering the ARM function call, arm_end (), the pipe is closed
and the connection is terminated.
The only other message that the agent could send to Apache server, is the
UNREGISTER_AGENT message to which Apache’s AgentHandler thread will
respond with an ack, UNREGISTER_ACK message.
4.2.2 Implementation of the agent using Pipes
As mentioned earlier, the pipe implementation has been done if a particular
situation requires the same. There might be some synchronization issues in
using shared memories and this has been described earlier in the report and in

42
such cases, it is advisable to use the pipes. The choice between the two is done
during compile time.
The main function of the ApacheHandler Thread implementation using Pipes is
to read the data written by Apache onto a named Pipe. So first the agent has to
open the already existing pipe. The name of the pipe is
\\\\.\\pipe\\ApacheServerPipe and it is known a-priori. The name is such that the
“.” indicates that the server (i.e. the Apache server) is on the same machine as
the client (i.e. the monitoring agent) and the actual name of the pipe is
“ApacheServerPipe”, onto which Apache writes the data. Opening this named
pipe returns a handle to access the named pipe and we call this handle “hPipe”.
The pipe is opened in generic read/write access, which means that the
ApacheHandler Thread application can do both read and write on this named
pipe. The thread uses the function WaitNamedPipe to be able to successfully
connect to an instance of the named pipe or until a time-out interval of 20
seconds elapses. Also, at this stage, the read/wait mode of the pipe needs to be
set. Here this mode is set to be of type “PIPE_READMODE_MESSAGE”, which
implies that the data to be read from the pipe is a stream of messages, as
opposed to a stream of bytes. That is necessary since the two processes,
Apache and agent, communicate by means of messages. Then two events are
created using Windows function CreateEvent, and assigned to two
OVERLAPPED structures, fileReadEvent and fileWriteEvent. A Windows
OVERLAPPED structure contains information used in asynchronous input and
43
output, so that an event is always non-blocking. Thus we have two events
fileReadEvent.hEvent and fileWriteEvent.hEvent.
The first message that the agent will sent to the server, is the
REGISTER_AGENT event. This message has to be written onto the named pipe
using the Windows WriteFile function. This function will be specified as a non-
overlapped function since unless the agent registration is complete, the server
cannot communicate further. After successfully writing the registration message
onto the pipe, the thread enters an infinite loop of reading messages from the
pipe. There are two types of read events that can occur on the pipe, namely the
fileReadEvent.hEvent and the g_AgentExitEvent. The thread therefore uses the
Windows WaitForMultipleObjects function to wait to receive any of these events.
If the g_AgentExitEvent is received, the handle to the pipe is closed. Upon
receiving the fileReadEvent.hEvent, one of the following messages will be
received.
� REGISTER_ACK : This message is sent by Apache upon receiving the
REGISTER_AGENT message. Along with this, information about the number
of child threads, nthreads, the application identifier and the transaction
identifier are also passed to the agent.
� TRAN_START : This message is sent by Apache when an arm_start () is
encountered. It informs the agent of the beginning of an instance of the client
request transaction. The server load variable, g_ServerLoad, is incremented
at this stage. Also, values for StartTickCount, StopTickCount, the client IP
address (of the client which sent the request associated with this
44
TRAN_START) and think time. More on the think time calculation is detailed
in Section 4.3.5. Since multiple clients will need to access this think time data
structure to add data related to their arm_start ()s, there is a need to use a
semaphore to lock the structure, while an entry/deletion is being made.
� TRAN_STOP: This message is sent to the agent to indicate the termination of
an instance of the client request transaction. The global variable on the server
load, g_ServerLoad is also decremented and the global variable on the
number of connections, g_NumConnections is incremented, indicating the
number of completed (successful) transactions. Again information associated
with this end of the transaction is used to add data into the think time data
structure. Also the total response time is calculated as the time spent in the
job list plus the actual servicing time. Again as before, a semaphore is used to
lock the data structure while data is being added/deleted by numerous clients.
As can be noted, these calculations should be identical to the ones performed
in the earlier section describing IPC between the agent and Apache by means
of shared memories and events. The think time as mentioned earlier, is
defined as the time between the end of last transaction and the beginning of
current transaction. Such times for each client are noted and then the mean
think time is calculated as the ratio of the sum of these think time values for
all clients to the number of such values considered. As also mentioned all
these parameters are calculated for each measurement period.
� TRAN_UPDATE : There has been no need for this particular message but it
may be useful for future purposes if there is a need for instance, to send more

45
detailed information about each transaction, like the time spent in the queue
for each transaction, the actual servicing time for each transaction etc.
� APACHE_EXIT : This message is sent by Apache upon its termination and
so the handle to the named pipe is closed and the ApacheHandler thread
exits.
4.3 Calculating Performance parameters
4.3.1 Calculation of mean response time
So now the agent has information about when a transaction starts (by the time at
which it receives the trigger for arm_start () ) and the time at which the
transaction stops (by the time at which it receives the trigger for arm_stop () ), so
the difference between the two values will give the total response time for that
particular transaction.
It is important to note that this time includes the time spent by the transaction in
the job list as well as the actual servicing time. Also the time spent in the job list
by a particular transaction instance, given by the transaction identifier or handle,
is already known directly from Apache, as the value of the variable
“TimeInQueue” written by Apache into the child shared memory. So the
difference between the overall time for processing a job and the time spent by
that job in the job list queue, gives the actual service time for the client request.
In this project, we do not pass the overall response time to the monitoring agent,
we just pass the service time to the agent.
46
Also the number of transactions can be known and so the ratio of the total
processing times from the various transactions and the number of transactions
would give the mean response time.
4.3.2 Calculation of the load on the server
The load on a server is calculated as the number of transactions or client
requests received by the server during the measurement interval. So every time
the agent receives a trigger for an arm_start (), the number of transactions, or
connections, is incremented by one.
4.3.3 Calculation of the capacity of the server
The capacity of the server would be the number of concurrent connections that
the server can handle. Now in Apache, the number of worker threads will decide
the number of concurrent requests being handled by the server, given by the
variable, nthreads.
4.3.4 Calculation of the utilization of server
The utilization of a server is calculated as the ratio of the load times the mean
response time and the capacity of the system. It is given by the formula:
Utilization = Load * Response Time / Capacity
4.3.5 Calculation of the think time of clients
The think time is defined in this project as the time between successive requests
from the same client. It is calculated as the time difference between the end of
one transaction and the beginning of the next transaction from the same client.
47
Each client is identified by its IP address, which is determined within the Apache
server code itself. Appropriately, Apache passes on to the agent, the information
on the time at which a transaction stops i.e. the connection closes, as well as the
time at which a new connection is established. As might be clear from the report,
these data are passed on to the agent anyway, to calculate the response time.
Thus no new information needs to be collected.
However, the value of think time itself needs some amount of calculation
because we are interested in knowing the mean think time of all the clients
present in the network, rather than that of each client separately. This means that
we use a linked list of think time records, one for each client. The fields in this list
are
� the client id, an integer
� the first (or previous) transaction stop time, which keeps getting updated for
each new transaction in the reporting interval period
� the following (next) transaction start time, which also keeps getting updated
for each new transaction in the reporting interval
� the total think time, which is the sum of the think times of all transactions
within the interval (as mentioned earlier, think time is the difference between
the end of previous transaction and the start of the next one)
� the number of think time values
� the mean think time, which is the ratio between the total think times for all
transactions from that client within that the reporting interval and the number
of such think time values
48
Once the mean think times of all clients is known, the overall think time for all
clients can be calculated as the ratio of the sum of all these mean think times to
the number of clients (i.e. the number of think time values summed)
All the data that the agent collects from the server are written into a log text file
called the “serverlog.txt”.
49
5 Interface between the monitoring agent and the QoS broker
The other thread started by the agent is the BrokerHandler thread dealing with
the communication between the broker and the agent. As mentioned earlier, we
use the API for UDP/IP sockets to define the interface between these two
entities. The following describes how the agent is supposed to function with
respect to the broker once it is initialized and running.
As soon as the agent comes up, it registers itself with the broker. The registration
process involves informing the QoS broker of the agent’s address and port
number as well as the monitored server’s address. In our case, since these two
processes run on the same machine, the addresses would essentially be the
same. During the registration, the broker will provide a unique identifier for the
monitoring agent, which will be used in the following interactions. This way every
new agent/server that registers with the broker gets its own identifier and the
broker can keep track of each agent in its subsequent communications.
5.1 Message parameters
The following sub-sections give details of the parameters involved in the
messages exchanged between the agent and the broker.
5.1.1 Monitoring agent identification parameters
1. Cluster Name
This is the public name of the cluster of servers to which this particular server
belongs.
2. Server Address

50
The real IP address and port number on which the server monitored by the agent
receives request from clients.
3. Agent Address
The IP address and port number on which the agent is listening for incoming
monitoring requests. The broker uses this address to communicate with the
agent.
5.1.2 Server parameters
1. Server capacity
This gives the maximum number of concurrent requests that the server can
handle at the same time.
2. QoS-Thresholds
The maximum tolerable response time for this particular server. The specification
of this value is optional, and if it is not specified, the broker can use the full
capacity of the server without any consideration for the resulting response time.
5.1.3 Performance report parameters
The performance report is the periodic report sent by the monitor agent to the
broker. It contains the following information:
1. Report number
This sequence number is used to distinguish between reports from the same
agent.
2. Mean Response Time (MRT)

51
This is the observed mean response time of the server during the last
measurement interval.
3. Server Load
The estimated value of the load on the server during the last measurement
interval (the number of requests received by the server during the measurement
interval).
4. Mean Think Time
This gives the value of the mean think time of clients during the last
measurement interval. As mentioned earlier, it basically represents the time
between two successive requests from the same client. It is calculated as the
time between the end of one request from a particular client and the beginning of
the next request from the same client. Since we are interested in calculating the
mean think time for all clients, these think times are measured for all the clients
and then the mean is calculated by adding these individual think times and then
dividing that by the number of such measurements taken.
5. Number of Requests per client
This is the mean number of requests per client during the last measurement
interval. The requests, which stretch over two intervals, will be included in the
second interval, so that the number of requests would actually be the number of
completed requests.
5.2 Monitoring Session parameters
The broker specifies the following parameters for each newly registered agent.
1. Agent ID
52
This ID is used by the broker to identify the agent. As mentioned earlier, the QoS
broker gives this value to the agent, as part of the registration acknowledge
message.
2. Length of the measurement interval
This gives the length in seconds of the measurement interval.
3. Reporting frequency limit or session timeout
This is the allowed number of consecutive intervals for which an active agent
may not send any report to the broker. When this period expires, the broker
assumes that the monitoring agent and the server is no longer active. It is very
possible that a sent report gets lost in the network and hence does not reach the
broker. Upon such a session time-out lapse, in this implementation, the agent will
re-register with the broker.
In theory, when the broker notices that the agent and its server are inactive,
it should stop using the server. If the server/agent are really inactive, they
need to register again and get a new ID. If the broker thinks that a
server is inactive only because all report messages are lost in the network
that becomes a special situation for which the broker would need to query
the agent. The monitor at the broker side knows from the sequence number of
the received reports, the status of the connection between itself and the agent.
The planned broker (not my prototype, but the one implemented by Mohamed
Salem) actually keeps all the registration information and maintains a flag
variable which indicates whether the server is active or not. This variable is
53
activated when the server registers, and it is deactivated upon the reception of a
STOP message or a session timeout.
5.3 Messages sent from the Monitoring agent
The following gives details of the types of messages sent by the agent to the
broker.
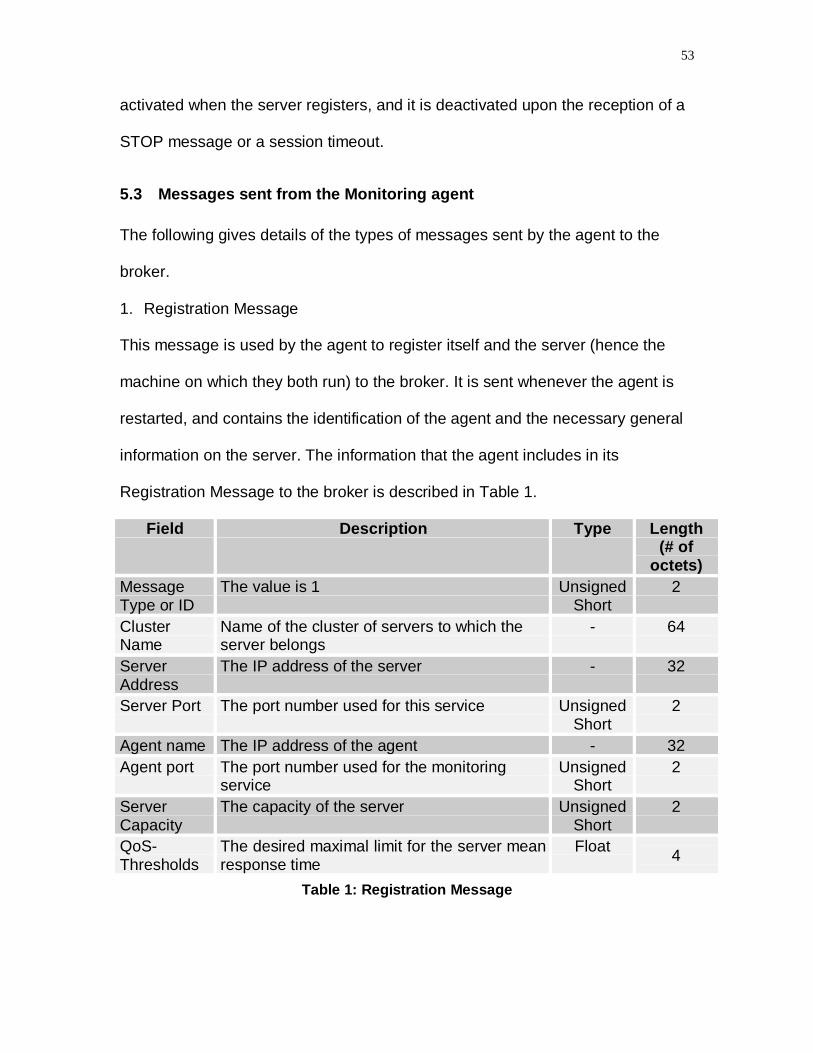
1. Registration Message
This message is used by the agent to register itself and the server (hence the
machine on which they both run) to the broker. It is sent whenever the agent is
restarted, and contains the identification of the agent and the necessary general
information on the server. The information that the agent includes in its
Registration Message to the broker is described in Table 1.
Field Description Type Length(# of
octets)MessageType or ID
The value is 1 UnsignedShort
2
ClusterName
Name of the cluster of servers to which theserver belongs
- 64
ServerAddress
The IP address of the server - 32
Server Port The port number used for this service UnsignedShort
2
Agent name The IP address of the agent - 32Agent port The port number used for the monitoring
serviceUnsigned
Short2
ServerCapacity
The capacity of the server UnsignedShort
2
QoS-Thresholds
The desired maximal limit for the server meanresponse time
Float4
Table 1: Registration Message
54
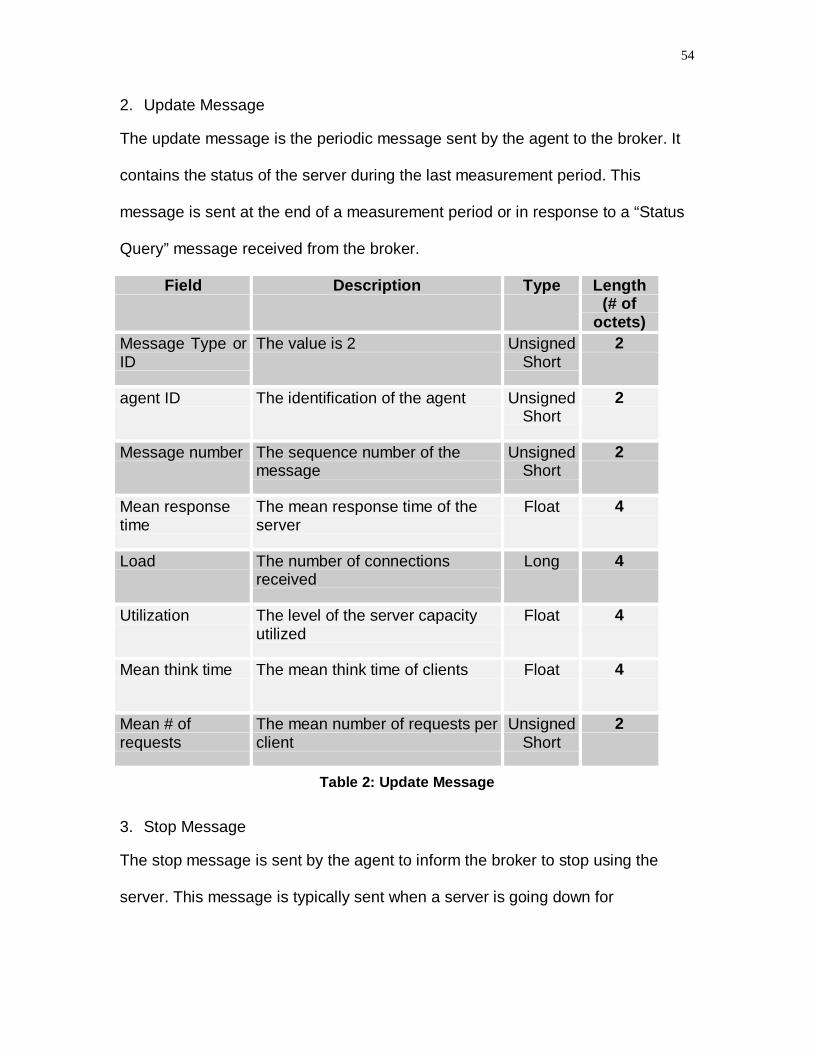
2. Update Message
The update message is the periodic message sent by the agent to the broker. It
contains the status of the server during the last measurement period. This
message is sent at the end of a measurement period or in response to a “Status
Query” message received from the broker.
Field Description Type Length(# of
octets)Message Type orID
The value is 2 UnsignedShort
2
agent ID The identification of the agent UnsignedShort
2
Message number The sequence number of themessage
UnsignedShort
2
Mean responsetime
The mean response time of theserver
Float 4
Load The number of connectionsreceived
Long 4
Utilization The level of the server capacityutilized
Float 4
Mean think time The mean think time of clients Float 4
Mean # ofrequests
The mean number of requests perclient
UnsignedShort
2
Table 2: Update Message
3. Stop Message
The stop message is sent by the agent to inform the broker to stop using the
server. This message is typically sent when a server is going down for
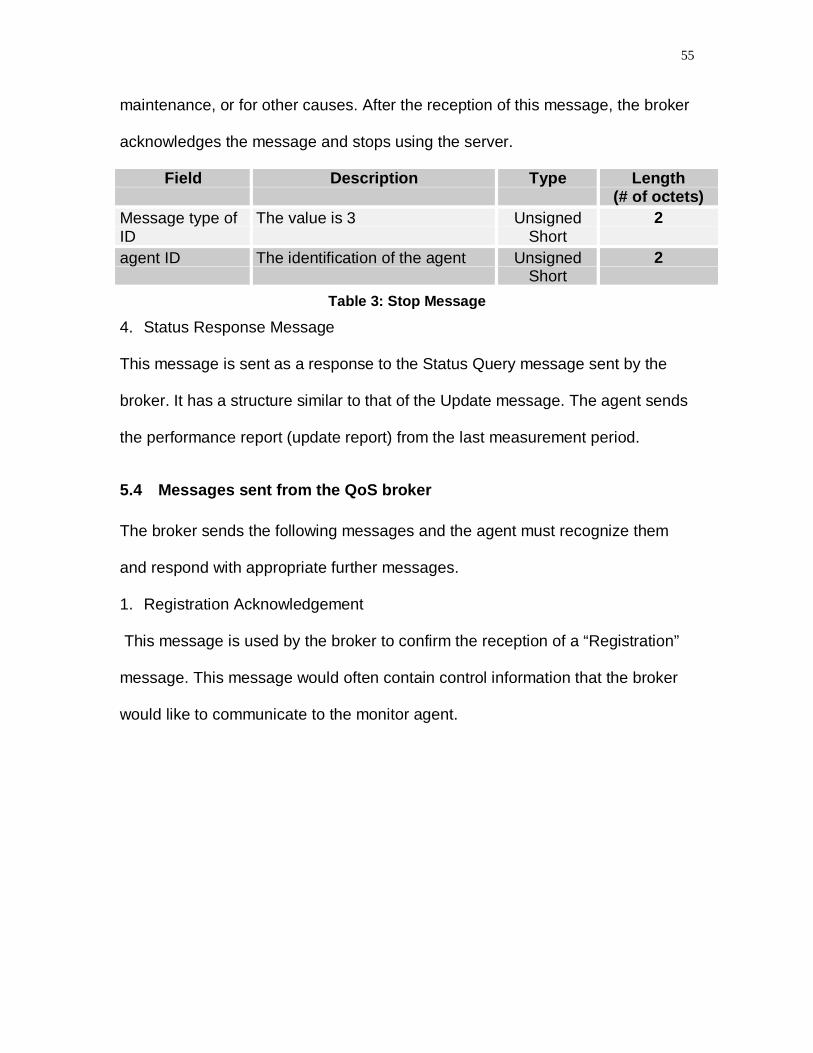
55
maintenance, or for other causes. After the reception of this message, the broker
acknowledges the message and stops using the server.
Field Description Type Length(# of octets)
Message type ofID
The value is 3 UnsignedShort
2
agent ID The identification of the agent UnsignedShort
2
Table 3: Stop Message
4. Status Response Message
This message is sent as a response to the Status Query message sent by the
broker. It has a structure similar to that of the Update message. The agent sends
the performance report (update report) from the last measurement period.
5.4 Messages sent from the QoS broker
The broker sends the following messages and the agent must recognize them
and respond with appropriate further messages.
1. Registration Acknowledgement
This message is used by the broker to confirm the reception of a “Registration”
message. This message would often contain control information that the broker
would like to communicate to the monitor agent.

56
Field Description Type Length(# of
octets)Message type orID
The value is 4 UnsignedShort
2
agent ID The identification of the agent UnsignedShort
2
Interval The length of a measurementinterval
UnsignedShort
2
Session Time-out The number of tolerableconsecutive measurementintervals without any reporting
UnsignedShort
2
Table 4: Registration Acknowledgement message
2. Status Query Message
This message is used by the broker to request the status of a server
asynchronously (i.e. the broker decides when it is necessary to sent this
message).
Field Description Type Length(# of octets)
Message type orID
The value is 5 UnsignedShort
2
Table 5: Status Query Message
The agent as a response to this message sends the performance report from the
last measurement interval.
3. Stop response Message
This message is sent by the broker to confirm the reception of a Stop message.
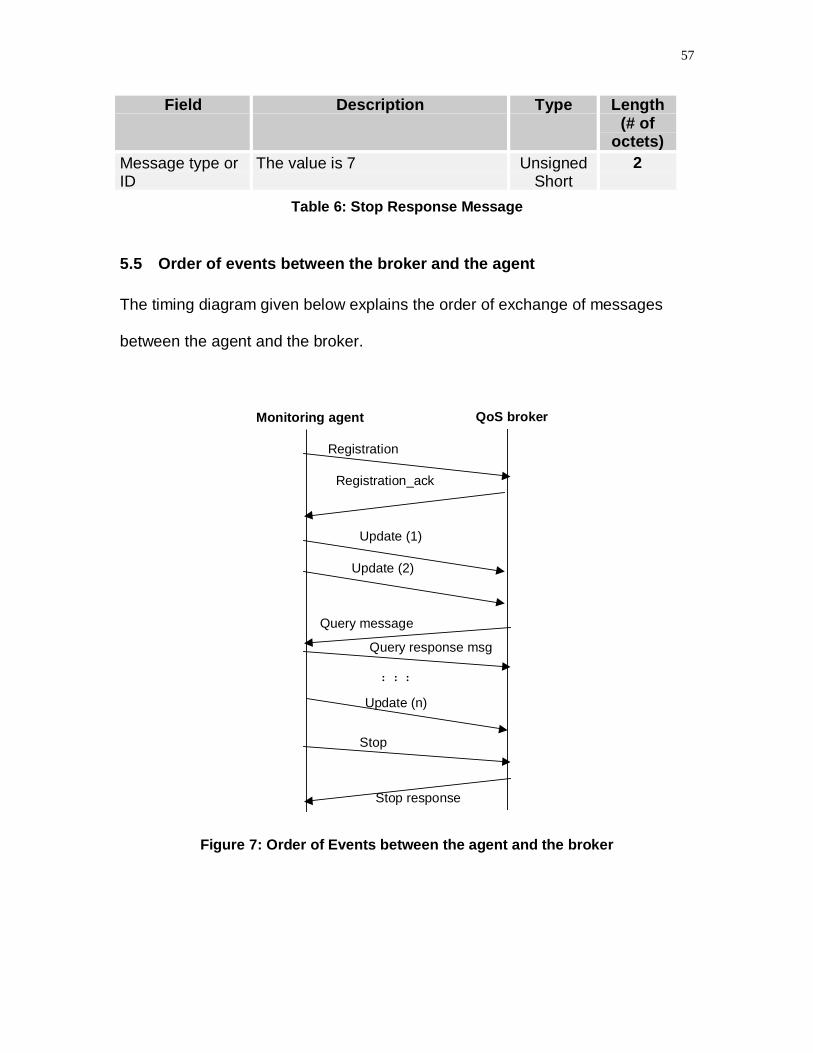
57
Field Description Type Length(# of
octets)Message type orID
The value is 7 UnsignedShort
2
Table 6: Stop Response Message
5.5 Order of events between the broker and the agent
The timing diagram given below explains the order of exchange of messages
between the agent and the broker.
Monitoring agent
: : :
Stop
Update (1)
Update (2)
Update (n)
Registration_ack
Registration
QoS broker
Stop response
Query message
Query response msg
Figure 7: Order of Events between the agent and the broker
58
5.6 The states of the Monitoring agent
The agent itself can operate in any of the following states, described further in
the FSM diagram for the agent.
(i) Idle state: The agent is in this state after the agent comes up and just
before it registers. At this time, the agent typically does the necessary
initialization for its UDP sockets etc.,
(ii) Preparation state: This is an intermediate state, when the agent has sent
out a Registration message to the broker and is waiting for a subsequent
Acknowledgement from the broker. In the eventuality of a lost/corrupted
Registration message, the agent continues to retry sending the
Registration after a certain time-out period, until it receives an Ack,
(iii) Active state: The agent enters this state when it has received the
necessary Ack from the broker and then it starts the monitoring process.
The messages in this state can be (a) periodic reports of updates to the
broker and (b) responses to asynchronous status query requests from the
broker
(iv) Stop Requested State: The agent is in this state waiting for a confirmation
that the broker received the Stop message correctly. After that the agent is
considered to at the idle state.

59
IDLESTATE PREPARATION
STATE
ACTIVESTATE
User Startsagent/Registration
Registration_ack/-
Timeout/Registration
(Retry)
End-of-Period/Update
Query/ResponseStop ack./-
STOP_REQSTATE User Stops agent
/Stop
Figure 8: Simplistic Finite State Machine diagram for the agent states
(Figure shows simplistic message names)
60
5.7 Implementation of the interface between the broker and agent
The various messages and their message structures are given in the header file
by the name “QoSBrokerIf.h”. The basic structure for any message (regardless of
whether the originator is the agent or the broker) has the name “Message_t”. It
includes a message id, an integer to differentiate between the various message
types and a union of the messages themselves, each of which again is a
structure.
The initial state of the agent is the Idle State. Upon initialization of the
BrokerHandler thread, the agent opens a UDP (connectionless) socket
“hListenSock ” and binds to a local port. Whenever any of the network (socket
related) events occurs on this named socket, the Windows DLL uses the
Windows WSAAsyncSelect function to inform the main Window with a named
message. The socket-related events that can occur are FD_READ (indicating
that a message has to be read from the socket), FD_WRITE (indicating that a
message has been sent on the socket) or and FD_CLOSE event (indicating that
the socket is closed). The first message that the agent sends to the broker is the
REGISTRATION_MSG. Along with this, data related to the server name, IP
address, etc. (which had been obtained from the registry) are passed along with
the registration message. Information on the global data related to the Apache is
also included.
The BrokerHandler thread then enters an indefinite loop waiting for any of 6
broker-related events. These events are:

61
� g_WriteReadyEvent –This event will be set when the FD_WRITE socket
event occurs on the socket. As mentioned before, occurrence of the
FD_WRITE socket event causes an appropriate message to be sent to the
main user interface window and one of those messages is the
g_WriteReadyEvent, indicating that data has been written onto the socket.
Now depending upon the state of the agent, the appropriate message is
written. If the agent is in the idle state, then the registration message will need
to be sent. At the same time, the register timer is set to the value obtained
from the Windows registry. Then the agent moves to the Preparation state.
Now in this state, if an acknowledgement message has not been received,
the agent will need to re-send the registration message. Then upon
successful registration, the agent moves to the active state. If at this stage a
query message is sent, then the agent sends a query response message,
sending the same information that is present in a performance report about
the load, utilization etc.
� g_ReadReadyEvent – This event will be set when the socket event
FD_READ occurs. This further means that some data is present on the
socket and that the agent needs to read this data. Again depending upon the
current agent state, appropriate action is taken. If the agent is in the idle state
at this stage, nothing needs to be done because an idle state indicates that
the agent has not even registered with the broker yet. The BrokerHandler
thread just breaks out of the loop here and does nothing since this is the
wrong state to receive any messages. In the preparation state, the agent (the

62
BrokerHandler thread) first checks to see if the received message is the
acknowledgement for the registration sent earlier by the agent. With this
REGISTER_ACK message, the broker also sends an ID for this agent as well
as performance report interval. If the register timer is still found to be active, it
is killed at this stage since now there is no need for registration. Now that the
performance report interval is known, the BrokerHandler thread sets the
PerfReportTimeOut timer to this value. So every time this timer expires, the
performance report has to be sent out. The successive setting of this timer is
taken care of by Windows WM_TIMER event. If the received message on the
socket, while the agent is in the preparation state, is the QUERY_MSG, then
the agent’s BrokerHandler thread prepares to sent the QUERY_RESP_MSG.
The agent’s BrokerHandler thread can receive this QUERY_MSG even while
the agent is in its active state. So again, the QUERY_RESP_MSG needs to
be sent out.
� g_SocketCloseEvent – Upon receiving this event, the two timers, namely,
RegisterTimer and PerfReportTimer are killed, the socket is closed and the
thread terminates.
� g_AgentExitEvent – Upon receiving this event, the two timers, register timer
and the performance report timer are killed, the socket is closed and the
thread exits.
� g_PerfReportTimeOutEvent – The time interval for performance reports to be
sent to the broker is set by the broker. Upon the expiry of this time interval,
the performance report is prepared, with data including information on server
63
load, g_ServerLoad, the server utilization, g_ServerUtilization, the report
sequence number (so that subsequent reports can be tracked), SeqNumber,
the mean response time, g_ServerMRTime, and the mean think time, for
which again we would need to lock the data during its access.
� g_RegisterTimeOutEvent – The registration timeout interval (i.e. if the
acknowledgement is not received from the broker, the registration message
has to be resent after this interval) is taken from the Windows.

64
6 Manual Test scenario
Start the three entities, that is, the Apache server, the monitoring agent and the
QoS broker. The order is not important. Then open a web browser (Netscape
Navigator or Internet Explorer) on the same machine or from a different machine.
If it started on the same machine, open the URI “http://localhost” or open the URI
<http://IPAddress of the Apache server>. You should see a welcome page. Then start
browsing the pages in the web site. Please note that if you step out to the
Internet, the local Apache server is not the one that services your request and
hence you may not see the transactions registered. From the QoS broker send a
few queries. Let the setup run for few minutes or hours and if possible run more
clients on different machines and increase the load on the server. After you exit
the QoS broker and the monitoring agent, you can open the serverlog.txt and
clientlog.txt in the monitoring agent directory and QoS broker directory to see if
the performance reports were correctly generated and the query from the clients
were responded properly.
Upon running the whole setup, it was found that proper variables from the
Apache server were transmitted to the monitoring agent and then after
subsequent calculations of performance parameters, the agent passes on these
parameters to the broker. The log texts for the agent and the broker are present
in the serverlog.txt and clientlog.txt files, respectively. The messages in these log
texts clearly indicate the proper functioning of the protocol and the entities.
A more advanced test scenario would be as follows:

65
When the Apache Web server with the monitoring agent are installed and run on
one machine, the client requests could come in from another machine at a
different geographical location and the broker runs at a third location. Such a
scenario would be closest to the real-time applications for this monitoring agent.
In fact, there had been a plan to do such a test where we could run the Apache
at DSRG lab in Ottawa University, the client requests could come in through an
e-commerce traffic generator implemented by a Carleton University student and
Mohamed’s implementation of the planned broker could run on a machine in his
lab at the University of Montreal.

66
7 Conclusions
This project aims at building a performance monitoring system for the Apache
web server, using IBM’s ARM API function calls which are inserted in proper
places within the server code. These calls send out triggers to another entity,
called the monitoring agent. The agent would then calculate the performance
attributes based on these triggers. And finally a third entity called the broker
would perform the actual load sharing between the various servers within the
network, thereby providing optimal performance.
Such an implementation is especially useful for electronic commerce applications
where load sharing is vital to a company’s profits. A customer to the company’s
ordering web site could be turned away if the particular server is already heavily
loaded. On the other hand, once the broker gets information about what the load
on each server on the network is, it can appropriately re-direct the incoming client
request to the lightly loaded server.
This implementation may very well be extended to measure other parameters
than the ones that have been mentioned in this report. Also since the ARM API
functions are not application specific, a similar work can be done for other types
of servers like FTP servers, Mail servers, Database servers etc.
Some future extensions to this project could be
� Using SNMP for the Web server management ,
� Having proper user interfaces (U/Is) in the form of self-explanatory GUIs
whereby tools like Microsoft Excel may be used to show the server
performance attributes in the form of graphs, etc.
67
8 Appendix A – Monitoring agent Code
(MultiServerThread_v2.cpp)

68
9 Main Apache source code (http_main.c)
69
10 Appendix B – ARM Instrumented Apache Server Code
(Logagent.c)
70
11 Appendix C – Prototype QoS broker Code (Client_v1.cpp)

71
12 Header file for the ARM-instrumented Apache code and theMonitoring agent code (arm_instr.h)

72
13 Header file for the monitoring agent and the QoS brokercodes (QoSBrokerIf.h)
73
14 Appendix D – General User Guidelines
Upon initialization, the agent reads the configuration parameters from the
Windows Registry. These parameters are stored in the key
“HKEY_LOCAL_MACHINE\Software\CITR\monitoring agent “. The configuration
parameters are
� AgentQueryPort – This is the UDP port number on which the agent listens for
query requests from the broker. The default value for this port number can be
6000. However if on some machine on which the agent is running this port
number is reserved, an appropriate error log message (that the agent is not
able to bind to this local port number) shows up in the serverlog.txt file so that
the user may go to the right Windows registry entry and change this value to
something else.
� ApacheClusterName – This is the public cluster name for a bunch of servers
to which this particular server belongs. If the server moves to another cluster
at a different location, the registry entry has to be changed by the user. The
broker uses this value to find out which cluster this particular server belongs
to.
� ApacheServerName – This is the name of the particular server belonging to
the cluster name mentioned above. Again this information is necessary for the
broker to identify the server in a bunch of servers.
� PipeName – This gives the name of the pipe which is used by the agent and
Apache server to communicate with each other. The Apache server creates

74
this named pipe and the agent has to know the name to be able to open the
same pipe to read the data written by Apache. The first three characters
should be “\\.” If the server and the monitoring agent are on the same
machine. Else the “.” should be replaced by the host name of the machine on
which the Apache server is running.
� QoSBrokerName – This gives the fully qualified domain name / host name /
IP address (in dotted notation) of the QoS broker so that the agent can
determine the IP address of the broker based on its name.
� QoSBrokerPort – This gives the broker’s UDP port number to which the agent
sends its registration message, performance reports and query response
messages.
� RegisterTimeOut – This gives the time after which an agent will need to re-
send a registration message to the broker, if it hasn’t received an
acknowledgement message from the broker.
� ThinkTimeOut – This value gives the time after which the think time
calculating structure is cleaned up, i.e. the collected data is used to calculate
the mean think time and passed on to the broker as a part of the performance
report. In this project implementation, this value has been set to be equal to
the performance-reporting interval.
The three major entities in this project, namely, the Apache server, the
monitoring agent could be run on one machine or two different machines
depending on the type of IPC used to compile the monitoring agent and the
Apache server. If shared memory is used, the Apache server and the monitoring

75
agent should be run on the same machine. If “Pipe” is chosen, they could be run
on two different machines and the registry should be updated properly as
explained above. The QoS broker could be run on the same machine or a
different machine as mentioned earlier.
The three entities could be started in any order. The Apache server should be
started from a console window. The Apache server can also be run as an NT
service. In order to do this, the user should install the Apache server as an NT
service. He / she should then manually copy the changed ApacheCore.dll from
the Apache source directory or run the install option of nmake.exe, for example
“nmake /f Makefile.nt installd INSTDIR=dir “ for Windows NT. Refer to [3] for
more information on the installation of the Apache server.
76
15 Appendix E – Compiling the Modules
� Compiling Apache Server
Apache server should be compiled from an MS DOS Console window using the
nmake command. All the compilation should be done within the Microsoft Visual
C++ IDE (Integrated Development Environment). More information is given in [3].
� Compiling monitoring agent
To compile the monitoring agent, open MultiServerThread_v2.dsw file and do
“Rebuild all” from the Build menu of Visual Studio.
� Compiling prototype QoS broker
To compile the QoS broker, open Client_v1.dsw workspace file and do “Rebuild
all” from the Build menu of Visual Studio.

77
References
1. The ARM Web page < http://www.cmg.org/regions/cmgarmw/index.html>
2. The Apache Server web page <http://www.apache.org/>
3. http://www.apache.org/docs/windows.html#comp
4. Windows NT MSDN Library
5. Unix Network Programming – by Richard Stevens