Performance Measurement of Design Patterns for Service-Oriented Architecture · PDF...
99
Performance Measurement of Design Patterns for Service-Oriented Architecture by Muhammad Kaleem Khan A thesis submitted to the Faculty of Graduate Studies and Research in partial fulfillment of the requirements for the degree of Master of Applied Science in Electrical and Computer Engineering Ottawa-Carleton Institute for Electrical and Computer Engineering Department of Systems and Computer Engineering Carleton University Ottawa, Ontario January 2013 ©Copyright 2013, Muhammad Kaleem Khan
Transcript of Performance Measurement of Design Patterns for Service-Oriented Architecture · PDF...

Performance Measurement of Design Patterns for Service-Oriented Architecture
by
Muhammad Kaleem Khan
A thesis submitted to the Faculty of Graduate Studies and Research
in partial fulfillment of the requirements for the degree of
Master of Applied Science in
Electrical and Computer Engineering
Ottawa-Carleton Institute for Electrical and Computer Engineering
Department of Systems and Computer Engineering
Carleton University Ottawa, Ontario
January 2013 ©Copyright 2013, Muhammad Kaleem Khan

1+1Library and Archives Canada
Published Heritage Branch
Bibliotheque et Archives Canada
Direction du Patrimoine de I'edition
395 Wellington Street Ottawa ON K1A0N4 Canada
395, rue Wellington Ottawa ON K1A 0N4 Canada
Your file Votre reference
ISBN: 978-0-494-94264-2
Our file Notre reference ISBN: 978-0-494-94264-2
NOTICE:
The author has granted a nonexclusive license allowing Library and Archives Canada to reproduce, publish, archive, preserve, conserve, communicate to the public by telecommunication or on the Internet, loan, distrbute and sell theses worldwide, for commercial or noncommercial purposes, in microform, paper, electronic and/or any other formats.
AVIS:
L'auteur a accorde une licence non exclusive permettant a la Bibliotheque et Archives Canada de reproduire, publier, archiver, sauvegarder, conserver, transmettre au public par telecommunication ou par I'lnternet, preter, distribuer et vendre des theses partout dans le monde, a des fins commerciales ou autres, sur support microforme, papier, electronique et/ou autres formats.
The author retains copyright ownership and moral rights in this thesis. Neither the thesis nor substantial extracts from it may be printed or otherwise reproduced without the author's permission.
L'auteur conserve la propriete du droit d'auteur et des droits moraux qui protege cette these. Ni la these ni des extraits substantiels de celle-ci ne doivent etre imprimes ou autrement reproduits sans son autorisation.
In compliance with the Canadian Privacy Act some supporting forms may have been removed from this thesis.
While these forms may be included in the document page count, their removal does not represent any loss of content from the thesis.
Conformement a la loi canadienne sur la protection de la vie privee, quelques formulaires secondaires ont ete enleves de cette these.
Bien que ces formulaires aient inclus dans la pagination, il n'y aura aucun contenu manquant.
Canada
A b s t r a c t
Service-Oriented Architecture (SOA) is a computing paradigm where large complex
applications are composed of independent components offering services to one another
through well-defined interfaces. SOA patterns provide generic solutions for different
architectural, design and implementation problems of SOA applications. SOA patterns
differ in scope and objectives, so their effect on system performance is also different,
either positive or negative. SOA patterns introduce means of reliable messaging.
Application of patterns facilitates workflow implementations ensuring business processes
are completed once started despite system failures. Platform vendors provide native
implementation to some patterns hidden from developers. Such enhancements to web
service systems compromise system performance. This thesis aims to measures
performance effects of applying different patterns at various levels, helping SOA
designers to better understand performance impacts of their applications and provide
knowledge to make trade-offs between performance and other software properties
affected by patterns. A predictive evaluation approach will demonstrate estimating
performance early in the lifecycle.
Table of Contents
A b s t r a c t ....................................................................................................................... iii
Table o f C o n te n ts ...........................................................................................................................................iv
A c r o n y m s ........................................................................................................ vii
List of F igu res ..................................................................................................................... viii
List of T a b le s .....................................................................................................................................................x
1 INTRODUCTION..................................................................................................................................... 11.1 M otivations and objectives....................................................................................................... 11.2 Proposed ap p ro ach ....................................................................................................................... 31.3 Thesis contributions ......................................................................................................... 51.4 Thesis contents ................................................................................................................................ 6
2 BACKGROUND.........................................................................................................................................72 .1 SERVICE ORIENTED ARCHITECTURE ........................................................................................7
2.1.1 SOAP........................................................................................................................................... 92.1.2 WEB SERVICES.........................................................................................................................92.1.3 WSDL....................................... .............................................................................................. 102.1.4 WORKFLOW (ORCHESTRATION)....................................................................................11
2 .2 DESIGN PATTERNS............................................................................................................. 122 .3 SOFTWARE PERFORMANCE ENGINEERING .................................................. 142 .4 TOOLS FOR SOA DEVELOPMENT ............................................................................................16
2.4.1 M icrosoft Biztalk se rv e r 2 0 1 0 .........................................................................................162.4.2 Soap-UI.................................................................................................................................... 192.4.3 Load-UI.................................................................................................................................... 202.4.4 Biztalk O rchestra tion Profiler........................................................................................ 20
3 PERFORMANCE MEASUREMENTS OF PLATFORM-PROVIDED PATTERNS...................213.1 INTRODUCTION ............................................................................................................................213 .2 RELIABLE MESSAGING ................................................................................................................23
3.2.1 PROBLEM............................................................................................................................... 233.2.2 SOLUTION............................................................................................................................... 233.2.3 APPLICATION.........................................................................................................................23
3 .3 PIPES AND FILTERS FOR MESSAGING ..................................................................... 253.3.1 PROBLEM............................................................................................................................... 253.3.2 SOLUTION............................................................................................................................... 253.3.3 APPLICATION.........................................................................................................................26
3 .4 PUBLISH/SUBSCRIBE................................................................................................................... 2 73.4.1 PROBLEM............................................................................................................................... 273.4.2 SOLUTION........................................................................ '.................................................... 27
V
3.4.3 APLLICATION.........................................................................................................................273.4.4 DEHYDRATION AND REHYDRATION............................................................................. 28
3 .5 CORRELATION IDENTIFIER .........................................................................................................293.5.1 PROBLEM............................................................................................................................... 293.5.2 SOLUTION ...................................................................................................................... 29
3 .6 PERFORMANCE IMPACT OF PLATFORM-PROVIDED PATTERNS..................................313.5.1 INVOCATION OF A WORKFLOW SERVICE.......................................... 323.6.2 INVOCATION OF A SIMPLE SERVICE............................................................................. 333.6.3 PERFORMANCE OVERHEADS OF WORKFLOW SERVICE AND SIMPLESERVICE INVOCATION ...........................................................................................................34
3 .7 PERFORMANCE IMPACT OF MESSAGE S IZE .................................................................... . 3 73.7.1 R esponse Time M e a s u re m e n ts fo r 1 KB.....................................................................373.7.2 R esponse Time M e a s u re m e n ts fo r 10 KB.................................................................. 383.7.3 R esponse Time M e a s u re m e n ts fo r 100 KB................................................................383.7.4 R esponse Time M e a s u re m e n ts fo r 200 KB................................................................393.7.5 R esponse Time M e a s u re m e n ts fo r 400 KB................................................................393.7.6 R esponse Time M e a s u re m e n ts fo r 600 KB................................................................403.7.7 R esponse Time M e a s u re m e n ts fo r 800 KB................................................................403.7.8 R esponse Time M e a s u re m e n ts fo r 1000 KB............................................................. 41
4 PERFORMANCE MEASUREMENTS OF APPLICATION-LEVEL PATTERNS........................ 434.1 Introduction .................................................................................................................................... 434 .2 Message Translator..................................................................................................................... 4 6
4.2.1 PROBLEM............................................................................................................................... 464.2.2 SOLUTION............................................................................................................................... 464.2.3 APPLICATION.........................................................................................................................464.2 .4 MESSAGE TRANSLATOR PERFORMANCE MEASUREMENTS................................48
4 .3 Aggregator - Parallel Convoy ........................................................................ 494.3.1 PROBLEM............................................................................................................................... 494.3.2 SOLUTION........................................................ 494.3.3 APPLICATION.........................................................................................................................494.3.4 PARALLEL CONVOY MEASUREMENTS..........................................................................52
4 .4 Aggregator - Sequential C onvoy ............................................................................................5 64.4.1 PROBLEM................................................................................................................................564.4.2 SOLUTION............................................................................................................................... 564.4.3 APPLICATION......................................................................................................................... 574.4.4 SEQUENTIAL CONVOY PERFORMANCE MEASUREMENTS................................... 58
4 .5 Content Based Router..................................................................................................................614.5.1 PROBLEM................................................................................................................................614.5.2 SOLUTION............................................................................................................................... 614.5.3 APPLICATION.........................................................................................................................614.5 .4 CONTENT BASED ROUTER MEASUREMENTS............................................................ 62
4 .6 Scatter and G a th e r ................ ,................................................................... 644.6.1 PROBLEM................................................................................................................................64
vi
4.6.2 SOLUTION............................................................................................................................... 644.6.3 APPLICATION......................................................................................................................... 654.6.4 SCATTER AND GATHER MEASUREMENTS.................................................................. 65
4 .7 Orchestration Instance Creation A ND restoration a fte r long w a it ............................664 .8 RESPONSE TIM E MEASUREMENT CHALLENGES................................................................68
5 PREDICTIVE PERFORMANCE EVALUATION................................................................................... 7 05.1 INTRODUCTION ............................................... 705 .2 CASE STUDY .....................................................................................................................................705.3 DESIGN.......................................................................................... 71
5.3.1 RESPONSE TIME ESTIMATION......................................................................................... 725 .4 SYSTEM IMPLEMENTATION IN BIZTALK............................................................................... 75
5.4.1 MEASUREMENTS.................................................................................................................. 775.4.2 CONFIDENCE INTERVAL OF MEASUREMENTS..........................................................77
5.5 ESTIMATION W ITH VARIABLE MESSAGE SIZE .................................................................... 78
6 CONCLUSIONS............................................................................................................................................... 816.1 Limitations o f the w o rk .............................................................................................................. 836.2 Future w o rk .................................................................................................................................... 84
R e fe r e n c e s ................................................................................................................................................................ 8 6
A c r o n y m s
API - Application Programming Interface
BRE - Business Rules Engine
DB - Database
EMR - Electronic Medical Records
XML - Extensible Markup Language
FIFO - First In First Out
HTTP - Hyper Text Transfer Protocol
IIS - Internet Information Services
MSMQ - Microsoft Messaging Queue
REST - Representational State Transfer
SLA - Service Level Agreement
SOA - Service-Oriented Architecture
SOAP - Simple Object Access Protocol
URL - Uniform Resource Locator URL
WCF - Windows Communication Foundation
WSDL - Web Services Description Language
XSD - XML Schema Definition
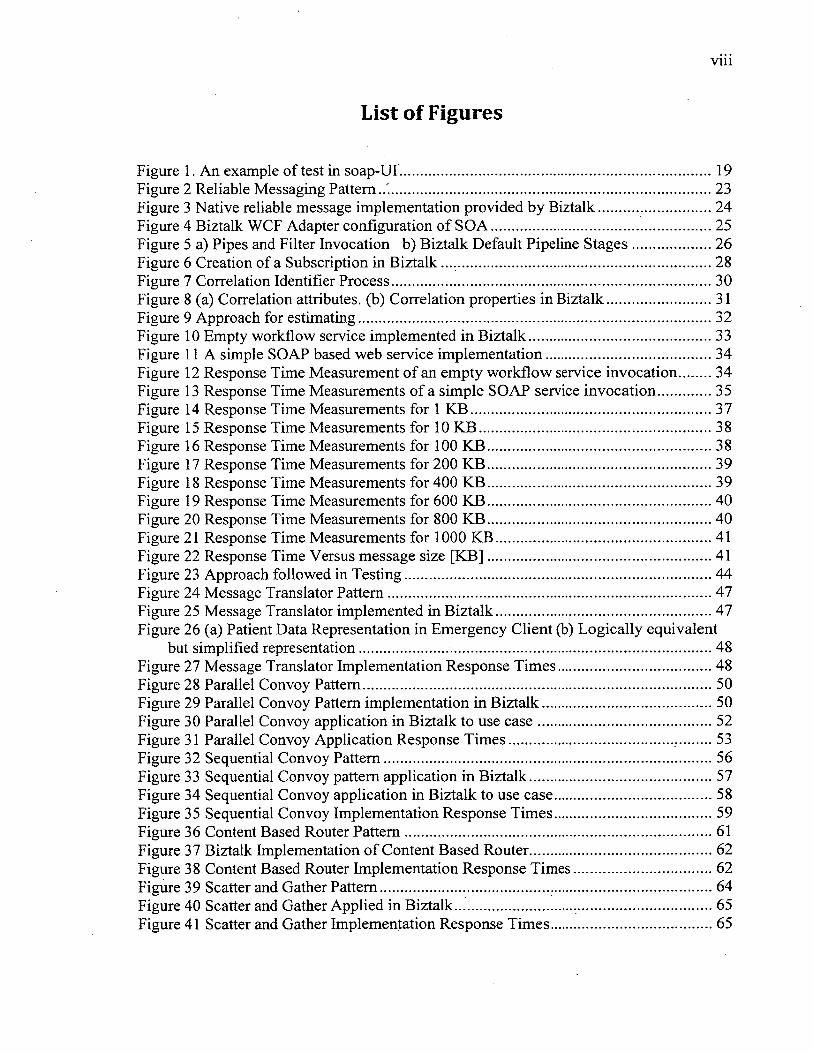
List of Figures
Figure 1. An example of test in soap-UI............................................................................... 19Figure 2 Reliable Messaging Pattern..'..................................................................................23Figure 3 Native reliable message implementation provided by Biztalk.............................24Figure 4 Biztalk WCF Adapter configuration of SOA........................................................25Figure 5 a) Pipes and Filter Invocation b) Biztalk Default Pipeline Stages.................... 26Figure 6 Creation of a Subscription in Biztalk ................................................................ 28Figure 7 Correlation Identifier Process.................................................................................30Figure 8 (a) Correlation attributes, (b) Correlation properties in Biztalk...........................31Figure 9 Approach for estimating........................ 32Figure 10 Empty workflow service implemented in Biztalk.............................................. 33Figure 11 A simple SOAP based web service implementation.......................................... 34Figure 12 Response Time Measurement of an empty workflow service invocation 34Figure 13 Response Time Measurements of a simple SOAP service invocation.............. 35Figure 14 Response Time Measurements for 1 KB.............................................................37Figure 15 Response Time Measurements for 10 KB...........................................................38Figure 16 Response Time Measurements for 100 KB....................................................38Figure 17 Response Time Measurements for 200 KB....................................................39Figure 18 Response Time Measurements for 400 KB....................................................39Figure 19 Response Time Measurements for 600 KB....................................................40Figure 20 Response Time Measurements for 800 KB....................................................40Figure 21 Response Time Measurements for 1000 KB.......................................................41Figure 22 Response Time Versus message size [KB].........................................................41Figure 23 Approach followed in Testing..............................................................................44Figure 24 Message Translator Pattern..................................................................................47Figure 25 Message Translator implemented in Biztalk.......................................................47Figure 26 (a) Patient Data Representation in Emergency Client (b) Logically equivalent
but simplified representation...................... 48Figure 27 Message Translator Implementation Response Times....................................... 48Figure 28 Parallel Convoy Pattern........................................................................................ 50Figure 29 Parallel Convoy Pattern implementation in Biztalk........................................... 50Figure 30 Parallel Convoy application in Biztalk to use case............................................ 52Figure 31 Parallel Convoy Application Response Times......................................... 53Figure 32 Sequential Convoy Pattern...................................................................................56Figure 33 Sequential Convoy pattern application in Biztalk.............................................. 57Figure 34 Sequential Convoy application in Biztalk to use case ;............................... 58Figure 35 Sequential Convoy Implementation Response Times........................................ 59Figure 36 Content Based Router Pattern..............................................................................61Figure 37 Biztalk Implementation of Content Based Router.............................................. 62Figure 38 Content Based Router Implementation Response Times................................... 62Figure 39 Scatter and Gather Pattern....................................................................................64Figure 40 Scatter and Gather Applied in Biztalk............................. 65Figure 41 Scatter and Gather Implementation Response Times......................................... 65

Figure 42 Prescription renewal workflow design (main workflow and insurance service) ........................................................................................................................................ 72
Figure 43 Implementation of insurance workflow in Biztalk............................................. 75Figure 44 Designer implementation of prescription re-fill workflow in Biztalk............... 76Figure 45 Patient prescription re-fill request workflow response times.............................77Figure 46 Response time for prescription refill workflow (with 800 KB messages) 79Figure 47 Response time for prescription refill workflow (with 400 KB messages) 79
X
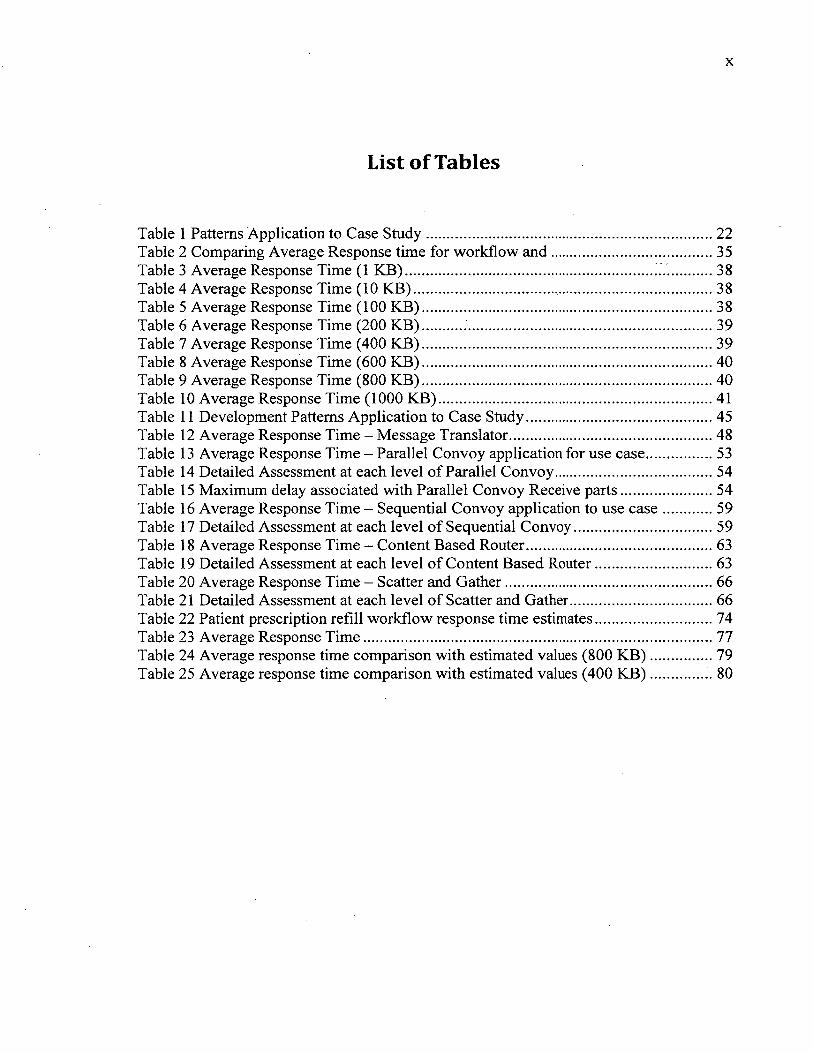
List of Tables
Table 1 Patterns Application to Case Study....................................................................... 22Table 2 Comparing Average Response time for workflow a n d ........................................35Table 3 Average Response Time (1 KB)................................................................. 38Table 4 Average Response Time (10 KB).................................. 38Table 5 Average Response Time (100 KB)......................................................................... 38Table 6 Average Response Time (200 KB) ..............................................................39Table 7 Average Response Time (400 KB)......................................................................... 39Table 8 Average Response Time (600 KB)......................................................................... 40Table 9 Average Response Time (800 KB)......................................................................... 40Table 10 Average Response Time (1000 KB)..................................................................... 41Table 11 Development Patterns Application to Case Study............................................... 45Table 12 Average Response Time - Message Translator................................................... 48Table 13 Average Response Time - Parallel Convoy application for use case................. 53Table 14 Detailed Assessment at each level of Parallel Convoy........................................ 54Table 15 Maximum delay associated with Parallel Convoy Receive parts.........................54Table 16 Average Response Time - Sequential Convoy application to use case ............. 59Table 17 Detailed Assessment at each level of Sequential Convoy................................... 59Table 18 Average Response Time - Content Based Router............................................... 63Table 19 Detailed Assessment at each level of Content Based Router..............................63Table 20 Average Response Time - Scatter and Gather.....................................................66Table 21 Detailed Assessment at each level of Scatter and Gather.................................... 66Table 22 Patient prescription refill workflow response time estimates.............................. 74Table 23 Average Response Time........................................................................................77Table 24 Average response time comparison with estimated values (800 K B )................ 79Table 25 Average response time comparison with estimated values (400 K B )............. ..80
1
1 INTRODUCTION
1.1 MOTIVATIONS AND OBJECTIVES
Service-oriented architectures (SOA) is a distributed computing paradigm where large
complex applications are composed of independent software components running on
heterogeneous platforms that offer services to one another through well-defined
interfaces. According to (Earl, 2005), SOA and the supporting technologies have matured
to the extent that proven design practices have been distilled in the form of SOA patterns,
which provide generic solutions for different architectural, design and implementation
problems. After years of research, reviews and validation, this body of work has been
documented as a comprehensive collection of over 90 generic SOA design patterns
(SOA-Pattems, 2012). Other publications express SOA patterns in terms that are specific
to a certain technology (Rostova, 2011) or give implementation examples in different
technologies (Hohpe and Woolf, 2003). There are different supporting technologies (also
known as service platforms) that support the implementation of SOA systems, each
providing different features for publishing, discovering and invoking services. Two well-
known SOA platforms are web services based on standard such as SOAP, Extensible
Markup Language (XML) and Web Services Description Language (WSDL) (Earl, 2005)
and Representational State Transfer (REST) services using HTTP verbs such as GET,
POST, PUT, etc. (Fielding, 2000). A side effect of using a service platform is the
performance overhead introduced by the platform operations; these overheads impact the
overall performance of a SOA application and are different from platform to platform.
The scope of different SOA patterns varies widely, from one single service, to a set of
services, to the extent of the entire enterprise architecture. The objectives of the SOA
design patterns are also very varied, each attempting to improve a certain functional or
non-functional property. Consequently, the effect of the design patterns on the system
performance is also very different: some have a positive effect while others a negative
one (which usually represents the price to pay by doing more work in order to improve
some other properties, such as maintainability, security, dependability, etc.).
Performance characteristics (such as response time and throughput) are essential quality
attributes of every software system, especially when humans are interacting with the
system and are waiting for replies or when the system needs to react to external events in
real-time. Many performance problems are due to fundamental architecture and design
factors rather than to inefficient coding (Smith and William, 2002). In order to assess
performance risks, quantitative performance assessments are necessary in early design
phases, when the system is not implemented yet and cannot be measured. For this reason,
the Software Performance Engineering (SPE) techniques proposed in the late 80’s have
been increasingly accepted and practiced (Smith, 1990), (Smith and William, 2002). SPE
proposes to use quantitative methods and performance models, such as Queueing
Networks (Lazowska et al., 1984), Layered Queueing Networks (Woodside et al, 1995)
or Petri Nets (Ajmone Marsan et al., 1995) to assess the performance effects of different
design and implementation choices through the development of a system. SPE supports
the idea that the integration of performance analysis into the software development
process, from the initial stages to the end, can insure that the system will meet its
performance objectives. This would eliminate the need for “late-fixing” of performance
problems, a frequent practiced approach that postpones any performance concerns until

the system is completely implemented. Late fixes tend to be very expensive and
inefficient, and the product may never reach its original performance requirements.
Since SPE proposes to use predictive performance models, the models need to indicate
the quantitative resource demands made by different parts of the software. Example of
resource demands are CPU execution time, number of visits to disk, number of
invocations of a service, etc. In general, it is difficult to estimate these numbers in the
early design phases. Besides the resource demands made by the application software
itself, the service platforms have also a performance cost, which needs to be captured in
the performance model. In order to build a performance model, the analyst needs to know
what resources are required and how much they are used by the application and by the
underlying platforms. It is important for application designers to understand the
performance overheads introduced by different service invocation mechanisms.
The objective of the thesis is to investigate the performance effects of different design
patterns through performance measurements and to get an idea of how long it takes to
execute them. The results will help SOA designers to better understand the performance
consequences of applying different patterns, and will give them insight and knowledge
for making better design decisions.
1.2 PROPOSED APPROACH
There are various tools and platforms with similar capabilities to implement SOA and
workflow solutions. Typically a tool provides the capability to design and host a business
process as well as integration with third party systems leveraging both proprietary and
standard protocols, such as SOAP based web services. In our research we have utilized
Microsoft Biztalk server to design and host business processes (BizTalk, 2010) mainly
because it is well known and also available. Biztalk Developer Edition was free, with
almost all the features offered by the Professional Edition. We used WCF (Windows
Communication Foundation) to expose the business processes created in Biztalk as
SOAP-based web services which will offer a WSDL interface to the client. We also used
SOAP-UI, which is a web service testing tool. It allows creating test cases to invoke web
services by generating a web service proxy on the client side. Also we utilized the
LOAD-UI tool to automate the execution of test cases created in SOAP-UI, as well as to
obtain statistics such as average response time of web service invocations.
We conducted our measurements of pattern applications around a case study in the health
care domain to handle and transfer patient data in emergency situations. This case study
has various use cases which we realized by applying different SOA design patterns,
mostly targeted to messaging and to service invocation. The implementation of some
patterns related to the invocation of services and messaging is provided natively by
Biztalk and is hidden from the user. We estimated the invocation overhead which
includes the hidden patterns by calling an empty business process which does nothing, so
its entire response time is due to the actual invocation. We built our system by
incrementally adding use cases of the case study, utilizing various patterns and measuring
the response time. Due to the fact that the response time is a stochastic variable, the
measurements of each experiment was performed repeatedly (usually around 180 times)
to estimate the variance and to achieve an acceptable level of confidence in the results.
The repeated requests were spread over one hour interval, leading to a frequency of 3
requests per minute, which allowed the system to complete a request before subsequent
test invocations, and thus to avoid the waiting of a request for previous ones. This was

done to insure that the resource usage was due to one request at a time. During
measurements, all other running processes were terminated (with the exception of
operating system processes over which the user has no control) in order to obtain
consistent measurements.
1.3 THESIS CONTRIBUTIONS
This research will allow getting better insight into performance patterns utilized in SOA
and overhead occurred in various stages of service-based workflow invocations.
Part of the outcome of this research has been published in the following paper:
M. Kaleem Khan, Dorina C. Petriu, “Performance Measurements of Design
Patterns for Service-Oriented Architecture”, Proc. of the International
Conference on Electrical and Computer Engineering ICECS’ 2012, Ottawa ON,
Canada, August 2012.
The thesis contributions are as follows:
• Measure the performance effects of SOA design patterns related to messaging and
service invocations, and study their dependency on the message size. For these
measurements, the design patterns were classified in two categories: patterns
implemented by the service platform (in our case the Biztalk server), which are
hidden from the developer, and patterns explicitly applied by the developer at the
application level.
• Predictive estimation of the response time for a new system in the design phase,
before it was implemented based on the patterns measurements results obtained
previously. After that, the system was implemented and measured, which allowed
us to verify the early predictions against the measurements of the real
implementation. This prediction approach gives the designer early insight into the
execution times for different service platform operations that include hidden
patterns, as well as application level patterns, allowing the developer to make
informed design decisions in early development phases.
1.4 THESIS CONTENTS
The thesis consists of six chapters.
Chapter two presents the background on concepts, such as SOA, Design patterns,
Software performance engineering, as well as on service platform (Biztalk Host),
development tools (Biztalk Orchestrations), and testing tools (SOAP-UI, LOAD-UI).
Chapter three investigates what design patterns are natively provided by platform, what is
their role and measures their cumulative overhead.
Chapter four presents the application development level SOA patterns by the application
of a case study in the health care domain handling patient data transfer in emergency
situations.
Chapter five presents the predictive estimation of end-to-end response time for a SOA
application in its early design phase. Then the application is implemented and measured,
in order to compare the estimated values against the actual measured performance.
Chapter six presents the conclusions and directions for future work.
2 BACKGROUND
In this chapter, we describe background knowledge regarding concepts, architecture,
tools and frameworks utilized in our research and development process. The following
issues will be discussed:
• SOA - Service Oriented Architecture
■ SOAP based Web Services, WSDL.
■ Business Processes or workflows. (In Biztalk server, these are also known
as Orchestrations).
■ Exposing Business Process as SOAP based web services.
■ Difference between simple SOAP based service and Orchestrations as
SOAP based service.
• Design Patterns, including SOA patterns
• Software Performance Engineering
• Tools for service-oriented development: Microsoft Biztalk Server.
• Tools for testing and statistics: soapUI, loadUI, Biztalk Orchestration Profiler.
2.1 SERVICE ORIENTED ARCHITECTURE
Service-oriented architectures (SOA) is a distributed computing paradigm where large
complex applications are composed of independent software components running on
heterogeneous platforms that offer services to one another through well-defined
interfaces(Earl, 2005). These services are well-defined business functionalities that are
built as software components that can be reused for different purposes. There are
different supporting technologies (provided by the service platforms) that support the
implementation systems, each providing different features for publishing, discovering

and invoking services. Two well-known service platforms are web services based on
standard such as SOAP, XML and WSDL (Earl, 2005) and Representational State
Transfer (REST) services using HTTP verbs such as GET, POST, PUT, etc. (Fielding,
2000). In this work, we use web services based on SOAP, XML and WSDL, which have
undergone an important standardization process.
SOA is not directly related to any technology, although it is most often implemented with
web services, which are very appropriate for SOA realization. However, just using web
services is not adequate to build SOA. We have to use web services according to the
design concepts that SOA defines (Earl, 2005). The service approach is ideally suited to
more loosely coupled systems. Some of the advantages of using SOA are:
• Modularity: As appropriate services are dynamically coupled, it is relatively easy
to integrate new services into the framework.
• Interoperability: Due to standardization of the communication and description of
the services, third party services can easily be incorporated as required.
• Extensibility: Due to the relative ease with which services can be incorporated
into a system, there is less danger of technology ‘lock-in’.
• High Autonomy: Services will likely be developed by distributed autonomous
teams.
• Coarse Granularity: Services will tend to be more coarse-grained than traditional
components, and there is a need to reconcile many aspects o f a complex activity.
• Process Awareness: Services will be driven by explicit business process, which
means there is a close relation to the domain workflows.

2.1.1 SOAP
Simple Object Access Protocol (SOAP) is a protocol for sending messages across
heterogeneous distributed systems. SOAP is based on XML. It is relatively easy for
humans to read and understand the structure of a SOAP message. SOAP messages are
always wrapped in a container called the envelope; the envelope always contains a body,
which carries the payload of the message in an XML documents. The envelope includes
headers that can optionally contain information like transaction context, security
information. If something goes wrong during processing, a SOAP fault will be added as
the body content and sent back to client (Hewitt, 2009).
An example of SOAP envelope <?xml version="1.0” ?><S:Envelope xmlns:S="h ttp ://schemas. xmlsoap. org/soap/envelope/">
<S:Header><ns2:username xmlns:ns2="http://soacookbook.com/">eben</ns2:username><ns2:password xmlns:ns2="http://soacookbook.com/">secret</ns2:password>
</S:Header><S:Body>
<ns2:verify xmlns:ns2="http://soacookbook.com/"><email>me@example. com</email>
</ns2:verify></S:Body>
</S :Envelope>
2.1.2 WEB SERVICES
Web services are a commonly used technology for interoperability and integration of
applications and information systems. They are a suitable technology often used for the
implementation of SOA. Web services provide the foundation for achieving
interoperability between applications using different software platforms, operating
systems, and programming languages. They are built on XML most commonly with
SOAP or Representational State Transfer (REST) protocols. A Web Service can provide
one or more operations, which look like an ordinary function call to the client. The client

10
generates a proxy method to call web services and these calls are translated into a SOAP
envelope and transmitted across the wire to the server or service provider. Operations in
web services are based on the exchange of XML-formatted payloads. They are a
collection of input, output, and fault messages. The combination of messages defines the
type of operation (one-way, request/response, solicit response, or notification).
2.1.3 WSDL
WSDL is the acronym for Web Service Description Language, which was defined as a
way to describing a web service in a platform independent manner. The client uses the
WSDL definition to generate a proxy, which is then invoked like an ordinary method call,
public String verify(@WebParam(mode=WebParam.Mode.IN, name-'emaiT')String email,
@WebParam(mode=WebParam.Mode.INOUT, header=true, name="usemame") Holder<String> username,
@WebParam(mode=WebParam.Mode. INOUT, header=true, name="password") Holder<String> password){ // Do Something }
The WSDL for the above JAVA implementation is expressed as
cmessage name="verify"><part name="parameters" element="tns:verify"></part><part name="username" element="tns:username"x/part><part name="password" element="tns:password"x/part>
</message><portType name="EmailCheck">
<operation name="verify" parameterOrder="parameters username password"><input message="tns:v er ify " x /in p u t><output message=”t n s :verifyResponse"></output>
</operation></portType><binding name="EmailCheckPortBinding" type="tns: EmailCheck">
<soap:binding transport="http://schem as.xm lsoap.org/soap/http" style="document"x/soap :binding><operation name="verify”>
<soap:operation soapAction=""x/soap:operation><input>
<soap:body use="literal" parts="parameters"x/soap:body><soap:header message="tns:verify" part="username"

u se=" litera l"x /soap:header><soap:header message="tns:verify" part="password” use=” l i t e r a l" x / s o a p : header >
</input><output>
<soap:body use=”l i t e r a l" parts="result"x/soap:body><soap:header message=”t n s :verifyResponse" part="usernalne,' use=”l i t e r a l ”x /soap :h ead er><soap:header message=”t n s :verifyResponse" part="password” use="literal"x/soap:header>
</output></operation>
</binding>
<service name="EmailCheckService"><port name="EmailCheckPort" binding="tns:EmailCheckPortBinding">
<soap:address location="http://localhost:8080/TestHeaders/EmailCheckService"> </soap:address>
</port></service>
2.1.4 WORKFLOW (ORCHESTRATION)
Workflow represents a sequence of connected steps that represent an abstraction of real
work, and are used to design and develop long running business processes. There are
many model-driven workflow development tools providing the ability to design
workflows graphically, which are easier to design, maintain or make changes than writing
code. For example, a workflow could be receiving Order-1 from customer-1, then in the
next step confirming their payment information, finding the customer address and finally
sending a message to warehouse for actual shipment. Workflow can also contain alternate
paths, such as if payment cannot be verified, then inform the customer.
Workflow services are the result of exposing a workflow as a Web Service, which to the
client looks like an ordinary web service described by its WSDL, as mentioned in the
previous section. Behind the scene, workflows have lot more functionality than a plain
web service, but this also affects the performance of the system. Workflows are hosted in
an environment such as the Biztalk server discussed in section 2.4.1. The hosting

12
environment offers many feature like message persistence and routing through end points
as discussed in section 2.4.1.
2.2 DESIGN PATTERNS
A design pattern explains a particular design problem that arises in a specific design
context and gives a well-proven solution for the problem. The first book of design
patterns (Gamma et al., 1995), documented the structure and participants in common
object-oriented program microstructures. A pattern language is a family of interconnected
patterns that define a process for resolving software development problems
systematically.
Design patterns can be seen as a means of transferring design knowledge. They represent
an efficient way of studying and later on reusing the designs of experienced software
engineers. In contrast to a methodology that tells us how to do something, a design
pattern shows us how to do it. Object-oriented design patterns are intended to alleviate
costly rediscovery and reinvention of core software concepts and abstractions. Patterns
provide a way to encapsulate the design knowledge that offers solution to standard
software development problems. However, patterns could only enable reuse of abstract
design and architecture knowledge, and do not directly provide reusable code.
The research field of design patterns is very fertile. The scale of design pattern varies
from architectural level, to mid-level design to language idioms (Buschmann et al, 1995),
(Schmidt et al., 2000). Design patterns have been investigated for different domains, such
as security and service-oriented architecture.
Different security patterns and security pattern systems are presented in (Schumacher,
Roedig, 2001) and (Yoder and Barcalow, 1997), where a security pattern describes a

certain recurring security problem and presents a well-proven generic scheme for its
solution, while a security pattern system is a collection of security patterns that are
implemented and combined for practical use.
In the SOA world various patters are defined which are meant to improve both non
functional and functional qualities of the system. Different authors use a variety of
notations and vocabulary to describe the patterns. For instance, (Earl, 2009) defines
various categories of patterns which are very general and valid for any SOA systems,
regardless of the technology that supports the implementations, whereas there are patterns
that focus on a specific technology and are more specific.
Moving one step further, the enterprise application integration patterns (Flohpe and
Woolf, 2003) mainly expand on Service Messaging, Transformation and Common
Compound Design categories of the patterns from (Earl, 2009). These patterns provide
generic solutions when creating documents schemas, perform message translation,
message routing to specific or multiple parties and sequencing of various steps to form a
workflow solution as well ways to implement communication mechanisms such as
synchronous/asynchronous communications and message queuing.
Various platform vendors provide native implementation of some patterns, using their
proprietary vocabulary. Further they provide guidelines to developers in form of patterns
that can be leveraged at design time, such as sequential and parallel convoys. Many of the
patterns at finer granularity are implemented as part of the platform and offer native
Application Programming Interface (API) implementations. For example, BizTalk server
creates many different databases, such as MessageBox and Subscription, when it is
14
installed, which support the realization of many patterns described in (Erl, 2009) as
platform-provided patterns.
2.3 SOFTWARE PERFORMANCE ENGINEERING
Software Performance Engineering (SPE) is a systematic, quantitative approach to
construct software systems to meet their performance objectives proposed by Connie
Smith (Smith, 1990). SPE uses quantitative performance models to identify architectural,
design, and implementation alternatives that will meet performance objectives (Smith,
1990), (Smith and William, 2002). SPE is a model-based and software-oriented approach.
Modeling is central to both SPE and object-oriented development. By building and
analyzing performance models of the proposed software, we can discover its
characteristics to decide if it will meet its requirements before we actually commit to
build it. Different kinds of performance models can be used, such as Queueing Networks
(Lazowska et al.,1984), Layered Queueing Networks (Woodside et al, 1995) , (Alhaj and
Petriu, 2010) (Mani et al, 2012) or Petri Nets (Ajmone Marsan et al., 1995). In SPE,
performance study begins as early as possible in the development process, when a
preliminary design exists.
It is believed that integration of software performance engineering into the software
development process will greatly improve the software quality and lower the risk of
software failure. The type of performance models used depends on the purpose of
analysis, the level of detail available, and the precision of the input data. Early in the
software development process, the knowledge of the software’s design and
implementation details is insufficient to model the system’s performance precisely.
Simple models with estimated parameters are used to get rapid feedback on whether the

proposed software is likely to meet the performance objectives. Rough performance
estimate at an early stage can prevent costly performance mistakes that may make the
systems miss its performance requirements by orders of magnitude. As software
development progresses, more and more details of the software design and
implementation become available, so it’s possible to replace the rough estimates of
resource usage with more detailed estimates or with measurements of actual usage.
Consequently, the accuracy of the performance predictions can improve while the project
progresses.
Software architectures need to be decided at the earliest stage in a software development
project. Architecture is a specification of the components of a system and the interaction
between them. Architecture guarantees certain behavioral properties o f a conforming
system and can be a powerful tool to aid the process of predicting the behavior of a
system with that architecture, of managing the construction of a system, and of
maintaining it.
The architectural decisions have the greatest impact on software quality. Although a
good architecture alone could not guarantee that the product will reach the quality goals,
a poor architecture surely can prevent their realizations. Inappropriate decisions or errors
at early stages will cost excessively or cause the failure of the project. Most performance
failures are because of a lack of consideration of performance issues early in the
development process and in the architectural design stage. The “fix-it-later” approach is
dangerous (Smith, 1990); it could not save the project if its major architecture is not
suitable to handle the required tasks, no matter how the software is implemented.
2.4 TOOLS FOR SOA DEVELOPMENT
2.4.1 Microsoft Biztalk server 2010
Microsoft BizTalk Server (BizTalk, 2010) provides a development and execution
environment that provides the ability to design and host workflow systems that run as
long as weeks or months. BizTalk Server features include the ability to define business
document specifications and how these documents have to be transformed when passed
between applications, and the ability to monitor and log server activity. These documents
are the XML based schema that defines structure of an actual document instance.
Biztalk server provides a standard gateway for sending and receiving documents across
the network as well as providing a range of services that ensures data integrity, delivery,
and security.
BizTalk Server features include the ability to define business document specifications
such as XML Schema Definition (XSD) schemas and how these documents have to be
transformed when passed between applications (messaging), and the ability to monitor
and log server activity. BizTalk Messaging Services provides the ability to send business
documents securely and reliably. BizTalk Orchestration or workflow services enable to
define the business processes that are used to create the messages and then implement
them using an integrated graphical environment.
BizTalk server provides many flexible developments features mentioned briefly below.
Orchestrations
The orchestration designer tool provides many shapes (i.e., diagram blocks) such as
receive and send to receive and send messages, respectively. It also has a Call Expression
shape to call any reusable code written in any language using .Net framework. The

17
Decision shape provides to write IF-ELSE logic in a graphical manner. The Construct
message and Transform shape together provide the capabilities to create new messages
inside the Orchestration.
Send Ports
BizTalk send ports provide a means of out-bound communication with outside world.
The send ports are created to send messages to other web services and other proprietary
interfaces such as SAP, Oracle, PeopleSoft etc. The send port implements an adapter to
convert BizTalk native messages which are XML to proprietary message format. Behind
the scene, a Biztalk send port implements Publish-Subscribe pattern as the out bound
messages are written to a MessageBox which is a relational database. There is
subscription resolution process that keeps monitoring the MessageBox. As soon as it
finds a message matching a particular subscription, it de-queues the message and
forwards it to the relevant send port for transmission or invokes a workflow instance if
the message is intended for a workflow. The send port also implements a message
translator pattern, which translates message from XML to the format expected by the
receiving party.
Receive Locations
Third party systems send messages to BizTalk receive ports which have a URI defined.
The receive location can implement an adapter to translate proprietary formats into XML
upon reception. The receive location implements the message translator pattern which
translates message from the sending party format to XML. Internally, Biztalk processes
all messages as XML. The receive location behind the scene also implements reliable
messaging pattern as it submits all inbound messages to MessageBox, which is
implemented as a relational database.
Receive Ports
Receive ports are logical grouping of receive locations. Biztalk orchestration can receive
messages from various sources in different format which have the same logical meaning.
Each receive location is created to handle a particular type of incoming message, whereas
a logical grouping of receive location into a receive port provides a unified interface to
the orchestration.
Web Service Invocation
BizTalk provides the ability to call 3rd party SOAP based web services. When a BizTalk
solution with a reference to SOAP based web service is deployed in a host environment,
it creates appropriate receive location and send ports for request-response operations of
the web service. A simple web service invocation does not have the overhead of reliable
messaging, publish-subscribe, pipe and filters and hydration and rehydration (described
in more details in the next chapter) however it does the job of forming a SOAP envelope
on the sending end and parsing of a SOAP envelope on the receiving end.
Orchestrations as SOAP Web Services
BizTalk provides the ability to expose an orchestration or workflow as a web service. To
the client, the WSDL appears as a normal web service with request-response operations
with a document schema, but when invoked, it starts an Orchestration within the BizTalk
environment. Orchestrations are utilized for business applications that require greater
degree of reliability involving communication with various business partners, for
example an airline reservation company may also offer car rental and hotel booking

19
services to its clients which requires use of orchestrations. The implementation of
orchestrations as web services requires reliable messaging, publish-subscribe, correlation
and hydration and rehydration, all of which are expensive to implement.
2.4.2 Soap-UI
soapUI (soap-UI, 2012) is a tool for Testing SOAP based Web Services. soapUI is an
Open Source and completely free tool with a commercial companion. soapUI can be
File loo ls Desktop Help
i l ^ f t @ j # o m m g m Search Forum j l a
ProjectsHi ContentBasedTest Hi GoogleServiceTest Hi MiscellaneousTests Hi OrchWithGoogleSrvTest Hi ParallelConvoyNewTest © - X BasicHttpBindingJTwoWayAsy Q " EB BasicHttpBindingJTwoWayAsy
Operationl TestCase S3 | r Test Steps 0.); *— Qperati o S
^ Load Tests (0)*© Security Tests (0)
S '" ^ 0peration2 TestCase © Test Steps P )( E @ Operation2r—^ LlTest Steps P ) | u ■<© Security Tests (0}
Hi ParalielConvoyTest Hi ScatterGatherPar.Test Hi ScatterGather_Test Hi SeRecTransfOneTest Hi SeifRouting_Test
•© SeqConvoyTest Hi SingleDSCall.Test Hi VanillaService Hi VaniHaService
f TestRequest Properties ] Test Properties
Property ValueNameDescription
Operationl
1 O p e r a t io n l ■ ■ * ■ • ■ ■* •- i □ tJ h ttp:// drver/ParallelService/Servicel .svc+l I? i O Q ________________________________ _
<s:Body> 1—<mis: Rootl xaln3:ia,is“»’,H ttp: //M iscellaneousTests. Port.
<FacilityIn£o><StAddress>23 bindings tiJay < / St Addres s>«City>Ottava</City><Province>OH</Province><PCodel>KlC4BS</PCodel>
</FacilityIn£o><TransferRecord>
<Date>2012-09-08</E>«te><Time>23: SS: SS</Tiioe><Hamel>Pred</I'Jamel><RelationBnail>johnQjohn. coa</ftelafcionBmai.L> <RelatxonPH>S13-222-4444</RelacionP;h:»- <Allergies>Hone-</Allergies> <PhysiciariHaiae>Roberti'</PhysxcianHame>- <Phys±c±&nEmail>robext@robert. coa</PhysicianEiai <PbysxcxanPb>S13-444—>666■</PbysAc:ianPll> < C urren tH ed ica tio rl> •N o n e< /C u rren tH ed ica tio n > <HospitalPre £>Gen.eral Campus</Hospit&lPre£>
</7rans f erBecord><Hospical>
<HospxtalIdl>4</HospxcalIdl> <HospicaiHame>Ganeral-</HospitaUJane>
</Hospital></ais:Rootl>
< / s : Body></s: Bnvelope>
A— Headers... Attachments... WS... WS-... iMS Head.,» J?/1$ Property...
^ Assertions (0) Request Log (9)
response tim e 2666ms (407888 bytes) 1:1
Figure 1. An example of test in soap-UI
used for functional, performance, interoperability, and regression testing of web services.
soapUI allows importing the WSDL definition of a web service, and then it generates a
2 0
web service proxy and client, and calls the web service. Beside many other functions, it
provides traces of SOAP messages exchanged by client and web service, as well as end-
to-end execution time measurement. It allows for the creation of test cases with
assertions, like any other unit testing tool or framework. Although soapUI allows
measuring end to end response time from the invocation of a web service until its
response is received, it lacks the ability to perform measurements at finer granularity,
such as eliminating the time required to form SOAP envelop and only measure the time
from invocation of orchestration to its completion. Figure 1 shows a test case as
implemented in soapUI.
2.4.3 Load-UI
LoadUI (loadUI, 2012) is a web service testing automation tool. It allows importing test
cases created in soapUI and then automatically invokes the test cases. Using loadUI, the
total testing can be defined as given number of test cases to be executed per second,
minute or hour. It has various data logging tools with capabilities to generate graphs and
summary reports.
Examples of graphs generated by loadUI are shown in Chapters 3 and 4.
2.4.4 Biztalk Orchestration Profiler
The orchestration profiler is a tool that provides instrumentation for Biztalk orchestration
execution. It generates reports over the specified time period and displays the time
consumes at each step of an Orchestration. However, it does not capture the time
consumed since the arrival of messages at a receive location until the orchestration
instance is created. This tool was used in the thesis for performance measurements.
21
3 PERFORMANCE MEASUREMENTS OF PLATFORM-
PROVIDED PATTERNS
3.1 INTRODUCTION
For developing service oriented application, there is lot of support and prebuilt
functionality provided by the development tools and runtime such as Biztalk server.
Many of these features or in some cases frameworks describe a pattern documented in
SOA literature. Implementation of these patterns provide infrastructure to develop
messaging applications and implementation of these patterns is part of plumbing
provided by platform such as Microsoft Biztalk. The developers are shielded away from
the complexity of implementing these patters. Because implementation of these patterns
is hidden under the platform, any changes to their application or measuring exact
performance overhead associated to them in isolation can be challenging. However,
during implementation of business processes in our case study, we found that a good
estimate of performance penalty can be gauged by eliminating the overhead caused by
known components from the end to end response time.
There are other patterns which are applied to problems in a business domain and onus of
implementation is on developer using the graphical notation provided by the vendor. The
implementation and naming of these patterns may vary from one tool to another. For
example, Microsoft documents Sequential and Parallel Convoy patterns to correlate
multiple arriving messages inside a given business process instance. We will examine
them in more detail in next chapter.
2 2
In this chapter, our focus is on components of Service Based system that are provided
natively by Biztalk server and will gauge the accumulative overhead caused by service
invocation. We will try to estimate the time required for execution of a component in
isolation wherever possible.
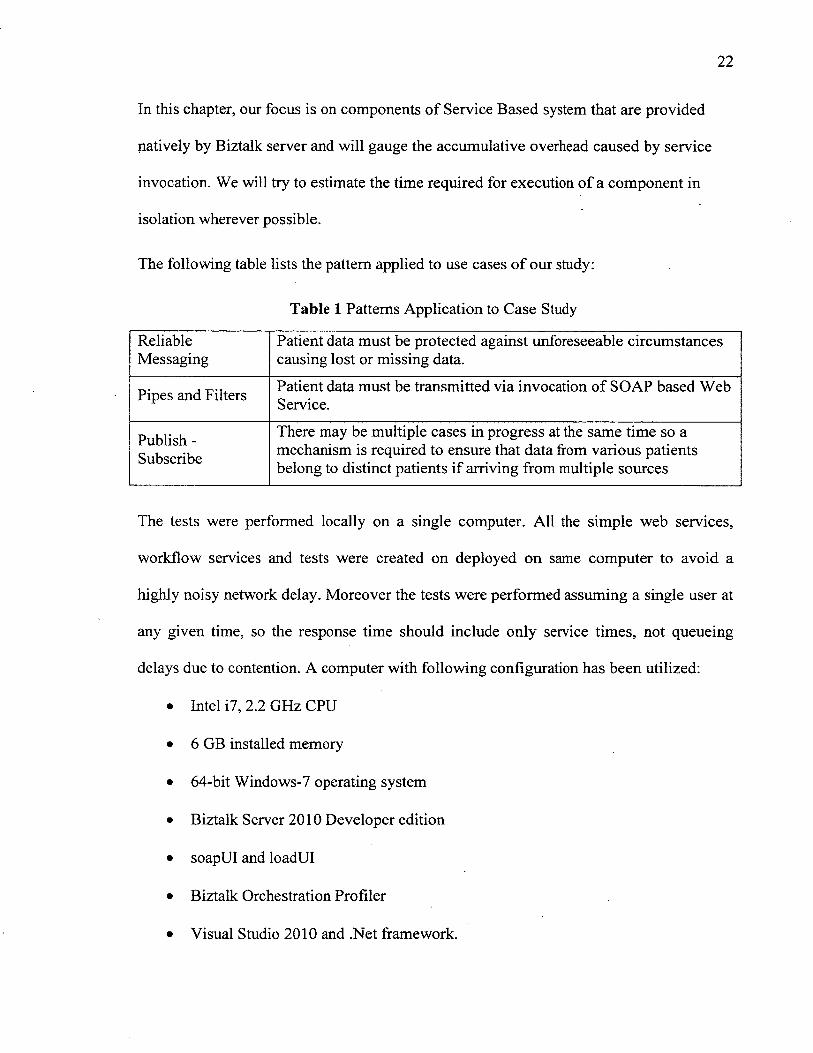
The following table lists the pattern applied to use cases of our study:
Table 1 Patterns Application to Case Study
ReliableMessaging
Patient data must be protected against unforeseeable circumstances causing lost or missing data.
Pipes and Filters Patient data must be transmitted via invocation of SOAP based Web Service.
Publish - Subscribe
There may be multiple cases in progress at the same time so a mechanism is required to ensure that data from various patients belong to distinct patients if arriving from multiple sources
The tests were performed locally on a single computer. All the simple web services,
workflow services and tests were created on deployed on same computer to avoid a
highly noisy network delay. Moreover the tests were performed assuming a single user at
any given time, so the response time should include only service times, not queueing
delays due to contention. A computer with following configuration has been utilized:
• Intel i7, 2.2 GHz CPU
• 6 GB installed memory
• 64-bit Windows-7 operating system
• Biztalk Server 2010 Developer edition
• soapUI and loadUI
• Biztalk Orchestration Profiler
• Visual Studio 2010 and .Net framework.
23
3.2 RELIABLE MESSAGING
3.2.1 PROBLEM
For real world problems, the reliable transfer of data is very important which otherwise
may result in unpleasant consequences. There is trade-off between using of reliable
messaging and performance as there is good deal of performance cost associated as
describe in following sections. Data may still be lost after being received due to power
failure, memory corruption etc. Further some processes may take longer to complete
which makes them more prone to such undesirable situations.
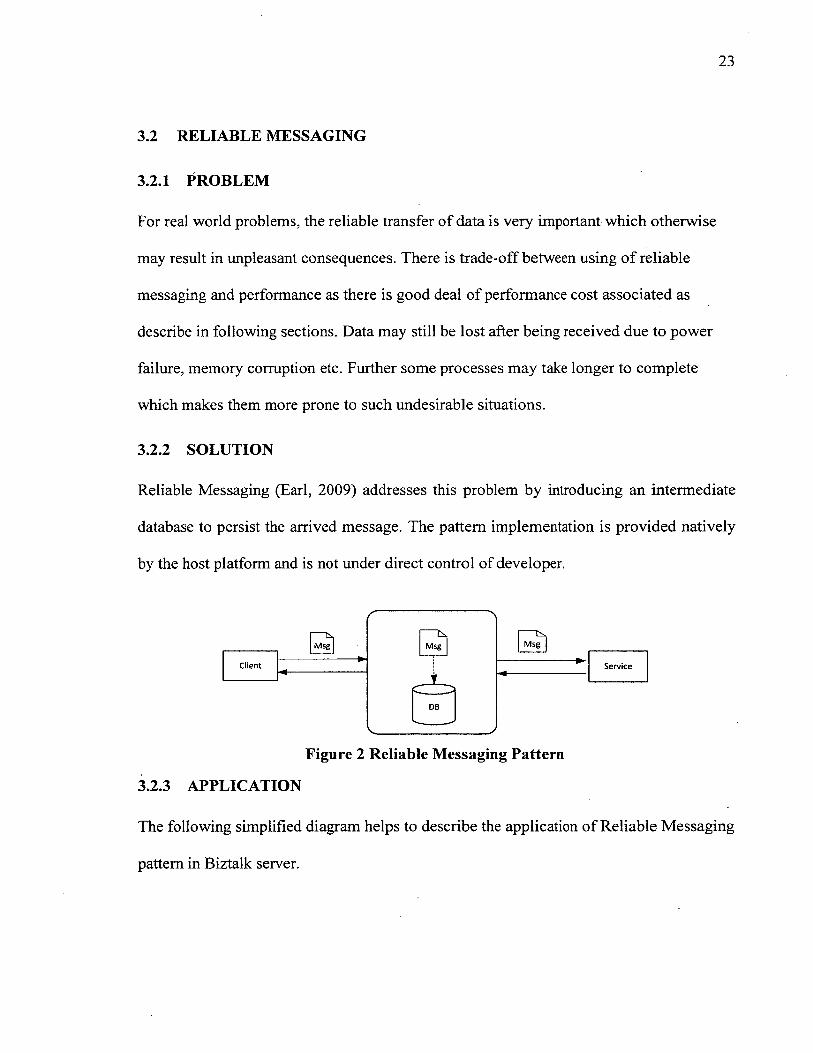
3.2.2 SOLUTION
Reliable Messaging (Earl, 2009) addresses this problem by introducing an intermediate
database to persist the arrived message. The pattern implementation is provided natively
by the host platform and is not under direct control of developer.
MsgMsg
Client Service
Msg
D8
Figure 2 Reliable Messaging Pattern
3.2.3 APPLICATION
The following simplified diagram helps to describe the application of Reliable Messaging
pattern in Biztalk server.
24
Client
M essage
A ctivate WCF Host
-------------yM ap to Biztalk Rec Loc
Pass To M essaging Engine
MS WCF A dap te r EndPoint M anager Biztalk M essaging Engine M essage A gent Biztalk M essa g e DB
M anage P ersistence to DB
P rocess th ro u g h P ipeline
P ersist m essag e to DB
----------------y
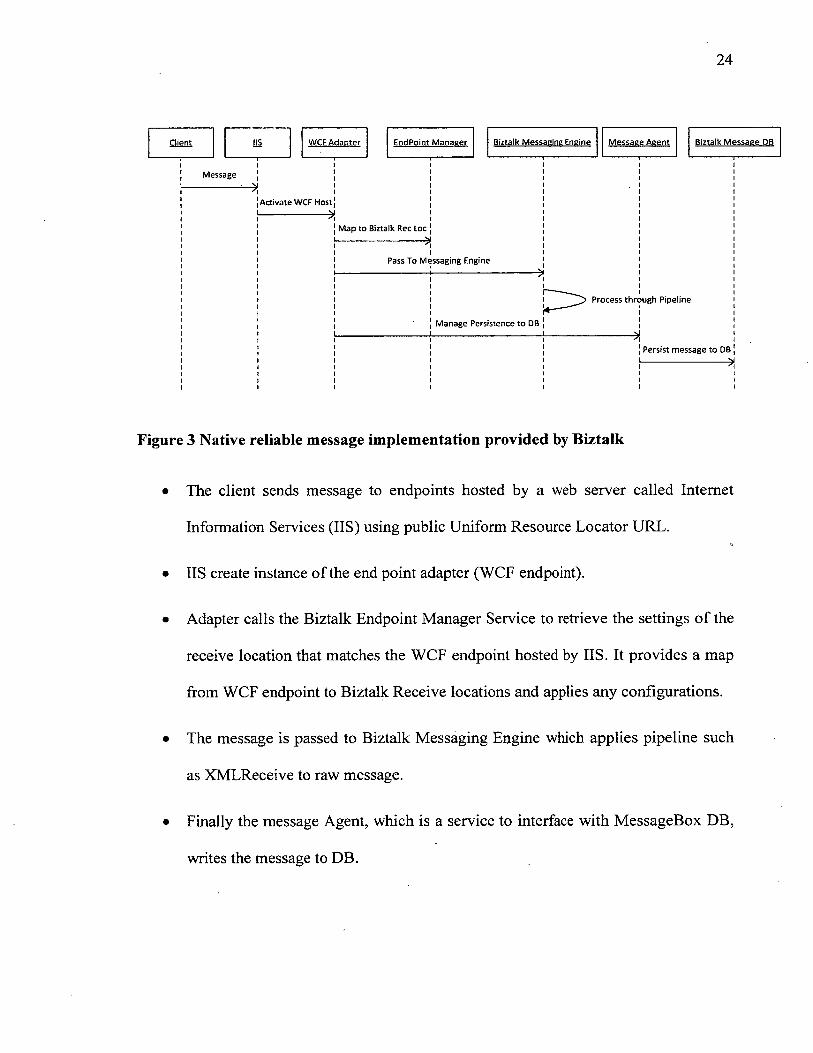
Figure 3 Native reliable message implementation provided by Biztalk
• The client sends message to endpoints hosted by a web server called Internet
Information Services (IIS) using public Uniform Resource Locator URL.
• IIS create instance of the end point adapter (WCF endpoint).
• Adapter calls the Biztalk Endpoint Manager Service to retrieve the settings of the
receive location that matches the WCF endpoint hosted by IIS. It provides a map
from WCF endpoint to Biztalk Receive locations and applies any configurations.
• The message is passed to Biztalk Messaging Engine which applies pipeline such
as XMLReceive to raw message.
• Finally the message Agent, which is a service to interface with MessageBox DB,
writes the message to DB.
25
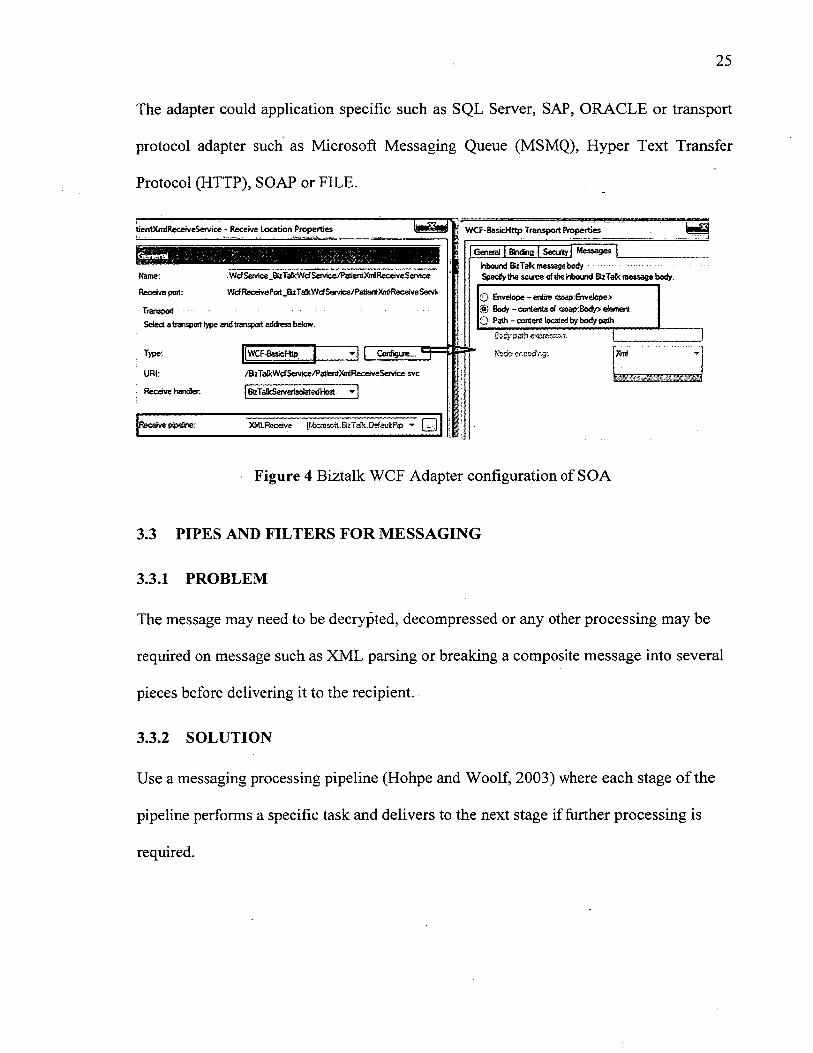
The adapter could application specific such as SQL Server, SAP, ORACLE or transport
protocol adapter such as Microsoft Messaging Queue (MSMQ), Hyper Text Transfer
Protocol (HTTP), SOAP or FILE.
tiertXmiRecetveService - Receive location Properties
Name:
Receive port:
. Wcf Sendee _B»zTaikWcf Service/PatieniXn! Receive Service
WcfRecervePort Biz Talk Wcf Service/PatiertXmi Receive Serv*
T ran sp a t................
Select a transport t>pe and transport address below.
Type:
URI:Receive handler.
WCF-8asicHBp Cbnfigttfe...
/BzTaJkWdService/PsiientXmlReceiveServjce.svc
BzTaScServerfeolatedHost ~
XMLReceive [fvhcrcscit.BiT lalk.DefauiiPip
WCF-BasicHttp Transport Properties
General [ Binding j Security j MessagesInbound SzTaik menage body....................................Specify the soiree of the inbound BzTaSc message body.
0 Envelope -entire <soap:Envelcpe>(o) Body - contents of <soap:8cdy> element O Path - content located by body path
8* dy path expreor.on.
Mode encodjtg: m
Figure 4 Biztalk WCF Adapter configuration of SOA
3.3 PIPES AND FILTERS FOR MESSAGING
3.3.1 PROBLEM
The message may need to be decrypted, decompressed or any other processing may be
required on message such as XML parsing or breaking a composite message into several
pieces before delivering it to the recipient.
3.3.2 SOLUTION
Use a messaging processing pipeline (Hohpe and Woolf, 2003) where each stage of the
pipeline performs a specific task and delivers to the next stage if further processing is
required.
26
3.3.3 APPLICATION
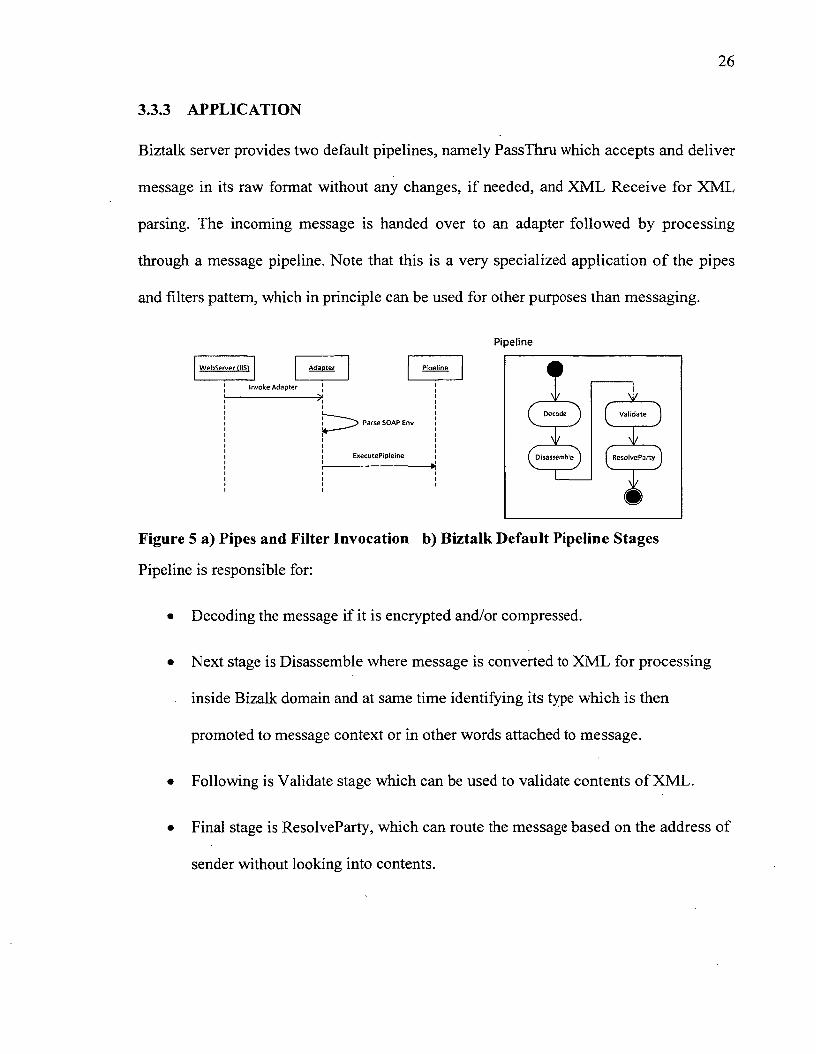
Biztalk server provides two default pipelines, namely PassThru which accepts and deliver
message in its raw format without any changes, if needed, and XML Receive for XML
parsing. The incoming message is handed over to an adapter followed by processing
through a message pipeline. Note that this is a very specialized application of the pipes
and filters pattern, which in principle can be used for other purposes than messaging.
P ipeline
W eb serv er OISI A daoter Pf'oeline
Invoke Adapter
Parse SOAP Env
ExecutePipleine
Decode ^ V alidate ^
^ Disassembl^
Figure 5 a) Pipes and Filter Invocation b) Biztalk Default Pipeline Stages
Pipeline is responsible for:
• Decoding the message if it is encrypted and/or compressed.
• Next stage is Disassemble where message is converted to XML for processing
inside Bizalk domain and at same time identifying its type which is then
promoted to message context or in other words attached to message.
• Following is Validate stage which can be used to validate contents of XML.
• Final stage is ResolveParty, which can route the message based on the address of
sender without looking into contents.
3.4 PUBLISH/SUBSCRIBE
3.4.1 PROBLEM
There could be many messages arriving at the same time and various parties expecting to
receive them. For example, Process-A expect to receive MsgType-1 and Process-B to
receive MsgType-2 where as there is another Process-C that expects to receive both
MsgType-1 and MsgType-2.
3.4.2 SOLUTION
Instead of point to point communication between service and sender, publish-subscribe
(Hohpe and Woolf, 2003) introduces and intermediary between communicating parties.
The sender can submit a message to a central repository and the service will receive the
message if it has been designated to receive that type of message. This way multiple
parties can subscribe to a particular message type.
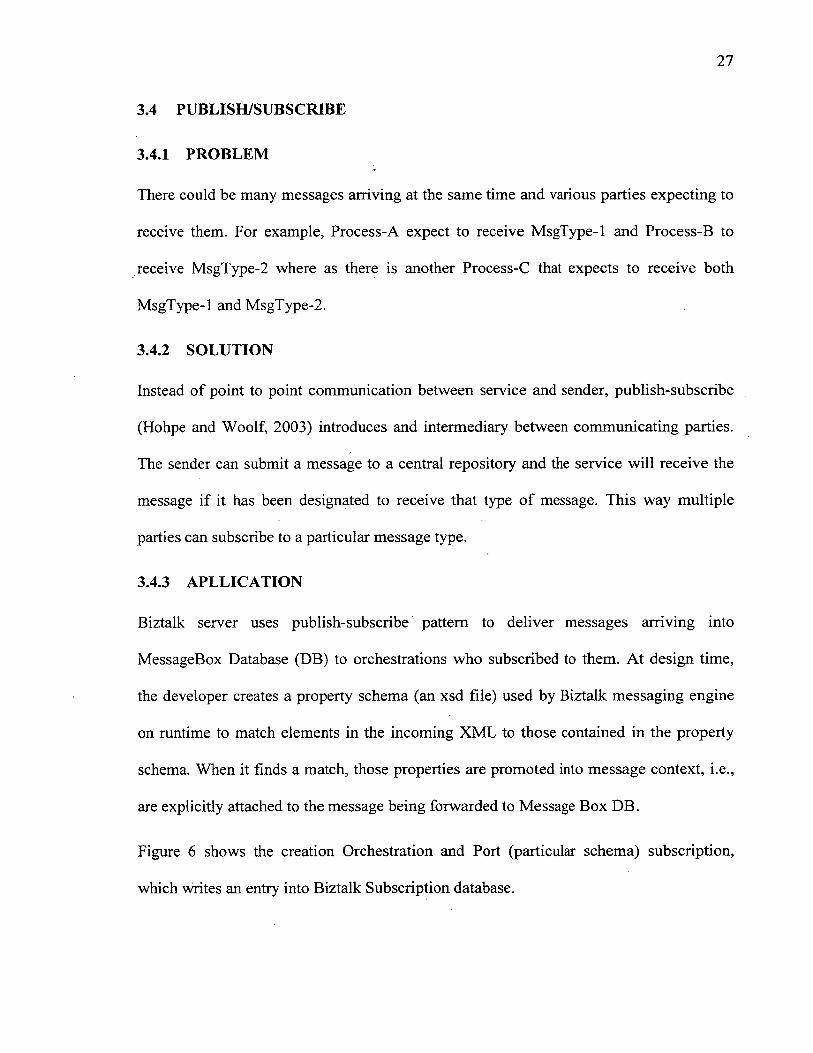
3.4.3 APLLICATION
Biztalk server uses publish-subscribe pattern to deliver messages arriving into
MessageBox Database (DB) to orchestrations who subscribed to them. At design time,
the developer creates a property schema (an xsd file) used by Biztalk messaging engine
on runtime to match elements in the incoming XML to those contained in the property
schema. When it finds a match, those properties are promoted into message context, i.e.,
are explicitly attached to the message being forwarded to Message Box DB.
Figure 6 shows the creation Orchestration and Port (particular schema) subscription,
which writes an entry into Biztalk Subscription database.
28
1Select a host for enlistment and to d any logical ports in the orchestration to physical ports. A new physical port may be created by clicking on the combo box next to the logical port name.
Host: BizTalkServerAppfication ▼
Bindings:
Inbound Logical Ports 4 ^ Receive Ports.................................... .j
[ Wcf Receive Port_8tzTalk Wcf Service/Patie ▼<None><New receive port...>
Figure 6 Creation of a Subscription in Biztalk
As shown in the simplified sequence diagram in Fig. 5.a, the Message Agent writes
Message to MessageBox. Before it does that, it asks MessageBox to find the subscription
of the message in question. MessageBox then queries the subscription database and links
the subscription results to the message. The Message Agent along with subscription
details inserts the message into MessageBox DB. MessageBox is implemented as First In
First Out (FIFO) and Biztalk Engine has multiple de-queuing threads that continuously
poll the DB; one thread will eventually pick up the message from the queue and deliver it
to the subscribed orchestration instance or create one if doesn’t already exist.
3.4.4 DEHYDRATION AND REHYDRATION
When Biztalk determines whether an orchestration instance has been idle for a long
period, and if it’s active, it Dehydrates the instance. This happens by saving the state of
orchestrations instance, and releasing the memory resources. This makes possible for a
large number of long-running orchestrations to run concurrently on the same computer.
Rehydration is the reverse of Dehydration, by which the engine loads a saved instance
context into memory and restores its state. The orchestration then continues to run from
the point where it was Dehydrated.
3.5 CORRELATION IDENTIFIER
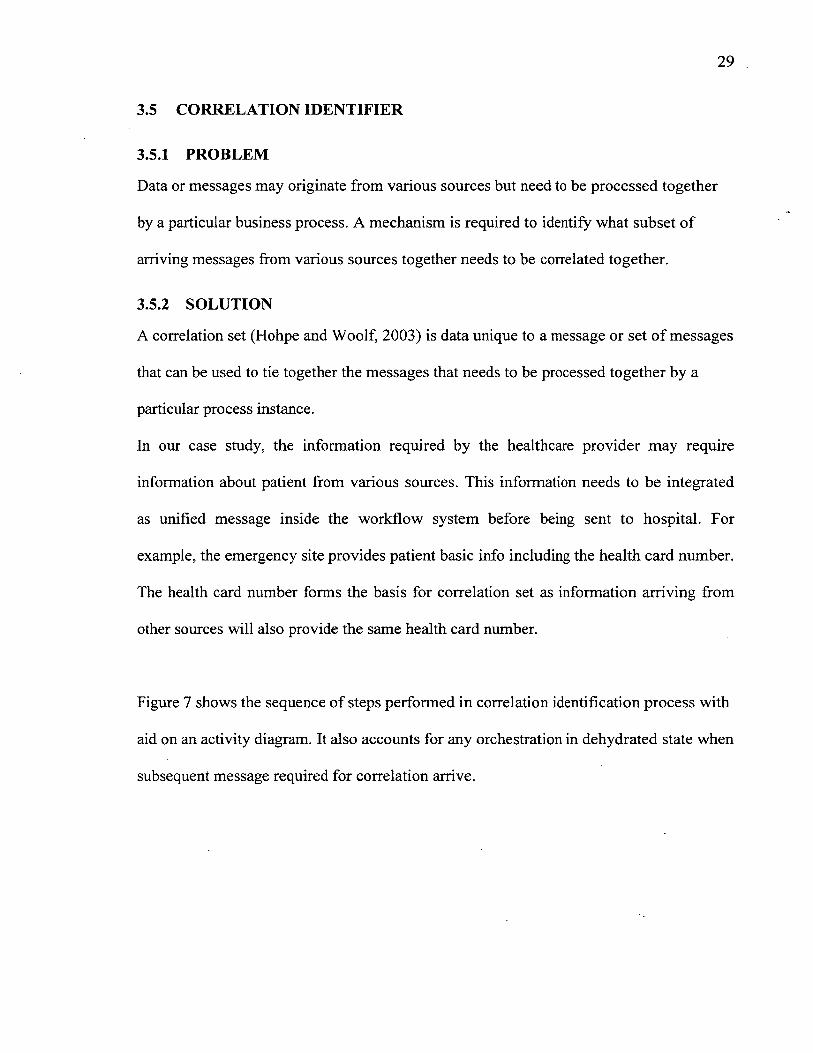
3.5.1 PROBLEM
Data or messages may originate from various sources but need to be processed together
by a particular business process. A mechanism is required to identify what subset of
arriving messages from various sources together needs to be correlated together.
3.5.2 SOLUTION
A correlation set (Hohpe and Woolf, 2003) is data unique to a message or set of messages
that can be used to tie together the messages that needs to be processed together by a
particular process instance.
In our case study, the information required by the healthcare provider may require
information about patient from various sources. This information needs to be integrated
as unified message inside the workflow system before being sent to hospital. For
example, the emergency site provides patient basic info including the health card number.
The health card number forms the basis for correlation set as information arriving from
other sources will also provide the same health card number.
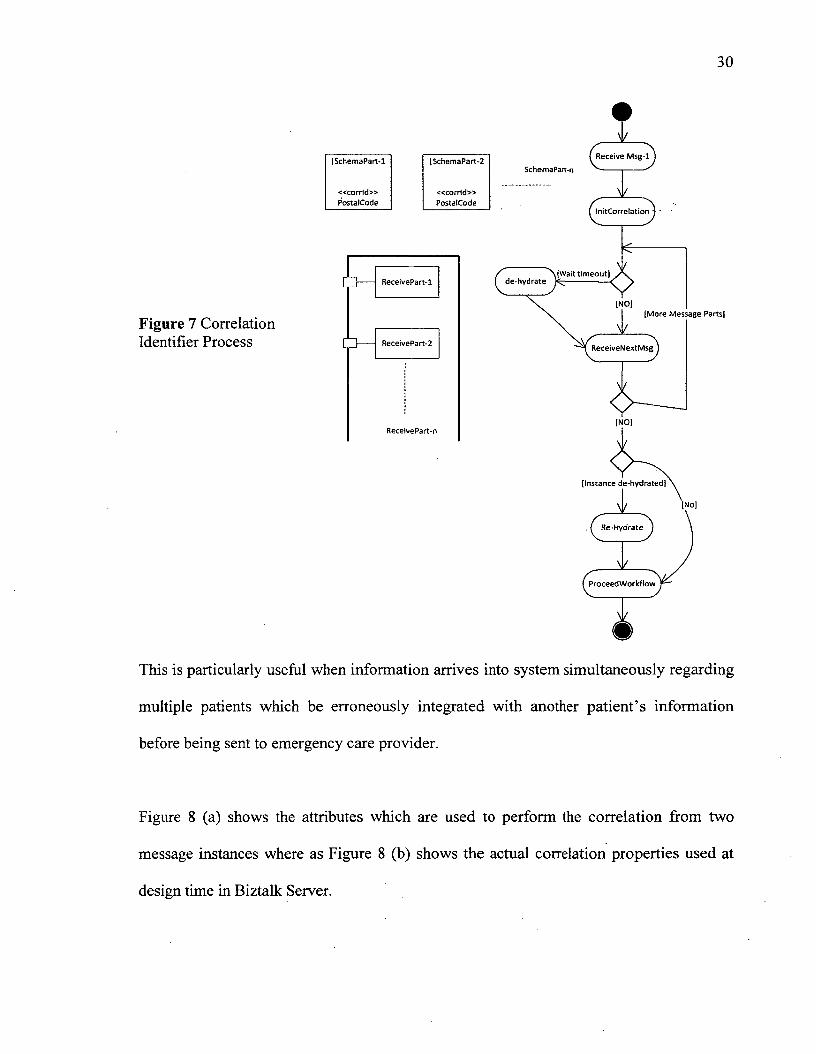
Figure 7 shows the sequence of steps performed in correlation identification process with
aid on an activity diagram. It also accounts for any orchestration in dehydrated state when
subsequent message required for correlation arrive.
30
Figure 7 Correlation Identifier Process
SchemaPart-1SchemaPart-n
« c o r r l d »PostalCode
« c o r r t d »PostalCode
InitCorrelation ) • -
------------- x V/ \[W ait tim eout] / vI de-hydrate ------——»*— \
vReceiveNextMsg
ReceivePart-1
[More Message Parts]
ReceivePart-2
[NO]ReceivePart-n
[Instance de-hydrated]
[No]
Re-Hydrate
ProceedW orkfiow
This is particularly useful when information arrives into system simultaneously regarding
multiple patients which be erroneously integrated with another patient’s information
before being sent to emergency care provider.
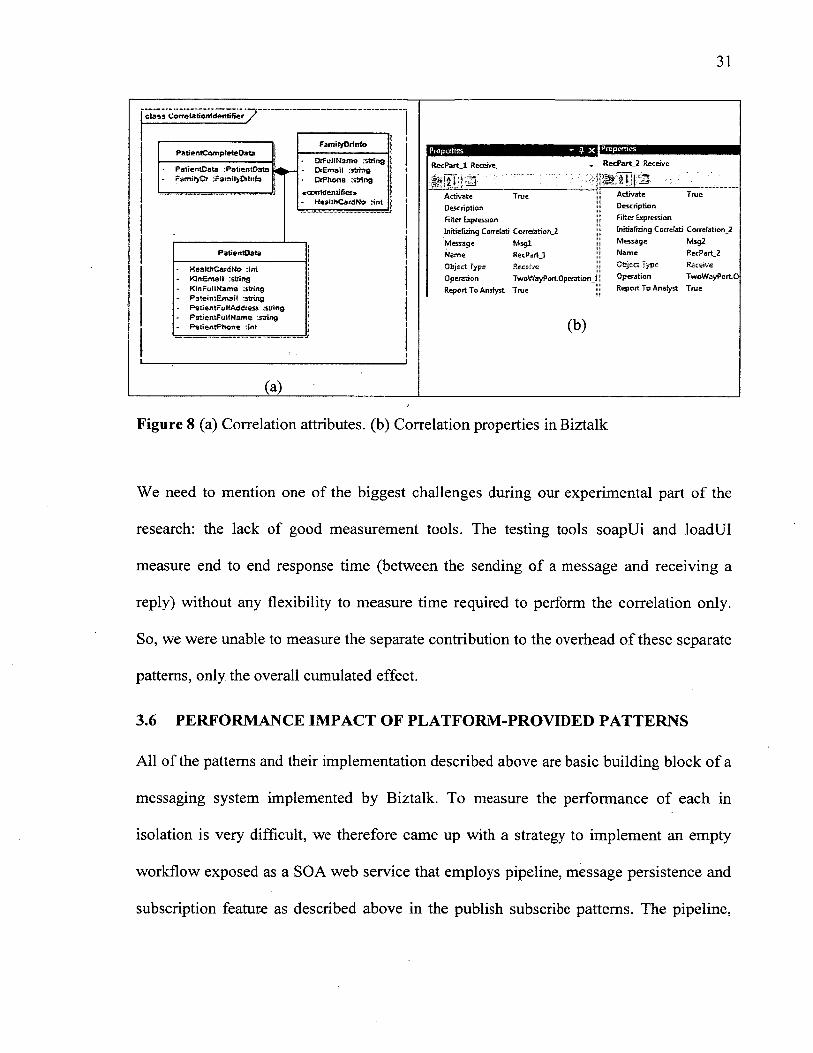
Figure 8 (a) shows the attributes which are used to perform the correlation from two
message instances where as Figure 8 (b) shows the actual correlation properties used at
design time in Biztalk Server.
31
class CorrelationtderttifiefVPatjentCorr plete Data
PatientDat3 :Patientf>3t3 FamilyO :FgmlfyDrtnfo
PatientOata
(a)
FamilyOilnfd
OrfuliMame cstring OrEmsil :string CtPhone : string
«ccrridenuftef»HealthCardNo .ini
KeaithCanlNo in i KJnSmail :string KinFultName : string Pateim Em sii :string PstientFullAddress :string PstientFulIName '.string P siien tPhcne in t
RecPart 1 Receive, RecPart_2 Receive
i ® j ; ...........■ ; ....Activate True Activate True
Description Description
Filter Expression Filter Expression
Initializing Correlati Correlatioh_2 Initializing Correlati Correfation_2
Message M sgi Message Msg2
Name RecPart_l Name RecPart_2
Object Type Receive Object Type Receive
Operation TwoWayPorLOperationJ Operation TwoWayPortO
Report To Anafyst True Report To Analyst Trixe
(b)
Figure 8 (a) Correlation attributes, (b) Correlation properties in Biztalk
We need to mention one of the biggest challenges during our experimental part of the
research: the lack of good measurement tools. The testing tools soapUi and loadUI
measure end to end response time (between the sending of a message and receiving a
reply) without any flexibility to measure time required to perform the correlation only.
So, we were unable to measure the separate contribution to the overhead of these separate
patterns, only the overall cumulated effect.
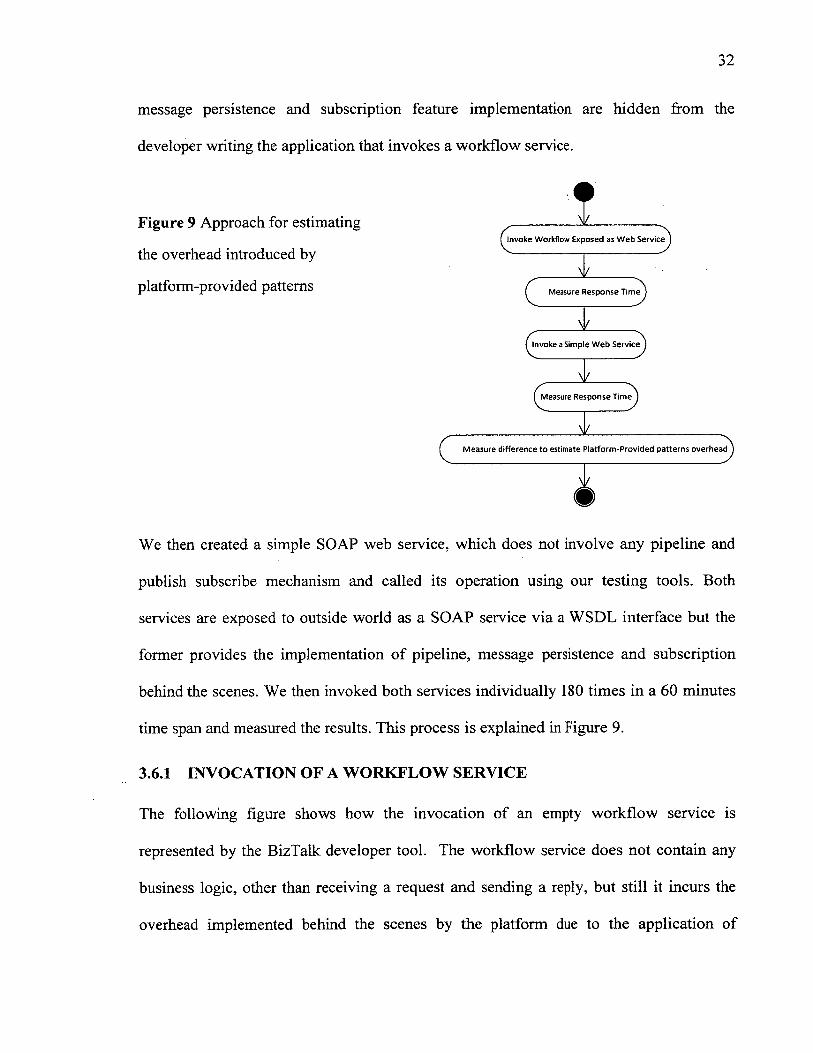
3.6 PERFORMANCE IMPACT OF PLATFORM-PROVIDED PATTERNS
All of the patterns and their implementation described above are basic building block of a
messaging system implemented by Biztalk. To measure the performance of each in
isolation is very difficult, we therefore came up with a strategy to implement an empty
workflow exposed as a SOA web service that employs pipeline, message persistence and
subscription feature as described above in the publish subscribe patterns. The pipeline,
32
message persistence and subscription feature implementation are hidden from the
developer writing the application that invokes a workflow service.
Figure 9 Approach for estimating
the overhead introduced by
platform-provided patterns
ai
^Invoke Workflow Exposed as W eb Service
CV
Measure R esponse Time
£ VInvoke a Simple W eb S ervice^
VMeasure R esponse Time^j
c M easure difference to estimate Platform -Provided pa tte rn s overhead
v
We then created a simple SOAP web service, which does not involve any pipeline and
publish subscribe mechanism and called its operation using our testing tools. Both
services are exposed to outside world as a SOAP service via a WSDL interface but the
former provides the implementation of pipeline, message persistence and subscription
behind the scenes. We then invoked both services individually 180 times in a 60 minutes
time span and measured the results. This process is explained in Figure 9.
3.6.1 INVOCATION OF A WORKFLOW SERVICE
The following figure shows how the invocation of an empty workflow service is
represented by the BizTalk developer tool. The workflow service does not contain any
business logic, other than receiving a request and sending a reply, but still it incurs the
overhead implemented behind the scenes by the platform due to the application of
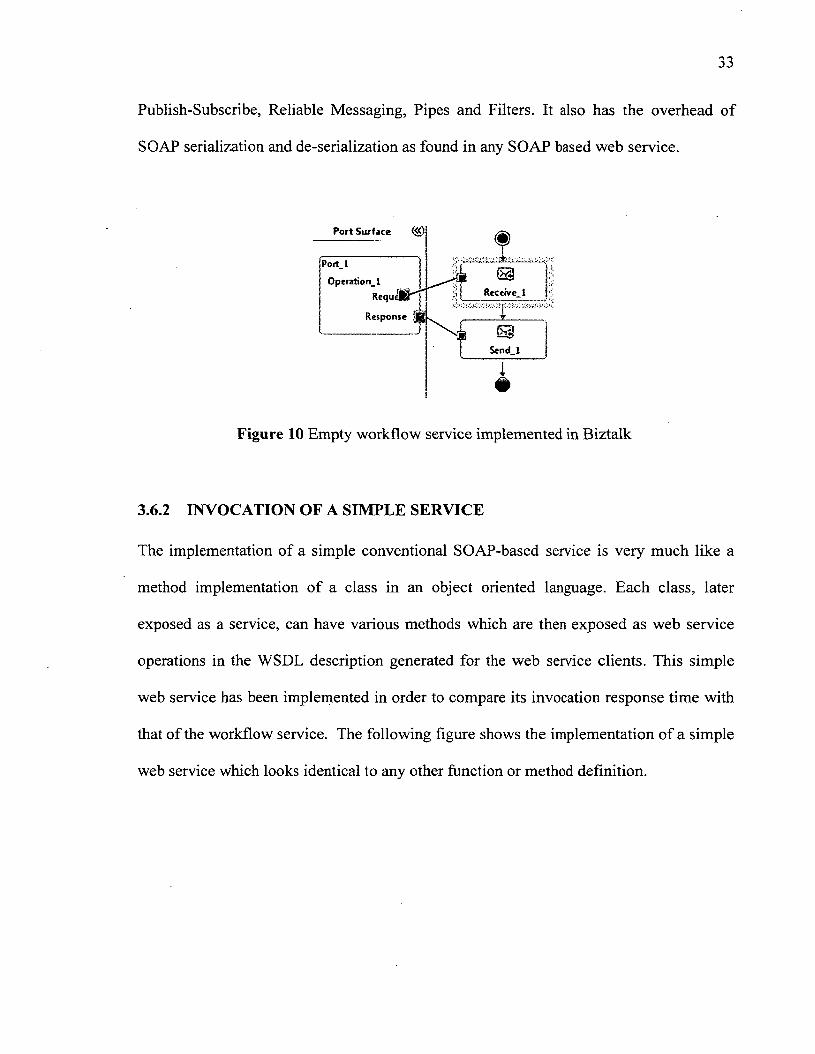
33
Publish-Subscribe, Reliable Messaging, Pipes and Filters. It also has the overhead of
SOAP serialization and de-serialization as found in any SOAP based web service.
Pori Surface (<<)
Port 1
O peration, I
R equ tK
Response
Receive. 1
S en d .l
Figure 10 Empty workflow service implemented in Biztalk
3.6.2 INVOCATION OF A SIMPLE SERVICE
The implementation of a simple conventional SOAP-based service is very much like a
method implementation of a class in an object oriented language. Each class, later
exposed as a service, can have various methods which are then exposed as web service
operations in the WSDL description generated for the web service clients. This simple
web service has been implemented in order to compare its invocation response time with
that of the workflow service. The following figure shows the implementation of a simple
web service which looks identical to any other function or method definition.
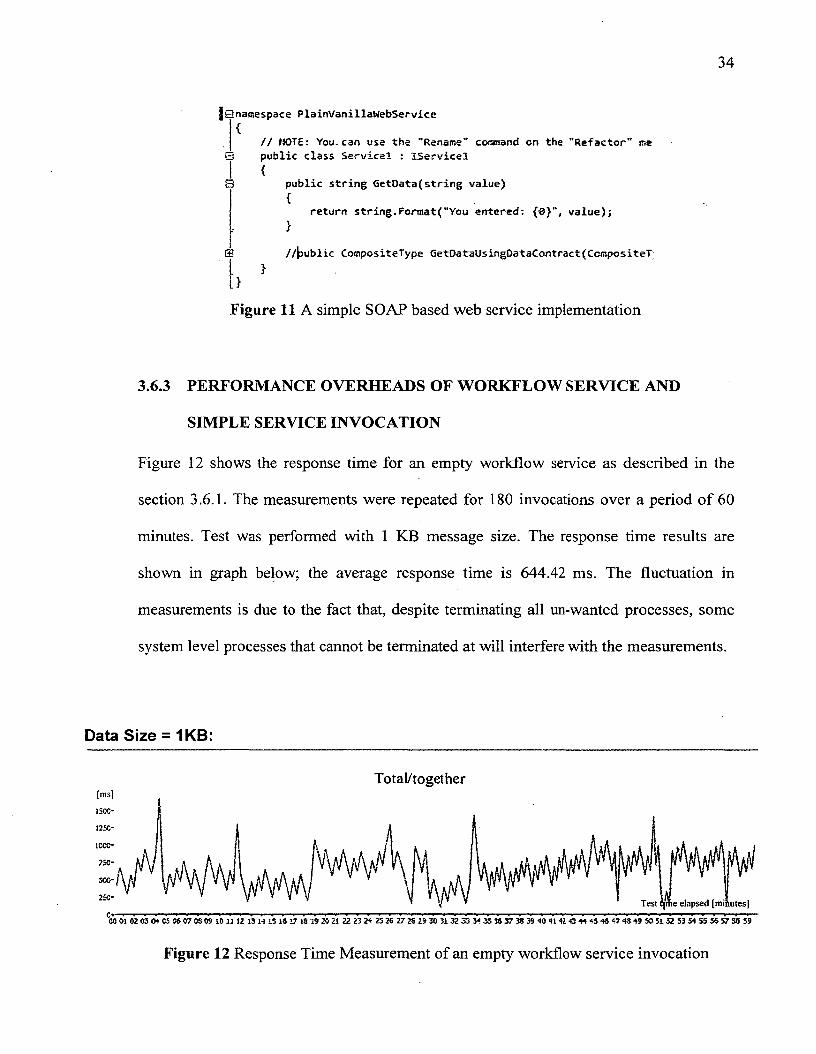
34
§0 namespace PlainVanillaWebServi.ee’{
// MOTE: You. can use the "Rename" command on the "Refactor" tr>e 0 public class Servicel : IServiee!
{public string GetData(string value){
return string.Format("You entered: {&}“, value);>//public CompositeType GetDataUsingDataContract(CcmpositeT'
>}
Figure 11 A simple SOAP based web service implementation
3.6.3 PERFORMANCE OVERHEADS OF WORKFLOW SERVICE AND
SIMPLE SERVICE INVOCATION
Figure 12 shows the response time for an empty workflow service as described in the
section 3.6.1. The measurements were repeated for 180 invocations over a period of 60
minutes. Test was performed with 1 KB message size. The response time results are
shown in graph below; the average response time is 644.42 ms. The fluctuation in
measurements is due to the fact that, despite terminating all un-wanted processes, some
system level processes that cannot be terminated at will interfere with the measurements.
Data Size = 1KB;
Total/together[ms]
icce-
5CC*
Test tofie elapsed [minutes]
CO 01 02 C3 04 05 06 07 03 09 10 11 12 13 H 15 16 17 IS 29 20 21 22 23 24 25 25 27 2S 29 30 31 32 33 34 35 35 37 38 39 40 41 42 «C 44 45 45 47 48 49 50 51 52 53 54 55 56 57 56 59
Figure 12 Response Time Measurement of an empty workflow service invocation

35
As we can see, the variations in response time values are quite large, due to the complex
processing by the patterns implemented by the tool behind the scenes, which offer many
alternative execution paths and reasons for variations.
Figure 13 shows the response time for 180 repeated invocations of an empty simple web
service over a period of 60 minutes. The message size was of 1 KB. The graph is
smoother than for the invocation of a workflow service from Figure 12, because the
processing is simpler, with fewer alternative execution paths and reasons for variation.
Response Times
[ms]
'J3-
7.5'
S'
2 S
*00 Cl
Figure 13 Response Time Measurements of a simple SOAP service invocation
Comparing the invocation response times of a workflow service with that of a simple
service, we can see that the first is considerably longer than the second (see table 2).
Table 2 Comparing Average Response time for workflow and
simple service invocation
Operation (end to end) Average Response Time (ms)
Workflow Service invocation 644.42
Simple Service invocation 8.54
Total/together
Test time elapsed [hour]
The reasons for the large difference of approx. 636 ms between the two kinds of
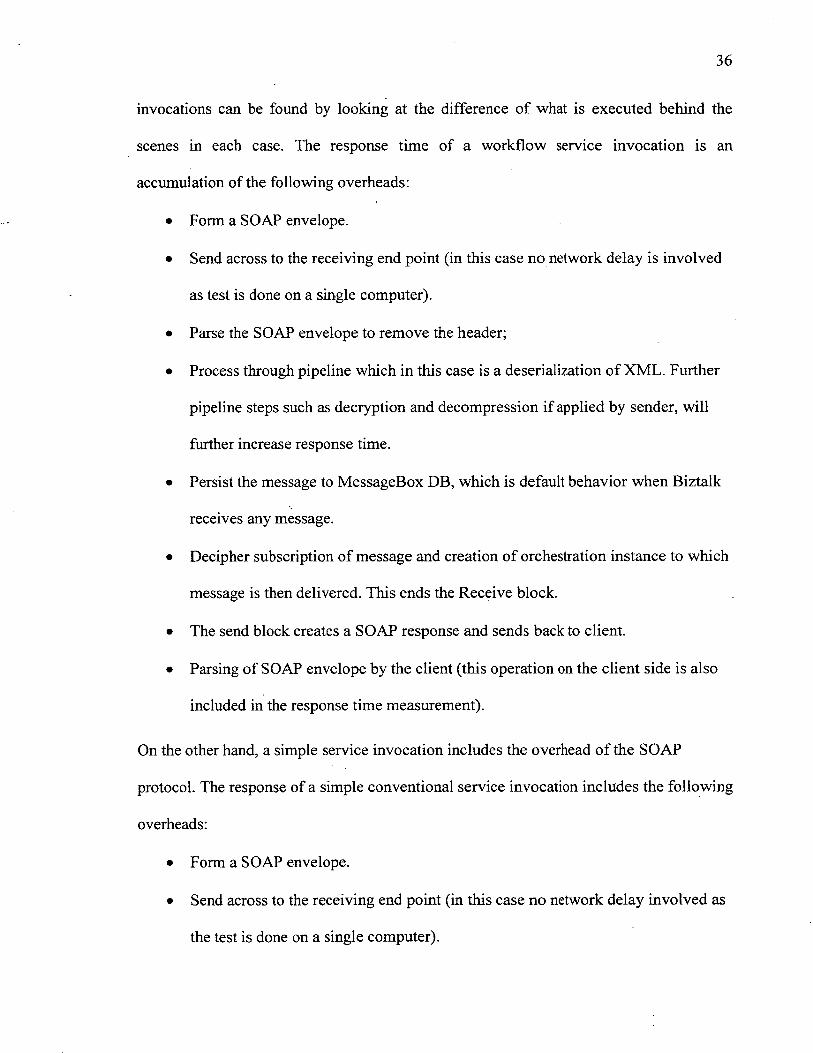
36
invocations can be found by looking at the difference of what is executed behind the
scenes in each case. The response time of a workflow service invocation is an
accumulation of the following overheads:
• Form a SOAP envelope.
• Send across to the receiving end point (in this case no network delay is involved
as test is done on a single computer).
• Parse the SOAP envelope to remove the header;
• Process through pipeline which in this case is a deserialization of XML. Further
pipeline steps such as decryption and decompression if applied by sender, will
further increase response time.
• Persist the message to MessageBox DB, which is default behavior when Biztalk
receives any message.
• Decipher subscription of message and creation of orchestration instance to which
message is then delivered. This ends the Receive block.
• The send block creates a SOAP response and sends back to client.
• Parsing of SOAP envelope by the client (this operation on the client side is also
included in the response time measurement).
On the other hand, a simple service invocation includes the overhead of the SOAP
protocol. The response of a simple conventional service invocation includes the following
overheads:
• Form a SOAP envelope.
• Send across to the receiving end point (in this case no network delay involved as
the test is done on a single computer).
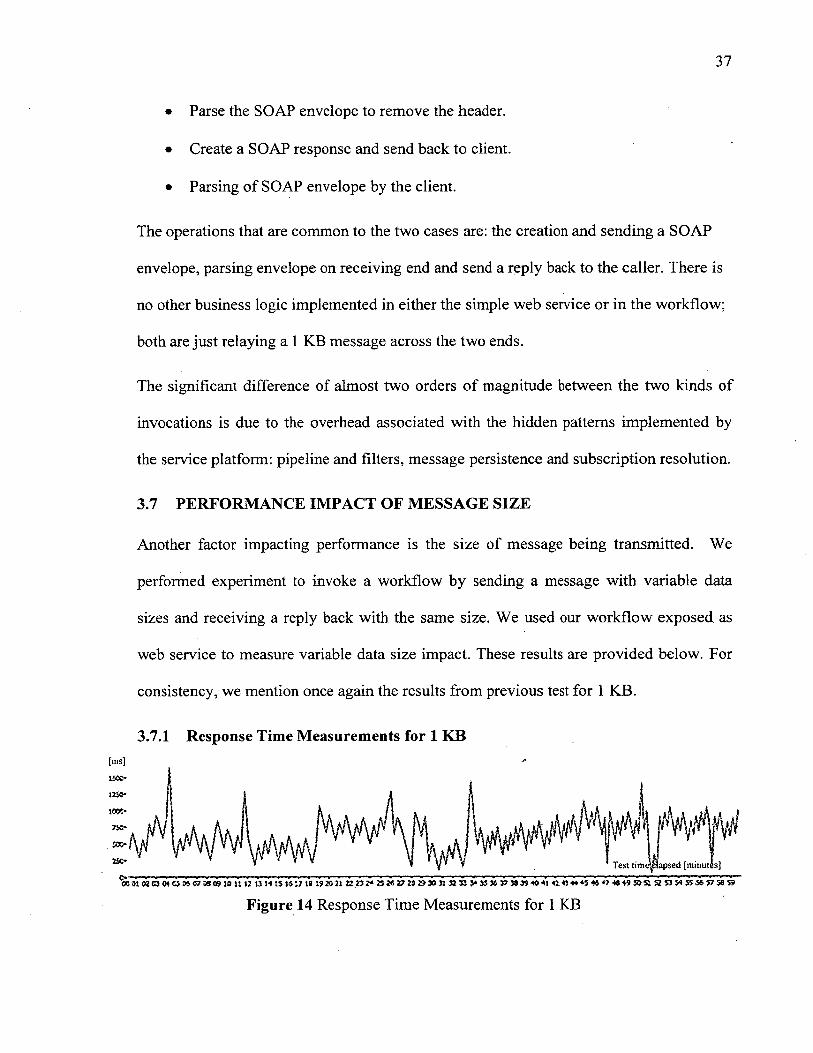
37
• Parse the SOAP envelope to remove the header.
• Create a SOAP response and send back to client.
• Parsing of SOAP envelope by the client.
The operations that are common to the two cases are: the creation and sending a SOAP
envelope, parsing envelope on receiving end and send a reply back to the caller. There is
no other business logic implemented in either the simple web service or in the workflow;
both are just relaying a 1 KB message across the two ends.
The significant difference of almost two orders of magnitude between the two kinds of
invocations is due to the overhead associated with the hidden patterns implemented by
the service platform: pipeline and filters, message persistence and subscription resolution.
3.7 PERFORMANCE IMPACT OF MESSAGE SIZE
Another factor impacting performance is the size of message being transmitted. We
performed experiment to invoke a workflow by sending a message with variable data
sizes and receiving a reply back with the same size. We used our workflow exposed as
web service to measure variable data size impact. These results are provided below. For
consistency, we mention once again the results from previous test for 1 KB.
3.7.1 Response Time Measurements for 1 KB[ms]
' Y Y i Test timtfpapsed [minutes]
Figure 14 Response Time Measurements for 1 KB

38
Table 3 Average Response Time (1 KB)
Data Size (KB) Average Response Time (ms)
1 644 .41
3.7.2 Response Time Measurements for 10 KB
Test tim e elapsed [m inutes]
CC Ol 02 93 0* 05 06 07 03 09 tC 11 12 13 H t5 16 I? 19 19 20 ?I 22 23 24 25 2* 2? *329 S>3: 32 33 34 33 33 35 43 41 42 43 4* *5 46 4? 49 45 SO 51 $2 S3 St 5SS6S7 58 59
Figure 15 Response Time Measurements for 10 KB
Table 4 Average Response Time (10 KB)
Data Size (KB) Average Response Time (ms)
10 682 .27
3.7.3 Response Time Measurements for 100 KB
Test tim e elapsed [m inutes]$•» , , » ■■■■■ .0C 01 02 930* 0506 02 08 » to II 12 13 M 15 !6 17 18 19 2C 21 22 23 24 25 25 27 2S 29 » 31 n » >4 35 55 37 39 3543 41 42 43 ♦4*5 46 47 40 49 SO 51 52 S3 54 5556 57 SO »
Figure 16 Response Time Measurements for 100 KB
Table 5 Average Response Time (100 KB)
Data Size (KB) Average Response Time (ms)
100 698.03
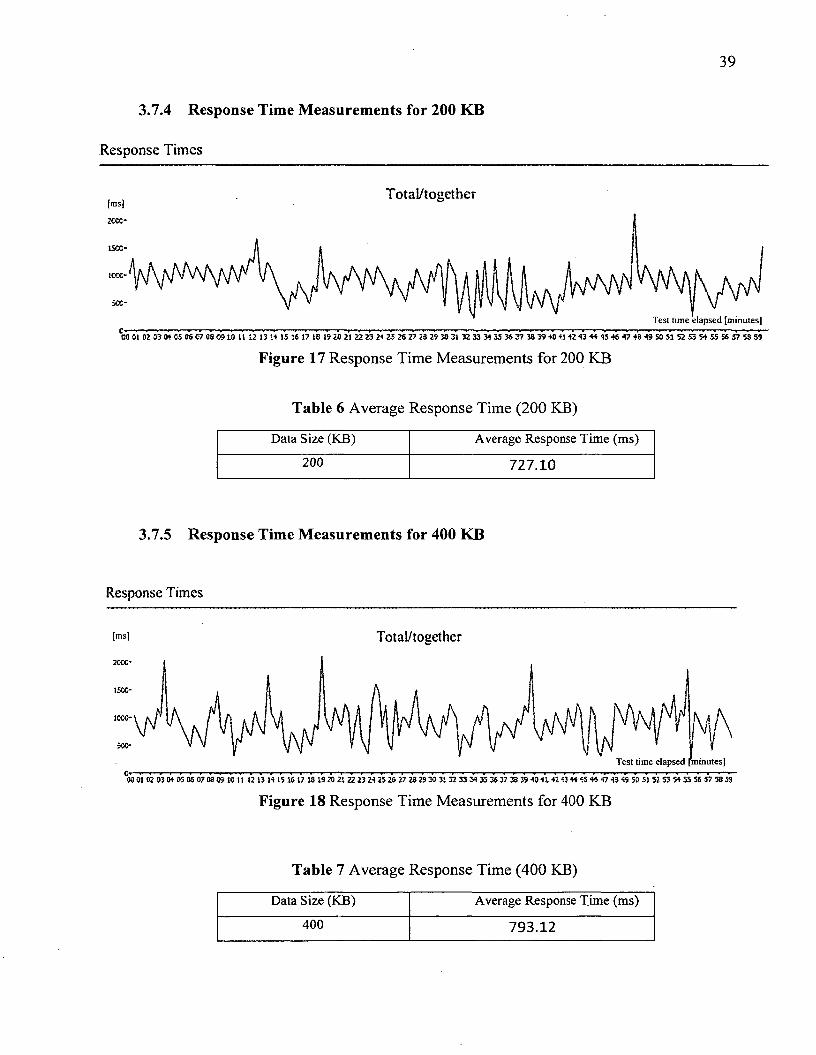
39
3.7.4 Response Time Measurements for 200 KB
Response Times
{ Total/together
scc-
Test time elapsed [minutes]C'GO 01 02 33 04 C5 06 07 08 09 10 U 12 13 14 15 16 17 IB 19 20 21 22 23 24 25 26 27 23 29 30 31 32 33 34 35 36 37 38 39 40 41 42 43 44 45 46 47 48 49 50 51 52 53 54 55 56 57 55 59
Figure 17 Response Time Measurements for 200 KB
Table 6 Average Response Time (200 KB)
Data Size (KB) Average Response Time (ms)
200 727 .10
3.7.5 Response Time Measurements for 400 KB
Response Times
[ms] Total/together2CCC*
Test time elapsed [minutes]
CO 01 02 03 04 05 06 07 08 09 1C U 12 13 14 15 16 17 13 19 20 2% 22 U 24 25 26 27 28 29 30 31 32 33 34 35 36 37 38 39 40 41 42 43 44 45 46 47 43 49 50 51 52 53 54 33 56 57 58 59
Figure 18 Response Time Measurements for 400 KB
Table 7 Average Response Time (400 KB)
Data Size (KB) Average Response Time (ms)
400 793 .12
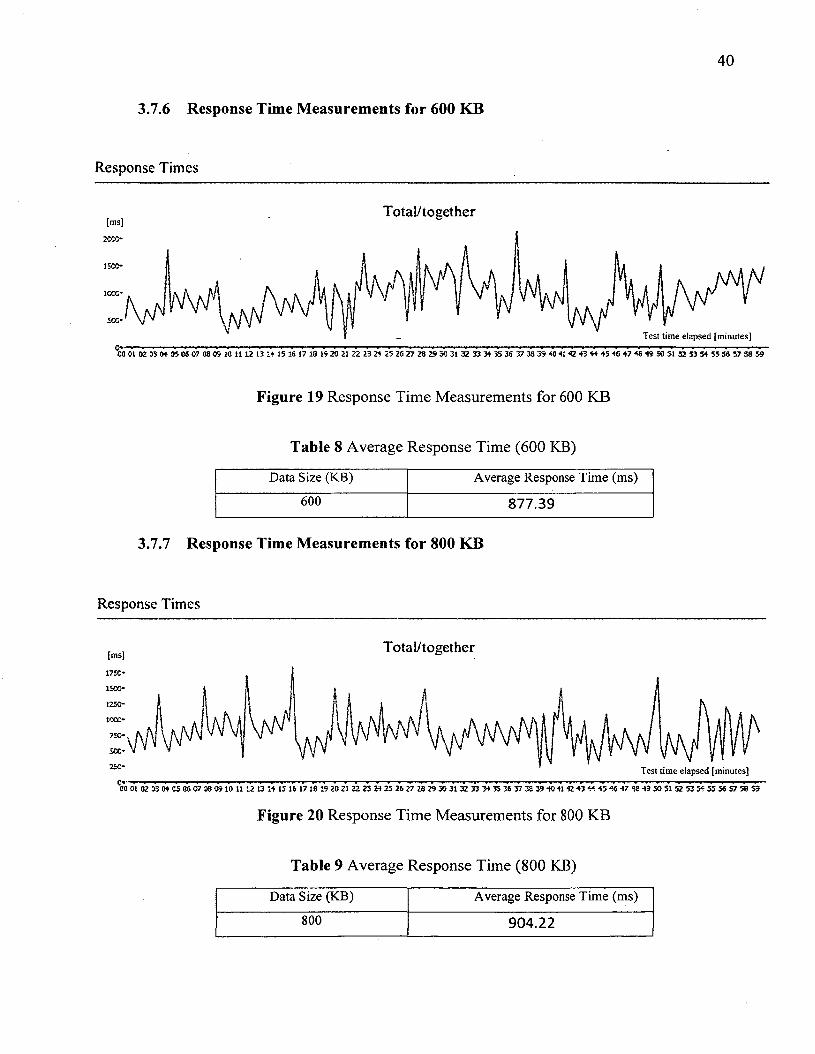
40
3.7.6 Response Time Measurements for 600 KB
Response Times
Total/together[ms]
Test time elapsed [minutes]
CO 01 02 03 04 05 06 C7 08 09 10 11 12 13 14 15 16 17 13 15 20 21 22 23 24 25 26 27 28 29 50 31 32 33 34 35 36 37 38 39 40 41 42 43 44 45 46 47 48 49 50 51 52 53 54 55 56 57 58 59
Figure 19 Response Time Measurements for 600 KB
Table 8 Average Response Time (600 KB)
Data Size (KB) Average Response Time (ms)
600 877 .39
3.7.7 Response Time Measurements for 800 KB
Response Times
Total/together
1250“
SCC-
Test time elapsed [minutes]O'CO 01 02 73 04 C5 06 07 08 05 10 11 12 13 14 15 16 17 18 19 20 21 22 23 24 25 26 27 28 29 30 31 32 33 34 35 36 37 38 59 40 41 42 43 44 45 46 47 48 49 50 51 52 53 54 55 56 57 58 59
Figure 20 Response Time Measurements for 800 KB
Table 9 Average Response Time (800 KB)
Data Size (KB) Average Response Time (ms)
800 9 04 .22
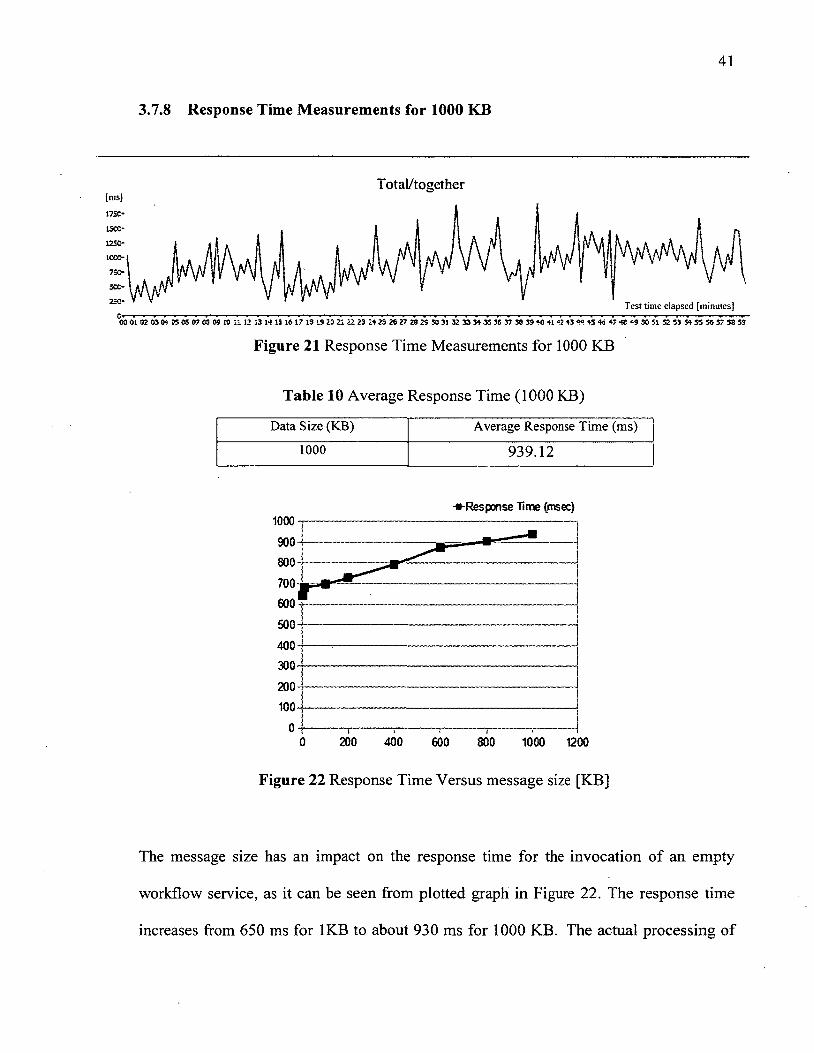
41
3.7.8 Response Time Measurements for 1000 KB
Total/together[ms]
ICCG-
7SC-
Test time elapsed [minutes]&CO 01 02 03 04 35 06 07 05 09 10 11 12 13 W IS 16 17 IS 19 23 21 22 23 24 25 26 27 28 25 30 31 32 33 34 35 36 37 38 33*0 41 *2 43 *4 45 45 47 48 *9 50 51 52 53 54 55 55 57 58 53
Figure 21 Response Time Measurements for 1000 KB
Table 10 Average Response Time (1000 KB)
Data Size (KB) Average Response Time (ms)
1000 939.12
1000
900 800 700 600 500 400 300 200
100
00 200 400 600 800 1000 1200
Figure 22 Response Time Versus message size [KB]
The message size has an impact on the response time for the invocation of an empty
workflow service, as it can be seen from plotted graph in Figure 22. The response time
increases from 650 ms for 1KB to about 930 ms for 1000 KB. The actual processing of
♦Response Time (msec)
the message content for a IK message has very small effect on response time, as most of
the time is spent in various stages of the platform-provided patterns. We draw this
conclusion from the fact that the measured response time for a 2K message for the same
workflow was almost the same as for IK. Hence we can assume that 650 ms delay is the
performance penalty.paid by the invocation of a workflow service on the computer
configuration we used for measurements. This overhead will be used in Chapter 5 for the
estimation of the end-to-end response time in the design phase of service-based
applications.
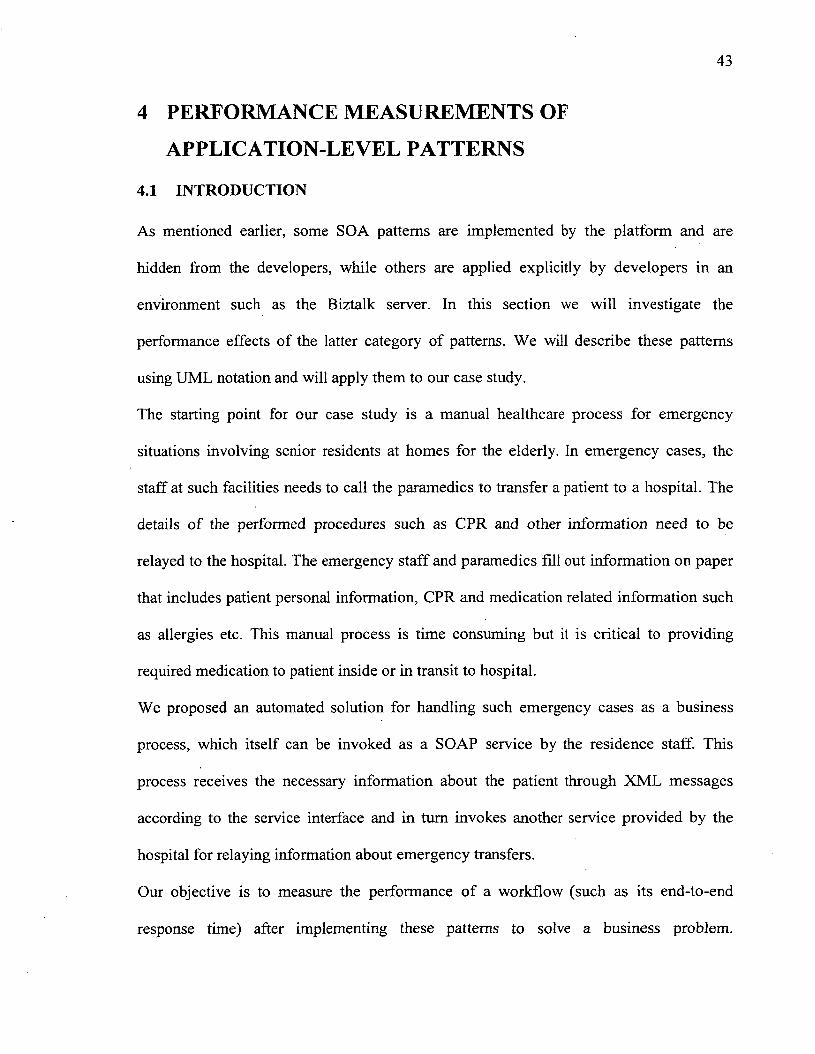
43
4 PERFORMANCE MEASUREMENTS OF
APPLICATION-LEVEL PATTERNS
4.1 INTRODUCTION
As mentioned earlier, some SO A patterns are implemented by the platform and are
hidden from the developers, while others are applied explicitly by developers in an
environment such as the Biztalk server. In this section we will investigate the
performance effects of the latter category of patterns. We will describe these patterns
using UML notation and will apply them to our case study.
The starting point for our case study is a manual healthcare process for emergency
situations involving senior residents at homes for the elderly. In emergency cases, the
staff at such facilities needs to call the paramedics to transfer a patient to a hospital. The
details of the performed procedures such as CPR and other information need to be
relayed to the hospital. The emergency staff and paramedics fill out information on paper
that includes patient personal information, CPR and medication related information such
as allergies etc. This manual process is time consuming but it is critical to providing
required medication to patient inside or in transit to hospital.
We proposed an automated solution for handling such emergency cases as a business
process, which itself can be invoked as a SOAP service by the residence staff. This
process receives the necessary information about the patient through XML messages
according to the service interface and in turn invokes another service provided by the
hospital for relaying information about emergency transfers.
Our objective is to measure the performance of a workflow (such as its end-to-end
response time) after implementing these patterns to solve a business problem.
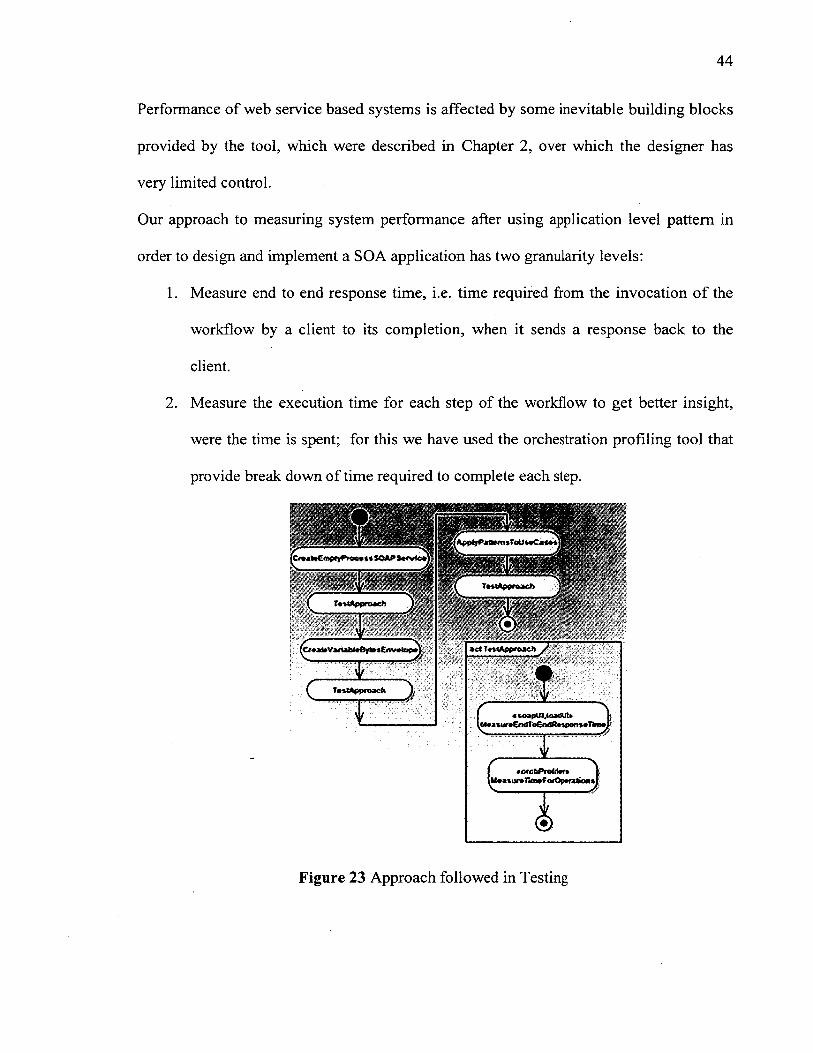
44
Performance of web service based systems is affected by some inevitable building blocks
provided by the tool, which were described in Chapter 2, over which the designer has
very limited control.
Our approach to measuring system performance after using application level pattern in
order to design and implement a SO A application has two granularity levels:
1. Measure end to end response time, i.e. time required from the invocation of the
workflow by a client to its completion, when it sends a response back to the
client.
2. Measure the execution time for each step of the workflow to get better insight,
were the time is spent; for this we have used the orchestration profiling tool that
provide break down of time required to complete each step.
act T«t {Approach /
« *oapm,loatfUt»
Figure 23 Approach followed in Testing

We built our system by incrementally adding these building blocks to the system as
indicated in Figure 23 and measuring the response time according to approaches
mentioned above. Due to the fact that the response time is a stochastic variable, every
measurement was repeated between 180 and 240 times, and the total duration of an
experiment was of about 1 hour.
With a basic idea of some default overhead in implementing our design as evaluated in
previous chapter, we started incorporating the use case of our case study by applying the
appropriate SO A patterns.
Table 11 lists the application-level pattern investigated in this chapter. We have focused
mainly on messaging patterns, because they address the same kind of problems as the
platform-provided patterns discussed in the previous chapter.
Table 11 Development Patterns Application to Case Study
SOA Pattern Utilized U se C ase Implemented
Message Translator Patient data arriving could be in one format
whereas the final recipient (hospital) expects
logically equivalent data but in other format
Aggregator - Sequential
Convoy
Integrate patient related data, arriving in a
defined sequence from various sources, inside
workflow and dispatch integrated data to
emergency care provider
Aggregator - Parallel Convoy Integrate patient related data, arriving out of
sequence from various sources, inside workflow

46
and dispatch integrated data to emergency care
provider
Content Based Router Allow the client to choose emergency care
provider and supply their Web Service URL
Scatter and Gather Allow workflow to solicit current patient load
from care providers in region, forward non-
critical cases to less busier locations
4.2 MESSAGE TRANSLATOR
4.2.1 PROBLEM
One of the major challenges in the SOA world is a different way of storing and
transmitting information. XML is a common way of transmitting information in Web
Services based system but parties involved in sending and receiving of messages may use
different design of XML schemas that logically contain the same piece of information.
4.2.2 SOLUTION
In order for these systems to work and integrate together the workflow system acting as a
mediator, it should able to perform the message translation or data transformation (Earl,
2009) in both directions i.e. transform message into format required by workflow and
then send a response in format required by the client. The pattern is shown in Fig 24.
4.2.3 APPLICATION
In our case study, the client sending the patient’s and other related information is using a
proprietary design of XML schema and the hospital Web Service exposed to receive this
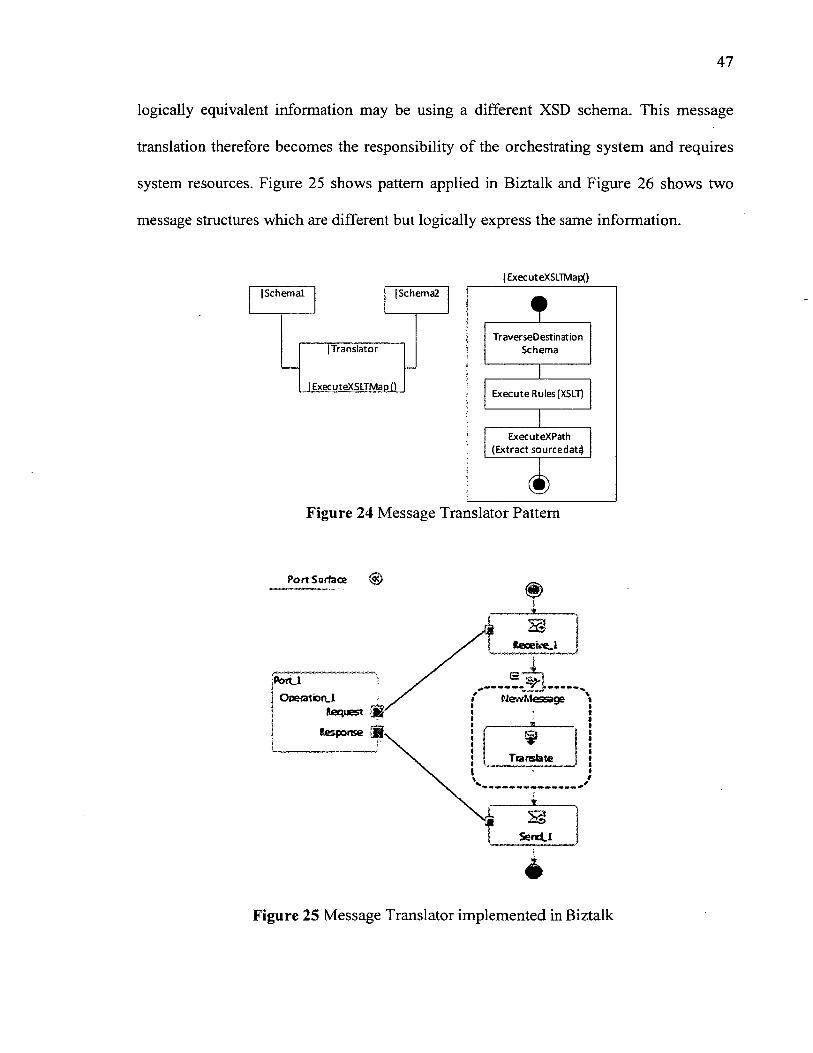
logically equivalent information may be using a different XSD schema. This message
translation therefore becomes the responsibility of the orchestrating system and requires
system resources. Figure 25 shows pattern applied in Biztalk and Figure 26 shows two
message structures which are different but logically express the same information.
| ExecuteXSLTMapQ
|Schem a2|S ch em al
I ExecuteXSLTMapQ
| T ranslator
E xecu te Rules (XSLT)
ExecuteXPath (Extract so u rce dat^
TraverseD estinationS chem a
Figure 24 Message Translator Pattern
Port Surface
SgSencLl
Figure 25 Message Translator implemented in Biztalk
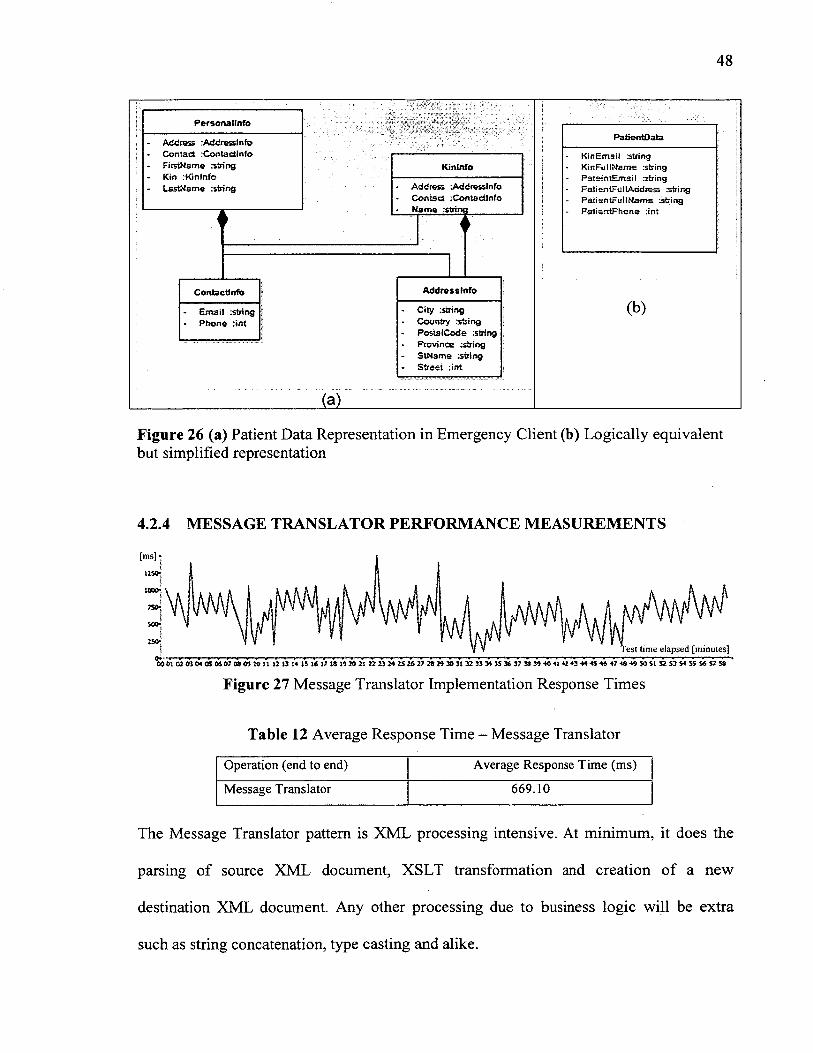
48
Address Addfesslnfo Contact :Contactlnfo Name :strinq_______
Kinlnfo
City istring Country :string PostalCode string Province firing StName string Street tint
A ddresslnfo
Address Addresslnfo Contact rContactlnfo FiistName string Kin :Kinlnfc Last!-! a m e string
Personallrrfo
M .
P a tie f itD a ta
Kin.Email .string KinFullMams string PateintEmail string PatieniFullAddr&sa string PatisntFuilMams string P stientPhene :lnt
(b)
Figure 26 (a) Patient Data Representation in Emergency Client (b) Logically equivalent but simplified representation
4.2.4 MESSAGE TRANSLATOR PERFORMANCE MEASUREMENTS
'est time elapsed [minutes]% f M a T « r d ' t t c S ^ < £ ^ i s i * i n 3 2 » »» j s * j ? m S 9 4q 4 1 4 2 * 3 4^ ^ ^ » V i h n & s s » sV m
Figure 27 Message Translator Implementation Response Times
Table 12 Average Response Time - Message Translator
Operation (end to end) Average Response Time (ms)
Message Translator 669.10
The Message Translator pattern is XML processing intensive. At minimum, it does the
parsing of source XML document, XSLT transformation and creation of a new
destination XML document. Any other processing due to business logic will be extra
such as string concatenation, type casting and alike.
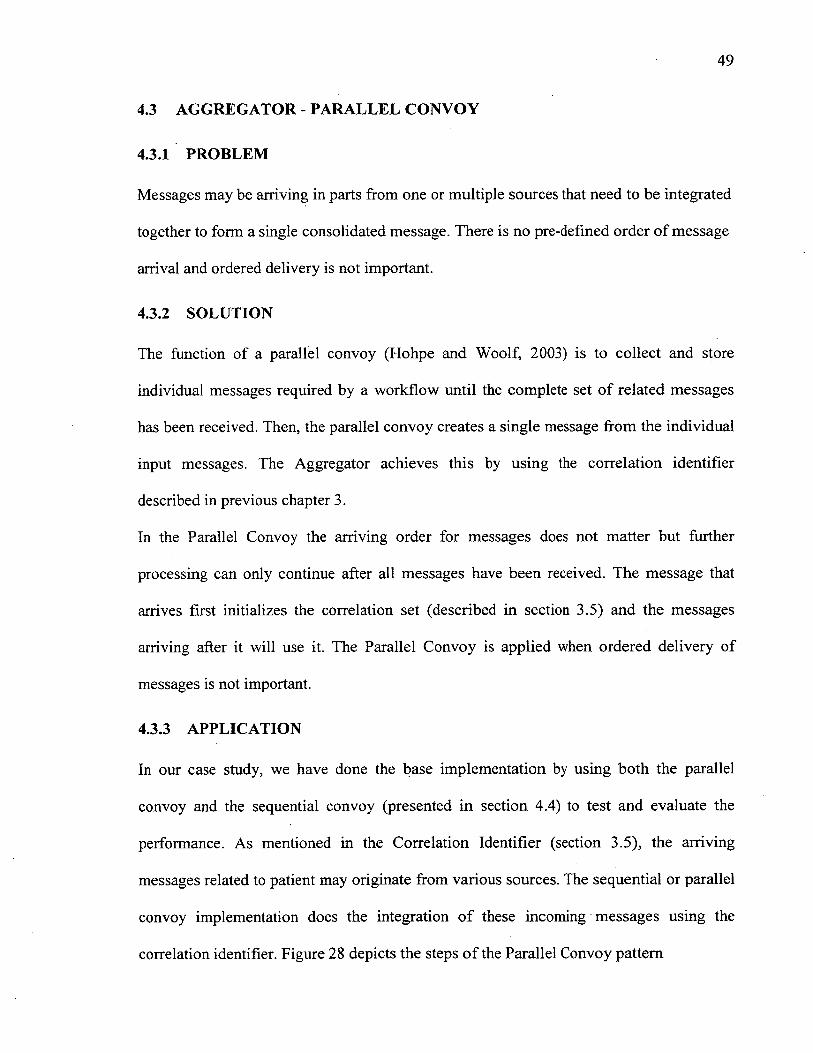
4.3 AGGREGATOR - PARALLEL CONVOY
4.3.1 PROBLEM
Messages may be arriving in parts from one or multiple sources that need to be integrated
together to form a single consolidated message. There is no pre-defined order of message
arrival and ordered delivery is not important.
4.3.2 SOLUTION
The function of a parallel convoy (Hohpe and Woolf, 2003) is to collect and store
individual messages required by a workflow until the complete set of related messages
has been received. Then, the parallel convoy creates a single message from the individual
input messages. The Aggregator achieves this by using the correlation identifier
described in previous chapter 3.
In the Parallel Convoy the arriving order for messages does not matter but further
processing can only continue after all messages have been received. The message that
arrives first initializes the correlation set (described in section 3.5) and the messages
arriving after it will use it. The Parallel Convoy is applied when ordered delivery of
messages is not important.
4.3.3 APPLICATION
In our case study, we have done the base implementation by using both the parallel
convoy and the sequential convoy (presented in section 4.4) to test and evaluate the
performance. As mentioned in the Correlation Identifier (section 3.5), the arriving
messages related to patient may originate from various sources. The sequential or parallel
convoy implementation does the integration of these incoming messages using the
correlation identifier. Figure 28 depicts the steps of the Parallel Convoy pattern
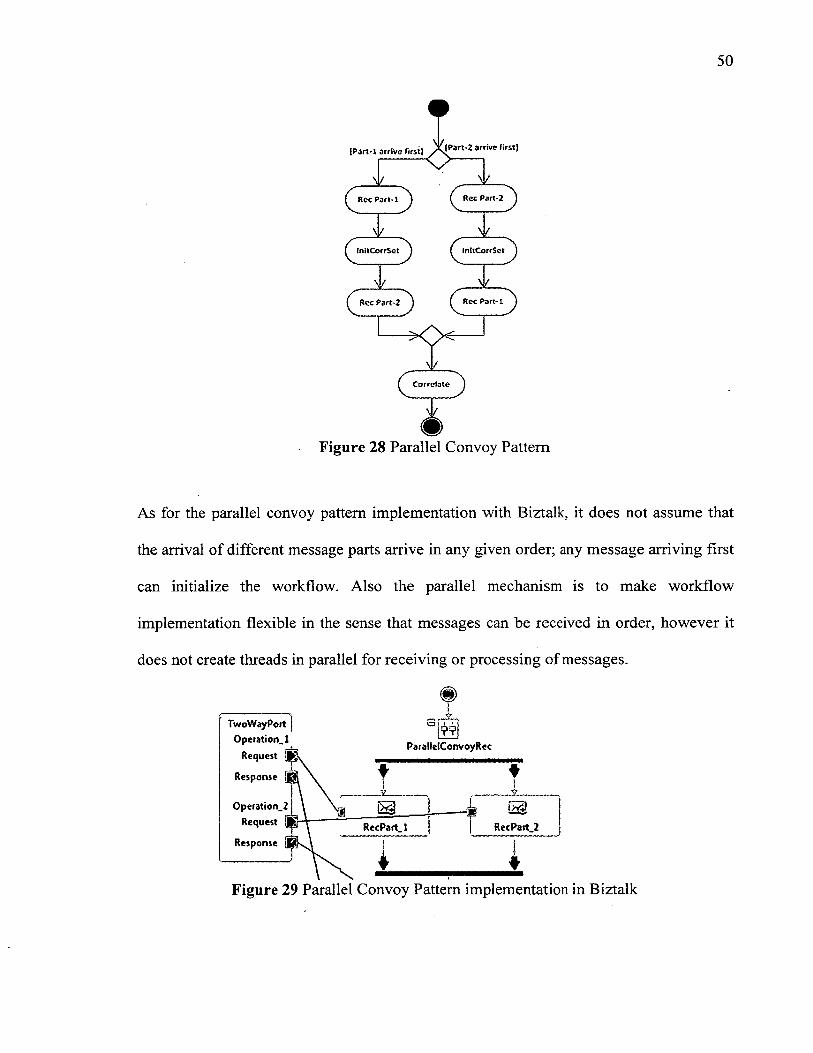
50
IPan-i arrive firs.l X l ^ n - 2 arrive first)
< >( ^ I T ) ^Rec Part-2
J Tw w^ In i tC o r rS e t^ ^ InitCorrSet
V^ R c c Part-2 ^ R e t Part-1 ^ )
w"corretate
Figure 28 Parallel Convoy Pattern
As for the parallel convoy pattern implementation with Biztalk, it does not assume that
the arrival of different message parts arrive in any given order; any message arriving first
can initialize the workflow. Also the parallel mechanism is to make workflow
implementation flexible in the sense that messages can be received in order, however it
does not create threads in parallel for receiving or processing of messages.
TwoW ayPort O pera tio n , 1
R equest
R esponse
O pera tio n ,
Request
R esponse
_A_
ParallelConvoyRec
i tI
Re t P a r t, 1 RecPart 2
Figure 29 Parallel Convoy Pattern implementation in Biztalk
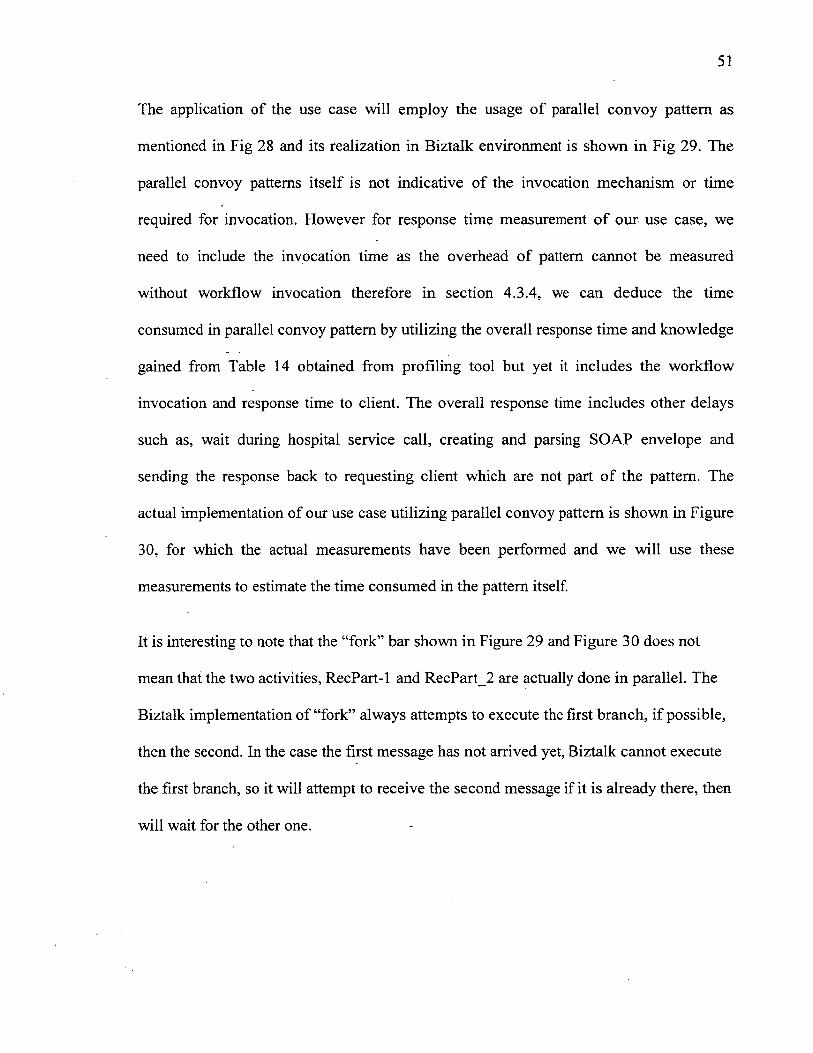
The application of the use case will employ the usage of parallel convoy pattern as
mentioned in Fig 28 and its realization in Biztalk environment is shown in Fig 29. The
parallel convoy patterns itself is not indicative of the invocation mechanism or time
required for invocation. However for response time measurement of our use case, we
need to include the invocation time as the overhead of pattern cannot be measured
without workflow invocation therefore in section 4.3.4, we can deduce the time
consumed in parallel convoy pattern by utilizing the overall response time and knowledge
gained from Table 14 obtained from profiling tool but yet it includes the workflow
invocation and response time to client. The overall response time includes other delays
such as, wait during hospital service call, creating and parsing SOAP envelope and
sending the response back to requesting client which are not part of the pattern. The
actual implementation of our use case utilizing parallel convoy pattern is shown in Figure
30, for which the actual measurements have been performed and we will use these
measurements to estimate the time consumed in the pattern itself.
It is interesting to note that the “fork” bar shown in Figure 29 and Figure 30 does not
mean that the two activities, RecPart-1 and RecPart_2 are actually done in parallel. The
Biztalk implementation of “fork” always attempts to execute the first branch, if possible,
then the second. In the case the first message has not arrived yet, Biztalk cannot execute
the first branch, so it will attempt to receive the second message if it is already there, then
will wait for the other one.
52
4.3.4 PARALLEL CONVOY MEASUREMENTS
The case study implementation given in Fig 30 applies the Parallel Convoy pattern at
the beginning of the workflow. There are two steps in Fig. 30 that do not belong to the
Parallel Convoy pattern and will be subtracted later, SendJHospital and Rec-
Confirmation. Note that there are two message parts, each delivered in an un-defined
order, which means that during our tests Message-2 can arrive before Message-1 or vice
versa.
TwoWayPortj Operational
Request j|
Response jj
ParaileiConvoyRec
MRecPart.l RecPait_2
Send.1
i
Figure 30 Parallel Convoy application in Biztalk to use case
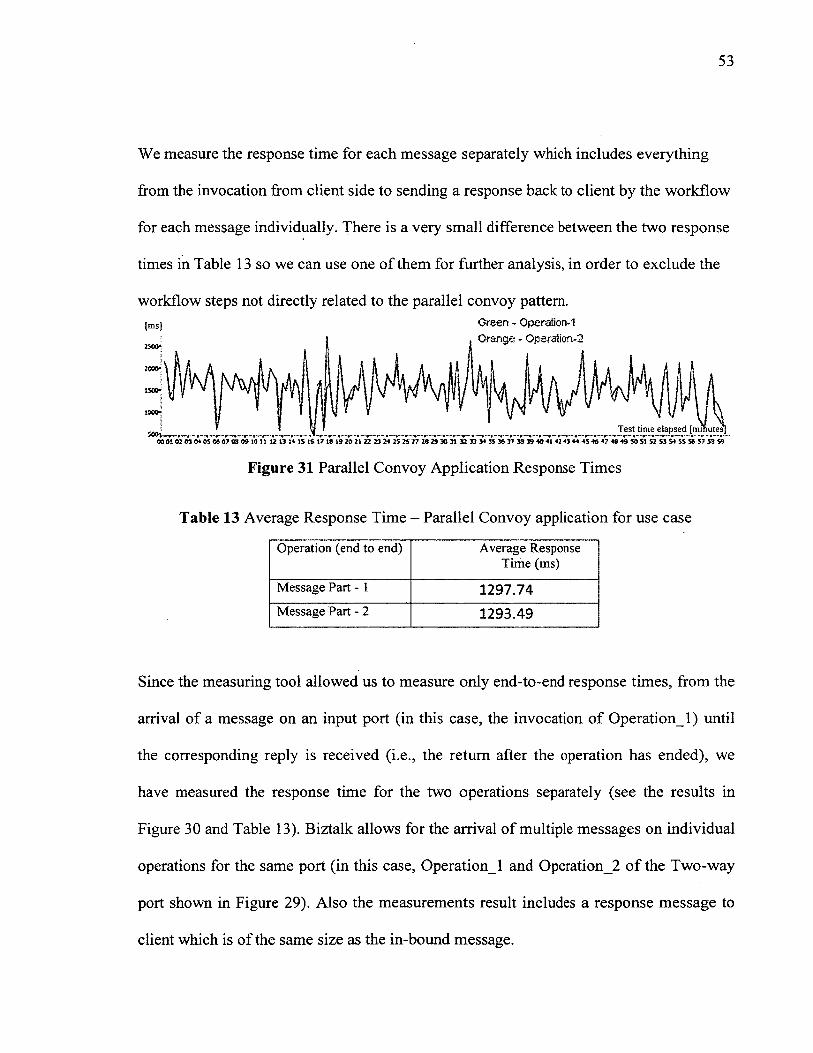
53
We measure the response time for each message separately which includes everything
from the invocation from client side to sending a response back to client by the workflow
for each message individually. There is a very small difference between the two response
times in Table 13 so we can use one of them for further analysis, in order to exclude the
workflow steps not directly related to the parallel convoy pattern.[ms] Green - Opereiion-1
2500*fi,
2000* 1
Orange - Operation-2
tooo*Test time elapsed [minutes
soot00 0 t 02 03 O* OS 66 0 ? OS 09 !0 n 12 n 14 i s l * 17 i s 19 20 21 2 2 23 24 2S 26 27 26 29 30 3 t 32 33 X 3$ 36 37 33 99 40 41 42 43 44 4S 4* 47 40 49 50 St S2 S3 54 $$ 56 5? S3 $9
Figure 31 Parallel Convoy Application Response Times
Table 13 Average Response Time - Parallel Convoy application for use case
Operation (end to end) Average Response Time (ms)
Message Part - 1 1297 .74Message Part - 2 1293.49
Since the measuring tool allowed us to measure only end-to-end response times, from the
arrival of a message on an input port (in this case, the invocation of Operation_l) until
the corresponding reply is received (i.e., the return after the operation has ended), we
have measured the response time for the two operations separately (see the results in
Figure 30 and Table 13). Biztalk allows for the arrival of multiple messages on individual
operations for the same port (in this case, Operation_l and Operation_2 of the Two-way
port shown in Figure 29). Also the measurements result includes a response message to
client which is of the same size as the in-bound message.

According to the approach from Figure 23, we used the orchestration profiler tool to get a
more detailed assessment of the time required to complete each step in the workflow.
Table 14 gives the results for the workflow steps.
Table 14 Detailed Assessment at each level of Parallel Convoy
„ _ . _ Success MmOurat MaxOura AvgDuratShape Id Shape Name Entry Count Exit Count ,
Rate (%) ion (ms) tio n (m s) ion (ms)1 RecPart 1 ISO ISO 100 0 3 04 Aggregate ISO 180 100 0 3 05 RecPart 2 181 180 100 0 253; 16 SendHospital 180 180 100 16 523 437 RecConfirmation 180 180 100 150 1250 4918 Send 1 180 180 100 20 400 449 ACKDelivery 180 180 100 20 440; 28
As indicated in the table, the longest average time is at RecConfirmation, which is when
the orchestration calls the hospital service and waits for a response. While waiting for the
reply from the hospital service, the orchestration instance gets de-hydrated and it has to
be re-hydrated when the web service response is received. However, the
RecConfirmation step is not part of the parallel Convoy, so it will be subtracted from the
measurement.
Another point where re-hydration may appear is before receiving the second part of the
message. As seen in the table, the max value of RecPart2 (253 ms) is much larger than
the max value of receive part 1 (only 3 ms) summarized in Table 15.
Table 15 Maximum delay associated with Parallel Convoy Receive parts
RecPart l delay (max) 3 msec
RecPart_2 delay (max) 253 msec
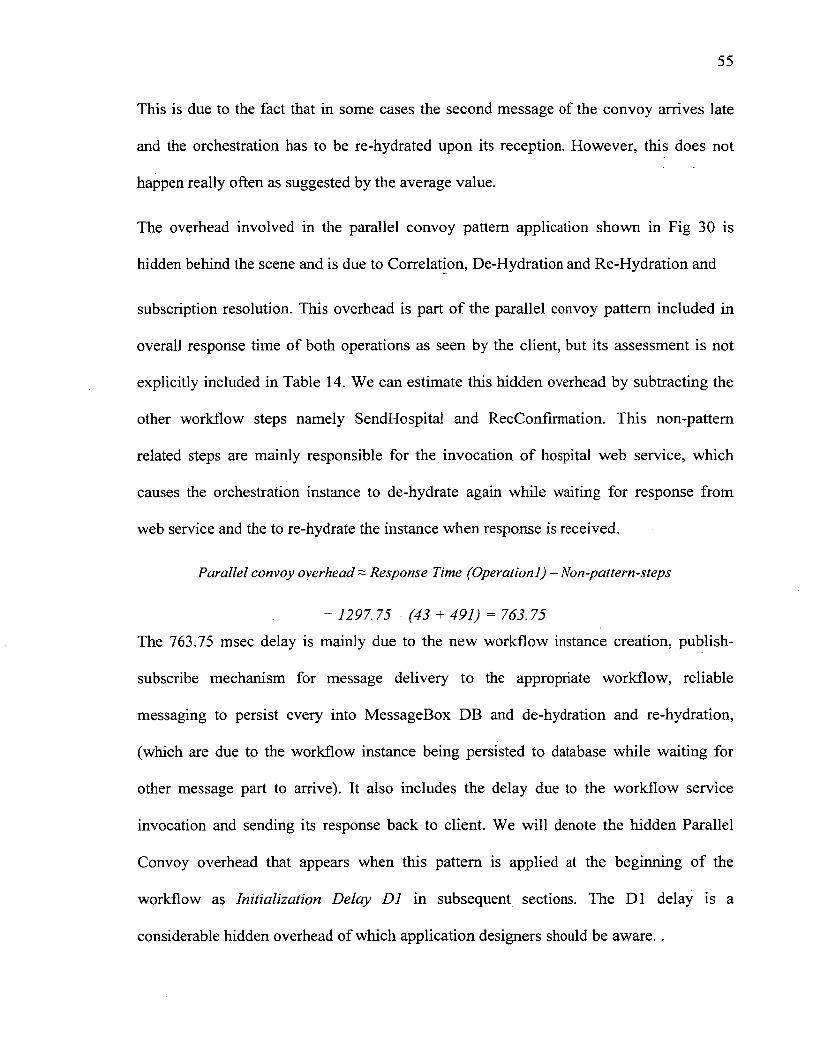
55
This is due to the fact that in some cases the second message of the convoy arrives late
and the orchestration has to be re-hydrated upon its reception. However, this does not
happen really often as suggested by the average value.
The overhead involved in the parallel convoy pattern application shown in Fig 30 is
hidden behind the scene and is due to Correlation, De-Hydration and Re-Hydration and
subscription resolution. This overhead is part of the parallel convoy pattern included in
overall response time of both operations as seen by the client, but its assessment is not
explicitly included in Table 14. We can estimate this hidden overhead by subtracting the
other workflow steps namely SendHospital and RecConfirmation. This non-pattern
related steps are mainly responsible for the invocation of hospital web service, which
causes the orchestration instance to de-hydrate again while waiting for response from
web service and the to re-hydrate the instance when response is received.
Parallel convoy overhead ~ Response Time (Operationl) -N on-pattern-steps
= 1297.75 - (43 + 491) = 763.75 The 763.75 msec delay is mainly due to the new workflow instance creation, publish-
subscribe mechanism for message delivery to the appropriate workflow, reliable
messaging to persist every into MessageBox DB and de-hydration and re-hydration,
(which are due to the workflow instance being persisted to database while waiting for
other message part to arrive). It also includes the delay due to the workflow service
invocation and sending its response back to client. We will denote the hidden Parallel
Convoy overhead that appears when this pattern is applied at the beginning of the
workflow as Initialization Delay D1 in subsequent sections. The D1 delay is a
considerable hidden overhead of which application designers should be aware. .
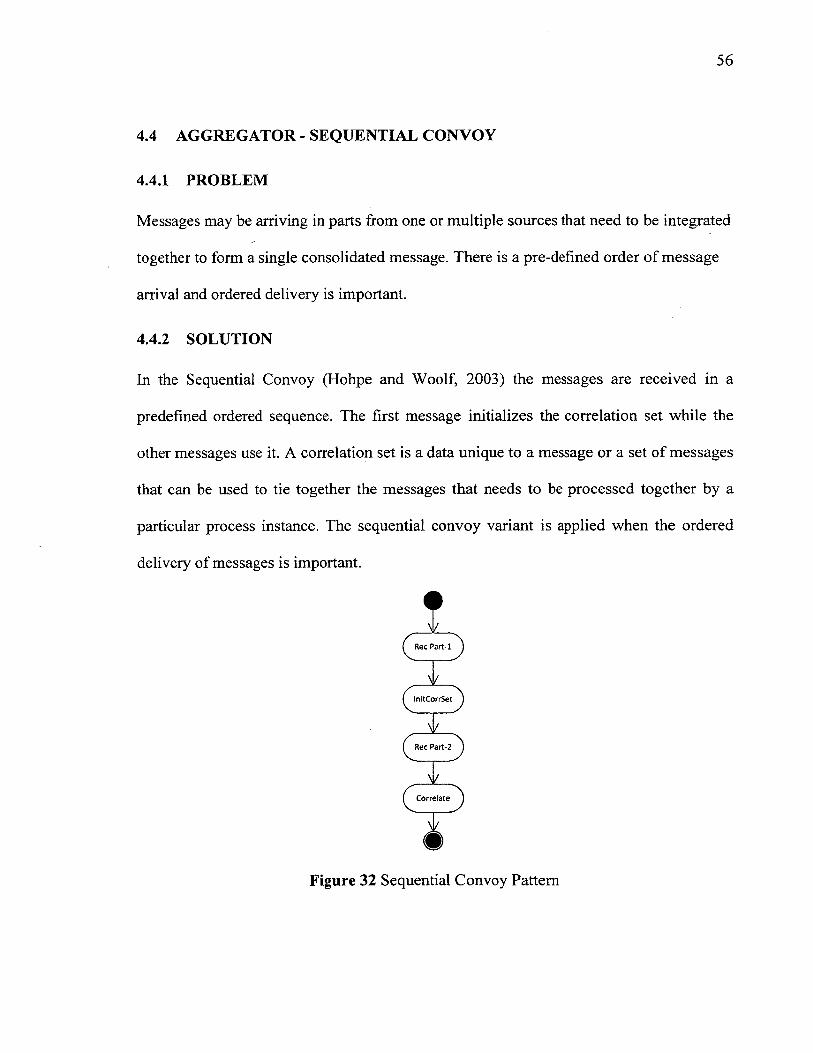
56
4.4 AGGREGATOR - SEQUENTIAL CONVOY
4.4.1 PROBLEM
Messages may be arriving in parts from one or multiple sources that need to be integrated
together to form a single consolidated message. There is a pre-defined order of message
arrival and ordered delivery is important.
4.4.2 SOLUTION
In the Sequential Convoy (Hohpe and Woolf, 2003) the messages are received in a
predefined ordered sequence. The first message initializes the correlation set while the
other messages use it. A correlation set is a data unique to a message or a set of messages
that can be used to tie together the messages that needs to be processed together by a
particular process instance. The sequential convoy variant is applied when the ordered
delivery of messages is important.
InitCorrSet
V^ R e c Part-2Rec Part-2
C orrela te
Figure 32 Sequential Convoy Pattern
57
4.4.3 APPLICATION
In our case study, we have done the base implementation by using both types of convoys
to test and evaluate their performance. As mentioned in the Correlation Identifier, the
arriving messages related to patient may originate from various sources. The sequential
or parallel convoy implementation does the integration of these incoming messages using
the correlation identifier. In this implementation we make use of Sequential Convoy.
SeqPortOperation.!
Request
Response
Figure 33 Sequential Convoy pattern application in Biztalk
Figure 32 shows the sequential convoy pattern and Figure 33 shows its realization in
Biztalk which also shows the ports used for receiving messages and sending response
back to client, these ports are not part of the pattern. The application of use case above
employ the usage of sequential convoy pattern, therefore in next section we can deduce
the time consumes in sequential convoy pattern only by utilizing the overall response
time and knowledge gained from Table 17 obtained by profiling tool.
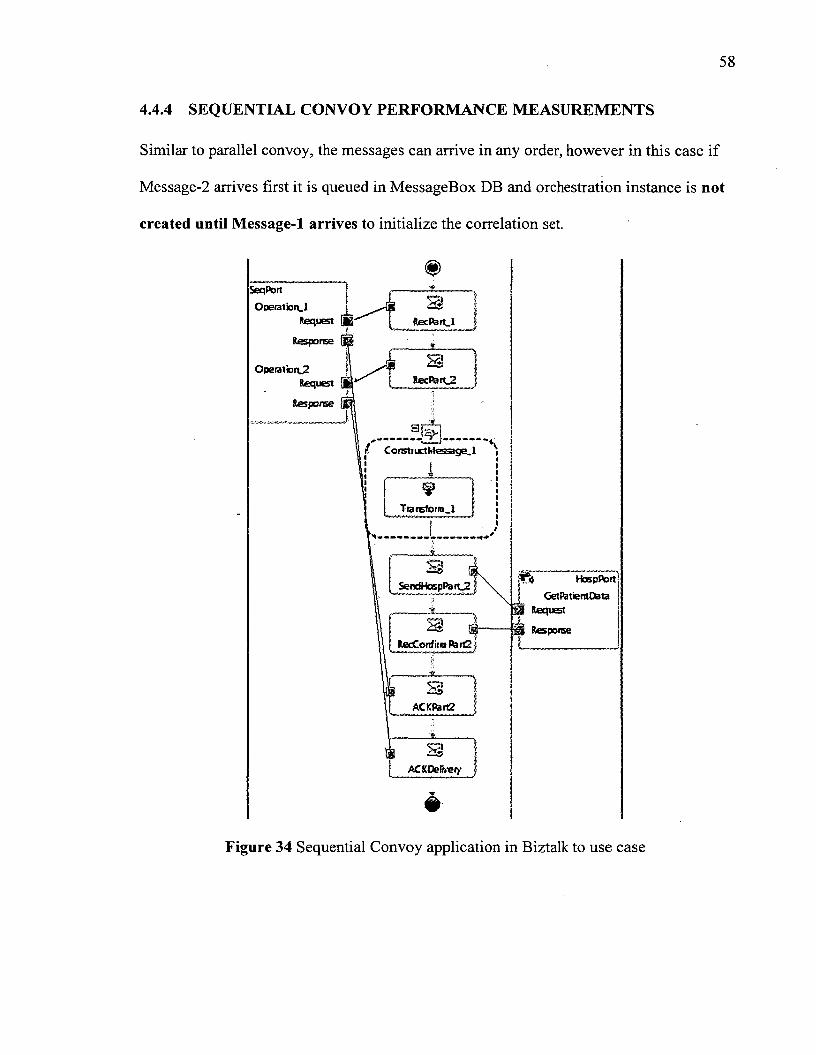
58
4.4.4 SEQUENTIAL CONVOY PERFORMANCE MEASUREMENTS
Similar to parallel convoy, the messages can arrive in any order, however in this case if
Message-2 arrives first it is queued in MessageBox DB and orchestration instance is not
created until Message-1 arrives to initialize the correlation set.
SeqPort
Operation.!Request fj£'i
Response U
j O HospPort
| Get Patient DataH Request
j|§ Response
Figure 34 Sequential Convoy application in Biztalk to use case
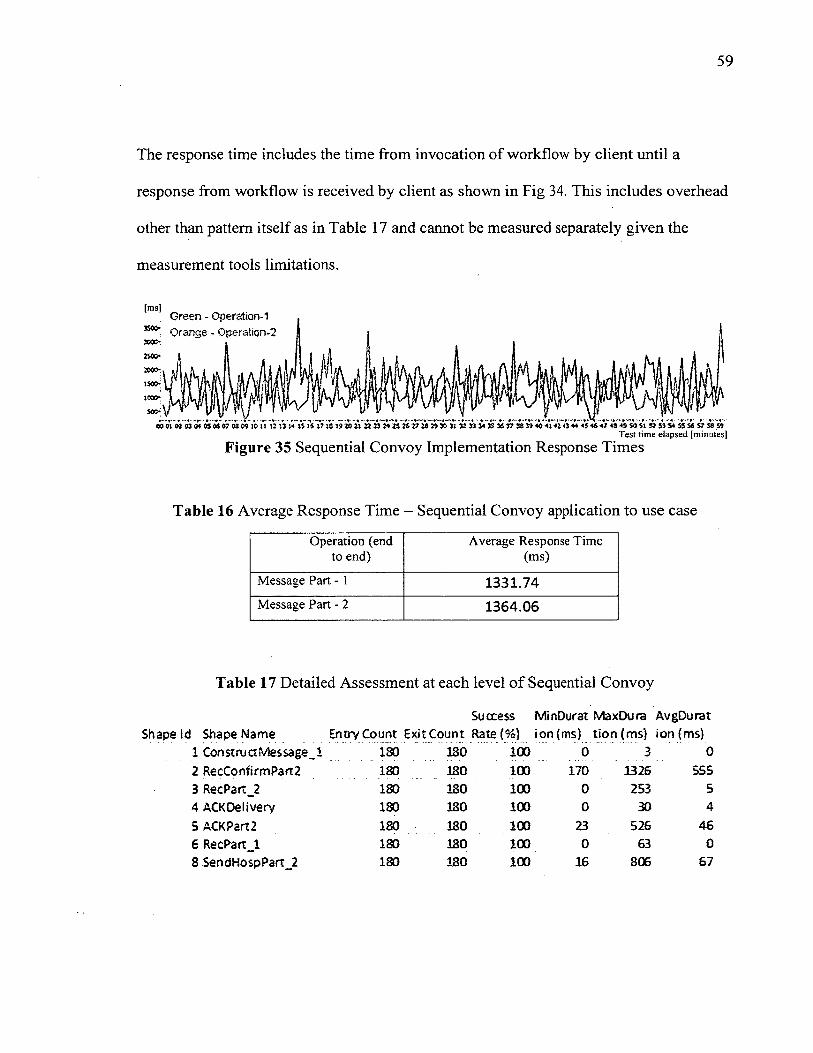
59
The response time includes the time from invocation of workflow by client until a
response from workflow is received by client as shown in Fig 34. This includes overhead
other than pattern itself as in Table 17 and cannot be measured separately given the
measurement tools limitations.
Green - Operation-1: Orange - Operation-?
0001 82 <8 <*05 06 07 08 09 10 U 12 13 14 X$ 1$ 17 18 19 » 21 22 25 24 25 26 &28 2930 Jl 32 » 34 55 3637 38 39404J4*4344 4$4647 43 49 » 51 52 S354 5556 57 S8 59Test time eiapsed [minutes]
Figure 35 Sequential Convoy Implementation Response Times
Table 16 Average Response Time - Sequential Convoy application to use case
Operation (end to end)
Average Response Time (ms)
Message Part - 1 1331 .74Message Part - 2 1364.06
Table 17 Detailed Assessment at each level o f Sequential Convoy
Success MinDurax MaxDura AvgDurat Shapeld ShapeN am e Entry Count Exit Count Rate (%) ion(m s) tion (m s) ion (m s)
1 ConstructM essage_! ISO 180 100 0 .......... 3 02 RecConfirmPart2 180 180 I ® 170 .1326 5553 RecPart_2 180 180 100 0 253 54 ACKDelivery 180 180 100 0 30 4
5 ACKPart2 1®. t s o 100 23 526 466 RecPart_l 180 180 10° 0 63 08 SendHospPart_2 180 180 100 16 806 67
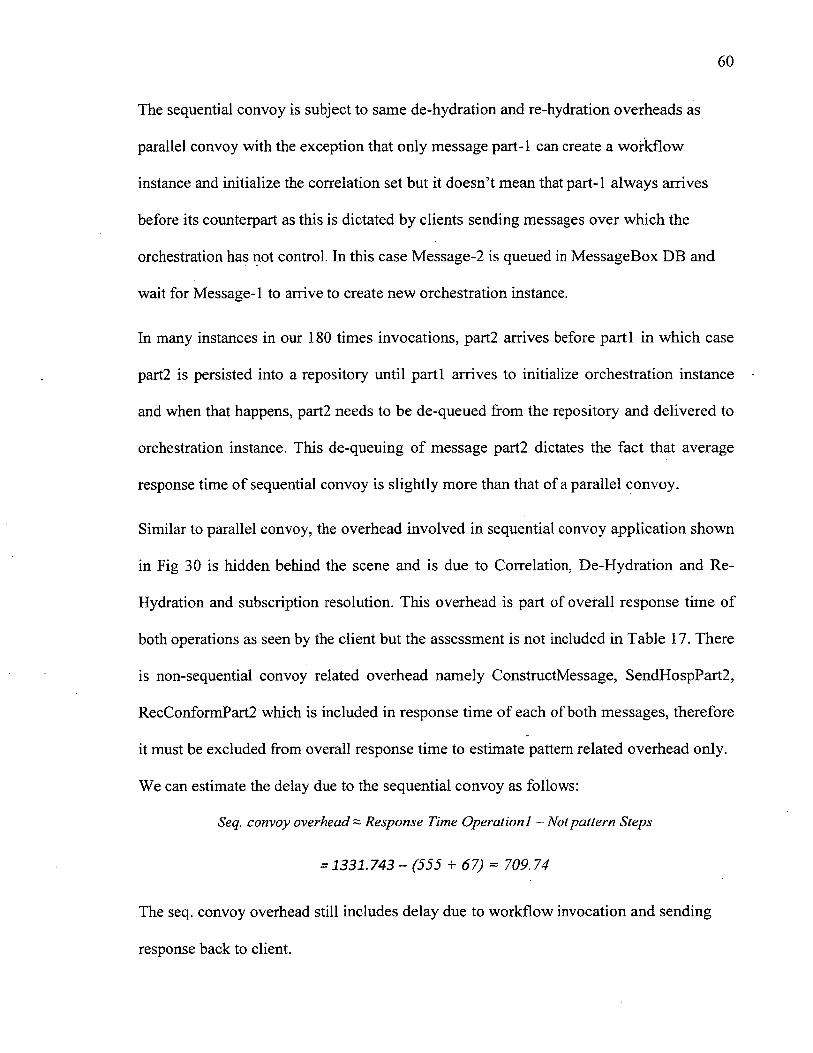
The sequential convoy is subject to same de-hydration and re-hydration overheads as
parallel convoy with the exception that only message part-1 can create a workflow
instance and initialize the correlation set but it doesn’t mean that part-1 always arrives
before its counterpart as this is dictated by clients sending messages over which the
orchestration has not control. In this case Message-2 is queued in MessageBox DB and
wait for Message-1 to arrive to create new orchestration instance.
In many instances in our 180 times invocations, part2 arrives before parti in which case
part2 is persisted into a repository until parti arrives to initialize orchestration instance
and when that happens, part2 needs to be de-queued from the repository and delivered to
orchestration instance. This de-queuing of message part2 dictates the fact that average
response time of sequential convoy is slightly more than that of a parallel convoy.
Similar to parallel convoy, the overhead involved in sequential convoy application shown
in Fig 30 is hidden behind the scene and is due to Correlation, De-Hydration and Re-
Hydration and subscription resolution. This overhead is part of overall response time of
both operations as seen by the client but the assessment is not included in Table 17. There
is non-sequential convoy related overhead namely ConstructMessage, SendHospPart2,
RecConformPart2 which is included in response time of each of both messages, therefore
it must be excluded from overall response time to estimate pattern related overhead only.
We can estimate the delay due to the sequential convoy as follows:
Seq. convoy overhead ~ Response Time Operationl - Not pattern Steps
= 1331.743 - (555 + 67) = 709.74
The seq. convoy overhead still includes delay due to workflow invocation and sending
response back to client.
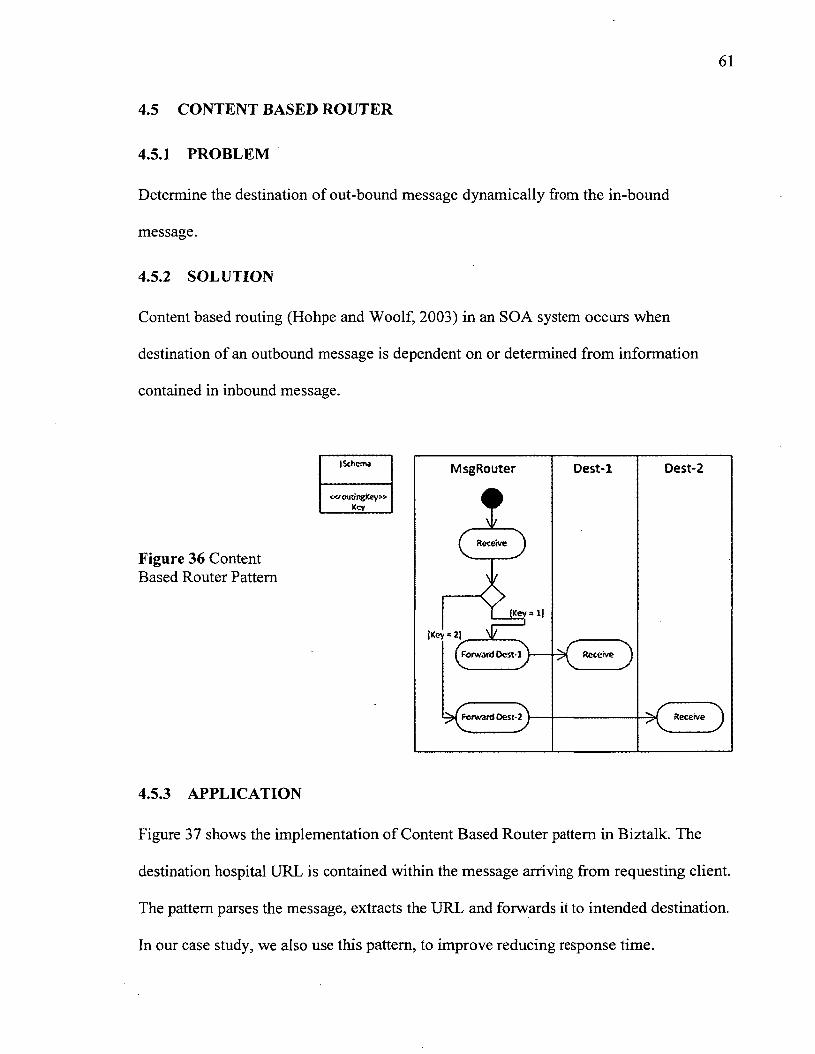
61
4.5 CONTENT BASED ROUTER
4.5.1 PROBLEM
Determine the destination of out-bound message dynamically from the in-bound
message.
4.5.2 SOLUTION
Content based routing (Hohpe and Woolf, 2003) in an SOA system occurs when
destination of an outbound message is dependent on or determined from information
contained in inbound message.
j Schema
«rcutrngfceY» Key
Figure 36 Content Based Router Pattern
4.5.3 APPLICATION
Figure 37 shows the implementation of Content Based Router pattern in Biztalk. The
destination hospital URL is contained within the message arriving from requesting client.
The pattern parses the message, extracts the URL and forwards it to intended destination.
In our case study, we also use this pattern, to improve reducing response time.
MsgRouter
•
Dest-1 Dest-2
^ Receive ^
AT !K ev*U
= 21 \ P
f o r w a r d O est-l^---- Receive ^
^ ^ F o n v a rd Oest-2^---- — Receive ^
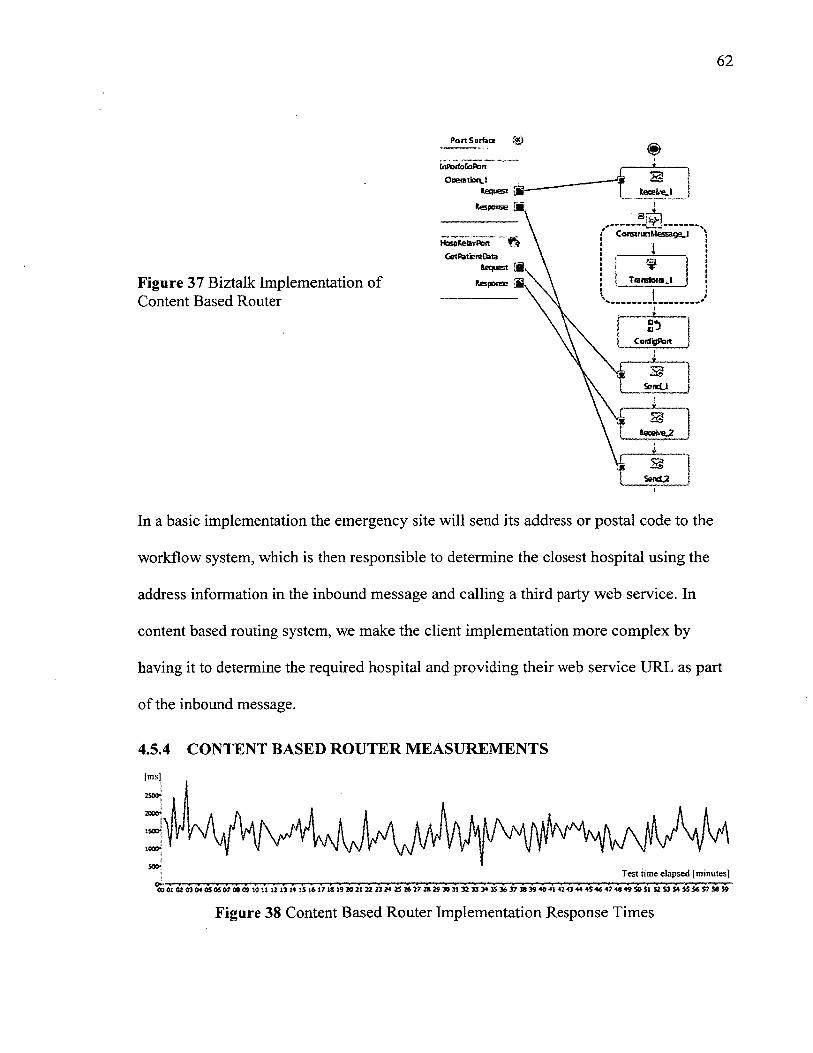
62
PortSurfaas
InflorfofioflonOperatbru.1
tequea ®
m
Figure 37 Biztalk Implementation of Content Based Router
Const! uctMesaggLlHaspRefeyPort
GetPatiemC&afewest S.
Response [fi.
sSencLl
Sen4J2
In a basic implementation the emergency site will send its address or postal code to the
workflow system, which is then responsible to determine the closest hospital using the
address information in the inbound message and calling a third party web service. In
content based routing system, we make the client implementation more complex by
having it to determine the required hospital and providing their web service URL as part
of the inbound message.
4.5.4 CONTENT BASED ROUTER MEASUREMENTS
Test time elapsed [minutes]
Figure 38 Content Based Router Implementation Response Times

63
Table 18 Average Response Time - Content Based Router
Operation (end to end) Average Response Time (ms)
Client Aggregated Message 1080.21
Table 19 Detailed Assessment at each level of Content Based Router
Shape Id Shape NameEntry Exit ! Success jMinDurat: MaxDura AvgDurat
Count ! Count ; Rate (%) ! ion (ms) itio n (m s ) ; ion (ms)1 Send_2 180 180 100; 6; 190 272 ConstructM essagejL 180! 180; 100! oi 13 03 Receive 2 180 180; 100! 126! 1370 5354 Receive 1 180! 180 1001 Of 6b ; 06 S end_l 180 180 100;
_ j _266i 55
7 Expression_l 180: 180 loo! o! _ 3r __ 0
As from Table 18, the response time of the design based on the content based router
pattern is less than that of the parallel and sequential convoy. This is because it avoids
receiving an extra message which saves the application of hidden platform patterns
overheads related to that message. Also there is no need of correlation of messages to be
performed as there is only one single message.
However, in this case it becomes the client’s responsibility to integrate all the relevant
information and send it as a single message. There is no de-hydration and re-hydration of
orchestration instance performed as the orchestration can continue its normal execution
after the reception of the single message.
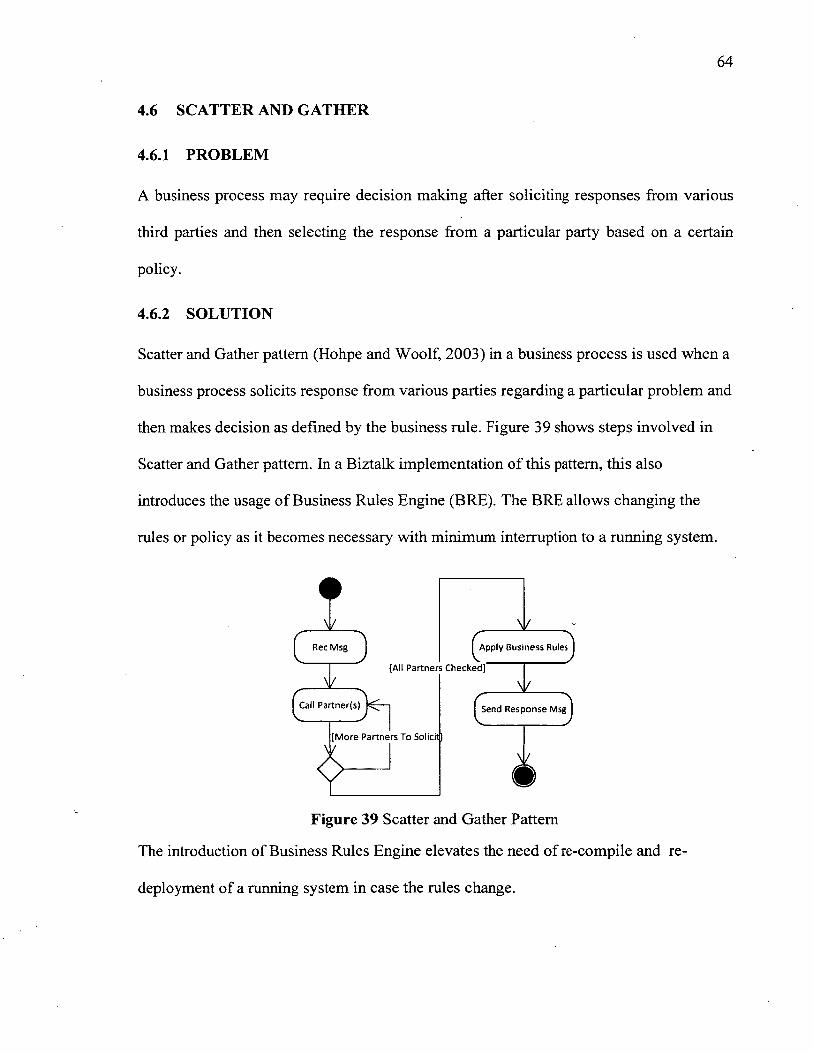
4.6 SCATTER AND GATHER
4.6.1 PROBLEM
A business process may require decision making after soliciting responses from various
third parties and then selecting the response from a particular party based on a certain
policy.
4.6.2 SOLUTION
Scatter and Gather pattern (Hohpe and Woolf, 2003) in a business process is used when a
business process solicits response from various parties regarding a particular problem and
then makes decision as defined by the business rule. Figure 39 shows steps involved in
Scatter and Gather pattern. In a Biztalk implementation of this pattern, this also
introduces the usage of Business Rules Engine (BRE). The BRE allows changing the
rules or policy as it becomes necessary with minimum interruption to a running system.
^ Rec M sg ^ Apply B usiness Rules
[All P a rtn e rs C hecked]
Call Partner(s) Send R esp o n se Msg
[M ore P a rtn e rs To Solicit |
Figure 39 Scatter and Gather Pattern
The introduction of Business Rules Engine elevates the need of re-compile and re
deployment of a running system in case the rules change.
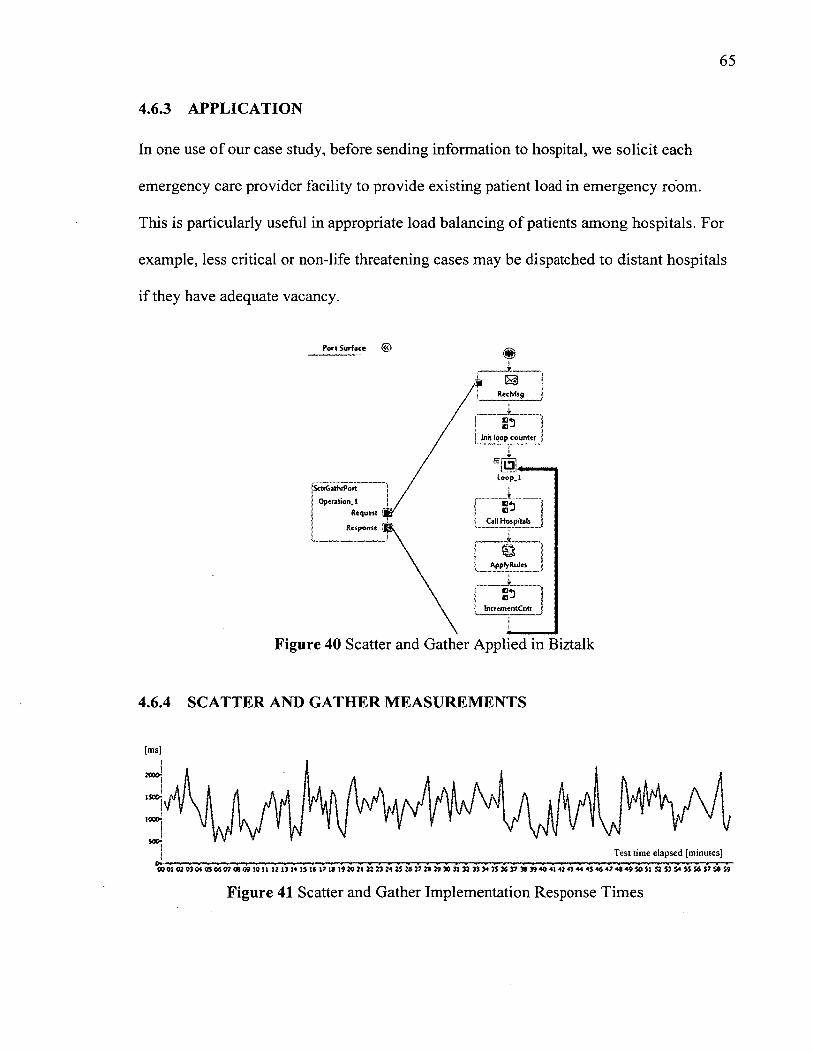
65
4.6.3 APPLICATION
In one use of our case study, before sending information to hospital, we solicit each
emergency care provider facility to provide existing patient load in emergency room.
This is particularly useful in appropriate load balancing of patients among hospitals. For
example, less critical or non-life threatening cases may be dispatched to distant hospitals
if they have adequate vacancy.
Port Surface {<<}
Init loop counter
loop .!
Request
ResponseCall Hospitals
Figure 40 Scatter and Gather Applied in Biztalk
4.6.4 SCATTER AND GATHER MEASUREMENTS
[ms]
Test time elapsed [minutes]
Figure 41 Scatter and Gather Implementation Response Times
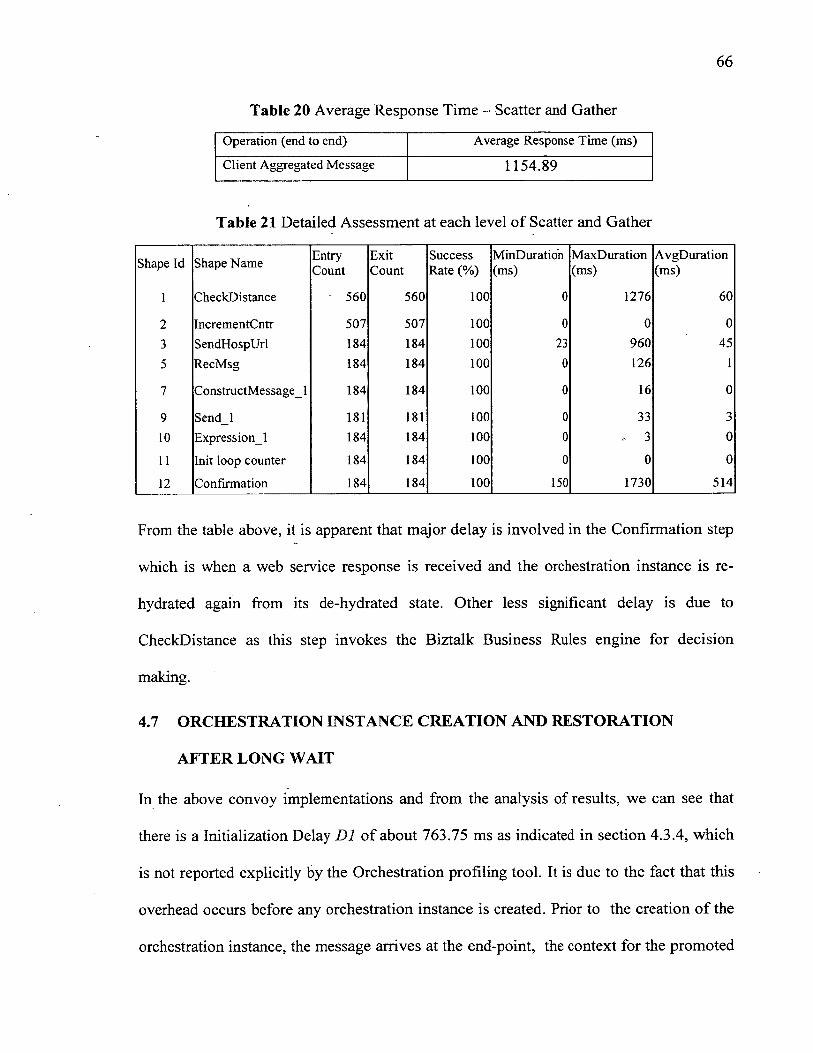
66
Table 20 Average Response Time - Scatter and Gather
Operation (end to end) Average Response Time (ms)
Client Aggregated Message 1154.89
Table 21 Detailed Assessment at each level of Scatter and Gather
pe Id Shape Name EntryCount
ExitCount
Success Rate (%)
MinDuration(ms)
MaxDuration(ms)
AvgDuration(ms)
1 CheckDistance 560 560 100 0 1276 60
2 IncrementCntr 507 507 100 0 0 0**>_> SendHospUrl 184 184 100 23 960 455 RecMsg 184 184 100 0 126 1
7 ConstructMessagel 184 184 100 0 16 0
9 Send_l 181 181 100 0 33 310 Expression^ 184 184 100 0 , 3 0
11 Init loop counter 184 184 100 0 0 0
12 Confirmation 184 184 100 150 1730 514
From the table above, it is apparent that major delay is involved in the Confirmation step
which is when a web service response is received and the orchestration instance is re
hydrated again from its de-hydrated state. Other less significant delay is due to
CheckDistance as this step invokes the Biztalk Business Rules engine for decision
making.
4.7 ORCHESTRATION INSTANCE CREATION AND RESTORATION
AFTER LONG WAIT
In the above convoy implementations and from the analysis of results, we can see that
there is a Initialization Delay D1 of about 763.75 ms as indicated in section 4.3.4, which
is not reported explicitly by the Orchestration profiling tool. It is due to the fact that this
overhead occurs before any orchestration instance is created. Prior to the creation of the
orchestration instance, the message arrives at the end-point, the context for the promoted
properties is created and attached to message, which is then persisted into the message
box together with the attached context. The Biztalk subscription mechanism dequeues the
messages from the message box and takes care of initializing or rehydrating the
appropriate orchestration instance. This delay implied by this process is not in captured
by the profiling tool, but can be seen as the difference between the end-to-end response
time and the sum of the step averages provided by the profiling tool. We denote this
delay by Dl. This delay can be verified by the measurement from the previous chapters
used to invoke an empty workflow service in order to evaluate the overhead due to the
platform-provided patterns in which case there is no correlation and re-hydration
performed due to fact that there is only one message but still there other overhead is
involved due to creation of property schema, persistence to message box, subscription
resolution and new orchestration instance creation.
At the development level, we can observe that the multiple receive steps, such as in
convoys, increases the overall response time due to the processing of the message
correlation set and re-hydration of orchestrations in the cases when the subsequent
messages are arriving later than the previous message.
Another common delay element in all implementations is the delay caused by the
dehydration and rehydration process when a third party web service is invoked, similar to
the hospital web service in our case study. The delay to rehydrate an orchestration after
receiving a response from a web service is about 500 ms, which also includes the
overhead of invoking and receiving response from a simple SOAP service, which is about
68
10 ms, as measured in previous chapter. According to this, we can assume that the
overhead required for the dehydration and rehydration of an orchestration instance takes
on average 490 ms on the system configurations we used for measurements. Let us
denote the dehydration and rehydration overhead by D2 (in ms). Therefore, if there are N
Web Service invocations in an orchestration, the likely overhead for dehydration and
rehydration will be in order of iV * D2 ms.
Similarly, if there are M message parts that arrive initially to an invoked workflow
service that need to be received by the workflow, the minimum average delay due to
instance creation, publish-subscribe, reliable messaging, dehydration and rehydration can
be order of (M-1)*D1 ms. Unfortunately, we could not investigate more closely this delay
and its relationship with the number of message parts that need to be received with the
measurement tools available in this research.
We can estimate that if there are M messages parts arriving to an orchestration that need
to be received and processed together for each invocation, and if this orchestration calls
N web services during its execution, the maximum average overhead due to dehydration
and rehydration (which are hidden patterns) would be:
((M-l) * D l) + (N*D 2)
4.8 RESPONSE TIME MEASUREMENT CHALLENGES
Since a broad range of patterns are implemented at platform level, it becomes difficult to
measure effect of each step on end to end response time due to lack of instrumentation at
fine grained levels. A detailed knowledge of platform implementation and API helps in
determining what overheads are involved and to associate them to generic patters but
measuring the performance cost tag attached to each stage is difficult such as time
required to determine a message subscriptions (Publish-Subscribe patterns), to persist
message to database (reliable messaging) and to de-hydrate and re-hydrate workflows.
However, wherever possible techniques such as eliminating the known delay of steps in
workflow from overall response time and incrementally building the system can help
estimate delays like D1 and D2.
70
5 PREDICTIVE PERFORMANCE EVALUATION
5.1 INTRODUCTION
In chapter 3 we evaluated the overhead that lies in patterns implemented by the
development and hosting platform, whereas in chapter 4 we measured the performance
implications of development patterns such as sequential and parallel convoy. We can
combine the knowledge gained to predict the performance of a SOA application that is
not implemented yet. This helps the designer of the workflows to gain a basic idea of the
performance of the system being designed by using our approach to predict the
performance overhead of the new system, then decide which patterns to use and why. We
evaluate this process with a new case study, whose response time is estimated based on
the design and our pattern measurements from Chapters 3 and 4. Next we validate the
estimations against measurements based on the actual implementation and execution of
the system on top of Biztalk.
5.2 CASE STUDY
This case study provides an automated solution for handling the prescription renewal
requests from a patient and determines the coverage of the drug by the insurance
provider. It is a part of the Electronic Prescribing Work/low Analysis Handbook
developed by the eHealthObservatory research team at the University of Victoria
(Partridge and Bassi, 2011). As clinicians migrate to using electronic medical records
(EMRs), one of the key workflow changes they will encounter will be the use of the
computer in prescribing. The ePrescribe system provided by the eHealthObservatory has
5 stages that implements more automation steps using computer assisted workflows as
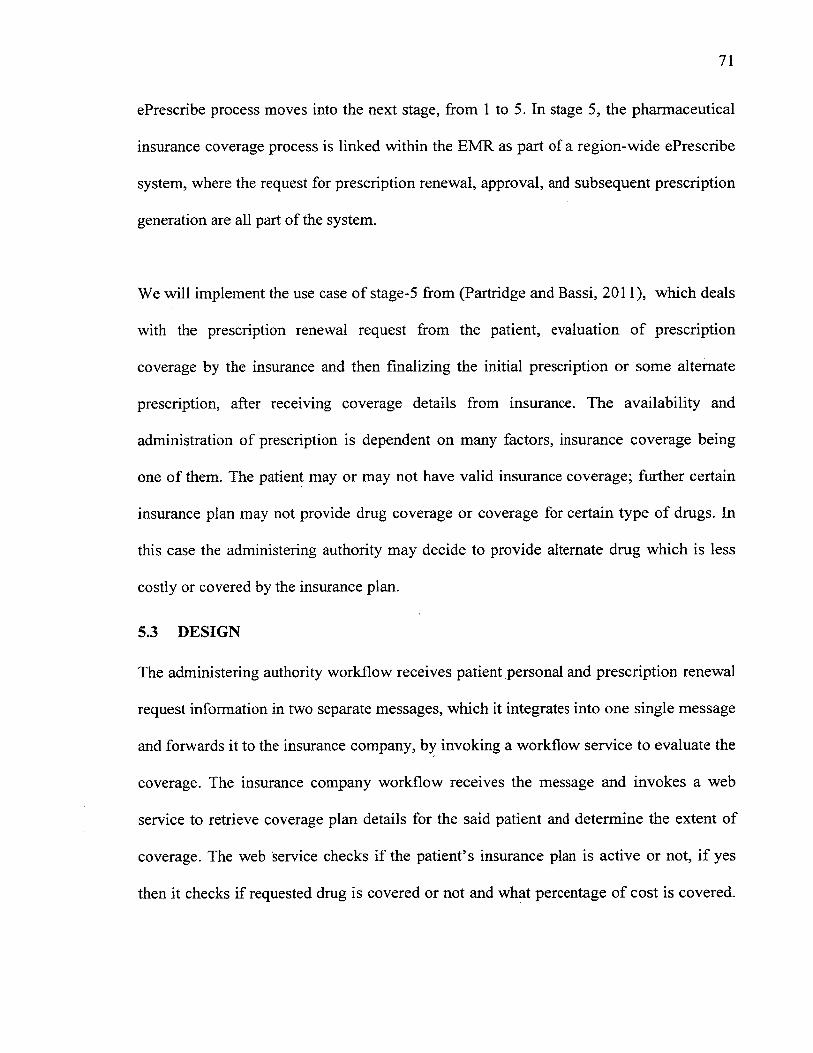
71
ePrescribe process moves into the next stage, from 1 to 5. In stage 5, the pharmaceutical
insurance coverage process is linked within the EMR as part of a region-wide ePrescribe
system, where the request for prescription renewal, approval, and subsequent prescription
generation are all part of the system.
We will implement the use case of stage-5 from (Partridge and Bassi, 2011), which deals
with the prescription renewal request from the patient, evaluation of prescription
coverage by the insurance and then finalizing the initial prescription or some alternate
prescription, after receiving coverage details from insurance. The availability and
administration of prescription is dependent on many factors, insurance coverage being
one of them. The patient may or may not have valid insurance coverage; further certain
insurance plan may not provide drug coverage or coverage for certain type of drugs. In
this case the administering authority may decide to provide alternate drug which is less
costly or covered by the insurance plan.
5.3 DESIGN
The administering authority workflow receives patient personal and prescription renewal
request information in two separate messages, which it integrates into one single message
and forwards it to the insurance company, by invoking a workflow service to evaluate the
coverage. The insurance company workflow receives the message and invokes a web
service to retrieve coverage plan details for the said patient and determine the extent of
coverage. The web service checks if the patient’s insurance plan is active or not, if yes
then it checks if requested drug is covered or not and what percentage of cost is covered.
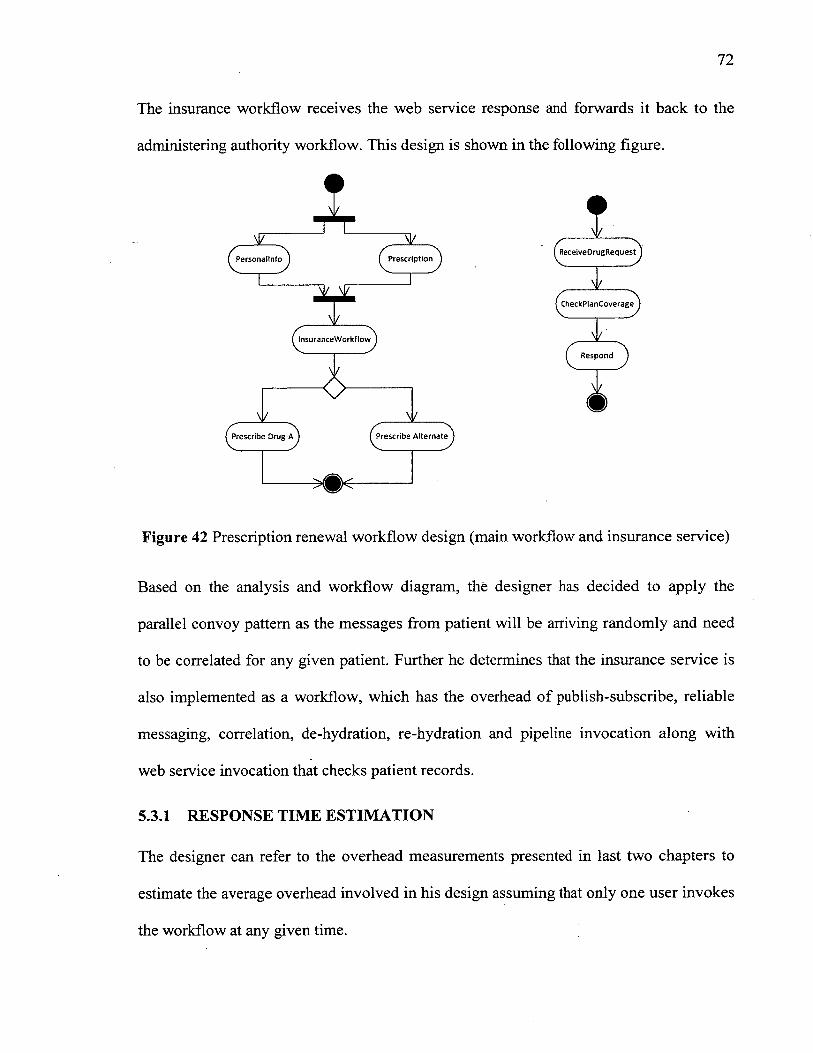
72
The insurance workflow receives the web service response and forwards it back to the
administering authority workflow. This design is shown in the following figure.
v
MT I^ Personallnfo^ ^ Prescription^
-------
^ReceiveDrugRequest^
M/^insurance W orkflow ^
V^heckP tanC overag^
\ /^ R e s p o n d ^ ^
O\l/ \l/
^Prescribe Drug-A^ p r e s c r ib e A lternate^
----------
Figure 42 Prescription renewal workflow design (main workflow and insurance service)
Based on the analysis and workflow diagram, the designer has decided to apply the
parallel convoy pattern as the messages from patient will be arriving randomly and need
to be correlated for any given patient. Further he determines that the insurance service is
also implemented as a workflow, which has the overhead of publish-subscribe, reliable
messaging, correlation, de-hydration, re-hydration and pipeline invocation along with
web service invocation that checks patient records.
5.3.1 RESPONSE TIME ESTIMATION
The designer can refer to the overhead measurements presented in last two chapters to
estimate the average overhead involved in his design assuming that only one user invokes
the workflow at any given time.
One challenge is that the measurement results presented in Chapter 3 and 4 are dependent
on the hardware and software configuration used for measurements. Other configuration
may give different timing results, so we will assume that either: a) the measurements
from chapter 3 and 4 were repeated on the new configuration to obtain the corresponding
overhead values; or b) the designers applies a scaling factor (which is obtained from other
experiments) between the two configurations. In any case, scaling measurement results
from a configuration to another one is a complex problem that requires future
investigation.
In order to estimate the overhead for a new design for the prescription refill workflow
from the ePrescribe system, considered as a case study for this chapter, we refer to:
• Measurements results of Parallel Convoy pattern to check what overhead is
involved.
• Measurements results for workflow invocations with variable data size (which in
this case is 1 KB).
Beside the above overheads, we realize that other delays will contribute to the workflow
response time due to business logic and the execution of external services invoked.
Assuming that in our case we will be dealing with messages with 1 KB data size, the
minimum average overhead introduced by patterns in the prescription refill workflow is
estimated in Table 22.
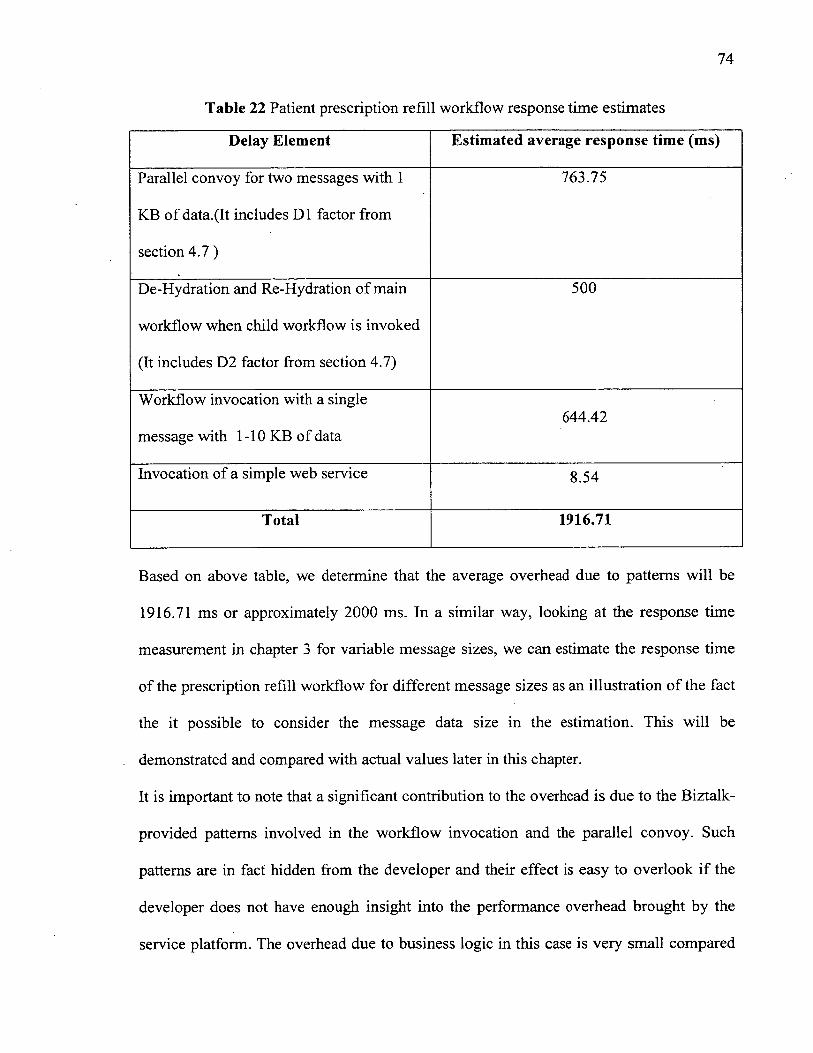
74
Table 22 Patient prescription refill workflow response time estimates
Delay Element Estimated average response time (ms)
Parallel convoy for two messages with 1
KB of data. (It includes D1 factor from
section 4.7)
763.75
De-Hydration and Re-Hydration of main
workflow when child workflow is invoked
(It includes D2 factor from section 4.7)
500
Workflow invocation with a single
message with 1-10 KB of data644.42
Invocation of a simple web service 8.54
Total 1916.71
Based on above table, we determine that the average overhead due to patterns will be
1916.71 ms or approximately 2000 ms. In a similar way, looking at the response time
measurement in chapter 3 for variable message sizes, we can estimate the response time
of the prescription refill workflow for different message sizes as an illustration of the fact
the it possible to consider the message data size in the estimation. This will be
demonstrated and compared with actual values later in this chapter.
It is important to note that a significant contribution to the overhead is due to the Biztalk-
provided patterns involved in the workflow invocation and the parallel convoy. Such
patterns are in fact hidden from the developer and their effect is easy to overlook if the
developer does not have enough insight into the performance overhead brought by the
service platform. The overhead due to business logic in this case is very small compared
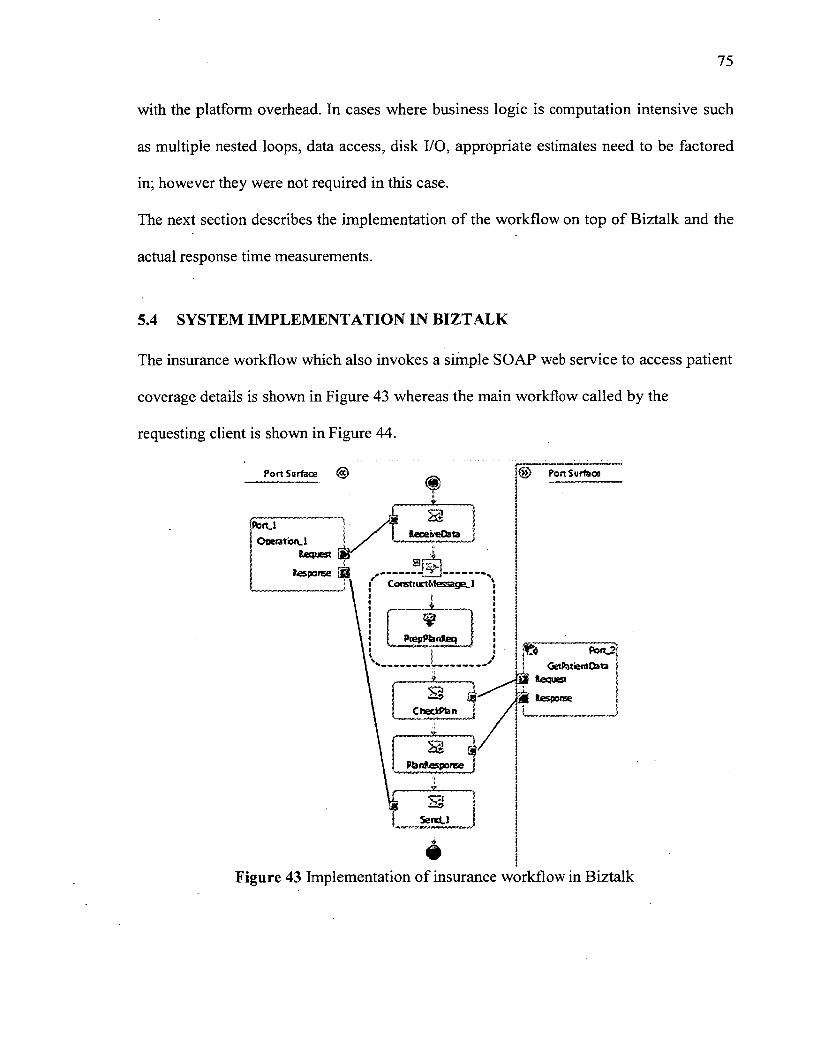
75
with the platform overhead. In cases where business logic is computation intensive such
as multiple nested loops, data access, disk I/O, appropriate estimates need to be factored
in; however they were not required in this case.
The next section describes the implementation of the workflow on top of Biztalk and the
actual response time measurements.
5.4 SYSTEM IMPLEMENTATION IN BIZTALK
The insurance workflow which also invokes a simple SOAP web service to access patient
coverage details is shown in Figure 43 whereas the main workflow called by the
requesting client is shown in Figure 44.
® PortSurfaoeP ort Surface
{teceb-eOata I
_ t% ___ „C orstiuctM essage.) \
Send.!
Figure 43 Implementation o f insurance workflow in Biztalk
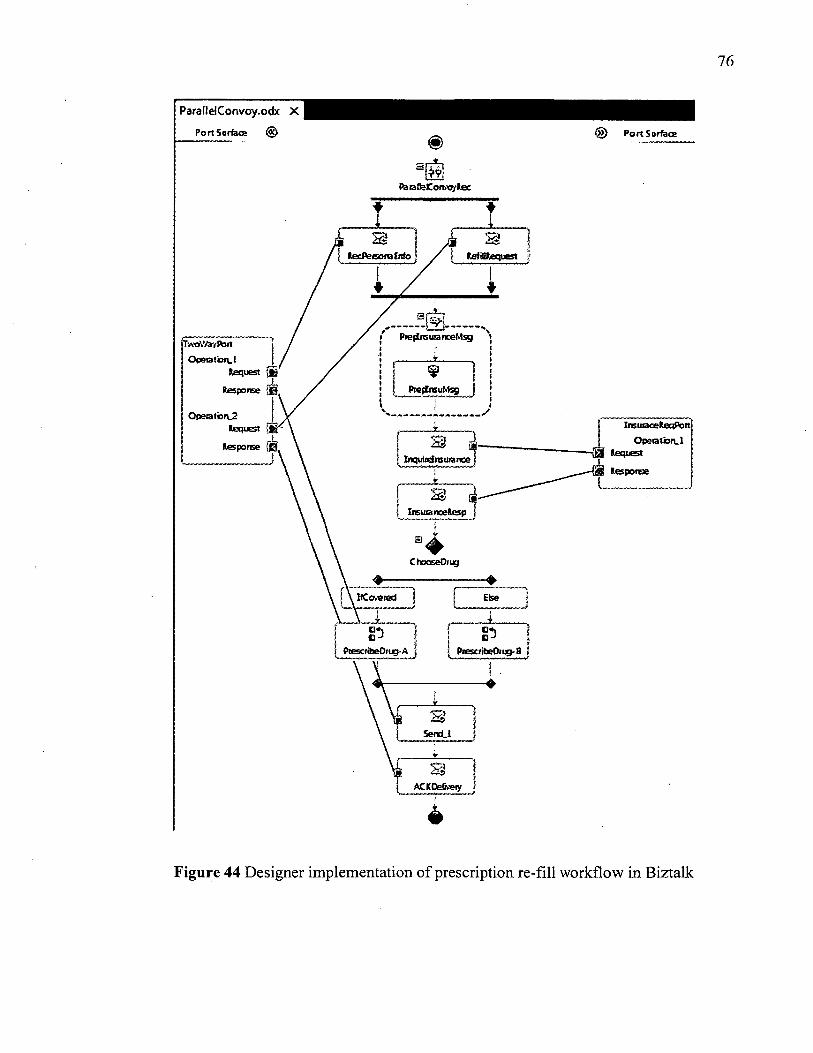
76
ParallelConvoy.odx X |
Port Surface ® ® Port Surface
ParafeCotvo’/lec
p.voWayPort
] Operatbn.1
IrauraceRectPort Operation. 1
Figure 44 Designer implementation of prescription re-fill workflow in Biztalk
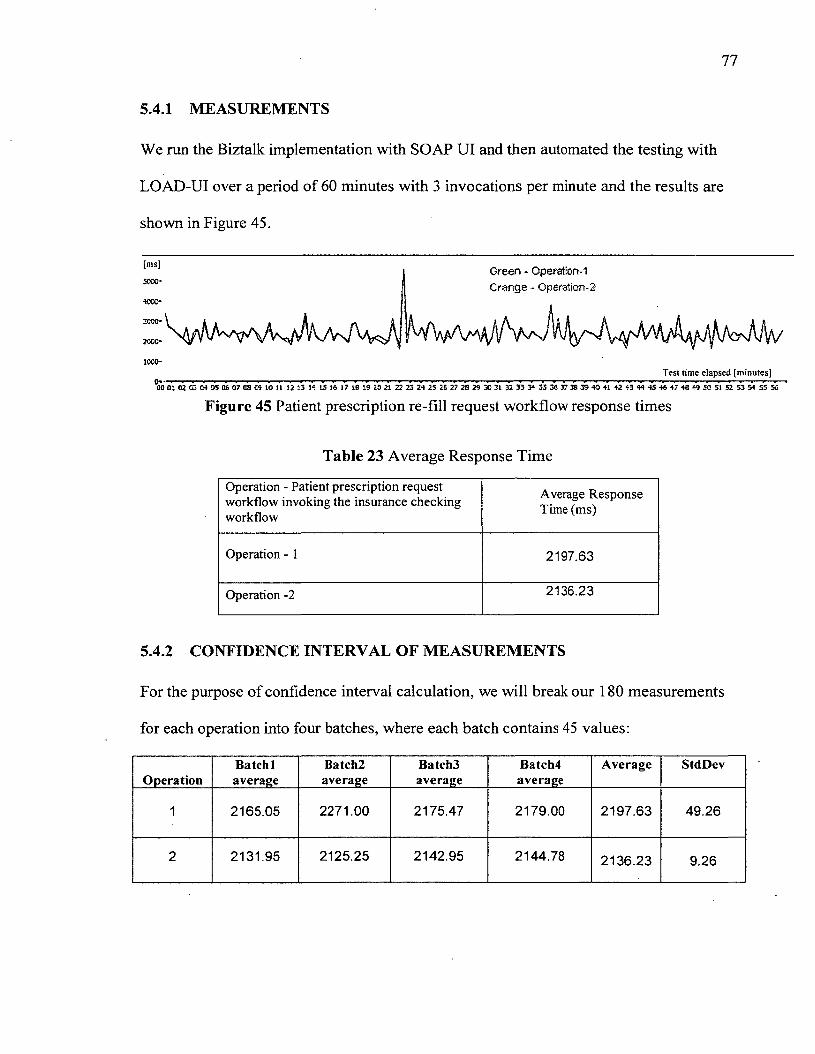
77
5.4.1 MEASUREMENTS
We run the Biztalk implementation with SOAP UI and then automated the testing with
LOAD-UI over a period of 60 minutes with 3 invocations per minute and the results are
shown in Figure 45.
[ms] Green - Operation-1 Orange - Operation-25CCC-
iccc-Test time elapsed [minutes]
01 02 <3 04 35 06 07 03 « 10 11 12 13 14 L5 16 17 18 19 20 21 22 23 24 2S 26 27 2fl 29 3C 31 32 33 34 33 36 37 38 35 4341 42 43 44 45 46 47 48 *9 SO 51 52 53 54 55 56
Figure 45 Patient prescription re-fill request workflow response times
Table 23 Average Response Time
Operation - Patient prescription request workflow invoking the insurance checking workflow
Average Response Time (ms)
Operation - 1 2197.63
Operation -2 2136.23
5.4.2 CONFIDENCE INTERVAL OF MEASUREMENTS
For the purpose of confidence interval calculation, we will break our 180 measurements
for each operation into four batches, where each batch contains 45 values:
OperationBatch 1 average
Batch2average
Batch3average
Batch4average
Average StdDev
1 2 1 6 5 .0 5 2 2 7 1 .0 0 2 1 7 5 .4 7 2 1 7 9 .0 0 2 1 9 7 .6 3 4 9 .2 6
2 2 1 3 1 .9 5 2 1 2 5 .2 5 2 1 4 2 .9 5 2 1 4 4 .7 8 2 1 3 6 .2 3 9 .26
78
For 95 % confidence interval of 4 sample size, we use the following equation (where the
coefficient 2.776 was taken from tables provided for t-Student distribution):
[Average - (StDev * 2.776), Average + (StDev * 2.776)]
For operation-1 we obtain the following confidence interval:
[2060.88 ms, 2334.37 ms]
For operation-2 we obtain the following confidence interval:
[2110.52 ms, 2161.93 ms]
We can observe that the actual value of the response time for each operation is rather
close to the estimated value from section 5.3.1; in fact the relative error of the estimated
value is within 15% of the actual values of both operations.
5.5 ESTIMATION WITH VARIABLE MESSAGE SIZE
In chapter 3, we performed measurements for variable message sizes; 1 KB had response
time of 644ms, whereas that of 800 KB was 904ms, which is a difference of 260 ms. If
we assume that the prescription refill workflow requires 800KB instead of 1 KB, we can
add an additional overhead of 260 ms on each operation due to the large message size.
Therefore we can estimate that the responses time for each operation 800 KB will be:
Operation -1 Reponses Time (1 KB) + 260 — 2197.63+ 260 = 2457 ms
Operation -2 Response Time (1 KB) + 260 = 2136 + 260 = 2396 ms
We then actually tested the prescription refill workflow with 800 KB message size and
obtained the results shown in the following figure:
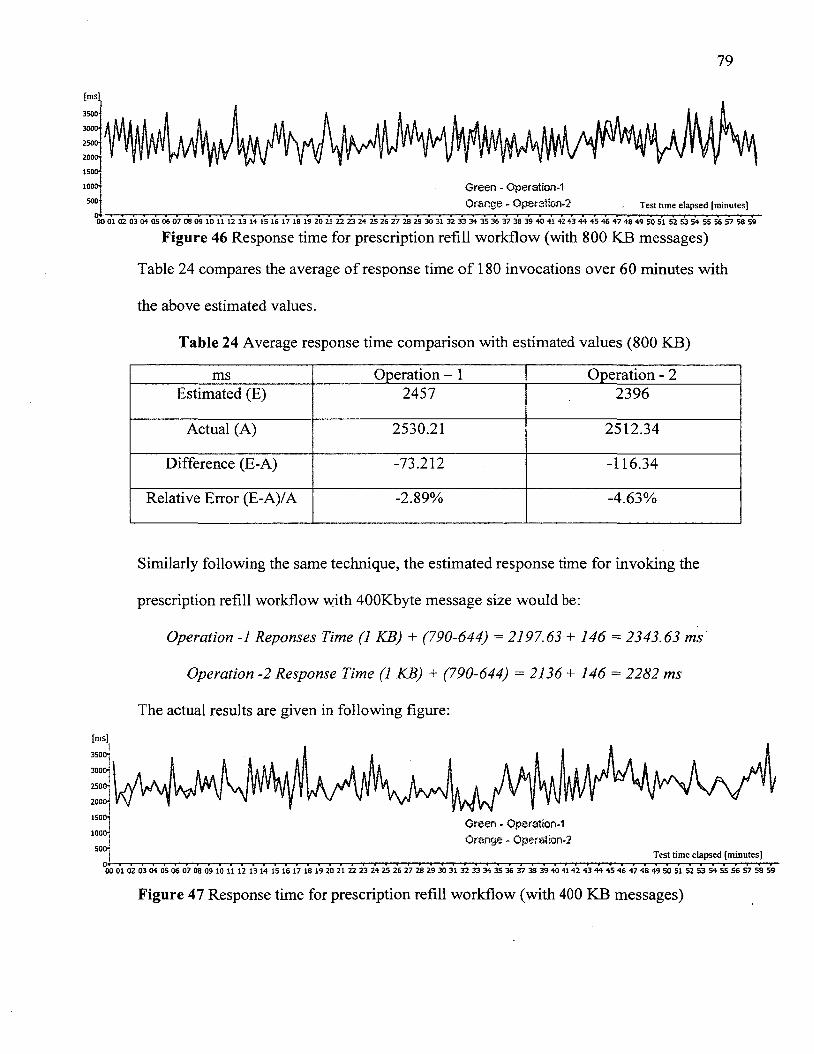
79
[ms]
3000-
2500'
2000-
1500*
Green - Operation-1 Orange - Operation-2
1000 -
soo- Test time elapsed [minutes]00 01 02 03 04 05 06 07 08 09 10 11 12 13 14 15 16 17 18 19 20 21 22 23 24 25 26 27 28 29 30 31 32 33 34 35 36 37 38 39 40 41 42 43 44 45 46 47 48 49 50 51 52 53 54 55 56 57 58 59
Figure 46 Response time for prescription refill workflow (with 800 KB messages)
Table 24 compares the average of response time of 180 invocations over 60 minutes with
the above estimated values.
Table 24 Average response time comparison with estimated values (800 KB)
ms Operation - 1 Operation - 2Estimated (E) 2457 2396
Actual (A) 2530.21 2512.34
Difference (E-A) -73.212 -116.34
Relative Error (E-A)/A -2.89% -4.63%
Similarly following the same technique, the estimated response time for invoking the
prescription refill workflow with 400Kbyte message size would be:
Operation -1 Reponses Time (1 KB) + (790-644) = 2197.63 + 146 = 2343.63 ms
Operation -2 Response Time (1 KB) + (790-644) = 2136 + 146 = 2282 ms
The actual results are given in following figure:[ms]
3000-
2500-
2000 -
1500-Green - Operation-1 Orange ~ Operation-2
1000-
500- Test time elapsed [minutes]00 01 02 03 04 05 06 07 08 09 10 11 12 13 14 15 16 17 18 19 20 21 22 23 24 25 26 27 28 29 30 31 32 33 34 35 36 37 38 39 40 41 42 43 44 45 46 47 48 49 50 51 52 53 54 55 S6 S7 58 59
Figure 47 Response time for prescription refill workflow (with 400 KB messages)
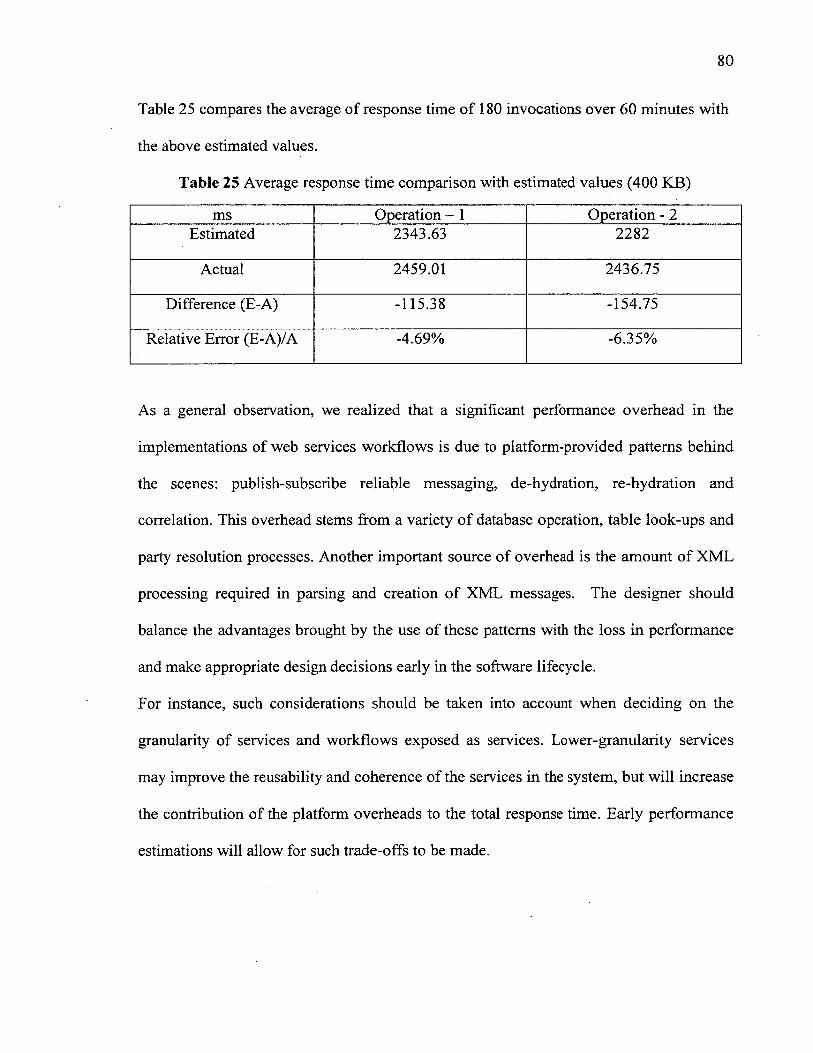
80
Table 25 compares the average of response time of 180 invocations over 60 minutes with
the above estimated values.
Table 25 Average response time comparison with estimated values (400 KB)
ms Operation - 1 Operation - 2Estimated 2343.63 2282
Actual 2459.01 2436.75
Difference (E-A) -115.38 -154.75
Relative Error (E-A)/A -4.69% -6.35%
As a general observation, we realized that a significant performance overhead in the
implementations of web services workflows is due to platform-provided patterns behind
the scenes: publish-subscribe reliable messaging, de-hydration, re-hydration and
correlation. This overhead stems from a variety of database operation, table look-ups and
party resolution processes. Another important source of overhead is the amount of XML
processing required in parsing and creation of XML messages. The designer should
balance the advantages brought by the use of these patterns with the loss in performance
and make appropriate design decisions early in the software lifecycle.
For instance, such considerations should be taken into account when deciding on the
granularity of services and workflows exposed as services. Lower-granularity services
may improve the reusability and coherence of the services in the system, but will increase
the contribution of the platform overheads to the total response time. Early performance
estimations will allow for such trade-offs to be made.
81
6 CONCLUSIONS
In this work, we found that there are many patterns that are applied in SOA systems.
Some patterns are applied at a very low level by the service platform, such as reliable
messaging, message persistence and parsing of XML. Such patterns are applied behind
the scene by the service platform to enhance the reliability of the application, but they
introduce major performance overheads in the response time of the SOA applications.
The developers have very little control over the application of these patterns, but it helps
if they are aware of their performance costs. Therefore developers must exercise caution
when deciding to use platform features that make use of these patterns, as in some cases,
using such features may be overkill. The decision what to use and when should be made
as a trade-off between performance and other software qualities (reliability and
robustness in this case). Before deciding to opt for such a reliable system, proper analysis
of requirements is necessary.
Other types of patterns, such as Scatter and Gather, Convoys and Content Based Router
are explicitly applied by the developers when they build the application on top of a
chosen platform. The developers have some flexibility to optimize their design to get
some performance improvement, but there is a default overhead due to existence of
platform patterns and their impact on performance is overwhelming. The choice of these
development level patterns should be influenced by a trade-off analysis between a
particular business case and the need to improve performance.
In real life implementations, there is a lot of emphasis on design, development and
functional testing. Also due to time constraints there is not much interest in performance
evaluation and enhancements until late, naturally due to non-availability of a functional
system that can be measured. Usually there is more emphasis on performance evaluation
when a system is built, after all the investment in time and money. Late changes
undertaken to improve performance are very costly. Therefore our approach suggests the
use quantitative performance analysis, which can be used to estimate the system
performance before its actual implementation. This approach can address many
performance problems early rather at later stages when it is very difficult to apply even
minor modifications. In the thesis, we showed how knowledge about the quantitative
overheads can be used to estimate the end-to-end response time of different workflows. A
more advanced approach would be to build a performance model of the system, as
recommended by the Software Performance Engineering methodology (Smith, 1990).
Such performance models require quantitative parameters regarding the resource
demands made by different workflow and services steps. Our work can help provide such
quantitative values to performance modeler. For instance, our measurements can be used
as input by other researchers that are concerned with building performance models for
SOA systems, such as (Alhaj and Petriu, 2010), (Mani et al., 2012).
Am important challenge for the thesis stems from the fact that the performance
characteristics of a service-oriented system depends not only on the software application,
but also on the underlying platforms: service execution engine, middleware, operating
system, communication networks and hardware. The performance contributions of these

83
elements are quite difficult to identify and separate, mainly due to the encapsulation of
details inside the components and modules composing all these layers and the limitation
of the measurement tools that are available.
With the use of right performance estimation techniques, more robust systems can be
built which are prone to fewer modifications for performance enhancements. Also a
careful analysis and knowledge of platform can help to better match the requirements of
the system being built with the capabilities offered by the platform, thereby eliminating
usage of any unnecessary patterns degrading the system performance.
6.1 LIMITATIONS OF THE WORK
The patterns list implemented in this work is not exhaustive. We have focused on
messaging patterns because messaging is an important part of SOA systems and has
important performance effects. There are several other patterns that are being
implemented at platform level and others that can be utilized at development time: These
patterns differ in scope and are dictated by other non-functional system requirements
such as maintainability, reusability, secure communication.
During this work, all the implementations were performed locally on a single computer to
eliminate the variance in response time due to network delays and availability. At the
beginning of our research, we conducted some measurements on two system
interconnected by a Local Area Network, but we realized that the variations in network
communication delay due to the interference of other workload was hard to understand
and explain.
84
In a more realistic scenario, the processes presented in this work such as hospital service
and insurance services are provided by different parties connected via public networks.
Also the tests were implemented for one concurrent user request at a time, not
considering multiple concurrent users and queuing delays, such as in other work in
literature, such as (El Saddik, 2006). The main reason is that we did not find appropriate
measurement tools that would allow us to separate the queueing delays from execution
times of different software steps. Future work is necessary to overcome these limitations.
6.2 FUTURE WORK
This work represents a first step for performance measurements and evaluations of
patterns applied in SOA applications. There are various dimensions for testing and
analysis in the following foreseeable directions:
• Apply and measure other patterns that can be applied to more diverse business
cases, not covered by the case studies in this work.
• Devise methods and find tools to measure resource demands and performance
results at different granularity levels. For instance, we found no explicit support
provided by testing and measurement tools to allow us to measure what happens
at platform level.
• Perform measurements under multiple users and varying workload conditions.
• Perform measurements in a distributed network scenario where various services
in an integration application are hosted on multiple computers on a local
network. This will allow considering the effect of network delays.

85
• Use the measurements in this work as input parameters to performance models
for complete predictive performance analysis.
86
References
Ajmone Marsan M., Balbo G., Conte G., Donatelli S. and Franceschinis G., (1995)
Modelling with Generalized Stochastic Petri Nets, Wiley Series in Parallel Computing,
John Wiley and Sons.
Adams, S., Hardas, D., Hossain, A., Cannon, C.R., Morimoto, R., Price, K.T., Tranchida,
(2002) Biztalk Unleashed, Sams Publishing.
Alhaj, M., Petriu,D.C. (2010) “Approach for generating performance models from UML
models of SOA systems”, Proc. of CASCON 2010, Toronto, Nov. 2010.
Biztalk 2010, http://www.microsoft.com/biztalk/en/us/default.aspx, consulted 20 December,
2012 .
Biztalk Orchestration Profiler, www.biztalkorcprofiler.codeplex.com, consulted 20
December, 2012.
Buschmann, F., Meunier, R., Rohnert H., Sommerlad (1996). Pattern-Oriented Software
Architecture, Volume 1: A System o f Patterns. John Wiley & Sons.
Barros, A., Dumas, M., ter Hofstede, A.H.M. (2005). Service Interaction Patterns. In
Business Process Management, Springer, LNCS Volume 3649, pp.302-318.
Earl, T. (2005). Service-Oriented Architecture (SOA): Concepts, Technology, and
Design, Pearson Ed.
Earl, T. (2008). Introducing SOA Design Patterns, SOA World Magazine, Vol. 8, Issue 6,
pp.2-7.
Earl, T. (2009). SOA Design Patterns. Prentice H all,Service-Oriented Computing Series
El Saddik, A. (2006). Performance Measurements of Web Services-Based Applications.
IEEE Transactions on Instrumentation and Measurements, Vol. 55, No 5, pp 1599-1605.
Fielding, R. (2000). Architectural Styles and the Design of Network-based Software
Architectures. Ph.D. Dissertation., University of California, Irvine.
Gamma, E., Helm, R., Johnson, R., Vlissides, J. (1994) Design Patterns: Elements o f
Reusable Object-Oriented Software. Addison-Wesley.
Hewitt, E. (2009). JA VA SOA cookbook, O'Reilly Media.
Hohpe, G., Woolf, B. (2003) Enterprise Integration Patterns. Addison-Wesley.
S., Kaiman, C., Havlioglu, C., Oikawa, R., Pearson, R., Lake, T., Larry Wall, L. (2002).
Biz Talk Unleashed, Sams.
Lazowska E., Zahoijan J., Scott Graham G., Sevcik K.S., (1984) Quantitative System
Performance: Computer System Analysis Using Queueing Network Models, Prentice
Hall, 1984.
LoadUI, www.loadui.org, consulted 20 Dec 2012.
Khan, M.K., Petriu,D.C. (2012) “Performance Measurements of Design Patterns for
Service- Oriented Architecture”, Proc. of the International Conference on Electrical and
Computer Engineering ICECS’ 2012, Ottawa ON, Canada, August 2012.
Mani, N., D.C. Petriu, Woodside, C.M. (2011) “Studying the Impact of Design Patterns
on the Performance Analysis of Service Oriented Architecture”, Proc. of the 37th
EuroMicro Conference on Software Engineering and Advanced Applications, Oulu,
Finland, Sept. 2011
Partridge, C., Bassi, J. (2011). Electronic Prescribing Workflow Analysis Handbook v3.0.
Retrieved from ehealth.uvic.ca/resources/toolsAVorkflowModeling/
W orkflowModeling.php
Rosanova, D. (2011). Microsoft BizTalk Server 2010 Patterns, PACKT Publishing.
SOA Patterns, www.soapattems.org/, consulted 20 Dec 2012.
soapUI, www.soapui.org, consulted 20 Dec 2012.
Schumacher, M. and Roedig, U. (2001) Security engineering with patterns. In 8th
Conference on Pattern Languages of Programs, July 2001.
Schmidt, D C., Stal, Rohnert, Buschmann (2000). Pattern-Oriented Software
Architecture, Volume 2: Patterns for Concurrent and Networked Objects. John Wiley &
Sons.
Smith, C.U. (1990) Performance Engineering o f Software Systems. Addison-Wesley.
Smith, C.U., Williams, L.G.(2002), Performance Solutions: A Practical Guide to
Creating. Responsive, Scalable Software, Addison-Wesley.
Woodside, J.E. Neilson, D.C. Petriu, S. Majumdar, (1995)”The Stochastic Rendezvous
Network Model for Performance of Synchronous Client-Server-like Distributed
Software," IEEE Transactions on Computers, Vol.44, No.l, pp. 20-34.
Yoder, J and J. Barcalow., J. (1997) Architectural patterns for enabling application
security. Conference on Pattern Languages of Programs. PLoP ’97.