Performance Management - Life Cycle Engineering · Performance Management UPTIME MAGAZINE JUNE/JULY...
3
® june/july12 www.uptimemagazine.com Vibration Analysis Periodic Table Gap Bridging the Between Construction and Operations for New Capital Assets Physical Asset Management The art of saving money by extending motor life and optimizing motor performance Motor Testing New Twist On Interpreting Vibration Analysis Faults Motor Performance Management UPTIME MAGAZINE JUNE/JULY 2012 the magazine for maintenance reliability professionals
Transcript of Performance Management - Life Cycle Engineering · Performance Management UPTIME MAGAZINE JUNE/JULY...

®
june
/july
12
www.uptimemagazine.com
Vibration Analysis Periodic Table Gap
Bridgingthe
Between Construction and Operations for New Capital Assets
Physical Asset Management
The art of saving money by extending
motor life and optimizing motor
performance
Motor Testing
New Twist
On Interpreting Vibration Analysis Faults
Motor Performance Management
UPTIM
E MAG
AZIN
E
JUN
E/JULY 2012
the magazine for maintenance reliability professionals
50 june/july12
management
reliabilityleadership
RL
Determining an OEE Goal Based Upon Customer Takt Time
Regardless of how you get there, it all starts with building an aware-ness of the need for the targeted performance level. It is from this awareness that the desire/motivation can be developed. There are a
variety of approaches for establishing your OEE goal, each with their share of questions that can limit the level of motivation.• Is it based upon an industry benchmark? “But we are unique and no
one else does what we do.”• Is it based on a senior management directive? “They just always want
more and are never satisfied!”• Is it based on a popular, well-rounded number, for example 85%? “But
why not 86% or 87%? What is so magical about 85%?”Because these approaches do not provide a clear answer to the ques-
tion “Why?,” they are often not effective. So how about a goal that focuses on customer satisfaction, like takt time?
You might be wondering, “What is takt time?” First you have to under-stand the word “takt,” which is a German word meaning pace or rhythm. Takt time means the pace or rhythm of customer demand. The ability to match your production with your takt time requires mastering the art of making the right part at the right time in the right quantity. This concept is a key aspect of lean manufacturing, and building a connection to the customer is one way for rationalizing a goal that the general population can understand.
But first we need to comprehend takt time value more clearly by under-standing its formula shown below:
An actual example could be as follows:Four Week Demand = 150,000 unitsProduction Day = 3, 8-hour shifts, each with 50 min for breaks and lunch = 3 x (8hr x 3600 sec/hr – 50 min x 60 sec/min) = 77,400 secondsWeekly PM Time = 6 hours or 21,600 seconds
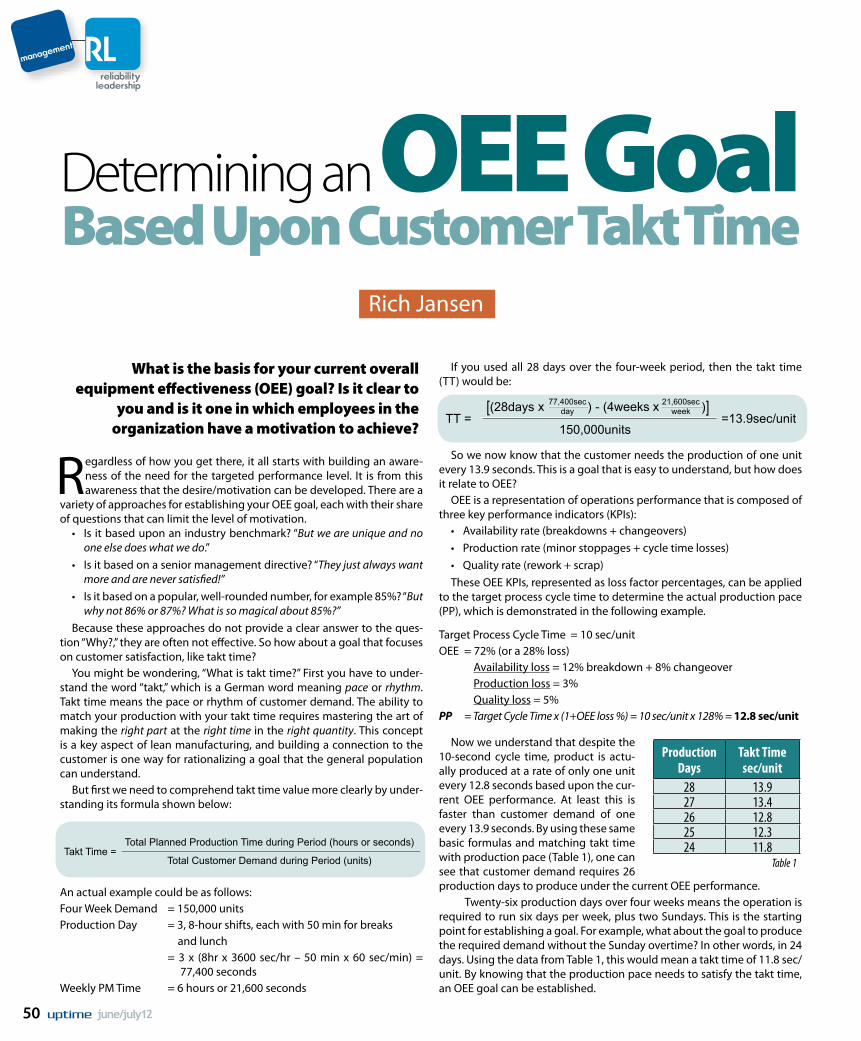
If you used all 28 days over the four-week period, then the takt time (TT) would be:
So we now know that the customer needs the production of one unit every 13.9 seconds. This is a goal that is easy to understand, but how does it relate to OEE?
OEE is a representation of operations performance that is composed of three key performance indicators (KPIs):• Availability rate (breakdowns + changeovers)• Production rate (minor stoppages + cycle time losses)• Quality rate (rework + scrap)These OEE KPIs, represented as loss factor percentages, can be applied
to the target process cycle time to determine the actual production pace (PP), which is demonstrated in the following example.
Target Process Cycle Time = 10 sec/unitOEE = 72% (or a 28% loss) Availability loss = 12% breakdown + 8% changeover Production loss = 3% Quality loss = 5%PP = Target Cycle Time x (1+OEE loss %) = 10 sec/unit x 128% = 12.8 sec/unit
Now we understand that despite the 10-second cycle time, product is actu-ally produced at a rate of only one unit every 12.8 seconds based upon the cur-rent OEE performance. At least this is faster than customer demand of one every 13.9 seconds. By using these same basic formulas and matching takt time with production pace (Table 1), one can see that customer demand requires 26 production days to produce under the current OEE performance.
Twenty-six production days over four weeks means the operation is required to run six days per week, plus two Sundays. This is the starting point for establishing a goal. For example, what about the goal to produce the required demand without the Sunday overtime? In other words, in 24 days. Using the data from Table 1, this would mean a takt time of 11.8 sec/unit. By knowing that the production pace needs to satisfy the takt time, an OEE goal can be established.
Production Days
Takt Time sec/unit
28 13.927 13.426 12.825 12.324 11.8Takt Time =
Total Planned Production Time during Period (hours or seconds)
Total Customer Demand during Period (units)
TT =[(28days
77,400secday
150,000units=13.9sec/unit
) - (4weeks )]21,600secweekx x
Table 1
What is the basis for your current overall equipment effectiveness (OEE) goal? Is it clear to
you and is it one in which employees in the organization have a motivation to achieve?
Rich Jansen
51june/july12
SPM®HD is implemented in the Intellinova® Compact, a new addition to the very
successful range of SPM Instruments on-line condition monitoring products.
Tel. 1-800-505-5636www.spmhd.com
Revolutionary Techniquefor Condition Monitoring
Particularly well suited for Low RPM bearing monitoring,SPM®HD can be utilized in bearings operating from 1– 20,000 RPM. For further information, please call or visit our website.
PP = Target Cycle Time x (1+OEE Loss %)
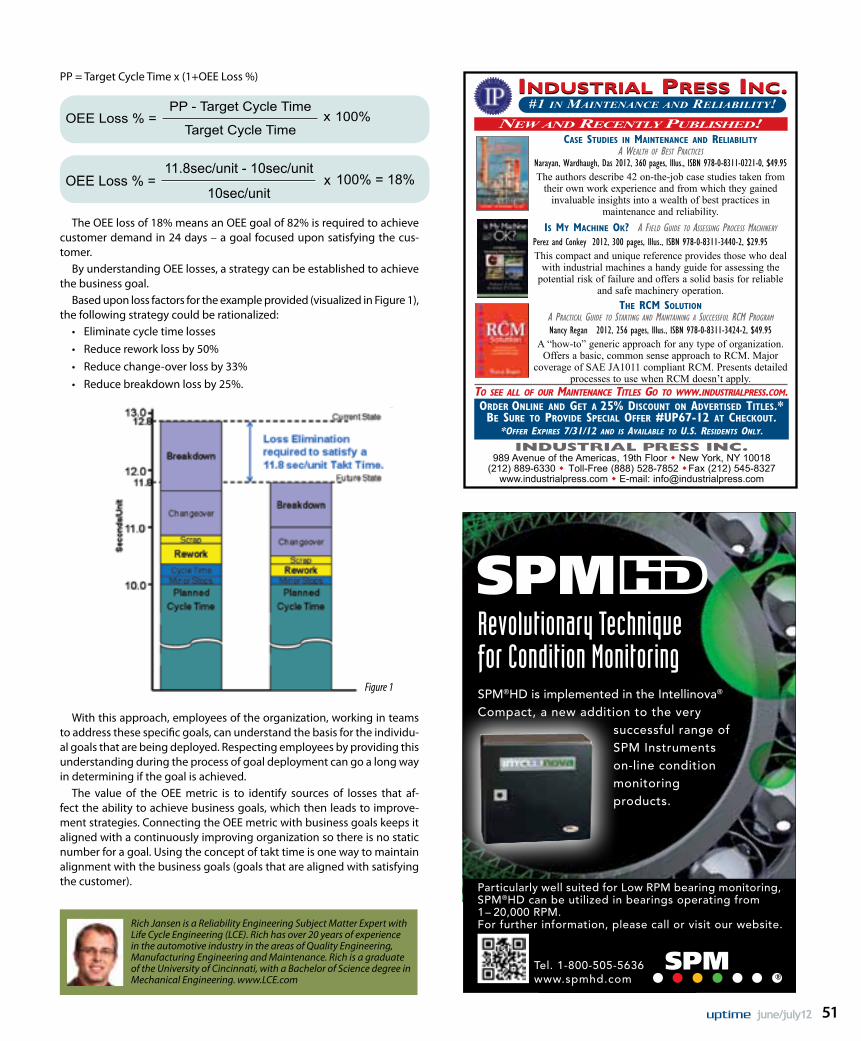
The OEE loss of 18% means an OEE goal of 82% is required to achieve customer demand in 24 days – a goal focused upon satisfying the cus-tomer.
By understanding OEE losses, a strategy can be established to achieve the business goal.
Based upon loss factors for the example provided (visualized in Figure 1), the following strategy could be rationalized:• Eliminate cycle time losses• Reduce rework loss by 50%• Reduce change-over loss by 33%• Reduce breakdown loss by 25%.
With this approach, employees of the organization, working in teams to address these specific goals, can understand the basis for the individu-al goals that are being deployed. Respecting employees by providing this understanding during the process of goal deployment can go a long way in determining if the goal is achieved.
The value of the OEE metric is to identify sources of losses that af-fect the ability to achieve business goals, which then leads to improve-ment strategies. Connecting the OEE metric with business goals keeps it aligned with a continuously improving organization so there is no static number for a goal. Using the concept of takt time is one way to maintain alignment with the business goals (goals that are aligned with satisfying the customer).
Rich Jansen is a Reliability Engineering Subject Matter Expert with Life Cycle Engineering (LCE). Rich has over 20 years of experience in the automotive industry in the areas of Quality Engineering, Manufacturing Engineering and Maintenance. Rich is a graduate of the University of Cincinnati, with a Bachelor of Science degree in Mechanical Engineering. www.LCE.com
PP - Target Cycle Time
Target Cycle Time 100%OEE Loss % = x
11.8sec/unit - 10sec/unit
10sec/unit 100% = 18%OEE Loss % = x
Figure 1
INDUSTRIAL PRESS INC.989 Avenue of the Americas, 19th Floor � New York, NY 10018
(212) 889-6330 � Toll-Free (888) 528-7852 �Fax (212) 545-8327 www.industrialpress.com � E-mail: [email protected]
ORDER ONLINE AND GET A 25% DISCOUNT ON ADVERTISED TITLES.*BE SURE TO PROVIDE SPECIAL OFFER #UP67-12 AT CHECKOUT.
*OFFER EXPIRES 7/31/12 AND IS AVAILABLE TO U.S. RESIDENTS ONLY.
INDUSTRIAL PRESS INC.INDUSTRIAL PRESS INC.#1 IN MAINTENANCE AND RELIABILITY!
NEW AND RECENTLY PUBLISHED!CASE STUDIES IN MAINTENANCE AND RELIABILITY
A WEALTH OF BEST PRACTICESNarayan, Wardhaugh, Das 2012, 360 pages, Illus., ISBN 978-0-8311-0221-0, $49.95The authors describe 42 on-the-job case studies taken from
their own work experience and from which they gainedinvaluable insights into a wealth of best practices in
maintenance and reliability. IS MY MACHINE OK? A FIELD GUIDE TO ASSESSING PROCESS MACHINERY
Perez and Conkey 2012, 300 pages, Illus., ISBN 978-0-8311-3440-2, $29.95This compact and unique reference provides those who deal
with industrial machines a handy guide for assessing thepotential risk of failure and offers a solid basis for reliable
and safe machinery operation. THE RCM SOLUTION
A PRACTICAL GUIDE TO STARTING AND MAINTAINING A SUCCESSFUL RCM PROGRAM
Nancy Regan 2012, 256 pages, Illus., ISBN 978-0-8311-3424-2, $49.95A �how-to� generic approach for any type of organization.
Offers a basic, common sense approach to RCM. Majorcoverage of SAE JA1011 compliant RCM. Presents detailed
processes to use when RCM doesn�t apply.TO SEE ALL OF OUR MAINTENANCE TITLES GO TO WWW.INDUSTRIALPRESS.COM.
Uptime67-12quarter.qxp 4/18/2012 3:13 PM Page 1