Performance Insights: School Disciplinary Absences October 2014.
24
Performance Insights: School Disciplinary Absences October 2014
-
Upload
alisha-richards -
Category
Documents
-
view
214 -
download
0
Transcript of Performance Insights: School Disciplinary Absences October 2014.
Performance Insights:
School Disciplinary Absences
October 2014
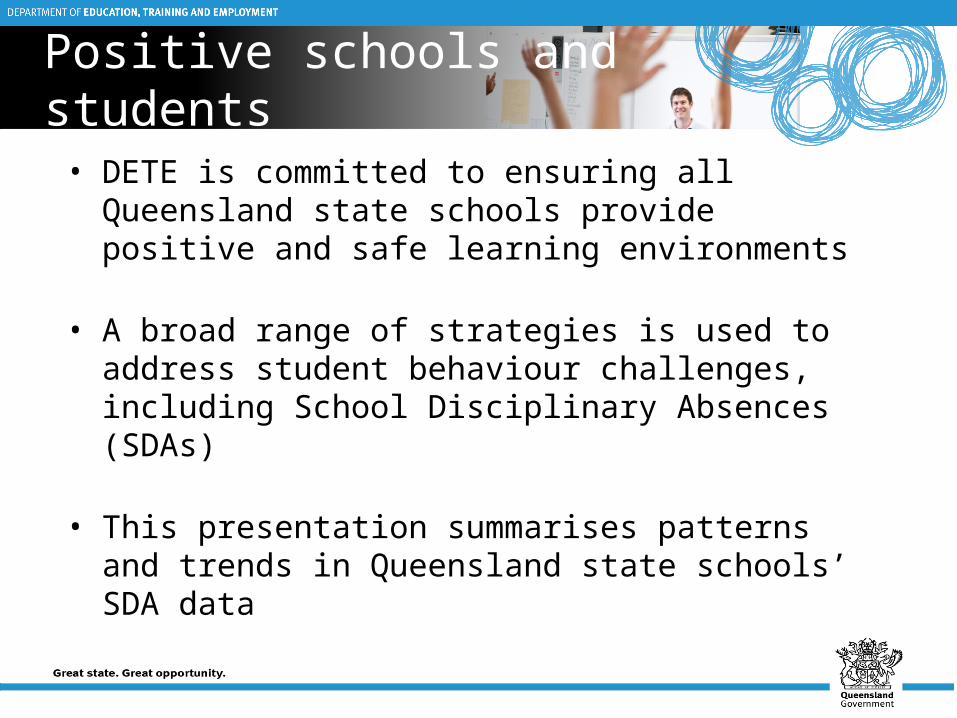
• DETE is committed to ensuring all Queensland state schools provide positive and safe learning environments
• A broad range of strategies is used to address student behaviour challenges, including School Disciplinary Absences (SDAs)
• This presentation summarises patterns and trends in Queensland state schools’ SDA data
Positive schools and students

• DETE’s Statement of expectations for a disciplined school environment sets out the expectations for approaches schools use to create a disciplined learning environment
• DETE’s Safe, Supportive and Disciplined School Environment procedure sets out the processes by which state schools are to promote a positive learning environment
• All state schools must have a Responsible Behaviour Plan for Students
Departmental policies
DETE’s Code of School Behaviour sets out a fair and consistent standard of behaviour for parents, students and staff:
•high standards of personal achievement and behaviour•effective teaching, respectful relationships•a whole school approach and effective leadership•partnerships with parents, community and other agencies•staff expertise valued and developed•standards of student behaviour linked to transparent, accountable and fair processes and consequences•responses to student behaviour must consider individual circumstances
Code of School Behaviour
School Disciplinary Absences
SDAs are only applied after consideration of other responses
1.Short suspensions – up to 10 days (previously 5)2.Long suspensions – up to 20 days (previously 10)3.Exclusions – up to 12 months or permanently4.Cancellations – enrolment of a post-compulsory age student can be cancelled if the student displays persistent refusal to participate in the program of instruction
Principals must take account of a student’s individual circumstances.
Historical trends - Overall
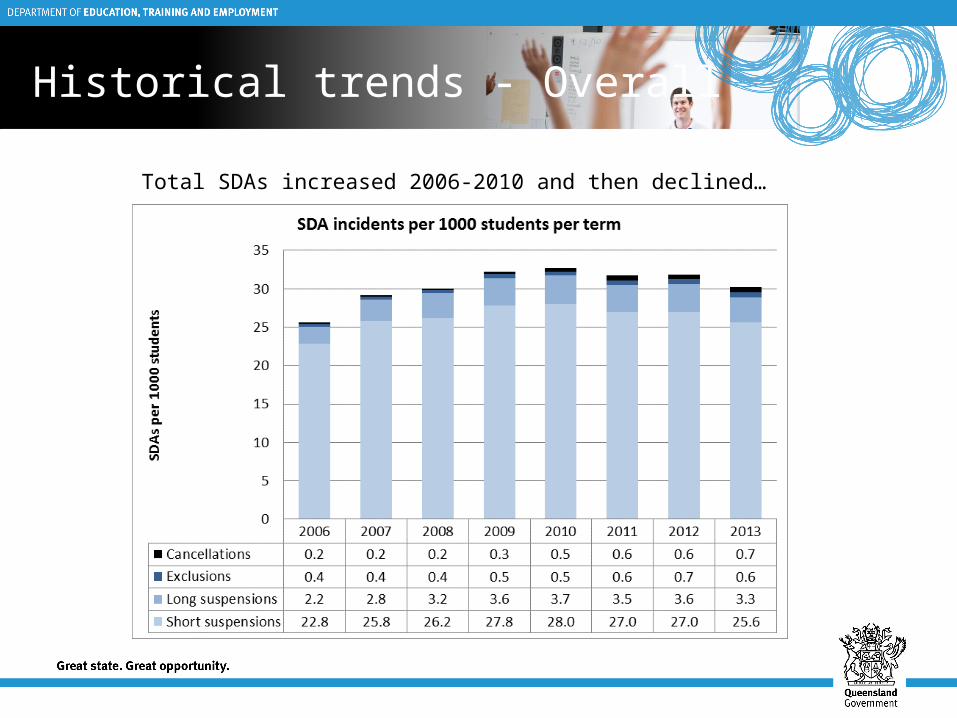
Total SDAs increased 2006-2010 and then declined…
Historical trends – Cancellations
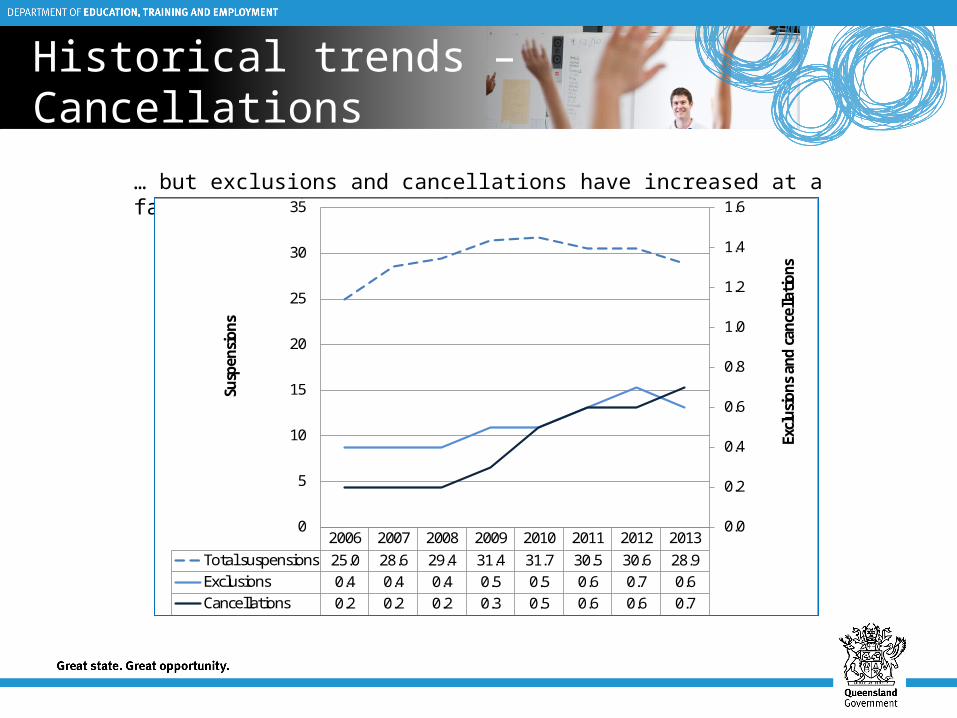
… but exclusions and cancellations have increased at a faster rate than suspensions
2006 2007 2008 2009 2010 2011 2012 2013Total suspensions 25.0 28.6 29.4 31.4 31.7 30.5 30.6 28.9Exclusions 0.4 0.4 0.4 0.5 0.5 0.6 0.7 0.6Cancellations 0.2 0.2 0.2 0.3 0.5 0.6 0.6 0.7
0.0
0.2
0.4
0.6
0.8
1.0
1.2
1.4
1.6
0
5
10
15
20
25
30
35
Excl
usio
ns a
nd c
ance
llati
ons
Susp
ensi
ons
Patterns – SDA prevalence
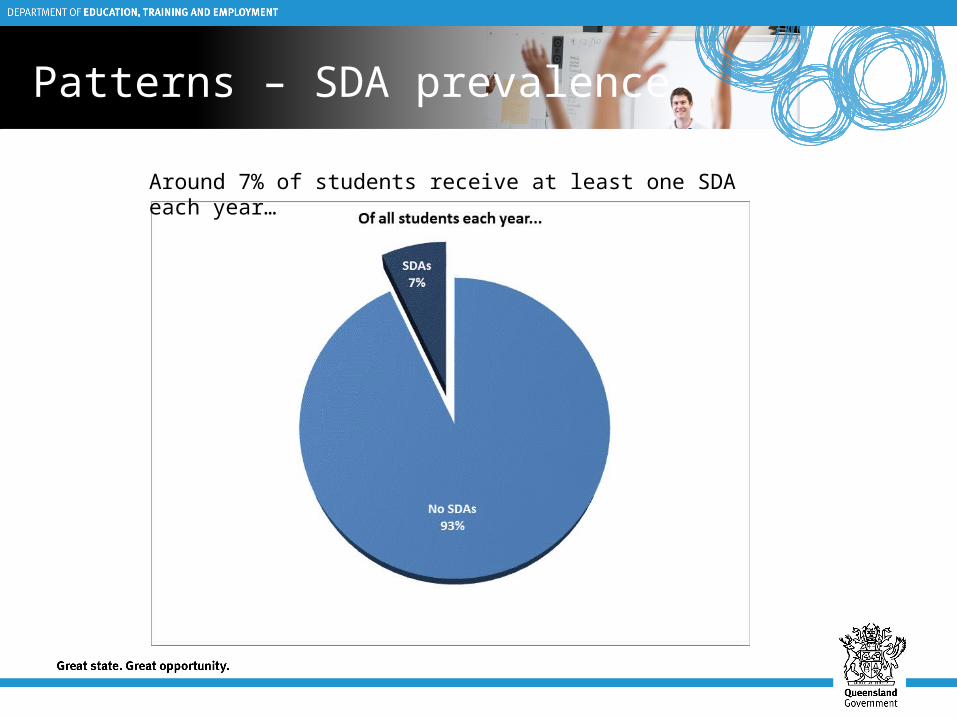
Around 7% of students receive at least one SDA each year…
Patterns – SDA prevalence
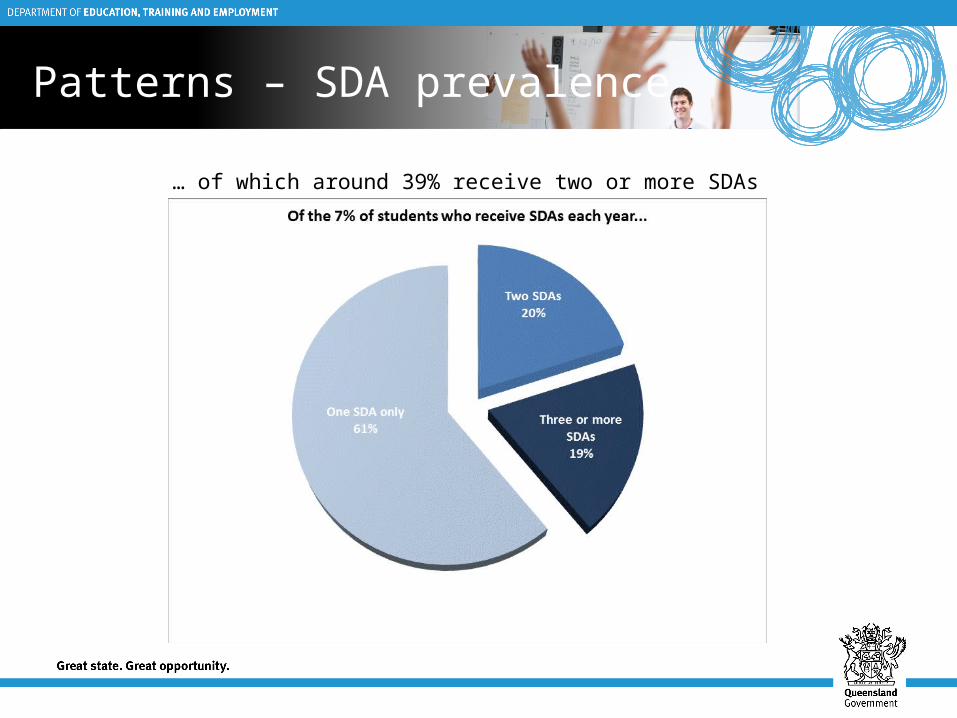
… of which around 39% receive two or more SDAs
Patterns – Reasons for SDAs
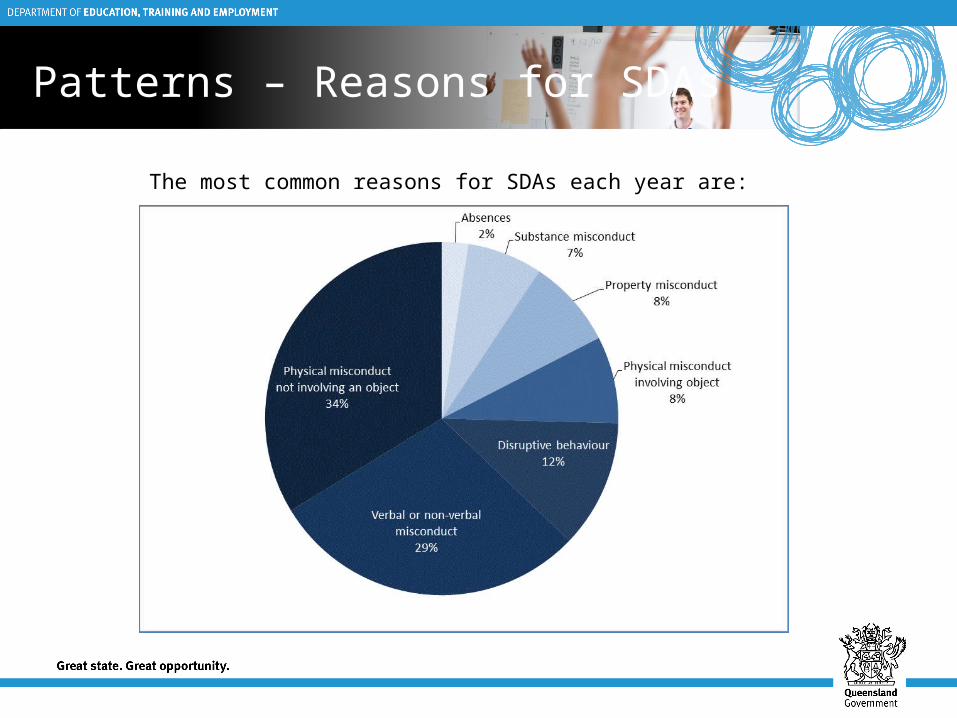
The most common reasons for SDAs each year are:
Patterns – School factors
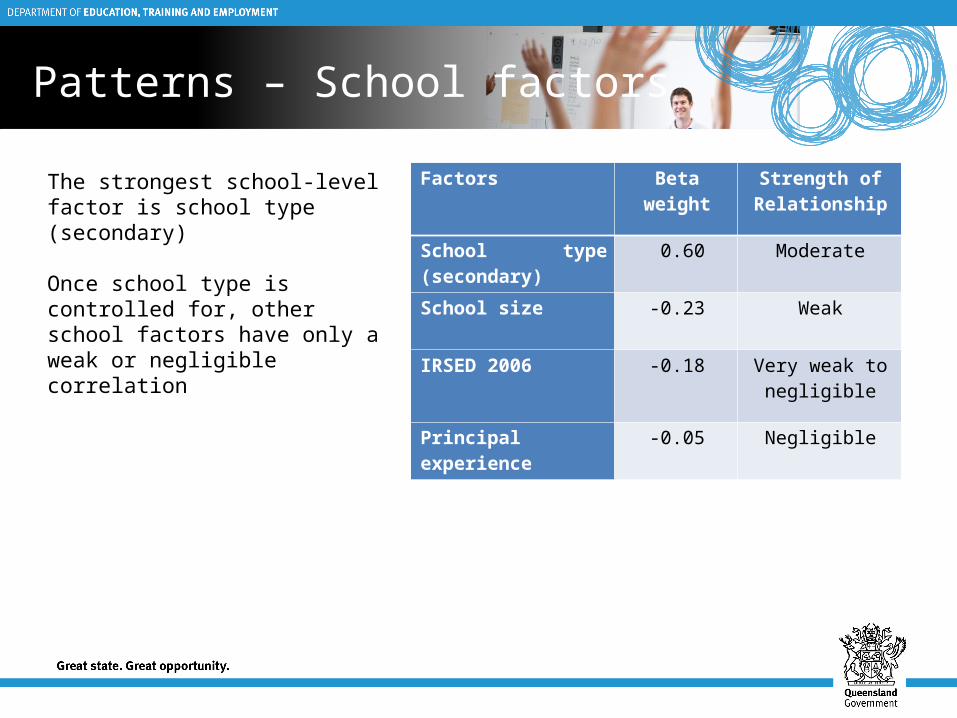
Factors Beta weight Strength of Relationship
School type (secondary) 0.60 Moderate
School size -0.23 Weak
IRSED 2006 -0.18 Very weak to negligible
Principal experience -0.05 Negligible
The strongest school-level factor is school type (secondary)
Once school type is controlled for, other school factors have only a weak or negligible correlation
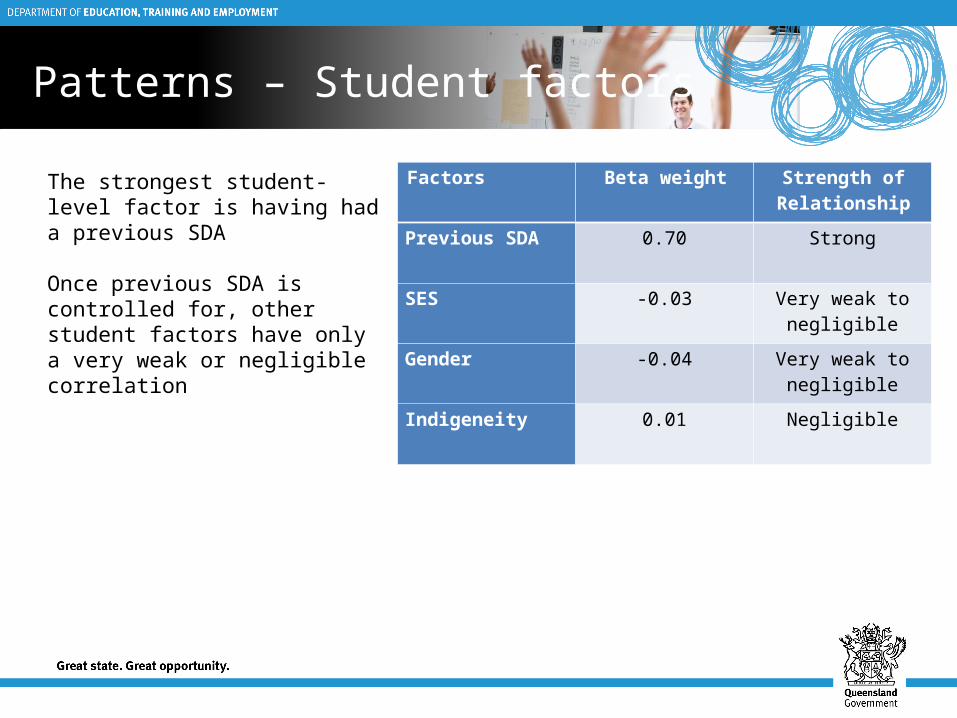
Patterns – Student factors
Factors Beta weight Strength of Relationship
Previous SDA 0.70 Strong
SES -0.03 Very weak to negligible
Gender -0.04 Very weak to negligible
Indigeneity 0.01 Negligible
The strongest student-level factor is having had a previous SDA
Once previous SDA is controlled for, other student factors have only a very weak or negligible correlation
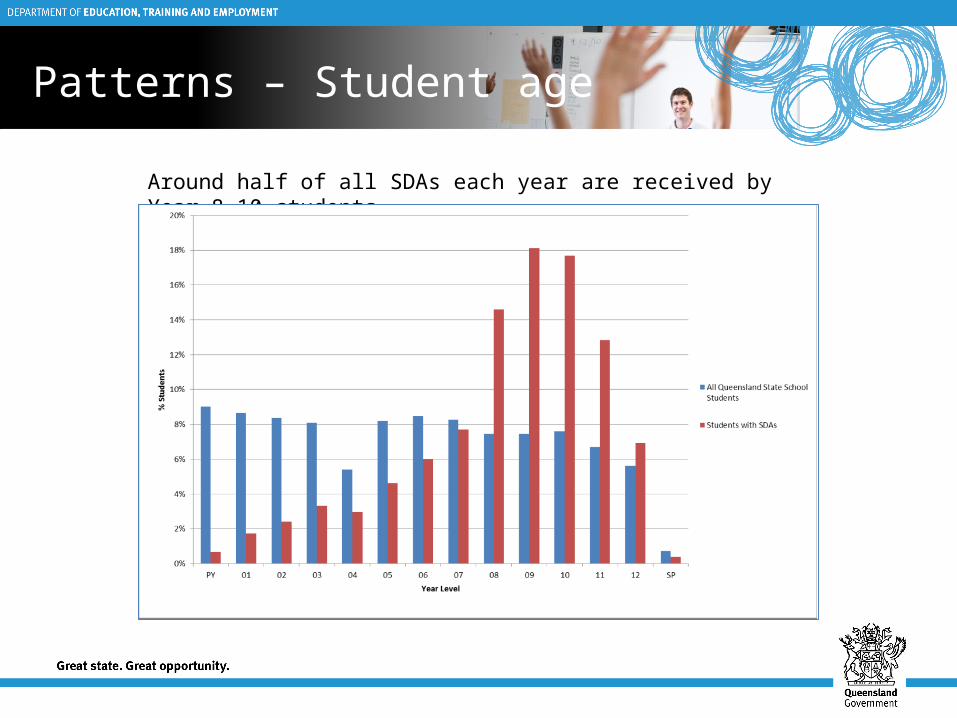
Patterns – Student age
Around half of all SDAs each year are received by Year 8-10 students

Patterns – Gender
While it is important to avoid negative stereotypes, national and international studies do consistently show that gender, socio-economic status and ethnicity are all correlated with SDA rates
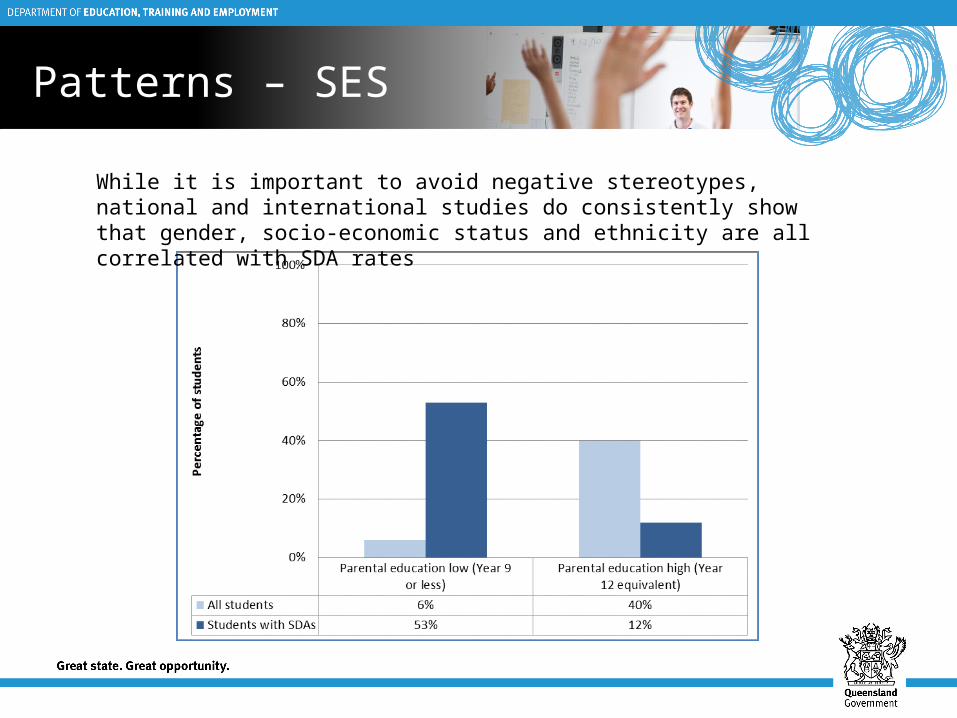
Patterns – SES
While it is important to avoid negative stereotypes, national and international studies do consistently show that gender, socio-economic status and ethnicity are all correlated with SDA rates
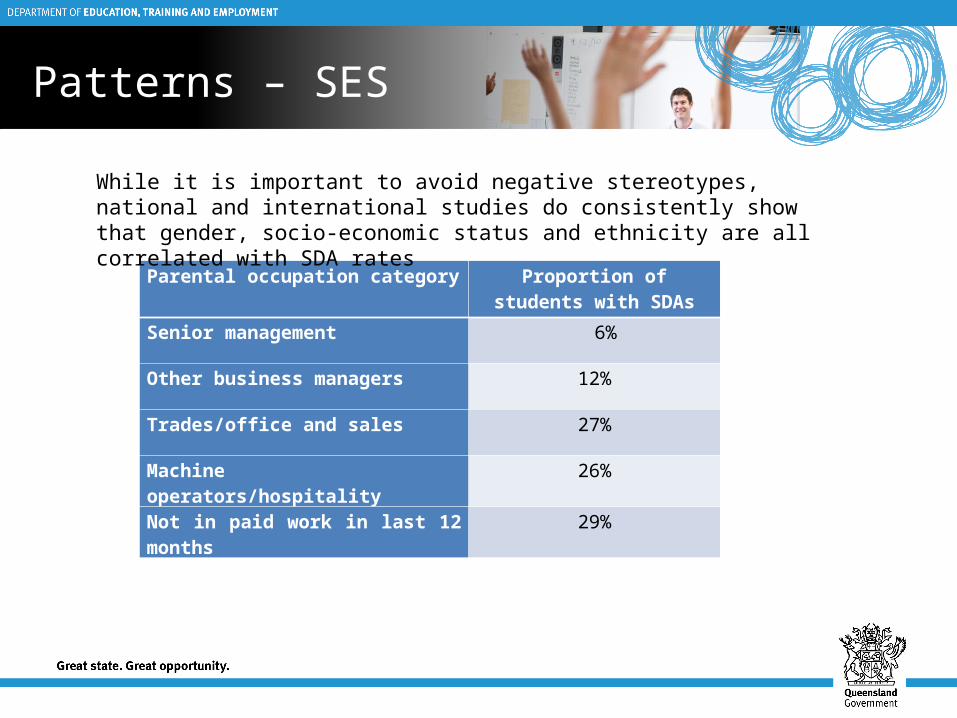
Patterns – SES
Parental occupation category Proportion of students with SDAs
Senior management 6%
Other business managers 12%
Trades/office and sales 27%
Machine operators/hospitality 26%
Not in paid work in last 12 months 29%
While it is important to avoid negative stereotypes, national and international studies do consistently show that gender, socio-economic status and ethnicity are all correlated with SDA rates
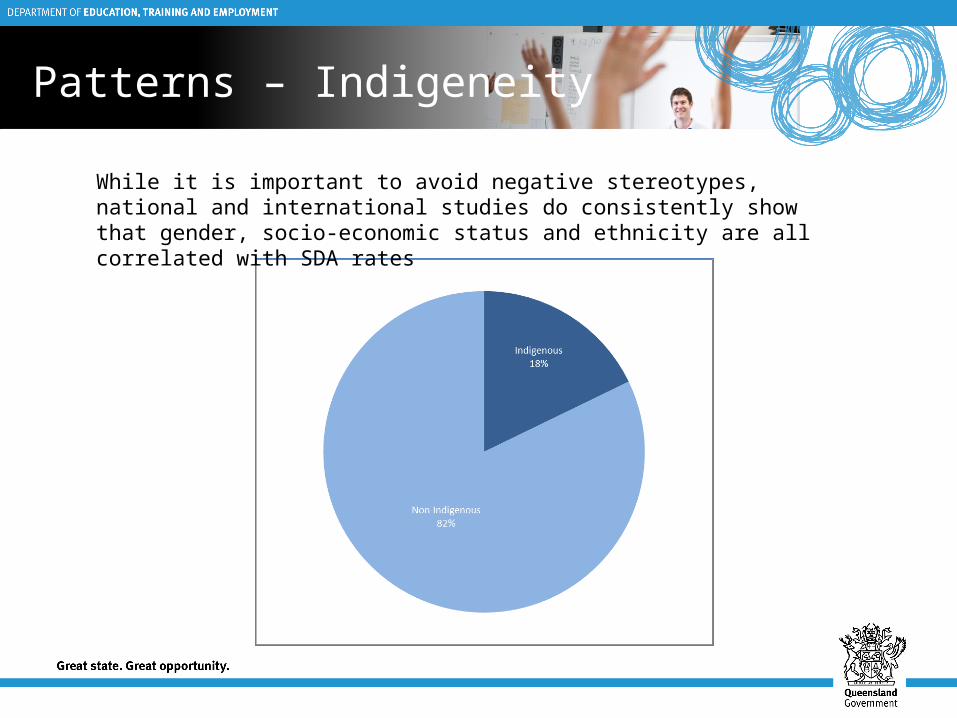
Patterns – Indigeneity
While it is important to avoid negative stereotypes, national and international studies do consistently show that gender, socio-economic status and ethnicity are all correlated with SDA rates
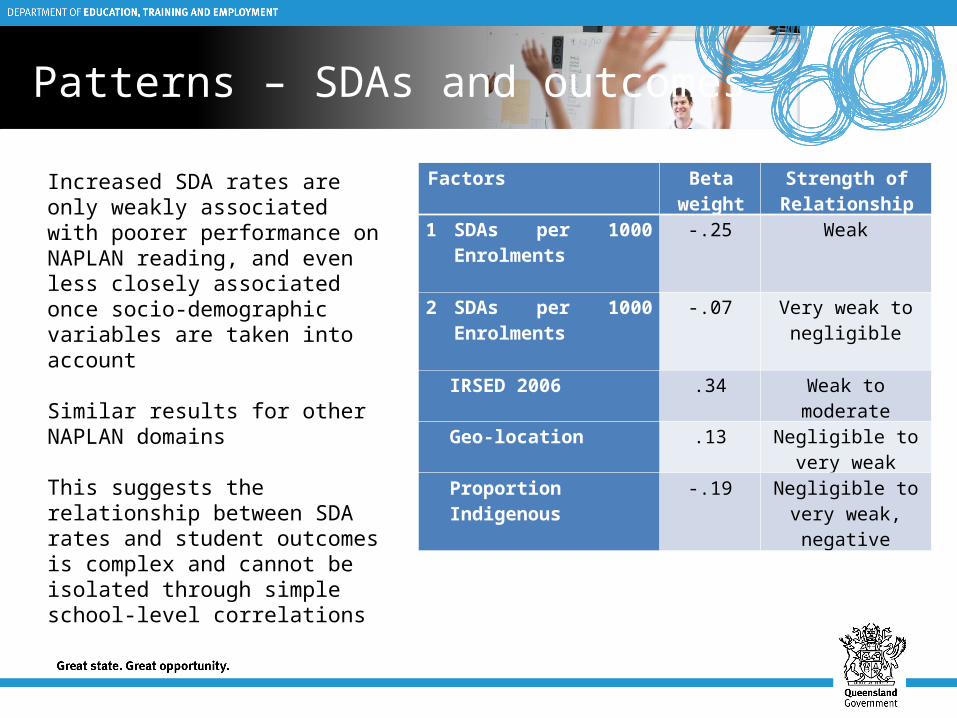
Patterns – SDAs and outcomes
Increased SDA rates are only weakly associated with poorer performance on NAPLAN reading, and even less closely associated once socio-demographic variables are taken into account
Similar results for other NAPLAN domains
This suggests the relationship between SDA rates and student outcomes is complex and cannot be isolated through simple school-level correlations
Factors Beta weight
Strength of Relationship
1 SDAs per 1000 Enrolments
-.25 Weak
2 SDAs per 1000 Enrolments
-.07 Very weak to negligible
IRSED 2006 .34 Weak to moderate
Geo-location .13 Negligible to very weak
Proportion Indigenous -.19 Negligible to very weak, negative
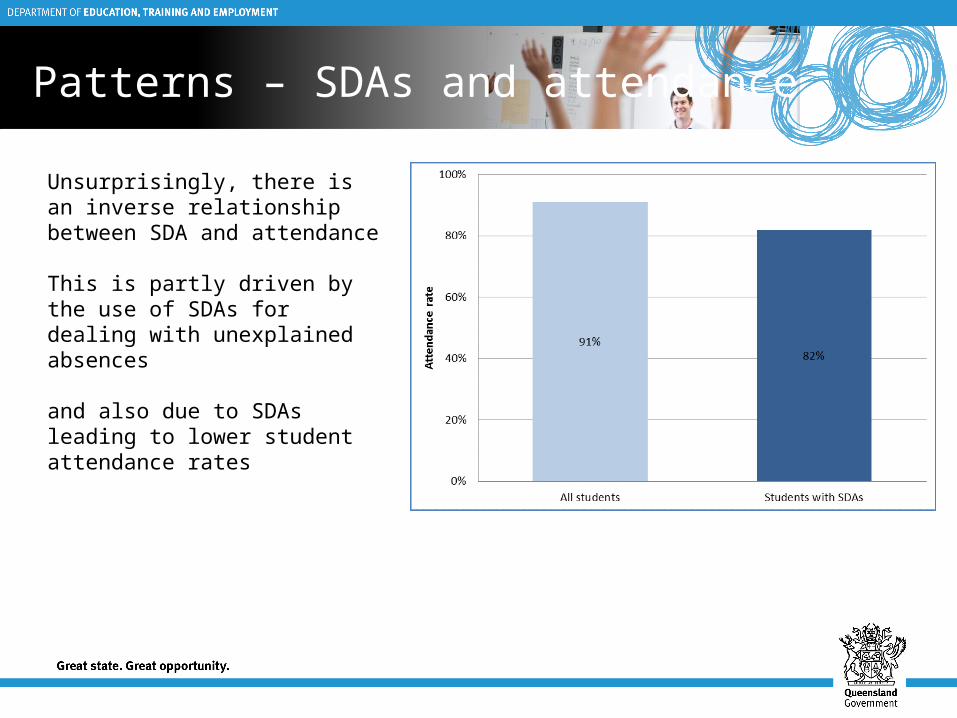
Patterns – SDAs and attendance
Unsurprisingly, there is an inverse relationship between SDA and attendance
This is partly driven by the use of SDAs for dealing with unexplained absences
and also due to SDAs leading to lower student attendance rates
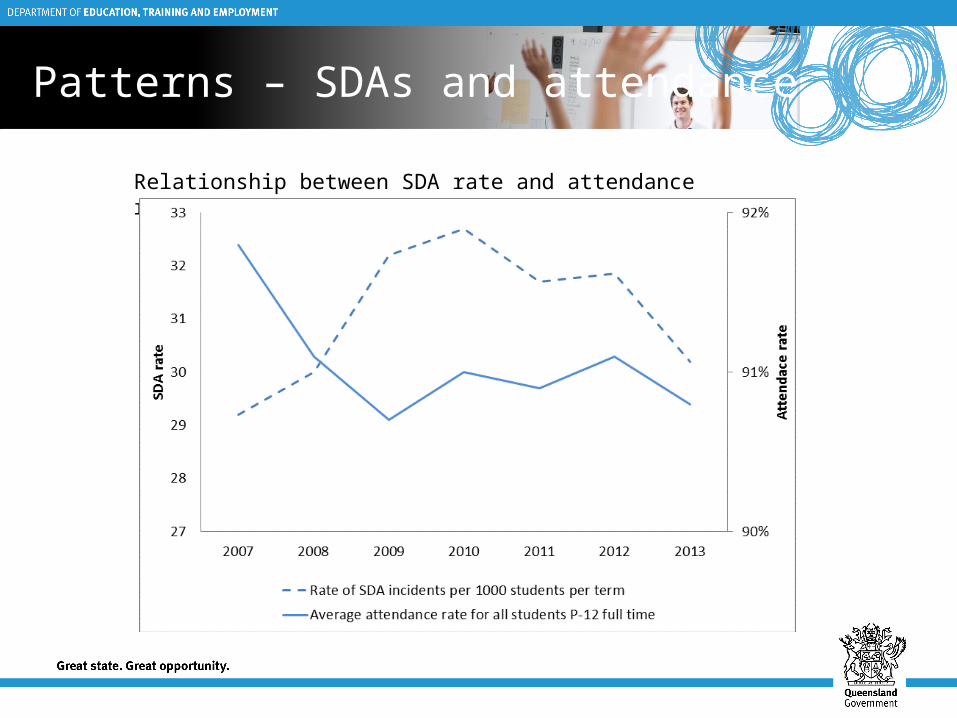
Patterns – SDAs and attendance
Relationship between SDA rate and attendance rate over time

School leadership is a critical factor, particularly attitudes towards:
•working with parents as partners in their children’s education•providing strong reintegration support after an SDA•focusing on pedagogy rather than punishment as the means to modify behaviour•engaging external support•developing and supporting teachers in behaviour management skills
Literature review – Lessons
Our school’s SDA profile
Insert your school’s SDA data here
Our school’s approach to SDAs
Insert your school’s approach to SDAs here
• A relatively small proportion of students receive SDAs
• SDAs are more frequently used in secondary schools
• SDAs in Queensland state schools are currently higher than 2006, particularly for more serious categories of exclusions and cancellations
• It is important to avoid stereotyping students and to develop specific responses to suit circumstances
• Good-practice lessons are reflected in the department’s policies and procedures
• The department is committed to ensuring that all Queensland state schools provide positive and safe learning environments
Conclusions