Performance indicators in basic education; 1992 -...
47
MINISTRY OF EDUCATION I UNDPI UNESCO EDUCATION SECTOR STUDY PROJECT IMYA 190 1 0041 • • . " ... • No. 1.1 Performance Indicators in Basic Education by U Saw Win Myanmar Education Research Bureau Yangon February. '992
Transcript of Performance indicators in basic education; 1992 -...
MINISTRY OF EDUCATION I UNDPI UNESCO
EDUCATION SECTOR STUDY PROJECT
IMYA 190 10041
• • ." ... •
No. 1.1
Performance Indicators
in Basic Education
by
U Saw Win
Myanmar Education Research BureauYangon
February. '992

Performance Indicators
in Basic Education
by
U Saw Win
(Institute of Economics)
Acknowledgement: This paper is the outcome of the collaborative effort of ESS Working Group No.1(Education Data Review and Analysis). The working group. chaired by U Tun Hla (OBE), included the followingmembers: U Myat Naing (MERB), U Saw Win (Institute of Economics), U Nyan Myint (Institute of Economics),U Thein Htay (OHE), U Nyunt Maung (OTAVE), Or. Tracy Sein (Institute of Medicine 1), U Thein Wan (MERB),Daw Nge Ma Ma Than (Institute of Computer Science and Technology).
j
j
j
j
j
j
j
j
j
j
j
j
j
j
j
j
j
j
j
j
j
j
j
j
j
j
j
j
j
j
j
j
j
j
j
j
j
j
ABSTRACT
This paper reviews the performance of the basic education sector. Enrolment ratios and indicatorssuch as promotion, repetition and drop-out rates have been analyzed as well as the number ofschools, teachers and teacher training. The study shows that Kindergarten has the highestrepetition and drop-out rates and the lowest promotion rates. A large number of teachers need tobe trained to become qualified teachers.
1
I1
PREFACE
The Ministry of Education, UNDP and UNESCO are engaged in a joint effort to review the presentstate of education and manpower training in the Union of Myanmar. This review is being carriedout under the Education Sector Study project, which began in mid-1990. The objective of theproject is to help improving Myanmar's education system so it can make contribute moreeffectively to the country's social and economic development. The first phase of the EducationSector Study lESS), a detailed diagnosis and analysis of the needs of the education sector, is nowcompleted. A synthesis of the main findings has been issued in a separate report.
This paper is one of a series of working papers produced by Myanmar ESS participants. The seriescovers various important aspects of education, such as quality and efficiency, linkages betweeneducation and employment, costs and financing, school facilities, and sector organization andmanagement. The ESS Working Papers series addresses itself to all professional staff in theeducation sector, as well as to interested researchers. It is hoped that these papers will contributeto stimulate a national discussion on ways and means to improve Myanmar's education system.
Khin Maung KyweNational Project Director
Antoine SchwartzChief Technical Adviser

ADNG
ASATEODBEDHEDTAVEEPDESSGARGERJATJATCKGMEBMERBNEPNERPATPATCSATSIDEOTEOTTCTTSWP
LIST OF ABBREVIATIONS
Academy for Development of National Groups(UDNR/University for the Development of National Races)Assistant SupervisorAssistant Township Education OfficerDepartment of Basic EducationDepartment of Higher EducationDepartment of Technical, Agricultural and Vocational EducationEducation Planning DepartmentEducation Sector StudyGross Admission RateGross Enrolment RatioJunior Assistant TeacherJunior Assistant Teacher CertificateKindergartenMyanmar Examinations BoardMyanmar Education Research BureauNew Education ProgrammeNet Enrolment RatioPrimary Assistant TeacherPrimary Assistant Teacher CertificateSenior Assistant TeacherState or Divisional Education OfficerTownship Education OfficerTeacher Training CollegeTeacher Training SchoolWorking Paper

TABLE OF CONTENTS
Page
I. INTRODUCTION , 1
11. BASIC EDUCATION IN MYANMAR . . . . . . . . . . . . . . . . . . . . . . . . . . . . . . . . . .. 2
Ill. EDUCATIONAL DEVELOPMENT. . . . . . . . . . . . . . . . . . . . . . . . . . . . . . . . . . . .. 4
IV. ACCESS TO EDUCATION , 7
V. DYNAMIC INDICATORS . . . . . . . . . . . . . . . . . . . . . . . . . . . . . . . . . . . . . . . .. 12
VI. SCHOOLS . . . . . . . . . . . . . . . . . . . . . . . . . . . . . . . . . . . . . . . . . . . . . . . . . .. 15
VII. TEACHERS. . . . . . . . . . . . . . . . . . . . . . . . . . . . . . . . . . . . . . . . . . . . . . . . .. 18
VIII. TEACHER TRAINING AND INSPECTION 20
IX. CONCLUSION. . . . . . . . . . . . . . . . . . . . . . . . . . . . . . . . . . . . . . . . . . . . . . .. 23
BIBLIOGRAPHY 24
ANNEXES
1234567891011121314151617181920
1234
LIST OF TABLES
Distribution of Enrolment by Level: (Per cent)Distribution of Teachers by Level of EducationGrowth Indices 1987/1988 (1962-63 = 100)Gross Admission Rate to KGGross Enrolment Ratio by Sex and Region (1983/84-1987/88 Average)Average Flow Rates: 1981/82-1986/87 (Per cent)Average KG Promotion Rates: 1981/82-1986/87Average Promotion of a Cohort: 1981/82-1986/87Average Number of Student Years Spent by a Cohort: 1981/82-1986/87Growth Indices of Schools 1987/88 (1981/82 = 100)Distribution of Schools by Region and by Level: 1987/88Number of Schools per 100,000 Population: 1987/88Distribution of Primary Schqols by the Number of Teachers per School: 1991Number of Two-shift Schools 1989/90Number of Untrained Teachers: 1989/90Per cent of Teachers PromotedPer cent of Teachers LostEnrolment Capacity by Type of InstitutionEnrolment and Output by Type of Institution: 1987/88Number of Teachers per Inspection Staff: 1987/88
LIST OF GRAPHS
EnrolmentPrimary Gross Enrolment RatiosMiddle Level Gross Enrolment RatiosHigh Level Gross Enrolment Ratios
Page
45678
121313141515161617191919202122
CHAPTER I
INTRODUCTION
One of the objectives of the Education Sector Study is to formulate educationalstrategies which will be in line with the anticipated restructuring of the economy of Myanmar. Thusan analysis of the education sector is a prerequisite for the formulation and implementation ofstrategies.
The education sector accounts for 19.0 per cent of the 1990/91 Union Budget. TheDepartment of Basic Education (DBE) employs more than 200,000 teachers with an expenditureof 2,597 million Kyats in 1989/90. Therefore it is an important department of the education sector.Thus, it is required to review the performance of basic education.
Chapter 11 presents general information on basic education of Myanmar.Development of the Basic Education Sector, over the last 30 years or so will be reviewed inchapter Ill. Chapter IV will be devoted to access to education. Gross Enrolment Ratio (GER) willbe used in analyzing the data. Dynamic indicators, such as promotion, repetition and drop-out rateswill be analyzed and used in measuring the efficiency of the school system in chapter V. Indicatorsof school characteristics, such as distribution and availability of schools will be presented ,inchapter VI. Some indicators on teacher characteristics and training schools will be examined in thenext two chapters.

CHAPTER II
BASIC EDUCATION IN MYANMAR
Department of Basic Education
The Department of Basic Education (OBE) is responsible for the following sub-departments:
• Primary and Secondary Education,• Teacher Training,• Inspection and Supervision of Schools and,• Students' Affair
Structure of Basic Education
The formal school system comprises three levels. Schooling at the primary level(including Kindergarten) takes 5 years; the middle level 4 years and the high school level 2 years.The terminal grades of these levels are the fourth, the eighth and the tenth grade respectively.
Primary Assistant Teachers (PAT) are responsible for the primary level of education.Junior Assistant Teachers (JAT) are normally assigned to teach from the fifth grade to the seventhgrade of the middle level. The JATs are also assigned to teach at the primary level. The eighthgrade of the middle school level and the ninth and the tenth grade of the high school level aretaught by Senior Assistant Teachers (SAT).
Examination
The Standard 4 Examination is conducted by the Basic Education authorities at theState/Divisional levej1. The Standard 8 Examination is conducted nationally by the MyanmarExaminations Board (MEB). A pupil's eligibility to the science stream is determined by his or herperformance and those who are ineligible to the science stream are allowed to study the artssubjects. At the end of the tenth grade a pupil has to take the Basic Education High SchoolExamination, conducted by the MEB.
Medium of Instruction
A change in the medium of instruction took place in 1981. English as a subject wasintroduced from Kindergarten onwards. Beginning from the academic year 1985/86, English hasbeen used as the medium of instruction for the science streams and Economics at high schoollevel.
Since 1991 the Standard 4 Examination is held at township level, administered by a cluster of schools.

3
The New Education Programme (NEP) was introduced in 1984/85 (UNESCO,1989: 10). In accordance with the NEP, the curriculum was revised and text books were writtenand printed over a two year period.
Training
At present, there are thirteen teacher training schools (ITS), to train the PATs. Fou'rteacher training colleges (TTC) are responsible for the training of JATs. The Institute of Educationconfers a Bachelor of Education degree and the diploma in teaching. The graduates of this instituteare classified as qualified SATs.
Inspection
The Assistant Township Education Officers (ATEO) are responsible for theinspection of primary schools. Middle and high schools are inspected by the State or DivisionalEducation Officers (S/DEO) and the Assistant Supervisors (AS).
CHAPTER III
EDUCATIONAL DEVELOPMENT
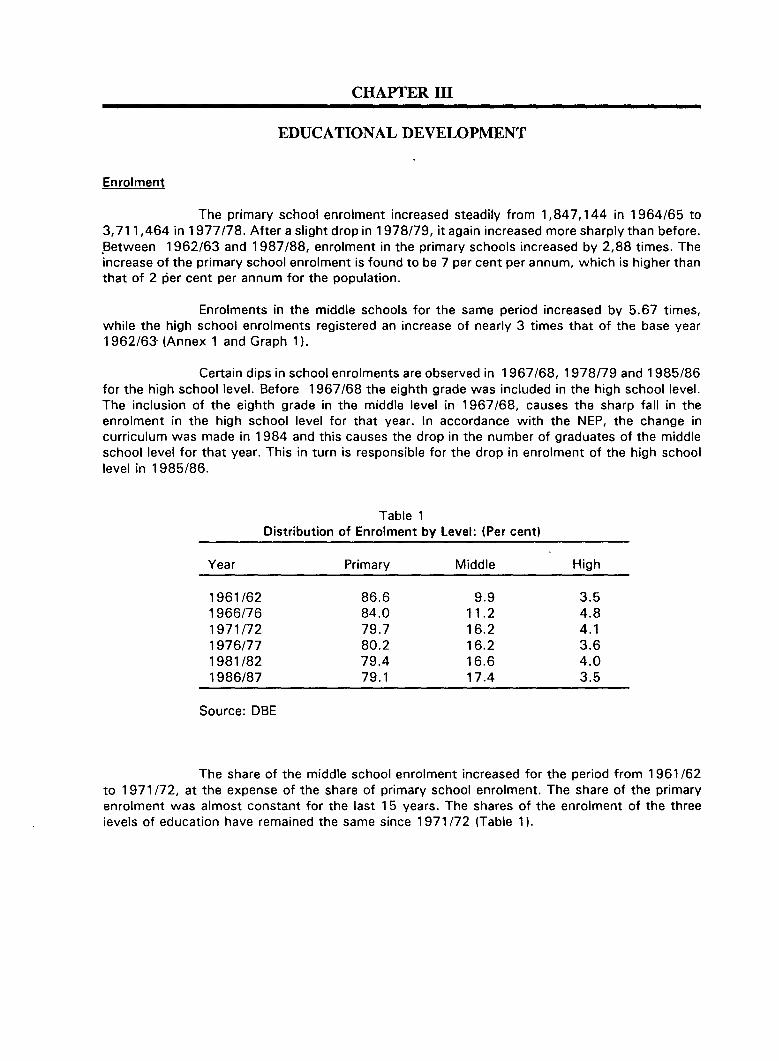
Enrolment
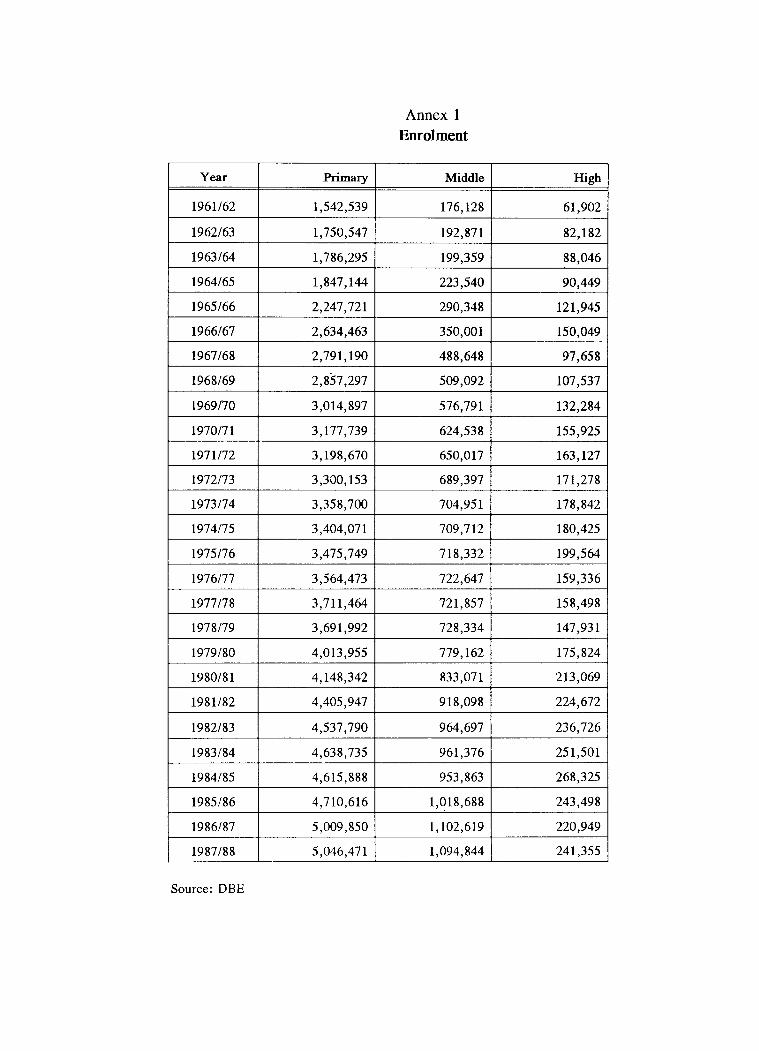
The primary school enrolment increased steadily from 1,847,144 in 1964/65 to3,711,464 in 1977178. After a slight drop in 1978179, it again increased more sharply than before..Between 1962/63 and 1987/88, enrolment in the primary schools increased by 2,88 times. Theincrease of the primary school enrolment is found to be 7 per cent per annum, which is higher thanthat of 2 per cent per annum for the population.
Enrolments in the middle schools for the same period increased by 5.67 times,while the high school enrolments registered an increase of nearly 3 times that of the base year1962/63· (Annex 1 and Graph 1).
Certain dips in school enrolments are observed in 1967/68, 1978/79 and 1985/86for the high school level. Before 1967/68 the eighth grade was included in the high school level.The inclusion of the eighth grade in the middle level in 1967/68, causes the sharp fall in theenrolment in the high school level for that year. In accordance with the NEP, the change incurriculum was made in 1984 and this causes the drop in the number of graduates of the middleschool level for that year. This in turn is responsible for the drop in enrolment of the high schoollevel in 1985/86.
Table 1Distribution of Enrolment by Level: (Per cent)
Year Primary Middle
1961/62 86.6 9.91966/76 84.0 11.21971/72 79.7 16.21976/77 80.2 16.21981/82 79.4 16.61986/87 79.1 17.4
Source: OBE
High
3.54.84.13.64.03.5
The share of the middle school enrolment increased for the period from 1961/62to 1971172, at the expense of the share of primary school enrolment. The share of the primaryenrolment was almost constant for the last 15 years. The shares of the enrolment of the threelevels of education have remained the same since 1971/72 (Table 1).

5
Graph 1
BASIC EDUCATION ENROLMENT
Enrolment (Millions)6.,-----------------------------,
5
4
3
2
1
1987/881982/831977/781972/731967/68o~~~~~~=+=~=+=~~~~~~~~::f
1962/63
YEAR
- Primary ---+-- Middle -lIE- High
Teachers
Table 2Distribution of Teachers by Level of Education
Primary Middle High Total
1962/63 Number. 41,157 6,546 2,742 50,445Per cent 81.6 13.0 5.4 100.0
1972/73 Number 71,136 16,059 9,405 96,600Per cent 73.6 16.6 9.8 100.0
1982/83 Number 86,354 23,227 12,498 122,079Per cent 70.8 19.0 10.2 100.0
1987/88 Number 166,950 44,958 16,536 228,444Per cent 73.1 19.7 7.2 100.0
Source: Reports to the Pyithu Hluttaw.

6
In the number of posts for teachers, sanctioned by the government, sharperincreases are observed after 1983/84 (Table 2). This is the result of the Fourth Four Year Plan(Union of Myanmar, 1982 : 364) which envisaged for the opening of 2,000 primary schools, 70middle schools and 25 high schools, each year. There have been changes in the distribution ofteachers over the years.
The growth in the number of teachers is much faster than the correspondingenrolment at primary and high school levels (Table 3).
Table 3Growth Indices 1987/1988 (1962-63 =100)
Schools
EnrolmentNumber of teachers
Primary
288405
Middle
567687
High
293603
The number of primary schools increased from 13,284 in 1962/63 to 31,329 in1987/88 which was 2.4 times' increase of the base year. The number of middle schools and highschools increased by 2.6 times and 2.2 times respectively during the same period (Annex 2).
Information regarding the number of class-rooms has not been collected by theDBE, so indicators such as the number of pupils per class and the number of teachers per class,cannot be analyzed. However, some information on school characteristics and section-size 2
based on a sample of schools is given in chapter VI and VII respectively.
Section-size corresponds to class-size.

CHAPTER IV
ACCESS TO EDUCATION
Age-specific Admission Rate
Age-specific Admission rate can give a clear picture of how different age-groupsgain access to the first level of education. These rates can be used to get an estimate of thenumber of children out of school, which is important information necessary for the implementationof the universal education. Data on KG enrolment by age is published by the OBE, but it is notpossible to have the number of new entrants by age and the number of repeaters by ageseparately. Hence age specific admission rates cannot be computed.
A sample survey should be conducted in the near future to collect data on thenumber of new entrants by ag~, so that age specific admission rates can be estimated.
The Gross Admission Rate (GAR) is used to analyze the access to education. TheGAR is defined as the number of children newly admitted to the first year of the school entranceexpressed as a percentage of the population of 5 year old children. The GAR to KG for the urbanareas increased from 123 in 1983/84 to 134 in 1987/88. In rural areas, sharper increases in theGARs are observed. This is mainly due to the opening of new primary schools, especially in therural areas during this period. But a slight decrease in the GAR is observed after 1986/87. Asaturation effect of opening new schools may have started, but it is too early to make any firmconclusion about this fact. There is also a disparity in the GAR for boys and girls !Table 4).
Table 4Gross Admission Rate to KG
Year Urban Rural UnionFemale Male Total Female Male Total
1983/84 119 126 123 115 125 120 1211984/85 123 132 128 116 119 118 1201985/86 131 138 134 120 124 122 1251986/87 129 144 136 137 143 140 1401987/88 132 135 134 135 141 138 137
5 ye~r Average 127 135 131 125 130 128 129
The variation of the GARs of the States/Divisions is quite substantial. It ranges froma low figure of 84 for the Shan state to a high figure of 155 for the Kayah state. All the States andDivisions except the Kachin and the Kayah states, have improved their GARs between 1983/84and 1987/88 (Annex 3).
8
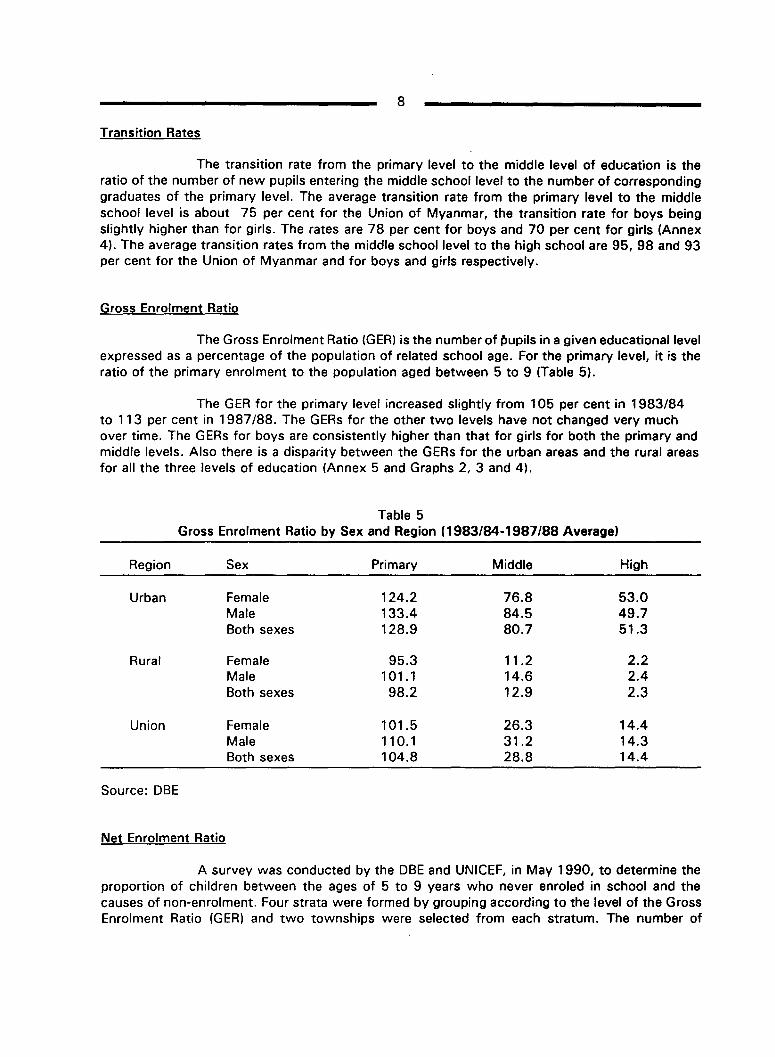
Transition Rates
The transition rate from the primary level to the middle level of education is theratio of the number of new pupils entering the middle school level to the number of correspondinggraduates of the primary level. The average transition rate from the primary level to the middleschool level is about 75 per cent for the Union of Myanmar, the transition rate for boys beingslightly higher than for girls. The rates are 78 per cent for boys and 70 per cent for girls (Annex4). The average transition rates from the middle school level to the high school are 95, 98 and 93per cent for the Union of Myanmar and for boys and girls respectively.
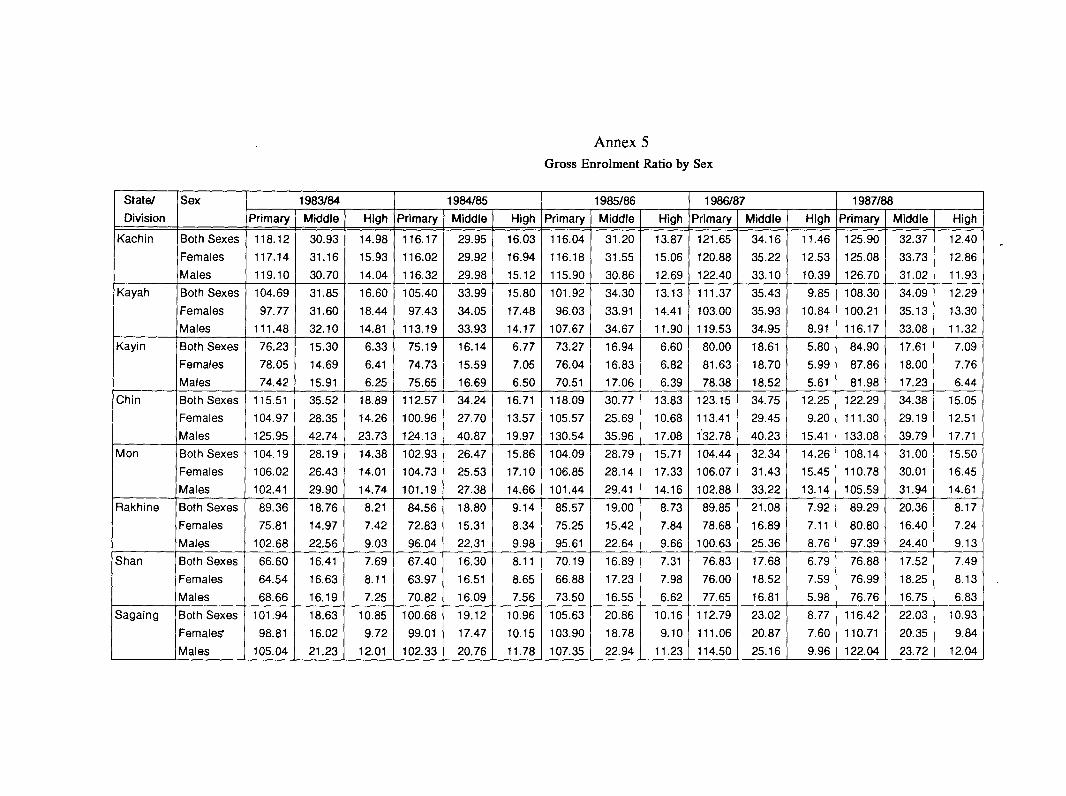
Gross Enrolment Ratio
The Gross Enrolment Ratio (GER) is the number of (>upils in a given educational levelexpressed as a percentage of the population of related school age. For the primary level, it is theratio of the primary enrolment to the population aged between 5 to 9 (Table 5).
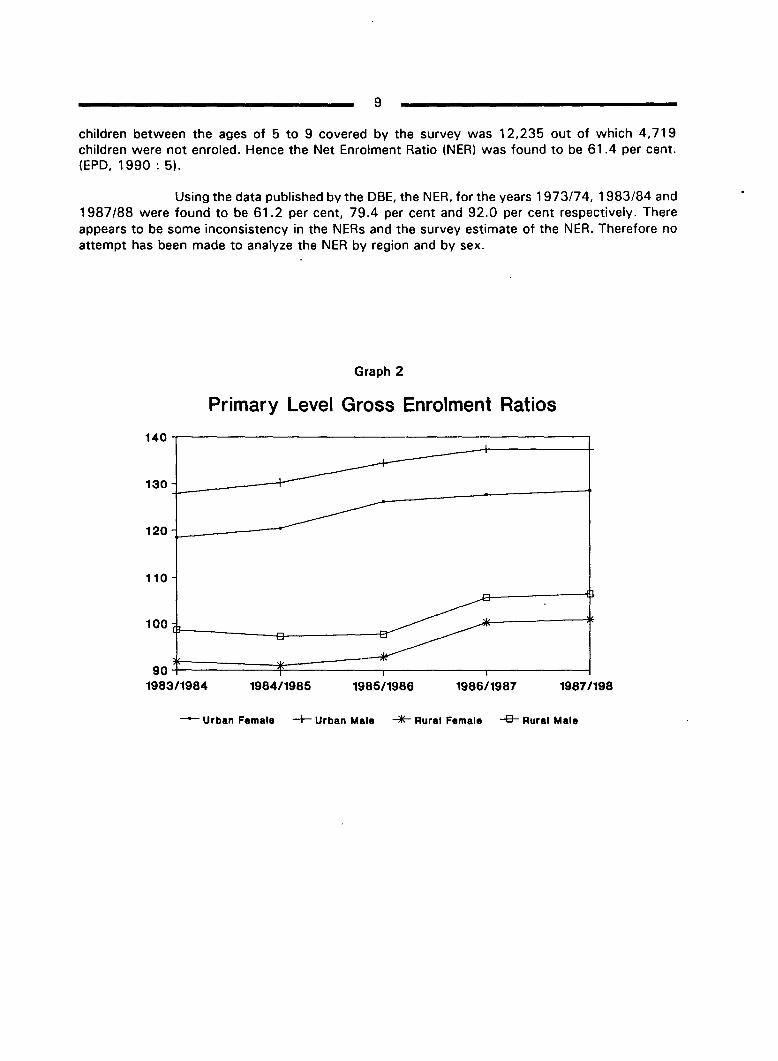
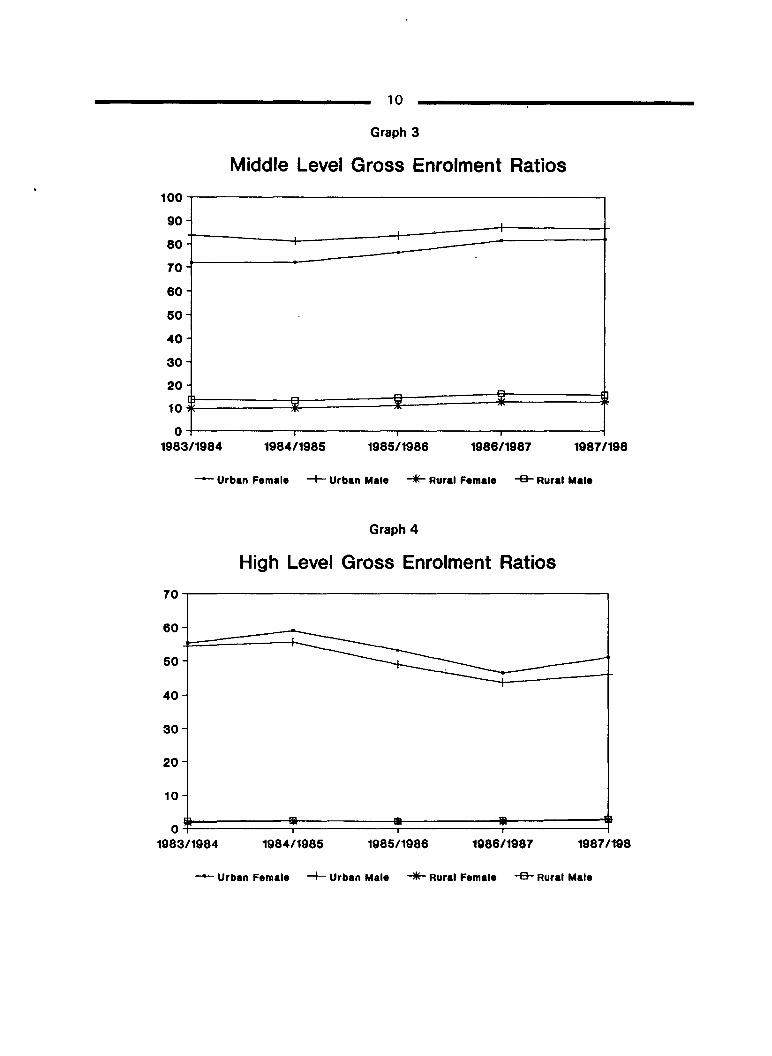
The GER for the primary level increased slightly from 105 per cent in 1983/84to 113 per cent in 1987/88. The GERs for the other two levels have not changed very muchover time. The GERs for boys are consistently higher than that for girls for both the primary andmiddle levels. Also there is a disparity between the GERs for the urban areas and the rural areasfor all the three levels of education (Annex 5 and Graphs 2, 3 and 4).
Table 5Gross Enrolment Ratio by Sex and Region (1983/84-1987/88 Average)
Region Sex Primary Middle High
Urban Female 124.2 76.8 53.0Male 133.4 84.5 49.7Both sexes 128.9 80.7 51.3
Rural Female 95.3 11.2 2.2Male 101.1 14.6 2.4Both sexes 98.2 12.9 2.3
Union Female 101.5 26.3 14.4Male 110.1 31.2 14.3Both sexes 104.8 28.8 14.4
Source: DBE
Net Enrolment Ratio
A survey was conducted by the DBE and UNICEF, in May 1990, to determine theproportion of children between the ages of 5 to 9 years who never enroled in school and thecauses of non-enrolment. Four strata were formed by grouping according to the level of the GrossEnrolment Ratio (GER) and two townships were selected from each stratum. The number of
9
children between the ages of 5 to 9 covered by the survey was 12,235 out of which 4,719children were not enroled. Hence the Net Enrolment Ratio (NERl was found to be 61.4 per cent.(EPD, 1990 : 5).
Using the data published by the DBE, the NER, for the years 1973/74, 1983/84 and1987/88 were found to be 61 .2 per cent, 79.4 per cent and 92.0 per cent respectively. Thereappears to be some inconsistency in the NERs and the survey estimate of the NER. Therefore noattempt has been made to analyze the NER by region and by sex.
Graph 2
Primary Level Gross Enrolment Ratios
140.-----------------------------,
130 L_-----o
120 L------
110
100~---~=l_---____Ey
198711981986/19871985/19861984/198590 f========*======~~---__,__---~
1983/1984
---- Urban Female -+- Urban Male -lIE- Rural Female -B- Rural Male
10
Graph 3
Middle Level Gross Enrolment Ratios
100
90
80
70
60
60
40
30
20
10
01983/1984 1984/1986 1985/1986 1986/1987 1987/198
-- Urban Female +- Urban Male -*- Rural Female -e- Rural Male
Graph 4
High Level Gross Enrolment Ratios
70 -r-------------------------,
60 .k=========f:::50
40
30
20
10
1987/1981986/19871985/19861984/1985O~======~=========!~======~======:::!f
1983/1984
-- Urban Female +- Urban Male -*- Rural Female -e- Rural Male
11
The GER for male is higher than for female for the primary and middle level. Forthe high s'chool level, the GER for female is higher than for male.
• The gap between the GERs for male and female has not reduced duringthis period for the primary level.
• The gap between the GERs for male and female remains constant for themiddle level in rural areas, but this gap has been reduced in urban areas.
• For high school level, there is a wide gap between the GERs for the urban andrural areas. The GER for the urban is about 50 per cent, while the GER forrural is only 3 per cent. This is mainly due to the lack of high schools in therural areas (Table 13), consequently, many rural children drop-out prematurely.
Major issues
ReHabJe information on the number of.children,by age is lacking, so that net enrolmentratio is not estimable. This information is vital for the implementation o.f universal education.A sample survey should be conducted to have reliable data on enrolment by age.
The Gross Enrolment Ratio of the secondary education for the rural areas is very low.This shows that secondary education is inaccessible to many roral children.

CHAPTER V
DYNAMIC INDICATORS
Flow Rates
Data on the number of promotions and repetitions has been collected for the period1981/82-1987/88. The average promotion, repetition and drop-out rates (Table 6) show that theflow rates of the KG are quite distinct from those of the other grades of the primary level. It hasthe highest repetition and drop-out rates and the lowest promotion rate of 49 per cent. Thepromotion rates of other grades are more than 60 per cent. The eighth and the tenth grades havehigh repetition and drop-out rates. These grades are the terminal grades of the middle level andhigh school level respectively, and the success rates of these grades are not very high, which leadsto high repetition rates. Those who fail twice are de-registered from school roll.
Table 6Average Flow Rates: 1981/82-1986/87 (Per cent)
Primary Level KG Grade 1 2 3 4
Repetition 29.0 23.8 21.3 20.7 18.8Drop-out 22.0 9.6 11.1 16.6Promotion 49.0 66.6 67.6 62.9 (68.6)a1
Middle Level 5 6 7 8
Repetition 20.2 18.8 20.4 33.2Drop-out 14.0 10.8 9.3Promotion 65.8 70.4 70.3 (45.9)8'
High School Level 9 10
Repetition 24.5 41.0Drop-out 11.4Promotion 64.1 (22.0)81
., In the terminal grades the promotion rate is actually the success rate at the final end-of cycleexamination. This success rate includes the performance of a substantial proportion of externalcandidates and is therefore strictly speaking not comparable with the promotion rate ofintermediate grades.Source: Data Sheet No.8 IMERB, 1990).
The promotion rate of the urban areas is higher than that of the rural areas (Table7). There is no difference between the KG promotion rates for boys and girls.
13
Table 7Average KG Promotion Rates: 1981/82-1986/87
Minimum Maximum
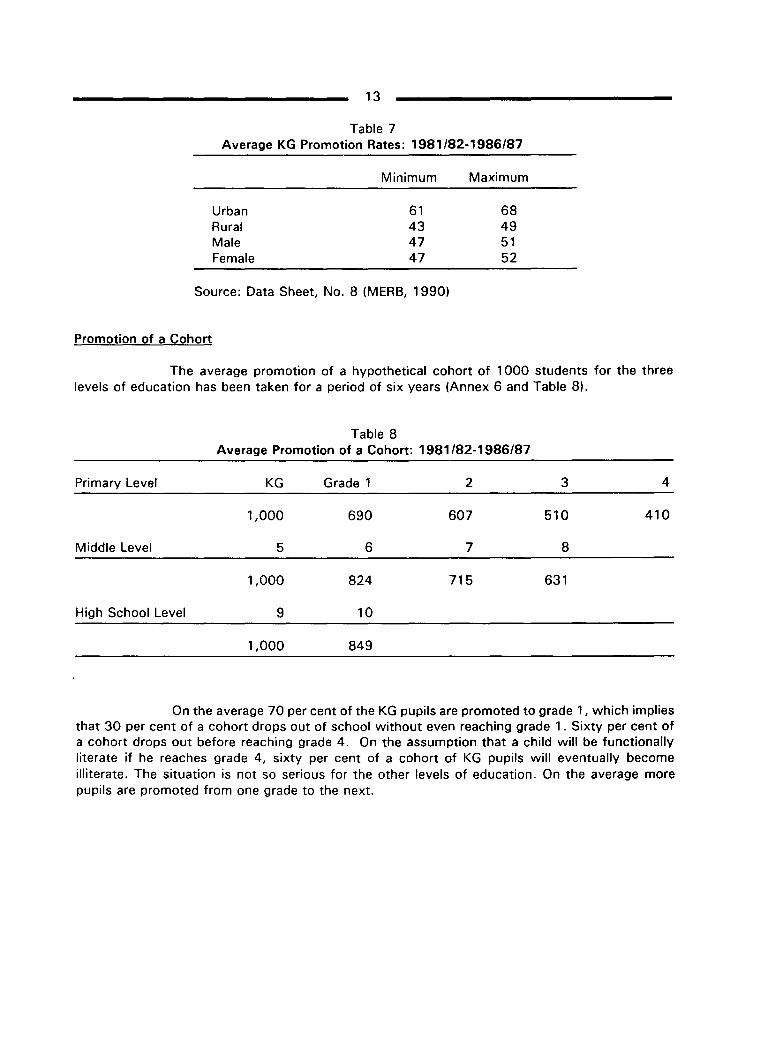
Urban 61 68Rural 43 49Male 47 51Female 47 52
Source: Data Sheet, No. 8 (MERB, 1990)
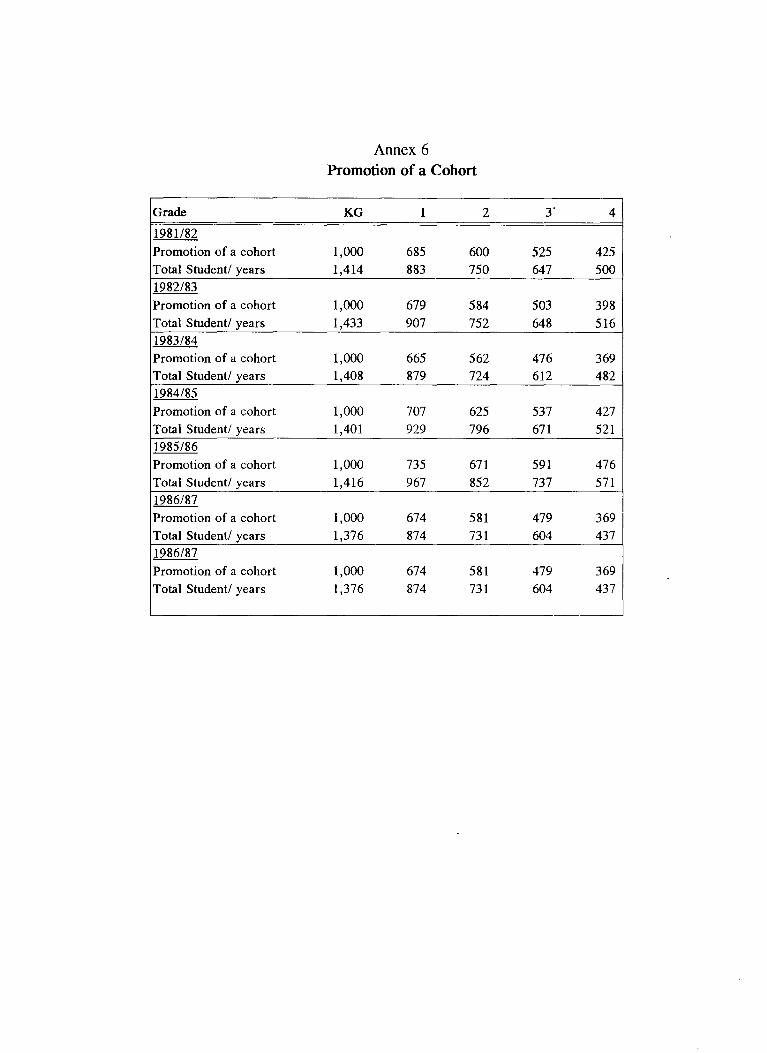
Promotion of a Cohort
The average promotion of a hypothetical cohort of 1000 students for the threelevels of education has been taken for a period of six years (Annex 6 and Table 8).
Table 8Average Promotion of a Cohort: 1981/82-1986/87
Primary Level KG Grade 1 2 3 4
1,000 690 607 510 410
Middle Level 5 6 7 8
1,000 824 715 631
High School Level 9 10
1,000 849
On the average 70 per cent of the KG pupils are promoted to grade 1, which impliesthat 30 per cent of a cohort drops out of school without even reaching grade 1. Sixty per cent ofa cohort drops out before reaching grade 4. On the assumption that a child will be functionallyliterate if he reaches grade 4, sixty per cent of a cohort of KG pupils will eventually becomeilliterate. The situation is not so serious for the other levels of education. On the average morepupils are promoted from one grade to the next.
14
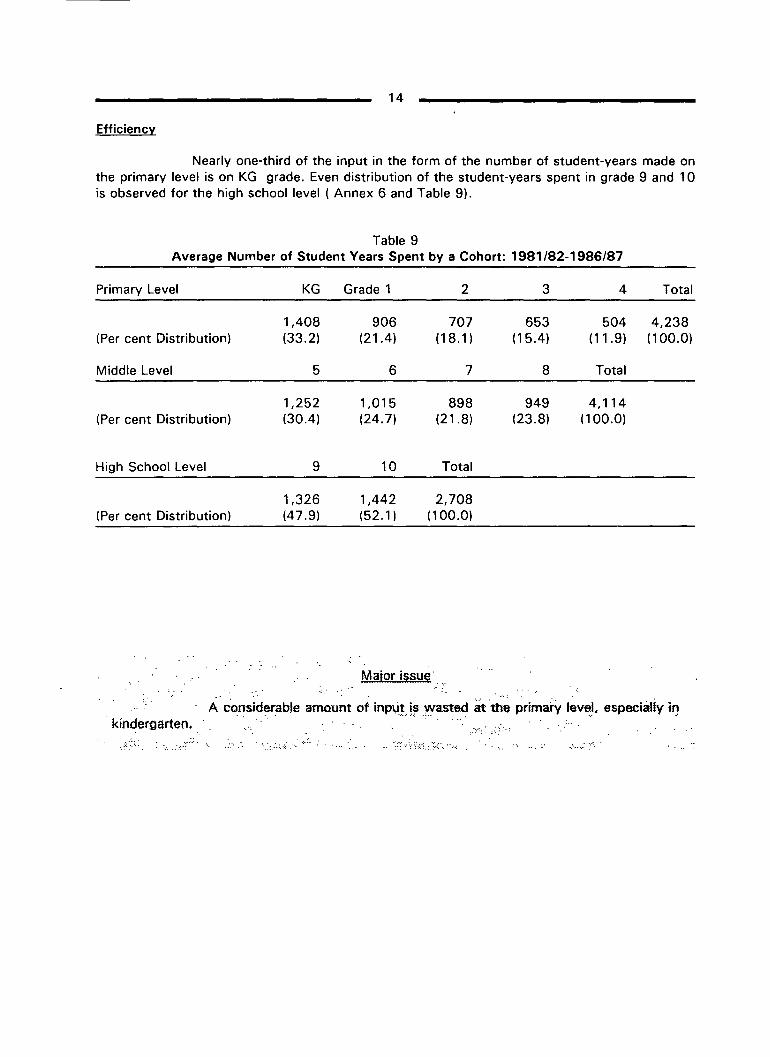
Efficiency
Nearly one-third of the input in the form of the number of student-years made onthe primary level is on KG grade. Even distribution of the student-years spent in grade 9 and 10is observed for the high school level ( Annex 6 and Table 9).
Table 9Average Number of Student Years Spent by a Cohort: 1981/82-1986/87
Primary Level KG Grade 1 2 3 4 Total
1,408 906 707 653 504 4,238(Per cent Distribution) (33.2) (21.4) (18.1 ) (15.4) (11.9) (100.0)
Middle Level 5 6 7 8 Total
1,252 1,015 898 949 4,114(Per cent Distribution) (30.4) (24.7) (21.8) (23.8) (100.0)
High School Level 9 10 Total
1,326 1,442 2,708(Per cent Distribution) (47.9) (52.1 ) (100.0)
Maior issu!',
A." considerable amou~t ot inpvt, i~ yvasted at 'th~ primary level. especialiy in'. '.' ':". .' '.' "
kindergarteo.
....:.:.:..:.... :. -.:.:.
..;.-.:-
'. ',. .: .
CHAPTER VI
SCHOOLS
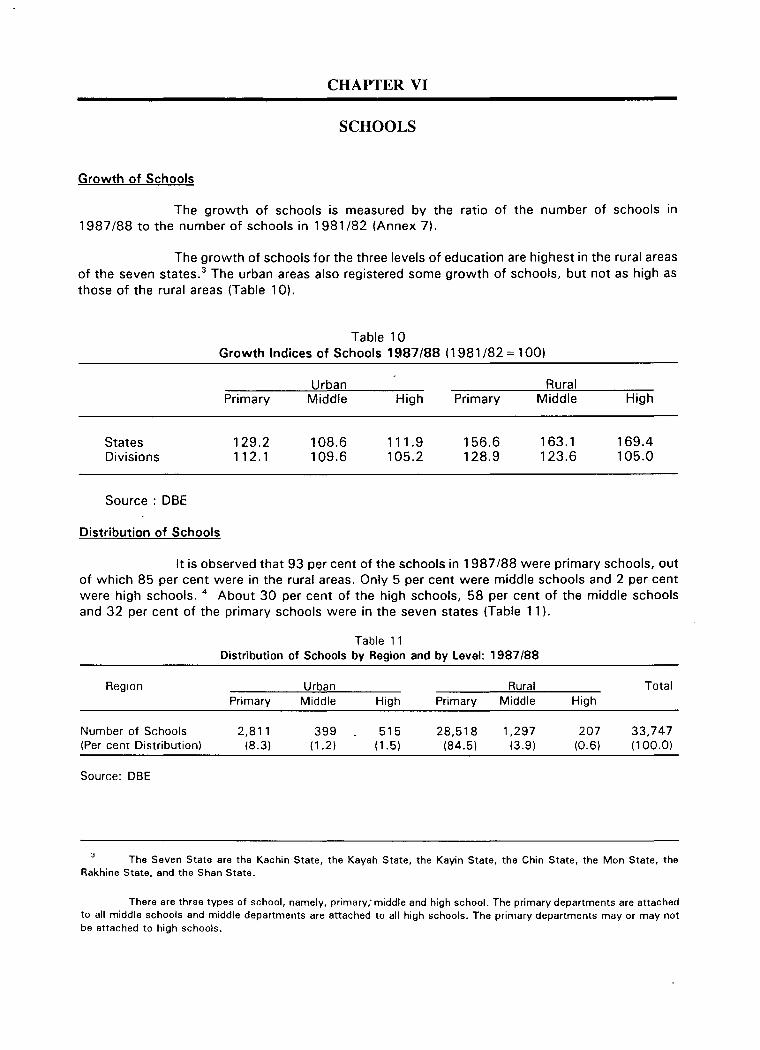
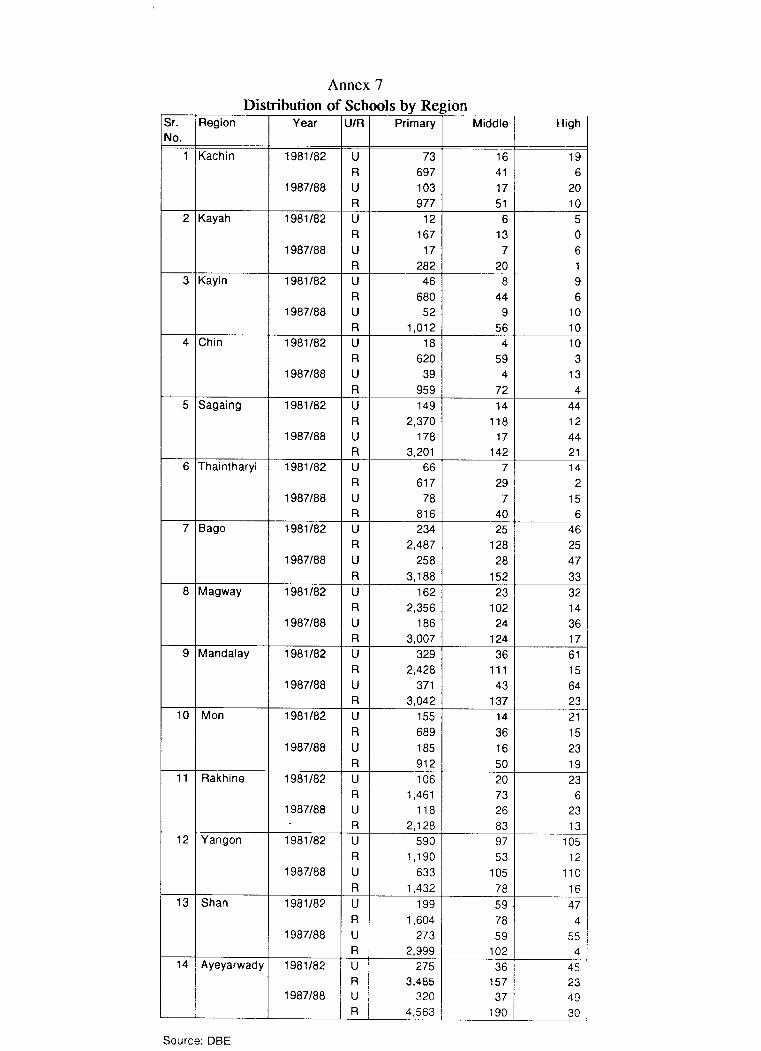
Growth of Schools
The growth of schools is measured by the ratio of the number of schools in1987/88 to the number of schools in 1981/82 (Annex 7).
The growth of schools for the three levels of education are highest in the rural areasof the seven states. 3 The urban areas also registered some growth of schools, but not as high asthose of the rural areas (Table 10).
Table 10Growth Indices of Schools 1987/88 (1981/82 = 100)
Urban
StatesDivisions
Source: DBE
Distribution of Schools
Primary
129.2112.1
Middle
108.6109.6
High
111.9105.2
Primary
156.6128.9
RuralMiddle
163.1123.6
High
169.4105.0
It is observed that 93 per cent of the schools in 1987/88 were primary schools, outof which 85 per cent were in the rural areas. Only 5 per cent were middle schools and 2 per centwere high schools. 4 About 30 per cent of the high schools, 58 per cent of the middle schoolsand 32 per cent of the primary schools were in the seven states (Table 11).
Table 11Distribution of Schools by Region and by Level: 1987/88
Region Urban Rural TotalPrimary Middle High Primary Middle High
Number of Schools 2,811 399 515 28,518 1,297 207 33,747(Per cent Distribution) (8.3) (1.2) [1.5) (84.5) (3.9) (0.6) (100.0)
Source: DBE
The Seven State are the Kachin State, the Kayah State, the Kayin State, the Chin State, the Mon State, theRakhine State, and the Shan State.
There are three types of school, namely, primary; middle and high school. The primary departments are attachedto all middle schools and middle departments are attached to all high schools. The primary departments mayor may notbe attached to high schools.

16
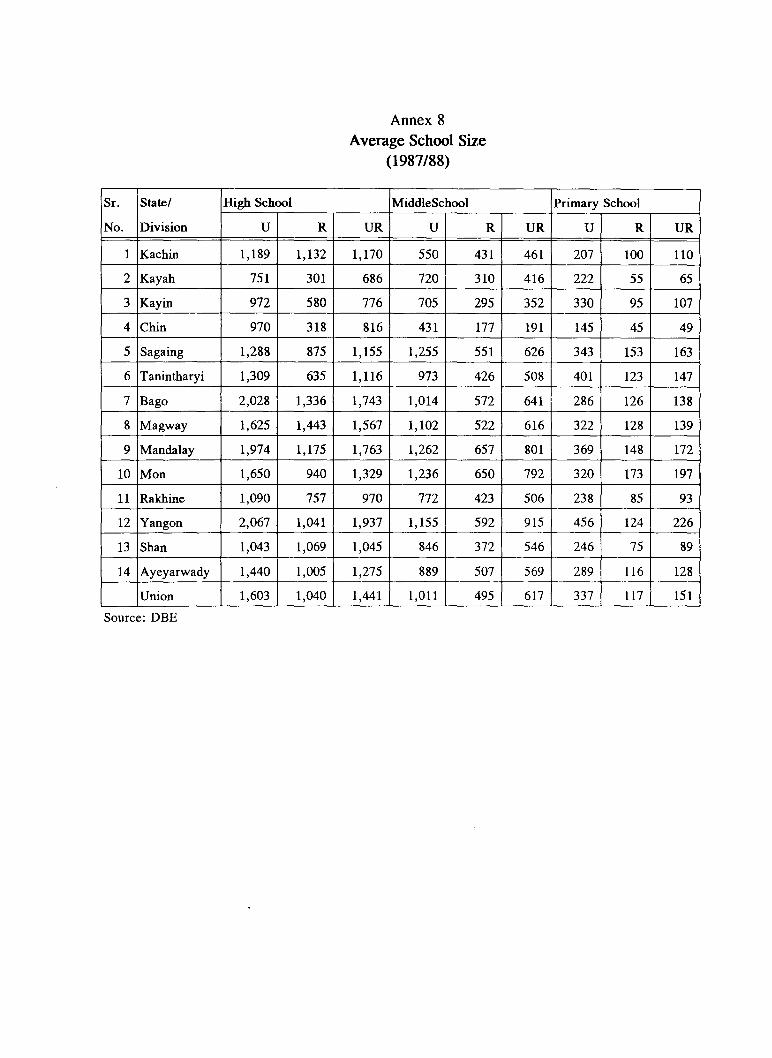
Availability of Schools
The availability of schools is measured by the number of schools per 100,000population (Table 12). Primary schools were more available on the basis of population in the ruralareas than in the urban areas. The average size of primary schools in the rural areas is muchsmaller than that of the urban primary schools. Hence, there are still many children out of schoolowing to the inaccessibility of schools in the rural areas.
Table 12Number of Schools per 100,000 Population: 1987/88
Region Urban RuralPrimary Middle High Primary Middle High
No. of Schools 29.1 4.1 5.3 96.6 4.4 0.7Avg. School Sizea
/ 337 1,011 1,603 117 495 1,040
a/ Average number of students per schoolSource: OBE
There are 207 rural high schools, which accounts for 28 per cent of the totalnumber of high schools but, the index of availability of high schools is only 0.7. The average sizeof rural primary schools is 117 pupils. It is even smaller in some states (Annex 8). Urban primaryschools have an average size of 337 pupils. The middle and high schools seem to have economicalsizes in terms of enrolment.
The Education Planning Department (EPD) selected over 2,500 primary schools bya random sampling method, and enrolment, the number of teachers and the number of sectionsfor each school were recorded (Table 13). The average number of teachers per section for the ruralprimary school was 0.6. Also 47.4 per cent of the rural primary schools had 1 or 2 teachers. Thusmulti-grade teaching is practised in some schools in the rural areas.
Table 13Distribution of Primary Schools by the Number of Teachers per School: 1991
2 3 4 5 6 7+ Total
RuralNo. of School 150 1,012 555 ·363 164 92 114 2,450(Per cent Distribution) (6.1) (41.3) (22.7) (14.8) (6.7) (3.8) (4.6) (100.0)
UrbanNo. of School 1 15 8 16 23 22 108 193(Per cent Distribution) (0.5) (7.8) (4.1 ) (8.3) (11.9) (11.4) (55.5) (100.0)
Source: EPD No. of Schools survey (1991)
17
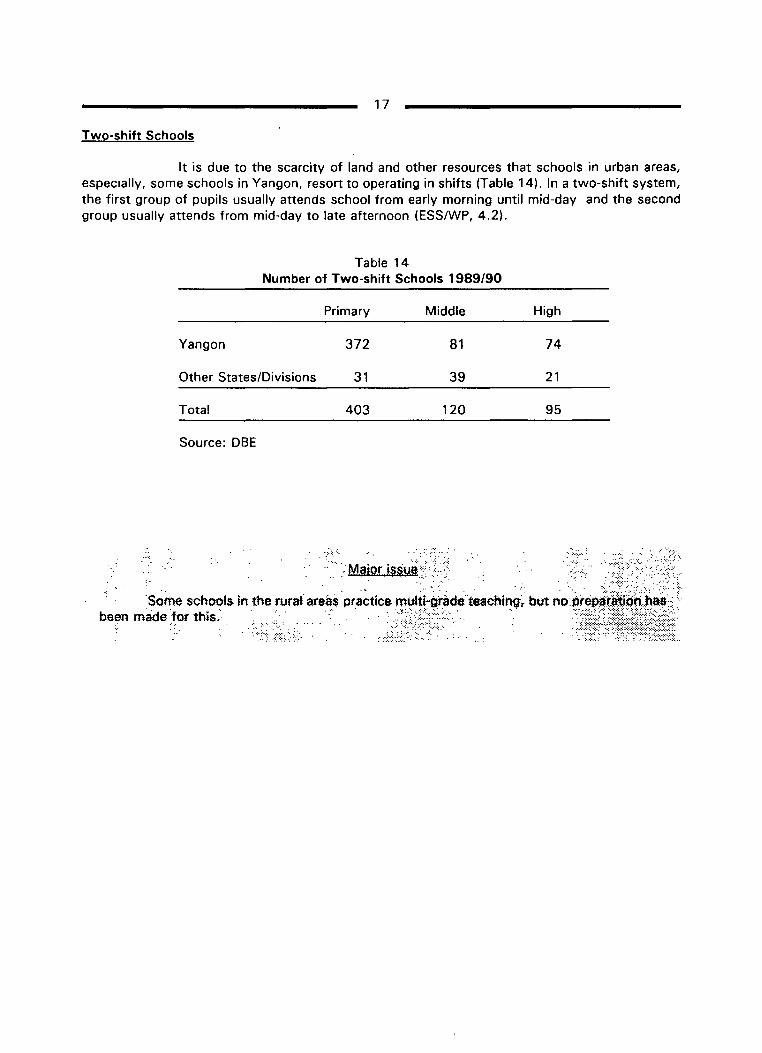
Two-shift Schools
It is due to the scarcity of land and other resources that schools in urban areas,especially, some schools in Yangon, resort to operating in shifts (Table 14). In a two-shift system,the first group of pupils usually attends school from early morning until mid-day and the secondgroup usually attends from mid-day to late afternoon (ESSIWP, 4.2).
Table 14Number of Two-shift Schools 1989/90
Yangon
Other States/Divisions
Total
Source: DBE
Primary
372
31
403
Middle
81
39
120
High
74
21
95
CHAPTER VII
TEACHERS
A policy has been adopted to create new teaching posts so that the section-sizewould not be more than 40 pupils. A recruitment campaign was started in 1984/85. Consequently,there has been an accelerating rate of increase in the number of JATs in both urban and ruralareas. Also, the number of SATs in the rural areas has increased by one and a half times that ofthe base-year 1981/82. There appears to be no increase in the number of PATs for the urbanareas. This should not be construed as the deterioration of the pupil-teacher ratio of the primarylevel, as JATs are also assigned to teach at the primary level (Annex 9).
Section-size
The EPD conducted a survey of schools in 1990. One out of four high schools wasselected by a systematic random sampling and the enrolment, the number of teachers and sectionsin each school are recorded from the forms filled up by the schools. Many States and Divisionshave more than 45 pupils per section on the average. Some high schools in Yangon have anaverage section-size of 50 or more (Annex 10). A similar survey of primary schools was conductedby the EPD as mentioned in chapter VI. The average section-size of the primary schools was 23and that of the urban primary schools was 42.
Pupil-teacher Ratio
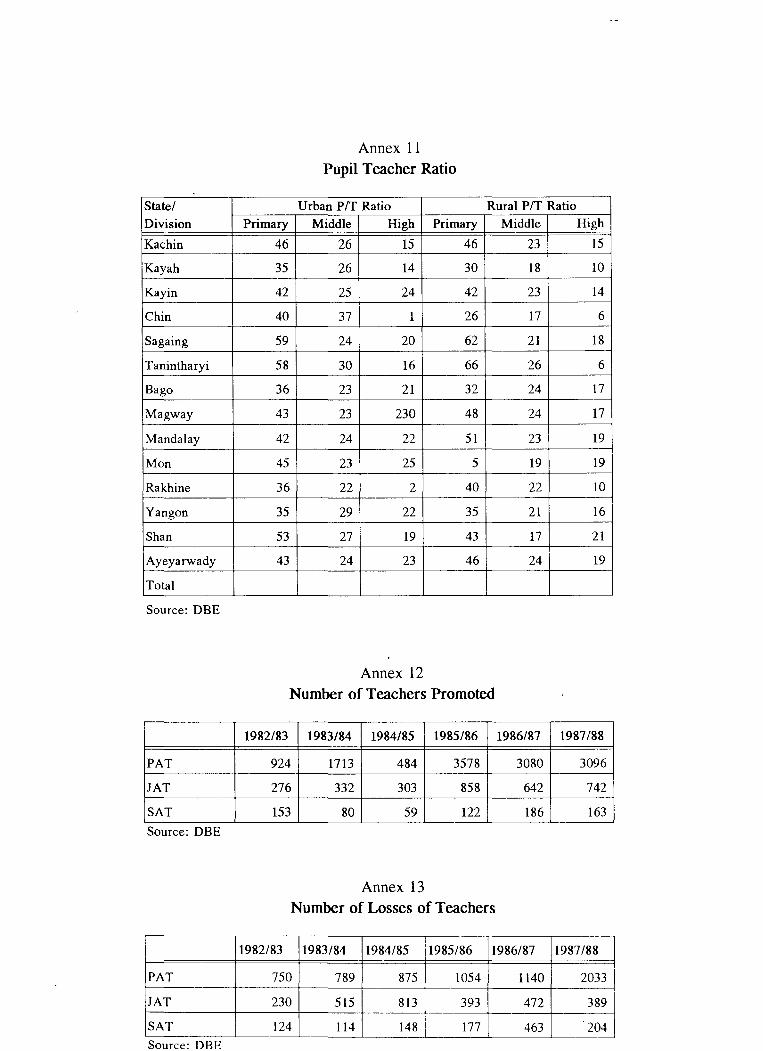
At the primary level, the average pupil-teacher ratio is high compared with the normof 32 for most States and Divisions. This is partly due to the inability to fill up the teaching postsin the rural areas. In the urban areas, many States and Divisions have an average pupil-teacher ratiohigher than the norm of 23, for the middle level of education. Many high schools, especially thosein the rural areas, have very low pupil-teacher ratios for grades 9 and 10, as the enrolments ofthese grades are very small.
Qualification Criteria
A few years ago, a university degree was a minimum qualification of primary schoolteachers. A primary teacher should have a Primary Assistant Teacher Certificate (PATC), awardedby a Teacher Training School. To qualify for a middle school post, a primary school teacher shouldhave completed an additional year course at a Teacher Training College (TTC). A JAT who has noteachership certificate is now allowed to enrol in a TTC. A Junior Assistant Teacher Certificate(JATC) is awarded at the completion of the course. A high school teacher needs to be a graduateof the Institute of Education.
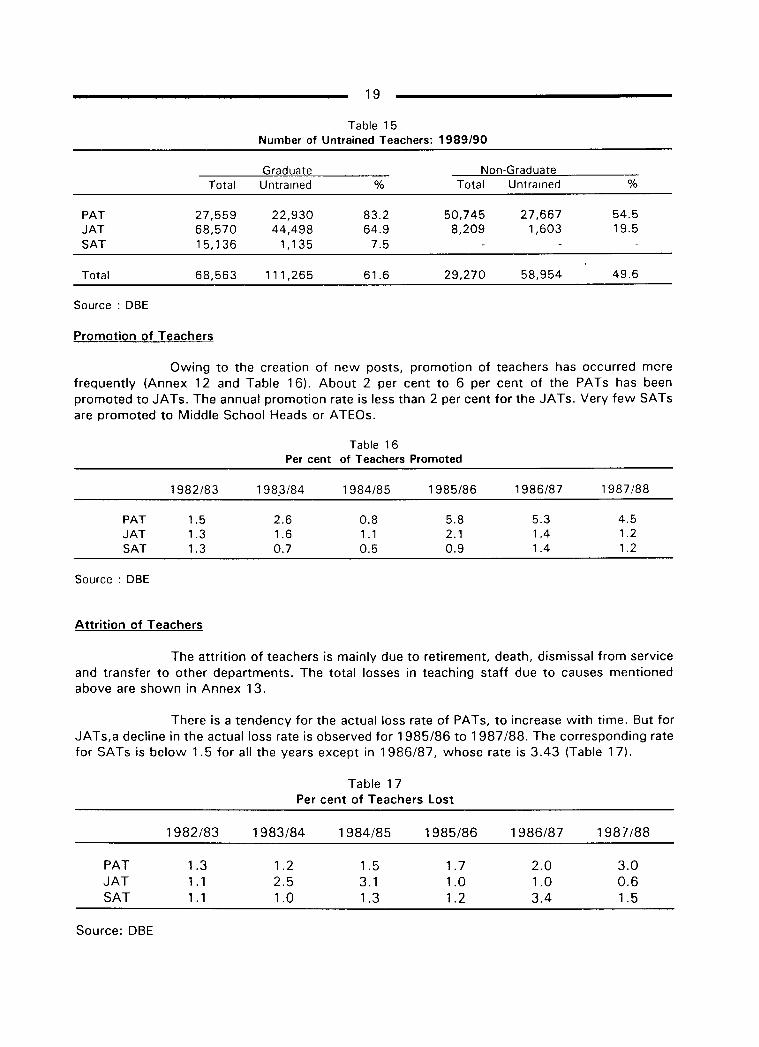
A graduate of a university who has not attended a TTS may be classified as anunderqualified teacher. A non-graduate without any teachership certificate may be classified as anunqualified teacher. There were 68,563 underqualified teachers and 29,270 unqualified teachersin 1989/90 (Table 15). This is due to the recruitment of many teachers for the last few years.
19
Table 15Number of Untrained Teachers: 1989/90
Graduate Non-GraduateTotal Untrained % Total Untrained %
PAT 27,559 22,930 83.2 50,745 27,667 54.5JAT 68,570 44,498 64.9 8,209 1,603 19.5SAT 15,136 1,135 7.5
Total 68,563 111,265 61.6 29,270 58,954 49.6
Source: OBE
Promotion of Teachers
Owing to the creation of new posts, promotion of teachers has occurred morefrequently (Annex 12 and Table 16). About 2 per cent to 6 per cent of the PATs has beenpromoted to JATs. The annual promotion rate is less than 2 per cent for the JATs. Very few SATsare promoted to Middle School Heads or ATEOs.
Table 16Per cent of Teachers Promoted
PATJATSAT
Source: OBE
1982/83
1.51.31.3
198.3/84
2.61.60.7
1984/85
0.81.10.5
1985/86
5.82.10.9
1986/87
5.31.41.4
1987/88
4.51.21.2
Attrition of Teachers
The attrition of teachers is mainly due to retirement, death, dismissal from serviceand transfer to other departments. The total losses in teaching staff due to causes mentionedabove are shown in Annex 13.
There is a tendency for the actual loss rate of PATs, to increase with time. But forJATs,a decline in the actual loss rate is observed for 1985/86 to 1987/88. The corresponding ratefor SATs is below 1.5 for all the years except in 1986/87, whose rate is 3.43 (Table 17).
Table 17Per cent of Teachers Lost
1982/83 1983/84 1984/85 1985/86 1986/87
PAT 1.3 1.2 1.5 1.7 2.0JAT 1.1 2.5 3.1 1.0 1.0SAT 1.1 1.0 1.3 1.2 3.4
Source: DBE
1987/88
3.00.61.5

CHAYfER VIII
TEACHER TRAINING AND INSPECTION
Teacher Training
• A one year in-service 5 course for PATs at 13 TTSs. A two-year correspondencecourse for PATs.
• A one-year in-service course for JATs at 4 TTCs.
• A one-year in-service course for SATs and a two-year correspondence course atthe Institute of Education.
• The Academy for Development of National Groups (ADNG)6 offers a four-yearpre-service course for middle school graduates. This institution is established forthe training of PATs cum-community leaders in remote areas.
Table 18Enrolment Capacity by Type of Institution
Institution
13 TTSs (PATs)4 TTCs (JATs)
Corr. Courses TTSs & TTCs (PATs)Year 1Year 2
Inst. of Ed. (SATs)Corr. Courses
ADNG
Capacity
3,0002,000
2,0002,000
500.,
800
., The annual intake of students varies from year to year.Source: Institute of Education
The total number of places available for training of PATs by both in-service andcorrespondence modes of teaching is 5,000. It would take more than 10 years to train 27,667unqualified and 22,930 underqualified PATs. More than 20 years would be necessary to train allthe unqualified and underqualified JATs.
In Myanmar the in-service training means training of staff for a period which may extend from a few weeks toone or more year. Trainees enjoy all the amenities while attending the courses.
The ADNG is since 1991 reorganized as the University for the Development of National Races (UDNR) under thePublic Service Commission.
21
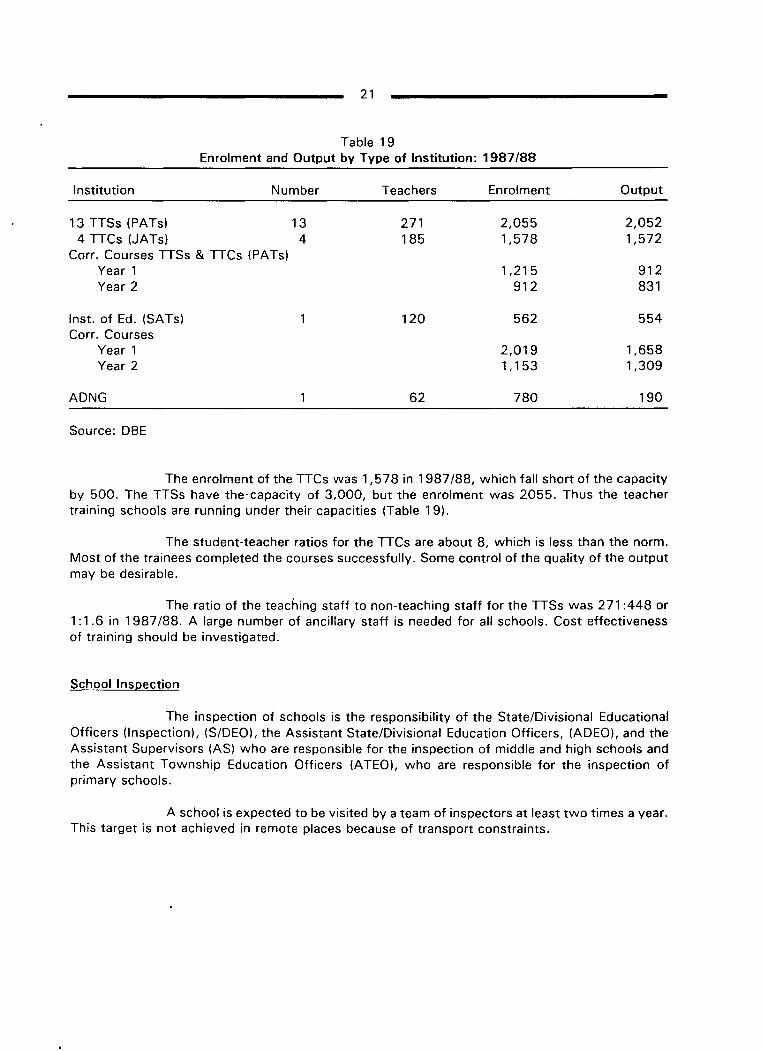
Table 19Enrolment and Output by Type of Institution: 1987/88
13TTSs(PATs) 134 TTCs (JATs) 4
Corr. Courses TTSs & TTCs (PATs)Year 1Year 2
Institution
Inst. of Ed. (SATs)Corr. Courses
Year 1Year 2
ADNG
Source: OBE
Number Teachers
271185
120
62
Enrolment Output
2,055 2,0521,578 1,572
1,215 912912 831
562 554
2,019 1,6581,153 1,309
780 190
The enrolment of the TTCs was 1,578 in 1987/88, which fall short of the capacityby 500. The TTSs have the' capacity of 3,000, but the enrolment was 2055. Thus the teachertraining schools are running under their capacities (Table 19).
The student-teacher ratios for the TTCs are about 8, which is less than the norm.Most of the trainees completed the courses successfully. Some control of the quality of the outputmay be desirable.
The ratio of the teaching staff to non-teaching staff for the TTSs was 271 :448 or1: 1.6 in 1987/88. A large number of ancillary staff is needed for all schools. Cost effectivenessof training should be investigated.
School Inspection
The inspection of schools is the responsibility of the State/Divisional EducationalOfficers (Inspection), (S/DEOI. the Assistant State/Divisional Education Officers, (ADEOI. and theAssistant Supervisors (AS) who are responsible for the inspection of middle and high schools andthe Assistant Township Education Officers (ATEO), who are responsible for the inspection ofprimary schools.
A school is expected to be visited by a team of inspectors at least two times a year.This target is not achieved in remote places because of transport constraints.
22
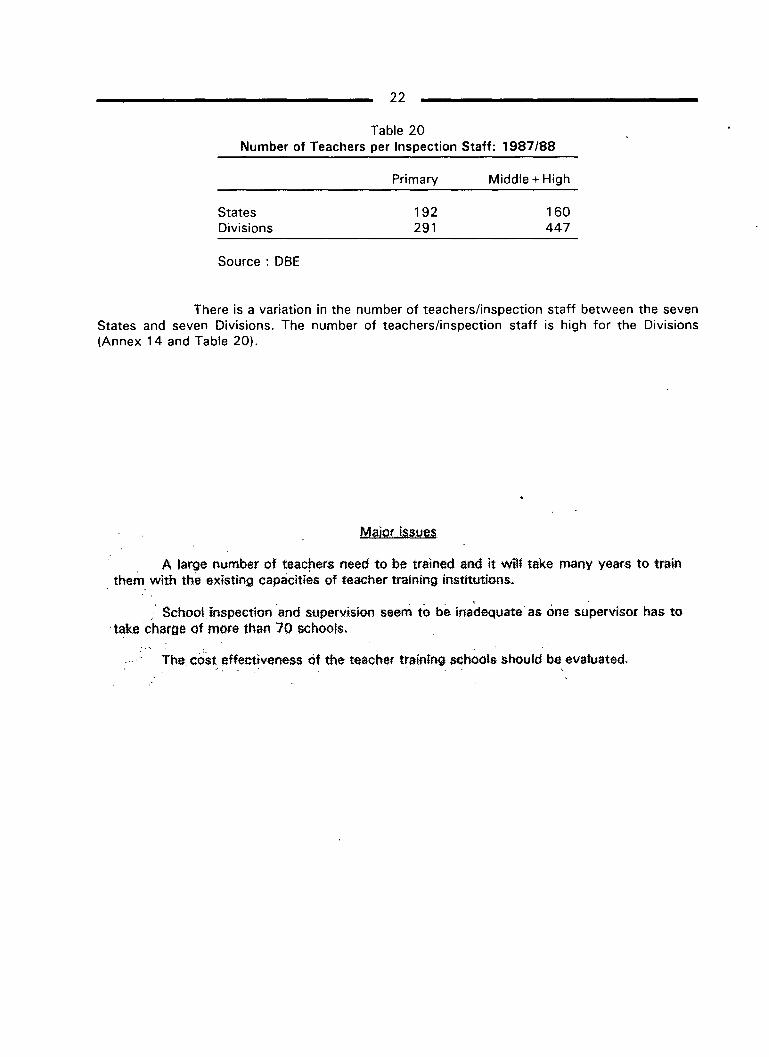
Table 20Number of Teachers per Inspection Staff: 1987/88
StatesDivisions
Source: DBE
Primary
192291
Middle + High
160447
There is a variation in the number of teachers/inspection staff between the sevenStates and seven Divisions. The number of teachers/inspection staff is high for the Divisions(Annex 14 and Table 20).
Maior issues
" A large number of teacpers need to be trained and it wilt take many years to train" them with the existing capacities of teacher training institutions.
" Schoo\.fnspection "and supervision seem to be. inadequate" as one su"pervisor has to"take charge of more than 70 schools.
. . ..' .
The" cost effectiveness of the teacher training schools should be evaluated,
CHAPTER IX
CONCLUSION
Males have higher access to education than females. Children in the urban areashave higher access to education than those in the rural areas. The Gross Enrolment Ratio (GER) ofthe secondary level for the rural areas was only 5 per cent in 1987/88. Thus access to secondaryeducation is yery limited to rural children.
A considerable amount of resources is wasted at the primary level, especially inkindergarten. It has the highest repetition and drop-out rates.
The New Education Programme (NEP) was launched in 1984 with the aims of givingrural children better access to education and reducing the class-size. Two thousand primaryschools, 70 middle schools and 25 high schools are built every year. Many teachers have also beenrecruited.
However a sample survey conducted by the Education Planning Department (EPD,1990) shows that 46 per cent of the rural primary schools had 1 or 2 teachers and the number ofteachers per section was only 0.7. Hence multi-grade teaching is still practised in the rural areas,although many teachers have been recruited. This is mainly due to the reluctancy of the teachersto work in isolated areas.
Large classes can be split-up into small classes, but this will need more teachersand class-rooms. For example, a class of 100 pupils when split-up into 2 classes of 50 pupils eachwill need one more class-room and one or more teachers. It will be impossible to reduce theclass-size, when the required additional rooms are not available. More teachers have beenappointed but few rooms are provided for. Therefore in large towns, some schools have largeclass-sizes. Between 1982/83 and 1987/88 80,000 teaching posts for the primary level and20,000 posts for the middle level were created. A large number of untrained teachers haveaccumulated so that it would take 10 years, with the existing capacity, to train the PATs and 20years for the JATs.
BIBLIOGRAPHY
Education Planning Department. Report on Primary School Age Non-enrolment Gap Survey.Ministry of Education, Department of Basic Education, Myanmar, 1990.
Myanmar Education Research Bureau. Summary of Basic Education Enrolment and Flow Rates(1981/82-1987/881. Education Sector Study Project (MYA/901004), Data SheetNo. 8, Yangon, 1990.
Nyan Myint. Population Projections for the Union of Myanmar, Urban and Rural Areas and itsStates and Divisions (1983-20131. Education Sector Study Project, Data Sheet No.5, Yangon, 1991.
Soe Soe Aung, Daw. Government Expenditure on Education. Education Sector Study Project,Working Paper 4.2, MERB, Ministry of Education, Yangon, 1991.
UNESCO. Information on Myanmar Education Sector. Educational Sector Review, Appendix to theFinal Report, Paris, October, 1989.
Union of Myanmar. Report to the Pyithu Hluttaw on the Financial, Economic and Social Conditionsof the Union of Myanmar for 1982/83. Fourth Four Year Plan, 1982/83 to1985/86, Ministry of Planning and Finance, Yangon, 1982.

LIST OF ANNEXES
1 Enrolment2 Number of Schools by Level of Education3 Gross Admission Rate to KG4 Transition Rates5 Gross Enrolment Ration by Sex6 Promotion of a Cohort7 Distribution of Schools by Region8 A verage School Size9 Distribution of the number of the Teachers by Region10 A verage Section Size11 Pupil Teacher Ratio12 Number of Teachers Promoted13 Number of Losses of Teachers14 Number of Teachers and Inspection Staff
Annex 1
Enrolment
Year Primary Middle High
1961/62 1,542,539 176,128 61,902
1962/63 1,750,547 192,871 82,182
1963/64 1,786,295 199,359 88,046
1964/65 1,847,144 223,540 90,449
1965/66 2,247,721 290,348 121,945
1966/67 2,634,463 350,001 150,049
1967/68 2,791,190 488,648 97,658
1968/69 2,857,297 509,092 107,537
1969170 3,014,897 576,791 132,284
1970/71 3,177,739 624,538 155,925
1971/72 3,198,670 650,017 163,127
1972/73 3,300,153 689,397 171,278
1973/74 3,358,700 704,951 178,842
1974/75 3,404,071 709,712 180,425
1975/76 3,475,749 718,332 199,564
1976/77 3,564,473 722,647 159,336
1977/78 3,711,464 721,857 158,498
1978/79 3,691,992 728,334 147,931
1979/80 4,013,955 779,162 175,824
1980/81 4,148,342 833,071 213,069
1981/82 4,405,947 918,098 224,672
1982/83 4,537,790 964,697 236,726
1983/84 4,638,735 961,376 251,501
1984/85 4,615,888 953,863 268,325
1985/86 4,710,616 1,018,688 243,498
1986/87 5,009,850 1,102,619 220,949
1987/88 5,046,471 1,094,844 241,355
Source: DBE

Annex 2Number of Schools by Level of Education
Basic Edm;ation School
Year Primary Middle High Total
1961/62 11,722 528 273 12,523
1962/63 13,284 651 322 14,257
1963/64 13,345 669 328 14,342
1964/65 13,341 681 331 14,353
1965/66 13,575 723 445 14,743
1966/67 13,943 814 508 15,265
1967/68 14,267 878 519 15,664
1968/69 14,915 961 524 16,400
1969/70 15,339 1,014 527 16,880
1970/71 15,534 1,033 527 17,094
1971/72 15,813 1,036 529 17,378
1972/73 16,224 1,054 534 17,812
1973/74 16,780 1,117 535 18,432
1974/75 17,619 1,122 540 19,281
1975/76 18,670 1,142 541 20,353
1976/77 18,742 1,149 545 20,436
1977/78 19,890 1,153 550 21,593
1978/79 19,895 1,153 550 21,598
1979/80 21,213 1,183 560 22,956
1980/81 21,785 1,231 586 23,602
1981/82 23,265 1,407 624 25,296
1982/83 23,453 1,415 624 25,492
1983/84 25,318 1,482 648 27,448
1984/85 25,459 1,485 649 27,593
1985/86 27,178 1,553 672 29,403
1986/87 31,040 1,696 722 33,458
1987/88 31,329 1,696 722 33,747
1988/89 31,429 1,696 722 33,847
1989/90
Source: DBE
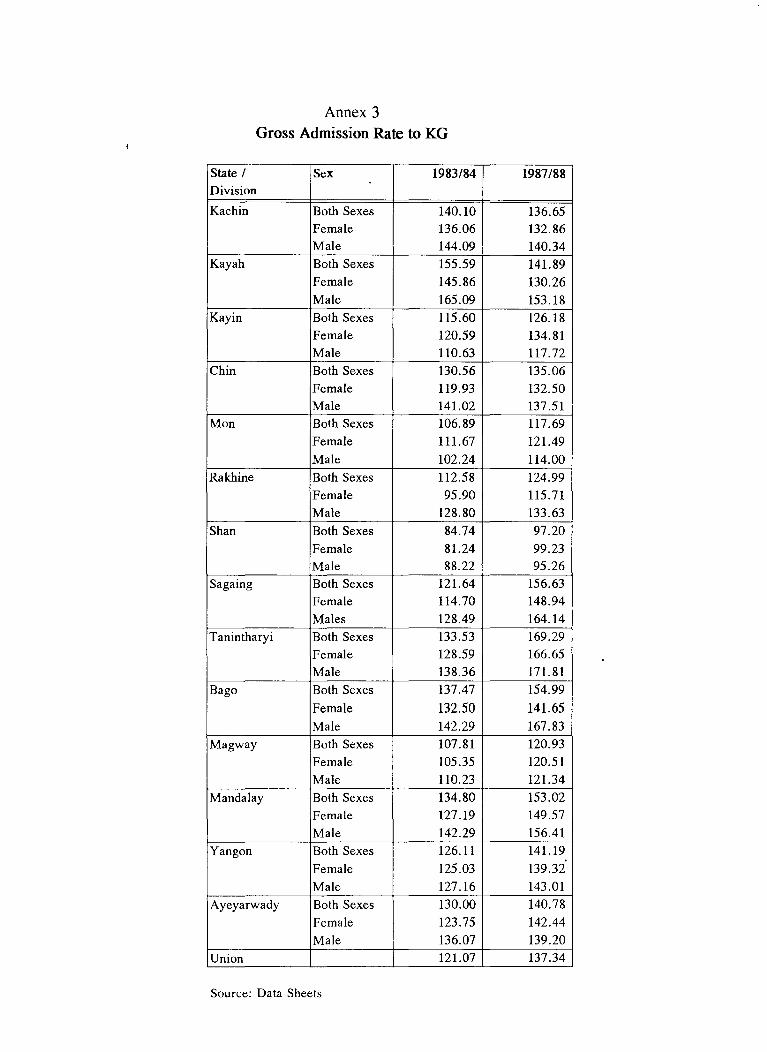
Annex 3Gross Admission Rate to KG
State / Sex 1983/84 1987/88Division
Kachin Both Sexes 140.10 136.65Female 136.06 132.86Male 144.09 140.34
Kayah Both Sexes 155.59 141.89Female 145.86 130.26Male 165.09 153.18
Kayin Both Sexes 115.60 126.18Female 120.59 134.81Male 110.63 117.72
Chin Both Sexes 130.56 135.06Female 119.93 132.50Male 141.02 137.51
Man Both Sexes 106.89 117.69Female 111.67 121.49Male 102.24 114.00
Rakhine Both Sexes 112.58 124.99Female 95.90 115.71Male 128.80 133.63
Shan Both Sexes 84.74 97.20Female 81.24 99.23Male 88.22 95.26
Sagaing Both Sexes 121.64 156.63Female 114.70 148.94Males 128.49 164.14
Tanintharyi Both Sexes 133.53 169.29Female 128.59 166.65Male 138.36 171.81
Bago Both Sexes 137.47 154.99Female 132.50 141.65Male 142.29 167.83
Magway Both Sexes 107.81 120.93Female 105.35 120.51Male 110.23 121.34
Mandalay Both Sexes 134.80 153.02Female 127.19 149.57Male 142.29 156.41
Yangon Both Sexes 126.11 141.19Female 125.03 139.32Male 127.16 143.01
Ayeyarwady Both Sexes 130.00 140.78Female 123.75 142.44Male 136.07 139.20
Union 121.07 137.34
Source: Data Sheets
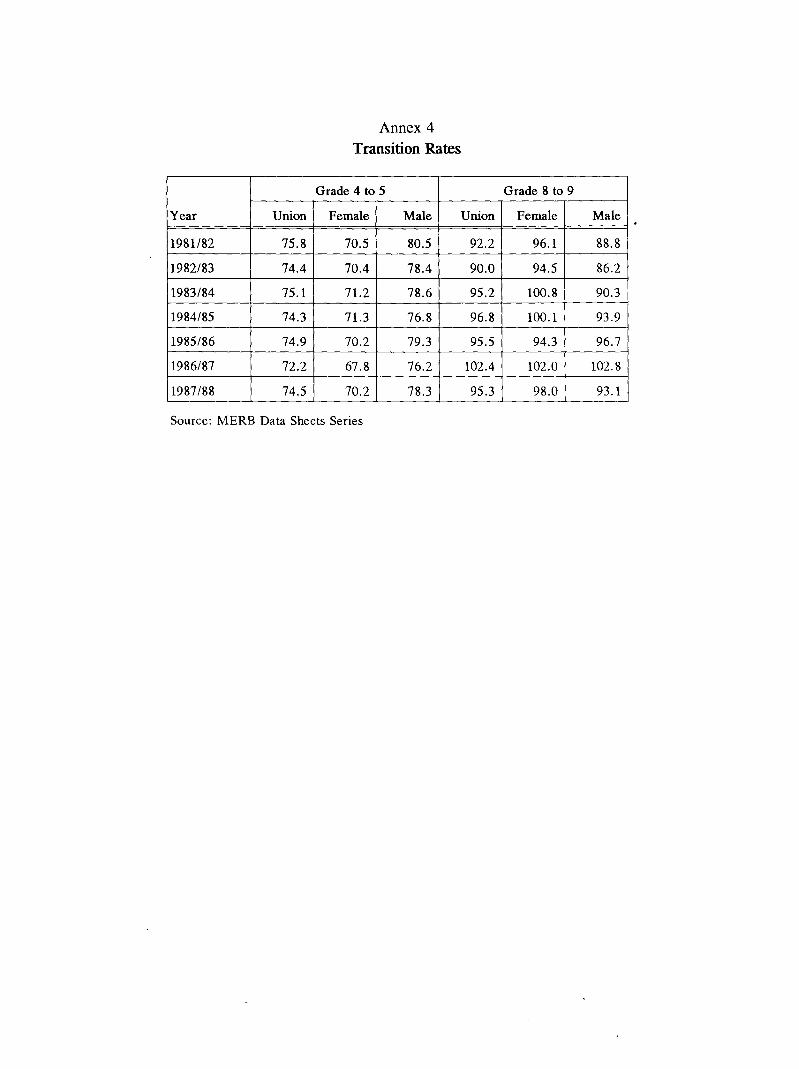
Annex 4Transition Rates
Grade 4 to 5 Grade 8 to 9
Year Union Female Male Union Female Male
1981/82 75.8 70.5 80.5 92.2 96.1 88.8
1982/83 74.4 70.4 78.4 90.0 94.5 86.2
1983/84 75.1 71.2 78.6 95.2 100.8 90.3
1984/85 74.3 71.3 76.8 96.8 100.1 93.9
1985/86 74.9 70.2 79.3 95.5 94.3 96.7
1986/87 72.2 67.8 76.2 102.4 102.0 102.8
1987/88 74.5 70.2 78.3 95.3 98.0 93.1
Source: MERB Data Sheets Series
Annex 5
Gross Enrolment Ratio by Sex
State! Sex 1983/84 1984/85 1985/86 1986/87 1987/88
Division Primary Middle High Primary Middle High Primary Middle High Primary Middle High Primary Middle High
Kachin Both Sexes 118.12 30.93 14.98 116.17 29.95 16.03 116.04 31.20 13.87 121.65 34.16 11.46 125.90 32.37 12.40
Females 117.14 31.16 15.93 116.02 29.92 16.94 116.18 31.55 15.06 120.88 35.22 12.53 125.08 33.73 12.86
Males 119.10 30.70 14.04 116.32 29.98 15.12 115.90 30.86 12.69 122.40 33.10 10.39 126.70 31.02 11.93
Kayah Both Sexes 104.69 31.85 16.60 105.40 33.99 15.80 101.92 34.30 13.13 111.37 35.43 9.85 108.30 34.09 12.29
Females 97.77 31.60 18.44 97.43 34.05 17.48 96.03 33.91 14.41 103.00 35.93 10.84 100.21 35.13 13.30
Males 111.48 32.10 14.81 113.19 33.93 14.17 107.67 34.67 11.90 119.53 34.95 8.91 116.17 33.08 11.32
Kayin Both Sexes 76.23 15.30 6.33 75.19 16.14 6.77 73.27 16.94 6.60 80.00 18.61 5.80 84.90 17.61 7.09
Females 78.05 14.69 6.41 74.73 15.59 7.05 76.04 16.83 6.82 81.63 18.70 5.99 87.86 18.00 7.76
Males 74.42 15.91 6.25 75.65 16.69 6.50 70.51 17.06 6.39 78.38 18.52 5.61 81.98 17.23 6.44
Chin Both Sexes 115.51 35.52 18.89 112.57 34.24 16.71 118.09 30.77 13.83 123.15 34.75 12.25 122.29 34.38 15.05
Females 104.97 28.35 14.26 100.96 27.70 13.57 105.57 25.69 10.68 113.41 29.45 9.20 111.30 29.19 12.51
Males 125.95 42.74 23.73 124.13 40.87 19.97 130.54 35.96 17.08 132.78 40.23 15.41 133.08 39.79 17.71
Man Both Sexes 104.19 28.19 14.38 102.93 26.47 15.86 104.09 28.79 15.71 104.44 32.34 14.26 108.14 31.00 15.50
Females 106.02 26.43 14.01 104.73 25.53 17.10 106.85 28.14 17.33 106.07 31.43 15.45 110.78 30.01 16.45
Males 102.41 29.90 14.74 101.19 27.38 14.66 101.44 29.41 14.16 102.88 33.22 13.14 105.59 31.94 14.61
Rakhine Both Sexes 89.36 18.76 8.21 84.56 18.80 9.14 85.57 19.00 8.73 89.85 21.08 7.92 89.29 20.36 8.17
Females 75.81 14.97 7.42 72.83 15.31 8.34 75.25 15.42 7.84 78.68 16.89 7.11 80.80 16.40 7.24
Males 102.68 22.56 9.03 96.04 22.31 9.98 95.61 22.64 9.66 100.63 25.36 8.76 97.39 24.40 9.13
Shan Both Sexes 66.60 16.41 7.69 67.40 16.30 8.11 70.19 16.89 7.31 76.83 17.68 6.79 76.88 17.52 7.49
Females 64.54 16.63 8.11 63.97 16.51 8.65 66.88 17.23 7.98 76.00 18.52 7.59 76.99 18.25 8.13
Males 68.66 16.19 7.25 70.82 16.09 7.56 73.50 16.55 6.62 77.65 16.81 5.98 76.76 16.75 6.83
Sagaing Both Sexes 101.94 18.63 10.85 100.68 19.12 10.96 105.63 20.86 10.16 112.79 23.02 8.77 116.42 22.03 10.93
FemaleS' 98.81 16.02 9.72 99.01 17.47 10.15 103.90 18.78 9.10 111.06 20.87 7.60 110.71 20.35 9.84
Males 105.04 21.23 12.01 102.33 20.76 11.78 107.35 22.94 11.23 114.50 25.16 9.96 122.04 23.72 12.04

Annex 5 (Cont.)
State! Sex 1983/84 1984/85 1985/86 1986/87 1987/88
Division Primary Middle High Primary Middle High Primary Middle High Primary Middle High Primary Middle High
Tanintharyi Both Sexes 109.36 19.65 9.94 109.87 19.74 10.43 111.40 22.41 9.12 114.58 23.53 7.79 118.08 22.87 8.27
Females 111.23 19.54 11.01 113.26 19.57 11.49 112.97 21.85 10.29 117.74 23.53 8.30 119.63 23.46 9.34
Males 107.53 19.75 8.86 106.56 19.91 9.36 109.87 22.97 7.95 111.53 23.53 7.29 116.58 22.28 7.21
Bago Both Sexes 110.61 28.59 15.10 114.55 29.00 16.10 114.06 30.11 13.74 120.95 31.71 12.63 118.43 32.21 14.45
Females 106.96 24.50 14.46 110.56 25.36 16.07 114.11 27.27 14.02 116.13 28.85 12.94 114.38 29.30 14.29
Males 114.15 32.56 15.73 118.40 32.52 16.12 114.01 32.86 13.46 125.60 34.46 12.33 122.33 35.02 14.61
Magway Both Sexes 106.65 23.89 12.48 106.22 23.26 13.86 107.97 25.83 12.96 114.75 27.46 12.16 115.79 27.50 12.63
Females 103.29 20.31 11.56 103.43 19.81 13.03 105.23 22.28 12.33 112.15 24.11 11.36 113.08 24.62 12.20
Males 109.97 27.43 13.42 108.97 26.68 14.69 110.66 29.34 13.60 117.30 30.78 12.95 118.44 30.35 13.07
Mandalay Both Sexes 108.01 30.50 16.50 106.18 29.62 17.84 108.39 31.62 15.68 116.12 33.68 13.66 116.61 32.90 14.82
Females 102.65 25.45 15.62 100.79 25.65 17.01 105.08 28.06 14.88 112.01 30.41 12.81 111.90 30.21 14.10
Males 113.26 35.45 17.36 111.46 33.47 18.65 111.61 35.07 16.44 120.13 36.83 14.48 121.21 35.47 15.51
Yangon Both Sexes 115.88 58.48 37.68 118.68 57.16 37.55 120.16 59.33 32.03 123.37 63.18 28.40 125.02 63.78 28.47
Females 112.08 54.12 40.30 114.95 53.62 41.08 114.97 55.98 35.53 118.84 60.17 30.20 120.92 61.54 32.27
Males 119.58 62.73 35.11 122.31 60.60 34.13 125.20 62.56 28.66 127.76 66.10 26.67 129.01 65.95 24.83
Ayeyarwad Both Sexes 104.61 23.51 11.92 101.35 21.90 12.75 103.67 23.50 11.94 112.82 25.30 10.98 109.77 24.79 11.84
Females 100.50 20.20 11.40 97.50 18.98 12.31 99.70 20.94 11.73 108.89 22.60 11.23 106.82 22.81 11.94
Males 108.61 26.74 12.44 105.07 24.74 13.18 107.51 25.98 12.16 116.60 27.93 10.72 112.62 26.72 11.74
Union Both Sexes 105.22 30.61 15.41 104.54 29.58 15.82 105.65 30.94 14.03 112.28 32.92 12.73 112.77 32.11 13.56
Females 101.52 27.59 15.19 101.00 27.06 15.93 102.85 28.60 14.24 109.14 30.67 12.75 109.68 30.24 13.77
Males 97.75 24.52 14.96 97.38 24.49 16.05 99.99 26.21 14.44 105.92 28.38 12.76 106.50 28.33 13.98Urban Both Sexes 123.23 77.91 54.81 125.43 76.79 57.23 130.37 80.16 50.96 132.53 84.39 44.98 132.92 84.45 48.32
Females 118.45 71.94 55.28 120.45 72.14 58.99 126.14 76.51 53.13 127.56 81.53 46.46 128.43 82.10 50.89
Males 127.86 83.68 54.36 130.25 81.24 55.54 134.48 83.65 48.92 137.34 87.13 43.59 137.26 86.70 45.92
Rural Both Sexes 95.27 11.73 2.10 94.16 11.56 2.31 95.34 12.74 2.19 102.90 14.41 2.26 103.61 14.13 2.66
Females 91.85 9.77 1.90 90.98 9.90 2.27 92.89 11.06 2.15 100.17 12.61 2.18 100.78 12.64 2.55
Males 98.65 13.66 2.29 97.29 13.20 2.36 97.74 14.42 2.22 105.57 16.19 2.34 106.35 15.60 2.78
Source: MERB Data Sheets Series
Annex 6Promotion of a Cohort
Grade KG 1 2 3' 4
1981/82Promotion of a cohort 1,000 685 600 525 425Total Studentl years 1,414 883 750 647 5001982/83Promotion of a cohort 1,000 679 584 503 398Total Student! years 1,433 907 752 648 5161983/84Promotion of a cohort 1,000 665 562 476 369Total Student1years 1,408 879 724 612 4821984/85
Promotion of a cohort 1,000 707 625 537 427Total Student! years 1,401 929 796 671 5211985/86Promotion of a cohort 1,000 735 671 591 476Total Student! years 1,416 967 852 737 5711986/87Promotion of a cohort 1,000 674 581 479 369Total Studentl years 1,376 874 731 604 4371986/87Promotion of a cohort 1,000 674 581 479 369Total Studentl years 1,376 874 731 604 437
Annex 7Distribution of Schools by Region
Sr. Region Year UlR Primary Middle HighNo.
1 Kachin 1981/82 U 73 16 19R 697 41 6
1987/88 U 103 17 20R 977 51 10
2 Kayah 1981/82 U 12 6 5R 167 13 0
1987/88 U 17 7 6R 282 20 1
3 Kayin 1981/82 U 46 8 9R 680 44 6
1987/88 U 52 9 10R 1,012 56 10
4 Chin 1981/82 U 18 4 10R 620 59 3
1987/88 U 39 4 13R 959 72 4
5 Sagaing 1981/82 U 149 14 44R 2,370 118 12
1987/88 U 178 17 44R 3,201 142 21
6 Thaintharyi 1981/82 U 66 7 14R 617 29 2
1987/88 U 78 7 15R 816 40 6
7 Bago 1981/82 U 234 25 46R 2,487 128 25
1987/88 U 258 28 47R 3,188 152 33
8 Magway 1981/82 U 162 23 32R 2,356 102 14
1987/88 U 186 24 36R 3,007 124 17
9 Mandalay 1981/82 U 329 36 61R 2,428 111 15
1987/88 U 371 43 64R 3,042 137 23
10 Mon 1981/82 U 155 14 21R 689 36 15
1987/88 U 185 16 23R 912 50 19
11 Rakhine 1981/82 U 106 20 23R 1,461 73 6
1987/88 U 118 26 23R 2,128 83 13
12 Yangon 1981/82 U 590 97 105R 1,190 53 12
1987/88 U 633 105 110R 1,432 78 16
13 Shan 1981/82 U 199 59 47R 1,604 78 4
1987/88 U 273 59 55R 2,999 102 4
14 Ayeyarwady 1981/82 U 275 36 45R 3,485 157 23
1987/88 U 320 37 49R 4,563 190 30
--
Source: OBE
Annex 8Average School Size
(1987/88)
Sr. State! High School MiddleSchool Primary School
No. Division U R UR U R UR U R UR
I Kachin 1,189 1,132 1,170 550 431 461 207 100 110
2 Kayah 751 301 686 720 310 416 222 55 65
3 Kayin 972 580 776 705 295 352 330 95 107
4 Chin 970 318 816 431 177 191 145 45 49
5 Sagaing 1,288 875 1,155 1,255 551 626 343 153 163
6 Tanintharyi 1,309 635 1,116 973 426 508 401 123 147
7 Bago 2,028 1,336 1,743 1,014 572 641 286 126 138
8 Magway 1,625 1,443 1,567 1,102 522 616 322 128 139
9 Mandalay 1,974 1,175 1,763 1,262 657 801 369 148 172
10 Mon 1,650 940 1,329 1,236 650 792 320 173 197
11 Rakhine 1,090 757 970 772 423 506 238 85 93
12 Yangon 2,067 1,041 1,937 1,155 592 915 456 124 226
13 Shan 1,043 1,069 1,045 846 372 546 246 75 89
14 Ayeyarwady 1,440 1,005 1,275 889 507 569 289 116 128
Union 1,603 1,040 1,441 1,011 495 617 337 117 151
Source: DBE

Annex 9
Distribution of the number of Teachers by Region
Urban Rural
Year PAT JAT SAT PAT JAT SAT
Number Index Number Index Number Index Number Index Number Index Number Index
1981182 20,521 100.0 12,876 100.0 9,233 100.0 35,410 100.0 6,387 100.0 2,109 100.01982/83 20,660 100.7 13,669 106.2 9,450 102.4 39,380 111.2 7,033 110.1 2,296 108.9
1983/84 22,778 1I 1.0 15,099 117.3 9,881 107.0 42,135 119.0 7,729 121.0 2,534 120.21984/85 20,357 99.2 18,179 141.2 9,812 106.3 42,525 120.1 8,480 132.8 2,388 113.2
1985/86 20,384 99.3 24,750 192.2 11,262 122.0 40,953 115.7 15,498 242.6 2,885 136.81986/87 21,034 102.5 27,417 212.9 11,419 123.7 36,764- 103.8 19,932 312.1 3,289 156.0
1987/88 19,897 97.0 34,603 268.7 11,593 125.6 48,930 138.2 26,487 414.7 3,326 157.7
Total 145,63 I 146,593 72,650 286,097 91,546 18,827
Source: DBE
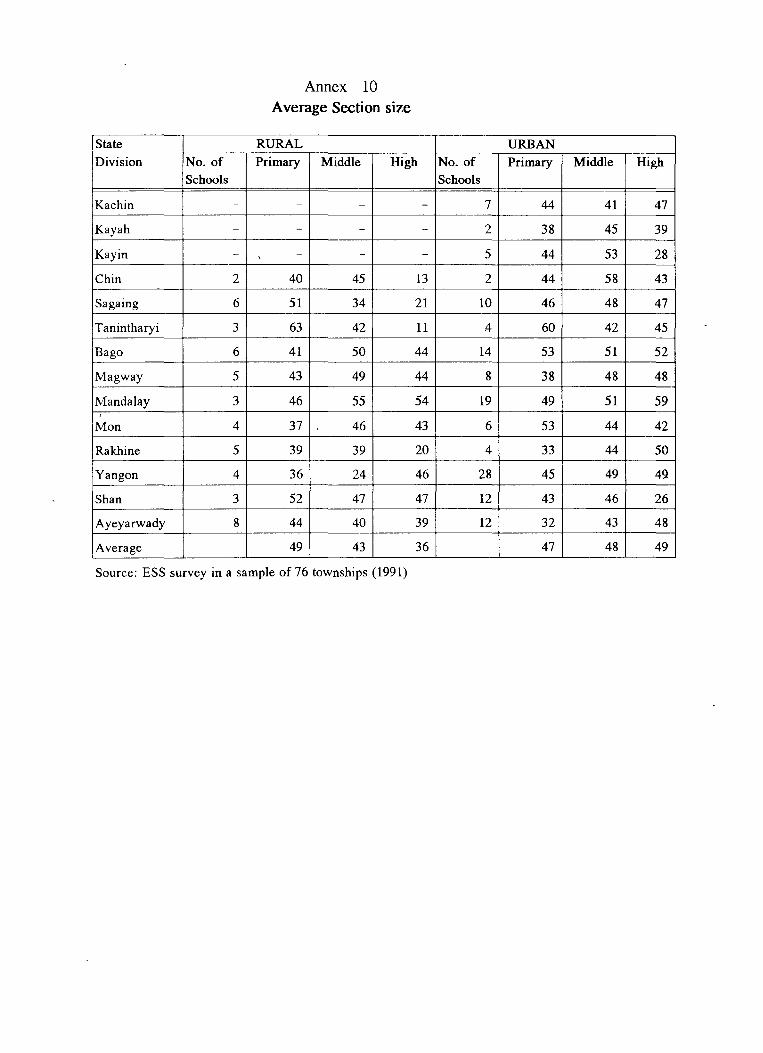
Annex 10Average Section size
State RURAL URBANDivision No. of Primary Middle High No. of Primary Middle High
Schools Schools
Kachin - - - - 7 44 41 47
Kayah - - - - 2 38 45 39
Kayin - , - - - 5 44 53 28
Chin 2 40 45 13 2 44 58 43
Sagaing 6 51 34 21 10 46 48 47
Tanintharyi 3 63 42 11 4- 60 42 45
Bago 6 41 50 44 14 53 51 52
Magway 5 43 49 44 8 38 48 48
Mandalay 3 46 55 54 19 49 51 59,
Man 4 37 46 43 6 53 44 42
Rakhine 5 39 39 20 4 33 44 50
Yangon 4 36 24 46 28 45 49 49
Shan 3 52 47 47 12 43 46 26
Ayeyarwady 8 44 40 39 12 32 43 48
Average 49 43 36 47 48 49
Source: ESS survey in a sample of 76 townships (1991)
Annex 11
Pupil Teacher Ratio
State/ Urban prr Ratio Rural prr Ratio
Division Primary Middle High Primary Middle High
Kachin 46 26 15 46 23 15
Kayah 35 26 14 30 18 10
Kayin 42 25 24 42 23 14
Chin 40 37 1 26 17 6
Sagaing 59 24 20 62 21 18
Tanintharyi 58 30 16 66 26 6
Bago 36 23 21 32 24 17
Magway 43 23 230 48 24 17
Mandalay 42 24 22 51 23 19
Mon 45 23 25 5 19 19
Rakhine 36 22 2 40 22 10
Yangon 35 29 22 35 21 16
Shan 53 27 19 43 17 21
Ayeyarwady 43 24 23 46 24 19
Total
Source: DBE
Annex 12
Number of Teachers Promoted
1982/83 1983/84 1984/85 1985/86 1986/87 1987/88
PAT 924 1713 484 3578 3080 3096
JAT 276 332 303 858 642 742
SAT 153 80 59 122 186 163Source: DBE
Annex 13
Number of Losses of Teachers
1982/83 1983/84 1984/85 1985/86 1986/87 1987/88
PAT 750 789 875 1054 1140 2033
JAT 230 515 813 393 472 389
SAT 124 114 148 177 463 204--'
Source: DBE
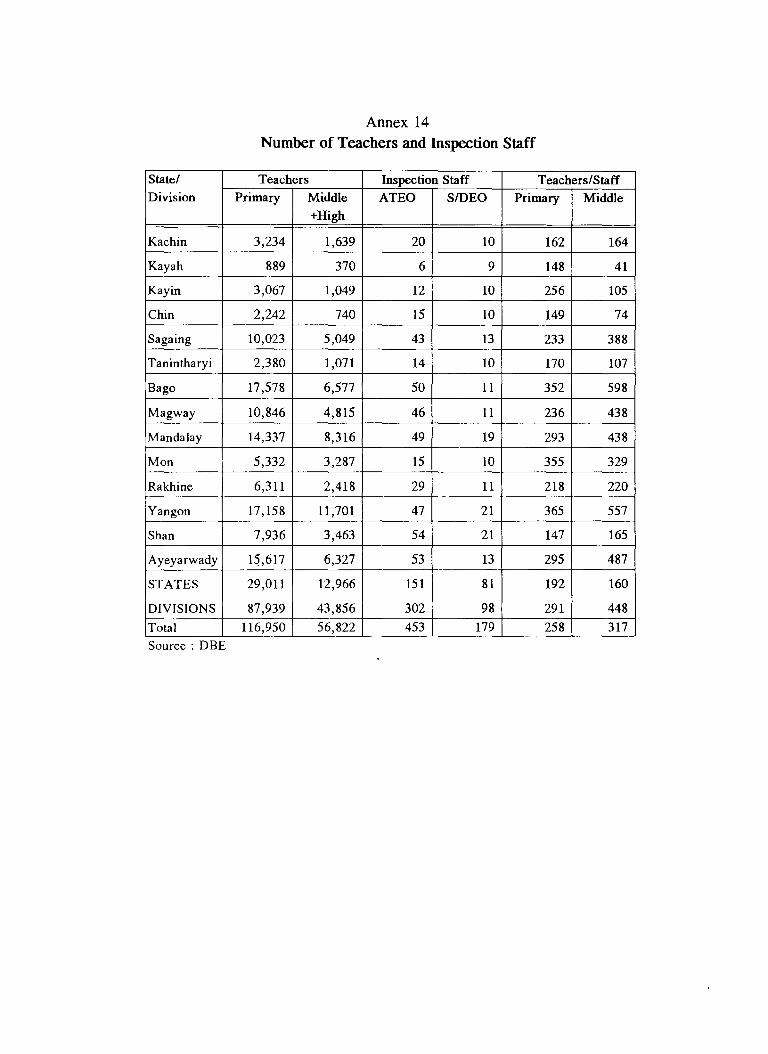
Annex 14Number of Teachers and Inspection Staff
State/ Teachers Inspection Staff Teachers/StaffDivision Primary Middle ATEO SIDEO Primary Middle
+High
Kachin 3,234 1,639 20 10 162 164
Kayah 889 370 6 9 148 41
Kayin 3,067 1,049 12 10 256 105
Chin 2,242 740 15 10 149 74
Sagaing 10,023 5,049 43 13 233 388
Tanintharyi 2,380 1,071 14 10 170 107
Bago 17,578 6,577 50 11 352 598
Magway 10,846 4,815 46 11 236 438
Mandalay 14,337 8,316 49 19 293 438
Mon 5,332 3,287 15 10 355 329
Rakhine 6,311 2,418 29 11 218 220
Yangon 17,158 11,701 47 21 365 557
Shan 7,936 3,463 54 21 147 165
Ayeyarwady 1~,617 6,327 53 13 295 487
STATES 29,011 12,966 151 81 192 160
DIVISIONS 87,939 43,856 302 98 291 448
Total 116,950 56,822 453 179 258 317Source: DBE
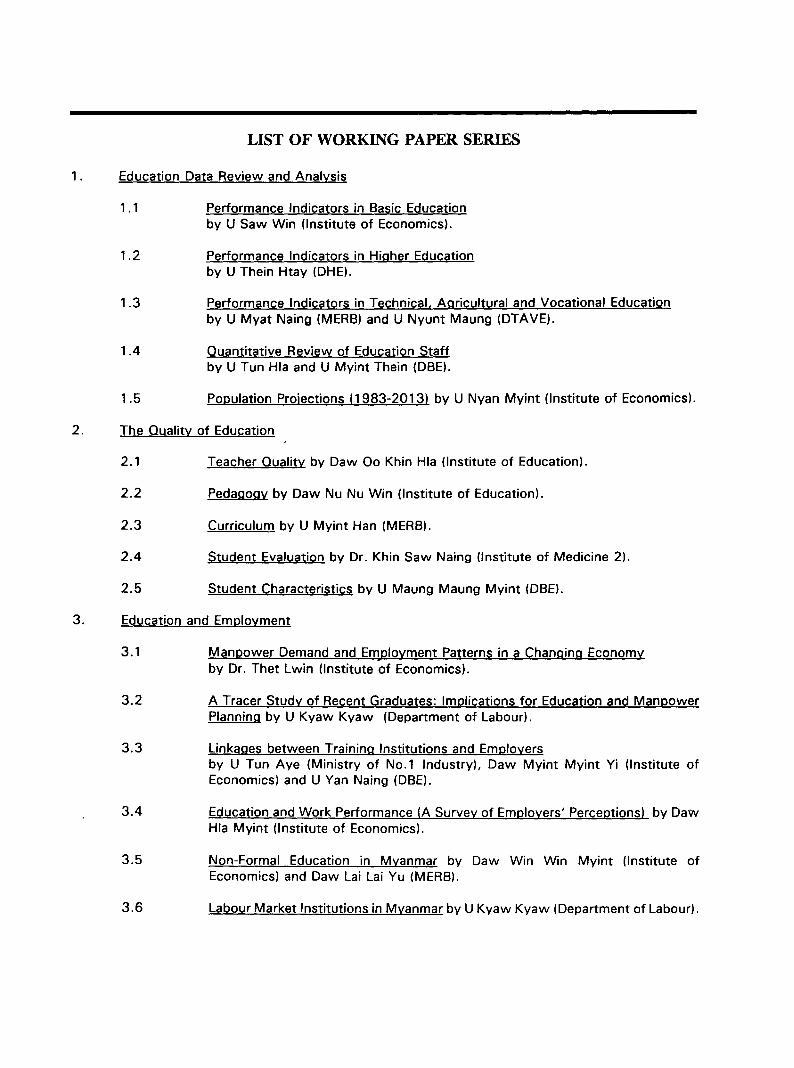
LIST OF WORKING PAPER SERIES
1. Education Data Review and Analysis
1.1
1.2
1.3
1.4
1.5
Performance Indicators in Basic Educationby U Saw Win (Institute of Economics).
Performance Indicators in Higher Educationby U Thein Htay (DHE).
Performance Indicators in Technical, Agricultural and Vocational Educationby U Myat Naing (MERB) and U Nyunt Maung (DTAVE).
Quantitative Review of Education Staffby U Tun Hla and U Myint Thein (OBE).
Population Projections (1983-2013) by U Nyan Myint (Institute of Economics).
2. The Quality of Education
2.1
2.2
2.3
2.4
2.5
Teacher Quality by Daw 00 Khin Hla (Institute of Education).
Pedagogy by Daw Nu Nu Win (Institute of Education).
Curriculum by U Myint Han (MERB).
Student Evaluation by Dr. Khin Saw Naing (Institute of Medicine 2).
Student Characteristics by U Maung Maung Myint (OBE).
3. Education and Employment
3.1
3.2
3.3
3.4
3.5
3.6
Manpower Demand and Employment Patterns in a Changing Economyby Dr. Thet Lwin (Institute of Economics).
A Tracer Study of Recent Graduates: Implications for Education and ManpowerPlanning by U Kyaw Kyaw (Department of Labour).
Linkages between Training Institutions and Employersby U Tun Aye (Ministry of No.1 Industry), Daw Myint Myint Vi (Institute ofEconomics) and U Van Naing (OBE).
Education and Work Performance (A Survey of Employers' Perceptions) by DawHla Myint (Institute of Economics).
Non-Formal Education in Myanmar by Daw Win Win Myint (Institute ofEconomics) and Daw Lai Lai Vu (MERB).
Labour Market Institutions in Myanmar by U Kyaw Kyaw (Department of Labour).
4. Costs and Financing of Education
4.1
4.2
4.3
Management and Administration of the Education Budget by Dr. Khin Ohn Thant(Ministry of Planning and Finance).
Government Expenditure on Education by Oaw Soe Soe Aung (Institute ofEconomics) .
Non-Government Expenditure on Education by U Saw Gibson (Yangon University).
5. Education Infrastructure
5.1
5.2
5.3
5.4
The Construction Sector by U Tet Tun (Ministry of Construction), U Nyi Hla Nge(Yangon Institute of Technology), Oaw Naw Joy Loo (Institute of Medicine 1) andOaw Win Win Maw (Institute of Medicine 1).
A Comprehensive Survey of Education Facilities by U Sein Myint (OBE), U NyiHla Nge (Yangon Institute of Technology), Oaw Win Win Myint (Institute ofEconomics), Oaw Naw Joy Loo (Institute of Medicine 1), U Saw Wynn (OBE) andOaw Win Win Maw (Institute of Medicine 1).
The Provision of Infrastructure by U Nyi Hla Nge (Yangon Institute ofTechnology), U Nyunt Hlaing (Ministry of No. 1 Industry), U Tet Tun (Ministry ofConstruction) and U Sein Myint (OBE).
Norms and Standards for Education Facilities by U Nyi Hla Nge (Yangon Instituteof Technology), Oaw Win Win Maw (Institute of Medicine 1), and U Tet Tun(Ministry of Construction).
6. Organization and Management of the Education System
6.1
6.2
6.3
Organization and Management of Basic Education by Oaw Hla Kyu (OBE) and UMyint Thein (OBE).
The Cluster System for Primary Schools by U Myint Han (MERB).
Organization and Management of Universities and Colleges by U Saw Gibson(Yangon University) and U Thein Htay (OHE).
7. Special Studies
7.1
7.2
7.3
7.4
Economics and Business Education by Oaw Cho Cho Thein (OBE).
The Teaching of Science and Technology by U Khin Maung Kyi (OBE).
The Teaching of English by Or. Myo Myint (Yangon University).
Higher Education by U Myo Nyunt (Institute of Education)