Performance Evaluation of the Kigoma Solar Program in ...
108
Millennium Challenge Account Tanzania (MCA-T) _____________________________________________________ Contract No: MCAT/COM/E9-173/1354 Performance Evaluation of the Kigoma Solar Program in Tanzania: Design and Implementation _____________________________________________________ Kigoma Solar Baseline and Interim Performance Evaluation Report _____________________________________________________ FINAL REPORT Submitted by: Abel Y. Busalama November, 2013
Transcript of Performance Evaluation of the Kigoma Solar Program in ...

Millennium Challenge Account Tanzania (MCA-T)
_____________________________________________________
Contract No: MCAT/COM/E9-173/1354
Performance Evaluation of the Kigoma Solar Program in Tanzania: Design and Implementation
_____________________________________________________
Kigoma Solar Baseline and Interim Performance Evaluation Report
_____________________________________________________
FINAL REPORT
Submitted by:
Abel Y. Busalama
November, 2013

Final Report: Kigoma Solar Baseline and Interim Performance Evaluation
i
Acknowledgements
The consultant would like to thank MCA-T and MCC for their support through the evaluation design and carrying out of the Baseline Survey and Interim Evaluation. Their dedications and attention to details when reviewing outputs of the consultant contributed to ensuring quality deliverables.
I would also like to thank the staff of Kigoma Rural and Kasulu Districts for their facilitation and support to the Consultant and enumerators. Without them access to respondents who provided data presented in this report would have been difficult.
I also gratefully acknowledge involvement of the Village Leaders, leaders of BMUs and SACCOS in providing sampling frames from which final respondents were selected.

Final Report: Kigoma Solar Baseline and Interim Performance Evaluation
ii
List of Acronyms
DED District Executive Director
ERR Economic Rate of Return
FGD Focus Group Discussion
HBS Household Budget Surveys
IDI In-Depth Interview
IGA Income Generating Activity
LGA Local Government Authority
LPG Liquid Petroleum Gas
M&E Monitoring and Evaluation
MCA-T Millennium Challenge Account Tanzania
MCC Millennium Challenge Corporation
NGO Non Governmental Organization
O&M Operations and Management
PAPI Pen-and-Paper Interviewing
PV Photovoltaic
RAS Regional Administrative Secretary
SACCOS Savings and Credit Cooperative Society
VEO Village Executive Officer
Final Report: Kigoma Solar Baseline and Interim Performance Evaluation
iii
ACKNOWLEDGEMENTS ...................................................................................................................................................... I
LIST OF ACRONYMS .......................................................................................................................................................... II
LIST OF TABLES ................................................................................................................................................................. V
EXECUTIVE SUMMARY ...................................................................................................................................................... 1
1. INTRODUCTION ..................................................................................................................................................... 10
1.1 OVERVIEW OF COMPACT AND KIGOMA SOLAR PROJECT .............................................................................. 10 1.2 EVALUATION OBJECTIVES AND SCOPE ........................................................................................................... 10 1.3 PROJECT DESCRIPTION ..................................................................................................................................... 11 1.4 PROGRAM LOGIC ................................................................................................................................................ 13 1.5 EVALUATION QUESTIONS ................................................................................................................................. 14 1.6 REPORT ORGANIZATION .................................................................................................................................. 15
2. EVALUATION DESIGN ............................................................................................................................................. 15
2.1 EVALUATION APPROACH ................................................................................................................................. 15 2.2 EVALUATION METHODOLOGY ......................................................................................................................... 15
2.2.1 SAMPLING ...................................................................................................................................................... 17 2.2.2 TOOLS ............................................................................................................................................................. 21 2.2.3 DATA COLLECTION ........................................................................................................................................ 21 2.2.4 DATA PROCESSING ........................................................................................................................................ 22
2.3 STUDY LIMITATIONS ......................................................................................................................................... 22
3. FINDINGS ............................................................................................................................................................... 23
3.1 BASELINE STATUS ............................................................................................................................................. 23 3.1.1 Descriptive Statistics of Key Indicators ......................................................................................................... 23 3.1.2 Energy needs before the program ................................................................................................................. 24 3.1.3 Use of other energy sources ........................................................................................................................... 25 3.1.4 Use of electricity-based sources of energy ..................................................................................................... 33 3.1.5 Investment and economic activities .............................................................................................................. 37 3.1.6 Human capital accumulation ........................................................................................................................ 44 3.1.7 Compact Goal indicator - Poverty reduction through economic growth ..................................................... 46 3.1.8 Conditions needed to be in place to encourage investments in energy ........................................................ 46
3.2 PROCESS EVALUATION ..................................................................................................................................... 48 3.2.1 Project Design ................................................................................................................................................ 48 3.2.2 Project Risks ................................................................................................................................................... 49 3.2.3 Summary of implementation: ........................................................................................................................ 50 3.2.4 Implementers ................................................................................................................................................. 51 3.2.5 Projected and Actual costs ............................................................................................................................. 51 3.2.6 Stakeholders Participation ............................................................................................................................ 51 3.2.7 Activity Monitoring ........................................................................................................................................ 52 3.2.8 Selection of Participants and Recruitment ................................................................................................... 52 3.2.9 Target Beneficiaries ....................................................................................................................................... 54
3.3 INTERIM EVALUATION ..................................................................................................................................... 56 3.3.1 Program implementation .............................................................................................................................. 56 3.3.2 Improvement in the quality of energy available ........................................................................................... 66 3.3.3 Increase investment and economic activities ................................................................................................ 70 3.3.4 Improve human capital accumulation .......................................................................................................... 75 3.3.5 Compact Goal indicator - Poverty reduction through economic growth ..................................................... 77 3.3.6 Sustainability of the outputs and outcomes .................................................................................................. 77 3.3.7 Lessons learned by Project Participants and Beneficiaries .......................................................................... 79 3.3.8 Success in further catalyzing investments in energy .................................................................................... 80
TABLE OF CONTENTS
Final Report: Kigoma Solar Baseline and Interim Performance Evaluation
iv
3.3.9 Unplanned results .......................................................................................................................................... 80 3.3.10 Policy Implications .................................................................................................................................... 81
4. CONCLUSION ......................................................................................................................................................... 81
5. RECOMMENDATIONS ............................................................................................................................................ 82
6. REFERENCES .......................................................................................................................................................... 84
7. APPENDICES .......................................................................................................................................................... 85
8. ANNEX I: DATA COLLECTION INSTRUMENTS .......................................................................................................... 90
9. ANNEX II: PROTOCOLS ........................................................................................................................................... 91

Final Report: Kigoma Solar Baseline and Interim Performance Evaluation
v
List of Tables
Table 1 Target Market Penetration Rates for the Marketing Approach Component
Table 2 Summary Evaluation Methodology
Table 3 Sample Selection Guide
Table 4 Sample Sizes and Methods
Table 5 Sample Coverage
Table 6 Key Descriptive Statistics
Table 7 (a) Baseline challenges with respect to power access and use at treated sites
Table 7 (b) Baseline challenges with respect to power access and use at comparison sites
Table 8 (a) Use of electricity substitutes at treated sites before the program
Table 8 (b) Use of electricity substitutes at comparison sites before the program
Table 9 Distribution of project participants responses on use of electricity substitutes before program implementation
Table 10 (a) Average annual quantity of other energy sources used at treated sites before the program
Table 10 (b) Average annual quantity of other energy sources used at comparison sites before the program
Table 11 (a) Consumption of Electricity at treated sites
Table 11 (b) Consumption of Electricity at comparison sites
Table 12 (a) Use of electricity based sources of energy at treated sites
Table 12 (b) Use of electricity based sources of energy at comparison sites
Table 13 Duration (Hours) electricity-based sources of energy were used before the program
Table 14 (a) Average annual business revenue before implementation at treated sites
Table 14 (b) Average annual business revenue before implementation at comparison sites
Table 15 (a) Price of energy at treated sites before the project
Table 15 (b) Price of energy at comparison sites before the project
Table 16 (a) Average annual expenditure on energy at treated sites
Table 16 (b) Average annual expenditure on energy at comparison sites
Table 17 (a) Cost of energy devices at treated sites before the project
Table 17 (b) Cost of energy devices at comparison sites before the project
Table 18 (a) Treated Health Centres and Dispensaries that provided vaccines before the program
Table 18 (b) Comparison Health Centres and Dispensaries that provided vaccines before the program
Table 19 Vaccines available at comparison sites six months before the survey
Table 20 Number of Vaccine Doses Administered

Final Report: Kigoma Solar Baseline and Interim Performance Evaluation
vi
Table 21 Distribution of Project Participants responses on conditions needed to be in place in order to encourage investment into energy
Table 22 Beneficiary participation in the design of the project
Table 23 Type and Number of Beneficiaries
Table 24 Achievements of the project
Table 25 Availability of power in the last 24 hours
Table 26 Daily solar power consumption
Table 27 Daily number of hours PV system are used, by treated group and by purpose
Table 28 How the PV systems have met needs
Table 29 Treated sites with change of operations after the installations
Table 30 Specific change of operations after the installations
Table 31 Treated sites with specific night sessions after the installations
Table 32 Installations that faced Challenges during implementation
Table 33 Change of Use of Electricity Substitutes after Program Implementation
Table 34 Change of Quantity Consumption of other energy sources
Table 35 Change of Consumption of Electricity-based Source of Energy
Table 36 Change of use of solar power
Table 37 Interim Average Annual Business Revenue
Table 38 Energy price after the PV installation
Table 39 Interim average annual expenditure on energy
Table 40 Change of cost of energy generation devices
Table 41 Number of project participants and beneficiaries that acknowledged receiving training
Table 42 Number of project participants and beneficiaries that had done any repair and maintenance of the solar PV systems
Table 43 Number of schools with and without afterhour study programs
Table 44 Vaccines available at treated sites during the survey
Table 45 Average annual household income per capita
Table 46 Distribution of existence of plans for ensuring sustainability for the system
Table 47 Plans to purchase additional PV system and pay price equal the cost of the systems

Final Report: Kigoma Solar Baseline and Interim Performance Evaluation
1
EXECUTIVE SUMMARY
1. OVERVIEW OF COMPACT AND KIGOMA SOLAR PROJECT
The Kigoma Solar Project is a diversified program comprising a component to provide metered Photovoltaic (PV) systems for selected public institutions and village markets, a component for Beach Management Units (BMUs)1, and another component for commercially sold PV systems for home and small businesses use. The first component was a grant-funded supply and installation of PV systems to secondary schools, health centers and dispensaries, vaccine refrigerators also for health centres and dispensaries, and village markets. It also connected four business units around each treated village market. The businesses pay the market for electricity consumed. The second component of PV systems for the BMUs was piloted for 2 months and then the boat owners/fishers purchased them through the BMUs. The third component was a marketing approach to encourage commercial purchases by households and business through Savings and Credit Cooperative Society (SACCOs).
The Kigoma Solar project is expected to improve electricity service coverage and thereby increase consumption of electricity. It is assumed that this will increase investment and economic activities by businesses and individuals. It is also expected to improve human capital accumulation in terms of improved quality of education and medical service delivery. The hypothesis is that these activities will ultimately result into increased income and more access to the two social services, which will in turn contribute to poverty reduction and economic growth.
The focus of the study leading to this report was on evaluation of energy availability, access, use, and costs in Kigoma and Kasulu Districts. Findings presented by this report attempt to determine the baseline status before the implementation of the Kigoma Solar Program and establish interim changes after the implementation of the energy project, and how the changes can be measured. The evaluation identifies policy issues and provides recommendations on the conditions in the two districts that should be changed in order to improve relevant development activities affecting the socio-economic status of individuals, households and communities.
2. EVALUATION APPROACH AND METHODOLOGY
The evaluation used a “Mixed Evaluation Model” comprising pre-post or before and after comparison evaluation method and comparison between treatment and comparison groups evaluation method albeit with main focus on pre-post evaluation because of lack of a valid counterfactual to implement a rigorous impact evaluation.
The consultant for this evaluation was contracted when implementation of the project had already begun. By the time the independent evaluator was contracted, about 76% of the installations were in progress to be completed (Progress Report 4 of 5 of Supervising Consultant). However, at the time of data collection, approximately 67% of installations had already taken place except that all vaccine refrigerators were yet to be installed. Marketing/sale of the systems through SACCOS, and maintenance and after sale services was also still implemented. Therefore the study had to be designed such that the first round of data collection gathered both baseline and interim data. It is suggested that a two-stage rounds project evaluation cycle be adopted for this evaluation - comprising:
First Round of combined baseline and interim round to measure process, outputs and outcome indicators; and
1 Beach Management Units (BMUs) are fishers’ cooperatives controlling fishing in a certain area.

Final Report: Kigoma Solar Baseline and Interim Performance Evaluation
2
Follow-up evaluation round to measure changes related to objectives and the Compact Goal - Poverty reduction and economic growth. This should be done at least two (2) years after project completion.
The evaluation uses quantitative and qualitative data collected as either primary or secondary data as complements in an evaluation strategy. The existing secondary data sources, including administrative data collected from relevant institutions complement primary data sources in establishing baselines for indicators of interest.
4. FINDINGS
The findings are organized by thematic areas of the evaluation that combine presentation and discussion of relevant indicators of the program logic and evaluation questions. They are divided into three parts. The first part presents baseline status. The second part presents evaluation of the implementation process while the third part presents interim evaluation results to measure preliminary changes after program implementation.
a) Baseline Status
The evaluation established that the project of the Compact was not the first electricity service project because about 24% of the respondents were using solar PVs before the program. However, the design of the evaluation as prepared by the consultant assumed power was not available (baseline = 0) even in places where PV systems were available. Consequently, the analysis did not calculate baseline outputs and some outcome indicators from these places.
The biggest challenge faced by project participants and beneficiaries before implementation of the project was lack of electricity that faced 86% of the respondents. Lack of electricity was a concern to all project participants and beneficiaries except health centres because all those covered by
the survey had solar systems before the program. Kerosene was the most used fuel (84%) followed by electricity generated by dry cells and batteries (82%), charcoal (53%), firewood (31%) and then medium size candle (20%). The high rank of electricity generated by dry cells and batteries
can be explained by observed mass marketing in the project area of many types of flash lights/lamps mostly from China that use dry cells and batteries and use of the batteries for radio and torch. The average annual quantity of other (non-electric) energy sources consumed was 939 kg before the program. The pattern was the same at comparison sites. To get the weight in kg a conversion factor of 0.8 per liter of liquid fuel was used while all standard measures of solid fuels were weighed during data collection to establish weight of fuel used.
Electricity-based sources of energy were also used before the program. However, there was no consumption of energy from the TANESCO grid or other grid electricity, biogas electricity nor wind mill electricity in the program area. About 75 out of 88 or 85% of the respondents interviewed indicated they were using dry cell batteries – size D. 21 respondents out of 88 treated respondents that answered the question on electricity consumption or 24% were using solar PVs before the program. About 91% of the respondents used energy for lighting; including torch that accounted of 26% of the responses is used for lighting. Use of electricity based sources of energy at comparison sites was also similar as at the treated sites because About 70% of the comparison respondents interviewed used electricity-based sources of energy for lighting as compared to the 65% established in treated sites. The difference of 5% is explained by the fact that baseline data was collected when the project was already operational for an average of 5 months. Exposure to the intervention might have affected recall of energy use patterns.
Final Report: Kigoma Solar Baseline and Interim Performance Evaluation
3
The average annual business revenue before implementation of the program was US$ 3,028 for businesses around the market that use power from the market power system, US$ 5,928 for businesses that bought the PV systems through SACCOS and US$ 9,909 for fishers that bought the systems through BMUs. Fishers had the highest revenue during good and medium sales days but the worst during poor sales days. This is because fishing is seasonal and sales are highest during months of August, September, October, and November as found out in the BMU survey. Employment before the Kigoma Solar Project was found in the fishing activity where the eight boat pairs reportedly employ 49 people. The total wage bill of a boat pair per month was reported to be US$ 4,559 that works out to be US$ 93.05 per fisher employee per month or US$ 1,116.58 per employee per annum.
The baseline survey established that 5 out of the 6 treated health centres (83%) and 13 out of the 14 dispensaries (93%) surveyed had vaccine refrigerators powered by LPG. However, despite having the refrigerators, one health centre and one dispensary were not providing vaccines because they were short of LPG fuel that runs the refrigerators. This limitation is expected to be resolved when the solar vaccine refrigerators are installed at the health centres and dispensaries. Therefore, solar vaccine refrigerators may contribute to increase of availability of vaccines at the health centres and dispensaries as hypothesized in the project logic.
The study adopted the average annual household income per capita of comparison household as a proxy of the baseline status for the treated households. This was established to be US$ 233.25. This is lower than the baseline target of US$ 246 based on 2008 figures (Table of Energy Indicator Baselines and Targets). It is also lower than the national per capita income of TZS 693,185 or US$ 433 established by the Economic Survey of 2009. It is also far lower than HBS (2007) monthly income in rural areas - TZS 28,418 (equivalent to US$ 22.80 per month or 273.55 per annum). Previous Human Development Reports have placed Kigoma Region among
poor/deprived regions of Tanzania based on both Human Development Index (HDI) and Human
Poverty Index (HPI).
b) Implementation Process
This project was designed to complement the Distribution Systems, Rehabilitation and Extension Activity intervention in Kigoma to increase overall access to electricity in the region. It was developed after environmental concerns caused the removal of a hydro-electric power station project - Malagarasi II from the Compact activities. MCA-T chose PV systems to address the energy needs and shortage of modern affordable energy in the Kigoma region.
The evaluation found out that a Project Implementation Plan (PIP) was prepared to guide execution of the activities. Roll-out was scheduled to be done between March 2012 and May 2013 but there were some changes of timeline for some activities as reported in progress reports up to September 2013. The institution arrangement for implementation of Kigoma Solar Project comprised of MCC, MCA-T, Service Provider (SP) who was the contractor, Supervising Consultant, office of the Regional Administration Secretary (RAS) for Kigoma Region, Local Government Authorities for Kigoma Rural and Kasulu Districts, and target communities. Each had specific roles and responsibilities. Recruitment was done as per MCC Program Procurement Guidelines. Oversight/supervision to ensure that project works were going as planned was done by an Individual Supervising Consultant Mr. Axel Scholle from South Africa. The same consultant had carried out the feasibility study, design and Request for Proposals (Bidding Document) for the program. He was assisted by a local representative based in Kigoma. Selection of project participants and beneficiaries was done jointly by the contractor and consultant in collaboration with Kigoma Region authorities.

Final Report: Kigoma Solar Baseline and Interim Performance Evaluation
4
The selection criteria used included selection of villages that would have benefited from Malagarasi Hydro Power Project, villages with the greatest number of potential beneficiaries/population, preference to Government institutions, selecting dispensaries in the same wards as other installed systems, selecting only Beach Management Unites (BMUs) registered by the Government, and selection of village markets with permanent market building infrastructure and village committees that grant security and Operations and Management (O&M), especially revenue collection. The evaluation established that the criteria was not comprehensive enough to include all components such as the marketing approach through SACCOS and it favoured semi-urban rural areas at the expense of the hard to reach rural areas, probably for implementation convenience. The selection criteria neither acknowledged existence of the solar system at some institutions, businesses and households nor provided guidance on how and why the project should install PV systems in places where they already existed.
The project wanted to introduce solar electricity solution as modern affordable energy in the area. That would have been achieved by covering as many villages and public institutions as well as SACCOS as possible within available budget. The evaluation found out that the capacity of PV systems provided by the program was lower than needs. It seems that the consultant recommended solar PV systems for basic needs. If design was to be made based on beneficiaries requirements, the money would have not been enough.
The Feasibility Study for Kigoma Solar projected implementation costs in the region of US$ 4,318,415, which includes cost of the Service Provider/contractor (US$ 3,722,151), Marketing (US$ 143,525), Training (US$ 247,100) and 5% of the cost items (US$ 205,639) for contingencies. The project is expected to benefit 106,923 people, comprising about 29,761 male and 77,162 female beneficiaries.
c) Interim Evaluation
Achievements of the project established by the assessment in July 2013 indicate that most of the output targets had been achieved except for the vaccine refrigerators that were yet to be installed at any of the targeted health centres or dispensaries. The household and business systems had the lowest achievement of 1.1% in terms of number of systems installed against the target (70 against 6,383 systems for the average exposure period of 5 months because the target for 4 year period was to sell 61,272 systems) and only 7.8% for capacity installed (3.1 kWp against 39.6 kWp for the average exposure period of 5 months because the target for 4 year period was 380.6 kWp). Comparison of rated capacity of the installed systems (see project description in Section 1.3) with records of electricity consumption extracted by the survey indicate that average consumption of the secondary schools surveyed per day ranged from 0.4 to 2.7 kWh against a rated capacity of 3 kWh per day; average power consumption of the health centres surveyed per day ranged from 0.4 to 0.8 kWh against a rated capacity of 1.1 kWh per day; average consumption of the dispensaries surveyed per day ranged from 0.3 to 1.3 kWh against a rated capacity of 1.0 kWh per day – indicating overuse at some dispensaries; and the average consumption of the village market surveyed per day was 1.8 and the average total for the four businesses connected was 0.8 kWh – making a total of 2.6 kWh against a rated capacity of 2.6 kWh per day – indicating overuse because some shops installations were not fully completed because some shops had lights only without sockets or sockets but not yet installed with lights.
Comparison of the project design with the baseline status on energy needs reveals that the PV systems addressed energy needs of the community. Lack of electricity before the program was

Final Report: Kigoma Solar Baseline and Interim Performance Evaluation
5
reported by 86% of the respondents; kerosene was the most used fuel (84%), and about 65% of the respondents were using the electricity substitutes for lighting.
The benefit of the outputs that was mentioned by most of the respondents to the survey was to get light at night (21.3% of the responses) followed by recharging cell phones for free or for a fee (17.4% of the responses), students being able to study during night time and reducing damages/health hazards that can be caused by use of kerosene (all mentioned by 8.7% of the responses), to conduct businesses at night/prolonged working hours (5.5%), improve health care services (5.1%), night health care services (3.6%) and simplifying business operations/improving efficiency by using electrical machines(2.8%) and then other benefits.
The interim evaluation also found out that the major changes on use of electricity in the project area were increase of solar PVs by 305% from 21 users before the project up to 85 users after the project and decrease of dry cell batteries –size D by 16% from 74 users before the project down to 62 users after the project. It seems that installation of the Compact solar PVs decreased use of flash lights/lamps mostly from China that use dry cells and batteries as noted in the baseline and use of batteries for radio and torch.
However, the interim survey estimated that 44% of the heads of institutions and households that accessed the systems believed the systems provided met their needs, indicating that 56% felt the program did not meet their needs. The survey further established that beneficiaries were not very satisfied with the project because PVs provided were of lower voltage than needs; the systems were not being installed at all buildings of the schools, health centres and dispensaries, and the businesses, households and fishers in the communities. The assessment, therefore, estimated satisfaction by beneficiaries to medium level.
The top challenges encountered during implementation of Kigoma Solar project included the project covering few businesses and fisher beneficiaries. Only four shops around the village market and only two trial fishers for each BMU were supplied with systems. That resulted into the challenge of misunderstanding and conflicts during implementation – including complaints that selection of businesses around the market that use power from the market power system and trial fishers was not transparent. The third challenge included lower voltage than needs and high cost of acquiring the systems. The fourth challenge was lack of knowledge on availability, use and benefits of solar electricity followed by short loan repayment. It seems that some participants and beneficiaries did not effectively participate in the training of installers, vendors and end users that was provided by the project or the training was not effective. Other challenges included the health centres and dispensaries not being provided with sterilization machine; businesses not allowed to switch on light during night; wires of the fishing system are short; health centres and dispensaries not being provided with solar refrigerator; carrying the heavy fishing system battery every fishing day; the solar fishing lamps cannot be installed on the boat-pair's bowyer; and maintenance of fishing system was not well understood.
Despite the medium level of satisfying needs and the challenges, the interim evaluation established that on average, about 67% acknowledged positive changes of operations after the solar PV installation. Changes that have come about after the installations that were mentioned by more respondents/sites were introducing night service sessions (68%) and opening more hours (63%). There was decrease of use of all non electricity sources of energy except firewood. Use of kerosene had decreased most from the baseline of 84% to 31% followed by candles – medium size candles from 20% to 6% and small size candles from 11% to 4%; Charcoal from 53% to 48% and then other types as indicated in the main chapters. Interim results also indicate that the income for businesses around the village market using power of the market had increased by US$ 1,023 from the baseline status of US$ 3,027 to US$ 4,050. Income of the other

Final Report: Kigoma Solar Baseline and Interim Performance Evaluation
6
businesses that bought the PV systems through SACCOS had increased by US$ 723 from the estimated baseline value of US$ 5,928 to US$ 6,650. However, the revenue of fishers had decreased by US$ 4,692. The decrease of fishers income contradicts with other findings of the survey on benefits where respondent reported increase of income and many fishers wanted to buy the systems. The survey could not establish reasons explaining the unexpected decrease. On average, about 25% of the respondents had received some training and materials for repair and maintenance of the PV system provided by MCA-T. Four (4) out of the 8 categories of project participants had already done some repair and maintenance of the installations of the project. About 13% of treated schools, dispensaries, businesses and households that bought the systems through SACCOS had already done some repair and maintenance. These trends were noted, but given the design of the evaluation (pre/post) and finding that there were other solar energy projects occurring at the same time in the area (21 respondents out of 88 respondents or 24% were using solar PVs before the program and 5 out of 6 health centres or 83% and 13 out of 14 dispensaries or 93% were using vaccine refrigerators powered by LPG) before the project and all during the evaluation, it is not possible to say whether these changes are truly the result of Kigoma Solar program alone. It just seems likely that these results would be related to the project.
The interim survey established that just like the baseline status, there was no employment at all the sixteen businesses that bought the PV systems through SACCOS that were interviewed (no change). However, employment at treated businesses around the village market had slightly increased from 2 employees before the program to 3 employees. Average wage, however, decreased from the baseline of US$ 51.56 to 41.67 per month or from US$ 618.75 down to US$ 500.00 per annum for the shop employee. Employment at the eight boat pairs had increased from 49 to 52. Wage per fisher employee per month had increased from US$ 93.05 to US$ 109.62 or from US$ 1,116.58 to US$ 1,3,15.38 per employee per annum.
With regard to human capital accumulation, seven (7) out of the ten (10) treated schools covered by the survey, or 70% had afterhours study programs. When compared to the baseline proxy established at comparison schools, where about 40% had such programs, the project is likely to have caused the increase of schools with afterhour study programs by 30%. However, there was not any interim change on vaccines because the solar refrigerators were yet to be installed at the health centres and dispensaries.
The interim average annual household income per capita was US$ 230. This was slightly lower than the baseline average annual household income per capita was US$ 233.25. The t-test conducted revealed that this change of income per capita was not significant (P value = 0.567 at 90% confidence Interval). Therefore, it was too early for the program to contributed poverty reduction within few months after implementation.
The interim evaluation also found that about 76% of heads of treated facilities and households
said they have plans for ensuring the sustainability for the system. This will keep and perpetuate
changes related to the project. The plans include some commitments to buy own PV systems, including extra or buying systems with bigger capacity than those provided by the program; to mobilize funds including loans to buy big capacity system; to charge for electricity used by businesses connected to the village market power source to pay for accessories and repair; institutions to charge cell phones at a fee; to save money for maintenance/open special bank account for user fee collected; to sensitize community members (and fishers) to contribute for maintenance and buy big capacity systems; to adhere to training instructions and use responsibly/use carefully - only when needed; keep in good condition and secure, get detailed training on use and maintenance, report or make maintenance/repair as soon as possible, and

Final Report: Kigoma Solar Baseline and Interim Performance Evaluation
7
use competent technician; and BMU indicated readiness to have in-house technicians. These commitments will contribute to attainment of the prime objective of Kigoma Solar Project - to introduce solar electricity solution as modern affordable energy in the area because they indicate that institutions, businesses and households will continue buying PV systems after closure of the program.
5. POLICY IMPLICATIONS The survey findings indicate that access to electricity is an important driver for socio-economic development. However, there are challenges to its access that need policy changes. Participants in the project (schools, health centres, dispensaries and village markets) mentioned personal and socio-economic efficiency benefits they were getting by the time of interim evaluation. The health, education, economic/cost saving and social benefits mentioned imply that electrifications projects should give priority to providing power to public institutions. For instance, the central and local governments as well as donors should set aside some funds to be given to TANESCO or REA to connect public institutions to the national power grid or alternative electricity sources like the Solar systems. The marketing approach through SACCOs and the trial approach through BMUs, had succeeded to interest businesses and households and fishers to purchased the PV systems and the solar night fishing systems. One of the constraints limiting purchases is lack of credit at affordable terms such as low interest rate and long repayment period. The Government, banks and other financial institutions as well as development partners should review their credit policies so as to enable more people to benefit from the solar energy solution. The bank of Tanzania can consider this to be among its credit policy directives. Beneficiaries are in dire need to buy bigger systems than what was provided under the program. This will require some policy considerations such as allowing village markets and the cooperatives to generate and distribute electricity in their local areas at less stringent requirements than those required by REA and EWURA – such as registration and licensing, quality codes and standards and financial regulatory requirements of solar and other electricity generation projects – because of their technical and financial constraints. 6. CONCLUSION
The Kigoma Solar Project has succeeded to improve electricity service coverage and consumption of electricity in the project area. The project addressed the challenge of lack of electricity that was considered the biggest challenge by 86% of the project participants and beneficiaries that were interviewed. The project design correctly focused primarily on providing lighting, which accounted for 65% of the primary uses of electricity substitutes by the project participants and beneficiaries. The project was implemented as per the approved Project Implementation Plan (PIP) except for the solar refrigerator systems that had not been implemented by the time of the evaluation. The household and business systems was rated low because of the achievement of 0.1% in terms of number of systems installed against the target and only 1% for capacity installed. While we cannot directly attribute survey findings to the Kigoma Solar Project because there were similar projects and about 24% of the installations were made at sites that already had solar systems, the Project may have contributed to the target outputs and outcomes leading to decrease of use of energy substitutes from 84% to 31%. The solar refrigerators may contribute to increase of availability of vaccines at the health centres and dispensaries as hypothesized in the project logic because of stock outs cases found at one health centre and one dispensary due to lack of LPG fuel that runs the refrigerators. The commercial

Final Report: Kigoma Solar Baseline and Interim Performance Evaluation
8
component (Cell phone charging and multimedia services at a fee as shown in the project description) of the project is likely to complement institutions’ solar systems that already existed at some of the treated sites. However, all institutions covered by the survey (schools, health centres and dispensaries) had not started providing such services. It seems that the survey was done too early to capture this data because the installations were operational for an average of 5 months only. Beneficiaries are committed to make the benefits sustainable through proper repair maintenance of the systems, proper use and purchase of replacement systems or even systems with bigger capacity than those provided by the program. The program has successfully introduced solar energy to a wide area in the Kigoma region as indicated by willingness and commitments of businesses and households to continue maintaining and buying PV systems after closure of the program. For the first time the project supplied solar night fishing systems in the area. The introduction of the solar energy solution is likely to be sustainable after program closure especially if products of various voltage and prices based on different energy needs and financial capabilities will be introduced and credit availed at favourable terms. The conditions required to be in place for successful investment in energy sources are within the capacity of beneficiaries and stakeholders.
However, there were design and selection criteria shortcomings. The selection criteria did not acknowledged prio existence of the solar systems in the project area and include the marketing approach through SACCOS, and it favoured semi-urban rural areas at the expense of the hard to reach rural areas, probably for implementation convenience. The project did not address other energy needs such as cooking and boiling water, which accounted for 31% of the primary uses of electrify substitutes by the project participants and beneficiaries. Total project costs increased from US$ 4,755,603 to US$ 5,357,729.37, an increase by US$ 602,126.37, or 13% of the original cost. There was increase of costs for the feasibility study so as to include design and bid preparation works. A separate contract with the same consultant was prepared for supervision work. Value of the construction work also increased due to change of scope of work as explained in the findings.
The project also did not provide electricity to all institutions and buildings such as religious buildings, other government offices, and providing electricity for staff houses at schools, health centres and dispensaries, and all shops around village market. Voltage of the installations did not allow use of appliances that project participants and beneficiaries would wish to be included such as refrigerators. The project also did not facilitate businesses and households to buy from SACCOS or fishers to buy from BMUs.
7. RECOMMENDATIONS
Since the program targeted only 45 secondary schools out of 100 in the two districts (38 in Kigoma Rural and 62 in Kasulu), 116 dispensaries out of 148 (72 in Kigoma Rural and 76 in Kasulu), 14 health centres out of 17 (6 in Kigoma Rural and 11 in Kasulu), and 25 village markets out of 46 with permanent building structure in the two districts (20 in Kigoma Rural and 26 in Kasulu), it is obvious that there are institutions that are still in need of the systems and there is no grid project planned to cover all rural areas in the near future. The marketing component through SACCOS and the trial approach through BMUs have registered significant sales as shown in this report. Businesses, households and fishers indicated willingness to buy the systems, especially if access constraints such as availability of credit at low interest rates and long repayment periods tied to agricultural income cycle are addressed. It is also beneficial if the Kigoma Solar program should be replicated within and outside the program districts.

Final Report: Kigoma Solar Baseline and Interim Performance Evaluation
9
However, success of any similar project will depend on addressing challenges and limitations that
faced the project as discussed in this report.
Hand-over of the PV systems must ensure that at local level the solar systems continue effecting intended changes by being led by people who are sufficiently engaged in the activities of the project participant or beneficiary. For instance, for the case of village market, handover should be to the Market Committee instead of the Project Committee. For Schools, health centres and dispensaries the handover should be to their Management Committees. This is because some project committees were still managing the installations during the survey.
The commercial component through SACCOS and BMUs are opportunities for the private sector to invest in the supply of PV systems of various capacity and prices based on different energy needs and financial capabilities. The project supplied for the first time solar night fishing systems that can be replicated to Lake Victoria and other lakes with night fishing. The ministries responsible for energy and fishing as well as other stakeholders can market this opportunity.
In contrast with the readiness of businesses, fishers and households to sustain the benefits as indicated in the report, systems installed at public institutions are likely to face budgetary constraints. The readiness of the community to contribute towards maintenance and replacement is good news that will require administrative support from the Village, District Councils and Regional Secretariats.
Design of future similar project should be based on clearly identified needs and similar projects in the target area. Design of similar projects should also address the design and selection criteria shortcomings, challenges and limitations that faced the project. Similar project should include budget for effective public outreach for creating understanding of the project and communities roles and responsibilities during the implementation and operational stage of the project.
There should also be change of policy directives on connecting public institutions, credit policy and simplification of requirements for solar and other electricity generation projects for rural areas.

Final Report: Kigoma Solar Baseline and Interim Performance Evaluation
10
1. INTRODUCTION
1.1 OVERVIEW OF COMPACT AND KIGOMA SOLAR PROJECT
The Millennium Challenge Corporation (MCC) and the Government of Tanzania (GoT) have entered into a Millennium Challenge Compact to help facilitate poverty reduction through economic growth in Tanzania. The consultative process for the Program was informed by, and anchored in, the consultative process conducted in connection with the Government’s National Strategy for Growth and Reduction of Poverty (NSGRP) which was finalized in 2005 (commonly referred to by the Swahili acronyms “MKUKUTA” and “MKUZA,” for the Mainland and Zanzibar, respectively.
The Compact is to be implemented over a period of five (5) years. Guided by MKUKUTA/MKUZA priorities, the Compact establishment process identified an inadequate transportation network, an insufficient and unreliable supply of energy, and a shortage of potable water as three key constraints to economic growth and private investment in Tanzania. The Compact is designed specifically to address each of these constraints. The Compact aims at reducing poverty through the implementation of a program consisting of three projects, namely transport, energy and water projects. Each project contains a number of activities and sub-activities.
The three infrastructure development projects are core components of the Compact. However, the Compact has a Monitoring and Evaluation (M&E) unit, which plays an important role in the management of the program by ensuring that the resources going into the Compact are being utilized effectively and efficiently; activities are implemented in a timely manner; services generated are being accessed, utilized and beneficiaries are satisfied with the services; and the expected results are being achieved in a sustainable manner. The M&E plan for Tanzania Compact is guided by both the national poverty monitoring system and the economic analysis that identified beneficiaries and provided economic rationale for the MCA-T programme.
The Kigoma Solar Project is designed to address a range of energy needs in Kigoma (Rural) and Kasulu Districts of Kigoma region. The energy infrastructure is underdeveloped and access to grid electricity low. The Tanzania Electric Supply Company Limited (TANESCO) powers a diesel based mini-grid in the Kigoma town area with installed capacity of 11MW but only 3-4MW is being produced. TANESCO is also developing a second mini-grid in Kasulu town, however the population of these two urban area accounts for less than 15% of the region’s population. According to the Feasibility Study for the Kigoma Solar Project, most households, rural or urban, rely on a mix of off-grid energy sources such as wood, charcoal, kerosene, dry-cell batteries, and candles - among others. The latest figures cited by the Ministry of Energy and Minerals (MEM) as part of their Big Results Now (BRN) energy laboratory indicate that approximately only 5% of rural residents in Tanzania have access to electric power.
Kigoma Solar Project is expected to improve electricity service coverage and thereby consumption of electricity. It is assumed that this will increase investment and economic activities by businesses and individuals. It is also expected to improve human capital accumulation in terms of education and medical service delivery. The hypothesis is that these activities will ultimately result into increased income and more access to the two social services, which will in turn contribute to poverty reduction and economic growth.
1.2 EVALUATION OBJECTIVES AND SCOPE
The objective of the assignment leading to this report was to establish the baseline status before the implementation of the Kigoma Solar Project and assess interim changes during and after implementation of the energy project.

Final Report: Kigoma Solar Baseline and Interim Performance Evaluation
11
The scope included the design and implementation of a performance Evaluation of the Kigoma Solar Project. It involved evaluation design, data gathering, analysis, and dissemination. A performance evaluation should provide descriptive answers to questions concerning program implementation, impact, externalities, and beneficiary perceptions. The focus was on evaluation of energy availability, access, use, and costs in Kigoma and Kasulu Districts. Findings in this report attempt.
The evaluation should identify policy issues and devise recommendations on how the conditions in the two districts should be changed in order to improve relevant development activities affecting the socio-economic status of individuals, households and communities.
1.3 PROJECT DESCRIPTION
The Kigoma Solar Project is a diversified program comprising a component to provide metered Photovoltaic (PV) systems for certain public institutions and village markets, a component for Beach Management Units (BMUs)2 night fishing system, and another component for commercially sold PV systems for home and small businesses use. Other activities of the project that support the three key components are organized marketing of the solar systems and their benefits; training of installers, vendors and end users; and maintenance and after sale services. Marketing addressed knowledge gap on PV technology, concerns about quality issues, cost, financing, distribution, and operations and maintenance of the PV systems. Also, appliance use limits and productive use opportunities.
The first component is a grant-funded supply and installation of PV systems to secondary schools, health centres and dispensaries, vaccine Refrigerators also for health centres and dispensaries, and village markets. This component was implemented in Kigoma Rural District and Kasulu District. Each grant-funded PV system is briefly described as follows:
The secondary school system is an AC electrical system with an energy meter. It was designed to provide an average of 3 Kwh per day that would support lighting for one administration office and two classrooms and will support the use of television setup or the use of computer. The system also has capacity to charge cell phones. Both cell phones charging and cinema services were expected to generate income that will finance repair and maintenance services as well as replacement of batteries in the future. The target was to make PV installations at 45 secondary schools. All the 45 Schools were expected to start afterhours study programs after the PV installations.
The Dispensary System is an AC electrical system with an energy meter. It was designed to provide an average of 1 Kwh per day that would support lighting and media services. It was expected that charging of cell phones by patients against a small fee would contribute to and facilitate battery replacements in the future. The target was to make PV installations at 116 dispensaries.
The health centre system is also an AC electrical system with an energy meter. It was designed to provide an average of 1.1 Kwh per day that would support lighting and media services. Like in the case of dispensaries, charging of cell phones by patients against a small fee would contribute to and facilitate battery replacements in the future. The target was to make PV installations at 14 health centres.
The Vaccine Refrigerator System is a DC stand alone3 electrical system without a meter. The focus of Monitoring and Evaluation (M&E) at the health centres and dispensaries is on three
2 Beach Management Units (BMUs) are fishers’ cooperatives controlling fishing in a certain area.
3 That has no provision for the power to be connected with or used by other types of appliances.
Final Report: Kigoma Solar Baseline and Interim Performance Evaluation
12
types of vaccines namely: BCG, Measles and Polio because they are most common for children. It was designed to provide an average of 1 Kwh per day for 24 hours with no other appliances connected to the system. The target was to make 130 PV installations at each of the treated health centres and dispensaries out of 165 health centres and dispensaries in the two districts as stated above.
The Village Market Productive-use Systems is an AC electrical system with a main energy meter and subsidiary energy meters for each user category. It was designed to provide an average of 2.6 Kwh per day that would support general lighting at the village market (exterior and for each stall). It was also designed to supports four types of income generating activities outside but around the market, namely cell phone charging, cinema, hair cutting and sewing. The four (4) businesses4 connected and using the market power source pay the market for electricity consumed. Connections are managed by the Village Market Committee who are the quasi owners of the of the village market solar PV system. It was expected that the connections would improve income of the users and enable the committee to maintain the system and replace batteries in the future. The target was to make PV installations at 25 village markets.
The second component for the BMUs night fishing system is a LED night fishing system without an energy meter. It is a DC stand alone electrical system without a meter that comprises two sub-systems of a solar PV array and a portable battery charger. The solar panel and lamps are installed at the fisher’s home and the boat pair, respectively while the home-charged battery is carried from home to the fishing boat for every fishing mission. It was designed to provide an average of 0.45 Kwh per day comprising 5 LED lamps per boat for 9 hours. It was piloted for 2 months covering 10 boat pairs and then the boat owners/fishers – after being encouraged by results - purchased them through the BMUs. The sales to boat owners/fishers are demand-driven and come about as a result of the 2 months trials. Therefore it is an outcome. This component was implemented in Kigoma Municipal Council and Kigoma Rural District Council. It was implemented through BMUs except at Kibirizi in Kigoma Municipal Council where it was implemented through a Boat Owners and Fishermen Association. The association was the major contact and source of all BMUs involved in the project. The target was 60 installations. Kigoma Municipal Council has 2 BMUs (Kibirizi and Katonga) while Kigoma Rural District Council has 10 BMUs.
The third component is a marketing approach to encourage commercial purchases by households and business. The component was initially implemented through a cluster approach but, after being behind schedule because of small response of the mostly small farmers, it was changed to a revolving loan fund approach through Savings and Credit Cooperative Society (SACCOS). The sales/installations are demand-driven and come about as a result of marketing done to SACCOS. Therefore it is an outcome. The main contacts and sources of all the SACCOS involved in the project were the Cooperatives Development Officers in Kigoma Rural and Kasulu districts. It comprises of Pico Solar PV systems and Solar Home Systems (SHS) in various sizes without an energy meter for home and small businesses use. Households and businesses purchase of the PV systems is demand-driven as an outcome of marketing done to the SACCOS. This component was implemented in Kigoma Rural District and Kasulu District. Table 1 presents 4 year target market penetration rates for the household market based on the feasibility study for the project.
4 A business is defined as an organization or economic system where goods and services are exchanged for one
another or for money( www.businessdictionary.com/definition). For this report we define business as any non-employment income generating activity.

Final Report: Kigoma Solar Baseline and Interim Performance Evaluation
13
Table 1: Target Market Penetration Rates for the Marketing Approach Component
Income Status High Income Middle Income Low Income Total Total households 21,500 107,500 86,000 Average monthly energy expenditure $23 $14 $9
Product description Integrated light charger 10% 2,150 20% 21,500 10% 8,600 32,250 Household lighting system 20% 4,300 10% 10,750 5% 4,300 19,350 20Wp SHS 20% 4,300 2% 2,150 0% 0 6,450 50Wp SHS 15% 3,225 0% 0 0% 0 3,225 Total 13,975 34,400 12,900 61,272
Source: Feasibility Study of the Project, February 2011
1.4 PROGRAM LOGIC
The evaluation measured the following process, outputs, outcomes, objectives and impact indicators in the revised5 Program Logic, in addition to other indicators related to the evaluation questions:
a) Process:
i) Finance feasibility design activity Value of feasibility contract ($) Value disbursed for feasibility contract ($)
ii) Finance construction (implementation) activities Value of construction contract ($) Value disbursed for construction contract ($)
b) Outputs:
i) Increase access to electricity Number of PV systems installed (at health centers, dispensaries, village markets, and
schools) (#) Total capacity of systems installed (kWpeak)
ii) Increase in technical and administrative capacity Percent of total training hours delivered to end users (%)
iii) Increased temporary employment Number temporary employed/contracted by contractors
c) Outcome:
i) Improve electricity service coverage: Number of solar night fishing systems sold to fishers through BMUs (#) Number of businesses around village markets connected and using the market power
source (#) Number of PV systems sold and installed at households and businesses through
SACCOS marketing system (#)
ii) Improve quality of service: Average availability of power in the last 24 hours Daily solar power consumption (kWh)
iii) Increase electricity consumption: Average annual quantity of other energy sources6 consumed (Kg)
5 Moving BMUs from outputs to outcomes and introducing businesses around the market using market power
source, and businesses that bought through SACCOS into outcomes based on findings of the evaluation.

Final Report: Kigoma Solar Baseline and Interim Performance Evaluation
14
d) Objectives:
i) Increase investment and economic activities Average annual business revenue ($) Average annual wages ($) Average annual expenditure on energy ($)
ii) Improve human capital accumulation Schools with afterhours study programs (%) Availability of vaccines (#) Vaccinations administered (#)
e) Compact Goal: Poverty reduction through economic growth Average annual household income per capita ($)
Assessment of the Program Logic is presented in the findings.
1.5 EVALUATION QUESTIONS
The evaluation will address the following overarching questions as per the evaluation design:
i. How well was the program implemented? (Including analysis of Project scope, timing, costs, and public perceptions); were the output targets achieved? If not, why?
ii. What types of challenges were encountered during implementations? iii. How well has the solar energy approach addressed the energy needs of the beneficiary
population? iv. What are the outcomes of the program on solar energy access, use and costs as well as
productivity, income, etc.? v. How sustainable are the outputs and outcomes?
vi. What lessons can be learned from the experience of the program? vii. Was the sub-activity successful in further catalyzing investments in solar power (e.g.
household systems) in Kigoma? If not what conditions will needs to be in place for the pilot to encourage additional investments?
viii. Are there any unplanned results due to the implementation of Kigoma Solar?
The evaluation also addresses the following key research questions:
i. Has Kigoma Solar contributed to an improvement in electricity service coverage across different customer types?
ii. Has Kigoma Solar contributed to an improvement in the quality of energy available, across different customer types?
iii. Has Kigoma Solar contributed to an increase in consumption of electricity, across different customer types?
iv. Has Kigoma Solar contributed to an increase in investment in economic activities across different customer types?
v. Has Kigoma Solar contributed to an improvement in human capital accumulation through changes in health service provision across different customer types?
vi. Has Kigoma Solar contributed to an improvement in human capital accumulation through changes in education service provision and study practices across different customer types?
vii. Has Kigoma Solar contributed to a reduction in poverty across different customer types, as measured by household income per capital?
6 Traditional energy sources such as kerosene, candles, firewood, charcoal, LPG, dry-cell batteries, and other Biomass Residues.

Final Report: Kigoma Solar Baseline and Interim Performance Evaluation
15
1.6 REPORT ORGANIZATION
This report is organized into six chapters including this introductory chapter. The Second Chapter presents the evaluation design including the methodology used. The Third Chapter presents findings of the evaluation followed by conclusion and recommendations in the Fourth and Fifth Chapters. References used are given in Chapter six. The findings chapter is organized by thematic areas of the evaluation that combine presentation and discussion of relevant indicators of the program logic and evaluation questions. The chapter is divided into three parts. The first part presents baseline status. The second part presents evaluation of the project’s implementation process while the third part presents interim evaluation results to measure preliminary changes after program implementation.
2. EVALUATION DESIGN
2.1 EVALUATION APPROACH
The evaluation is conducted using a pre-post or before and after comparison evaluation method. This involves estimating differences of the status before and an outcome after a program is implemented. Therefore, the “before” status is baseline status. Due to lack of a valid counterfactual as explained in limitations to the study in section 2.4, this is a performance evaluation that will provide descriptive statistics on changes from baseline to end-line (pre-post evaluation).
2.2 EVALUATION METHODOLOGY
Table 2 summarizes the methodology.
Table 2: Summary of Evaluation Methodology
Activity Evaluation Methodologies
Pre-post Comparison Method
Similarities of Treatment and Comparison Groups Method
Key Outcomes and Impact
Installations of Solar PV Hardware
Marketing
Training
Maintenance
After sale services
Baseline status compared with status after implementation
Recall of situation one year before solar PV installation began (Baseline)
Situation Months7 after solar PV installation is completed
Baseline status in communities that got program installations (Treatment Group)
Status at the same time periods in similar communities and facilities that did not get installations and cannot access program services (Comparison Group)
Household and business purchases
Improve electricity service coverage
Improve quality of service
Increase electricity consumption to reduce per-unit energy costs
Increase investment and economic activities
Improve human capital accumulation
Poverty reduction and economic growth (Increased average annual household income per capita)
Source: The Kigoma Evaluation Concept Note, 2013
7 Months post-intervention ranged as shown in brackets: Secondary Schools (2 to 5 months); Health Centres (2 to 5
months with the majority being 5 months old); Dispensaries (1 to 9 months with the majority being 5 months old); Village Markets (1 to 11 months – very sporadic); and BMUs (1 to 4 months – sporadic).

Final Report: Kigoma Solar Baseline and Interim Performance Evaluation
16
The evaluation was conducted when implementation of the project had already begun. By the time the independent evaluator was contracted, about 76% of the installations were in progress, and about to be completed (Progress Report 4 of 5 of Supervising Consultant). However, at the time of data collection, approximately 67% of installations had already taken place. It was only the vaccine refrigerators that were yet to be installed. Therefore the study had to be designed such that the first round of data collection collected both baseline and interim data. With this background, the survey collected data on 1-year recall questions to estimate the baseline values. Given that some share of the installations had already been done, the study used the opportunity to conduct an interim evaluation for the sample that had received the installation at least 5 months prior to the evaluation, to assess the expected short-term changes resulting from the project.
Therefore, Interim evaluation round that is normally conducted after activity implementation is near
a half way, has been done during the first round of data collection that has also collected data to
estimate baseline values. Therefore, a two-stage rounds project evaluation cycle will be adopted - comprising:
First Round of combined baseline and interim round that measure process, outputs and
outcome indicators; and
Follow-up evaluation round to measure changes related to objectives and the Compact Goal - Poverty reduction and economic growth. It is suggested that this is done at least two (2) years after project completion because on average, the project had been operational for 5 months only.
The evaluation uses both quantitative and qualitative data collected as either primary and secondary data as complements in an evaluation strategy. The existing secondary data sources, including administrative data complement primary data sources in establishing baselines for indicators of interest.
i) Secondary Data Collection
Secondary data to gauge the effectiveness of this project was collected from the Energy Department of MCA-T REA and Kigoma Rural and Kasulu District Councils and extractions from literature available in the public domain/Internet. A list of documents reviewed is given as List of References in Section 6.
ii) Primary Data Collection and Units of Observation
Primary data was collected by concurrently conducting 22 surveys of treatment and comparison groups with the following Units of Observation:
1) Headmasters/mistress of treated schools; 2) Headmasters/mistress of comparison schools; 3) Clinical Officers In-charge of treated Health Centres; 4) Clinical Officers In-charge of comparison Health Centres; 5) Clinical Officers In-charge of treated dispensaries; 6) Clinical Officers In-charge of comparison dispensaries; 7) Leaders of treated village markets; 8) Leaders of comparison village markets; 9) Owners/managers of businesses treated through the village market; 10) Owners/managers of comparison businesses around the village market; 11) Secretaries of treated BMUs; 12) Secretaries of comparison BMUs;

Final Report: Kigoma Solar Baseline and Interim Performance Evaluation
17
13) Fishers/owners of treated boats; 14) Fishers/owners of comparison boats; 15) Treated SACCOS; 16) Owners/managers of businesses treated through SACCOs; 17) Owners/managers of comparison businesses; 18) Head of Households treated through SACCOs; 19) Comparison Head of Households; 20) Stakeholders (Energy department of MCA-T, District Councils, and Village leaders); 21) FGD of Treated Community Members – Male and Female; and 22) FGD of Comparison Community Members – Male and Female.
2.2.1 SAMPLING
One of pre-requisites for effective pre-post evaluation method is collection of data from the same sources and community/population during all rounds of data collection. However, due to semi nomadic nature of fisher community, especially men, some farmers and also attrition, a multiple cross sectional approach will be used instead of the ideal panel survey.
(a) Stages of sample selection
The evaluation included institution, business and household surveys. There were three stages of sample selection that were implemented at different levels. The first selection was to adopt the Kigoma Rural and Kasulu districts that are targeted by the program as study areas. The second selection involved sampling of units of observation for the institution, business and household surveys. The third sampling was selection of respondents for fishers, business and households surveys.
Sampling of responding units was intervention based. It involved subjects covered by the intervention for the pre-post comparison evaluation method. This was complemented by including communities not covered by the Program as comparison group for assessing baseline status in the additional treatment and comparison groups’ evaluation method. However, some facilities were eliminated from the comparison sampling frame because they were too far to get to. They included Buhingu village in Kigoma Rural District with a non treated health centre. Access to this village is by MV Liemba Ship that travels to this village once after every ten days, which was not compatible with the work plan.
Units of observation were selected based on program beneficiaries and stakeholders provided in the ToR. The detailed deployment plan for the program was used as sampling frame.
The evaluation used Cluster sampling design with stratification because the communities are clusters while the sources of data are stratified into treated and non-treated. For efficiency purposes, villages with most of the types of the solar PV installations (village market, secondary school, dispensary, health centre, BMU and SACCOS) were purposefully be given priority. This was to ensure all types of installations, conduits and beneficiaries are covered by the evaluation. The selection of comparison of groups’ villages and facilities was also done purposefully to ensure that they are located far from the target villages and facilities of the program to the extent that they cannot access services provided by the program.
The first selection was for villages to be covered as explained in part (d) above. The second stage sampling was also done purposefully based on the distribution of installations in the detailed deployment plan for the program as sampling frame and the above sample selection guide. The selection included BMUs that are also given in the detailed deployment plan for the program. It also included selection of SACCOS based on their list obtained from MCA-T and updates by Cooperative Officers of the two districts. Once an institution was sampled as a unit of

Final Report: Kigoma Solar Baseline and Interim Performance Evaluation
18
observation, the head of the institution such Headmaster/mistress was automatically or purposefully selected/identified because we had already planned to interview the institution. The third stage sampling involved selection of units of respondents for outcome indicators namely fishers/boat owners that purchased PV systems through BMUs, Businesses connected to the PV system of the village market, and businesses and households that purchased the PV systems through SACCOS.
(b) Required Sample Size and Level of Representation
Required sample size was guided by the National Master Sample (NMS) developed by the National Bureau of Statistics (NBS). The optimal sample size for producing national estimates in Tanzania varies from 5-10 clusters (EAs8) per stratum (region) depending on the sensitivity of the study.
Based on the sampling plan and representative sample guidance, geography and activity scope, the required sample size was estimates as shown in Table 3.
Table 3: Sample Selection Guide
Installation Type
Total Population
Representative Sample’s Range
For villages with 4 Interventions
For villages with 3 Interventions
Choice Treatment
Group Comparison
Group
Dispensaries 116 12 - 23 14 37 14 4 Health Centres 14 1 - 3 2 5 6 4 Secondary schools
45 5 - 9 15 29 10 4
Village markets 25 3 - 5 14 9 6 4 BMUs 5* 1 - 2 0 4 5 2 SACCOS 22* 3 - 5 4 7 4 2 Businesses 4 2
Households 4 2
Comment Health Centres not Adequate
Village Markets Excessive
Add 2 Health Centres from each district
Cover all the 4 BMUs and Kibirizi
*As per list from MCA-T (26th April 2013)
After field experience, however, additional units of sampling were added after the initial sample selection during pilot test in the two districts revealed that there were outcome indicators that were omitted in the Program Logic and study design. The units added included businesses using electricity from village market power source installed by the project, and fishers/boat owners that bought the PV systems through BMUs as shown in Table 4. The table also presents sampling frame and methods.
8 EAs are Enumeration Areas demarcated prior to the population census activities covering a maximum of 900 persons in
the rural settings and 400 in the urban areas. These areas are used by researchers for carrying social economic studies.

Final Report: Kigoma Solar Baseline and Interim Performance Evaluation
19
Table 4: Sample Sizes and Methods
S/N Survey Instrument Sampling Frame Sampling Method Sample Size (N) 1) Treated Schools survey Deployment plan for the
program Purposive 10
2) Treated Health Centres survey Deployment plan for the program
Purposive 6
3) Treated Dispensaries survey Deployment plan for the program
Purposive 14
4) Treated Village Markets survey Deployment plan for the program
Purposive 6
5) Treated Businesses around the village market survey
Businesses connected to the market power
Purposive 12
6) Treated BMUs survey Deployment plan for the program
Purposive 4
7) Treated Fisher/boat survey List of members of the BMU that bought the systems
Random with replacement
8
8) Treated SACCOS survey List of SACCOS from MCA-T and District Cooperative Officers
Purposive 4
9) Treated Businesses survey List of members of SACCOS that had bought the systems
Random with replacement
16
10) Treated Households survey List of members of SACCOS that had bought the systems
Random with replacement
16
11) Stakeholders (Energy department of MCA-T, District Councils, and Village leaders) survey
Deployment plan for the program
Purposive 21
12) Treated Community Members’ Focus Group Discussion (FGD) – Male and Female
Deployment plan for the program
Purposive 4
Total 121
About 49 comparison respondents were purposefully selected in the field ensuring those selected are located very far from program target areas such that they cannot access benefits from the interventions – given logistics in the two districts. Therefore, a total of 170 respondents were selected for the various surveys.
The combined baseline survey and interim evaluation collected data from 170 respondents in various categories as shown in Table 5.

Final Report: Kigoma Solar Baseline and Interim Performance Evaluation
20
Table 5: Sample Coverage
S/N District/Village Stakeholders Dispensaries Health Centres
Sec. Schools
Village Markets
Market Business
BMUs Fisher SACCOS Business Household FGDs
Tr Co Tr Co Tr Co Tr Co Tr Co Tr Co Tr Co Tr Co Tr Co Tr Co
Kigoma Rural District
1. Nyarubanda 1 1 1 1 2
2. Mkigo 1 3. Kalinzi 1 1 1 4. Kazuramimba 1 1 1 1 2 5. Uvinza 1 1 1 1 1 2 2 2 2 6. Nguruka** 1 1 2 2 7. Itebula 1 1 8. Mwakizega 1 1 1 2 1
10. Ilagala 1 1 1 3 2 4 2 11. Kaseke* 1 3 1 12. Musimba* 1 2 13. Karago 1 1 1 1 14. Kaparamsenga* 1 1 2 1 2 15. Mgambazi* 1 1 2 1 16. Mwamgongo 1 1 1 2 1 17. Kagunga 1 1 1 2
Sub-total 10 7 2 3 0 5 2 3 2 6 4 4 2 8 4 2 8 4 8 4 2 2 Kasulu District 1
1. Kasangezi* 1 2 1 2. Songambele* 1 3. Rusesa 1 1 1 1 2 2 4. Kigogwe* 4 5. Herujuu/Kalunga* 2 2 1 6. Kwaga 1 1 1 2 7. Munzeze 1 1 1 1 2 8. Rusaba 1 1 1
10. Janda 1 1 1 1 11. Bukuba* 1 1 12. Buhigwe 1 1 13. Mulera* 1 14. Kibwigwa 1 1 1 1 2 15. Mkatanga* 1 16. RungweMpya 1 1 1 17. Murufiti 1 1 1 4 2 4 2 18. Nyenge 1 1 1 19. Migunga 1 20. Nyamyusi* 1 2 21. Muhunga* 1
Sub-total 11 7 2 3 3 5 3 3 2 6 4 2 8 4 8 4 2 2 Total (170) 21 14 4 6 3 10 4 6 4 12*** 8*** 4 2 8*** 4*** 4 16 8 16 8 4 4
Target 21 14 4 6 4 10 5 6 4 4 2 4 16 8 16 8 4 4
Coverage 100%
KEY: Tr = Treated; Co = Comparison; *Selected for filling gap in the previous sampled village; ** Sampled but also used for filling gap of a sampling unit
**** Not included in the initial study and sampling design (included during pilot)

Final Report: Kigoma Solar Baseline and Interim Performance Evaluation
21
2.2.2 TOOLS
All data collection instruments and protocols for the 22 surveys were prepared in English and translated from English into Kiswahili. The original English document was compared with the back translation document to identify sections not correctly translated. Annex I presents questionnaires used in the evaluation. All protocols used are given as Annex II.
2.2.3 DATA COLLECTION
Data collection started after approval of the Pilot Test Report and Final English and Swahili Data Collection Instruments and Protocols. It was led by the Consultant who recruited and trained five (5) people to provide data collection support. These staff were divided into two data collection teams, one in Kigoma Rural District and another in Kasulu District.
Data was collected using Pen-and-Paper Interviewing (PAPI). All primary data was collected by visiting respondents and conducting face to face interviews. Most of data collected is gender disaggregated, which is a strategic priority for MCC and MCA-T.
The Evaluation Consultant also obtained Research Ethical Consideration Clearance from Tanzania’s Commission for Science and Technology (COSTECH) on 18th June 2013. The data gathering activity was entrenched into the Local Government Authorities (LGAs) structures in Kigoma Rural and Kasulu districts. The activity was facilitated by letters of introduction from MCA-T that introduced the Consultant to the Regional Administrative Secretary (RAS) of Kigoma Region and the District Executive Directors (DEDs) for Kigoma Rural and Kasulu District Councils. DEDs prepared letters to introduce the data collection team to Village Executive Officers (VEOs) of all sampled villages and heads of public infrastructures sampled for the survey. These arrangements enabled the Consultant to connect easily with all sources of information. There was no problem of accessing respondents and data.
All interviews were done in privacy. Participation in the study was voluntary. Protocols included a Research Subject Information and Consent Form that was signed or thumbed by each respondent to mark and indicate willingness to voluntarily participate in this study, including providing private information. All respondents signed the form before interview. All identified data will be made publicly available by MCC to enable additional analysis of the average answers. At the end of data collection, a Data Gathering Report was prepared and submitted to inform on the data collection team and methodology/technology, geographic and subject sample coverage, surveys completed, challenges and lessons learned, and the way forward. Results dissemination will be done through this report and stakeholders’ workshop and it may include publications into journals.
Evaluation Team members’ roles and responsibilities were as follows:
Name Role 1) Abel Y. Busalama Consultant for the assignment responsible for all activities and managing data
collection support staff and other resources. 2) Diana Beatus Data collection support for both Quantitative and qualitative data collection in
Kigoma Rural District. 3) BoniphaceLivinus Data collection support for both Quantitative and qualitative data collection in
Kigoma Rural District. 4) KanutiMwanosa Data collection support for both Quantitative and qualitative data collection in
Kasulu District. 5) Athanas Haule Data collection support for both Quantitative and qualitative data collection in
Kasulu District. 6) Said Nyambaya Data collection support for aligning data collection tools with data capture screens
and assisted the Consultant to make coordination between the data collection teams in Kigoma Rural District and Kasulu District.

Final Report: Kigoma Solar Baseline and Interim Performance Evaluation
22
2.2.4 DATA PROCESSING
Since data was collected using paper surveys, there was double data entry. The Kiswahili data dictionary was translated into English to make all data entry to be in English. Data was entered using CsPro and then exported to SPSS software for analysis. A data quality control/verification process was inbuilt into the data management system with validation rules and consistency checks for values appropriate in Tanzania leading to pop up dialog boxes if there was violation. In addition, frequencies were generated to facilitate data consistency checks and identify any outliers.
Due to challenges of qualitative data, the consultant reviewed and edited the scripts against the voice recorded during the FGDs. Analysis was through transcription (review), which involves
reading through the scripts to look for patterns or themes of the evaluation among the discussions of
the participants, and then group them in any meaningful way, such as by type of participant. There was aggregation of similar responses/answers stated in different sentences of IDIs but meaning the same thing.
After production of an acceptable clean data set, a Data Analysis Documentation was prepared, covering descriptive statistics complemented by summary description, list of files, data dictionary, codebook, and do files. The analysis produced cross-tab tables for key variables as per the tabulation plan reviewed by MCA-T. Data was disaggregated by control factors such as gender, age, education, and income in households; and type, size, and location of Businesses.
2.3 STUDY LIMITATIONS
The “baseline” data was estimated after the intervention had already begun and nearing completion. To mitigate this problem, the pre-intervention data (baseline) was collected using recall data. It is likely that some respondents may have forgotten the situation before installation of the solar PVs. To mitigate this, questions asked had a relatively shorter reference period of ONE YEAR before data collection.
Since all public institutions have similar structures based on Government architectural plans, ownership, management, use and funding; villages in the two districts have similar cultural practices (all are largely of Waha tribe); carryout similar economic activities (mostly small scale farming of the same crops, for those fishing do it in the same Lake Tanganyika and those employed are mainly teachers, extension officers and other public sector officials as shown in the Feasibility Study for this project); and businesses are predominantly small, these could be comparison groups because they are similar facilities in similar communities in the same geographical and socio-economic region and are unlikely to access and get changed by the intervention. Therefore, limited and non-scientific, comparison between treatment and comparison groups has also been done so as to complement and enhance the pre-post evaluation because it provides another point of reference on energy access and use in the absence of solar PV intervention. Similarities of data between the two groups will serve to indicate appropriateness of the baseline status established by the pre-post evaluation.
It is expected that the analysis may also reveal comparison data between the selected Kigoma Solar Project treatment sites and comparison sites, which could inform selection of future solar intervention treatment sites. However, due to the way the program was implemented, a valid counterfactual could not be established and so a rigorous impact evaluation that would provide impact estimates that are attributed to the Kigoma Solar intervention could not be undertaken. In this regard, the study of the Kigoma Solar Project will be a performance evaluation that will provide descriptive statistics on changes from baseline to end-line (pre-post evaluation).

Final Report: Kigoma Solar Baseline and Interim Performance Evaluation
23
Another limitation was availability of respondents. For instance, the sole untreated Health Centre in Kigoma Rural District is in a remote area not easily accessible. To mitigate this, more comparison health centres were interviewed in Kasulu District. However, Kasulu district had only three (3) untreated Health Centres, hence making interviews of comparison Health Centres to fall short of one interview. The target for the two districts was four (4) comparisons. Secondary data was used when primary data was not available. Comparison data was also used as a proxy of baseline status when recall data was not collected. Another limitation was availability of secondary data from the district councils.
3. FINDINGS
3.1 BASELINE STATUS
3.1.1 Descriptive Statistics of Key Indicators
The key statistics are shown in Table 6. The baseline for the solar night fishing systems sold to fishers was zero because for the first time the project supplied solar night fishing systems in the area. The baseline indicator for the number of businesses around village markets connected and using the market power source was also zero. Use of solar at the markets before the Compact project refers to existence of a private solar system around the market rather than a market installation. The baseline indicator for the average availability of power in the last 24 hours was also zero because that indicator captures PV systems provided by the Compact project.

Final Report: Kigoma Solar Baseline and Interim Performance Evaluation
24
Table 6: Descriptive Statistics for Selected Indicators
Indicator Category
Variable N Minimum Maximum Mean Std. Deviation
Daily solar power consumption (Kwh) 0 0 0 0 0
Number of solar night fishing systems (#) 0 0 0 0 0
Number of businesses around village markets (#)
0 0 0 0 0
Average annual quantity of other energy sources consumed (kg):
8 173.77 3,779.12 1,743.71 1,498.18
Treated school 10 2 37,464 4,238.01 11,685.51
Treated health centre 6 494 32,680 11,165.26 15,083.52
Treated dispensary 14 54 20,487 2,281.90 5,344.18
Treated village market 5 36 1,314 481.71 512.87
Treated market business 10 10 4,113 544.06 1,262.14
Treated business 16 10 2,002 499.37 611.98
Treated fishers 7 3,848 12,072 6,927.63 2,790.93
Treated household 16 37 5,165 1,487.08 1,795.99
Average availability of power in the last 24 hours (Hours):
Treated school 10 4 24 15.0 7.63
Treated health centre 6 8 24 18.8 6.52
Treated dispensary 13 12 24 19.92 4.368
Treated village market 5 12 24 14.8 5.22
Treated market business 12 3 16 11.3 3.34
Treated business 16 4 24 9.6 5.19
Treated fishers 8 0 12 10.0 4.17
Treated household 16 0 24 9.6 5.69
Objective Vaccinations administered (#):
Schools with afterhours study programs (#) 0 0 0 0 0
Availability of vaccines (#):
BCG 7 0 1,000 203.43 60.67
Polio 7 0 1,200 258.00 426.23
Measles 7 0 1,000 192.43 60.71
Average annual expenditure on energy (US$):
Treated school 8 11 4,629 790.45 1,594.15
Treated health centre 6 29 3,362 1,165.38 1,213.97
Treated dispensary 14 16 4,074 579 1,046.77
Treated village market 5 101 2,193 709 860.39
Treated market business 8 17 1,597 412 553.99
Treated business 15 5 1,208 276 344.06
Treated fishers 8 0 9,510 5,796 3,450.44
Treated household 15 18 900 171 221.92
Average annual business revenue (US$):
Treated fishers 8 2,545 32,143 15,512 9,471.55
Treated business 15 188 90,000 19,951 23,330.49
Treated market business 12 1,219 31,875 11,992 11,153.17
Goal Average annual household income per capita 8 31.00 760.00 233.25 231.84092
Source: Kigoma Solar Baseline/Interim Survey, 2013
3.1.2 Energy needs before the program
Respondents at treated sites were asked to mention the biggest challenges they faced with respect to power access and use before being provided with the Solar PV system from MCA-T. Responses are presented in Table 7 (a). The table shows that the biggest challenge before the project was lack of electricity that faced 86% of the treated respondents. This was followed at far by high price of fuel (49%), financial constraints (42%), inadequate power supplied (39%), lack

Final Report: Kigoma Solar Baseline and Interim Performance Evaluation
25
of cheap source of power (31%), and then other challenges such as lack of near electricity mains/suppliers, administrative constraints, lack of wiring and installation supplies, shortage of power gen-sets and appliances, shortage of repair technicians, and shortage of spare parts as shown in the table.
The table also shows that lack of electricity was a concern to all project participants and beneficiaries except health centres because all those covered by the survey had solar systems before the program. High price of fuel was a more challenge to fishers (6 out of 8) and businesses around the market (8 out of 12) than other project participants and beneficiaries. Financial constraints affected all respondents almost equally. Inadequate power supplied was a concern to all health centres indicating that the solar systems installed at the health centres before the project had lower voltage than needs. Six out of the 8 fishers also considered the power available to be inadequate.
The biggest challenge at comparison sites was also lack of electricity that faced 93% of the respondents followed by high prices of fuels (64%) and then financial constraints (50%) as shown in Table 7 (b). Higher proportions of people who considered lack of electricity as the biggest challenge followed by high prices of fuels were found at comparison sites than treated sites because data was collected after the treated sites had accesses and used solar electricity of the project for about 5 months. The difference is also explained by the fact that the selection criteria for treated sites included only “Villages with the greatest number of potential beneficiaries (i.e. all division headquarters and villages with population greater than 10,000”. These are semi-urban areas with employees and people doing business where it is more likely to have people who can afford solar technology and petroleum fuel electricity generators than in pure rural areas. That criterion was not used in the selection of comparison sites. Selection of comparison sites as explained in the methodology purposefully ensured that they are located far from the target villages and facilities of the program to the extent that they cannot access services provided by the program.
3.1.3 Use of other energy sources
a) Use of electricity substitutes
The baseline survey established distribution of use of other energy sources9 consumed before receiving the solar PV technology from MCA-T as recall data 12 months before the survey. Table 8 (a) shows that kerosene was the most used fuel (84%) followed by electricity generated by dry cells and batteries (82%), charcoal (52%), firewood (36%) and then medium size candle (17%). The high rank of electricity generated by dry cells and batteries can be explained by observed mass marketing of many types of flash lights/lamps mostly from China that use dry cells and batteries.
All the health centres, dispensaries, village market and households surveyed were using kerosene followed by fishers and businesses that bought from SACCOS (All 88%). Secondary schools had the lowest proportion of using kerosene (40%) but all (100%) were using dry cells and batteries.
The use of such types of sources of energy depicted a similar pattern at comparison sites. However, dry cells and batteries that ranked second at the treated sites were the most used by being used by 95% of the respondents and kerosene that ranked first at treated sites ranked second by being used by 89% of the respondents as shown in Table 8 (b). These were followed by charcoal (48%), firewood (43%) and then medium size candle (16%).
9 Traditional energy sources such as kerosene, candles, firewood, charcoal, LPG, dry-cell batteries, and other Biomass Residues.

Final Report: Kigoma Solar Baseline and Interim Performance Evaluation
26
Table 7 (a): Baseline challenges with respect to power access and use at treated sites (responses)
Challenges Treated schools
Treated health
centres
Treated dispensaries
Treated village market
Treated market
businesses
Treated businesses - through SACCOS
Treated fishers
Treated households
Grand Total Rank
Yes Total Yes Total Yes Total Yes Total Yes Total Yes Total Yes Total Yes Total Yes Total %Yes
Lack of electricity
10 10 2 6 12 14 5 5 10 12 16 16 4 8 17 17 76 88 86% 1
Lack of near electricity mains/suppliers
2 10 1 6 3 14 1 5 4 12 8 16 0 8 4 17 23 88 26% 6
Lack of wiring and installation supplies
1 10 0 6 1 14 0 5 0 12 0 16 0 8 0 17 2 88 2% 9
Lack of cheap source of power
3 10 1 6 7 14 2 5 2 12 7 16 3 8 2 17 27 88 31% 5
Inadequate power supplied
1 10 6 6 5 14 2 5 6 12 4 16 6 8 4 17 34 88 39% 4
High prices of fuel
3 10 1 6 6 14 4 5 8 12 7 16 6 8 8 17 43 88 49% 2
Shortage of power gen-sets and appliances
0 10 1 6 0 14 0 5 0 12 1 16 0 8 0 17 2 88 2% 9
Shortage of spare parts
0 10 0 6 1 14 0 5 0 12 0 16 0 8 0 17 1 88 1% 10
Shortage of repair technicians
0 10 0 6 1 14 0 5 1 12 0 16 0 8 0 17 2 88 2% 9
Financial constraints
4 10 1 6 7 14 3 5 4 12 7 16 4 8 7 17 37 88 42% 3
Administrative constraints
2 10 0 6 1 14 0 5 0 12 0 16 0 8 0 17 3 88 3% 8
Other 4 10 0 6 1 14 0 5 2 12 3 16 3 8 4 17 17 88 19% 7
Total 30 120 13 72 45 168 17 60 37 144 53 192 26 96 46 204 267 1056 25%
Source: Kigoma Solar Baseline/Interim Survey, 2013

Final Report: Kigoma Solar Baseline and Interim Performance Evaluation
27
Table 7 (b): Baseline challenges with respect to power access and use at comparison sites (responses) Challenges Comparison
schools Comparison
health centres
Comparison dispensary
Comparison village market
Comparison market
businesses
Comparison businesses -
through SACCOS
Comparison fishers
Comparison households
Grand Total Rank
Yes Total Yes Total Yes Total Yes Total Yes Total Yes Total Yes Total Yes Total Yes Total %Yes
Lack of electricity
4 5 3 3 4 4 4 4 8 8 8 8 3 4 7 8 41 44 93% 1
Lack of near electricity mains/suppliers
1 5 2 3 2 4 2 4 3 8 3 8 0 4 3 8 16 44 36% 5
Lack of wiring and installation supplies
0 5 0 3 1 4 1 4 0 8 1 8 0 4 0 8 3 44 7% 8
Lack of cheap source of power
2 5 2 3 2 4 1 4 4 8 3 8 0 4 3 8 17 44 39% 4
Inadequate power supplied
1 5 1 3 0 4 1 4 1 8 1 8 4 4 2 8 11 44 25% 6
High prices of fuel
1 5 2 3 1 4 3 4 8 8 5 8 4 4 4 8 28 44 64% 2
Shortage of power gen-sets and appliances
0 5 0 3 0 4 0 4 0 8 1 8 0 4 0 8 1 44 2% 10
Shortage of spare parts
0 5 0 3 0 4 0 4 0 8 0 8 0 4 0 8 0 44 0%
Shortage of repair technicians
0 5 0 3 0 4 0 4 0 8 0 8 0 4 0 8 0 44 0%
Financial constraints
2 5 1 3 3 4 2 4 3 8 5 8 2 4 4 8 22 44 50% 3
Administrative constraints
1 5 0 3 0 4 1 4 0 8 0 8 0 4 0 8 2 44 5% 9
Other 1 5 0 3 0 4 0 4 0 8 1 8 2 4 1 8 5 44 11% 7
Total 13 60 11 36 13 48 15 48 27 96 28 96 15 48 24 96 146 528 28%
Source: Kigoma Solar Baseline/Interim Survey, 2013

Final Report: Kigoma Solar Baseline and Interim Performance Evaluation
28
Table 8 (a): Use of electricity substitutes at treated sites before the program (Number of Users)
Used Total %
Used
Used Total %
Used
Used Total %
Used
Used Total %
Used
Used Total %
Used
Used Total %
Used
Used Total %
Used
Used Total %
Used
Kerosene 4 10 40% 6 6 100% 14 14 100% 5 5 100% 7 12 58% 14 16 88% 7 8 88% 16 16 100% 84% 1
Candle - small 0 10 0% 1 6 17% 0 14 0% 2 5 40% 3 12 25% 0 16 0% 0 8 0% 1 16 6% 8% 7
Candle-medium 1 10 10% 0 6 0% 1 14 7% 4 5 80% 3 12 25% 3 16 19% 0 8 0% 3 16 19% 17% 5
Candle - large 0 10 0% 0 6 0% 0 14 0% 2 5 40% 1 12 8% 1 16 6% 0 8 0% 0 16 0% 5% 9
Biomass
Residue -
Firewood
4 10 40% 3 6 50% 1 14 7% 0 5 0% 1 12 8% 9 16 56% 2 8 25% 11 16 69% 36% 4
Animal Dung 0 10 0% 0 6 0% 0 14 0% 0 5 0% 0 12 0% 0 16 0% 0 8 0% 1 16 6% 1% 12
Biomass
Residue - straw
0 10 0% 0 6 0% 0 14 0% 0 5 0% 0 12 0% 1 16 6% 0 8 0% 1 16 6% 2% 11
Biomass
Residue - Tree
leaves
1 10 10% 0 6 0% 0 14 0% 0 5 0% 0 12 0% 3 16 19% 0 8 0% 1 16 6% 6% 8
Biomass
Residue -
Charcoal
7 10 70% 6 6 100% 7 14 50% 1 5 20% 2 12 17% 8 16 50% 4 8 50% 10 16 63% 52% 3
Biomass
Residue - Other
0 10 0% 0 6 0% 0 14 0% 0 5 0% 0 12 0% 2 16 13% 0 8 0% 1 16 6% 3% 10
Gas (LPG) 0 10 0% 4 6 67% 8 14 57% 0 5 0% 1 12 8% 0 16 0% 0 8 0% 0 16 0% 15% 6
Electricity
(using dry cell,
car battery,
generator, etc.)
10 10 100% 5 6 83% 13 14 93% 4 5 80% 0 12 0% 13 16 81% 6 8 75% 11 16 69% 82% 2
Other 0 10 0% 0 6 0% 0 14 0% 0 5 0% 1 12 8% 0 16 0% 1 8 13% 0 16 0% 2% 11
Total 27 130 21% 25 78 32% 44 182 24% 18 65 28% 28 156 18% 54 208 26% 20 104 19% 56 208 27% 24%
Weighted
average
of % used
RankTreated schools Treated health
centre
Treated
Dispensary
Treated Village
Market
Treated Market
business
Treated businessElectricity
substitutes
Treated fishers Treated
household
Source: Kigoma Solar Baseline/Interim Survey, 2013
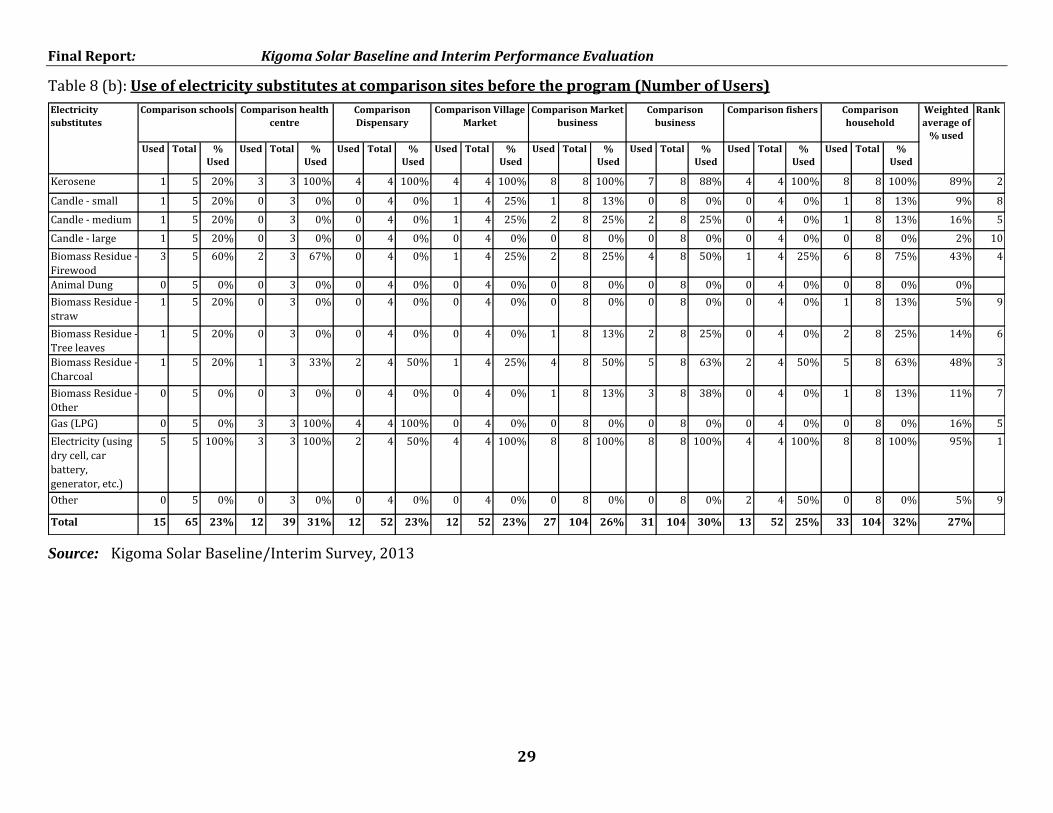
Final Report: Kigoma Solar Baseline and Interim Performance Evaluation
29
Table 8 (b): Use of electricity substitutes at comparison sites before the program (Number of Users)
Used Total %
Used
Used Total %
Used
Used Total %
Used
Used Total %
Used
Used Total %
Used
Used Total %
Used
Used Total %
Used
Used Total %
Used
Kerosene 1 5 20% 3 3 100% 4 4 100% 4 4 100% 8 8 100% 7 8 88% 4 4 100% 8 8 100% 89% 2
Candle - small 1 5 20% 0 3 0% 0 4 0% 1 4 25% 1 8 13% 0 8 0% 0 4 0% 1 8 13% 9% 8
Candle - medium 1 5 20% 0 3 0% 0 4 0% 1 4 25% 2 8 25% 2 8 25% 0 4 0% 1 8 13% 16% 5
Candle - large 1 5 20% 0 3 0% 0 4 0% 0 4 0% 0 8 0% 0 8 0% 0 4 0% 0 8 0% 2% 10
Biomass Residue -
Firewood
3 5 60% 2 3 67% 0 4 0% 1 4 25% 2 8 25% 4 8 50% 1 4 25% 6 8 75% 43% 4
Animal Dung 0 5 0% 0 3 0% 0 4 0% 0 4 0% 0 8 0% 0 8 0% 0 4 0% 0 8 0% 0%
Biomass Residue -
straw
1 5 20% 0 3 0% 0 4 0% 0 4 0% 0 8 0% 0 8 0% 0 4 0% 1 8 13% 5% 9
Biomass Residue -
Tree leaves
1 5 20% 0 3 0% 0 4 0% 0 4 0% 1 8 13% 2 8 25% 0 4 0% 2 8 25% 14% 6
Biomass Residue -
Charcoal
1 5 20% 1 3 33% 2 4 50% 1 4 25% 4 8 50% 5 8 63% 2 4 50% 5 8 63% 48% 3
Biomass Residue -
Other
0 5 0% 0 3 0% 0 4 0% 0 4 0% 1 8 13% 3 8 38% 0 4 0% 1 8 13% 11% 7
Gas (LPG) 0 5 0% 3 3 100% 4 4 100% 0 4 0% 0 8 0% 0 8 0% 0 4 0% 0 8 0% 16% 5
Electricity (using
dry cell, car
battery,
generator, etc.)
5 5 100% 3 3 100% 2 4 50% 4 4 100% 8 8 100% 8 8 100% 4 4 100% 8 8 100% 95% 1
Other 0 5 0% 0 3 0% 0 4 0% 0 4 0% 0 8 0% 0 8 0% 2 4 50% 0 8 0% 5% 9
Total 15 65 23% 12 39 31% 12 52 23% 12 52 23% 27 104 26% 31 104 30% 13 52 25% 33 104 32% 27%
Comparison
Dispensary
RankElectricity
substitutes
Comparison schools Weighted
average of
% used
Comparison Market
business
Comparison health
centre
Comparison Village
Market
Comparison
business
Comparison fishers Comparison
household
Source: Kigoma Solar Baseline/Interim Survey, 2013

Final Report: Kigoma Solar Baseline and Interim Performance Evaluation
30
b) How electricity substitutes were used
Table 9 presents usage of non-electricity sources of energy prior to the installation of PV systems. It indicates that electricity substitutes were mostly used for lighting that accounted for 149 out of 230 or 65% of the responses followed by cooking and boiling water that accounted for 31% (72 out of 230) of the primary use, fire ignition and cloth ironing, in that order of importance.
Table 9: Distribution of project participants responses on use of electricity substitutes before program implementation (Number)
Light Cooking Fire
Ignition
Boiling
Water
Cloth Ironing
Treated Schools 15 11 1 27Treated Health centre 11 6 3 20Treated Dispensary 27 3 5 35Treated Village Market: 17 1 18Treated Businesses 32 15 6 1 54Treated Fishers 13 4 17Treated Household 34 23 1 1 59Total 149 63 8 9 1 230% 65% 27% 3% 4% 0% 100%Rank 1 2 4 3 5 15
Sources of Energy Primary use Total
Source: Kigoma Solar Baseline/Interim Survey, 2013
c) Quantity of electricity substitutes used
Table 10 (a) presents findings on consumption of non-electricity sources of energy in the program area. It indicates that the weighted average of annual quantity of other energy sources10 consumed was 939 kg before the program. To get the weight in kg a conversion factor of 0.8 per liter of liquid fuel11 was used while all solid fuel were weighed during data collection. Since this is a weight measurement firewood and charcoal rank first and second most consumes quantities. Kerosene which was the fuels used by most of the project participants rank third as shown in the table.
Health centres used more quantity of firewood (15,240 kg) per annum than all other project participants and beneficiaries followed by dispensaries (11,280 kg) and then secondary schools (9,399 kg). It seems that health centres included firewood used by relatives of patients for providing services to the admitted patients. Fishers used more quantity of kerosene (4,265 kg) than all other project participants and beneficiaries followed by health centres (470 kg). The pattern was the same at comparison sites with firewood, charcoal and kerosene being the most used quantities Table 10 (b). However, use across the strata was slightly different from the treated sites because fishers followed by secondary schools consumed more quantities than other comparison sites. This is because the answers of fishers included us at their households.
10
Traditional energy sources such as kerosene, candles, firewood, charcoal, LPG, dry-cell batteries, and other Biomass Residues. 11
The density of kerosene is 817.15 Kg per cubic meter or 0.81715 Kg per Litre (www.wiki.answers.com)

Final Report: Kigoma Solar Baseline and Interim Performance Evaluation
31
Table 10 (a): Average annual quantity of other energy sources used at treated sites before the program (in kg)
Valid
N
Mean Valid
N
Mean Valid
N
Mean Valid
N
Mean Valid
N
Mean Valid
N
Mean Valid
N
Mean Valid
N
Mean
Kerosene 4 138 6 470 14 142 5 311 7 79 14 34 7 4265 17 43 521 3
Candle - small - - 1 120 - - 2 15 3 24 - - - - 1 90 45 6
Candle - medium 1 24 - - 1 30 4 27 3 56 3 30 - - 3 15 31 7
Candle - large - - - - - - 2 14 - - 1 36 - - - - 21 8
Biomass Residue -
Firewood
4 9399 3 15240 1 11280 - - 1 3600 9 367 2 2520 10 1,298 3,984 1
Animal Dung - - - - - - - - - - - - - - - - -
Biomass Residue -
straw
- - - - - - - - - - - - - - - - -
Biomass Residue -
Tree leaves
- - - - - - - - - - - - - - - - -
Biomass Residue -
Charcoal
7 466 6 2970 6 1800 1 540 2 270 8 456 4 2295 11 818 1,218 2
Biomass Residue -
Other
- - - - - - - - - - - - - - - -
Gas (LPG) - - 4 96 8 293 - - - - - - - - - - 227 4
Electricity (using
dry cell, car
battery,
generator, etc.)
10 94 4 32 13 424 4 36 8 64 13 6 6 16 12 8 107 5
Other - - - - - - - - - - 0 - 1 4320 - - 4,320
Weighted
Average
1666 2797 871 142 248 161 2430 427 959
Weighted
Average
RankOther source of
energy
Treated
Schools
Treated
Health
Centres
Treated
Dispensaries
Treated
Village
Markets
Treated
Market
Businesss
Treated
Businessess
Treated
Fishers
Treated
Households
Source: Kigoma Solar Baseline/Interim Survey, 2013
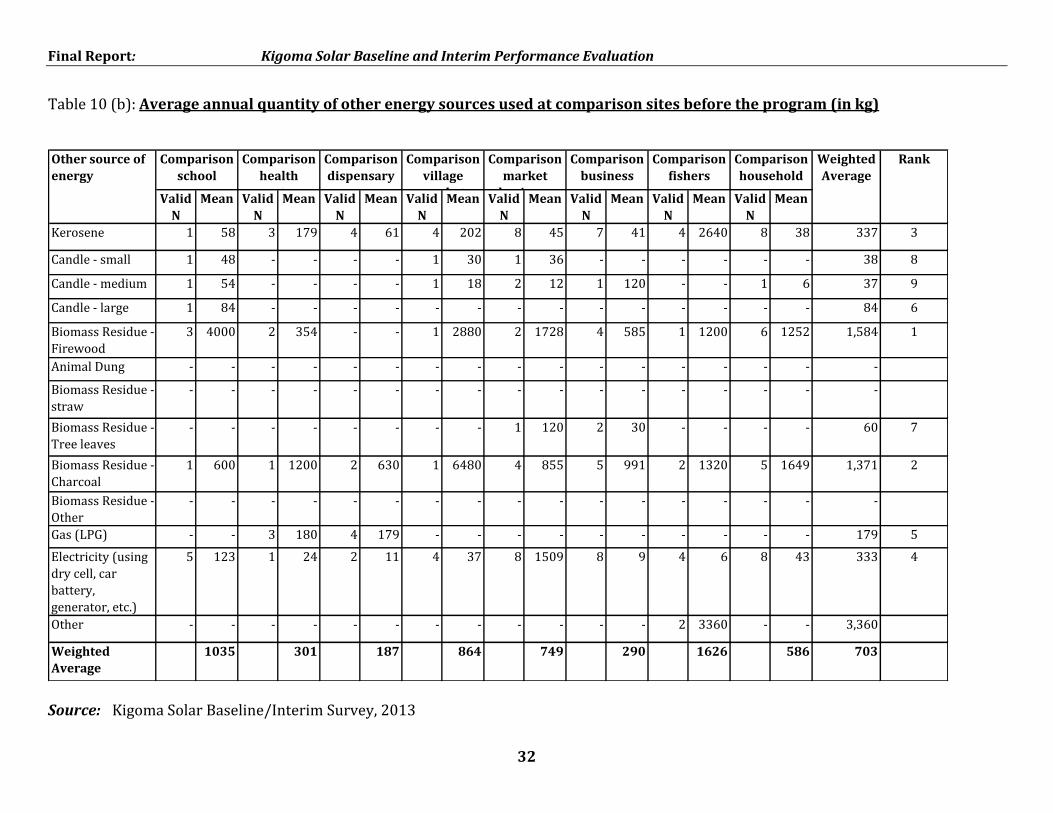
Final Report: Kigoma Solar Baseline and Interim Performance Evaluation
32
Table 10 (b): Average annual quantity of other energy sources used at comparison sites before the program (in kg)
Valid
N
Mean Valid
N
Mean Valid
N
Mean Valid
N
Mean Valid
N
Mean Valid
N
Mean Valid
N
Mean Valid
N
Mean
Kerosene 1 58 3 179 4 61 4 202 8 45 7 41 4 2640 8 38 337 3
Candle - small 1 48 - - - - 1 30 1 36 - - - - - - 38 8
Candle - medium 1 54 - - - - 1 18 2 12 1 120 - - 1 6 37 9
Candle - large 1 84 - - - - - - - - - - - - - - 84 6
Biomass Residue -
Firewood
3 4000 2 354 - - 1 2880 2 1728 4 585 1 1200 6 1252 1,584 1
Animal Dung - - - - - - - - - - - - - - - - -
Biomass Residue -
straw
- - - - - - - - - - - - - - - - -
Biomass Residue -
Tree leaves
- - - - - - - - 1 120 2 30 - - - - 60 7
Biomass Residue -
Charcoal
1 600 1 1200 2 630 1 6480 4 855 5 991 2 1320 5 1649 1,371 2
Biomass Residue -
Other
- - - - - - - - - - - - - - - - -
Gas (LPG) - - 3 180 4 179 - - - - - - - - - - 179 5
Electricity (using
dry cell, car
battery,
generator, etc.)
5 123 1 24 2 11 4 37 8 1509 8 9 4 6 8 43 333 4
Other - - - - - - - - - - - - 2 3360 - - 3,360
Weighted
Average
1035 301 187 864 749 290 1626 586 703
Comparison
market
business
Comparison
business
Comparison
fishers
Comparison
household
Weighted
Average
RankOther source of
energy
Comparison
school
Comparison
health
centre
Comparison
dispensary
Comparison
village
market
Source: Kigoma Solar Baseline/Interim Survey, 2013

Final Report: Kigoma Solar Baseline and Interim Performance Evaluation
33
3.1.4 Use of electricity-based sources of energy
a) Consumption of Electricity Electricity-based sources of energy were used at the treated sites before the program as shown in Table 11 (a). However, there were no consumption of TANESCO grid or other grid electricity, biogas electricity nor wind mill electricity in the program area. About 75 out of 88 or 85% of the responses of the project participants and beneficiaries interviewed indicated they were using dry cell batteries – size D. Again this can be explained by observed mass marketing of many types of flash lights/lamps mostly from China that use dry cells and batteries and use of batteries for radio and torch as shown in the benefits section. In contrast with hypothesis this was the first solar project in the area, the table shows that the baseline found out that 21 respondents out of 88 treated respondents that answered the question on electricity consumption or 24% were using solar PVs before the program. Details in Appendix 3 show that one out of the 10 treated secondary schools or 10%, 6 out of 6 treated health centres or 100%, 6 out of 14 treated dispensaries or 43%, 2 out of 5 treated village markets or 40%, 4 out of 12 businesses around the market that use power from the market power system or 33%, 1 out of 16 businesses that bought the systems through SACCOS or 6% and the same percentage for households that bought the systems through SACCOS had solar systems before the program. No fisher had used a solar fishing system indicating that for the first time the project supplied solar night fishing systems in the area. Observations of the consultant during field data collection saw public institutions with solar systems provided by other donors before the program. Use of solar at the markets refers to existence of a private solar system around the market rather than a market installation. The next source in terms of electricity based sources of energy that were used by most of the respondents were gasoline gen sets, dry cell batteries – size C, diesel gen sets, car batteries, motor cycle batteries and dry cell batteries – size A as shown in the Table. Table 11 (a): Consumption of Electricity at treated sites (responses) Source Used Not used Total % Used Use RankTANESCO grid 0 88 88 0%Other electricity grid 0 88 88 0%Diesel Gen-set 6 82 88 7% 5
Gasoline Gen-set 12 76 88 14% 3
Biogas 0 88 88 0%Wind mill 0 88 88 0%Solar PV 21 67 88 24% 2
Solar Lantern 2 86 88 2%Car Battery 5 83 88 6% 6
Motorcycle Battery 4 84 88 5% 7
D - Size dry cell batteries 75 13 88 85% 1
C - Size dry cell batteries 11 77 88 13% 4
A - Size dry cell batteries 4 84 88 5% 7
AA - Size dry cell batteries 1 87 88 1%AAA - Size dry cell batteries 1 87 88 1%9 Volt - Size dry cell batteries 0 88 88 0%Other 2 86 88 2%Total 144 1,352 1,496 10%
Source: Kigoma Solar Baseline/Interim Survey, 2013 Consumption of electricity based sources of energy at comparison sites was slightly the same as at the treated sites because 84% of the comparison respondents interviewed indicated they were

Final Report: Kigoma Solar Baseline and Interim Performance Evaluation
34
using dry cell batteries – size D as shown in Table 11 (b) as compared to the 85% determined in treated sites. However, use of dry cell batteries – size C was higher at comparison sites (23%) as compared to treated sites (13%). Conversely, use of solar PVs was lower at the comparison sites (14%) as compared to treated sites (24%). The difference is explained by the fact that the selection criteria for treated sites included only “Villages with the greatest number of potential beneficiaries (i.e. all division headquarters and villages with population greater than 10,000”. These are semi-urban areas with employees and people doing business where it is more likely to have people who can afford solar technology and petroleum fuel electricity generators than in pure rural areas. Table 11 (b): Consumption of Electricity at comparison sites (responses)
Source Used Not used Total % Used Use Rank
TANESCO grid 0 44 44 0%
Other electricity grid 0 44 44 0%
Diesel Gen-set 1 43 44 2% 7
Gasoline Gen-set 9 35 44 20% 3
Biogas 0 44 44 0%
Wind mill 0 44 44 0%
Solar PV 6 38 44 14% 4
Solar Lantern 1 43 44 2% 7
Car Battery 5 39 44 11% 5
Motorcycle Battery 2 42 44 5% 6
D - Size dry cell batteries 37 7 44 84% 1
C - Size dry cell batteries 10 34 44 23% 2
A - Size dry cell batteries 0 44 44 0%
AA - Size dry cell batteries 0 44 44 0%
AAA - Size dry cell batteries 0 44 44 0%
9 Volt - Size dry cell batteries 0 44 44 0%
Other 2 42 44 5% 6
Total 73 675 748 10% Source: Kigoma Solar Baseline/Interim Survey, 2013
b) How electricity based sources of energy were being used
Table 12 (a) shows that about 65% of the treated respondents were using electricity-based sources of energy for lighting. This was the major use because even torch that accounted of 26% of the responses is used for lighting, indicating that a total of 91% used for lighting. There was no use for cooking. Use for cloth ironing and radios were low as shown in the table.
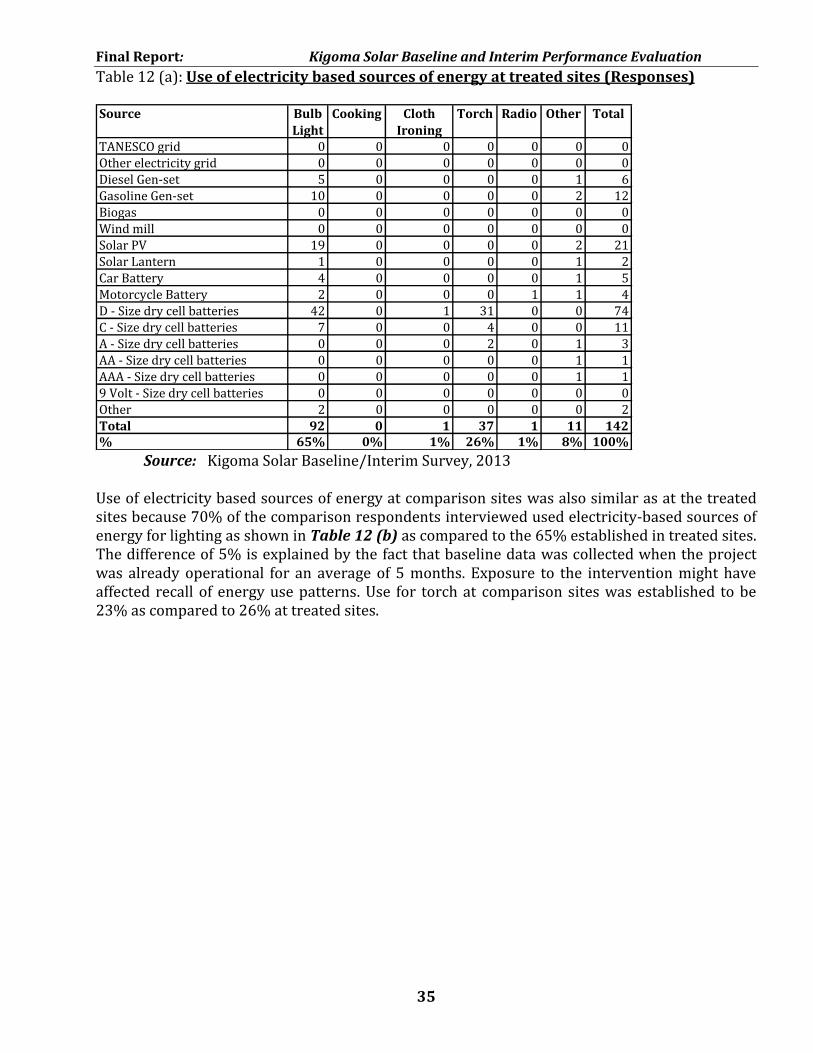
Final Report: Kigoma Solar Baseline and Interim Performance Evaluation
35
Table 12 (a): Use of electricity based sources of energy at treated sites (Responses) Source Bulb
Light
Cooking Cloth
Ironing
Torch Radio Other Total
TANESCO grid 0 0 0 0 0 0 0Other electricity grid 0 0 0 0 0 0 0Diesel Gen-set 5 0 0 0 0 1 6Gasoline Gen-set 10 0 0 0 0 2 12Biogas 0 0 0 0 0 0 0Wind mill 0 0 0 0 0 0 0Solar PV 19 0 0 0 0 2 21Solar Lantern 1 0 0 0 0 1 2Car Battery 4 0 0 0 0 1 5Motorcycle Battery 2 0 0 0 1 1 4D - Size dry cell batteries 42 0 1 31 0 0 74C - Size dry cell batteries 7 0 0 4 0 0 11A - Size dry cell batteries 0 0 0 2 0 1 3AA - Size dry cell batteries 0 0 0 0 0 1 1AAA - Size dry cell batteries 0 0 0 0 0 1 19 Volt - Size dry cell batteries 0 0 0 0 0 0 0Other 2 0 0 0 0 0 2Total 92 0 1 37 1 11 142% 65% 0% 1% 26% 1% 8% 100%
Source: Kigoma Solar Baseline/Interim Survey, 2013 Use of electricity based sources of energy at comparison sites was also similar as at the treated sites because 70% of the comparison respondents interviewed used electricity-based sources of energy for lighting as shown in Table 12 (b) as compared to the 65% established in treated sites. The difference of 5% is explained by the fact that baseline data was collected when the project was already operational for an average of 5 months. Exposure to the intervention might have affected recall of energy use patterns. Use for torch at comparison sites was established to be 23% as compared to 26% at treated sites.

Final Report: Kigoma Solar Baseline and Interim Performance Evaluation
36
Table 12 (b): Use of electricity based sources of energy at comparison sites (Responses) Source Bulb
Light
Cooking Cloth
Ironing
Torch Radio Other Total
TANESCO grid 0 0 0 0 0 0 0
Other electricity grid 0 0 0 0 0 0 0
Diesel Gen-set 1 0 0 0 0 0 1
Gasoline Gen-set 8 0 0 0 0 0 8
Biogas 0 0 0 0 0 0 0
Wind mill 0 0 0 0 0 0 0
Solar PV 6 0 0 0 0 0 6
Solar Lantern 1 0 0 0 0 0 1
Car Battery 4 0 0 0 1 0 5
Motorcycle Battery 2 0 0 0 0 0 2
D - Size dry cell batteries 21 0 0 13 2 0 36
C - Size dry cell batteries 6 0 0 3 1 0 10
A - Size dry cell batteries 0 0 0 0 0 0 0
AA - Size dry cell batteries 0 0 0 0 0 0 0
AAA - Size dry cell batteries 0 0 0 0 0 0 0
9 Volt - Size dry cell batteries 0 0 0 0 0 0 0
Other 1 0 0 0 0 1 2
Total 50 0 0 16 4 1 71
% 70% 0% 0% 23% 6% 1% 100% Source: Kigoma Solar Baseline/Interim Survey, 2013
c) Duration (Hours) electricity-based sources of energy were used
Table 13 presents duration (hours) the electricity-based sources of energy were used before the program. Solar PVs were used by respondents with those systems for longer hours (13.8 hours) than other electricity-based sources of energy. This is because the major input, sunlight, is free. They were followed by dry cell batteries – size C (10 hours), car battery (9.3 hours), motorcycle battery (7.0 hours), dry cell batteries – size D (5.0 hours) and then other sources as shown in the table. Among project participants and beneficiaries, households with solar PVs used them for 24 hours followed by health centres and dispensaries (all 16 hours).
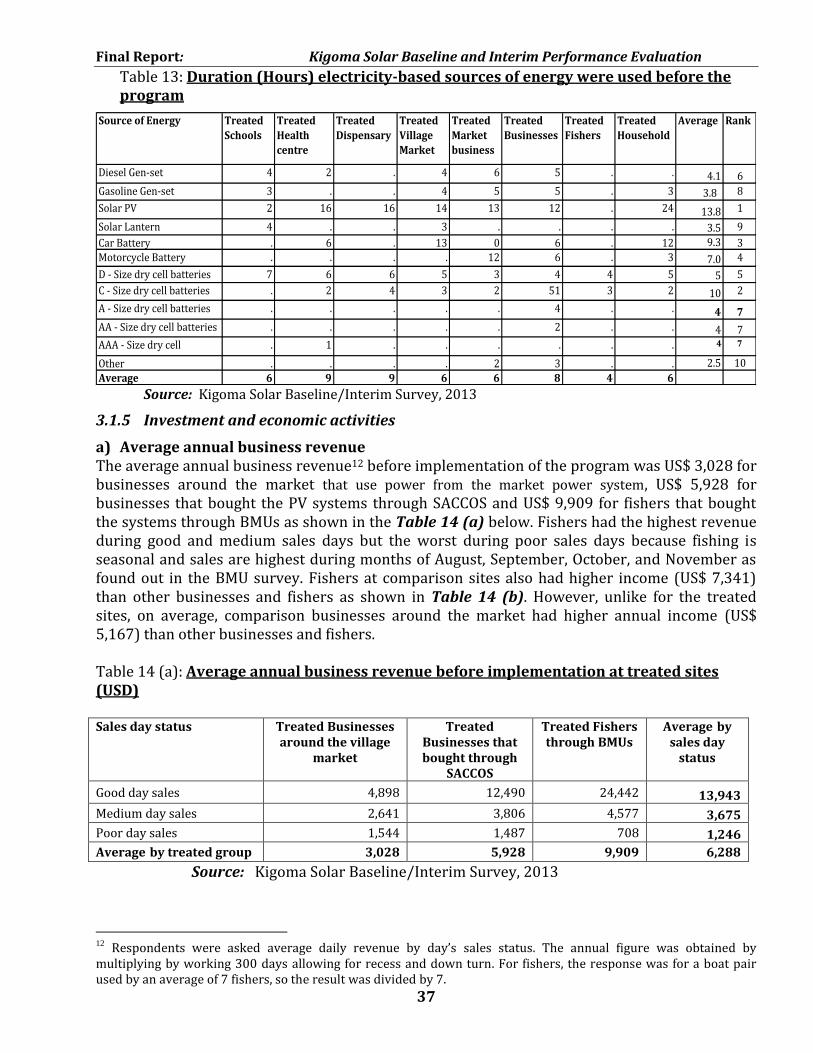
Final Report: Kigoma Solar Baseline and Interim Performance Evaluation
37
Table 13: Duration (Hours) electricity-based sources of energy were used before the program
Source of Energy Treated
Schools
Treated
Health
centre
Treated
Dispensary
Treated
Village
Market
Treated
Market
business
Treated
Businesses
Treated
Fishers
Treated
Household
Average Rank
Diesel Gen-set 4 2 . 4 6 5 . . 4.1 6
Gasoline Gen-set 3 . . 4 5 5 . 3 3.8 8
Solar PV 2 16 16 14 13 12 . 24 13.8 1
Solar Lantern 4 . . 3 . . . . 3.5 9
Car Battery . 6 . 13 0 6 . 12 9.3 3Motorcycle Battery . . . . 12 6 . 3 7.0 4
D - Size dry cell batteries 7 6 6 5 3 4 4 5 5 5
C - Size dry cell batteries . 2 4 3 2 51 3 2 10 2
A - Size dry cell batteries . . . . . 4 . . 4 7
AA - Size dry cell batteries . . . . . 2 . . 4 7
AAA - Size dry cell
batteries
. 1 . . . . . . 4 7
Other . . . . 2 3 . . 2.5 10
Average 6 9 9 6 6 8 4 6 Source: Kigoma Solar Baseline/Interim Survey, 2013
3.1.5 Investment and economic activities
a) Average annual business revenue The average annual business revenue12 before implementation of the program was US$ 3,028 for businesses around the market that use power from the market power system, US$ 5,928 for businesses that bought the PV systems through SACCOS and US$ 9,909 for fishers that bought the systems through BMUs as shown in the Table 14 (a) below. Fishers had the highest revenue during good and medium sales days but the worst during poor sales days because fishing is seasonal and sales are highest during months of August, September, October, and November as found out in the BMU survey. Fishers at comparison sites also had higher income (US$ 7,341) than other businesses and fishers as shown in Table 14 (b). However, unlike for the treated sites, on average, comparison businesses around the market had higher annual income (US$ 5,167) than other businesses and fishers.
Table 14 (a): Average annual business revenue before implementation at treated sites (USD)
Sales day status Treated Businesses
around the village market
Treated Businesses that bought through
SACCOS
Treated Fishers through BMUs
Average by sales day
status
Good day sales 4,898 12,490 24,442 13,943
Medium day sales 2,641 3,806 4,577 3,675
Poor day sales 1,544 1,487 708 1,246
Average by treated group 3,028 5,928 9,909 6,288
Source: Kigoma Solar Baseline/Interim Survey, 2013
12
Respondents were asked average daily revenue by day’s sales status. The annual figure was obtained by multiplying by working 300 days allowing for recess and down turn. For fishers, the response was for a boat pair used by an average of 7 fishers, so the result was divided by 7.

Final Report: Kigoma Solar Baseline and Interim Performance Evaluation
38
Table 14 (b): Average annual business revenue before implementation at comparison sites (USD)
Sales day status Comparison Market Business
Comparison Business
Comparison Fishers
Average by sales day status
Good day sale 7,168 5,703 9,152 7,341
Medium day sale 5,953 6,164 2,879 4,999
Poor day sale 2,378 1,544 1,780 1,901
Average by comparison group 5,167 4,470 4,604 4,747
Source: Kigoma Solar Baseline/Interim Survey, 2013 b) Average annual wages The survey found out that all the sixteen businesses that bought the PV systems through SACCOS that were interviewed had no employee before the Kigoma Solar Project. It was also found out that the twelve businesses that were using power of the village market that were interviewed had only 2 employees who were being paid a total of US$ 103 per month, or US$ 51.56 per employee per month, or US$ 618.75 per shop employee per annum. Employment before the Kigoma Solar Project was found in the fishing activity where the eight boat pairs reported employment of 49 people. The total wage bill of a boat pair per month was reported to be US$ 4,559 that works out to be US$ 93.05 per fisher employee per month or US$ 1,116.58 per employee per annum. c) Energy prices
Respondents at treated sites were asked to mention prices of energy sources before program implementation. Table 15 (a) presents findings. The table shows that charcoal was the most expensive among other energy sources (US$ 7.92 per bag) followed by other biomass residues and petroleum products namely gasoline and kerosene. However, sources of energy use different units. The table also shows that institutions bought kerosene at higher prices (US$ 1.47 to 1.60 per liter) than businesses and households prices (US$ 1.27 per liter). Energy prices at comparison sites are presented in Table 15 (b). The most expensive source of energy was also charcoal (US$ 5.19 per bag).

Final Report: Kigoma Solar Baseline and Interim Performance Evaluation
39
Table 15 (a): Price of energy at treated sites before the project (US$ per unit)
Valid
N
Mean Valid
N
Mean Valid
N
Mean Valid
N
Mean Valid
N
Mean Valid
N
Mean Valid
N
Mean Valid
N
Mean
Kerosene Liter 6 1.60 6 1.47 11 1.49 5 1.54 12 1.27 10 1.48 8 1.44 10 1.27 1.42
Candle - small Pc 5 0.09 3 0.10 11 0.10 4 0.10 11 0.10 12 0.11 8 0.08 9 0.11 0.10
Candle - medium Pc 5 0.16 3 0.11 10 0.15 5 0.12 11 0.16 13 0.14 8 0.17 10 0.14 0.15
Candle - large Pc 0 - 2 0.14 3 0.26 3 0.17 5 0.13 6 0.19 5 0.22 3 0.18 0.19
Biomass Residue -
Firewood
Bundle 7 3.53 3 0.42 13 1.15 5 0.50 12 0.56 10 0.43 8 0.68 12 0.61 0.96
Biomass Residue -
Animal Dung
Bundle 0 - 1 - 1 0.63 0 - 0 - 0 - 1 - 0 - 0.21
Biomass Residue -
straw
Bundle 0 - 0 - 0 - 0 - 0 - 0 - 1 1.88 0 - 1.88
Biomass Residue -
Tree leaves
Bundle 1 0.31 0 - 4 1.17 1 0.63 3 0.44 3 0.51 4 1.02 2 0.31 0.73
Biomass Residue -
Other
Bundle 7 9.73 5 4.19 11 6.65 4 4.69 11 4.64 11 4.38 8 4.20 13 4.83 5.38
Charcoal Bag 0 - 0 - 2 11.88 0 - 0 - 1 - 0 - 0 - 7.92
Other non-
electricity fuel
Bundle 0 - 0 - 0 - 0 - 0 - 1 4.69 0 - 0 - 4.69
Diesel Liter 3 1.42 5 0.93 5 1.69 3 1.40 7 1.25 7 3.49 4 0.72 2 1.63 1.69
Gasoline Liter 4 1.39 5 1.21 10 1.57 4 4.59 10 1.56 9 1.51 8 1.57 6 1.57 1.73
D - Size dry cell
batteries
Pc 9 0.24 6 0.20 13 0.22 5 0.22 12 0.21 15 0.20 8 0.19 14 0.21 0.21
C - Size dry cell
batteries
Pc 8 0.18 4 0.10 10 0.12 4 0.09 11 0.13 12 0.09 7 0.09 7 0.12 0.12
A - Size dry cell
batteries
Pc 2 0.14 1 0.13 1 0.06 2 1.13 6 0.08 1 0.13 3 0.14 0 - 0.23
AA - Size dry cell
batteries
Pc 3 0.10 2 0.09 1 0.09 2 0.08 4 0.18 3 0.13 1 0.63 3 0.17 0.16
AAA - Size dry cell
batteries
Pc 0 - 0 - 0 - 2 0.13 0 - 0 - 0 - 0 - 0.13
Unit Treated
health
centre
Weighted
AverageTreated
business
Treated
dispensary
Treated
village
market
Type of energy Treated
school
Treated
fishers
Treated
household
Treated
market
business
Source: Kigoma Solar Baseline/Interim Survey, 2013

Final Report: Kigoma Solar Baseline and Interim Performance Evaluation
40
Table 15 (b): Price of energy at comparison sites before the project (US$ per unit)
Valid
N
Mean Valid
N
Mean Valid
N
Mean Valid
N
Mean Valid
N
Mean Valid
N
Mean Valid
N
Mean Valid
N
Mean
Kerosene 3 1.54 3 1.56 4 1.63 4 1.98 5 1.56 4 1.48 7 1.60 5 1.46 1.60
Candle - small 2 0.13 1 0.09 3 0.11 2 0.17 7 0.08 - - 5 0.09 6 0.09 0.10
Candle - medium 2 0.19 1 0.13 2 0.20 1 0.13 8 0.15 3 0.17 5 0.16 5 0.16 0.16
Candle - large - 0.00 1 0.19 1 0.25 1 0.19 3 0.19 2 0.17 1 0.19 2 0.11 0.18
Biomass Residue -
Firewood
2 0.31 3 0.83 4 2.27 3 0.94 7 0.96 4 1.17 7 0.76 5 0.85 1.03
Biomass Residue -
Tree leaves
2 0.59 - - - - 2 0.56 3 0.63 2 0.78 4 0.63 2 0.63 0.63
Biomass Residue -
Charcoal
4 7.34 1 6.25 3 6.88 3 4.48 7 4.55 4 5.16 8 3.98 6 5.47 5.19
Diesel 2 1.53 2 1.50 1 1.88 1 1.56 3 1.40 3 1.74 3 1.56 2 1.56 1.57
Gasoline 4 4.61 2 1.59 3 1.67 3 1.73 7 1.48 4 1.58 6 1.46 5 1.50 1.90
D - Size dry cell
batteries
4 0.22 2 0.17 4 0.24 4 0.24 8 0.20 4 0.20 6 0.24 6 0.21 0.22
C - Size dry cell
batteries
4 0.15 2 0.13 4 0.16 4 0.13 7 0.13 - - 4 0.12 5 0.20 0.15
A - Size dry cell
batteries
- - - - - - - - 2 0.08 - - 3 0.11 - - 0.10
AA - Size dry cell
batteries
1 0.28 1 0.13 1 0.13 - - - - - - - - - - 0.18
AAA - Size dry
cell batteries
1 0.16 - - - - - - 1 0.09 - - - - - - 0.13
Weighted
Average
Comparison
village
market
Comparison
business
Comparison
fishersSource of energy Comparison
school
Comparison
health centre
Comparison
dispensary
Comparison
marke
business
Comparison
household
Source: Kigoma Solar Baseline/Interim Survey, 2013
d) Average annual expenditure on energy The survey measured annual expenditure on energy as summarized in Table 16 (a). The weighted average annual expenditure on energy at the surveyed treated sites before the project was estimated at US$ 319 as shown in the table. The largest expenditure was on gasoline at secondary schools (US$ 1,305) followed by kerosene (US$ 988 and then charcoal and firewood. The price of firewood in the market was used to estimate cost of firewood collected for free. The table also shows that fishers were the major users of kerosene while schools and village markets were the major users of gasoline. This result is for the sample covered. The table also shows that fishers spent more on kerosene (US$ 6,286 per annum) than other project participants and beneficiaries followed at far by health centres (US$ 736 per annum). The pattern of expenditure was the same at comparison sites as shown in Table 16 (b). It seems that secondary schools were spending a lot on gasoline. It was also reported during Focus Group Discussions (FGDs) that schools required students to contribute money for purchase of gasoline.

Final Report: Kigoma Solar Baseline and Interim Performance Evaluation
41
Table 16 (a): Average annual expenditure on energy at treated sites (US$)
Valid
N
Mean Valid
N
Mean Valid
N
Mean Valid
N
Mean Valid
N
Mean Valid
N
Mean Valid
N
Mean Valid
N
Mean
Kerosene 2 541 6 736 11 292 5 525 7 90 10 73 7 6286 10 60 988 2
Candle - small - - 1 180 2 45 4 46 - - - - - - 65 7
Candle -
medium
- - - - 1 94 4 72 4 168 3 114 - - 3 54 104 6
Candle - large - - - - - - 2 26 - - 2 76 - - - 51 8
Biomass
Residue -
Firewood
3 968 3 55 2 338 - - 2 236 6 78 2 83 4 49 229 4
Biomass
Residue -
Charcoal
4 161 5 275 6 645 - - 2 60 4 484 7 189 331 3
Diesel - - 3 250 - - - - - - 1 72 - - - - 206 5
Gasoline 1 1485 - - - - - - 1 1125 - - - - - - 1,305 1
D - Size dry cell
batteries
8 26 6 14 12 21 5 77 6 15 14 15 7 36 13 21 25 9
C - Size dry cell
batteries
- - 2 8 - - 3 31 1 2 1 2 1 9 1 8 14 10
Weighted
Avearge
351 269 253 168 122 54 2,208 68 319
Weighted
Average
RankTreated
Businesses
Treated
Fishers
Treated
Households
Type of
Energy
Treated
Schools
Treated
Health
Centre
Treated
Dispensary
Treated
Village
Market
Treated
Market
Businesses
Source: Kigoma Solar Baseline/Interim Survey, 2013

Final Report: Kigoma Solar Baseline and Interim Performance Evaluation
42
Table 16 (b): Average annual expenditure on energy at comparison sites (US$)
Valid
N
Mean Valid
N
Mean Valid
N
Mean Valid
N
Mean Valid
N
Mean Valid
N
Mean Valid
N
Mean Valid
N
Mean
Kerosene 1 113 3 350 8 227 4 436 5 332 4 4,856 14 121 5 59 632 2
Candle - small - - - - - - 1 141 - - - - 2 270 - - 227 5
Candle - medium - - - - - - - - 1 300 - - 6 115 - - 141 6
Candle - large - - - - - - - - - - - - - - - - -
Biomass Residue -
Firewood
- - 2 103 - - 1 180 2 289 1 135 4 450 4 194 263 4
Biomass Residue -
Charcoal
1 120 1 375 4 552 1 648 4 375 2 405 4 506 4 196 403 3
Diesel - - - - - - - - - - - - - - - - -
Gasoline 1 1,125 - - - - - - - - - - - - - - 1,125 1
D - Size dry cell batteries 4 13 2 32 4 72 4 99 8 21 4 14 10 59 6 17 41 7
C - Size dry cell batteries - - 1 18 - - 1 6 - - 2 7 2 14 1 18 12 8
Weighted Avearge 202 190 269 260 210 1,572 175 99 303
RankComparison
fishers
Comparison
market
business
Comparison
household
Weighted
Average
Type of Energy Comparison
school
Comparison
health centre
Comparison
dispensary
Comparison
village
market
Comparison
business
Source: Kigoma Solar Baseline/Interim Survey, 2013

Final Report: Kigoma Solar Baseline and Interim Performance Evaluation
43
e) Cost of energy devices The cost of devices used for generating energy is an important input in energy evaluation. Respondents at treated sites were asked to mention the cost of energy devices in the market before program implementation. The highest cost mentioned was for diesel generator (US$ 243) followed by Solar power (US$ 162), gasoline generator (US$ 116), car battery (US$ 82), pressurized kerosene lamp (US$ 23) , motor cycle battery (US$ 22), Hurricane lantern (US$ 3), and torch (US$ 1) - in that order as shown in Table 17 (a). The level of costs was similar in the comparison sites except for the cost of diesel and gasoline gen-sets that were found out to be lower in comparison sites than at treated sites as shown in Table 17(b).
Table17 (a): Cost of energy devices at treated sites before the project (US$)
Valid
N
Mean Valid
N
Mean Valid
N
Mean Valid
N
Mean Valid
N
Mean Valid
N
Mean Valid
N
Mean Valid
N
Mean
Hurricane
lantern8 2 4 3 11 2 5 3 11 2 12 2 8 3 13 3 3
Presurrized
kerosene
lamp
4 16 1 19 2 25 - - 3 20 6 18 8 32 2 13 23
Diesel Gen-
set4 313 1 188 - - 1 281 2 184 - - 1 250 1 94 243
Gasoline Gen-
set3 119 2 125 4 144 2 75 3 144 2 94 5 126 3 71 116
Solar PV 3 240 2 281 - - 2 234 5 34 3 185 5 158 3 152 162
Car Battery 6 90 1 63 3 75 3 38 3 52 8 79 5 94 3 140 82
Motorcycle
Battery8 15 - - 3 19 3 21 7 17 7 37 6 14 2 40 22
Torch 10 1 5 1 12 1 4 1 10 1 11 1 7 1 12 1 1
Type of
energy
device
Weighted
Average
Treated
dispensary
Treated
village
market
Treated
market
business
Treated
business
Treated
fishers
Treated
household
Treated
school
Treated
health
centre
Source: Kigoma Solar Baseline/Interim Survey, 2013
Table17 (b): Cost of energy devices at comparison sites before the project (US$)
Valid
N
Mean Valid
N
Mean Valid
N
Mean Valid
N
Mean Valid
N
Mean Valid
N
Mean Valid
N
Mean Valid
N
Mean
Hurricane
lantern
5 2 1 5 3 4 4 3 8 3 4 2 6 2 7 2 3
Presurrized
kerosene
lamp
0 0 0 0 1 0 0 0 0 0 2 27 2 31 0 0 23
Diesel Gen-
set
0 0 1 50 1 56 0 0 1 188 1 188 2 87 0 0 109
Gasoline
Gen-set
3 81 0 0 3 102 2 131 2 88 3 100 3 73 1 88 94
Solar PV 1 156 2 100 2 234 2 156 2 319 0 0 3 47 2 125 155
Car Battery 1 50 1 75 2 106 2 94 3 71 0 0 3 62 4 58 72
Motorcycle
Battery
2 23 1 25 2 22 1 9 3 30 1 19 1 62 3 19 25
Torch 4 2 3 1 3 1 3 1 7 1 3 1 8 1 8 3 2
Comparison
dispensary
Comparison
household
Comparison
market
business
Comparison
fishers
Comparison
business
Comparison
village
market
Type of
energy
device
Comparison
school
Comparison
health
centre
Weighted
Average
Source: Kigoma Solar Baseline/Interim Survey, 2013

Final Report: Kigoma Solar Baseline and Interim Performance Evaluation
44
3.1.6 Human capital accumulation
a) Schools with afterhours study programs The project documents that were bases for the study design indicated that the project was the first solar power project in the area and that all areas were not connected to grid electricity. Therefore, no afterhour study programs were expected to exist at the treated schools and that data was not collected from the surveyed treated schools. However, the survey established that one out of the 10 treated secondary schools or 10% had solar system before the project. The survey asked comparison schools, whether they had introduced afterhour study programs. Two (2) out of the five (5) comparison schools interviewed or 40% had afterhour study programs. Since the selection of comparison schools ensured that they do not have solar system. This has been considered as a proxy of the situation at the treated sites because only 10% had solar system before the project. b) Availability of vaccines The survey established that 5 out of the 6 treated health centres or 83% and 13 out of the 14 treated dispensaries surveyed or 93% had vaccine refrigerators before the Kigoma Solar program as shown in Table 18 (a). However, despite having the refrigerators, one out of the 6 treated health centres or 17% and 1 out of the 14 treated dispensaries or 7% were not providing vaccines because they were short of LPG fuel that runs the refrigerators. The consultant was informed that during such situations, vaccines are immediately transferred to a neighbouring facility with a functioning refrigerator or to the District Hospital. This limitation is expected to be resolved when the solar vaccine refrigerators are installed at the health centres and dispensaries. Therefore, solar vaccine refrigerators may contribute to increase of availability of vaccines at the health centres and dispensaries as hypothesized in the project logic. But, the increase cannot be attributed to the solar refrigerators of the project alone because of the existence of the LPG powered refrigerators in the project area and only a few (1 out of the 6 health centres and 1 out of the 14 dispensaries) had shortage of LPG. All the comparison health centres and dispensaries were providing vaccines and had the LPG powered refrigerators as shown in Table 18 (b). Table 18 (a): Treated Health Centres and Dispensaries that provided vaccines before the program
Facility Provided vaccines before
Was not providing vaccines before
Total % was providing vaccines before
Had a vaccine refrigerator before
Had no vaccine refrigerator before
Total % had the vaccine refrigerator before
Health centre
5 1 6 83% 6 0 6 100%
Dispensary 13 1 14 93% 14 0 14 100%
Weighted Average
90% 100%
Source: Kigoma Solar Baseline/Interim Survey, 2013

Final Report: Kigoma Solar Baseline and Interim Performance Evaluation
45
Table 18 (b): Comparison Health Centres and Dispensaries that provided vaccines before the program
Facility Provided vaccines before
Was not providing vaccines before
Total % was providing vaccines before
Had a vaccine refrigerator before
Had no vaccine refrigerator before
Total % had the vaccine refrigerator before
Health centre
3 0 3 100% 3 0 3 100%
Dispensary 4 0 4 100% 4 0 4 100%
Weighted Average
100% 100%
Source: Kigoma Solar Baseline/Interim Survey, 2013 With regard to number of vaccine doses available, baseline data was collected from comparison sites only because there was a skip of that question in the questionnaire of treated health centres and dispensaries if the facility is not yet installed with MCA-T system. Review of records on movement of stocks established that the health centres and dispensaries had an average of 258 doses of Polio vaccine, 192 doses of Measles vaccine, 203 doses of BCG vaccine in stock per facility six months before the survey as shown in Table 19. The table also shows that more doses were stocked at dispensaries than at health centres, indicating that the latter are the primary facilities for Mother and Child Health (MCH) care. The data indicates that some vaccines were not available at some dispensaries than at health centres. Table 19: Vaccines available at comparison sites six months before the survey (Number of Doses)
(a) Comparison Health Centre:
District Polio Vaccine in Stock Measles vaccine in stock BCG vaccine in stock
Valid N Sum Mean Valid N Sum Mean Valid N Sum Mean
Kasulu 1 300 300 1 150 150 1 240 240
Buhigwe 2 100 50 2 40 20 2 40 20
Sub-total 3 400 350 3 190 170 3 280 260
(b) Comparison Dispensary:
District Polio vaccine in stock Measles vaccine in stock BCG vaccine in stock
Valid N Sum Mean Valid N Sum Mean Valid N Sum Mean
Uvinza 2 1240 620 2 1000 500 2 1020 510
Buhigwe 1 100 100 1 120 120 1 100 100
Kasulu Mjini 1 66 66 1 37 37 1 24 24
Sub-total 4 1406 786 4 1157 657 4 1144 634
Weighted Average Doses 258 192 203
Source: Kigoma Solar Baseline/Interim Survey, 2013
The survey also established that other types of vaccines are being stocked at the health centres and dispensaries. They include OPV for poliomyelitis, Pentavalent for three diseases namely Diptheria, Tetanus and Pertusis (DPT), PCV(Polysaccharide Conjugate Vaccine) for pneumonia prevention, Rotavirus/ROTARIX for diarrhea prevention, Tetanus Toxoid (TT) for tetanus and Vitamin A for prevention of Vitamin A deficiency.

Final Report: Kigoma Solar Baseline and Interim Performance Evaluation
46
c) Vaccinations administered Polio vaccine is administered at birth (0) and then after every month for the next 3 months. BCG vaccine is administered at birth (0) repeated after 3 months if a scar did not occur after the at 0 administration. Measles vaccine is administered at the age of 9 months together with Vitamin A. Data on vaccine administered was collected as secondary data from the council because registers had no total of doses provided. The day average for the three types of vaccines worked out at 242 doses of Polio vaccine, 75 doses of Measles vaccine, 79 doses as shown in Table 20.
Table 20: Number of Vaccine Doses Administered
S/N
Vaccine Type of Health Facility
Total No. of Facilities
Number of Vaccine Doses Administered Annual Average
Day Average
2008 2009 2010 2011 2012
1 BCG Health Centres (6) and Dispensaries (64)
70 22,699 21,929 23,874 24,461 25,980 23,789 79
2 Polio Health Centres (6) and Dispensaries (64)
70 66,765 54,846 78,860 80,316 81,643 72,486 242
3 Measles Health Centres (6) and Dispensaries (64)
70 21,079 21,592 22,205 22,998 24,334 22,442 75
Source: Kigoma Rural District Council
3.1.7 Compact Goal indicator - Poverty reduction through economic growth
Poverty reduction and economic growth has been measured by “average annual household income per capita” through interview of non-treated (comparison) individual household members. This was adopted as baseline rather than using recall data, which could not be easily memorized due to lack of records. Findings from the survey revealed that the baseline average annual household income per capita was US$ 233.25. This is lower than the documented baseline value of US$ 246 based on 2008 figures (Table of Energy Indicator Baselines and Targets). It is also lower than the national per capita income of TZS 693,185 or US$ 433 established by the Economic Survey of 2009. It is also far lower than HBS (2007) monthly income in rural areas - TZS 28,418 (equivalent to US$ 22.80 per month or 273.55 per annum). Previous Human
Development Reports place Kigoma Region among poor/deprived regions of Tanzania based on both
Human Development Index (HDI) and Human Poverty Index (HPI).
3.1.8 Conditions needed to be in place to encourage investments in energy Survey of comparison institutions and households identified conditions necessary for encouraging investments in energy. Table 21 shows the conditions. The modal/most frequently mentioned factor was market sensitization followed by low cost/price, availability of energy loans, easy availability of energy systems and appliances in nearby rural areas, market/demand sensitization, and then other factors.

Final Report: Kigoma Solar Baseline and Interim Performance Evaluation
47
Table 21: Distribution of Project Participants responses on conditions needed to be in place in order to encourage investment into energy
Factor CS CHC CD CVM CMB CF CB CH C-BMU Total Rank
Market/demand assurance 1 1 1 1 1 5 5
Low cost/price 4 2 3 2 1 12 2
Existence of needs 2 2
Market sensitization 3 1 3 2 2 3 5 5 2 26 1
Easy availability of energy systems and appliances in nearby rural areas
1 1 1 1 1 1 6 4
Availability of technicians to provide support
1 1
Energy loans to farmers with repayment tagged to sell of harvests
1 1
Government efforts to get donors 1 1 2
Security 1 1 2
Improvement of transport infrastructure 1 1
Availability of energy source loans 1 4 4 9 3
Energy loans to farmers with repayment tagged to sell of harvests
1 1
People building durable houses 1 1 1 3 6
Maintaining trustworthiness for those loaned the energy systems
1 1
Improvement of performance of businesses
1 1
Supply of high capacity energy systems that meet needs satisfactory
1 1
Increase loan repayment period 1 1
KEY:
CS = Comparison schools CHC= Comparison Health Centres
CD = Comparison Dispensary
CVM= Comparison Village Market CMB= Comparison Market Businesses
CF = Comparison Fishers CB = Comparison Business CH= Comparison
Household C-BMU= Comparison BMUs
Source: Kigoma Solar Baseline/Interim Survey, 2013

Final Report: Kigoma Solar Baseline and Interim Performance Evaluation
48
3.2 PROCESS EVALUATION
3.2.1 Project Design
The evaluation established that the program logic clearly illustrates the objectives of the Kigoma solar project, the theory of change and the expected results; both in the short and long terms. The project has demonstrated capacity to fulfill some energy needs and changing communities as shown in this report. FGD participants (both treatment and comparison) had a view that energy interventions are relevant. They mentioned expected benefits. As a show of interest, some comparison participants inquired price/costs and community contribution if such a project is brought to their village. Section 2.1.3 of the Feasibility Study for the project states that unlike past solar PV initiatives, the project factored in “recurrent budget constraint” to ensure that should something go wrong or a component such as a battery need to be replaced, there will be funds to do that. This constraint was addressed in the project design by including provision of cell phone charging and multimedia services at a fee at the institutions. These were likely to support sustainability for institutions’ solar systems that already existed at some of the treated sites before the project.
However, there were some design and M&E shortfalls, which are discusses in this sub-section.
(a) Design shortfalls
The evaluation determined that the design was not as comprehensively thought as it should have been. For instance, the program logic assumed that the capacity of the systems installed was an appropriate level. The evaluation found out that the capacity of PV systems provided by the program was lower than the needs. Apparently, the consultant recommended solar PV systems assuming that recipients will use the systems for lighting and other uses explained in Section 1.3 (Project Description), but it is indicated in this report that recipients wanted electricity that would be used for other appliances such as refrigerators and there was evidence from both qualitative and quantitative data that some recipients put the installed PV systems to unintended uses. Chapter 2 of the Feasibility Study (Market Characteristics) should have included wishes of people and businesses in the project area on how they would use electricity once it is available and ability to buy appliances.
Moreover, the evaluation findings indicate that the hypotheses that the introduction of solar installations in the health centers and dispensaries would increase availability of vaccines cannot be related to the project alone because the majority of health centers (5 out of 6 or 83%) and dispensaries (13 out of 14 or 93%) surveyed already had LPG powered refrigerators that were found storing vaccines before the project. The assumption that the project was the first solar project in the area was also not correct because the evaluation found out that about 24% of the treated sites were using solar PVs before the program that were either installed by other donors at the public institutions or bought from the market by businesses and households. Therefore, it seems that the Kigoma Solar project made installations in some places that already had solar power.
(b) M&E shortfalls
The evaluation also revealed that the Monitoring and Evaluation (M&E Plan) as summarized in the
Program Logic was not as accurate as it needed to be. The program logic incorrectly categorized number of systems supplied/sold to BMUs as an output, instead of being an outcome. Furthermore, the logic omitted businesses connected to the PV system of the village market, fishers/boat owners that purchased PV systems through BMUs, and owners/managers of businesses that purchased PV systems through SACCOs. The outcome indicator on the number of

Final Report: Kigoma Solar Baseline and Interim Performance Evaluation
49
PV systems sold and installed at households should have been separated into households and businesses.
Therefore, the Program Logic was not comprehensive enough such that it required adjustments of the indicators and the logic during the study design and evaluation. It seems that design shortfalls affected comprehensiveness of the Program Logic.
3.2.2 Project Risks
Review of reports of the Supervising Consultant revealed that monitoring identified risks that were mitigated. However, based on assessment of challenges of project implementation and operations, and factors that limited households, businesses and fishers to buy the solar systems; the consultant has identified risks that may affect attainment of expected changes. These include the following:
(i) Subsistence strategy patterns do not change:
Challenges and limitations mentioned by respondents indicate that poor communities generally do not have the flexibility to forego short-term benefits (some money in the pocket today for the family evening meal) for the sake of long-term livelihood sustainability13. The traditional subsistence strategies of the local population and the often patronizing approach to ‘helping’ poor rural communities from external agents represent a significant risk for the success of this project. Unless this behavior changes, they will remain dependent on short-term gains and never be able to break out of the poverty cycle. Avoiding this risk requires behavioral changes from external development agents and the poor people themselves. Capacity building and communications will mitigate this risk.
(ii) Resistance to change:
Evaluation of the project established that there were people who could not access the solar systems because of negative perception or fear of change. Therefore, success of the project needs mindset change and this takes time and courage. Without such changes, sustainability of the intervention through repair and maintenance of systems provided/bought and/or replacement with new ones could be affected. Lessons learned indicate that an empirical approach is needed, where learning-by-doing is a critical element. This is in line with the prime objective of Kigoma Solar Project - to introduce solar electricity solution as modern affordable energy in the area.
(iii) Accountability vacuum:
The solar systems will continue affecting intended changes if led by people who are sufficiently engaged in the activities of the beneficiary institution/facility. The evaluation found that the implementation at beneficiary level was managed by select committees. However, some committees were still managing the installations during the survey. Without timely and proper handover to the management of the institutions/facilities, there will be accountability vacuum that, if not properly managed, may affect sustainability of the systems.
(iv) Cultural beliefs and public perceptions:
There are worries brought forward by beneficiaries including the requirement for technical support once connected yet such services may not be available in remote areas. Another worry mentioned by FGD participants is the risk of electrical faults igniting fire that can
13
The survey revealed challenges related to complaints that beneficiaries had to contribute to the project and lack of technicians and knowledge despite the training given by the project.

Final Report: Kigoma Solar Baseline and Interim Performance Evaluation
50
destroy property and lives. It is also thought that theft of the PV system installed will lead to great loss of benefits being enjoyed, forcing community members to contribute for its replacement.
A few FGD participants were worried about being bewitched after getting electricity by neighbours still in the dark- jealousy is rampant in the community. Gender issues also featured significantly. A female participant at Herujuu Village in Kasulu District said that:
“Electricity is for rich people with good houses and security. I cannot afford and even if I get it, it is likely to be stolen and sold to rich people; I have a grass-thatched house that will make me ridiculed if I install electricity, because it is likely to be burned by the electricity. ………. Women are unlikely to buy solar in their own because they are worried husbands will be angry for a woman to buy such an important system without showing source of the money and getting husband’s permission”.
Some participants emphasized that benefits will be sustainable if there will be technical support. Theft of systems was another worry. A few FGD participants were worried about theft of the panels. A male FGD participant at Nyenge Village identified a potential theft risk:
“There have been attempted thefts of the PV systems installed at some facilities. For instance at Rungwempya Secondary School thieves attempted to steal the PV system. It was rescued by Rungwempya villagers after surrounding the thieves who were forced to drop the components at the village pond, unless security is increased, theft may affect flow of the benefits being enjoyed”.
(v) Implementation challenges:
Comparison FGD participants said expected challenges during implementation of energy interventions include lack of knowledge of the technology and its benefits. Trials are very important. Houses being thatched by grass, low income of the majority of community members, need for credit purchase, short loan repayment periods, uncertainty on availability of technicians were also mentioned as challenges. Perceived high cost and resistance to changes were also expected to be challenges of the implementation.
A female FGD participant at Kasangezi Village claimed that there are people benefiting from lack of electricity at health facilities and secondary schools. She narrated an example that:
“There are secondary school teachers that run after hour studies using petrol generator. Each student has to contribute between TZS 2,500 and 3,000 for re-filling the generator. A student who cannot pay is not allowed to attend even day-time studies. This is a lot of money for the whole schools or class such that such teachers may be against introduction of solar electricity”
3.2.3 Summary of implementation: The evaluation established that a Project Implementation Plan (PIP) was prepared to guide execution of the activities. Implementation activities included mobilization, marketing, training, public and demonstration system roll-out, the household market and monitoring and evaluation. Roll-out was scheduled to be done between March 2012 and May 2013 but there were some changes of timeline for some activities as reported in the progress reports of the Supervising Consultant up to September 2013. The evaluation found out that all what was planned to be done with the exception of solar refrigerators had been done as it was planned. Only wiring for the solar refrigerators had been done and none of the health centres and dispensaries visited was installed with the refrigerator. Most of the health centres (5 out of 6 or 83%) and dispensaries (13 out of 14 or 93%) covered by the survey were using vaccine refrigerators powered by LPG before the project.

Final Report: Kigoma Solar Baseline and Interim Performance Evaluation
51
3.2.4 Implementers The institutional arrangement for implementation of Kigoma Solar Project comprised of MCC, MCA-T, Service Provider (SP) who was the contractor, Supervising Consultant, office of the Regional Administration Secretary (RAS) for Kigoma Region, Local Government Authorities for Kigoma Rural and Kasulu Districts, and target communities. Each had specific roles and responsibilities. MCA-T coordinated the team of implementers. Review of progress reports did not identify any issue concerning the work arrangement. Data and reports were submitted to the
M&E department through the energy sector as required. Therefore, the institutional arrangement can
be adopted if a similar project is implemented.
3.2.5 Projected and Actual costs The Feasibility Study for Kigoma Solar projected costs in the region of US$ 4,755,603, which includes US4 4,318,41514 for implementation. According to data obtained from MCA-T in November 2013, expected actual costs will be US$ 5,357,729.37. This value comprises of US$ 196,094.24 for the feasibility study, design and bid preparation works; US$ 415,578.13 for supervision work and US$ 4,746,057 for construction contract. Therefore, total costs were higher than original cost by US$ 602,126.37, or 13% of the original cost. The increase was due to changes of the scope of work. For instance, the contract for the feasibility study was modified to include design and bid preparation works. He was also given a separate contract for supervision work. The construction contract was modified so as to include replacement of flexible wires for the village market businesses installation by a fixed permanent underground installation that added US$ 10,425.00, US$ 2,982.00 was added for replacement of solar panels stolen at 2 secondary schools and one dispensary in Kasulu District and US$ 13,553 was added for changing some LED light fishing systems to experiment another type of the systems.
3.2.6 Stakeholders Participation
The survey interviewed heads of facilities and households provided with the PV systems. On average, only about 22% of those interviewed got an opportunity to contribute their ideas during the design of the project as shown in Table 22, indicating that about 78% did not contribute. However, when asked whether they would have liked to contribute ideas, all responded that they would have contributed ideas, implying that participation of stakeholders during the design of the project was limited. The main reason for this can be explained by the fact that Kigoma solar project was add-in. Information obtained from the Feasibility Study of the project indicates that the Kigoma Solar Project was an emergence sub-activity introduced after removal of a hydro-electric power station project - Malagarasi II from the Compact activities due to environmental concerns. Therefore, since the compact duration had already been set, use of participatory design methodologies such as Participatory Rural Appraisal (PRA) would have reduced time for implementation before the compact ends.
14
This includes cost of the Service Provider/contractor (US$ 3,722,151), Marketing (US$ 143,525), Training (US$ 247,100) and 5% of the cost items (US$ 205,639) for contingencies.

Final Report: Kigoma Solar Baseline and Interim Performance Evaluation
52
Table 22: Beneficiary participation in the design of the project (Number)
Facility Contributed Did Not Contribute
Total % Contributed
Treated Schools 4 6 10 40%
Treated Health Centre 2 4 6 33%
Treated Dispensary 1 13 14 7%
Treated Village Market 1 4 5 20% Treated Businesses around the village market
2 10 12 17%
Treated SACCOS 1 3 4 25%
Treated Businesses 2 14 16 13%
Treated BMUs 2 2 4 50%
Treated Fishers: 2 6 8 25%
Treated Households 3 14 17 18%
Stakeholders 6 14 20 29%
Total 26 90 116 22% Source: Kigoma Solar Baseline/Interim Survey, 2013
3.2.7 Activity Monitoring
Oversight/supervision to ensure that project works were going as planned was done by an Individual Supervising Consultant Mr. Axel Scholle from South Africa. The same consultant had carried out the feasibility study, design and Request for Proposals (Bidding Document) for the program. He was assisted by a local representative based in Kigoma. The Supervising Consultant was required to make 21 field supervision visits. He made more than the contract visits. The presence of a local representative in Kigoma was expected to complement the visits through continuous observations. The Supervisor was required by his contract to prepare five (5) Progress Reports. All these reports were prepared between March 2012 and September 2013. The close-up report was also expected to be submitted in September 2013. Besides the progress reports, he was also supposed to submit weekly updates, which were done as required.
This arrangement was based on the way engineering projects are monitored. However, review of documents did not show whether the consultant was responsible for signing work progress certificates of the contractor and whether such certificates were tied to payments. It is also not clear whether there were joint meetings of all those involved in the implementation of the project and how such meetings made decisions to affect progress or quality of work. For future projects, the consultant should be responsible to authorize payments and time and quality control should not be in the hands of the consultant alone but rather group decision of all institutions involved in the implementation of the project.
3.2.8 Selection of Participants and Recruitment
This project was designed to complement the Distribution Systems, Rehabilitation and Extension Activity intervention in Kigoma to increase overall access to electricity. It was developed after environmental concerns caused the removal of a hydro-electric power station project - Malagarasi II from the Compact activities. MCA-T chose PV systems to address the energy needs and shortage of modern affordable energy in the Kigoma region. The Kigoma Solar sub-activity targeted the 25 villages that were to get electricity from the abandoned power station project - Malagarasi II. These villages were the first priority. However, in order to introduce modern

Final Report: Kigoma Solar Baseline and Interim Performance Evaluation
53
affordable energy to a wide area in the Kigoma region, the contractor and consultant in collaboration with Kigoma Region authorities were asked by MCA-T to select additional villages in Kigoma Rural and Kasulu districts. Recruitment of the Service Provider and consultants was done as per MCC Program Procurement Guidelines.
With regard to the selection of project participants and beneficiaries, this was also done by the contractor and consultant in collaboration with Kigoma Region authorities. The aim was to cover as many villages and public institutions as well as SACCOS as possible within available budget. In order to achieve the objective, public institutions15 serving many people were selected to be beneficiaries. These included public secondary schools, dispensaries, health centres, and village markets. BMUs and SACCOS were also selected as conduits for introducing the solar PV systems to fishermen, small businesses and households because of the large following they command in their areas of operations.
The selection criteria used included:
1) Villages pre-selected by MCA-T, that would have benefited from Malagarasi Hydro Power Project;
2) Villages with the greatest number of potential beneficiaries (i.e. all division headquarters and villages with population greater than 10,000;
3) Preferably Government institution (best judgement);
4) Look for dispensaries with the largest number of beneficiaries in the same wards as other installed systems for more efficient maintenance services and support;
5) Only BMUs registered by the Government, Two grid BMUs in Kigoma town; and
6) Village markets selected in villages with permanent market building infrastructure and village committees that grant security and O&M, especially revenue collection.
Assessment of the evaluation criteria revealed that as an add-in project the first criteria of selecting villages that would have benefits from the hydro power project were justified. However, the criteria did not include guideline for selection of SACCOS and the businesses and households that bought the PV systems through the marketing approach involving SACCOs. The criteria for BMUs and village markets were not comprehensive enough because it did not indicate how fishers and businesses around the market would be selected. Moreover, selecting “division headquarters and villages with population greater than 10,000” made the project to concentrate on semi-urban and easy to access rural areas leaving out the hard to reach rural areas. The fourth criteria on selecting dispensaries in the same wards as other installed systems focused on implementation convenience rather than energy needs of the villages. Gender was not included in the selection criteria. The selection criteria neither acknowledged existence of the solar system at some institutions, businesses and households nor provided guidance on how and why the project should install PV systems in places where they already existed. Since the selection criteria did not address all the target energy needs and it limited electricity service coverage, it constrained attainment of the project’s purpose and objectives.
15
Included private institutions such as health centres designated by the Government to serve a certain area as public service
providers
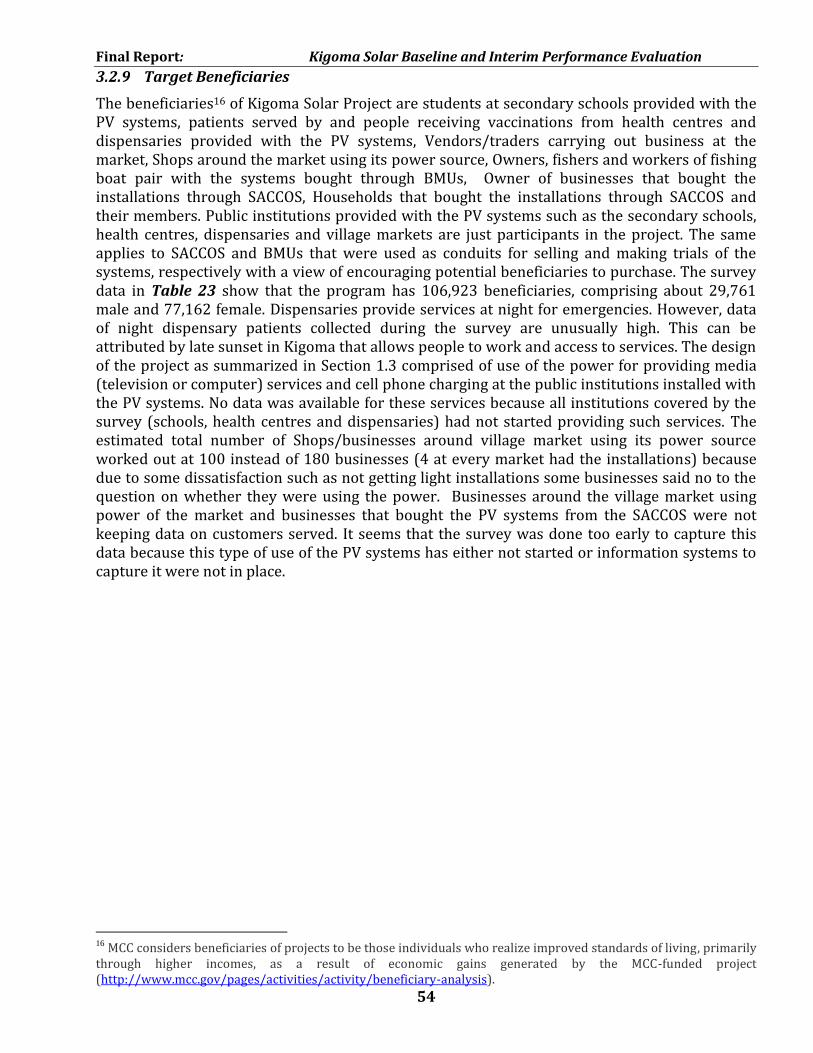
Final Report: Kigoma Solar Baseline and Interim Performance Evaluation
54
3.2.9 Target Beneficiaries
The beneficiaries16 of Kigoma Solar Project are students at secondary schools provided with the PV systems, patients served by and people receiving vaccinations from health centres and dispensaries provided with the PV systems, Vendors/traders carrying out business at the market, Shops around the market using its power source, Owners, fishers and workers of fishing boat pair with the systems bought through BMUs, Owner of businesses that bought the installations through SACCOS, Households that bought the installations through SACCOS and their members. Public institutions provided with the PV systems such as the secondary schools, health centres, dispensaries and village markets are just participants in the project. The same applies to SACCOS and BMUs that were used as conduits for selling and making trials of the systems, respectively with a view of encouraging potential beneficiaries to purchase. The survey data in Table 23 show that the program has 106,923 beneficiaries, comprising about 29,761 male and 77,162 female. Dispensaries provide services at night for emergencies. However, data of night dispensary patients collected during the survey are unusually high. This can be attributed by late sunset in Kigoma that allows people to work and access to services. The design of the project as summarized in Section 1.3 comprised of use of the power for providing media (television or computer) services and cell phone charging at the public institutions installed with the PV systems. No data was available for these services because all institutions covered by the survey (schools, health centres and dispensaries) had not started providing such services. The estimated total number of Shops/businesses around village market using its power source worked out at 100 instead of 180 businesses (4 at every market had the installations) because due to some dissatisfaction such as not getting light installations some businesses said no to the question on whether they were using the power. Businesses around the village market using power of the market and businesses that bought the PV systems from the SACCOS were not keeping data on customers served. It seems that the survey was done too early to capture this data because this type of use of the PV systems has either not started or information systems to capture it were not in place.
16
MCC considers beneficiaries of projects to be those individuals who realize improved standards of living, primarily through higher incomes, as a result of economic gains generated by the MCC-funded project (http://www.mcc.gov/pages/activities/activity/beneficiary-analysis).

Final Report: Kigoma Solar Baseline and Interim Performance Evaluation
55
Table 23: Type and Number of Beneficiaries
Beneficiary Group Program Coverage
Survey Average per installation
Program Estimated Total
Male Female Male Female a) Beneficiaries of secondary school installations: Schools 45 Students 217 112 9,761 5,045 b) Beneficiaries of health centres installations: Health centres 14 Patients served by health centres per day (day time) 12 19 168 270 Patients served by health centres per day (night time) 1 3 16 46 c) Beneficiaries of dispensaries installations: Dispensaries 116 Patients served by the dispensaries per day (day time) 83 90 9,633 10,454 Patients served by the dispensaries per day (nighttime) 72 72 8,369 8,401 d) Beneficiaries of Vaccine Refrigerators: 130 Vaccinations administered per day (to male and female) 395.72 51,444 e) Beneficiaries of village market installations: Village markets 25 Vendors/traders carrying out business at the market 42 53 1,050 1,321 People providing hair cutting services using the electricity 0.5 0.0 13 0 Shops around the market using its power source 2.5 1.5 70 30 f) Beneficiaries of night fishing installations: BMUs 60 Owners and fishers using fishing boat pair 60 Workers of fishing boat pair provided with the systems 6.5 390 g) Beneficiaries of business and household systems sold: SACCOS 22* Owner of businesses that bought the installations 2 1 44 22 Households that bought the installations 5 2 110 44 Household members 3.5 3.9 77 85 Total 29,761 77,162
*As per list from MCA-T (26th April 2013) Source: Kigoma Solar Baseline/Interim Survey, 2013

Final Report: Kigoma Solar Baseline and Interim Performance Evaluation
56
3.3 INTERIM EVALUATION
The study of the Kigoma Solar program is a performance evaluation because of lack of a valid counterfactual. Therefore, it is not an impact evaluation where results can be attributed to the intervention. Also, due to the design of the evaluation (pre/post) and finding that there were other solar energy projects occurring at the same time in the area, it is not possible to say whether changes found by the evaluation are truly the result of Kigoma Solar program alone. However, since evaluation questions were very specific to the Compact Project in the name that was found to be common during pilot test, we believe it is likely that the project has contributed significantly to the changes found by this evaluation. The extent of the changes is likely to be affected by the exposure period because on average, the project had been operational for 5 months only. A table of key interim indicators with the estimated baseline values is given as Appendix 2. Some outcome indicators captured PV systems provided by the Compact project only.
3.3.1 Program implementation
a) Improvement in electricity service coverage
The baseline status shows that indicators for outputs and outcomes such as electricity service coverage (Number of PV systems sold and installed at household) and quality of service (Average availability of power in the last 24 hours and daily solar power consumption) was 0. Table 24 presents achievements of the project established by the survey in July 2013 from the 0 status. Therefore, most of the targets outputs had been met except of the vaccine refrigerators that were yet to be installed at any health centre or dispensary during data gathering for the evaluation. The Household and business systems had the lowest achievement of 1.1% in terms of number of systems installed against the target (70 against 6,383 systems for the average exposure period of 5 months because the target for 4 year period was to sell 61272 systems) and only 7.8% for capacity installed (3.1 kWp against 39.6 kWp for the average exposure period of 5 months because the target for 4 year period was 380.6 kWp) as shown in the table.
Table 24: Achievements of the project
Output Unit of Measure Item Target Achievement %
Completed Number of PV systems installed
Number Dispensaries: 116 116 100% Health centers: 14 14 100%
Vaccine refrigerators 130 0 0% Secondary Schools: 45 45 100%
Village markets: 25 25 100% LED night fishing system
through BMU: 60 60 100%
Household and business systems:
6,383 70 1.1%
Capacity of PV systems installed
Kilowatts peak (kWp) Non-household: 241.1 241.1 100% Household/Business17: 39.6 3.1 7.8%
Hours of training delivered to end users
Hours 938.4 938.4 100%
Total number of people temporarily employed/contracted by contractors
Number 57 57 100%
Source: Kigoma Solar Baseline/Interim Survey, 2013
17
This measure is an outcome rather than an output because it is a result of marketing through SACCOS. This figure is a plan in the IFB rather than sum of installations made because aggregated data was not yet available at the time of the study.

Final Report: Kigoma Solar Baseline and Interim Performance Evaluation
57
Table 25 presents findings on average availability of power in the last 24 hours form the PV systems of the Compact project. The table shows that the average availability of power in the last 24 hours prior to the survey date was 14 hours. However, it was established by the evaluation that the number of hours power is available are affected by cloud weather condition, using appliances not allowed because their power consumption exceed installed capacity and overuse of the rated capacity as reported by both quantitative and qualitative data.
About 24.2% of the installations were providing electricity for less than 10 hours. This is inadequate supply given that schools, health centres and dispensaries operate day and night for after hour study programs for schools and night/emergence medical services. Businesses and households are open for more than the 10 hours.
Table 25: Availability of power in the last 24 hours
Facility Less 5
hours 5 - 9
hours 10 - 14
hours
15 - 19 hours
20 -24 hours
Total Responses
% Less 10
Hours
Average availability of
power in the last 24 hours
Treated Schools 2 2 8 0 8 20 20.0% 15.00
Treated Health Centre 0 2 0 4 6 12 16.7% 18.83
Treated Dispensary 0 0 4 8 14 26 0.0% 25.57
Treated Village Market
0 0 8 0 2 10 0.0% 14.80
Treated Businesses around the village market
2 2 18 2 0 24 16.7% 11.33
Treated Businesses 4 12 12 2 2 32 50.0% 10.00
Treated BMUs 8 18 50 16 32 124 21.0% 9.56
Treated Fishers 2 2 12 0 0 16 25.0% 10.00
Treated Households 8 8 16 0 2 34 47.1% 9.29
Total/Average 26 46 128 32 66 298 24.2% 14
% 8.7% 15.4% 43.0% 10.7% 22.1% 100.0%
Source: Kigoma Solar Baseline/Interim Survey, 2013
Daily solar power consumption (kWh) at installations provided with a meter was estimated as presented in Table 26 as follows: Schools 1.3 kWh, Health centres 0.5 kWh, Dispensaries 0.7 kWh and Village Market 0.4 kWh:

Final Report: Kigoma Solar Baseline and Interim Performance Evaluation
58
Table 26: Daily solar power consumption (kWh)18
Source: Kigoma Solar Baseline/Interim Survey, 2013
Comparison of rated capacity (see project description in Section 1.3) with records of electricity consumption in the above table indicate that average consumption of the secondary schools surveyed per day ranged from 0.4 to 2.7 kWh against a rated capacity of 3 kWh per day; average consumption of the health centres surveyed per day ranged from 0.4 to 0.8 kWh against a rated capacity of 1.1 kWh per day; average consumption of the dispensaries surveyed per day ranged from 0.3 to 1.3 kWh against a rated capacity of 1.0 kWh per day – indicating overuse at some dispensaries; and the average consumption of the village market surveyed per day was 1.8 and the average total for the four businesses connected was 0.8 kWh – making a total of 2.6 kWh against a rated capacity of 2.6 kWh per day – indicating overuse because some shops installations were not yet completed.
b) Benefit of the outputs
The benefit of the outputs that was mentioned by most of the project participants and beneficiaries of the program that were interviewed was to get light at night (21.3% of the responses) followed by recharging cell phones for free at the public institutions power source or for a fee at businesses around the market that use power from the market power system and businesses that bought the PV systems through SACCOS (17.4% of the responses), students being able to study during night time and reducing damages/health hazards that can be caused by use of kerosene (all mentioned by 8.7% of the responses), to conduct businesses at night/prolonged working hours (5.5%), improve health care services (5.1%), night health care services (3.6%) and simplifying business operations/improving efficiency by using electrical machines (2.8%) and then other benefits such as enabling introduction of new businesses, increased security during night time, attract civil servants in remote areas, to get entertainment/can now watch TVs/using radio, increased income from businesses using the solar electricity, enabling teaching during night time/extra lessons during night time, enabling use of computers to increase teaching standards/increased teaching aids/teaching has been 18
Consumption data was extracted from meter reading books at each facility. 19
These are treated sites A, B, C, etc.
Installation A19 B C D E F G
Average (kWh
(a) Treated Schools
1.1 1.7 0.5 0.4 2.7 1.4 1.3
(b) Treated Health Centre
0.8 0.4 0.4 0.4 0.8 0.5
(c)Treated Dispensaries
0.3 1.3 0.6 0.6 0.6 1.0 0.4 0.7
(d) Village Market
Village Market
Shop A
Shop B
Shop C
Shop D
Cinema Provider A
Hair cutting Provider A
Cell phone charging Provider A
Cell phone charging Provider B
Other
Consumption (kWh
1.8 0.1 0.2 0.3 0.2 0.2 0.3 0.1 0.3 0.2 0.4

Final Report: Kigoma Solar Baseline and Interim Performance Evaluation
59
simplified, the light makes the environment attractive, reduced phone charging costs in the area, reduced environmental pollution from smoke, has reduced damages/health hazards that can be caused by use of kerosene, has created awareness of community members to purchase solar systems, has created understanding of solar system/Learn how to install and conduct maintenance, expecting mothers can deliver in better light, reduced costs of buying radio batteries and to recharge electricity lantern and other benefits as shown in Appendix 3.
Moreover, Focus Group Discussions (FGDs) of treated participants – men and women – found out that the project had delivered intended results. Benefits mentioned included enabling patients and expecting mothers to get health services under a very good light at night. They said that previously they were required to go with kerosene, dry cell batteries and even lanterns which is not a requirement after installation of the PVs. Other benefits are getting laboratory services/tests even at night while in the past it depended on availability of a working generator and fuel; enabling students to study at night, use of computers, enabling businesses around the village market to provide services till midnight, enabling community members, especially women to work for more hours because they can do shopping at the village market at night, improving business sales, and charging phones more easily and cheaply than before. FGD participants at Janda Village reported decline of phone charging fees from TZS 300 (US$ 0.19 cents) to 100 (US$ 0.06 cents). Other benefits mentioned include more security as exemplified by decrease of theft cases at the market, and reducing costs because once it is installed it is almost free compared to the situation before when buying kerosene and match boxes or dry cells for lamps/torches were daily expenses. Beneficiaries can do things such as charging phones that they could not think of doing before the project. A male FGD participant at Janda Village in Kasuku District narrated his story:
“Before the program I was admitted at our Health Centre due to malaria. I was directed to take medicine three times in 24 hours, one being at 4 am. When I woke up to take the night dose I could not see where I had put the medicine and water due to darkness; I spilled both water and the medicine. I could not see the medicine till morning and had been run-over. I had to be given another dose and admitted for one additional day”
All participants had positive perception and asked for scale-up – including covering villages not covered by the program. However, there are vast unsatisfied needs of the communities. Most participants wanted all households and public institutions including religious buildings to be connected. Power provided by the PV systems installed is less than needs of the beneficiaries. They want power that can enable them to use all appliances. However, implementation encountered some negative cultural beliefs. These included resistance to change. A woman at Mwakizega FGD in Kigoma Rural said
“Some community members did not buy the systems because of resistance to change. For instance, they believed things from white people are likely to have negative effects such as faults that can ignite fire that will burn the house and the family. The electricity worries were continuation of beliefs that mobile phones have health effects and food from refrigerators is harmful……. To convince them to buy, they had to be told about practices they have abandoned that were considered appropriate by fore furthers. More sensitization on abandoning cultural beliefs and adopting changes in technology and practices is required”
Some FGD participants perceive the price of the PV systems to be very high. Polygamy accelerated the perception as a Man at Mwakizega put it:

Final Report: Kigoma Solar Baseline and Interim Performance Evaluation
60
“I have three wives in different locations. I cannot afford to buy for all three wives households and buying for only one can bring conflicts and infighting”.
Some FGD participants said they were aware that some community members connected by the program were using appliances not allowed because their power consumption exceed installed capacity.
c) Addressing the energy needs of the beneficiary population The description of the PV systems of the project shows in Section 1.3 that they were designed to support lighting and media services such as cell phones charging, television/cinema setup or the use of computer. The Vaccine Refrigerator System is for storage of vaccines. The village market system was designed to provide an average of 2.6 Kwh per day that would support general lighting at the village market (exterior and for each stall). It was also designed to supports four types of income generating activities outside but around the market, namely cell phone charging, cinema, hair cutting and sewing. There was a LED night fishing system implemented through BMUs and various sizes of PV systems that were sold to businesses and households through SACCOS. Comparison with these design requirements and the baseline status on energy needs reveals that the PV systems addressed energy needs of the community because lack of electricity that faced 86% of the respondents before the program; kerosene was the most used fuel (84%), about 65% of the respondents were using the electricity substitutes for lighting.
The evaluation found out that the systems were being used for ways and purposes shown in Table 27. Purpose for which the PV systems were used for more hours than other purposes was given rank 1 and the purpose for which the PV systems were used for least hours was given rank 9. The rank indicates relative use of the systems. Use for charging cell phone for free ranked first followed by lighting at night that ranked second, followed by using for cell phone charging business at a fee, hair cutting business, after hours study programs and then other uses as shown in the table. These use of the systems, were in line with the way the project and systems were designed and energy challenges that faced the communities as explained above.
The table also shows that village market systems were being used for more hours followed by health centres businesses that bought through SACCOs, dispensaries, businesses connected to and using the market power source, households and then secondary schools that had used the systems for the lowest hours.
Comparison with average availability of power in the last 24 hours revealed that like in the analysis of kWh consumed, secondary schools and dispensaries used the systems for shorter hours than the period power was available (underuse) while, mathematically, the markets used the systems for more hours than hours the power was available (overuse).

Final Report: Kigoma Solar Baseline and Interim Performance Evaluation
61
Table 27: Daily number of hours PV system are used, by treated group and by purpose
Use Treated Schools
Treated Health centre
Treated Dispensary
Treated Village Market
Treated Market
business
Treated Businesses
Treated Household
Total Hours
Average Hours
Rank
Lighting - Day time 0.2 6.7 0.4 - - - 0.8 8.0 2.0 6
Lighting - Night 1.8 11.8 10.8 14.4 4.2 6.0 8.6 57.6 8.2 2
Radio/music 1.1 - - - 4.3 0.4 0.3 6.1 1.5 7
Television 0.5 - - - 0.2 - - 0.7 0.3 9
Computer 0.3 - - - - - - 0.3 0.3 9
Ventilation Fan - - - - - - - - 0.0
After hours study programs
3.0 3.5 6.7 13.2 4.45
Charging Cell phone for free
3.6 4.5 4.5 2.0 15.2 4.3 34.1 11.41
Hair Cutting
business
- - - 5.0 - - - 5.0 5.04
Sewing business - - - - 0.3 0.7 - 1.0 0.5 8
Cell phone charging business at a fee
- - - 9.8 8.1 0.4 - 18.3 6.1
3
Cinema business at
a fee
- - - - - - - - 0.0
Other - - - - - - - - 0.0
Total hours the
systems are used
10.6 26.5 22.3 29.2 19.1 22.7 13.9
Average availability
of power in the last 24 hours
15.00 18.83 25.57 14.8 11.33 10.00 9.29
Overuse/underuse (4.43) 7.67 (3.25) 14.40 7.75 12.69 4.61
Source: Kigoma Solar Baseline/Interim Survey, 2013
However, the interim survey established that about 44% of the heads of institutions and households that accessed the systems believed the systems provided met their needs as shown in Table 28. This is medium level of satisfaction because about 56% felt the program did not meet their needs. All SACCOS interviewed felt their (business) needs were met. About 63% of fishers and 59% of households also felt that their energy needs were met by the systems of the project. The satisfaction level felt by all other project participants and beneficiaries was less than 50% as shown in the table.

Final Report: Kigoma Solar Baseline and Interim Performance Evaluation
62
Table 28: How the PV systems have met needs
Facility/respondent Has sufficiently met energy needs
Has not met their energy needs
Total
% Met their Needs
Treated schools 1 9 10 10%
Treated Health centre 2 4 6 33%
Treated Dispensary 7 7 14 50%
Treated Village Market 1 4 5 20%
Treated Market Business 6 6 12 50%
Treated Businesses 5 11 16 31%
Treated Fishers 5 3 8 63%
Treated Household 10 7 17 59%
Treated BMUs 2 2 4 50%
SACCOS 4 0 4 100%
Treated Stakeholder 9 12 21 43%
Total 52 65 117 44%
% 44% 56% 100%
Source: Kigoma Solar Baseline/Interim Survey, 2013
The survey found out that factors attributed to medium level of satisfying needs include getting PVs of lower voltage than needs; not being installed at all buildings of the schools (offices, classrooms and teacher houses), and health centres and dispensaries’ offices, other service houses and staff houses; only a few market businesses connected to the market power system; the health centres and dispensaries not being provided with sterilization machine; businesses not allowed to switch on light during night; wires of the fishing system are short; health centres and dispensaries not being provided with solar refrigerator; carrying the heavy fishing system battery every fishing day; the solar fishing lamps cannot be installed on the boat-pair's bowyer; and maintenance of fishing system was not well understood. d) Change of operations after the installations
Respondents were asked whether operations of their facility had changed anyhow since the PV installation. Table 29 shows that despite the medium level of satisfying needs due to the above mentioned constraints, on average, about 67% acknowledged changes (improvement) of operations after the solar PV installation. The table shows that all the treated schools had changed operations (100%) followed by treated village markets (80%), treated health centres (67%), treated fishers (63%), and then others as shown in the table. Given the fact that most of the installations had been operational for an average of 5 months, this result indicates that the intervention will change operations of most of the project participants and beneficiaries, in the future.
Table 29: Treated sites with change of operations after the installations
Facility covered Changed No change Total % with changes of Operations
Treated school 10 0 10 100% Treated health centre 4 2 6 67% Treated dispensary 8 6 14 57% Treated village market 4 1 5 80% Treated market business 7 5 12 58% Treated business 7 9 16 44% Treated fishers 5 3 8 63% Average 67%
Source: Kigoma Solar Baseline/Interim Survey, 2013

Final Report: Kigoma Solar Baseline and Interim Performance Evaluation
63
Changes that have come about after the installations that were mentioned by more respondents/sites were introducing night service sessions (68%) and opening more hours (63%) as shown in Table 30. About 22% and 11% had introduces new products and services respectively. All treated schools had introduced supervised night preparations. This is however common practice at secondary schools. Two (2) out of the 10 surveyed schools had introduced computer studies. With regard to types of night services introduced, Table 31 shows that most of the night sessions of secondary schools covered all subjects (67%). For health centres and dispensaries, women delivery services were the most important services that had been improved by availability of solar electricity - 50% and 71% of the health centres and dispensaries, respectively. About 25% of the health centres had started carrying out new laboratory tests.
Table 30: Specific change of operations after the installations
Yes No Total Avearge
hours
added
per day
Yes No Total Yes No Total Yes No Total Yes No Total
Secondary schools 7 3 10 3 6 4 10 - - 0 - - 0 - - 0
Health centres 0 4 4 0 4 0 4 - - 0 - - 0 - - 0
Dispensaries 4 4 8 7 7 1 8 - - 0 - - 0 - - 0
Village markets 4 0 4 2 2 2 4 0 4 4 1 3 4 1 3 4
Market businesses 5 2 7 2 5 2 7 1 6 7 1 6 7 3 4 7
Businesses through
SACCOS5 2 7 4 3 4 7 2 5 7 0 7 7 0 7 7
Total 25 15 40 27 13 40 3 15 18 2 16 18 4 14 18
% 63% 38% 100% 68% 33% 100% 17% 83% 100% 11% 89% 100% 22% 78% 100%
Yes No Total Yes No Total Yes No Total
Secondary schools 10 0 10 2 8 10Health centres 1 3 4Dispensaries 0 8 8Total 10 0 10 2 8 10 1 11 12
% 100% 0% 100% 20% 80% 100% 8% 92% 100%
Introduced new
services
Open more hoursTreated Sites
Supervised night
preps
Computer studies Carryout new
laboratory tests
Night service
sessions
Stock more goods
than before
Introduced new
products
Source: Kigoma Solar Baseline/Interim Survey, 2013
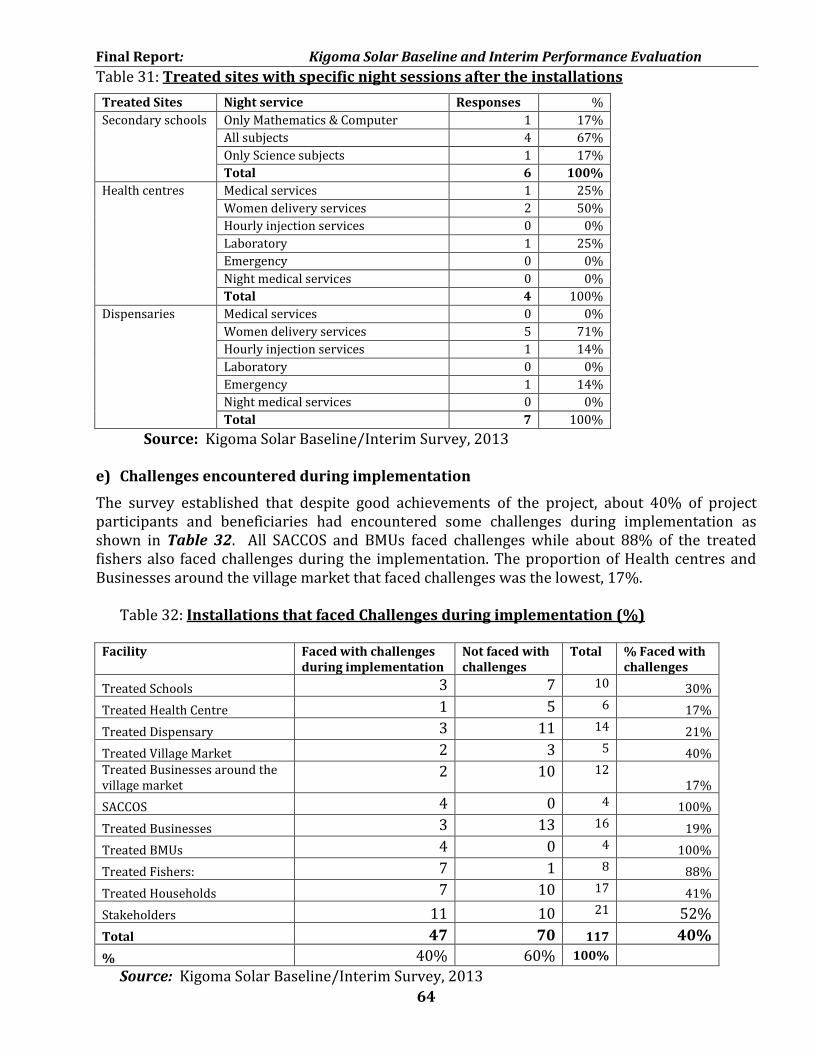
Final Report: Kigoma Solar Baseline and Interim Performance Evaluation
64
Table 31: Treated sites with specific night sessions after the installations
Treated Sites Night service Responses %
Secondary schools Only Mathematics & Computer 1 17%
All subjects 4 67%
Only Science subjects 1 17%
Total 6 100%
Health centres Medical services 1 25%
Women delivery services 2 50%
Hourly injection services 0 0%
Laboratory 1 25%
Emergency 0 0%
Night medical services 0 0%
Total 4 100%
Dispensaries Medical services 0 0%
Women delivery services 5 71%
Hourly injection services 1 14%
Laboratory 0 0%
Emergency 1 14%
Night medical services 0 0%
Total 7 100%
Source: Kigoma Solar Baseline/Interim Survey, 2013
e) Challenges encountered during implementation
The survey established that despite good achievements of the project, about 40% of project participants and beneficiaries had encountered some challenges during implementation as shown in Table 32. All SACCOS and BMUs faced challenges while about 88% of the treated fishers also faced challenges during the implementation. The proportion of Health centres and Businesses around the village market that faced challenges was the lowest, 17%.
Table 32: Installations that faced Challenges during implementation (%)
Facility Faced with challenges during implementation
Not faced with challenges
Total % Faced with challenges
Treated Schools 3 7 10 30%
Treated Health Centre 1 5 6 17%
Treated Dispensary 3 11 14 21%
Treated Village Market 2 3 5 40% Treated Businesses around the village market
2 10 12 17%
SACCOS 4 0 4 100%
Treated Businesses 3 13 16 19%
Treated BMUs 4 0 4 100%
Treated Fishers: 7 1 8 88%
Treated Households 7 10 17 41%
Stakeholders 11 10 21 52%
Total 47 70 117 40%
% 40% 60% 100% Source: Kigoma Solar Baseline/Interim Survey, 2013

Final Report: Kigoma Solar Baseline and Interim Performance Evaluation
65
Project participants and beneficiaries of the project implementation were asked to mention challenges that they encountered during implementation of Kigoma Solar project. The top challenge was the project covering few businesses and fishers beneficiaries such as only four shops around the village market and only two trial fishers for each BMU. That resulted into the second challenge on misunderstanding and conflicts during implementation – including complaints that selection of businesses around the market that use power from the market power system and trial fishers was not transparent. The third challenge was on low voltage than needs and high price/cost for those who had to purchase through SACCOS and BMUs. The fourth challenge was lack of knowledge on availability, use and benefits of solar electricity followed by short loan repayment and then other challenges.
Other general challenges included cloud weather condition, lack of funds/Low income /poverty, and fear of theft.
Technical challenges identified by the survey included strict use terms and conditions, incomplete installation of lights in other locations, decision of the project to reduce solar panels from 10 up to 8 at institutions lowered voltage, complaints of lights power decreasing over time, some parts became out of order before rated lifetime, the solar electricity at some sites damaged lights/bulbs before it was rectified, Shortage of qualified technicians, and after experiencing low voltage some community members opted to buy from shops instead of SACCOS.
Challenges related to the village market systems included raising funds for construction of the solar systems' accommodation (small house) at village markets, requirement to contributed payments for excavation of trench for wires, requirement to contribute connection wire to enable electricity reach the business, community's lack of understanding that they are supposed to contribute to project implementation, timeframe for completing the project was not enough, and it was not well known where the payments for electricity goes and is used for what purpose.
There were also perception challenges such as some people believed solar causes health problems, and fear of being laughed and ridiculed at for buying systems that do not meet needs that emerged after some people found out that the voltage was lower than their needs.
Challenges related to the LED solar night fishing system included lack of box to store solar fishing lamps in the boat, the fishing lamps cannot be fixed on the boat-pair's bowyer, and the fishing light being not adjustable.
FGD participants identified the following challenges that were encountered during implementation:
Sometimes the installation teams of the Contractor either did not have or had inadequate supply of some connection supplies such as wires, requiring affected businesses around the market that were selected to get the electricity to buy on their own;
The program did not cover all requirements of the community and households such as providing installation for all public institutions including local government offices and religious buildings, and the capacity installed being inadequate for all appliances including refrigerators. Male and female FGD participants at Janda Village said there was scramble and conflicts during selection of only four business units to be connected to electricity of the market. Each owner of a business unit started to dig a trench for the connection and they became angry when they were told that only four will get the electricity connection.
Failure of some parts to function, especially bulbs Lack of technicians to make repairs.

Final Report: Kigoma Solar Baseline and Interim Performance Evaluation
66
Nevertheless, some FGD participants said there were no challenges and they started to enjoy the benefits immediately after installation.
3.3.2 Improvement in the quality of energy available
a) Relative quality of electricity substitutes Survey of use of electricity substitutes before and after the program implementation as shown in Table 33 indicates decrease of use of all non electricity sources of energy except firewood that had slightly increased from being used by 35% of respondents during baseline to 36% of respondents during interim evaluation. This is because the PV systems were not designed to address substitution of the major use of firewood, which is cooking and boiling. The table shows that the use of sources of energy that are used for lighting such as kerosene had decreased most from the baseline of 84% to 32% followed by candle – medium that had decreased from use by 17% to 6%, Candle – small from 8% to 3%, Charcoal from 52% to 48% and then other types as shown in the table. However, the decrease of use of charcoal, which like firewood is mainly used for cooking/boiling, is also due to environmental concerns and protection efforts because they were mentioned to among factors limiting use energy. The table also shows that use of electricity substitutes had decreased at all project participants and beneficiaries except at treated schools where it remained unchanged. b) Quantity of electricity substitutes used This was measured through changes of consumption of quantities in kilogram of electricity substitute sources of energy such as kerosene. Table 34 presents findings on consumption of non-electricity sources of energy in the program area. It indicates that the weighted average of annual quantity of other energy sources20 consumed had slightly decreased from 959 kg before the program to 923 kg after implementation – a decrease by 4%. The table shows that there have been marked decreases of most of the individual sources of energy, except dry cells and batteries, large size candles and charcoal. Quantities of firewood that had slightly increased users from 31% of respondents during baseline to 32% of respondents (Table 29) also decreased in terms of quantities used, indicating that even though users had increased, the quantity used had started to decrease. However, it seems that the decrease is substituted by charcoal. One of the selection criteria for location of the intervention was “Villages with the greatest number of potential beneficiaries (i.e. all division headquarters and villages with population greater than 10,000”. These are semi-urban areas where charcoal use is expected to increase. Therefore, quantities consumption also indicate substitution other sources of energy. The table also shows that unlike decreased of users at all project participants and beneficiaries except at treated schools that is shown in Table 33, quantity consumed decreased at treated schools, treated dispensaries, treated village markets, treated businesses around the village market using the market power source and treated fishers but the quantities consumed did not decrease but rather increased at treated health centres, and treated businesses and households that bought the systems through SACCOS.
20
Traditional energy sources such as kerosene, candles, firewood, charcoal, LPG, dry-cell batteries, and other Biomass Residues.

Final Report: Kigoma Solar Baseline and Interim Performance Evaluation
67
Table 33: Change of Use of Electricity Substitutes after Program Implementation
Used Total Used
%
Used Total Used
%
Used Total Used
%
Used Total Used
%
Used Total Used
%
Used Total Used
%
Used Total Used
%
Used Total Used
%
Kerosene 2 10 20% 3 6 50% 6 14 43% 1 5 20% 3 12 25% 4 16 25% 1 8 13% 8 16 50% 32% 84%Candle - small 0 10 0% 0 6 0% 0 14 0% 1 5 20% 1 12 8% 0 16 0% 0 8 0% 1 16 6%
3% 8%Candle - medium 1 10 10% 0 6 0% 0 14 0% 1 5 20% 1 12 8% 2 16 13% 0 8 0% 0 16 0% 6% 17%Candle - large 0 10 0% 0 6 0% 0 14 0% 1 5 20% 0 12 0% 1 16 6% 0 8 0% 0 16 0% 2% 5%Biomass Residue -
Firewood
4 10 40% 3 6 50% 2 14 14% 0 5 0% 1 12 8% 9 16 56% 2 8 25% 10 16 63%
36% 35%Animal Dung 0 10 0% 0 6 0% 0 14 0% 0 5 0% 0 12 0% 0 16 0% 0 8 0% 0 16 0% 0% 1%Biomass Residue -
straw
0 10 0% 0 6 0% 0 14 0% 0 5 0% 0 12 0% 1 16 6% 0 8 0% 0 16 0%
1% 2%Biomass Residue -
Tree leaves
0 10 0% 0 6 0% 0 14 0% 0 5 0% 0 12 0% 2 16 13% 0 8 0% 0 16 0%
2% 6%Biomass Residue -
Charcoal
7 10 70% 4 6 67% 7 14 50% 1 5 20% 2 12 17% 8 16 50% 4 8 50% 9 16 56%
48% 52%Biomass Residue -
Other
0 10 0% 0 6 0% 0 14 0% 0 5 0% 0 12 0% 1 16 6% 0 8 0% 0 16 0%
1% 3%Gas (LPG) 0 10 0% 4 6 67% 8 14 57% 0 5 0% 0 12 0% 0 16 0% 0 8 0% 0 16 0% 14% 15%Electricity (using
dry cell, car
battery, generator,
etc.)
10 10 100% 5 6 83% 12 14 86% 3 5 60% 8 12 67% 13 16 81% 7 8 88% 13 16 81%
82% 82%Other 3 10 30% 0 6 0% 0 14 0% 0 5 0% 1 12 8% 1 16 6% 2 8 25% 1 16 6% 9% 2%Total 27 130 21% 19 78 24% 35 182 19% 8 65 12% 17 156 11% 42 208 20% 16 104 15% 42 208 20% 18% 26%
Baseline 27 130 21% 25 78 32% 44 182 24% 18 65 28% 28 156 18% 54 208 26% 20 104 19% 59 221 27% 24%
Change 0% -8% -5% -15% -7% -6% -4% -7% -6%
Weighted
average of
% used
BaselineElectricity
substitutes
Treated fishers Treated householdTreated schools Treated health
centre
Treated Dispensary Treated Village
Market
Treated Market
business
Treated business
Source: Kigoma Solar Baseline/Interim Survey, 2013

Final Report: Kigoma Solar Baseline and Interim Performance Evaluation
68
Table 34: Change of Quantity Consumption of other energy sources in kg
Valid
N
Mean Valid
N
Mean Valid
N
Mean Valid
N
Mean Valid
N
Mean Valid
N
Mean Valid
N
Mean Valid
N
Mean
Kerosene 2 29 3 131 6 76 1 72 3 75 4 13 1 115 9 39 59 (461)
Candle - small - - - - - - 1 24 1 30 - - - - - - 27 (18)
Candle - medium 1 24 - - - - 1 30 1 42 2 15 - - - - 25 (6)
Candle - large - - - - - - 1 18 - - 1 720 - - - - 369 348
Biomass Residue -
Firewood4 9364 3 15240 1 240 - - 1 3600 9 600 2 2520 9 883 3,634 (350)
Animal Dung - - - - - - - - - - - - - - - - - -
Biomass Residue -
straw - - - - - - - - - - - - - - - - - -
Biomass Residue -
Tree leaves - - - - - - - - - - - - - - - - - -
Biomass Residue -
Charcoal7 466 4 3588 6 1775 1 540 2 270 8 861 4 2295 10 882 1,291 74
Biomass Residue -
Other - - - - - - - - - - - - - - - - - -
Gas (LPG) - - 4 99 8 272 - - - - - - - - - - 214 (13)
Electricity (using
dry cell, car
battery, generator,
etc.)
10 652 4 20 9 1085 2 3 6 2009 7 6 7 1501 3 9.63 813 705
Other 1 3 - - - - - - - - 1 360 2 3600 1 1 1,513 (2,807)
Weighted
Average
2154 3390 1102 99 2039 423 2659 537 923
Increase/
decrease
487 - 594 - 231 - (42) - 1,791 - 262 - 230 - 110 (35)
Weighted
Average
Increase/
Decrease
Other source of
energy
Treated Schools Treated Health
Centres
Treated
Dispensaries
Treated Village
Markets
Treated Market
Businesss
Treated
Businessess
Treated Fishers Treated
Households
Source: Kigoma Solar Baseline/Interim Survey, 2013

Final Report: Kigoma Solar Baseline and Interim Performance Evaluation
69
c) Change of electricity consumption Table 35 present interim change of consumption of electricity in the project area. Major changes shown in the table are increase of solar PVs by 305% from 21 users before the project up to 85 users after the project and decrease of dry cell batteries –size D by 16% from 74 users before the project down to 62 users after the project. It seems that installation of the Compact solar PVs decreased use of flash lights/lamps mostly from China that use dry cells and batteries as noted in the baseline and use of batteries for radio and torch as shown in the benefits section. There was also decrease of use of diesel and gasoline electricity generators, all other types of dry cell batteries except size AA normally used in cameras and other electronics. Use of car and motorcycle batteries also decreased. The table also shows that the major change on types of use was increase of bulb light, which is in line of the intended use of the Compact solar PVs as explained in the project description that the major uses were lighting and multimedia services. Table 36 shows that, on average, the project increased use of solar energy among project participants and beneficiaries from 24% before the project to about 70% during the interim evaluation. Table 35: Change of Consumption of Electricity-based Source of Energy
Source Bulb Light
Cooking Cloth Ironing
Torch Radio Other Total Baseline Change
TANESCO grid 0 0 0 0 0 0 0 0 0 Other electricity grid 0 0 0 0 0 0 0 0 0 Diesel Gen-set 3 0 0 0 0 0 3 6 -3 Gasoline Gen-set 6 0 0 0 0 0 6 12 -6 Biogas 0 0 0 0 0 0 0 0 0 Wind mill 0 0 0 0 0 0 0 0 0 Solar PV 82 0 0 0 0 3 85 21 64 Solar Lantern 0 0 0 0 0 0 0 2 -2 Car Battery 2 0 0 0 2 0 4 5 -1 Motorcycle Battery 2 1 0 0 0 0 3 4 -1 D - Size dry cell batteries 31 0 0 30 0 1 62 74 -12 C - Size dry cell batteries 4 0 0 3 0 0 7 11 -4 A - Size dry cell batteries 0 0 0 1 0 0 1 3 -2 AA - Size dry cell batteries 1 0 0 0 0 1 2 1 1 AAA - Size dry cell batteries
0 0 0 0 0 0 0 1 -1
9 Volt - Size dry cell batteries
0 0 0 0 0 0 0 0 0
Other 1 0 0 0 0 0 1 2 -1 Total 132 1 0 34 2 5 174 142 32
% 76% 1% 0% 20% 1% 3% 100% 100%
Baseline 65% 0% 1% 26% 1% 8% 100%
Change 11% 1% -1% -7% 0% -5%
Source: Kigoma Solar Baseline/Interim Survey, 2013

Final Report: Kigoma Solar Baseline and Interim Performance Evaluation
70
Table 36: Change of use of solar power
Treated Sites Baseline existence of solar systems
Interim existence of solar systems
Change
Secondary Schools 10% 100% 90%
Health Centres 100% 100% 0%
Dispensaries 43% 100% 57%
Village Markets 40% 100% 60%
Businesses around the Market
33% 100% 67%
Businesses 6% 100% 94%
Fishers 0% 100% 100%
Households 6% 100% 94%
Average 70%
Source: Kigoma Solar Baseline/Interim Survey, 2013
3.3.3 Increase investment and economic activities a) Average annual business revenue Table 37 presents interim annual business revenue21 and changes of revenue from the baseline status for businesses around the village market connected to the market PV system, and businesses and fishers that bought the solar systems. The table shows that during interim evaluation, the income for businesses around the village market using power of the market had increased by US$ 1,023 from the baseline status of US$ 3,027 to US$ 4,050. Income of the other businesses that bought the PV systems through SACCOS had increased by US$ 723 from the baseline status of US$ 5,928 to US$ 6,650. However, the revenue of fishers had decreased by US$ 4,692. The decrease of fishers income contradicts with other findings of the survey on benefits where respondent reported increase of income. Table 37: Interim Average Annual Business Revenue (US$)
Sales day status Treated Businesses around the village market
Treated Businesses that bought through SACCOS
Treated Fishers through BMUs
Average by sales day status
Good day sales 6,852 12,873 9,097 22,756
Medium day sales 3,391 4,823 5,451 10,030
Poor day sales 1,909 2,256 1,102 4,533
Average by treated group
4,050 6,650 5,217 12,440
Increase/decrease 1,023 723 (4,692) 181
Source: Kigoma Solar Baseline/Interim Survey, 2013
21
Respondents were asked average daily revenue by day’s sales status. The annual figure was obtained by multiplying by working 300 days allowing for recess and down turn. For fishers, the response was for a boat pair used by an average of 7 fishers, so the result was divided by 7.

Final Report: Kigoma Solar Baseline and Interim Performance Evaluation
71
b) Average annual wages The interim survey found out that like during the baseline, there was no employment at all the sixteen businesses that bought the PV systems through SACCOS that were interviewed (no change). However, employment at treated businesses around the village market had slightly increased from 2 employees before the program to 3 employees but average wage slightly decreased from the baseline of US$ 51.56 to 41.67 per month or from US$ 618.75 down to US$ 500.00 per annum for the shop employee. It seems that availability of light at the market increased supply of labour than demand and change of exchange of rate might also contribute to the decrease of the wage in US Dollars. Employment at the eight boat pairs had increased from 49 to 52. Wage per fisher employee per month had increased from US$ 93.05 to US$ 109.62 or from US$ 1,116.58 to US$ 1,3,15.38 per employee per annum. c) Energy prices after the PV installation
Table 38 presents costs of energy sources after the installations in US$. The table shows that the prices of diesel, gasoline, and dry cells size A had decreased. The table also shows that firewood and dry cells sizes C and AA had an increase of just 0.01 US$ cents over the one year period, which is low. The changes are likely to be related to decrease of use of diesel and gasoline electricity generators, and decrease of use of flash lights/lamps mostly from China that use dry cells after the introduction of solar power.
d) Interim average annual expenditure on energy The survey measured changes of annual expenditure on energy as summarized in Table 39. The table shows that total expenditure of the respondents covered by the survey had slightly decreased from the baseline value of US$ 319 to US$ 286, a decrease by 10%, which is considered low. This is because of the increase of prices of types of energy sources as shown in Table 38. The price of kerosene had increased by 5% while the price of dry cell batteries size D and C had increased by 9% and 12%, respectively. The price of charcoal had increased by 11% while candle – small and medium size had increased by 18% and 14%, respectively as shown in the table.
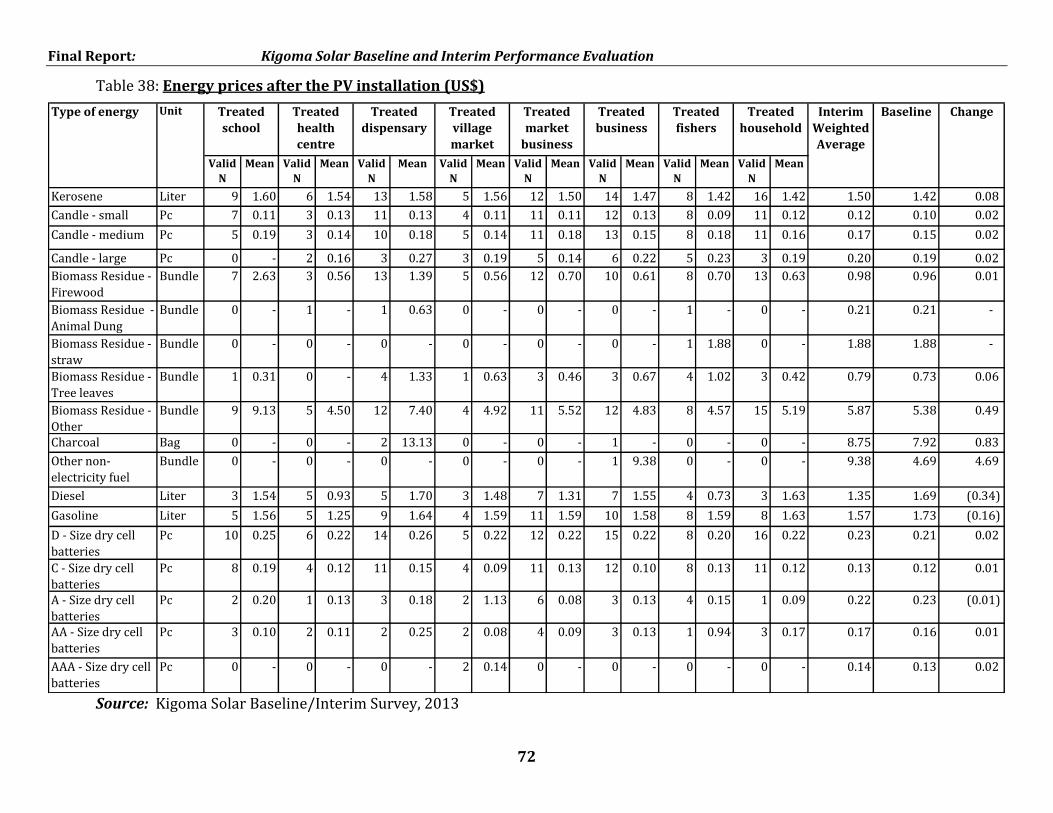
Final Report: Kigoma Solar Baseline and Interim Performance Evaluation
72
Table 38: Energy prices after the PV installation (US$)
Valid
N
Mean Valid
N
Mean Valid
N
Mean Valid
N
Mean Valid
N
Mean Valid
N
Mean Valid
N
Mean Valid
N
Mean
Kerosene Liter 9 1.60 6 1.54 13 1.58 5 1.56 12 1.50 14 1.47 8 1.42 16 1.42 1.50 1.42 0.08
Candle - small Pc 7 0.11 3 0.13 11 0.13 4 0.11 11 0.11 12 0.13 8 0.09 11 0.12 0.12 0.10 0.02
Candle - medium Pc 5 0.19 3 0.14 10 0.18 5 0.14 11 0.18 13 0.15 8 0.18 11 0.16 0.17 0.15 0.02
Candle - large Pc 0 - 2 0.16 3 0.27 3 0.19 5 0.14 6 0.22 5 0.23 3 0.19 0.20 0.19 0.02
Biomass Residue -
Firewood
Bundle 7 2.63 3 0.56 13 1.39 5 0.56 12 0.70 10 0.61 8 0.70 13 0.63 0.98 0.96 0.01
Biomass Residue -
Animal Dung
Bundle 0 - 1 - 1 0.63 0 - 0 - 0 - 1 - 0 - 0.21 0.21 -
Biomass Residue -
straw
Bundle 0 - 0 - 0 - 0 - 0 - 0 - 1 1.88 0 - 1.88 1.88 -
Biomass Residue -
Tree leaves
Bundle 1 0.31 0 - 4 1.33 1 0.63 3 0.46 3 0.67 4 1.02 3 0.42 0.79 0.73 0.06
Biomass Residue -
Other
Bundle 9 9.13 5 4.50 12 7.40 4 4.92 11 5.52 12 4.83 8 4.57 15 5.19 5.87 5.38 0.49
Charcoal Bag 0 - 0 - 2 13.13 0 - 0 - 1 - 0 - 0 - 8.75 7.92 0.83
Other non-
electricity fuel
Bundle 0 - 0 - 0 - 0 - 0 - 1 9.38 0 - 0 - 9.38 4.69 4.69
Diesel Liter 3 1.54 5 0.93 5 1.70 3 1.48 7 1.31 7 1.55 4 0.73 3 1.63 1.35 1.69 (0.34)
Gasoline Liter 5 1.56 5 1.25 9 1.64 4 1.59 11 1.59 10 1.58 8 1.59 8 1.63 1.57 1.73 (0.16)
D - Size dry cell
batteries
Pc 10 0.25 6 0.22 14 0.26 5 0.22 12 0.22 15 0.22 8 0.20 16 0.22 0.23 0.21 0.02
C - Size dry cell
batteries
Pc 8 0.19 4 0.12 11 0.15 4 0.09 11 0.13 12 0.10 8 0.13 11 0.12 0.13 0.12 0.01
A - Size dry cell
batteries
Pc 2 0.20 1 0.13 3 0.18 2 1.13 6 0.08 3 0.13 4 0.15 1 0.09 0.22 0.23 (0.01)
AA - Size dry cell
batteries
Pc 3 0.10 2 0.11 2 0.25 2 0.08 4 0.09 3 0.13 1 0.94 3 0.17 0.17 0.16 0.01
AAA - Size dry cell
batteries
Pc 0 - 0 - 0 - 2 0.14 0 - 0 - 0 - 0 - 0.14 0.13 0.02
Treated
dispensary
Treated
village
market
Unit ChangeBaselineType of energy Treated
school
Treated
health
centre
Treated
fishers
Treated
household
Interim
Weighted
Average
Treated
market
business
Treated
business
Source: Kigoma Solar Baseline/Interim Survey, 2013

Final Report: Kigoma Solar Baseline and Interim Performance Evaluation
73
Table 39: Interim average annual expenditure on energy in US$
Valid
N
Mean Valid
N
Mean Valid
N
Mean Valid
N
Mean Valid
N
Mean Valid
N
Mean Valid
N
Mean Valid
N
Mean
Kerosene 4 298 6 760 13 278 5 575 7 150 13 66 7 6,340 16 79 842 988 (146) Candle - small - - 1 225 - - 2 45 4 60 - - - - - - 80 65
14 Candle -
medium- - - - 1 113 4 92 4 158 3 131 - - 4 53 107 104
3 Candle - large - - - - - - 2 26 - - 2 81 - - - - 53 51
2 Biomass
Residue -
Firewood
3 693 2 103 2 338 - - 2 315 6 113 2 113 5 69 220 229
(9) Biomass
Residue -
Charcoal
6 146 5 300 6 729 - - 2 75 4 98 4 548 9 263 329 331
(2) Diesel - - 3 250 - - - - - - - - - - - - 250 206 44 Gasoline 1 1,688 - - - - - - 1 1,125 3 750 - - - - 1,013 1,305 (293) D - Size dry
cell batteries9 30 6 15 12 23 5 78 6 17 14 18 7 39 15 21 27 25
2 C - Size dry
cell batteries- - 2 9 - - 3 30 1 2 1 2 1 9 1 9 14 14
0
Weighted
Avearge
265 294 266 184 146 108 2,242 90 286 319
(32)
Change (86) 25 13 16 24 55 34 23 (32)
Treated
businesses
Treated
fishers
Treated
household
Baseline ChengeInterim
Weighted
Average
Type of
Energy
Treated
schools
Treated health
centre
Treated
dispensary
Village
market
Treated
market
business
Source: Kigoma Solar Baseline/Interim Survey, 2013

Final Report: Kigoma Solar Baseline and Interim Performance Evaluation
74
e) Change of cost of energy generation devices Table 40 presents change of the cost of energy generation devices after implementation of the project. The table shows that the cost of all devices had increased except for the cost of diesel electricity generators that had decreased by US$ 10.54. This is likely to be related to availability and promotion of solar energy, which might have reduced demand for the generators. The change is also likely to include both diesel and gasoline generators because most respondents had difficulties of differentiating these two types of fuel. The cost of solar PVs had increased by US$ 14.56 as shown in the table. The increase could be related to increase of demand following the introduction and marketing of solar PVs in the area. The study found out that there was readiness of people and institutions in the area to buy own PV systems, including buying systems with larger capacity than those provided by the program. Table 40: Change of cost of energy generation devices (US$)
Valid
N
Mean Valid
N
Mean Valid
N
Mean Valid
N
Mean Valid
N
Mean Valid
N
Mean Valid
N
Mean Valid
N
Mean
Hurricane
lantern
9 3 4 4 12 3 5 3 11 2 12 2 8 3 13 3 2.79 2.51 0.29
Presurrized
kerosene
lamp
4 20 1 19 2 28 - - 3 21 5 24 8 32 2 14 24.75 22.56 2.19
Diesel Gen-
set
5 313 1 188 1 169 1 281 2 200 1 219 1 250 2 94 232.59 243.13 (10.54)
Gasoline Gen-
set
6 146 1 94 5 138 2 78 3 146 5 104 5 128 5 76 118.36 116.46 1.90
Solar PV 3 240 2 313 2 609 3 260 6 80 11 156 6 121 10 132 176.38 161.82 14.56
Car Battery 6 90 2 94 4 86 3 40 4 64 8 90 5 101 6 105 86.84 81.64 5.20
Motorcycle
Battery
8 16 2 11 4 20 3 23 7 20 7 42 6 14 5 29 22.86 21.56 1.29
Torch 10 2 5 2 13 1 5 1 10 1 12 1 8 1 15 1 1.40 1.25 0.15
Baseline ChangeTreated
market
business
Treated
business
Treated
fishers
Treated
household
Treated
school
Treated
health centre
Treated
dispensary
Treated
village
market
Weighted
AverageType of
energy
device
Source: Kigoma Solar Baseline/Interim Survey, 2013 f) Training and Repair and Maintenance of the systems Treated respondents were asked whether they had received training and materials for repair and maintenance of the PV system provided by MCA-T. Table 41 presents the results. On average, about 28% of the respondents had received some training and materials for repair and maintenance of the PV system provided by MCA-T. Treated businesses and households that bought the systems through SACCOS reported the highest proportion of receiving training and materials on repair and maintenance (38%) than other facilities as shown in the table. About 25% of treated fishers acknowledged receiving training and materials on repair and maintenance.

Final Report: Kigoma Solar Baseline and Interim Performance Evaluation
75
Table 41: Number of project participants and beneficiaries that acknowledged receiving training
Treated Sites Yes No Total % Received training and materials for repair and maintenance
Treated school 3 7 10 30%
Treated health centre 1 2 3 33%
Treated dispensary 3 11 14 21% Treated village market 1 4 5 20% Treated market business 2 10 12 17% Treated businesses 6 10 16 38% Treated fishers 2 6 8 25% Treated household 6 10 16 38%
Average 28%
Source: Kigoma Solar Baseline/Interim Survey, 2013 Treated respondents were also asked whether they had done any repair and maintenance of the solar PV systems provided by MCA-T. Table 42 indicates that 4 out of the 8 categories of project participants had already done some repair and maintenance of the installations of the project. Treated health centres, village markets, market businesses and fishers had not done any repair and maintenance of the solar PV system. However, treated schools, dispensaries, businesses and households that bought the systems through SACCOS had already done some repair and maintenance while the average operation period of the systems was 5 months. On average, about 13% of these had already done some repair and maintenance. The survey had established that one of the challenges faced during implementation were incomplete installations, short wires, some parts became out of order before rated lifetime, and the solar electricity at some sites damaged lights/bulbs before it was rectified. Table 42: Number of project participants and beneficiaries that had done any repair and maintenance of the solar PV systems
Treated Sites Yes No Total % Have ever done any repair and maintenance of the solar PV system
Treated school 2 8 10 20% Treated health centre 0 3 3 0% Treated dispensary 3 11 14 21% Treated village market 0 5 5 0% Treated market business 0 12 12 0%
Treated businesses 1 15 16 6%
Treated fishers 0 8 8 0% Treated household 1 15 16 6% Average 13%
Source: Kigoma Solar Baseline/Interim Survey, 2013
3.3.4 Improve human capital accumulation a) Schools with afterhours study programs Schools were asked whether they had introduced afterhour study programs since the PV installation. Seven out of the ten treated schools covered by the survey, or 70% had afterhours study programs as shown in Table 43. Therefore, the surveyed found out that not all the treated

Final Report: Kigoma Solar Baseline and Interim Performance Evaluation
76
secondary schools had introduced afterhours study programs as it was expected in the design of the project. When compared to the baseline proxy established at comparison schools, where about 40% had such programs, the project is likely to have caused the increase of schools with afterhour study programs by 30%.
Table 43: Number of schools with and without afterhour study programs
District Schools with afterhours study programs
Schools without Total
Kasulu 2 0 2
Kigoma Rural 1 1 2
Uvinza 1 2 3
Buhigwe 3 0 3
Total 7 3 10
Ratio 70% 30% 100%
Source: Kigoma Solar Baseline/Interim Survey, 2013
b) Availability of vaccines The survey asked health centres and dispensaries types and number of vaccine doses were stocked during the interview. The vaccines were stored in the refrigerators powered by LPG because the solar refrigerators of the Compact project were not yet installed at the health centres and dispensaries. Table 44 shows that health centres and dispensaries had an average of 121 doses of Polio vaccine, 107 doses of Measles vaccine and 66 doses of BCG vaccine per facility. Comparison with the proxy baseline values established as recall data of the situation at comparison health centres and dispensaries six months before the survey indicate that the stock of all the three vaccines of interest to the project had decreased. Polio vaccine had decreased from 258 doses to 121 doses, a decrease by 53%. Measles vaccine had increased from 192 doses to 107 doses, a decrease by 44%. BCG vaccine in stock had also decreased from 203 doses to 66 doses, a decrease by 68%. Data for the survey was collected in the Government budget month of July when most of health facilities have depleted their budgets. Experience also shows that most Government offices in Tanzania start getting money of the financial year in November and the first trench reach some offices in January of the next year. The budget and disbursement cycles of the Government explain the decrease of vaccines stored. We believe if data was collected in the same month as the baseline (December/January) results would have been different.

Final Report: Kigoma Solar Baseline and Interim Performance Evaluation
77
Table 44: Vaccines available at treated sites during the survey (Number of Doses)
District Polio Vaccine in Stock Measles vaccine in stock BCG vaccine in stock
Valid N Sum Mean Valid N Sum Mean Valid N Sum Mean
(a) Treated Health Centers:
Kasulu 2 304 152 2 11 6 2 46 23
Kigoma Vijijini 1 200 200 1 230 230 1 60 60
Uvinza 2 200 100 2 150 75 2 150 75
Buhigwe 1 300 300 1 400 400 1 200 200
Sub-total 6 1004 752 6 791 711 6 456 358
(b) Treated Dispensaries:
District Polio vaccine in stock Measles vaccine in stock BCG vaccine in stock
Valid N Sum Mean Valid N Sum Mean Valid N Sum Mean
Kasulu 1 11 11 1 11 11 1 11 11
Kigoma Vijijini 3 306 102 3 277 92 3 94 31
Uvinza 3 310 103 3 320 107 3 257 86
Buhigwe 4 391 98 4 440 110 4 262 66
Kasulu Mjini 1 160 160 1 90 90 1 100 100
Sub-total 12 1178 474 12 1138 410 12 724 294 Weighted Average Doses
121
107
66
Source: Kigoma Solar Baseline/Interim Survey, 2013 c) Vaccinations administered The evaluation could not capture interim change because the solar refrigerators were yet to be installed at the health centres and dispensaries. The data collection tools had no question on the LPG powered refrigerators. Efforts to get secondary data for the six months of 2013 proved futile.
3.3.5 Compact Goal indicator - Poverty reduction through economic growth
Interim poverty reduction and economic growth has been measured by “average annual household income per capita” through interview of treated heads of households. The interim average annual household income per capita was US$ 230. This was slightly lower than the baseline average annual household income per capita was US$ 233.25 as shown in Table 45. The t-test conducted revealed that this change of income per capita was not significant (P value = 0.567 at 90% confidence Interval). Therefore, it was too early for the program to contributed poverty reduction within few months after implementation.
Table 45: Average annual household income per capita (US$)
Status N Minimum Maximum Mean Std. Deviation
Interim for Treated Households
14 13.00 1125.00 230.0000 341.00440
Baseline adopted from Comparison Households
8 31.00 760.00 233.2500 231.84092
Source: Kigoma Solar Baseline/Interim Survey, 2013
3.3.6 Sustainability of the outputs and outcomes
The survey assessed sustainability of the project in terms of readiness and commitment to uphold
the benefits created by the project. Table 46 shows that on average, about 93% of heads of treated

Final Report: Kigoma Solar Baseline and Interim Performance Evaluation
78
facilities and households said they have plans for ensuring the sustainability for the system. All treated
schools, businesses, BMUs and fishers had sustainability plans.
Table 46: Distribution of existence of plans for ensuring sustainability for the system
(Responses)
Facility Have
Plans Do not have plans
Total % with plan
Treated Schools 10 0 10 100%
Treated Health Centre 5 1 6 83%
Treated Dispensary 13 1 14 93%
Treated Village Market 4 1 5 80%
Treated Market Businesses 11 1 12 92%
Treated Businesses 16 0 16 100%
Treated BMUs 4 0 4 100%
Treated Fishers: 8 0 8 100%
Treated Households 15 2 17 88%
Total/average 86 6 92 93%
Ratio 93% 7% 100% Source: Kigoma Solar Baseline/Interim Survey, 2013 The survey also established sustainability plans of treated facilities and households. The top 10
plans that were most frequently mentioned are as follows:
1. To keep in good condition and secure;
2. To get competent technician/have BMU in-house technicians;
3. To use responsibly/use carefully - only when needed;
4. To report or make maintenance/repair as soon as possible;
5. To charge for electricity used by businesses to pay for accessories and repair;
6. Sensitize community members (and fishers) to contribute for maintenance and buy big capacity systems.
7. To save money for maintenance/open special bank account for user fee collected
8. To adhere to training instructions
9. To recharge phones for a fee
10. To find funds including loans to buy big capacity system
11. To purchase personal extra solar system
12. To get detailed training on use and maintenance The above sustainability plans indicate that the main beneficiaries are committed to make the PV systems continue provide services and resulting benefits. This will keep and perpetuate
changes related to the project. The plans include some commitments to buy own PV systems,

Final Report: Kigoma Solar Baseline and Interim Performance Evaluation
79
including buying systems with larger capacity than those provided by the program. These commitments will contribute to attainment of the prime objective of Kigoma Solar Project - to introduce solar electricity solution as modern affordable energy in the area because they indicate that institutions, businesses and households will continue buying PV systems after closure of the program. The survey had also asked heads of treated facilities and households on whether they have plans to purchase additional PV systems and whether they are able to pay the cost of the PV systems provided by the program in a lump-sum or installments. Table 47 presents the findings. On average, about 53% of the respondents had plans to buy an additional system, confirming plans to sustain services and resulting benefits. However, all the dispensaries had no such plans and only one health centre had such plans. This is attributed to the fact that unlike schools and village markets, health facilities in Tanzania have very limited sources of funds. They do not have income generating activities or donors to contribute without getting permission of the District Medical Officer (DMO). Furthermore, the table shows that 88% of treated businesses, 75% of fishers and 65% of households had plans to purchase additional PV systems. About 88% of treated businesses, 71% of households and 63% of fishers indicated that they are able to pay the cost of the PV systems provided by the program. Therefore, the introduction of the solar electivity solution is likely to be sustainable after program closure. Table 47: Plans to purchase additional PV system and pay price equal the cost of the systems
Have
Plans
Do not
have
plans
Total % with
plan
Price
(USD)
Can
Afford
If by
installment
Cannot
Afford
Total % can
afford
Treated Schools 3 7 10 30% 13,125 0 2 8 10 20%Treated Health Centre 1 5 6 17% 8,125 0 0 6 6 0%
Solar Vaccine Refrigerator 9,375 0 0 6 6 0%Treated Dispensary 0 14 14 0% 8,125 0 0 14 14 0%
Solar Vaccine Refrigerator 9,375 0 0 14 14 0%Treated Village Market 0 5 5 0% 13,750 0 2 3 5 40%Treated Market Businesses 3 9 12 25% 169 0 5 7 12 42%Treated Businesses 14 2 16 88% 169 4 10 2 16 88%Treated BMUs 3 1 4 75% 0 2 2 4 50%Treated Fishers 6 2 8 75% 3,125 2 3 3 8 63%
Treated Households11 6 17
65% 600 -
1,000
1 11 5 1771%
Total/average 41 51 92 53% 7 35 70 112 53%Ratio 45% 55% 100% 6% 63% 100%
Plans to purchase additional Ability to pay purchase price to replace systemFacility
Source: Kigoma Solar Baseline/Interim Survey, 2013
3.3.7 Lessons learned by Project Participants and Beneficiaries
Interview with heads of facilities and households that implemented the program identified the following lessons learned that may benefit other similar projects:
Solar power is simple to implement and replicate – this was due to the installer and user training provided by the project.
Solar power is reliable – this could be due to the sunny weather condition in the area and the fact that the systems were still almost new at the time of the survey.
Solar power reduces living costs – the systems saved money that was used to buy kerosene, dry cells and batteries.
Careful use of electricity enables use of solar electricity of that system for a long

Final Report: Kigoma Solar Baseline and Interim Performance Evaluation
80
hours – this was after witnessing that those who do not use carefully such as switching off when power is not needed do not get power for some hours.
It is easy to install and use solar systems if one is trained – this was also due to the installer and user training provided by the project.
Stakeholders’ participation creates ownership of the program indicating that use of facility project implementation committees was very useful.
Solar power can increase working hours – markets and businesses started to be open till late night hours due to the light provided by the solar systems.
Solar power can enable access to previously unthinkable activities – businesses around the market and businesses that bought the systems through SACCOS had started providing cell phone charging services. Some had established salon businesses.
Solar power can improve working and teaching environment – employees at the institutions provided with the solar PV systems could work better at night because of the good electric light. Teachers could use computers and teach at night. Employees of the treated institutions could also charge their cell phones at their working station for free instead of labouring sending their phones away and paying a fee.
It can attract workers to remote areas – because of the above and other benefits. Solar power can increase community livelihood because of the benefits from use
of the electricity and generating income for those using it for businesses. If the government decides, it can install electricity in all villages – this was because
implementation of the systems took very short time and the installer and user trainings made it simpler to implement.
Education on use and repair of solar systems is essential to beneficiaries because of lack of technicians in the areas.
When a project with clear benefits covers a few beneficiaries, it leads to conflict in the community due to conflicts as happened during implementation of the LED night fishing systems through BMUs and connecting only 4 out of so many businesses around the village markets.
3.3.8 Success in further catalyzing investments in energy
Respondents were asked whether there been other energy investments from other donors or the Government since the Kigoma Solar implementation. Fifteen (15) out of the 16 respondents of treated schools and health centres replied there was none. This indicates that the project had not started causing changes of performance indicators because on average, the project had been operational for 5 months only.
3.3.9 Unplanned results
The expected results of Kigoma Solar Project are given in Section 1.3 (project description). Findings on benefits experienced due to the Kigoma Solar program in Appendix 2 indicate there were unexpected results. These include:
To attract civil servants in remote areas, Security during night time; and Light makes the environment attractive.
The first and second are among the top ten benefits as shown in the appendix.

Final Report: Kigoma Solar Baseline and Interim Performance Evaluation
81
3.3.10 Policy Implications
The survey findings indicate that access to electricity is an important driver for socio-economic development. However, there are challenges to its access that need policy changes. Participants in the project (schools, health centres, dispensaries and village markets) mentioned personal and socio-economic efficiency benefits they were getting by the time of interim evaluation. The health, education, economic/cost saving and social benefits mentioned imply that electrifications projects should give priority to providing power to public institutions. For instance, the central and local governments as well as donors should set aside some funds to be given to TANESCO or REA to connect public institutions to the national power grid or alternative electricity sources like the Solar systems.
The marketing approach through SACCOs and the trial approach through BMUs, had succeeded to interest businesses and households and fishers to purchased the PV systems and the solar night fishing systems. One of the constraints limiting purchases is lack of credit at affordable terms such as low interest rate and long repayment period. The Government, banks and other financial institutions as well as development partners should review their credit policies so as to enable more people to benefit from the solar energy solution. The bank of Tanzania can consider this to be among its credit policy directives. Beneficiaries are in dire need to buy bigger systems than what was provided under the program. This will require some policy considerations such as allowing village markets and the cooperatives to generate and distribute electricity in their local areas at less stringent requirements than those required by Rural Energy Agency (REA)22 and Energy and Water Utilities Regulatory Authority (EWURA)23 because of their technical and financial constraints such as registration and licensing of solar and other electricity generation projects. Even for small electricity activities EWURA requires five types of licenses – generation, transmission, distribution, supply and system operation. All electrical works and goods installed or operated in Tanzania are required to comply with certain acceptable standards that EWURA has a responsibility to monitor. All registrations, licenses and inspections are paid for. Section 19(3) of REA Act, 2005 requires isolated generations to pay 5% of revenue generated to Rural Energy Fund.
4. CONCLUSION
The Kigoma Solar Project has succeeded to improve electricity service coverage and consumption of electricity in the project area. The project addressed the challenge of lack of electricity that was considered the biggest challenge by 86% of the project participants and beneficiaries that were interviewed. The project design correctly focused primarily on providing lighting, which accounted for 65% of the primary uses of electricity substitutes by the project participants and beneficiaries. The project was implemented as per the approved Project Implementation Plan (PIP) except for the solar refrigerator systems that had not been
22
REA is an autonomous body under the Ministry of Energy and Minerals of the United Republic of Tanzania. Its main role is to promote and facilitate improved access to modern energy services in rural areas of Mainland Tanzania. REA became operational in October 2007 (http://www.rea.go.tz). 23
EWURA has broad objectives, including protecting stakeholder’s interests and ensuring service providers can fund their regulated activities. In achieving these objectives, the Authority, among other duties, issues licences, formulates and enforces quality codes and standards, reviews and determines rates and charges, approves Power Purchase Agreements, ensures security of supply, energy efficiency, and promotes effective competition and economic efficiency (http://www.ewura.go.tz).

Final Report: Kigoma Solar Baseline and Interim Performance Evaluation
82
implemented by the time of the evaluation. The household and business systems was rated low because of the achievement of 0.1% in terms of number of systems installed against the target and only 1% for capacity installed. While we cannot directly attribute survey findings to the Kigoma Solar Project because there were similar projects and about 24% of the installations were made at sites that already had solar systems, the Project may have contributed to the target outputs and outcomes leading to decrease of use of energy substitutes from 84% to 31%. The solar refrigerators may contribute to increase of availability of vaccines at the health centres and dispensaries as hypothesized in the project logic because of stock outs cases found at one health centre and one dispensary due to lack of LPG fuel that runs the refrigerators. The commercial component (Cell phone charging and multimedia services at a fee as shown in the project description) of the project is likely to complement institutions’ solar systems that already existed at some of the treated sites. However, all institutions covered by the survey (schools, health centres and dispensaries) had not started providing such services. It seems that the survey was done too early to capture this data because the installations were operational for an average of 5 months only. Beneficiaries are committed to make the benefits sustainable through proper repair maintenance of the systems, proper use and purchase of replacement systems or even systems with bigger capacity than those provided by the program. The program has successfully introduced solar energy to a wide area in the Kigoma region as indicated by willingness and commitments of businesses and households to continue maintaining and buying PV systems after closure of the program. For the first time the project supplied solar night fishing systems in the area. The introduction of the solar energy solution is likely to be sustainable after program closure especially if products of various voltage and prices based on different energy needs and financial capabilities will be introduced and credit availed at favourable terms. The conditions required to be in place for successful investment in energy sources are within the capacity of beneficiaries and stakeholders.
However, there were design and selection criteria shortcomings. The selection criteria did not acknowledged prio existence of the solar systems in the project area and include the marketing approach through SACCOS, and it favoured semi-urban rural areas at the expense of the hard to reach rural areas, probably for implementation convenience. The project did not address other energy needs such as cooking and boiling water, which accounted for 31% of the primary uses of electrify substitutes by the project participants and beneficiaries. Total project costs increased from US$ 4,755,603 to US$ 5,357,729.37, an increase by US$ 602,126.37, or 13% of the original cost. There was increase of costs for the feasibility study so as to include design and bid preparation works. A separate contract with the same consultant was prepared for supervision work. Value of the construction work also increased due to change of scope of work as explained in the findings.
The project also did not provide electricity to all institutions and buildings such as religious buildings, other government offices, and providing electricity for staff houses at schools, health centres and dispensaries, and all shops around village market. Voltage of the installations did not allow use of appliances that project participants and beneficiaries would wish to be included such as refrigerators. The project also did not facilitate businesses and households to buy from SACCOS or fishers to buy from BMUs.
5. RECOMMENDATIONS
Since the program targeted only 45 secondary schools out of 100 in the two districts (38 in Kigoma Rural and 62 in Kasulu), 116 dispensaries out of 148 (72 in Kigoma Rural and 76 in Kasulu), 14 health centres out of 17 (6 in Kigoma Rural and 11 in Kasulu), and 25 village markets

Final Report: Kigoma Solar Baseline and Interim Performance Evaluation
83
out of 46 with permanent building structure in the two districts (20 in Kigoma Rural and 26 in Kasulu), it is obvious that there are institutions that are still in need of the systems and there is no grid project planned to cover all rural areas in the near future. The marketing component through SACCOS and the trial approach through BMUs have registered significant sales as shown in this report. Businesses, households and fishers indicated willingness to buy the systems, especially if access constraints such as availability of credit at low interest rates and long repayment periods tied to agricultural income cycle are addressed. It is also beneficial if the Kigoma Solar program should be replicated within and outside the program districts.
However, success of any similar project will depend on addressing challenges and limitations that
faced the project as discussed in this report.
Hand-over of the PV systems must ensure that at local level the solar systems continue effecting intended changes by being led by people who are sufficiently engaged in the activities of the project participant or beneficiary. For instance, for the case of village market, handover should be to the Market Committee instead of the Project Committee. For Schools, health centres and dispensaries the handover should be to their Management Committees. This is because some project committees were still managing the installations during the survey.
The commercial component through SACCOS and BMUs are opportunities for the private sector to invest in the supply of PV systems of various capacity and prices based on different energy needs and financial capabilities. The project supplied for the first time solar night fishing systems that can be replicated to Lake Victoria and other lakes with night fishing. The ministries responsible for energy and fishing as well as other stakeholders can market this opportunity.
In contrast with the readiness of businesses, fishers and households to sustain the benefits as indicated in the report, systems installed at public institutions are likely to face budgetary constraints. The readiness of the community to contribute towards maintenance and replacement is good news that will require administrative support from the Village, District Councils and Regional Secretariats.
Design of future similar project should be based on clearly identified needs and similar projects in the target area. Design of similar projects should also address the design and selection criteria shortcomings, challenges and limitations that faced the project. Similar project should include budget for effective public outreach for creating understanding of the project and communities roles and responsibilities during the implementation and operational stage of the project.
There should also be change of policy directives on connecting public institutions, credit policy and simplification of requirements for solar and other electricity generation projects for rural areas.

Final Report: Kigoma Solar Baseline and Interim Performance Evaluation
84
6. REFERENCES
1) Axel Scholle and Robert Aitken (2013), Progress Report 4, Supply of Goods, Related Services and Management of the Photovoltaic Program in Kigoma Region
2) CEER (2011), 5th CEER Benchmarking Report on the Quality of Electricity Supply, Council of European Energy Regulators
3) DataVision International (2004), Study to Promote Productive Uses of Electricity in Tanzania commissioned by the Africa Energy Unit (AFTEG) of the Word Bank.
4) http://en.wikipedia.org/wiki/Renewable_energy
5) http://en.wikipedia.org/wiki/Power_quality
6) http://tarea-tz.org/
7) http://www.access2innovation.com/en/cases/ongoing_projects_02/clean_water_through_renewable_energy_in_tanzania.htm
8) http://www.nortonrose.com/knowledge/publications/59141/scaling-up-renewable-energy-in-africa-tanzania
9) MTUHA Register Books and Tally Forms for Data Collection and Reporting at Health Statistics in Tanzania
10) URT (2009), The Economic Survey, The Ministry of Finance and Economic Affairs, June, 2010
11) URT (2009),Poverty and Human Development Report, Research and Analysis Working Group,
MKUKUTA Monitoring System, The Ministry of Finance
12) URT (2011), Feasibility Study related to Systems Design for a domestic and commercially oriented Solar Photovoltaic Program in Kigoma Regionand Economic Affairs
13) URT (2011), Request for Proposals, MCAT/CB/COM/E9-057
14) The guardian, 22nd August 2012
15) World Bank (2010), Addressing the Electricity Access Gap, Background Paper for the World Bank Group Energy Sector Strategy.
16) www.allafrica.com/stories/201211030230.html
17) http://evaluationtoolbox.net.au/index.php?option=com_content&view=article&id=30&Itemid=136

Final Report: Kigoma Solar Baseline and Interim Performance Evaluation
85
7. APPENDICES
APPENDIX 1: USE OF ELECTRICITY BEFORE AND AFTER THE PROJECT BEFORE:
Used Total %
used
Used Total %
used
Used Total %
used
Used Total %
used
Used Total %
used
Used Total %
used
Used Total %
used
Used Total %
used
TANESCO grid 0 10 0% 0 6 0% 0 14 0% 0 5 0% 0 12 0% 0 16 0% 0 8 0% 0 16 0%Other electricity grid 0 10 0% 0 6 0% 0 14 0% 0 5 0% 0 12 0% 0 16 0% 0 8 0% 0 16 0%Diesel Gen-set 1 10 10% 1 6 17% 0 14 0% 1 5 20% 1 12 8% 2 16 13% 0 8 0% 0 16 0%Gasoline Gen-set 1 10 10% 0 6 0% 0 14 0% 1 5 20% 3 12 25% 4 16 25% 0 8 0% 2 16 13%Biogas 0 10 0% 0 6 0% 0 14 0% 0 5 0% 0 12 0% 0 16 0% 0 8 0% 0 16 0%Wind mill 0 10 0% 0 6 0% 0 14 0% 0 5 0% 0 12 0% 0 16 0% 0 8 0% 0 16 0%Solar PV 1 10 10% 6 6 100% 6 14 43% 2 5 40% 4 12 33% 1 16 6% 0 8 0% 1 16 6%Solar Lantern 1 10 10% 0 6 0% 0 14 0% 1 5 20% 0 12 0% 0 16 0% 0 8 0% 0 16 0%Car Battery 0 10 0% 1 6 17% 0 14 0% 1 5 20% 1 12 8% 1 16 6% 0 8 0% 1 16 6%Motorcycle Battery 0 10 0% 0 6 0% 0 14 0% 1 5 20% 1 12 8% 1 16 6% 0 8 0% 1 16 6%D - Size dry cell batteries 10 10 100% 5 6 83% 12 14 86% 5 5 100% 6 12 50% 14 16 88% 7 8 88% 15 16 94%C - Size dry cell batteries 0 10 0% 1 6 17% 1 14 7% 3 5 60% 1 12 8% 2 16 13% 1 8 13% 2 16 13%A - Size dry cell batteries 0 10 0% 0 6 0% 0 14 0% 1 5 20% 1 12 8% 2 16 13% 0 8 0% 0 16 0%AA - Size dry cell batteries 0 10 0% 0 6 0% 0 14 0% 0 5 0% 0 12 0% 1 16 6% 0 8 0% 0 16 0%AAA - Size dry cell batteries 0 10 0% 1 6 17% 0 14 0% 0 5 0% 0 12 0% 0 16 0% 0 8 0% 0 16 0%9 Volt - Size dry cell batteries 0 10 0% 0 6 0% 0 14 0% 0 5 0% 0 12 0% 0 16 0% 0 8 0% 0 16 0%
Other 0 10 0% 0 6 0% 0 14 0% 0 5 0% 1 12 8% 1 16 6% 0 8 0% 0 16 0%Total 14 170 8% 15 102 15% 19 238 8% 16 85 19% 19 204 9% 29 272 11% 8 136 6% 22 272 8%
Treated schools Treated health
centre
Treated
dispensary
Treated village
markeet
Treated market
business
Treated
businesses
Treated fishers Treated
household
Source

Final Report: Kigoma Solar Baseline and Interim Performance Evaluation
86
AFTER:
Used Total %
used
Used Total %
used
Used Total %
used
Used Total %
used
Used Total %
used
Used Total %
used
Used Total %
used
Used Total %
used
TANESCO grid 0 10 0% 0 6 0% 0 14 0% 0 5 0% 0 12 0% 0 16 0% 0 8 0% 0 16 0%Other electricity grid 0 10 0% 0 6 0% 0 14 0% 0 5 0% 0 12 0% 0 16 0% 0 8 0% 0 16 0%Diesel Gen-set 0 10 0% 1 6 17% 0 14 0% 1 5 20% 0 12 0% 1 16 6% 0 8 0% 0 16 0%Gasoline Gen-set 1 10 10% 0 6 0% 0 14 0% 1 5 20% 1 12 8% 2 16 13% 0 8 0% 1 16 6%Biogas 0 10 0% 0 6 0% 0 14 0% 0 5 0% 0 12 0% 0 16 0% 0 8 0% 0 16 0%Wind mill 0 10 0% 0 6 0% 0 14 0% 0 5 0% 0 12 0% 0 16 0% 0 8 0% 0 16 0%Solar PV 10 10 100% 6 6 100% 14 14 100% 5 5 100% 12 12 100% 16 16 100% 8 8 100% 16 16 100%Solar Lantern 0 10 0% 0 6 0% 0 14 0% 0 5 0% 0 12 0% 0 16 0% 0 8 0% 0 16 0%Car Battery 0 10 0% 1 6 17% 0 14 0% 0 5 0% 1 12 8% 1 16 6% 0 8 0% 1 16 6%Motorcycle Battery 0 10 0% 0 6 0% 0 14 0% 0 5 0% 1 12 8% 1 16 6% 0 8 0% 1 16 6%D - Size dry cell batteries 10 10 100% 5 6 83% 10 14 71% 3 5 60% 3 12 25% 10 16 63% 7 8 88% 13 16 81%C - Size dry cell batteries 0 10 0% 1 6 17% 1 14 7% 2 5 40% 0 12 0% 1 16 6% 1 8 13% 1 16 6%A - Size dry cell batteries 0 10 0% 0 6 0% 0 14 0% 1 5 20% 0 12 0% 1 16 6% 0 8 0% 0 16 0%AA - Size dry cell batteries 0 10 0% 1 6 17% 0 14 0% 0 5 0% 0 12 0% 1 16 6% 0 8 0% 0 16 0%AAA - Size dry cell batteries 0 10 0% 0 6 0% 0 14 0% 0 5 0% 0 12 0% 0 16 0% 0 8 0% 0 16 0%9 Volt - Size dry cell batteries 0 10 0% 0 6 0% 0 14 0% 0 5 0% 0 12 0% 0 16 0% 0 8 0% 0 16 0%
Other 0 10 0% 0 6 0% 0 14 0% 0 5 0% 0 12 0% 1 16 6% 0 8 0% 0 16 0%Total 20 170 12% 15 102 15% 25 238 11% 13 85 15% 18 204 9% 34 272 13% 16 136 12% 32 272 12%
Treated schools Treated health
centre
Treated
dispensary
Treated village
markeet
Treated market
business
Treated
businesses
Treated fishers Treated
household
Source
Source: Kigoma Solar Baseline/Interim Survey, 2013
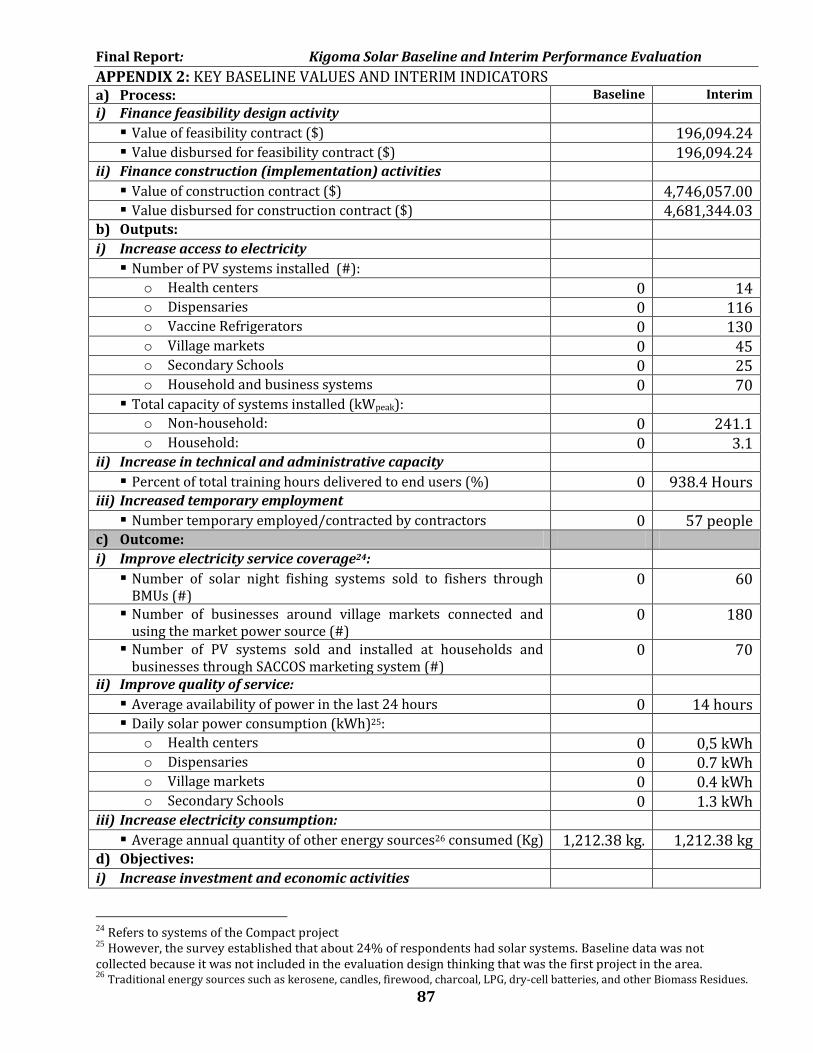
Final Report: Kigoma Solar Baseline and Interim Performance Evaluation
87
APPENDIX 2: KEY BASELINE VALUES AND INTERIM INDICATORS a) Process: Baseline Interim
i) Finance feasibility design activity Value of feasibility contract ($) 196,094.24 Value disbursed for feasibility contract ($) 196,094.24
ii) Finance construction (implementation) activities Value of construction contract ($) 4,746,057.00 Value disbursed for construction contract ($) 4,681,344.03
b) Outputs: i) Increase access to electricity
Number of PV systems installed (#): o Health centers 0 14 o Dispensaries 0 116 o Vaccine Refrigerators 0 130 o Village markets 0 45 o Secondary Schools 0 25 o Household and business systems 0 70
Total capacity of systems installed (kWpeak): o Non-household: 0 241.1 o Household: 0 3.1
ii) Increase in technical and administrative capacity Percent of total training hours delivered to end users (%) 0 938.4 Hours
iii) Increased temporary employment Number temporary employed/contracted by contractors 0 57 people
c) Outcome: i) Improve electricity service coverage24:
Number of solar night fishing systems sold to fishers through BMUs (#)
0 60
Number of businesses around village markets connected and using the market power source (#)
0 180
Number of PV systems sold and installed at households and businesses through SACCOS marketing system (#)
0 70
ii) Improve quality of service: Average availability of power in the last 24 hours 0 14 hours Daily solar power consumption (kWh)25:
o Health centers 0 0,5 kWh o Dispensaries 0 0.7 kWh o Village markets 0 0.4 kWh o Secondary Schools 0 1.3 kWh
iii) Increase electricity consumption: Average annual quantity of other energy sources26 consumed (Kg) 1,212.38 kg. 1,212.38 kg
d) Objectives: i) Increase investment and economic activities
24
Refers to systems of the Compact project 25
However, the survey established that about 24% of respondents had solar systems. Baseline data was not collected because it was not included in the evaluation design thinking that was the first project in the area. 26
Traditional energy sources such as kerosene, candles, firewood, charcoal, LPG, dry-cell batteries, and other Biomass Residues.

Final Report: Kigoma Solar Baseline and Interim Performance Evaluation
88
Average annual business revenue ($) o Businesses around the market 3,028 4,050 o Businesses (through SACCOS) 5,928 6,650 o Fishers 9,909 5,217
Average annual wages ($) o Businesses around the market 618.75 500.00 o Businesses (through SACCOS) 0 0 o Fishers 1,116.58 1,3,15.38
Average annual expenditure on energy ($) 15,093 17,591 ii) Improve human capital accumulation
Schools with afterhours study programs (%) 40% 70% Availability of vaccines27 (#)
o Polio vaccine 227 doses 121 doses o Measles vaccine 165 doses 107 doses o BCG vaccine 179 doses 66 doses
Vaccinations administered (#) o Polio vaccine 242 doses Not collected
o Measles vaccine 75 doses Not collected o BCG vaccine 79 doses Not collected
e) Compact Goal: Poverty reduction through economic growth Average annual household income per capita ($) 233.25 230
Source: Kigoma Solar Baseline/Interim Survey, 2013 and secondary data
27
Using LPG powered refrigerators that existed at the health centres and dispensaries before and after the project because the solar refrigerators of the project were not yet installed at the time of the survey. The baseline was determined from comparison sites while the interim was from sites that were expected to be treated.

Final Report: Kigoma Solar Baseline and Interim Performance Evaluation
89
APPENDIX 3: BENEFIT OF THE OUTPUTS Benefits Treated
Schools
Treated
Health
Centres
Treated
Dispensary
Treated
Village
Market
Treated
Market
business
Treated
Businesses
Treated
Fishers
Treated
HouseholdsTotal Ratio Rank
To get light at night 3 4 10 4 7 12 3 11 54 21.3% 1
To recharge phones for free/fee 7 1 9 4 4 7 3 9 44 17.4% 2
To recharge electricity lantern 2 2 0.8%
Students have increased 1 1 0.4%To conduct bussinesses till night(Prolonged business/working hours) 4 2 3 3 2 14 5.5% 4
Dispensaries and health centres provide services at night 2 1 5 1 9 3.6% 6
Teaching during night time/extra lessons during night time 2 1 3 1.2%Students can now study computer 1 1 0.4%Students study during night time 5 2 1 1 3 1 9 22 8.7% 3
Store medicines at dispensaries 1 1 0.4%
Reduce costs of buying radio bettries 1 1 2 0.8%
Reduced fishing costs 7
Reduce kerosene costs 1 2 1 2 7 2 7 22 8.7% 3
Reduce damages/health hazards that can be caused by use of kerosene 1 1 2 0.8%
Store laboratory reagents 1 1 0.4%
Store vaccines 1 1 0.4%
To attract civil servants in remote areas 1 3 1 5 2.0% 9
To get intertainment/Can now watch TVs/Using radio 1 1 1 2 5 2.0% 9Improved health care services 1 4 3 1 3 1 13 5.1% 5
Security during night time 1 1 1 1 1 1 6 2.4% 8
To get internet services 1 1 0.4%
To use computers to increase teaching standards/Increased teaching
aids/Teaching has been simplified 2 1 3 1.2%
Increased passing of students in exams 2 2 0.8%
Facilitated marking of exams (now can be done at night) 1 1 0.4%
Expecting mothers can deliver in better light 1 1 2 0.8%
Increased income from businesses using the solar electricity 1 1 2 4 1.6% 10
No effect from solar light 1 1 0.4%
Expand/increase business 1 2 3 1.2%
Has enabled introduction of new businesses 1 4 1 6 2.4% 8
Increase employment 1 1 0.4%
Has simplified businesses operations/improved businesses efficiency (use
of electrical machines) 2 1 3 1 7 2.8% 7
Businesses have become more vibrant than before 1 1 0.4%
Light makes the environment attractive 1 1 1 3 1.2%
Understand solar system/Learn how to install and conduct maintenance1 1 2 0.8%
Awareness of community members to purchase solar systems 1 1 2 0.8%
Has reduces environmental pollution from smoke 1 1 2 0.8%
Avoid phone charging costs 1 1 0.4%
Reduced phone charging costs in the area 2 1 3 1.2%
0 0.0%
Total 40 17 39 16 39 41 22 46 253 100.0% Source: Kigoma Solar Baseline/Interim Survey, 2013

90
8. ANNEX I: DATA COLLECTION INSTRUMENTS
These have been submitted separately.

91
9. ANNEX II: PROTOCOLS
Performance Evaluation of the Kigoma
Solar Sub-Activity in Tanzania: Design and
Implementation
FINAL
Data Collection Protocols
Submitted by: Abel Y. Busalama
Submitted to: Millennium Challenge Account Tanzania (MCA-T)
Part I Training and Field Manual
Part II Research Subject Information and Consent Form
Part III Tanzania Mainland Informal Sector Industry Codes Manual

92
Training and Field Manual

93
Performance Evaluation of the Kigoma Solar Program in Tanzania: Design and Implementation TRAINING MANUAL
1. INTRODUCTION
The Government of the United States of America is helping the Government of Tanzania (GoT)
through the Ministry of Financeto facilitate poverty reduction through economic growth in Tanzania
by implementing the Millennium Challenge Account Tanzania (MCA-T) assistance agreement. The
agreement is on implementation of a program consisting of three projects, namely transport, energy
and water projects. Each project contains a number of activities and sub-activities.
MCA-T has commissioned this study in order to establish initial progress and outcome indicators
against which performance will be measured. Therefore, this is a very important study to socio-
economic development of Tanzania.
2. PURPOSE OF THE TRAINING
The training is geared towards imparting all procedures and logistics pertaining to the assignment, data
collection tools, data collection methodology, research ethics, confidentiality, and other issues
presented in this manual. The purpose of this training is to ensure uniform methodology in the field to
guarantee comparability of the end results.
The aim of this training is to equip you with the necessary skills needed for collection of reliable and
valid data from the right respondents during fieldwork. Although knowledge and skills gained in this
training may not be self sufficient due to the fact that there no objective reality in the field, it will guide
you and make the data collection exercise objective, easier and enjoyable. Furthermore, you will get
the skills that will enable you to collect appropriate information for the present study. All you need is
to follow carefully and abide to the guidelines given in this training.
3. PROJECT BACKGROUND
Kigoma Solar Project is designed to address a range of energy needs in Kigoma (Rural) and Kasulu
Districts of Kigoma region.
It is diversified program comprising a fully grant-funded component to provide PV systems for certain
public institutions, village markets, and beach management units, and a component for commercially
sold PV systems for home and small businesses use. The grant-funded component will involve
installing solar modules and other electric systems in approximately 45 secondary schools, 116
dispensaries, 14 health centres, 25 village markets, and 60 fishing boat pairs. Solar systems to be
installed are as follows:
(a) Grant Funded PV Systems
i) Public Systems
Secondary School System
Dispensary System
Health Centre System
Vaccine Refrigerator System
ii) Business Systems
Village Market Productive-use Systems
BMU Night Fishing System
(b) Commercially Sold Systems
Solar systems in various sizes for home and small businesses use sold through SACCOS.

94
4. STUDY FOCUS AND METHODOLOGY
Kigoma Solar Project is expected to improve electricity service coverage and thereby consumption of
electricity. It is assumed that this will increase investment and economic activities by businesses
and individuals. It is also expected to improve human capital accumulation in terms of education and
medical service delivery. The hypothesis is that these activities will ultimately result into increased
income and more access to the two social services, which will in turn contribute to poverty reduction
and economic growth.
The study measures changes of these parameters in the project area.
The study will use a before and aftercomparison evaluation method.
5. STUDY AREA
The study will collect secondary and primary data from respondents in the Program areas of Kigoma
Rural and Kasulu Districts. Secondary data and extractions from administrative records will also be
done in Dar es Salaam covering stakeholders and TANESCO and Fishers’ association in Kigoma
Municipal.
6. DATA COLLECTION INSTRUMENTS
Data will be collected using the following data collection instruments:
Instrument Responding Unit and Respondent
Questionnaire No. 1 Treated Schools (Headmasters/mistress)
Questionnaire No. 2 Comparison Schools (Headmasters/mistress)
Questionnaire No. 3 Treated Health Centres (In-charge of Health Centres)
Questionnaire No. 4 Comparison Health Centres (In-charge of Health Centres)
Questionnaire No. 5 Treated Dispensaries (In-charge of Dispensaries)
Questionnaire No. 6 Comparison Dispensaries (In-charge of Dispensaries)
Questionnaire No. 7a Treated Village Markets (Village Market leaders)
Questionnaire No. 7b Treated Village Markets Businesses (Owner/Manager)
Questionnaire No. 8a Comparison Village Markets (Village Market leaders)
Questionnaire No. 8b Comparison Village Markets Businesses (Owner/Manager)
Questionnaire No. 9a Treated BMUs (Secretaries of BMUs)
Questionnaire No. 9b Treated Fisher (Boat-pair owner/fisherman)
Questionnaire No. 10a Comparison BMUs (Secretaries of BMUs)
Questionnaire No. 10b Comparison Fisher (Boat-pair owner/fisherman)
Questionnaire No. 11 Treated Businesses (Owner/managers of Businesses)
Questionnaire No. 12 Comparison Businesses (Owner/managers of Businesses)
Questionnaire No. 13 Treated Households (Head of Households)
Questionnaire No. 14 Comparison Households (Head of Households)
In-Depth interviews (IDIs) No. 1 SACCOS (SME-MFIs) involved in the program
In-Depth interviews (IDIs) No. 2 Stakeholders (Energy department of MCA-T, District Councils, and
Village leaders)
FGD Guide No. 1 Treated Community Members – Male and Female
FGD Guide No. 2 Comparison Community Members – Male and Female
Literature Checklist Institutions and websites
TRAINER: Explain the purpose and content of each tool.

95
7. SAMPLE SELECTION
(a) Sampled Treatment Group
Sampled Villages and Responding Units
S/N Ward Village Dispensaries Health
Centres
Sec.
Schools
Village
Markets
BMUs SACCOS Bus. HHs
Kigoma Rural District
1. Bitale Bitale
2. Nguruka Nguruka* 1
3. Mkigo Nyarubanda 1 1 1 **
4. Kalinzi Kalinzi 1 1
5. Mwandiga Kibingo
6. Kazuramimba Kazuramimba 1 1 1 **
7. Uvinza Uvinza 1 1 1 1 ** **
8. Kagunga Kagunga 1 1 **
9. Mwamgongo Mwamgongo* 1 1 **
10. Ilagala Ilagala 1 1 1 ** **
11. Mwakizega 1 1 **
12. Sunuka Karago 1 1 **
Sub-total 7 3 5 3 4 2
Kasulu District
1. Munzeze Munzeze 1 1 1 **
2. Kwaga Kwaga 1
3. Rusesa Rusesa 1 1 1 ** **
4. Nyange Nyange* 1
5. RungweMpya RungweMpya 1 1
6. Murufiti Murufiti 1 1 ** **
7. Rusaba Rusaba 1 1 1 **
8. Munanila Kibwigwa 1 1 1 **
10. Buhigwe Buhigwe 1
11. Janda Janda* 1
Kibirizi in Kigoma Municipality 7 3 5 3 1 2 ** **
14 6 10 6 5 4
*Additional Health Centres ** Full coverage of all found connected to the system at a sampled village.
(b) Sampled Comparison Group
The comparison dispensaries, health centres, secondary schools and village markets will be selected
after getting more geographic information during piloting in Kigoma. Comparison groups should not
be located near treatment because people from near villages can obtain services from the facilities
provided with the solar PVs of the program. Since, implementation of BMUs was done in Kigoma
District alone, similar respondents in Kasulu District will be used as a comparison group.
(c) Community FGD
The selection rule for villages where FGDs will be conducted will be to pick the third village when
moving between villages during field data collection. Therefore, given the above sampling of villages
for household survey, a total of 8 FGDs (4 for Male and same number for Female) will be conducted in
4villages where there are Health Centre and/or Village Market installations. The geographical
arrangements of villages are not known enough to determine a movement track that could help make
the choice of FGD villages at this stage. Four (4) FGDs (2 for Male and same number for Female) will
be conducted in 2 comparison villages.
(d) In-Depth interviews (IDIs) and Literature Checklist
Respondents are shown in these data collection instruments.

96
8. ROLES AND RESPONSIBILITIES
There will be two (2) moving data collection teams, one for each district. Each team shall together
cover respondents of one location and then move to another sampled location.
Each enumerator must be conversant to administer all the 19 data collection tools.
With regard to Focus Group Discussions (FGDs), they will e collected by a pair – one being a
Moderator while the other is a recorder.
9. SIMILARITY OF QUESTIONS
The questions in the questionnaires are similar.TRAINER: physically show similar questions.
10. FIELD PROCEDURES AND PROCESSES
Data collection will be entrenched into the Local Government Authorities structures. There will be
letters of introduction introducing the Team to the District Executive Directors (DEDs) of Kigoma
Rural and Kasulu Districts. The flow of work will involve:
Courtesy call to DED to introduce the team, purpose and villages to be covered in the district, and
asking for Letters of Introduction to Village Executive Officers (VEOs) of sampled villages.
Visit VEO of each village to introduce the team, purpose and responding units to be covered in the
village.
Visit each responding units to collect data from the target respondent.
The data collection tools have some of the field procedures and processes that will be known when
studying the tools as part of the training.
11. RESEARCH ETHICS
Research has its own ethical standards that must be taken into account by all researchers. The
following are some research ethical consideration that all enumerators must possess:
Adhering to the research design and instructions
Being willing to seek informed consent from respondents – Make sure the Form is signed
Being open and honest to respondents
Being ready to protect respondents from any physical and mental discomfort, harm and danger
Being able to treat information obtained from respondents confidentially
Ensuring there are no unfilled gaps in the questionnaire – unless if there no information to collect
Ensuring correctness of data collected
Ensuring the handwriting is readable
Ensuring safety of the questionnaires
12. PRACTICE IN THE USE OF THE INSTRUMENTS
TRAINER: (1)Use one tool in each category to train how to administer each question.
. (2) Allow them to practice
(3) Ask them to read and understand all tools before piloting

97
Research Subject Information and
Consent Form

98
RESEARCH SUBJECT INFORMATION AND CONSENT FORM
TITLE: Evaluation of Performance Evaluation of the Kigoma Solar Sub-Activity in Tanzania: Design and
Implementation
SPONSOR: Millennium Challenge Account Tanzania (MCA-T)
Ministry of Finance, Tanzania
INVESTIGATOR: Abel YejiBusalama,
P. O. Box 12843, Dar es Salaam, Tanzania
Mobile Phone: 0754 053 732, E-mail: [email protected]
INTRODUCTION AND PURPOSE
Good morning. I am ___________. I am here on behalf of the Ministry of Finance, and the Millennium Challenge Account – Tanzania (MCA-
T), to collect data that will be used for evaluation of energy availability, access, use, and costs in Kigoma and Kasulu Districts. Funding for
this research study is provided by the Millennium Challenge Corporation (MCC). The data collected now will help to establish changes that
can bebrought about by an energy project and how they can be measured.
The purpose of the study is to better understand the conditions within your community in order to improve relevant development
activities affectingthe socioeconomic status of individuals in your community and household.You are being asked to participate in this
study because you live in one of the communities selected for the present study.
This consent form may contain words that you do not understand. Please ask for explanation of any words or information that you do not
clearly understand. You may have a copy of this consent form and contact the study staff with future questions.
PROCEDURES AND CONFIDENTIALITY
The study staff has come to talk to you. You will give answers to a confidential questionnaire. The questionnaire today will take
approximately 1.5 hours of your time to complete.About one year from now, someone will visit the community again to ask questions.
This will take about 1 hour.
Any information that is obtained in connection with this study and that can be identified with you will remain confidential and will not be
disclosed without your permission. Once the study is completed, all de-identified data will be made publicly available to enable
additional analysis of the average answers. Your name will not be printed or used in any documents. The honesty of your answers is very
important.
RISKS
You may feel uncomfortable answering some of the questions, which may gather information that is private.
BENEFITS AND PAYMENT FOR PARTICIPATION
We hope to have a better understanding about current government services designed to improve community and household wellbeing
through your participation in the study. However, there may be no other direct personal benefits for you from this research and you will
not be paid for being in this study.
VOLUNTARY PARTICIPATION AND WITHDRAWAL
Your participation in this study is voluntary. You may decide not to participate or you may leave the study at any time. Your decision
will not result in any penalty or loss of benefits to which you are entitled.Your participation in this study may be stopped at any time by the
study staff or the sponsor without your consent for any of the following reasons:
if it is in your best interest; or for any other reason.
QUESTIONS
If you have any questions, please feel free to ask the interviewer at any time during the interview.ContactVillage Executive Officer
(VEO)if you have any questions about your participation in this study after the departure of the study staff.
Do not agree to be in this research unless you have had a chance to ask questions and have received satisfactory answers to all of your
questions. Are there any questions about what I have just explained?
CONSENT
I willingly agree to participate. I may withdraw my consent at any time and stop participation without penalty. All my questions about
the study and my participation in it have been answered.
By agreeing to be in this research, I have not given up any of my legal rights.Your signature or thumb mark indicates your willingness to
voluntarily participate in this study.
Participant name: Date:
Day / Month / Year
Signature or Mark:
Person Conducing Informed Date:
Consent Discussion Name: Day / Month / Year
Signature:
District: Ward: Village: Questionnaire No.:

99
Tanzania Mainland Informal Sector
Industry Codes Manual

100
TANZANIA MAINLAND INFORMAL SECTOR INDUSTRY CODES
1. Agriculture and fishing
101- Agriculture or keeping livestock for business purposes (urban area only)
102 – Fishing (urban and rural)
2. Mining and Quarrying
201 – Mining or quarrying of rocks or sand for buildings.
202 – Other mining and quarrying e.g. Gold precious.
3. Manufacturing
31. Food processing
311- Making Bread
312- Making maandazi, scones or similar baked products.
313- Making sweets, (Halua)
314- Making Fruit drinks (non alcoholic)
315- Making Beer or similar alcoholic drinks.
316- Other food processing.
32. – Making clothing mats baskets and similar products of cloth or other fibred
321- Sewing/making clothing
322- Making caps hats
323- Other cloth products
324- Making mats carpets ropes, twine and other products of straw.
325- Other products of fibre
33. Leather or rubber products
331- Making shoes or other leather products
332- Making products from rubber –old tyros, etc
34. Wood products (incl. Cane)
341- Making furniture and other wooden household goods e.g. chairs tables
342- Making doors windows and other house fittings for sale.
343- Carvings for sale.
344- Making boats canoes.
35. Paper products
351- Making paper bags or other paper products.
36. Charcoal makers
361- Making charcoal.
37. Clay and Earth ware and cement.
371- Making pottery, knives.
372- Making house Bricks (not cement)
373- Making Bricks with cement
38. Metal products
381- Making cuttery knives
382- Making furniture or house fittings of metal e.g. security bars.
383- Making stoves and other appliances.
384- General Blacksmiths
39. Jewellery
391- Making jewellery or other products of gold or silver.
392- Other manufacturing.
5. Construction
501. General construction of houses buildings (ujenzi)

101
Services to construction:
502- Masons
503- Carpenters
504- Plumbers
505- Roof makers (makuti)
506- Electrical fundis.
507- Painters
508- Other building or construction.
6. Trade/ Restaurants/Hotels
601- General Retails (Duka)
602- Cooked grain products sale e.g. maandazi, scones, bread sellers
603- Fruit or vegetable sellers
604 - Fish, meat or chicken sellers.
(Cooked or uncooked)
605- Other food sellers e.g. salt
606- Local Beer selling
607- Charcoal/Firewood sellers
608- General street sellers
609- Cooked food stalls similar to restaurants but in the street (mama ntilie)
610- Restaurants or hotels main activity food supply
611- Hotels - main activity accommodation
612- Other retail - e.g. trade, medicines etc
613- Traders (w’ sale or R’ tail) rural/urban between countries.
7. Transport
701- Bus pickup or taxis (motorized))
702- Hand or Animal drawn transport
703- Water transport (Canoes, Dhows)
9. Community and Personal services.
901 – Education or Religious tuition/coaching.
(Tutoring, Koran school)
902- Shoes and other leather goods repair
903- Electrical repairs radio etc.
904- Watch, Clock and Jewellery repair
905- Garage- repair of vehicles
906- Other repair)
907- Laundries/ Dobis
908- Local midwives doctors or herbalists
909- Video Trade, Dancing or other entertainment
910- Barbers and Beauty shop
911- Photographic shops/ services
912- Other service e.g. shoe shining