Performance Evaluation of Mobile WIMAX IEEE 802.16E for...
14
International Journal of Computer Networks & Communications (IJCNC) Vol.8, No.5, September 2016 DOI: 10.5121/ijcnc.2016.8501 1 PERFORMANCE EVALUATION OF MOBILE WIMAX IEEE 802.16E FOR HARD HANDOVER Amira Youssef Fahoud and D.K. Lobiyal School of Computer & Systems Sciences, Jawaharlal Nehru University, New Delhi, India ABSTRACT Seamless handover in wireless networks is to guarantee both service continuity and service quality. In WiMAX, providing scalability and quality of service for multimedia services during handover is a main challenge because of high latency and packet loss. In this paper, we created four scenarios using Qualnet 5.2 Network Simulator to analyze the hard handover functionality of WiMAX under different conditions. The scenarios such as Flag with 5 and 10 sec UCD and DCD interval values, Random mobility scenario and DEM scenario using 6 WiMAX Cells have been considered. This study is performed over the real urban area of JNU where we have used JNU map for scenarios 1, 2 and 3 but for scenario 4, the JNU terrain data has been used. Further, each BS of 6 WiMAX cell is connected to four nodes. All nodes of each scenario are fixed except Node 1. Node 1 is moving and performing the handover between the different BSs while sending and receiving real time traffics. Flag mobility model is used in Scenario 1, 2 and 4 to model the movement of the Node 1 while we use random mobility model in sceanrio3. 5 seconds time interval is used for Scenarios 1, 3, and 4 while 10 seconds time interval is used for scenario 2 to study the effect of management messages load on handover. Further, the statistical measures of handover performance of WiMAX in terms of number of handover performed, throughput, end-to-end delay, jitter, and packets dropped are observed and evaluated. KEYWORDS Wireless Broadband; WiMAX; Performance Evaluation; Qualnet; Handover 1. INTRODUCTION Worldwide Interoperability for Microwave Access (WiMAX) brings broadband experience into wireless context [1]. It is an emerged industry based standard technology to provide a cost effective alternative solutions to the high cost wired broadband technologies available nowadays like DSL, T1/E1, and cable modems [2]. WiMAX is based on IEEE802.8 family of standards for providing wireless broadband connectivity over a metropolitan sized network and in two possible developments [3]. They are fixed WiMAX which is based on IEEE802.16d 2004 and Mobile WiMAX that is based on IEEE802.16e 2005 [4]. Broadband provides end users with certain benefits for traditional services and new multimedia services as well. Broadband systems must provide these benefits with a robust QoS in terms of throughput, jitter, End-to-End delay and packet error rate [2]. Mobility on the other hand is the most advantage provided by Mobile WiMAX to end users [5], but it brings main challenges like the need to address two important issues for supporting mobility; they are roaming and handover as well [6]. Roaming and Handoff are what we mobility management should take care of [7]. It should find means for supporting roaming and making seamless handover as well. As for a seamless handover, how to maintain on- going sessions without it being interrupted while on the move even with a vehicular speed is a
Transcript of Performance Evaluation of Mobile WIMAX IEEE 802.16E for...

International Journal of Computer Networks & Communications (IJCNC) Vol.8, No.5, September 2016
DOI: 10.5121/ijcnc.2016.8501 1
PERFORMANCE EVALUATION OF MOBILE
WIMAX IEEE 802.16E FOR HARD HANDOVER
Amira Youssef Fahoud and D.K. Lobiyal
School of Computer & Systems Sciences, Jawaharlal Nehru University, New Delhi, India
ABSTRACT
Seamless handover in wireless networks is to guarantee both service continuity and service quality. In
WiMAX, providing scalability and quality of service for multimedia services during handover is a main
challenge because of high latency and packet loss. In this paper, we created four scenarios using Qualnet
5.2 Network Simulator to analyze the hard handover functionality of WiMAX under different conditions.
The scenarios such as Flag with 5 and 10 sec UCD and DCD interval values, Random mobility scenario
and DEM scenario using 6 WiMAX Cells have been considered. This study is performed over the real
urban area of JNU where we have used JNU map for scenarios 1, 2 and 3 but for scenario 4, the JNU
terrain data has been used. Further, each BS of 6 WiMAX cell is connected to four nodes. All nodes of each
scenario are fixed except Node 1. Node 1 is moving and performing the handover between the different BSs
while sending and receiving real time traffics. Flag mobility model is used in Scenario 1, 2 and 4 to model
the movement of the Node 1 while we use random mobility model in sceanrio3. 5 seconds time interval is
used for Scenarios 1, 3, and 4 while 10 seconds time interval is used for scenario 2 to study the effect of
management messages load on handover. Further, the statistical measures of handover performance of
WiMAX in terms of number of handover performed, throughput, end-to-end delay, jitter, and packets
dropped are observed and evaluated.
KEYWORDS
Wireless Broadband; WiMAX; Performance Evaluation; Qualnet; Handover
1. INTRODUCTION Worldwide Interoperability for Microwave Access (WiMAX) brings broadband experience into
wireless context [1]. It is an emerged industry based standard technology to provide a cost
effective alternative solutions to the high cost wired broadband technologies available nowadays
like DSL, T1/E1, and cable modems [2]. WiMAX is based on IEEE802.8 family of standards for
providing wireless broadband connectivity over a metropolitan sized network and in two possible
developments [3]. They are fixed WiMAX which is based on IEEE802.16d 2004 and Mobile
WiMAX that is based on IEEE802.16e 2005 [4]. Broadband provides end users with certain
benefits for traditional services and new multimedia services as well. Broadband systems must
provide these benefits with a robust QoS in terms of throughput, jitter, End-to-End delay and
packet error rate [2]. Mobility on the other hand is the most advantage provided by Mobile
WiMAX to end users [5], but it brings main challenges like the need to address two important
issues for supporting mobility; they are roaming and handover as well [6]. Roaming and Handoff
are what we mobility management should take care of [7]. It should find means for supporting
roaming and making seamless handover as well. As for a seamless handover, how to maintain on-
going sessions without it being interrupted while on the move even with a vehicular speed is a

International Journal of Computer Networks & Communications (IJCNC) Vol.8, No.5, September 2016
2
serious challenge [8]. This serious challenge rises on how and when to make the transition
process [9]. Algorithms which are responsible for taking the decision on when to make the
handover needs to assure the balance between handoff rate and the dropping probability [10]. So,
serving multimedia applications while on move and with a certain levels of QoS is more
challenging because of the time variability and channel unpredictability and the situation became
more critical when doing the handoff from one cell to another [10]. Handover in WiMAX is
classified into three types; they are hard handover (HHO), Macro Diversity Handover (MDHO)
and Fast Base Station Switching (FBSS) [10]. Hard handover is mandatory in WiMAX systems.
The other two types of handover are optional [10]. During hard handover, the MS communicates
with only just one BS each time. Connection with the old BS is broken before the new connection
is established with the new serving base station. In this paper we do a performance evaluation of
the basic handover of WiMAX in multi-cell environment with high mobility for Real Time
Traffic [11]. The contribution of this paper is to evaluate the performance of hard handover
functionality of WiMAX under different conditions and in terms of number of handover
performed, throughput, end-to-end delay, jitter, and packets dropped for real time applications.
The rest of this paper is organized as follow: section 2 defined the hard handover in WiMAX;
section 3 outlines some of the related work done in this area of research. The detailed simulation
setup has been described in section 4, whereas section 5 explains the results analysis. Finally this
study is summarized in section 6.
2. HARD HANDOVER The default handover in mobile WiMAX (IEEE 802.16e) is hard handover and the entire process
of HHO is divided into two phases [10]. They are Network Topology Acquisition Phase (NTAP)
and the Actual Handover phase (AHOP) [10, 12]. The procedures of handover consists of cell
reselection through scanning, then taking the decision and initiation of handover, Finally network
entry including the synchronization and ranging with the target base station [11]. The hard
handover is depicted in the Figure.1. Selection is done by the MS and its serving base station with
the help of network backbone. They will collect the information about network topology and
Neighbour base stations. They identify the list of potential base stations around that could enter
the process oh handover later. Out of this list one base station will be chosen to be target base
station. The messages included in this phase are listed in the Table. 1[13, 12]
Figure 1: Hard Handover

International Journal of Computer Networks & Communications (IJCNC) Vol.8, No.5, September 2016
3
Table 1. Handover Messages Description.
Message Description
MOB- NBR-ADV Mobile Neighbour Advertisement)
message, BS broadcasts information
about the state of the network base
stations periodically.
MOB -SCN-REQ Scanning request from MS
MOB -SCN-RSP Scanning response from BS
MOB- SCN-REP Scanning result Report
RNG- REQ Ranging Request from MS
RNG –RSP Ranging Response from BS
MOB ASC-REP Association Result Reports
MOB MSHO-REQ From the MS to the Serving Base station
listing the target base stations. This
message will be sent in case the decision
of handover is made by the MS
MOB BSHO-RSP BS reply back for the MOB MSHO-REQ
message.
MOB BSHO-REQ From the BS to the Serving Base station
listing the target base stations. This
message will be sent in case the decision
of handover is made by the BS
3. RELATED WORK Handover is an important issue to be tackled when providing Multimedia applications over
wireless broadband networks. How to make the handover between WiMAX BSs was studied in
[10] to ensure providing seamless handover for multimedia applications, S. K. Ray et al.
presented the issues related to handover along with suggesting different solutions to face these
issues and challenges. In [14] Pero et al. discussed the effect of handover on the performance of
Mobile, WiMAX. They concluded that handover latency and dropping rate have a significant
influence over the performance. In [15] Zina et al. in their paper studied handover issues and its
effect on multimedia traffic, while presenting a MAC layer solution for optimizing handover for
video applications in WiMAX. Their solution reduced the scanning time pre handover through
the process of eliminating the number of scanned BSs according to different parameters like
required bandwidth support. In [16] Po-wen Chi et al. proposed a fast and controlled handover
scheme to decrease handover procedure and according to the results presented in the work the
proposed scheme outperforms the default one. G. Khishigjargal et al. in their paper [17] defined
the procedures of MBS handover. They evaluate the performance of WiMAX under conditions
related to MBS handover for mobile IPTV in Qualnet simulator. Performance metrics are
handover latency and data loss.

International Journal of Computer Networks & Communications (IJCNC) Vol.8, No.5, September 2016
4
4. SIMULATION SETUP We created Four WiMAX scenarios using Qualnet 5.2 Network Simulator to test the basic
handover functionality of IEEE 802.16e in multi_cell environment and, high mobility for real
time applications. The created scenarios are composed of six subnets; each has 4 nodes connected
with a BS. Nodes 4, 5, 10, 13, 17, and 21 in each scenario are the BSs of these six subnets, as it is
shown in the Table 2
Table 2: Subnets
Subnet Nodes attached Base Station
192.0.6.0 (1 to 4) 4
192.0.7.0 (5 to 8) 5
192.0.8.0 (9 to 12) 10
192.0.9.0 (13 to 16) 13
192.0.10.0 (17 to 20) 17
192.0.11.0 (21 to 24) 21
All the BSs connect to node 25 (ASN-Gateway) via wired point-to-point links. Each subnet
operates with different radio frequency. Node 1 is under the study. This node transmits and
receives real time traffic while it is moving across the six cells. We use two models for modelling
Node 1 mobility. The models are flag mobility model and Random mobility model. in Flag Node
1 moves from left to right, then from right to left. It is originally close to BS node 4. So it
registers with BS node 4. When it moves to right, it will perform handover to BS node 5, then
handover to BS node 10, then handover to BS node 21,then handover to BS node 17, then
handover to BS node 13, and finally handover to original BS node 4. While, in Random Mobility
model it moves with minimum speed of 0 Mps and maximum speed of 20kmps in random and
straight lines. Time for pause is 10 seconds. These two mobility models are considered when we
are dealing with Cartesian coordinate system but only flag mobility model is considered when we
are dealing with latitude-Longitude coordinate system. Two values are considered for UCD
(uplink channel descriptor) and DCD (downlink channel descriptor) management messages time
interval, 5 and 10 with flag mobility model. These channel descriptors indicate modulation-code
rate information of bursts for uplink and downlink respectively. 6 CBR flow are running to model
the real time traffic in each Scenario as follow:
• CBR 1 3 2000 1024 1S 10S 0S PRECEDENCE 3 (rtPS)
• CBR 1 7 2000 1024 1S 10S 0S PRECEDENCE 3 (rtPS)
• CBR 1 14 2000 1024 1S 10S 0S PRECEDENCE 3 (rtPS)
• CBR 18 1 2000 1024 1S 10S 0S PRECEDENCE 3 (rtPS)
• CBR 9 1 2000 1024 1S 10S 0S PRECEDENCE 3 (rtPS)
• CBR 22 1 2000 1024 1S 10S 0S PRECEDENCE 3 (rtPS)
So Node 1 is sending 3 CBR flows and Receive 3CBR Flows while it moves and performs
handovers. Totally six handovers should be performed. The general Simulation parameters are
listed in the Table.3:

International Journal of Computer Networks & Communications (IJCNC) Vol.8, No.5, September 2016
5
Table 3: General Simulation parameters
Parameters Values
Length of simulation 4 mintues
Mobility Models Flag mobility (File based Mobility) used for
node 1
Frequency Band (GHZ) 2.4 GHz
Channel Bandwidth (MHZ) 20
Frame Duration (ms) 20
FFT Size 2048
BS Transmitted Power (dbm) 20
SS Transmitted Power (dbm) 20
Simulation Time (s) 240 seconds(4 M)
Traffic CBR
Antenna Type Omni-directional
Radio Type 802.16e
Packet size 1024
Base Station Antenna Height 32 m
MS Antenna Height 1.5 m
Neighbour BS Scanning RSS Trigger -76
Handover RSS Trigger(dBm) -78
Handover RSS Margin(dB) 3
Cyclic Prefix Factor 8
MAC frame Duration 20 milli-second
TDD Downlink Duration 10 milli-secod
DCD Broadcast Interval 5 seconds
UCD Broadcast Interval 5 seconds
Ranging Minimal Backoff Value 3 seconds
Ranging Maximal Backoff Value 15
Service Flow Timeout Interval 15 seconds
Transmit/Receive Transition Gap(TTG) 10 micro second
Receive/Transmit Transition Gap( RTG) 10 micro second
SS Transition Gap(SSTG) 4 micro second
Maximum Allowed Uplink Load Level 0.7
Maximum Allowed Downlink Load Level 0.7
Bandwidth Request Minimal Backoff Value 3
Bandwidth Request Maximal Backoff Value 15
No of Packets sent for each application 50,100,1000,10000
UCD and DCD time intervals 5,10
5. NETWORK MODEL
5.1. Scenario 1: is shown in Figure.2 we have placed six BS over 2000 x 3000 area considered
to be the area of JNU, Jawaharlal Nehru University. Node 1 is moving according to flag mobility
model. The scenario specific parameters are listed in the Table.4. Results of scenario 1 is
compared with results of scenarios 2, 3, 4 for studying the effect of load of management
messages, Mobility model, terrain on the number of performed handover, respectively.

International Journal of Computer Networks & Communications (IJCNC) Vol.8, No.5, September 2016
6
Figure 2: Scenario 1
Table 4: scenario 1 parameters
Parameter Values
Coordinate system CARTESIAN
Coordinate Dimension 2000*3000
Terrain-Data-Type Cartesian terrain data type
Mobility Model Flag Mobility Model
UCD and DCD time interval 5
5.2. Scenario 2: is shown in Figure.3 we have placed six BS over 2000 x 3000 area considered
to be the area of JNU, Jawaharlal Nehru University. Node 1 is moving according to Flag mobility
model. The scenario specific parameters are listed in the Table 5.
Figure 3: Scenario 2
International Journal of Computer Networks & Communications (IJCNC) Vol.8, No.5, September 2016
7
Table 5: scenario 2 Parameters
Parameter Values
Coordinate system CARTESIAN
Coordinate Dimension 2000*3000
Terrain-Data-Type Cartesian terrain data type
Mobility Model Flag Mobility Model
UCD and DCD time interval 10
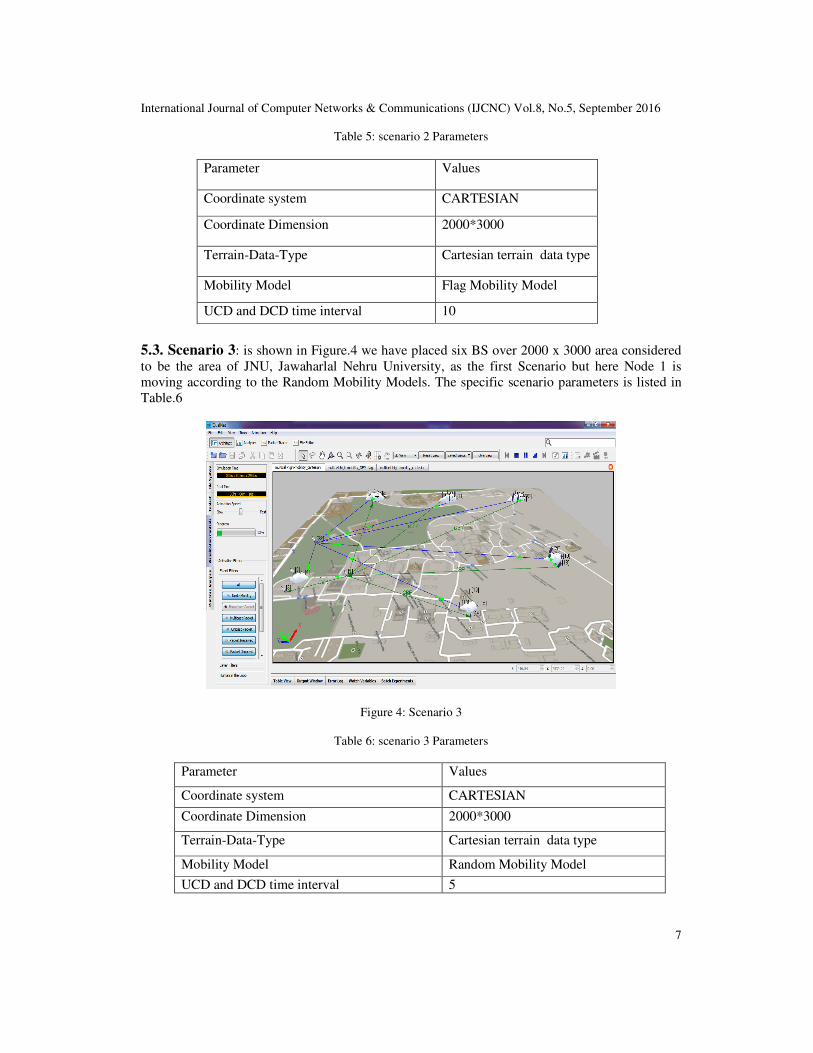
5.3. Scenario 3: is shown in Figure.4 we have placed six BS over 2000 x 3000 area considered
to be the area of JNU, Jawaharlal Nehru University, as the first Scenario but here Node 1 is
moving according to the Random Mobility Models. The specific scenario parameters is listed in
Table.6
Figure 4: Scenario 3
Table 6: scenario 3 Parameters
Parameter Values
Coordinate system CARTESIAN
Coordinate Dimension 2000*3000
Terrain-Data-Type Cartesian terrain data type
Mobility Model Random Mobility Model
UCD and DCD time interval 5

International Journal of Computer Networks & Communications (IJCNC) Vol.8, No.5, September 2016
8
5.4. Scenario 4: is shown in Figure.5 we have placed six BS over the area of JNU. Using JNU
DEM data for terrain. The specific scenario parameters are listed in the Table 7
Figure 5: Scenario 4
Table 7: scenario 4 Parameters
Parameter Values
Coordinate system LATLONALT
Terrain-south-west-corner (28.5251, 77.1526)
Terrain-North-East-corner (28.5536, 77.1796)
Terrain-Data-Format USGS DEM (Digital
Elevation Model data type
produced by USGS. It is 1
degree file with elevation
points in a grid at
approximately 100 meters
spacing)
Number of DEM Files 1
DEM Terrain File Jnu-DEM.dem
Urban-Terrain-Format None
UCD and DCD time interval 5 seconds
Mobility Model Flag Mobility Model

International Journal of Computer Networks & Communications (IJCNC) Vol.8, No.5, September 2016
9
6. RESULTS AND DISCUSSION
We discuss simulation results, number of handover performed; throughput, end-to-end
delay, and jitters as follow.
6.1. Number of Handover
Total number of successful handovers occurred during the simulation time =
NHO_success
Total number of failed handover during the simulation time = NHO_fail
Total number of handover attempts during the simulation time = Nattempt , where
Nattempt = NHO_success +NHO_fail
Table 8: Scenario 1- Cartesian-Flag Mobility Model-UCD and DCD-5
Scenario 1: Cartesian-Flag Mobility Model-UCD and DCD-5
No. of
Packets
100 500 1000 1500 2000 2500 30
00
NHO_success 3 5 5 5 5 5 5
NHO_fail 1 1 1 1 1 1 1
Nattempt 6 6 6 6 6 6 6
Table 9: Scenario 2 - Cartesian-Flag Mobility Model-UCD and DCD-10
Scenario 2 : Cartesian-Flag Mobility Model-UCD and DCD-10
No. of
Packets
100 500 1000 1500 2000 2500 30
00
NHO_success 3 5 5 5 5 5 5
NHO_fail 1 1 1 1 1 1 2
Nattempt 6 6 6 6 6 6 6
Table 10: Scenario 3- Cartesian-Random Mobility Model-UCD and DCD-5
Scenario 3: Cartesian-Random Mobility Model-UCD and DCD-5
No. of
Packets
100 500 1000 1500 2000 2500 3000
NHO_success 3 3 3 3 3 3 3
NHO_fail 3 3 3 3 3 3 3
Nattempt 6 6 6 6 6 6

International Journal of Computer Networks & Communications (IJCNC) Vol.8, No.5, September 2016
10
Table 11: Scenario 4-DEM-Flag Mobility Model-UCD and DCD-5
Scenario 4: DEM-Flag Mobility Model-UCD and DCD-5
No. of
Packets
100 500 1000 1500 2000 2500 3000
NHO_success 2 2 3 3 3 3 3
NHO_fail 4 4 4 3 3 3 3
Nattempt 6 6 6 6 6 6 6
In the first two scenarios (Table.8, Table.9) changing the interval time of receiving UCD and
DCD is not affecting the number of handover performed. We start by sending 100 packets for
each running application; we keep Node 1 busy in transmission and receiving till the end of
simulation by changing the interval time between the generated packets. Since the interval for 100
is long, the node will have longer time of pausing before retransmitting, therefore the number of
handover is less. By increasing the number of packets into 500 the number of handover
performed is increased in the first two cases and remains constant while increasing the number of
packets in the multiple of 500, i.e. 1000, 1500, 2000, 2500, and 3000. In case of Scenario
3(Table.10), where the random mobility model is used, the number of handover performed is
fixed for the varying number of sent Packets. It is due to the random movement of Node 1 and the
position of node from the base station is affecting the possibility of executing handover. In
scenario 4(Table.11), the number of handover is same for the first two cases where the number of
packets sent was 100 and 500, and then it increased with increasing the number of packets sent
and remained constant.
6.2. Throughput Throughput refers to the rate of information arriving at or passing a particular point in the
network. It is the total amount of data at that point divided by the time it takes to get the last
packet. It is measured in bits per second [8] (bit/s or bps).
Throughput = (total bytes received * 8) / (time last packet received - time first packet received)
Figure 6: Throughput

International Journal of Computer Networks & Communications (IJCNC) Vol.8, No.5, September 2016
11
In case of Scenario 1 and 2 where the used value for UCD and DCD intervals are 5 and 10
seconds, the number of performed handover is same in varying number of packet sent shown in
tables 7 and 8. The only difference in both the scenarios was in throughput where throughput of
scenario1 is higher than throughput of scenario 2, due to the number of packets dropped in 10sec
is more compared to 5sec depicted in Figure 6.
The throughput for scenario-3 where random mobility model is used to model the movement of
Node1, is less than throughput in Scenario 1 with flag mobility model, shown in figure 6, because
the node 1 in Scenario-3 is getting away from the base stations and failing to make handover ,
therefore the larger number of packets are dropped.
In case of Scenario-4 where DEM data is considered, its throughput is higher than the throughput
in Scenario 1 where the elevation of node is not taking into consideration.
6.3. Average Unicast Jitter
Jitter can seriously affect the quality of services. “It is the variation in delay of different data
packets that reach the destination. For varying number of packets the jitter is more when the
number of packet sent is less. From the Figure.7 the value of jitter in all scenarios is very high
when 100 packets are sent, then it goes down when 500 packets are sent, and it becomes almost
constant with increasing the number of packets, i.e. 1000, 1500, 2000, 2500, and 3000. In case of
sending 100 and 500 packets the interval between the packets sent is large which causes the
interval between the variations in delay of the received packets to be larger than the other cases of
number of packets sent where the interval between packets sent is smaller.
In scenario-1 the jitter in case of 100 packets is less than jitter in Scenarios 2, 3 and 4 then it goes
higher than scenario 2 and 3 in case of 500 packets sent, but for 1000 packets, jitter becomes less
than both scenarios 2, and 3. Then it remains constant for varying number of packets.
Figure 7: Jitter

International Journal of Computer Networks & Communications (IJCNC) Vol.8, No.5, September 2016
12
Jitter in scenario 2 is higher than jitter in scenario 1 only for 100 packets, and then it goes down
for the varying number of packets.
In scenario-3 the number of handover performed is not changing at all along with changing the
number of packets sent, but the jitter is higher in case of 100 and 500 packets sent. Whereas,
scenario-4, has always higher jitter compare to the other scenarios, because of the variation in the
terrain and then the variation in the delay of received data. Similar to other scenarios, scenario 4
also remains constant for the varying number of packets after 500 packets sent.
6.4. End-To-End Delay
End-to-end delay indicates how long or how much time units it takes for a packet to travel from
the source to the destination. “It is the average data delay an application experiences while
transmitting data given by [8].
The average end-to-end delay is calculated as follows:
Delay= (Total of packet delays for all packets) / (Total packets received)
Packet delay = (time when packet is received at the server - time when the packet is
transmitted at the client)
Figure 8: End-to-End Delay
Initially end-to-end delay (Figure.8) of scenario 1 is low compare to other scenarios in 100
number of packets sent, but it goes very high when the number of packets increase to 500. Later it
fluctuates for the remaining varying number of packets, therefore, there is no pattern performed
by scenario 1. Similarly in the case of scenario 2, 3 and 4, end-to-end delay fluctuate with the
varying number of packets, thus it is difficult to conclude the significance of mobility mode, UCD
and DCD interval values and terrain on the network performance in terms of delay. In all
scenarios the values of delay is higher to support rtPS data.

International Journal of Computer Networks & Communications (IJCNC) Vol.8, No.5, September 2016
13
6.5. Packet Dropped
Packet loss is another important performance metric for handover, in scenario-1, the packets
dropped is less than the other scenarios in all the cases, whereas, scenario 3 has the highest
packets dropped (Figure.9).
Figure 9: Packets Dropped
Scearnio-3 is the only scenario, whose number of packets dropped increased with the varying
number of packets till 1500, after that it fluctuate. The number of dropped packets in scenarios 1,
2 and 4 is increasing with the varying number of packets.
7. CONCLUSIONS In this study, the real urban area that is our university, JNU is considered for the WiMAX
handover performance. Four scenarios such as Flag with 5 and 10 sec UCD and DCD interval
values, Random mobility scenario and DEM scenario have been created using Qualnet Simulator.
Further, the statistical measures of handover performance of WiMAX in terms of number of
handover performed, throughput, end-to-end delay, jitter, and packets dropped are observed and
evaluated. The obtained results indicate that the performance of handover in terms of number of
handover performed and packets dropped is affected by the load of management messages,
mobility model of the moving nodes and the variation of terrain data. Depending on this analysis
we see that handover is affected by the mobility pattern and terrain variation more the load of
management messages. The delay, jitter and packets dropped are high to support real-time
application.
REFERENCES
[1] Rao, GSV Radha K., and G. Radhamani. WiMAX: a wireless technology revolution. CRC Press,
2007.
[2] Andrews, Jeffrey G., Arunabha Ghosh, and Rias Muhamed. Fundamentals of WiMAX: understanding
broadband wireless networking. Pearson Education, 2007.

International Journal of Computer Networks & Communications (IJCNC) Vol.8, No.5, September 2016
14
[3] Etemad, Kamran. "Overview of mobile WiMAX technology and evolution." IEEE Communications
Magazine 46.10 (2008): 31-40.
[4] Eklund, Carl, et al. "IEEE standard 802.16: a technical overview of the WirelessMAN™ air interface
for broadband wireless access." IEEE communications magazine 40.6 (2002): 98-107.
[5] Ahmadi, Sassan. "An overview of next-generation mobile WiMAX technology." IEEE
Communications.
[6] Li, Bo, et al. "A survey on mobile WiMAX [wireless broadband access]."IEEE Communications
magazine 45.12 (2007): 70-75.
[7] WiMAX-Part, Mobile. "I: A technical overview and performance evaluation."WiMAX Forum (2006):
9-24
[8] Jain, Raj. "WiMAX system evaluation methodology v2. 1." WiMAX Forum. 2008.
[9] Jiao, Wenhua, Pin Jiang, and Yuanyuan Ma. "Fast handover scheme for real-time applications in
mobile WiMAX." 2007 IEEE International Conference on Communications. IEEE, 2007: 6038-6042
[10] Ray, Sayan Kumar, Krzysztof Pawlikowski, and Harsha Sirisena. "Handover in mobile WiMAX
networks: the state of art and research issues." IEEE Communications Surveys & Tutorials 12.3
(2010): 376-399.
[11] Ben-Mubarak, Mohammed A., et al. "Movement direction-based handover scanning for mobile
WiMAX." The 17th Asia Pacific Conference on Communications. IEEE, 2011.: 737-742
[12] Chen, Jenhui, Chih-Chieh Wang, and Jiann-Der Lee. "Pre-coordination mechanism for fast handover
in WiMAX networks." The 2nd International Conference on Wireless Broadband and Ultra Wideband
Communications (AusWireless 2007). IEEE, 2007.:15
[13] Chen, Ling, et al. "A cross-layer fast handover scheme for mobile WiMAX."2007 IEEE 66th
Vehicular Technology Conference. IEEE, 2007.: 1578-1582
[14] Latkoski, Pero, and Borislav Popovski. "Evaluation of Mobile WiMAX handover
procedure." Melecon 2010-2010 15th IEEE Mediterranean Electrotechnical Conference. IEEE( 2010):
476-481
[15] Jerjees, Zina, and Hamed Al-Raweshidy. "Handover Optimization for Video Applications in
WiMAX." 2009 Third International Conference on Next Generation Mobile Applications, Services
and Technologies. IEEE(2009): 189–196
[16] Lin, Yu-Hsiang, et al. "Fast Uncontrolled Handover scheme for WiMAX: infrastructure
networks." International Journal of Autonomous and Adaptive Communications Systems 4.3 (2011):
237-251.
[17] Gonchigsumlaa, Khishigjargal, Young-il Kim, and Enkhzul Doopalam. "Performance analysis of
MBS handover for mobile WiMAX." Advanced Communication Technology (ICACT), 2012 14th
International Conference on. IEEE, 2012.29-32
AUTHORS
Amira is pursuing Ph.D in Computer Science and Technology from School of
Computer and Systems Sciences, Jawaharlal Nehru University (JNU), New Delhi,
India. She pursued her M.Tech (Computer Science and Technology) from JNU, in
2011, Information Engineering from Tishreen University, Lattakia, Syria in 2007 .Her
area of interest includes Computer Networks, Wireless Networks, and broadband
Networks.
Daya K. Lobiyal received his Ph.D. and M.Tech. (Computer science) from School of
Computer and Systems Sciences, Jawaharlal Nehru University, New Delhi, India in
1996 and 1991, respectively. B.Tech. (Computer Science and Engineering) was
pursued from Lucknow University, India, 1988. Presently, he is an Associate Professor
in the School of Computer and Systems Sciences, Jawaharlal Nehru University, New
Delhi, India. His research interest includes Mobile Ad hoc Networks, Vehicular Ad
Hoc Networks, Wireless Sensor Network, Video on Demand and Natural Language
Processing
![An Efficient Analytical Model for the Dimensioning …...2004 (fixed/nomadic WiMAX) [1]. It was followed by a ratification of mobile WiMAX amendment IEEE 802.16e in 2005 [2]. On](https://static.fdocuments.in/doc/165x107/5faedf879fc41e08f829d493/an-eifcient-analytical-model-for-the-dimensioning-2004-ixednomadic-wimax.jpg)